FIT Annex2 Technical Report Part 1 Design Fire Scenarios
161
-
Upload
bhuvaneshwaran85 -
Category
Documents
-
view
204 -
download
21
description
Part 1 fire scenarios - tunnels
Transcript of FIT Annex2 Technical Report Part 1 Design Fire Scenarios


Thematic Network Fire in Tunnels
2/161
Copyright © WTCB, Brussels, Belgium All rights reserved. No part of this publication may be reproduced without the prior written permission of BBRI. It is allowed to quote data from this publication, provided that the source of the quotation is clearly mentioned. Although all care is taken to ensure the integrity and quality of this publication and the information herein, no responsibility is assumed by the publishers, the authors or the European Community for any damage to property or persons as a result of operation or use of this publication and/or the information contained herein. This publication does not necessarily represent the opinion of the European Community.
Technical Report – Part 1
Design Fire Scenarios Rapporteur Alfred Haack, STUVA
Thematic Network FIT ‘Fire in Tunnels’ is
supported by the European Community under the fifth Framework Programme
‘Competitive and Sustainable Growth’ Contract n° G1RT-CT-2001-05017
Thematic Network FIT – Fire in Tunnels


Overview of the FIT reports
Technical report Part 1 ‘Design Fire Scenarios’ 5/161
Overview of the FIT reports The Thematic Network FIT ‘Fire in Tunnels’ aims to establish and develop a European platform and optimise efforts on fire safety in tunnels. The Network’s ambition is to develop a European consensus on fire safety for road, rail and metro tunnel infrastructures and enhance the exchange of up-to-date knowledge gained from current practice and ongoing European and national research projects. The outcome of the FIT network is presented in 3 complementary formats:
• FIT website (www.etnfit.net) • General report • Technical Reports on
o Design fire scenarios; o Fire safe design; and o Fire response management
The FIT website (www.etnfit.net) contains the 6 consultable databases, the co-membership, the presentations of the International Symposium on Safe and Reliable Tunnels (Prague 2004) and the technical reports. The reports are available after registration as a corresponding member. The General report presents the outcome of the FIT activities. After the introduction of the FIT Network, the general approach to tunnel fire safety is presented. This chapter can be considered as a strategic introduction to the consecutive safety aspects and the integrated approach to safety in tunnels. It introduces the highlights of the technical reports of the FIT network with the executive summaries on design fire scenarios, fire safe design and fire response management. The Technical reports on the FIT workpackages presents the detailled reflexion and results of the network on the items in more then 450 pages state of the art research work. The reports are available from the FIT website after registration as a corresponding member.
Technical report Part 1 ‘Design fire scenarios’ describes recommendations on design fire scenarios for road, rail and metro tunnels. Design fires to cover different relevant scenarios (e.g. design fires referring to the evacuation of people, design fires referring to ventilation purpose or design fires referring to the structural load) are presented and recommended. In Technical report Part 2 ‘Fire Safe Design’, a compilation of relevant guidelines, regulations, standards or current best practices from European member states (and important tunnel countries like e.g. Japan and USA) is given. The analysis is focused on all fire safety elements regarding tunnels properly said and are classified according to the transport nature: road, rail and metro. The occurrence of a fire in a tunnel provokes a need for response from the tunnel users, the operators and the emergency services. The Technical report Part 3 ‘Fire response management’ presents the best practices which should be adopted by these different categories to ensure a high level of safety.

Overview of the FIT reports
Thematic Network Fire in Tunnels 6/161
The Technical reports on the FIT workpackages presents the detailled reflexion and results of the network on the items in more then 450 pages state of the art research work. The reports are available from the FIT website after registration as a corresponding member.
Technical report – Part 1 ‘Design fire scenarios’ Rapporteur Alfred Haack, STUVA The technical report of FIT Work Package 2 is devoted to design fire scenarios for road, rail and metro tunnels. It collects data from different countries (e.g. Germany, France, Italy, UK), international organisations (e.g. PIARC, ITA, UPTUN) as well as from the experiences in individual tunnels (e.g. Mont Blanc, Tauern, Nihonzaka, Caldecott, Pfänder). The report includes basic principles of design fires, tunnel fire statistics and impacts of fires and smoke in tunnels on people, equipment and structure. The data is analysed and different sets of data are compared to ascertain the degree of confidence attributed to the information. Recommendations are made within the text on specific issues when this was deemed appropriate and reliable. Technical report – Part 2 ‘Fire Safe Design’ Rapporteur Bruno Brousse, CETU Fire Safe Design – Road Niels Peter Hoj, COWI Fire Safe Design – Rail Giorgio Micolotti, RFI Fire Safe Design – Metro Daniel GABAY, Arnoud Marchais, RATP The FIT Workpackage ‘Compilation of guidelines for fire safe design’ presents the compilation of relevant guidelines, regulations, standards or current best practices from European member states, including reference documents from important tunnel countries like e.g. USA and Japan, or from European or international organisations, e.g. PIARC and UN/ECE. The report is classified according to the transport nature in three similar main sections: road, rail and metro tunnels. The three sections in the report presents the collected guidelines and regulations, their analytical abstract and table of content. About 50 safety measures are presented and compared related to structural measures (19), safety equipment (36) and structure and equipment with response to fire (3). For each type of measure the impact on safety is presented with a synthesis and a detailed comparison of the comprehensive list of safety measures. Technical report – Part 3 ‘Fire Response Management’ Rapporteur Norman Rhodes, Mott MacDonald The objective of the FIT Work Package 4 ‘Best practise for Fire Response Management’ is the definition of best practices for tunnel authorities and fire emergency services on prevention and training, accident management and fire emergency operations. The occurrence of a fire in a tunnel provokes a need for response from the tunnel users, the operators and the emergency services. The technical systems which are installed in many tunnels are described in Chapter 2. These systems contribute to the possible levels of safety that can be achieved and are mentioned later in relation to response planning. The viewpoint of the fire brigade is then presented in Chapter 3 in order to establish the context of fire response management. Best practices for Road, Rail and Metro tunnels then follow in Chapter 4, 5 and 6 respectively. They are presented according to the conceptual phases “before’, ‘during’ and ‘after’ a fire, taking into account the different involved parties (users, operators and emergency services).

Table of contents
Technical report Part 1 ‘Design Fire Scenarios’
7/161
Table of contents Chapter 1 : Introduction 19 1.1 Design fire objectives 19 1.2 Characteristics of design fires 21
1.2.1 Input parameters and fire development phases 21 1.2.2 Classification of design fires based on design fire scenario analysis 23 1.2.3 Pre-flashover design fires 23 1.2.4 Fully-developed (fuel- or ventilation- controlled) fires 24 1.2.5 Smouldering fires 25 1.2.6 Parametric fires 25
Chapter 2 : Hazards by fires 27 2.1 Statistical overview of Real Fires and Fire Effects 27
2.1.1 Frequency of Fires in Tunnels 27 2.1.2 Analysis of selected Fires 27
2.2 Fire impact on human beings [94] 32
Chapter 3 : Existing Standards and Proposals on Design Fires 39 3.1 Design Fires for Road Tunnels 39
3.1.1 The Course of some real Fires in Road Tunnels 39 3.1.2 Evaluation of fire growth rate and peak HRR 53 3.1.3 Design fires referring to the structural load of Road tunnels 61 3.1.4 Design Fires referring to the Ventilation of Road Tunnels 78 3.1.5 Design Fires and Road Tunnel Equipment 80 3.1.6 Design Fires referring to the Rescue of Road Tunnel Users 81
3.2 Design Fires for Mainline Railway Tunnels 87
3.2.1 The Course of some actual Fires in Mainline Railway Tunnels87 3.2.2 Evaluation of fire growth rate and peak HRR from experiments91 3.2.3 Design Fires referring to the Structural Load of Mainline Railway
Tunnels 92 3.2.4 Design Fires referring to the Ventilation of Mainline Railway Tunnels 104 3.2.5 Design Fires referring to the Equipment of Mainline Railway Tunnels 105 3.2.6 Design Fires referring to the Rescue of Passengers in Mainline
Railway Tunnels 105

Table of contents
Thematic Network Fire in Tunnels
8/161
3.3 Design Fires for Metro Tunnels 106 3.3.1 The Course of some actual Fires in Metro Tunnels 106 3.3.2 Evaluation of fire growth rate and peak HRR from experiments111 3.3.3 Design fires referring to the structural load of metro tunnels 112 3.3.4 Design Fires referring to the Ventilation of Metro Tunnels 116 3.3.5 Design Fires referring to the Equipment of Metro Tunnels 116 3.3.6 Design Fires referring to the Rescue of Passengers in Metro
Tunnels 117
Chapter 4 : Current Considerations in the EU Countries on Future Developments in the Fire Scenarios for Traffic Tunnels within the DARTS project [132 to 135] 121
4.1 Application of Natural Fire Safety Concept to Road, Rail and Metro Tunnels [132 to 135] 121
4.1.1 Fire characteristics contributing to natural fire curve 122 4.1.2 Structural behaviour 123 4.1.3 Parameters contributing to realistic structural load 124 4.1.4 Safety measures in the NFSC approach 125
4.2 Effect of ventilation on rate of heat release during fire tests in the Second
Benelux road tunnel 139 4.2.1 Fire development for cars [132, 135] 139 4.2.2 Fire development for vans 140 4.2.3 Conclusions from the Second Benelux tunnel tests 141
4.3 Summary 141
Chapter 5 : Conclusions 143 5.1 Introduction 143 5.2 Design fire objectives 143 5.3 Proposals for design fires 144
5.3.1 Road tunnels 144 5.3.2 Mainline railway tunnels 145 5.3.3 Metro tunnels 147
5.4 Future work 148
Chapter 6 : Bibliography 151

FIT Partnership
Technical report Part 1 ‘Design Fire Scenarios’
9/161
FIT PARTNERSHIP
BELGIAN BUILDING RESEARCH INSTITUTE (BBRI) (Co-ordinator & WP1 leader on Consultable Databases) Johan Van Dessel Yves Martin www.bbri.be
BUILDING RESEARCH ESTABLISHMENT LTD (BRE) (Manager Database 3: Overview of numerical computer codes) Suresh Kumar Stewart Miles www.bre.co.uk
CENTRE FOR CIVIL ENGINEERING RESEARCH AND CODES/CENTRE FOR UNDERGROUND CONSTRUCTION (CUR/COB) Jan P.G. Mijnsbergen www.cur.nl – www.cob.nl
ENTE PER LE NUOVE TECNOLOGIE, L'ENERGIA E L’'AMBIENTE (ENEA) Franco Corsi www.enea.it

FIT Partnership
Thematic Network Fire in Tunnels
10/161
GESELLSCHAFT FUER ANLAGEN- UND REAKTORSICHERHEIT(GRS) Klaus Köberlein
www.grs.de
HEALTH AND SAFETY EXECUTIVE (HSE) Richard Bettis www.hse.gov.uk
INSTITUTO DE CIENCIAS DE LA CONSTRUCCION "EDUARDO TORROJA" – CSIC (IETCC) Angel Arteaga www.csic.es
INSTITUT NATIONAL DE L'ENVIRONNEMENT INDUSTRIEL ET DES RISQUES (INERIS) (Manager Database 2: Tunnel test site facilities) (Manager Database 5: Assessment reports on fire accidents) Guy Marlair www.ineris.fr
SP SWEDISH NATIONAL TESTING AND RESEARCH INSTITUTE (SP) Haukur Ingason www.sp.se/fire
NETHERLANDS ORGANIZATION FOR APPLIED SCIENTIFIC RESEARCH (TNO) Kees Both www.bouw.tno.nl

FIT Partnership
Technical report Part 1 ‘Design Fire Scenarios’ 11/161
TECHNICAL RESEARCH CENTRE FINLAND (VTT) Esko Mikkola www.vtt.fi/rte/firetech
FIRE SAFETY ENGINEERING GROUP - UNIVERSITY OF GREENWICH (UOG) E. R. Galea http://fseg.gre.ac.uk
OVE ARUP PARTNERSHIP (ARUP) Paul Scott www.arup.com
COWI CONSULTING ENGINEERING AND PLANNERS AS (COWI) (General approach to tunnel fire safety & WP3 rapporteur Fire Safe Design - road) Niels Peter Høj Steen Rostam www.cowi.dk
DEUTSCHE MONTAN TECHNOLOGIE GMBH (DMT) (Manager Database 4: Data on safety equipment in tunnels) Horst Hejny Werner Foit www.dmt.de
FIRE SAFETY DESIGN AB (FSD) Yngve Anderberg Gabriel Khoury www.csic.es

FIT Partnership
Thematic Network Fire in Tunnels
12/161
MOTT MACDONALD LIMITED (WP 4 rapporteur Fire response management) Norman Rhodes www.mottmac.com
SISTEMI ESPERTI PER LA MANUTENZIONE (SESM) Fulvio Marcoz www.sesm.it
STUDIENGESELLSCHAFT FUER UNTERIRDISCHE VERKEHRSANLAGEN E.V. (STUVA) (WP 2 rapporteur Design Fire scenarios) Alfred Haack www.stuva.de
FOGTEC BRANDSCHUTZ GMBH & CO KG Stefan Kratzmeir Dirk Sprakel www.fogtec.com
TRAFICON NV Ilse Roelants www.traficon.com
DRAGADOS CONSTRUCCION P.O., S.A. Enrique Fernandez Gonzalez Carlos Bosch www.dragados.com

FIT Partnership
Technical report Part 1 ‘Design Fire Scenarios’ 13/161
HOCHTIEF AKTIENGESELLSCHAFT Hermann-Josef Otremba www.hochtief.com
ALPTRANSIT GOTTHARD AG Christophe Kauer www.alptransit.ch
CENTRE ETUDE DES TUNNELS (CETU) (Chair & WP3 rapporteur on Fire Safe Design) Didier Lacroix Bruno Brousse www.cetu.equipement.gouv.fr
FRANCE-MANCHE SA (EUROTUNNEL) Alain Bertrand www.eurotunnel.com
METRO DE MADRID S.A. Gabriel Santos www.metromadried.es
REGIE AUTONOME DES TRANSPORTS PARISIENS (RATP) (WP3 rapporteur Fire Safe Design - metro) Daniel Gabay Arnaud Marchais www.ratp.fr

FIT Partnership
Thematic Network Fire in Tunnels
14/161
SUND & BAELT HOLDING A/S Leif J. Vincentsen Ulla Vesterskov Eilersen www.sundbaelt.dk
STOCKHOLM FIRE BRIGADE Anders Bergqvist www.brand.stockholm.se
KENT FIRE BRIGADE Ian Muir Manny Gaugain www.kent-fire-uk.org
LYON TURIN FERROVIAIRE (LTF) Eddy Verbesselt www.ltf-sas.com
RETE FERROVIARIA ITALIANA S.P.A. (RFI) (WP3 rapporteur Fire Safe Design – rail) Giorgio Micolitti Raffaele Mele www.rfi.it
TECHNICAL UNIVERSITÄT GRAZ - INSTITUT FÜR VERBRENNUNGSKRAFTMASCHINEN (TUG) Peter-Johann Sturm www.virtualfires.org

FIT Partnership
Technical report Part 1 ‘Design Fire Scenarios’ 15/161
FIT Co-membership The FIT partnership is strengthened with a co-membership (co-opted members and corresponding members) to receive ample feedback and input and obtain a larger forum for the dissemination of its outcome. The objectives of the corresponding and co-opted membership is the following:
• provide a large platform for the FIT working items • ensure European feedback and input via organizations active in 'fire in tunnels' • ensure member-state support via national and regional representatives
Co-opted members are organisations invited to contribute to the FIT activities in a very intensive way. They have the same access level as FIT network members (working document, etc.). Co-opted members are bound by an agreement of collaboration and confidentiality. Seventeen organisation have been invited and agreed as FIT Co-opted members. Corresponding members further enlarge the FIT Network. Corresponding members are these organisations and national representatives that are interested to follow closely the activities of FIT and registered themselves via the FIT website. They have a priviliged access to the endorsed FIT working documents and the Consultable Databases on fire and tunnel. A FIT public working document is a draft document that is being prepared for final edition by the FIT network. It is made available for the FIT corresponding members for consultation, input and comment. More then 1200 corresponding members have been registered on the FIT website www.etnfit.net (status March 2005).
FIT CO-OPTED MEMBERS Amberg Engineering AG (Hagerbach test gallery) Contact name: Mr. Felix Amberg Rheinstrasse 4, Postfach 64, 7320 Sargans – Switzerland Asociacion Latinoamericana de metros y subterraneos Contact name: Mr. Aurelio Rojo Garrido Cavanilles 58, 28007 Madrid - Spain CENIM - UPM Contact name: Mr. Enrique Alarcon José Gutiérrez Abascal 2, 28006 Madrid - Spain Centro Ricerche Fiat Societa Consortile per Azioni Contact name: Mr. Roberto Brignolo Strada Torino, 50, 10043 Orbassano (TO) - Italy Railway Scientific and Technical Centre Naukowo-Techniczne Kolejnictwa Contact name: Mrs. Jolanta Radziszewska-Wolinska ul. Chlopickiego 50, 04275 Warsaw - Poland

FIT Partnership
Thematic Network Fire in Tunnels
16/161
CTICM Contact name: Mr. Joël Kruppa Bâtiment 6 domaine de Saint Paul - 102 route de Limours 78471 Saint Remy-Les-Chevreuse - France Deutsche Bahn AG Contact name: Mr. Klaus-Juergen Bieger Taunustrasse 45, 60329 Frankfurt - Germany European Association for Railway Interoperability Contact name: Mr. Peter Zuber Boulevard de l'Impératrice 66 1000 Brussels - Belgium European Commission Directorate-General for Energy and Transport Contact name: Mr. Bernd Thamm rue de la Loi 200, 1049 Brussels - Belgium European Fire Services Tunnel Group (EFSTG) Contact name: Mr. Bill Welsh ME13 6XB Tovil, United Kingdom Eurovirtunnel Contact name: Mr. Gernot Beer Lessingstrasse 25/II, 8010 Graz - Austria Federal Highway Administration Contact name: Mr. Tony Caserta 400 Seventh Street S.W., HIBT-10 Washington, D.C. 20590 - USA Federal Ministry for Transport, Innovation and Technology Contact name: Dipl. Ing. Rudolf Hoerhan Stubenring 1, 1010 Wien - Austria Holland Rail Consult Contact name: Mr. Mark Baan Hofman Postbus 2855, 3500 GW Utrecht - The Netherlands Ministerie van het Brussels Hoofdstedelijk Gewest Contact name: Mr. Pierre Schmitz Vooruitgangstraat 80/1 1030 Brussels - Belgium Ministry of Transport, Public works and Watermanagement Contact name: Ir. Evert Worm PO Box 20.000 3502 LA Utrecht - The Netherlands Norwegian Public Roads Administration Contact name: Mr. Finn Harald Amundsen PO Box 8142 Dep 0033 Oslo - Norway

Technical report Part 1 ‘Design Fire Scenarios’
17/161
Technical Report Part 1
Design Fire Scenarios
Rapporteur: Alfred Haack (STUVA)
Contributions: Alfred Haack (STUVA), Suresh Kumar (BRE), Didier Lacroix (CETU), Werner Foit (DMT), Horst Hejny (DMT), Franco Corsi (ENEA), Rudolf Hörhan (Federal Ministry for Transport, Innovation and Technology, Austria), Guy Marlair (INERIS), Arthur Bendelius (Parsons Brinckerhoff), Daniel Gabay (RATP), Haukur Ingason (SP), Kees Both (TNO), Ed Galea (University of Greenwich) Technical review: Gabriel Khoury (FSD) Workpackage Members Alfred Haack (STUVA), Yves Martin (BBRI), Suresh Kumar (BRE), Jan Mijnsbergen (CUR/COB), Horst Hejny & Werner Foit (DMT), Franco Corsi (ENEA), Angel Arteaga (IETCC), Guy Marlair (Ineris), Roger Dirksmeier (Fogtec), Klaus Köberlein (GRS), Richard Bettis (HSE), Haukur Ingasson (SP), Fulvio Marcoz (SESM), Kees Both (TNO), Ed Galea (University of Greenwich)

Technical report Part 1 ‘Design Fire Scenarios’
18/161

Introduction
Technical report Part 1 ‘Design Fire Scenarios’ 19/161
CHAPTER 1 : INTRODUCTION This is the final report of Work Package 2 of the European FIT (Fire in Tunnels) project devoted to design fire scenarios for road and rail tunnels. It collects data from different countries (e.g. Germany, France, Italy, UK), international organisations (e.g. PIARC, ITA, UPTUN) as well as from the experiences in individual tunnels (e.g. Mont Blanc, Tauern, Nihonzaka, Caldecott, Pfänder). The report includes basic principles of design fires, tunnel fire statistics and impacts of fires / smoke in tunnels on people, equipment and structure. The data is analysed and different sets of data are compared to ascertain the degree of confidence attributed to the information. Recommendations are made within the text on specific issues when this was deemed appropriate and reliable.
1.1 Design fire objectives Design fires and design fire scenarios are essential inputs required by a fire safety engineered approach to the fire safety design of new tunnels and any appraisal of fire protection measures in existing tunnels. Because of the shift from prescriptive to performance-based regulations, they have become the basis for the quantitative analysis of all aspects of tunnel fire design and accidental management. An effective fire protection design for life safety and property protection in tunnels requires a systematic assessment of a number of component “sub-systems” which contribute to the overall safety of the design. These sub-systems are: the initiation and development of fire spread, spread of smoke and toxic gases, detection and activation, fire service intervention and occupant evacuation, and possibly also adequate repair and retrofit conditions. Different fire protection measures are required at different stages of fire development, and these depend upon whether the system is designed for life safety or property protection (fire safety in the construction phase of the tunnels is not considered here). Further complexity arises due to the fact that the time scales for the response of active fire protection measures such as detectors and sprinklers are different from the response time of occupants during evacuation or the structural response time for structural integrity. Recently ISO (the International Organisation for Standardisation) has also published documents on design fire scenarios [157, 168]. Part 2 of the Standard ISO/TR 13387 covers “Design fire Scenarios and Design Fires” and outlines important principles and aspects that need to be considered for the provision of fire safety primarily for buildings [168]. These can equally apply to the fire safety in tunnels. The approach, however, ignores any constraints which might apply as a consequence of prescriptive national regulations or codes, and so may not necessarily mean compliance with national regulations unless they permit a performance-based approach. Following ISO/TR 13387, a design fire is an idealisation of a real fire that might occur, and a design fire scenario is the interaction of the design fire with its environment, which includes the impact on the fire of the geometrical features of the tunnel, the ventilation and other fire safety systems in the tunnel, occupants and other factors. Generally principles for fire safety engineering may apply for tunnels; however essentially the approach in the ISO document applies to buildings in which the compartimentalisation strategy can be applied; i.e. pre-dominantly the safety is guaranteed by comparting or limiting the fire to the room in which it originates sufficiently long enough to allow evacuation and fire brigade intervention.

Introduction
Thematic Network Fire in Tunnels
20/161
Such a strategy is however hardly possible in tunnels, in which generally speaking there is only one compartment, unless current developments of tunnel plugs, water curtains etc. would eventually succeed in providing discret sections within the tunnel to extinguish fires and prevent smoke reaching people. Work on such ideas is currently in progress in the European project UPTUN (UPgrading TUnnels). At this stage, such technologies have not yet been fully developed. A design fire scenario would typically define the ignition source and process, the growth of fire on the first item or vehicle ignited within the tunnel, the subsequent possible spread of fire, the interaction of the fire with its enclosure and environment, and its eventual decay and extinction. The PIARC report [36] states clearly that there should be more focus on the definition of appropriate fire scenarios dealing with specific aspects of tunnel fire safety. This can be achieved by accurate specification of the input and output characteristics of design fires, which are discussed in detail in the next section. The main cause of death in fire is related to smoke and hot gases inhalation and not to the fire itself. With respect to life safety, therefore ample attention should be given to the determination and mitigation of spread of (possibly toxic) hot gases and smoke. Some key design fire scenarios relevant to the fire safety in tunnels are listed below: (1) Design fire scenario for ventilation design and assessment Smoke ventilation in tunnels needs to be designed on the basis of smoke flow rates, i.e. the volume flow in the fire plume, from a design fire and local gas temperatures downstream from the design fire since they determine the volume flow rates which need to be vented. The design fire scenario should take into account all important factors such as ambient conditions, wall properties, and the efficient operation of detection and ventilation systems, which can have significant influence on the appropriate design fire characteristics. Although design fires can also be related to the critical confinement velocity in the design of exhaust ventilation systems, there is experimental evidence from large-scale fires tests [167] that for large fires, the critical velocity becomes independent of fire size. Furthermore, assumptions and regulations in the choice of design fire for design of ventilation system differs between different countries, especially for large fires. (2) Design fire scenario for egress analysis Evacuation measures for tunnel users or emergency rescue service need to consider breathable gas temperatures and concentration of toxic gases at head height in the tunnel as well as the effect of thermal radiation down onto evacuees from the hot gases at high level in the tunnel. The times for hazardous conditions to develop at particular locations needs to be compared with occupant egress times. These need to take into account the time it takes for occupants to realise they are in danger and begin their escape. Concern is related to the issue of stratification of hot gases and smoke. Expert opinions differ, and therefore we recommend to be careful and preferably avoid scenarios relying heavily on stratification. (3) Design fire scenario for thermal action on structures Initial data on design fires regarding the structural load are mainly based on fire tests executed in the context of the EUREKA project as reported in the PIARC report [36]. Currently ISO curves, Eurocode 1 curves, a so called hydrocarbon curve and still other different national design curves such as the Dutch 'Rijkswaterstaat Design Curve' are in use.

Introduction
Technical report Part 1 ‘Design Fire Scenarios’ 21/161
Unfortunately none of these design criteria are universally accepted. Very important in this respect is to note that in general no appreciation of the real risks involved in adopting another curve is made. In the design fire scenario, instead of simply considering the fully-developed or steady-state phase, there can also be an advantage considering the various different phases of a design fire. (4) Design fire scenario for the safety of tunnel fire equipment In the existing regulations only a few hints are given to, for example, the temperature resistance of equipment in the case of a fire, often in relation to the ISO-temperature curve (Figure 3.3) and therefore not to specific tunnel fires. So a more precise framework together with the definition of design fires for testing purposes is needed. (5) Design fires for work on tunnel construction, refurbishment, repair and maintenance In the past fires related to, for example, tunnel boring machines and the refurbishment of tunnels. To cope with such incidents design fires for different work scenarios are needed. Within this report for the work package 2 of FIT the focus is on establishing design fires whereas guidelines etc. are discussed within work package 3 (see reports there). Also the results of other European projects like UPTUN must be taken into account as soon as they are available. Further the ISO work on design fires in general [157, 168] must be considered.
1.2 Characteristics of design fires 1.2.1 Input parameters and fire development phases Design fires, which are the basis of the design fire scenario analysis, are described in terms of variables used for the quantitative analysis. These variables typically include the heat release rate of the fire, yield of toxic species and soot as functions of time. Where the mathematical models used are not able to predict growth of fire and its spread to other objects within the tunnel traffic space or any other part of the tunnel, such growth and spread needs to be specified by the analysis as part of the design fire, or determined on experimental basis, preferably at a realistic scale. (1) Input characteristics Each design fire scenario is represented by a unique occurrence of events and is the result of a particular set of circumstances associated with active and passive fire protection measures. Accordingly, a design fire scenario represents a particular combination of events associated with factors such as: a) type, size and location of ignition source, b) distribution and type of fuel, c) fuel load density, d) type of fire, e) fire growth rate f) fire’s peak heat release rate g) tunnel ventilation system, h) external environment conditions, i) fire suppression j) human intervention(s)

Introduction
Thematic Network Fire in Tunnels
22/161
Design fires are further characterised in terms of the following variables as functions of time: a) fire characteristics (flame length, centreline velocity, radiation, convection, temperatures) b) critical confinement velocity for avoiding backlayering (only relevant in longitudinal ventilated tunnels) c) toxic species production rate d) time to key events such as fire spread from one vehicle to the next. Alternatively design fires can be characterised, for thermal actions on the tunnel structure and tunnel equipment, in terms of time-temperature curves that depend on the emissivity of the fire gases, surface temperature and emissivity of the walls. (2) Fire development analysis A full specification of a design fire scenario may include the following phases (figure 1.1): a) incipient phase – characterised by a variety of fire sources, such as smouldering or flaming fire b) growth phase – covering time of fire propagation up to flashover or full fuel involvement c) fully developed phase – characterised by a substantially steady burning rate as may occur in ventilation or fuel controlled fire d) decay phase – covering the period of declining fire severity e) extinction – when there is no more energy being produced.
Figure 1.1: Schematic of a design fire scenario (axes: horizontal = time; vertical = hrr and/or
temperature)
Decay
INCIPIENT GROWTH Fully Developed DECAY
Sprinklered-controlled fire
Sprinklered Activation
Flashover

Introduction
Technical report Part 1 ‘Design Fire Scenarios’ 23/161
1.2.2 Classification of design fires based on design fire scenario analysis Following ISO/TR 13387, different phases of the design fire scenario, illustrated in the above figure, can be used to define different design fires for meeting different design objectives. In contrast to building applications, where pre-flashover fires are of primary interest for life safety analysis, for tunnel applications, fully developed and flashed over fires are also of interest for life safety because of large distances involved as was the case in the Mont Blanc Tunnel fire disaster that consumed 26 vehicles and took 39 lives (in buildings, the strategy is to contain the fire in the room in which it originates; in tunnels there is only one compartment). Fully developed and flashed over fires also have an impact on the tunnel structure, tunnel equipment and structural components. In tunnels, significant flashover and fully developed phases are likely to occur in large fire incidents where multiple vehicles are involved. It should be emphasised that in contrast to the flashed over fires (arising in enclosed spaces) in buildings, a flashed over fire in a tunnel is unlikely to involve the whole tunnel length, but would be restricted to the vicinity around the seat of the fire. On the other hand, in tunnels the smoke spread will be in the area in which people have to evacuate. 1.2.3 Pre-flashover design fires Pre-flashover fires are of primary interest for life safety analysis, and can be influenced by active fire protection measures such as smoke control system or fire suppression systems. The incipient and the growth phase prior to flashover is referred to as the pre-flashover phase. The growth of a vehicle fire in a tunnel is highly depending on the arrangement of the combustibles and the way oxygen can be drawn in. As the fire grows in size, the rate of growth accelerates. If the fire remains localised to the item first ignited (or incident vehicle), the fire becomes fuel-controlled and decays. However, if the fire spreads to other combustible items (or vehicles), this may cause onset of rapid transition from a localised fire to the combustion of all exposed surfaces within the tunnel. The phenomenon of rapid transition driven largely by radiation feedback from the hot combustible and flammable gases collected under the tunnel roof and their sudden ignition. For design purposes, an exponential or power-law is often used for characterising the transient growth of the heat release rate for the pre-flashover fires. The most commonly used relationship is “t2 fire”, where the heat release rate of the fire grows with square of the time, of the form:
2
0 ⎟⎟⎠
⎞⎜⎜⎝
⎛=
••
gttQQ (1)
where tg is referred to as the growth time, and represents the time for the fire to grow to the reference heat release rate 0Q& , where 0Q& can be used to represent the fully developed phase of the vehicle’s heat release rate. The rate of fire growth is subsequently modified by events that occur during the design fire scenario. These events can modify the heat release rate of the rate of the fire positively or negatively.

Introduction
Thematic Network Fire in Tunnels
24/161
Typical events and their effects are: a) Flashover extremely rapid acceleration from a localised fire to fully involved fire (fully
developed heat release rate) b) Deep hot layer acceleration c) Sprinkler activation steady or declining heat release rate d) Manual fire suppression steady or declining heat release rate e) Fuel exhaustion heat release rate decays to zero f) Changes in ventilation fire characteristics modified g) Fire service intervention fire characteristics modified h) Flaming debris subsequent ignition(s). Table 1.1 below gives the four categories of t2-fire growth commonly used in Great Britain for building fires.
Growth rate description Characteristic growth time, tg (s) Slow 600 Medium 300 Fast 150 Ultra-fast 75
Table 1.1: t²-fire growth commonly used in Great Britain for building fires
These t2-fires can be modified appropriately for a particular tunnel fire scenario to take into account the factors described above. Considerable engineering judgement is required in selecting the appropriate category of fire growth. As an example, for liquid fuel spill from a vehicle fire on the floor, the ultra-fast growth description may be a good assumption for the fire growth rate. 1.2.4 Fully-developed (fuel- or ventilation- controlled) fires Fires with a significant steady-burning phase, such as following flashover, are referred to fully developed fires. The potential scenarios representative of such fires in tunnels could be, for example, a petrol tanker fire or post-crash fire involving multiple vehicles in a collision. When the fires reach fully developed phase, the rate of burning can be either fuel-controlled or ventilation-controlled. The transition from fuel-controlled to ventilation-controlled regime occurs when: mf = mox/s, (2) where mf and mox are respectively the mass fraction of fuel and oxidant, s is the stoichiometric oxidant to fuel ratio. It should be noted that usually apart from the close-vicinity of vehicle(s) on fire, tunnel fires are largely fuel-controlled, where their burning rate is controlled by the nature and geometrical arrangement of the fuel and not by the availabilty of air. However, there are exceptions such as the Mont Blanc Tunnel fire (1999) that became ventilation controlled due to the large number of vehicles being involved in fire.

Introduction
Technical report Part 1 ‘Design Fire Scenarios’ 25/161
1.2.5 Smouldering fires A smouldering fire is caused by a combination of the following (input) parameters: a) Nature of fuel, b) Limitation of ventilation c) Strength of the ignition source The smouldering fire generally burns over a long period in limited ventilation conditions with little air entrainment, producing relatively low levels of heat but considerable unburned combustibles, higher concentration of smoke with relatively low visibility but large toxic products of combustion such as carbon monoxide and soot (e.g., burning of rubber tyres of vehicles involved in fire). The relatively low temperatures generated also mean that there is little buoyancy in the combustion products and thus little likelihood of smoke stratification under the tunnel roof as with hotter fires. Thus, the principal hazards posed by a smouldering fire are high concentration of carbon monoxide and low visibility conditions. The construction and combustible contents of a vehicle (e.g., electrical fault or overheating parts in its engine compartment) could be a potential source of a smouldering fire in tunnels. Seating materials in railway carriages with high fire resistance may also lead to a smouldering fire. 1.2.6 Parametric fires Parametric fires are the family of curves for the gas phase for different ventilation opening factors and fire load densities, which are usually expressed as time-temperature curves but can use heat release rates versus time curves. Since the parametric fires have been mainly derived from fires in small compartments using cellulosic-based fuels, their use for fires in tunnels should be used with caution. Prior to undertaking any fire scenario analysis, it is essential that the fundamental aspects of fire science and fire safety engineering, and limitations of the mathematical models used for hazard and risk analysis are clearly understood [168]. Recently some guidance has published on the use of advanced fire models based on the technique of computational fluid dynamics (CFD) [180] now being used quite frequently for tunnel fire safety design and assessment [169-172, 180, 181]. Note of caution: The success or acceptance criteria that appear in many of the tables presented in this report are in essence part of existing prescriptive standards that are accepted and in use in many countries around the world. However, it is essential to appreciate that many of these criteria are on the whole based on consensus opinion rather than reliable and representative engineering data. The information contained in these tables should thus not be automatically considered to be a reliable engineering basis upon which to base success or acceptance criteria for life safety or structural design.

Technical report Part 1 ‘Design Fire Scenarios’
26/161

Hazards by fires
Technical report Part 1 ‘Design Fire Scenarios’
27/161
CHAPTER 2 : HAZARDS BY FIRES
2.1 Statistical overview of Real Fires and Fire Effects 2.1.1 Frequency of Fires in Tunnels Fire incidents in traffic tunnel systems are rare in relation to the total number of vehicle fires in several countries [36, 130, 206]. The following numbers are taken from a recent report by S. Kumar summarising fire incidents (road, rail) of 1994 to 1999 in the UK [163]. As a guide to likely numbers, the total number of arson fires (all vehicle types) in tunnels varies in the UK between 60 – 90 per year. This would be about 0.1 % of all vehicle fires, about 0.3 to 0.45 % of the vehicle fires with engines running and about 6.7 % to 10 % of the vehicle fires which follow a crash / collision [163]. 2.1.2 Analysis of selected Fires 2.1.2.1 Restrictions of the data base With regard to the rare frequency of vehicle fires in tunnels (chapters 2.1.1 and 4.1.1.4.1 as well as [36]) detailed reports about these fires are even more rare. In order to determine main fire causes it was necessary to include fires from various countries (e.g. USA, Japan, Great Britain) as well as fires which occurred sometime ago (i.e. between approximately 1970 and 1997) in the analysis of the fire events. One aspect which must be taken into consideration, among others, is that fires described in the sources available (e.g. investigation reports, fire service operational reports, publications in specialist journals, newspaper articles) are not always described in sufficient detail for the problems which occurred relating to fire protection and those encountered when fighting the fire to be adequately assessed. Furthermore, the technical developments during the assessment period also have to be taken into account. It is certainly possible that a fire which occurred in 1970 might not occur at all today, or certainly not take on the same proportions, as a result, for example, of the numerous improvements that have been made to vehicles in the intervening period. Against this background a total of 85 fires have been analysed in underground traffic systems. These selected fires are divided up as follows: - 45 fires in underground railway and suburban railway tunnels - 11 fires in main-line railway tunnels - 29 fires in road tunnels. Analysis of these fires brought to light the following main points of emphasis with respect to the causes of the fires and problems encountered in fighting the fires. 2.1.2.2 Causes of the Fires A significant proportion of the fires assessed were caused by vehicle defects: (1) approx. 40 % of the fires assessed (18 out of 45) in underground railway and suburban
railway tunnels (Figure 2.1) (2) approx. 82 % of the fires assessed (9 out of 11) in main-line railway tunnels (Figure
2.1) (3) approx. 62 % of the fires assessed (18 out of 29) in road tunnels (Figure 2.1)

Hazards by fires
Thematic Network Fire in Tunnels
28/161
In the case of road tunnels therefore, approx. 62% of the fires assessed by STUVA were triggered by technical defects to vehicles. A further approx. 34% of the assessed fires were caused by rear-end collisions in road tunnels (Figure 2.3). These results essentially confirm the assessments carried out by PIARC/OECD on fires in road tunnels in the past 40 years (Figure 2.3) [1]. The slight deviations from the STUVA analysis (figure 2.3) are almost certainly attributable to the varying number of fire events assessed (STUVA 29 fires; PIARC/OECD 33 fires) and to the fact that some of the fires included in the analysis are of a different nature.
40
82
62
0
10
20
30
40
50
60
70
80
90
100
vehicle defects vehicle defects vehicle defects
metro tunnel railway tunnel(main line)
road tunnel
fires
[%]
Figure 2.1: Main Causes of the Selected Fires in Traffic Tunnels [74]

Hazards by fires
Technical report Part 1 ‘Design Fire Scenarios’ 29/161
51
3648
0102030405060708090
100
bad visibility(rescuing andextinguishing)
unfavourabletrain operation
on the line
bad ventilationduring
incident
metro tunnel railway tunnel(main line)
road tunnel
fires
[%]
Figure 2.2: Main Problems of Fire-Fighting in the Selected Fires in Traffic Tunnels [74]
5862
3634
6 4
0
10
20
30
40
50
60
70
Cau
ses
of fi
res
[%]
technical defects rear-end collisions others
PIARC / OECD
STUVA
Figure 2.3: Results of the PIARC / OECD Analyses of the Causes of Fires in Road Tunnels [74]
In the case of underground railway and suburban railway tunnels, another common cause of fires in addition to defects to vehicles was found to be arson (17 out of 45 fire events, approximately 50% of which were in the vehicles themselves, and the other approximately 50% at the stopping points)

Hazards by fires
Thematic Network Fire in Tunnels
30/161
2.1.2.3 Problems encountered during Extinguishing and Rescue Work (1) Visibility The most frequently mentioned cause of delays to extinguishing and rescue work contained in the literature assessed relating to metro and road tunnels was poor visibility in the smoke-filled tunnel systems: a) 23 out of 45 fires in underground railway and suburban railway tunnels (Figure 2.2) b) The frequent poor visibility during fires in underground railway and suburban railway
tunnels is often related to the lack of forced ventilation. c) 12 out of 29 of the fires analysed in road tunnels Poor visibility in road tunnels resulted mainly from inadequate tunnel ventilation equipment and fire ventilation programs. It was not possible to find any details on the visibility during the fires in main-line railway tunnels during the extinguishing and rescue work in the documentation available for the analysis. (2) Technical Equipment of the Fire Services Problems with technical equipment of the fire services occurred mainly in fires in metro tunnels and road tunnels. The following are the main difficulties which occurred: a) Problems with the extinguishing water supply (9 out of 45 fires in metro tunnels, 7 out of
29 fires in road tunnels) b) Insufficient respiratory protection (4 out of 45 fires in metro tunnels, 5 out of 29 fires
in road tunnels) c) Inadequate two-way radio equipment (5 out of 45 fires in metro tunnels, 4 out of 29 fires
in road tunnels) In the documentation available referring to fire events in main-line railway tunnels there were no significant details of problems with the technical equipment of the fire services. Material DamaFires caused various types of damage to tunnel structures and tunnel equipment: (1) Concrete Spalling Concrete spalling was found in a total of 34 out of 85 fire events. Of these, 11 involved damage to underground railway and suburban railway tunnels, 3 cases of damage related to mainline tunnels (including the Channel Tunnel) and 20 cases were found in road tunnels. (2) Sagging of rectangular roof tunnel due to overheating of the steel reinforcement. This is particularly serious in underwater tunnels. (3) Damage to Tunnel Equipment In 42 out of 85 fire events there was damage to the tunnel equipment (e.g. electric cables, lighting, ventilators). Of these, 19 cases of damage related to underground railway and suburban railway tunnels, 2 cases to mainline tunnels and 21 to large conflagrations in road tunnels.

Hazards by fires
Technical report Part 1 ‘Design Fire Scenarios’ 31/161
2.1.2.4 Problems with Tunnel Operation related to fire Problems with tunnel operation before and during the fire essentially occurred in the (1) Organisation of Tunnel Operation during the Fire In 21 out of 85 fire events analysed, problems occurred with the organisational
procedures of the extinguishing and human rescue work. (2) Vehicle Operation in Tunnels containing Rail Traffic In 12 out of 56 fires in rail traffic tunnels there were problems with organising the
transport operations in cases of fire (e.g. stopping vehicles not affected by the fire in good time). Of these 12 fires, 8 related to tunnel systems for underground railways and suburban railways and 4 related to mainline railway tunnels (Figure 2.2). In Germany there were only 2 fires in the underground railway and suburban railway field where there were problems with transport operations: a) up to and including 1987: 1 fire (1983, Munich) b) from 1988 on after introduction of the new BOstrab: 1 fire (1991, Herne)
(3) Ventilation in Road Tunnels In 14 of the 29 large fires analysed in road tunnels the ventilation equipment itself or
operation of the equipment proved to be insufficient (Figure 2.2). 2.1.2.5 Summary Analysis of the fire events therefore shows the following main points of emphasis: (1) Main Causes of Fires: a) Vehicle defects b) Arson (metro tunnels), decreasing tendency since increased demands on fire protection of the vehicles (e.g. DIN 5510) c) Rear-end collisions (road tunnels) (2) Problems with Extinguishing and Rescue Work: a) Poor visibility for the rescue workers (metro tunnels, road tunnels) b) Inadequate two-way radio connections during fire service operations (mainly in metro and road tunnels) (3) Main Aspects of Damage (additional to vehicles) a) Damage to concrete tunnel lining b) Damage to operational equipment (4) Problems with Tunnel Operations a) Inadequate organisation of tunnel operation in cases of fire b) Ventilation in road tunnels during large fires not ideal These practical issues have to be taken into account in the formulation of design fires.

Hazards by fires
Thematic Network Fire in Tunnels
32/161
2.2 Fire impact on human beings [94] The products of combustion are many and varied. We generally lump fire products together and call the resulting mixture smoke. The smoke produced by fires is a volatile cocktail comprising, solid soot particles, unburnt or partially burnt fuel and a mixture of hot air and toxic gases. While the density, and chemical composition of the smoke produced by fires is dependent on the nature of the burning fuel, the total volume of smoke produced will depend on the physical size of the fire and the confines of the fire enclosure - in particular the height of the ceiling. The life threatening components of fire smoke are (1) obscuration causing loss of visibility, (2) toxic gases and (3) heat. (1) Obscuration: The obscuring nature of sooty smoke reduces visibility and the escape potential of fire victims. The effects of reduced visibility may be felt far away from the seat of fire origin. It is often this effect which is first noted by the victims of fire. Light obscuration is often expressed by the concept of optical density. This is a measure of the attenuation in intensity (I) of a beam of light traversing a distance L through the smoke. The optical density (OD) is defined by the non-dimensional parameter,
⎟⎟⎠
⎞⎜⎜⎝
⎛=
LIILogOD 0 (3)
where Io is the intensity of a standard light source and IL is the light intensity after passing a distance L through the smoke. Another measure of smoke concentration is the extinction coefficient (K). Both the OD and K relate to the level of smoke particles measured in the environment. In order to convert from the extinction coefficient to optical density per metre (OD/L), multiply OD/L by 2.3, i.e. K = OD/L * 2.3 [101, 102]. From these formulations the visibility can be approximated. The reciprocal of the optical density gives an indication of the level of visibility. Jin calculated that 2.0 divided by the extinction coefficient gave a conservative estimate as the visibility afforded by the environment [101, 102]. However, numerous figures can be used, according to the level of illumination, as well as other conditions. Jin [101, 102] conducted a series of experiments exploring the relationship between visibility in smoke and evacuation movement rates. Jin’s experiments were conducted in a smoke filled corridor some 20m long. The experimental population consisted of 17 females and 14 males with ages ranging from 20-51 years. Experiments were conducted using both non-irritant and irritant smoke. The subjects were asked to travel from one end of the corridor to the other, identifying when they could see a fire exit sign. Both the irritancy and the density of the smoke affected the volunteer’s walking speed.Figure 2.4 shows the gradual decline of the recorded walking speed through non-irritant smoke as the density of the smoke is increased, whereas in irritant smoke the gradient is far steeper. Jin explained this as being caused by the erratic movement of the volunteers due to their inability to keep their eyes open [101, 102]. Jin also noticed that the volunteers attempted to compensate for this lack of orientation by using the walls as guidance. Jin’s results suggest that in non-irritant smoke, walking speeds reduce to 0.5m/s in smoke with an optical density of 0.43m (extinction coefficient of 1.0), while in irritant smoke, the walking speed is reduced to 0.4m/s at an optical density of 0.22m/s (extinction coefficient of 0.5).

Hazards by fires
Technical report Part 1 ‘Design Fire Scenarios’ 33/161
Figure 2.4 The walking speed of volunteers through irritant (solid line) and non-irritant (dashed
line) smoke. The squares indicate the approximate visibility levels, purely according to the extinction coefficient of the smoke.
(2) Toxic gases: The toxic gases produced by fire fall into two main groups, the NARCOTIC GASES - e.g. Carbon Monoxide (CO), Carbon dioxide (CO2), Hydrogen Cyanide (HCN), low Oxygen (O2) and the IRRITANT GASES - e.g. Hydrogen Chloride (HCl), Hydrogen Floride (HF), Hydrogen Bromide (HBr), Sulphur Dioxide (SO2), Oxides of Nitrogen (NOx), Acrolein (CH2 CH CHO). It is estimated that some twenty toxic gases are produced in fires [95]. While popular belief may suggest that heat is the major cause of death in fires, the life threatening capability of these gases claims more fire related fatalities per year. When inhaled, the narcotic gases cause incapacitation and in extreme cases death. These gases attack the central nervous system causing reduced awareness, intoxication and reduced escape capability. Prolonged exposure (several minutes in some cases) causes loss of consciousness and eventually death. Exposure to narcotic fire gases is the main cause of death in building fires. The effect is generally (but not totally) dependent on the dose received rather than the atmospheric concentration. The irritant fire gases cause sensory irritation to the eyes, nose, throat and lungs ranging from mild irritation to severe pain. As the degree of irritancy increases the occupants escape abilities can be severely degraded. The effect is dependent on the concentration of the irritant. If sufficiently high concentrations of irritants are ingested incapacitation and death may result. The effects of some of the major fire gases may be summarised as follows [99]. a) CO: Produced when any combustible material burns incompletely or in reduced oxygen. It is always present in fires and can reach extremely high concentrations. Concentrations of several thousand parts per million (ppm) are not uncommon.

Hazards by fires
Thematic Network Fire in Tunnels
34/161
When CO is inhaled, it is absorbed by the blood from the lungs and combines with haemoglobin to form carboxyhaemoglobin (CoHb). This reaction inhibits the absorption and hence the transport of oxygen to the body tissue. 10 - 20% CoHb generally causes headache, 30 - 40% CoHb generally causes severe headache, nausea, vomiting and collapse, 50 - 100% CoHb generally causes death. However, values as low as 20% are known to have caused death in some victims. It is necessary to consider the original state of health of the victim and their level of activity during exposure. Angina can reduce fatal level dramatically, there is also some evidence to suggest that smoking can also alter the concentrations required to cause the effect. b) HCN: Produced by the combustion of Nitrogen (N) containing materials such as wool, silk, polyurethane foams, nylon, leather, acrylics and some plastics. Levels of 3 mg/lit are normally fatal, however levels as low as 1 mg/lit have resulted in death and people have survived levels as high as 7 mg/lit. An atmospheric concentration of 200 ppm will induce rapid collapse and death. One important difference between the impact of CO and HCN is the so-called ‘knock down;’ effect that HCN possesses. The impact of CO follows Haber’s Rule, which assumes that the impact of time and concentration is equivalent. HCN, however, does not follow this relationship, with low concentrations producing relatively long incapacitation times (in the order of tens of minutes) whilst at higher concentrations (approaching only 200ppm), incapacitation occurs in under a minute. c) CO2: Produced by the combustion of any fuel. Effects partially due to exposure concentration and partially dose received. CO2 produces HYPOXIA - a reduction in the amount of oxygen available for tissue respiration. It also has a tendency to increase the respiration rate (breathing rate), thus increasing the rate of uptake of other toxic fire gases and it is itself toxic. 3 - 6% respiratory distress, 6 - 7% dizziness, bordering on loss of consciousness, 7 - 10% loss of consciousness. d) Low O2: All fires will consume O2, if the compartment is not well ventilated the concentration of O2 can drop dramatically. The effects of low O2 hypoxia are partly concentration related and partly dose related. 20.9 - 14.4% slight loss of exercise tolerance, 14.4 - 11.8% reduction in mental task performance, reduced exercise tolerance, 11.8 - 9.6% severe incapacitation, loss of consciousness, 9.6 - 7.8% loss of consciousness, death. e) HF: Produced from fluorinated polymers such as polyvinyl fluoride. Combines with moisture to produce hydrofluoric acid - an extremely potent acid. Causes EDEMA (accumulation of an excessive amount of fluid in cells, tissues or body cavities) within the respiratory tract. Burns produced by hydrofluoric acid cause throbbing pain. 32 ppm Irritation of eyes and nose, 60 ppm Itching of skin, irritation of respiratory tract, 50 - 100 ppm Dangerous to life after a few minutes.

Hazards by fires
Technical report Part 1 ‘Design Fire Scenarios’ 35/161
f) HCL: Produced from the combustion of PVC and many fire-retardant materials. Combines with water to produce hydrochloric acid which is highly irritant to the eyes, throat and respiratory tract. 35 ppm Irritation of throat, 50 - 100 ppm Barely tolerable, 1000 ppm Danger of edema after a short exposure. g) SO2:
Produced from the combustion of rubbers and other compounds containing sulphur. Combines with water to produce sulphurous acid which is highly irritant to the eyes. It causes uncontrollable coughing.
20 ppm Coughing and eye irritation, 100 - 250 ppm Dangerous to life, 600 - 800 ppm Death in a few minutes. h) CH2 CH CHO: Produced from the combustion of natural materials such as wood and cotton and hydrocarbons such as kerosene. It is an intense eye irritant and causes irritation to the upper respiratory tract. 1 ppm Irritation, 5.5 ppm Intense irritation, 24 ppm Unbearable. All the values presented above are indicative only. Factors such as health, body weight, age, level of activity may affect an individuals tolerance to these products. For the irritant gases, Purser [100] recommends that the levels at which irritant gases are supposed to become severe and influence evacuation capabilities are shown in Table 2.1. These values would be subject to wide variations in the subject population, according to differences in the constitutions of those involved. As well as causing incapacitation, the elevated exposure levels would also slow down the progress of the evacuee due to the increasingly uncomfortable conditions (as well as the effect of these gases on the visual acuity of the evacuees making navigation increasingly difficult). Through this reduction in travel speed, the evacuee would in turn be exposed to the irritant environment for a greater period of time.
Concentration [ppm] Toxic Gas Impair half of population
Incapacitation in half of population
HCl 200 900 HBr 200 900 HF 200 900 SO2 24 120 NO2 70 350 Acrolein 4 20 HCHO 6 30
Table 2.1: Concentration levels of irritant gases resulting in evacuation limiting behaviour.

Hazards by fires
Thematic Network Fire in Tunnels
36/161
(3) Heat: Fires release large amounts of energy, this energy is used to heat up the surrounding environment. Air temperatures in excess of 1000oC can be generated in fully developed enclosure fires. Excessive heat transfer to the skin of exposed people can cause pain and burns. These in turn can result in incapacitation and death. When a victim is attempting to escape a fire they are most likely to be affected by both convective and radiative heat. The rate of convective heat transfer from hot air is dependent on the air temperature, degree of insulation provided by clothing and the humidity in the air. Above 120oC the exposed areas of the skin are subject to burning by convective heat. High levels of humidity compound the problem (reduce the critical temperature) by reducing the cooling effects due to perspiration. Furthermore, humid air delivers more heat to the skin due to waters higher heat capacity. Damage to the respiratory tract due to burns is strongly dependent on the humidity of the air. However, due to its higher heat capacity, inhaled hot air with a high water vapour content can cause more severe damage to the respiratory tract than dry air at the same temperature [95]. Dry air at 300oC can cause burns to the larynx after a few minutes while humid air at 100oC can cause burn throughout the respiratory tract. Of greater concern is the impact of thermal radiation. The so-called “pain threshold” due to exposure to thermal radiation is the equivalent to a thermal radiation exposure of 2.5 kW/m2 for 24 seconds. This is a conservative value and is the value recommended by Purser [96]. The rationale for using this as a critical tolerance value is that the individual has received a cumulative dose of thermal radiation equivalent to that required to cause the onset of pain (but not burns) and as a result is rendered incapable of continuing to evacuate effectively. An arguably more representative formulation is the so-called “incapacitation threshold”. This is equivalent to an exposure of 8.25 kW/m2 for one minute. A cumulative dose of radiation equivalent to 8.6 kW/m2 for one minute is expected to cause mortality in 1% of the population [97]. The rationale for using this as the critical tolerance value is that the occupant has received a severe cumulative dose of thermal radiation and is thus likely to be suffering from second degree burns to exposed skin resulting in severe pain and thus will find it difficult to continue to evacuate. To compare the impact of the two formulations, consider an individual exposed to a constant radiative heat flux of approximately 2.5 kW/m2. An exposure to 2.5 kW/m2 for 24 seconds is the recommended tolerance time according to Purser [96]. According to Hymes et al [97] an exposure to 2.6 kW/m2 for 1 minute is the lower limit threshold for second degree blistering of exposed skin, an exposure to 2.6 kW/m2 for 5 minutes can result in a 1% mortality and an exposure to 2.8 kW/m2 for 5 minutes is the lower limit for second degree plus burns (>0.1mm deep) to exposed skin. Using the ‘pain threshold’ approach, an occupant exposed to 2.5 kW/m2 for 24 seconds is considered incapable of evacuating. Using the ‘incapacitation’ approach, this value increase so that an individual exposed to 2.5 kW/m2 for 5 minutes is considered incapable of evacuating. The first approach therefore assumes that the evacuee will succumb once a pain threshold is reached; the evacuee subsequently succumbing at a far lower level of radiative flux.

Hazards by fires
Technical report Part 1 ‘Design Fire Scenarios’ 37/161
Both approaches are subjective and depend on many variables such as age of the occupant, state of health, amount and type of clothing worn, amount of skin exposed etc. For an average adult, if the head, neck and hands are exposed, this is the equivalent of about 14% of the body surface area. If arms and legs are also exposed, this increases the exposed surface area to approximately 61%. The old are more susceptible to burn injuries than the young. The predicted mortality rate from burns as a function of % area burned and age suggests that a 20 year old with 20% area burned has a 1% chance of death which increases to 5% at age 40 and 31% at age 70. For 65% area burned, the chance of death is 67%, 90% and 99% for 20, 40 and 70 year olds respectively [98]. As a result these values are only intended to be indicative. In reality, the degree of thermal radiation a person is subjected to is likely to influence the person’s behaviour as well as their physical ability to evacuate. For instance, during a fire evacuation scenario, a person may be less likely to elect to enter an environment in which they will receive a moderately high dose of thermal radiation (e.g. that required to cause the onset of pain). Faced with such a situation, the person may be more likely to select an alternative exit route if one exists or remain in a place of relative safety. However, if the person is already exposed to the fire environment and is in the process of evacuating, they are likely to tolerate higher exposures to thermal radiation than those required to cause pain before they are rendered incapable of evacuating. Thus for tunnel fire environments, it is likely that the higher value is the more reasonable to use. Many of the above principles are applied in a range of toxicity models commonly used in engineering design known as Fractional Effective Dose (i.e. FED) models [100]. These FED models can then be imbedded into advanced evacuation modelling tools to provide an indication of the possible effect of the fire atmosphere on the evacuating population [182-186, 190].

Hazards by fires
Thematic Network Fire in Tunnels ’
38/161

Design Fire for Road Tunnels
Technical report Part 1 ‘Design Fire Scenarios’
39/161
CHAPTER 3 : EXISTING STANDARDS AND PROPOSALS ON DESIGN FIRES
3.1 Design Fires for Road Tunnels 3.1.1 The Course of some real Fires in Road Tunnels As an introduction to the development of design fires, examples from real tunnel fires are presented: (1) Nihonzaka Tunnel, Japan (1979) (2) Caldecott Tunnel, Oakland, California (1982) (3) Pfänder Tunnel, Austria (1995) (4) Gotthard Tunnel, Switzerland (1997) (5) Mont Blanc Tunnel, France/Italy (1999) (6) Tauern Tunnel, Austria (1999) More fire incidents are included, for example, in the reports about the European UPTUN and NEDIES project as well as in [3, 74]. The data provided for each tunnel is mostly presented in the same logical manner with sections on: (1) Fire Event (2) Course of the fire and extinguishing and rescue work (3) Fire Damage (4) Summary 3.1.1.1. Nihonzaka Tunnel, Japan (1979) (1) Fire Event [2 to 6] The Nihonzaka tunnel is located half way between the cities of Tokyo and Nagoya. The tunnel consists of two approx. 2 km-long tubes which are operated in each direction. There were no restrictions on hazardous materials travelling through the tunnel until the fire occurred. The fire was started on July 11, 1979, by a rear-end collision involving 4 lorries and 2 cars. The accident caused tanks on the vehicles to become leaky so that fuel (petrol and diesel) leaked out. This fuel ignited and thereby triggered a conflagration affecting 173 vehicles in total. Among the burnt-out vehicles there were two road tankers carrying neoprene and accompanying solvent. The load on another lorry involved in the accident consisted of 10 drums of ether. These also became leaky as a result of the accident. The ether which leaked out immediately began to burn intensely. Other materials which burnt were artificial resin and plastics. The deluge sprinklers located in the tunnel were set off automatically by fire alarm systems. After approx. 10 minutes the fire appeared to have been extinguished. However, approx. 15 minutes later the fire flared up again. This produced thick black smoke. Thereafter the fire grew to a length of more than 1100 meters. Although there was a message at the portal of the tunnel that there had been an accident, vehicles continued to drive into the tunnel. A tailback of 231 vehicles formed in front of the seat of the fire.

Design Fires for Road Tunnels
Thematic Network Fire in Tunnels
40/161
(2) Course of the Fire and Extinguishing and Rescue Work [2 to 6] The Nihonzaka tunnel is monitored from two control centres (Shizuoka and Kawasaki). The fire was first noticed by the Kawasaki control room. Mistakenly, from here the fire service responsible for the Shizuoka district was alarmed initially, although it was further away. A unit of the fire service which was much closer was only informed 40 minutes after the fire broke out. The people inside the tunnel initially tried to extinguish it themselves by rolling out the hoses attached to the hydrants in the emergency areas. However they were not able to activate the extinguishing water supply, as they were not aware that in addition to the throwing of a lever - which is normally sufficient - it was also necessary to press a button. Personnel located in the Shizuoka control centre failed in their attempts to reach the scene of the accident, but were able to assist 42 vehicles in escaping from the tunnel. At around 8.30 pm 208 people had managed to escape from the tunnel on foot (approx. 15 minutes after the fire had broken out again). The firemen reaching the scene of the fire could not initially achieve a great deal, as their respiratory equipment only allowed each of them to work for 30 minutes. The supply of fire-fighting water in the tunnel (approx. 170 m³) had been used up approximately 1½ hours after the fire started without it being possible to put the fire out. When the fire-fighting water ceased to flow, combustible gases and vapours drifted from the source of the fire to two groups of vehicles in the tunnel, setting them alight. The extinguishing work could only be resumed after a "shuttle service" to surface waters had been set up using 7 sets of fire-fighting appliances. It was only possible to bring the fire under control 2 days after it had broken out. The fire, which initially started on July 11, 1979, was finally extinguished on July 18 (i.e. approx. one week after the rear-end collision). During the fire the semi-cross ventilation of the tunnel worked in the suction mode at full power. However this was not sufficient to extract enough smoke and hot burning gases for the fire service units, who were equipped only with limited respiratory protection, to effectively fight the fire. (3) Fire Damage [2 to 6] Of the 230 vehicles in the tunnel, 173 were destroyed by the fire. 7 people died in the fire, while a further 2 were injured. The tunnel lining and the additional 4.5 mm-thick reinforcement of the tunnel walls were damaged for a length of approx. 1,100 meters. The greatest damage occurred in an area of approx. 500 metres on either side of the seat of the fire. The road surface melted in places up to a depth of 2-3 cm on average, with the maximum depth being approx. 7 cm. Electric cables and pipes laid in a cable duct in the road surface concrete continued to function normally. During the repair work the concrete of the tunnel lining was removed up to a depth of approx. 3 cm. Then wire grating was placed in position and steel fibre concrete injected using the dry injection method. The application thickness depended on the damage to the tunnel, being approx. 5-10 cm on average. After the repair work to the roadway had been completed on August 7, work began on repairing the tunnel equipment. This work lasted approx. 1 month, including among other things: a) renewal of the surveillance and fire alarm systems b) reconstruction of the ventilation system c) renewal and supplementation of the fire extinguishing equipment d) installation of a guided escape system (including loudspeakers)

Design Fires for Road Tunnels
Technical report Part 1 ‘Design Fire Scenarios’ 41/161
(4) Summary a) The fire was caused by a rear-end collision. b) The fire brigade alarm was incorrect (wrong fire brigade, too late). c) Those people in the tunnel could not use the fire extinguishers as the instructions were
not clear. d) The efforts of the fire brigade to extinguish the fire were considerably hampered by the
inadequate respiratory protection devices. e) The suction power of the semi-cross ventilation system in the tunnel was not sufficient to
extract the smoke and hot burning gases. f) The hot burning gases caused the fire to jump between groups of vehicles. g) In the fire 7 people died, the tunnel was damaged over a length of approx. 1,100 meters
and 173 vehicles were destroyed. 3.1.1.2 Caldecott Tunnel, Oakland, California (1982) (1) Fire Event [2, 3] The fire occurred on April 7, 1982, shortly before midnight, with very little traffic in the tunnel. A drunken car driver lost control of his car and collided several times with the wall of the tunnel. Behind a right-hand curve in the tunnel he stopped in the left-hand lane in order to inspect the damage he had caused. Two or three cars then passed the stationary vehicle without there being an accident. However, an empty bus then pulled out to overtake a full petrol tanker without noticing the stationary car in the left-hand lane. When the towing vehicle of the petrol tanker was level with the stationary car all three vehicles collided. The bus driver was thrown out of the bus by the force of the collision. The bus itself carried on without the driver and smashed into a concrete pillar outside the tunnel. This alerted the personnel operating the tunnel to the accident inside the tunnel. The tanker was carrying a total of 33,300 litres of petrol, of which 20,400 litres were in the trailer, which was torn open by the collision. The petrol leaked out and ignited. As there were no traffic lights at the entrance to the tunnel, vehicles continued to drive into the tunnel even after the fire had broken out. Some of these drove into the area affected by the fire, with the result that in total 2 lorries and 4 cars burnt out. (2) Course of the Fire and Extinguishing and Rescue Work [2, 3] The tunnel personnel initially tried to find out what was going on in the tunnel. However it took approx. 7 minutes until the fire brigade was alarmed. The first fire service units reached the western portal of the tunnel approx. 11 minutes after the vehicles collided. Fire units did not reach the eastern portal until approx. 19 minutes after the accident occurred. The ventilation in the tunnel switched itself off at this time. From then on, the course the fire took was influenced by the natural ventilation. Within three minutes of the collision the tunnel filled with over 150°C hot smoke between the eastern portal and the burning tanker. As the escape routes to the neighbouring tubes were not particularly well marked they were not noticed by the people in the tunnel. They remained with their cars and were enclosed by the smoke. Some of the vehicles which drove into the tunnel after the fire had started reversed back out of the tunnel. As the natural air current drove the burning gases to the eastern portal, it was possible for the firemen on the opposite side of the fire to get within 25 meters of the fire. At this time, however, they did not make any effort to extinguish the fire. When they wanted to operate a valve in order to keep the water and petrol mixture in the tunnel drainage system away from a local lake they discovered that this valve was corroded and could not be moved.

Design Fires for Road Tunnels
Thematic Network Fire in Tunnels
42/161
When approx. 75 minutes after the collision the first efforts were made to extinguish the fire, the water pressure dropped and the extinguishing water supply in the tunnel failed. This may have been attributable to the damaged fire-fighting water connections in the vicinity of the burning tanker, as some firemen noticed that water was leaking out of the damaged connections. The residual fire was finally extinguished with foam extinguishing agents and extinguishing powder. After approx. 2¾ hours (after the time of the collision) the fire was finally under control. (3) Fire Damage [2, 3] The tunnel and tunnel equipment, as well as the road surface, were badly damaged over a length of approx. 580 meters. The repair costs amounted to more than approx. 3.3 million EUR (3 million US dollars). (4) Summary a) The fire was triggered by a drunken car driver who caused a rear-end collision (bus, petrol tanker) in the tunnel. b) The tunnel was filled with smoke within approx. 3 minutes. c) As it was not possible to stop vehicles entering the tunnel, more people were placed in danger by the fire. d) Escape routes to the neighbouring tubes were not used owing to inadequate marking in conjunction with the dense smoke. e) The fire-fighting water supply pipes in the tunnel were damaged by the impact of the vehicle (no impact protection). f) Foam extinguishing agents and extinguishing powder proved an advantage in extinguishing the fire. 3.1.1.3 Pfänder Tunnel, Austria (1995) (1) Fire Event [7, 8] On April 10, 1995, there was a traffic accident in the tunnel as a result of which three vehicles burnt out. The fire was located approx. 4.3 km from the northern portal and 2.4 km from the southern portal. The accident was caused by the microsleep of a car driver travelling in a southerly direction. He crossed over to the oncoming traffic lane and crashed into an articulated vehicle laden with bread. This lorry began to skid, then also crossed over to the wrong side of the road, slid along the tunnel wall for approx. 130 meters and then finally crashed into an oncoming minibus with caravan carrying three people. The minibus caught fire immediately and then set the articulated lorry and a following car on fire. (2) Course of the Fire and Extinguishing and Rescue Work [7, 8] In the tunnel control room the computer-controlled fire programme was started immediately. Furthermore, the alarm was passed on to the local municipal police force and the rescue services in the town of Bregenz. From here, the fire brigade responsible for the southern portal was alarmed at 8.45, and at 8.47 the fire service responsible for the northern portal. At 8.48 control of operations at the southern portal was taken over by the fire brigade at the tunnel control centre. While the alarms were being given, an explosive flare-up was observed on the monitors in the tunnel control centre. The scene of the accident was filled with smoke within seconds so that it was no longer possible to follow the course of the fire on the screens in the control centre.

Design Fires for Road Tunnels
Technical report Part 1 ‘Design Fire Scenarios’ 43/161
The volunteer fire service of the town of Bregenz entered the tunnel at around 8.57 am from both portals without having any exact information on the situation at the seat of the fire. Some minutes later four people fleeing in the direction of the southern cavern of the tunnel were rescued (the car driver causing the accident, the driver of the articulated lorry involved in the accident and two lorry drivers who had driven into the danger area from the southern side). These people and the rescue teams were caught up in the smoke which was drifting in a southerly direction. From the scene of the accident the tunnel was completely filled with smoke in a northerly direction for approx. 270 meters and in a southerly direction for approx. 800 meters. In spite of the excessive amount of smoke and the detonations which could be heard in the tunnel, four firemen attempted to reach the scene of the fire with a special fire engine equipped for tunnel use. This was intended to prevent any injured people who might be lying on the ground from being driven over in the dark by an emergency vehicle. The driver of the fire engine was only able to find his way in the tunnel by skirting the edge of the pavement with his tyres in order not to lose his bearings. As the visibility was zero because of the dense smoke, the firemen could not find the central line of the road even when they bent down or crawled along the ground. A fireman walking in front of the fire engine collided with a parked lorry in the smoke because he was not able to see the obstacle in good time. Moreover, owing to the very poor visibility it was extremely difficult to drive the fire engine between the lorries and cars standing in the traffic jam in the tunnel. In order to be able to finally begin extinguishing the fire, it was initially necessary in the smoke-filled tunnel for the firemen to identify by touch a fire extinguishing bay from where they could open a water valve located in front of a hydrant. The extinguishing work was also greatly hindered by the heat at the scene of the fire. Nevertheless, the fire was under control approx. 1 hour after the fire brigades had been alarmed. Coordination of the fire-fighting measures was also greatly hindered by the fact that the two-way radio system in the tunnel stopped working. The three occupants of the minibus were burned to death in their vehicle. All the other people (at the time of the accident there were approx. 60 people in vehicles in the tunnel) were able to escape from the tunnel unharmed. (3) Fire Damage [7, 8] The articulated lorry, a car and a minibus were written off by the fire. The tunnel ceiling at the scene of the fire showed spalling and cracks. Even the supporting consoles of the false ceiling on the internal vault were weakened by the heat of the fire. This structural damage stretched over a length of approx. 24 meters. Additionally, the tunnel was completely blackened by soot over a length of 35 meters north of the scene of the accident, and 70 meters in a southerly direction. The operating equipment, such as the tunnel lighting, the aerial cables for the tunnel radio and the supply lines in a cable duct on the tunnel ceiling, was damaged over a length of approx. 360 meters. In order that the tunnel could be put back into temporary operation, the false ceiling was initially supported with thick wooden poles and planks. In addition, a narrow-meshed steel net was fixed in place on the ceiling in the damaged part of the tunnel. After approx. 2 days it was possible to open the tunnel again for traffic. The final repair work was carried out in May 1995. The cost of this work was estimated to be approx. 200.000,- EUR.

Design Fires for Road Tunnels
Thematic Network Fire in Tunnels
44/161
(4) Summary a) Overtired drivers are a considerable danger to other road users. b) The extinguishing work was hindered by smoke, heat and the fact that the two-way radio connections did not work. c) Dense smoke spread out over several hundred meters across the entire cross-section of the tunnel. d) Owing to the dense smoke it was not possible to follow the course of the fire on the video monitoring system. 3.1.1.4 Gotthard Tunnel, Switzerland (1997) (1) Fire Event [9] On October 31, 1997, a car transporter caught fire in the tunnel. The transporter was laden with 8 new cars. After noticing the fire, the driver stopped approx. 1 km before the exit portal and called for help via the nearest emergency telephone. The automatic fire alarm system of the tunnel registered the fire approx. 1 minute after the emergency call made by the lorry driver. When the fire broke out there were 60 vehicles, including 20 lorries, in the tunnel. Approximately half of these vehicles were driving in the direction of the fire and therefore had to be stopped. From measurement data of the tunnel surveillance system and information provided by the emergency services it was possible after the fire to estimate the maximum energy release rate of the fire at approx. 22 MW. (2) Course of the Fire and Extinguishing and Rescue Work [9] The fire alarm was received by the tunnel control centre at 7.21 am. Approx. 1 minute later all emergency systems were activated, some automatically and some by hand. Four minutes after the alarm the tunnel fire service entered the tunnel from the southern portal, the portal located nearest to the fire. The tunnel fire service responsible for the northern portal drove into the tunnel 9 minutes after the alarm was raised. First aid workers were already in the tunnel 3 minutes after the emergency call, dealing mainly with the vehicles which had formed a tailback. They instructed the car drivers to turn around and drive out of the tunnel. Only a few of the lorry drivers went to the emergency rooms located in the tunnel without first being requested to do so. Most of the drivers did not want to leave their vehicles in spite of the immediate danger presented by the smoke. As a rule the vehicle occupants had to be requested to leave their vehicles by the emergency services, as well as having to be accompanied by them to the nearest emergency rooms. In total, 60 people were taken to the emergency rooms. Only one person suffered from smoke inhalation. At the scene of the fire the emergency services were placed in danger by concrete spalling. Furthermore, it was difficult to estimate the remaining strength of the damaged false ceiling. This was exacerbated by the fact that the false ceiling was scarcely visible owing to the dense smoke. The rescue was made easier by the relatively slow development of the fire and the slow rate at which the smoke spread. Approximately 1 hour after the start of the fire it was under control, before being completely extinguished after a further 30 minutes. Subsequently, however, the wreck of the vehicle had to be cooled down for approximately a further 2 hours.

Design Fires for Road Tunnels
Technical report Part 1 ‘Design Fire Scenarios’ 45/161
(3) Fire Damage [9] The spalling of the false ceiling stretched over an area of approx. 90 m² to 100 m². The spalling reached down as far as the reinforcing steel. The vertical deformation of the false ceiling was up to approx. 10 cm. Subsequent laboratory analyses showed that the strength of the ceiling sections had dropped owing to the effects of the high temperatures of the fire and the water used to extinguish the fire to approx. 50% of the values for new ceiling sections. The damage to the tunnel equipment was also extensive. Through the effects of the smoke, the temperature being about 700°C, and the direct effects of the fire, video cameras, aerial cables, communication cables, lighting equipment, traffic signs and an emergency telephone were damaged. The false ceiling and its reinforcement outside the direct location of the fire were heated up to approx. 500°C by the smoke from the fire. The repair work began immediately after the fire had been extinguished and was carried out at the same time as the tunnel was being cleared (removal of the wrecked vehicle, turning around and driving out the lorries jammed in the tunnel). Such measures were taken immediately with the intention of reopening the tunnel as quickly as possible. They had already been completed approx. 13 hours after the fire started. The immediate measures included removal of the damaged electrical installations over a length of approx. 100 meters and the installation of emergency lighting, clearing of the tunnel walls of loose material and supporting of the damaged false ceiling, and clearing of the damaged road surface and installation of a temporary one. The following measures contributed to the fact that the immediate measures were concluded very quickly: a) Storage of steel parts for temporary support of the false ceiling b) Training of the tunnel personnel in the execution of immediate measures. These preventive measures resulted in a significant reduction in the time required for planning the measures and the procurement of building materials. In comparison to previous lorry fires with similar effects on the tunnel, it was possible for the time required to secure the false ceiling to be more or less halved. The final repair work was carried out during the periods which were planned anyway for maintenance work. During this maintenance work the tunnel is closed for a period of 15 to 20 nights between 8 pm and 5 am. During this time the traffic is diverted over the Gotthard Pass. Ceiling sections were replaced or repaired with sprayed concrete. These measures comprised a ridge area of approx. 120 m² and a length of 24 meters. Furthermore, the concrete sections of the side walls had to be replaced over a length of 136 meters by new sections. The total costs for the repair measures, including repairs to the tunnel equipment, were approx. 1.2 million EUR (1.7 million Swiss francs). (4) Summary a) As a rule, the vehicle occupants were only prepared to go to the emergency rooms in the tunnel after being requested to do so by the emergency services. b) The extinguishing and rescue work was hindered by concrete spalling. c) The members of the tunnel fire service were at the scene of the fire within a few minutes. d) As materials were stored for emergency repairs and the tunnel personnel were trained to carry out such emergency repairs, it was possible to significantly shorten the length of time for which the tunnel was closed.

Design Fires for Road Tunnels
Thematic Network Fire in Tunnels
46/161
3.1.1.5 Mont Blanc Tunnel, France/Italy (1999) (1) Fire Event [10 to 13, 104] The Mount Blanc tunnel is 11.6 km long, with a cross-section of approximately 46 m2. The tunnel section is formed like a vault with the highest point 6 m above the road surface. The width is 8.5 m. Before the large fire which occurred on March 24, 1999, there had already been a total of 17 lorry fires in the Mont Blanc tunnel since it was opened in 1965. Most of these fires were extinguished with fire extinguishers located on board the lorries or in the tunnel. In at least 5 of the fires the fire brigade was called into action. In these fires it was possible for the fire service to reach the scene of the fire without difficulty and extinguish the burning vehicle. 4 of the 5 fires in which the fire brigade had to take action involved lorries with an overheated engine. Such overheating may be attributable to the height differences which have to be overcome in order to reach the tunnel. None of the 17 fires spread to other vehicles. Although experience had therefore been gained of vehicle fires in the Mont Blanc tunnel, the lorry fire on March 24, 1999, got out of control. The fire started in an articulated lorry which was transporting about 9 tonnes of margarine and 12 tonnes of flour. Besides the load, other flammable materials on the lorry were approx. 550 litres of diesel fuel and the highly inflammable foam material of the heat insulation of the refrigerator semi-trailer. This semi-trailer stopped 6.5 km from the French entrance. A second semi-trailer truck stopped 12 m behind the first one and a third truck 6 m behind the second one, and so on. A total of 14 HGVs was stopped behind the first truck. The longitudinal ventilation velocity at the place where the truck stopped was estimated to be 1 to 1.5 m/s [10]. The ventilation system consisted of transverse ventilation with air supply at a lower level and extraction or supply at higher levels, depending on the operational situation. The inquiry report [10] discusses the possible peak HRR based on the amount of oxygen available at different stages of the fire. The report estimates that the HRR in the vicinity of the first truck could be somewhere between 75 MW and 110 MW. These values presuppose that at most half of the oxygen in the longitudinal air flow (50-70 m3/s) crossing the section where the first truck was located was consumed. (2) Course of the Fire [10 to 13, 104] The fire started under the driver's cab and spread to the entire articulated lorry after it had been stopped. During the course of the fire the margarine melted and was transformed into extremely flammable oil. Moreover, the liquid margarine very probably flowed on to the road surface, thereby causing the power of the fire to increase considerably owing to the enlarged surface. The fire spread from the first vehicle to the others behind. Due to low ventilation rate it is assumed that the flames were deflected by the presence of ceiling, mainly in the direction of the ventilation flow. The flames ‘crawled’ along the ceiling above the vehicles. Thus, for example the flames from the first vehicle impinged on the ceiling and due to the flame radiation and convection the trailer of the second vehicle was ignited. The fire in first and the second vehicle then into the goods, the cabin (windows broke) and to the tyres probably with aid of the dropping plastics. Eventually, the fuel tank and other containers in combination with the melted goods created pool fires on the road surface, which in turn enhanced the local fire spread. Accompanied with this, the flames continued to creep along the ceiling and the third vehicle ignited due to the flame radiation. Some local turbulence may also have been created around the ventilation inlet openings at the ceiling. The gas temperatures downstream these vehicles increased significantly from now on and preheated more and more vehicles. Therefore the fire spread accelerates all the time.

Design Fires for Road Tunnels
Technical report Part 1 ‘Design Fire Scenarios’ 47/161
The Mont Blanc fire was most likely a typical ventilation-controlled tunnel fire. A ventilation-controlled tunnel fire includes five different zones: the burn out zone (involves vehicles that have been completely consumed in the fire), the glowing ember zone (contains vehicles at a very late stage of the decay phase), the combustion zone (contains violently burning vehicles where enough fuel is vaporizing to support gas phase combustion), the excess fuel zone (where all the oxygen has been depleted) and the preheating zone (preheats the vehicle material within this zone). Provided that there are enough vehicles in the vicinity of the initial fire, these different zones move forwards in a dynamic manner. All the vehicles within a distance of 700 m downstream of the first vehicle became involved in the fire (14 HGVs and also private cars), but not at the same time. Fresh air was supplied at regular distances downstream the first HGV. According to the technical report this made it possible that the peak HRR was estimated as 150-190 MW, still assuming that half of the oxygen was used. (3) Extinguishing and Rescue Work [10 to 13] The first fire alarm was received at about 10.55 am. The traffic lights at the entrances to the tunnel were switched to red. On the Italian side the barrier in front of the tunnel was also closed. The lorry driver failed in his attempt to extinguish the initial phases of the fire. As early as 2 to 4 minutes after the fire alarm was raised, 1,200 meters of the tunnel was filled with so much smoke that fire engines belonging to the tunnel operator which had entered the tunnel had to stop. The French and Italian fire services reached the tunnel almost simultaneously at approx. 11.10 am. A quarter of an hour after the fire had broken out a pump water tender from Chamonix located in the tunnel was enclosed in smoke at a distance of approx. 2,700 meters from the burning lorry (11.10 am). A pump water tender that had entered the tunnel at 11.36 am was trapped by the smoke at a distance of 4,800 meters from the scene of the fire. The ventilation system of the tunnel was turned to maximum air input in order to supply the people located near the fire with fresh air. However, this also fanned the fire and pushed hot burning gases through the tunnel. This measure did not therefore help the situation, but rather placed the people in the tunnel in additional danger. On the French side the fire flashed over distances of up to 300 meters, spreading to the following vehicles: a) French Side A column of 26 vehicles (15 lorries with semitrailers and/or trailers, 1 van, 9 cars, 1
motorbike) was burnt out. The vehicle column was located approximately 100 meters from the scene of the fire and had a length of approx. 500 meters.
b) Italian Side Here a column of 8 lorries caught fire. The distance of the column of lorries to the fire
was approx. 290 meters. The cars in the column were able to turn around and drive out of the tunnel.
c) Emergency Vehicles on the French Side A pump water tender located approx. 450 meters behind the last lorry on the French side
also caught fire. A second such tender which was located a further 230 meters away from the fire became very hot and was damaged, but did not burn.
The smoke spread on the Italian side to a lesser extent than in the direction of France. At about 11.05 am a police motorcyclist from the Italian side was able to get within 10 meters of the burning articulated lorry.
Between 11.20 and 11.30 am the Italian firemen were able to get within approx. 300 meters of the lorry. It was possible to extinguish the lorry which had caught fire on the Italian side earlier than the extensive group of lorries on the French side.

Design Fires for Road Tunnels
Thematic Network Fire in Tunnels
48/161
The more favourable ventilation conditions on the Italian side were not taken advantage of, however, for extensive fire-fighting measures on French territory. The conditions that were favourable for the extinguishing work on the Italian side were the use of foam fire extinguishers fetched from Marseille. However, the extinguishing and rescue work were hampered by the following: a) almost zero visibility b) extreme heat c) difficult use of the self-contained respiratory protection equipment in overheated surroundings d) incompatibility of the respiratory protection equipment used by the tunnel operator and that of the fire brigade e) insufficient water pressure in the French half of the tunnel f) extinguishing water pumps did not work g) communication problems inside the tunnel, as some of the communication equipment was very quickly destroyed by the fire h) incompatibility of the hose connections for the various emergency services Two people in the tunnel located near the scene of the fire fled to one of the emergency rooms provided in the tunnel. These rooms offer protection against a fire for approx. 2 hours. As the fire event lasted much longer than this however (approx. 53 hours), these people could not be rescued from the emergency room and died. In all, 39 people were killed by this fire. 29 victims were found in motor vehicles, 9 outside of the vehicles. Furthermore, one of the firemen died from the injuries he sustained in the tunnel. (4) Fire Damage [10 to 13] The damage to the tunnel vault stretched over a length of more than 900 meters. The road surface and the slabs under the road surface were damaged over a somewhat shorter distance. Additionally, the tunnel equipment was damaged or made unusable over a long distance as a result of the temperatures that were reached or the secretions caused by the fire. The costs of repairing and modernising the tunnel tubes were estimated at approx. 155 million EUR. The tunnel has been reopened to the traffic in March 2002. (5) Summary a) The fire was caused by a defect to a vehicle. b) Turning the ventilation system to maximum air input fanned the fire and caused it to flash over distances of up to approx. 300 meters. c) The period for which the partitions of the emergency rooms were able to resist the fire (approx. 2 hours of standard fire) was not sufficient. d) The extinguishing and rescue work on the French side was hindered by smoke and heat. e) The extinguishing and rescue work was delayed (equipment of the fire brigades and tunnel operator was not compatible, communication problems, equipment did not work correctly). f) The fire-fighting measures were improved by the use of extinguishing foam. g) The fire protection measures of the operating companies (France, Italy) were not coordinated with one another.

Design Fires for Road Tunnels
Technical report Part 1 ‘Design Fire Scenarios’ 49/161
3.1.1.6 Tauern Tunnel, Austria (1999) (1) Fire Event [14 to 19] The Tauern tunnel accident occurred on the 29th of May 1999. The tunnel is 6400 m long, 9.5 m wide and 5 m high. In the Tauern tunnel road works had been set up approx. 800 meters before the northern portal. A lorry laden with paints, behind which there were 4 cars, stopped in the tunnel at the red light in front of these road works. A following articulated lorry noticed too late that the vehicles in front of him had come to a standstill. The driver did not manage to brake in time. He pushed 2 cars under the lorry laden with paints and 2 cars against the wall of the tunnel. The vehicles caught fire immediately. Then the fire spread to the vehicles which had now tailed back in the tunnel. In total 16 lorries and 24 cars caught fire. (2) Course of the Fire [14 to 17, 19, 104, 126] The ventilation system in the Tauern tunnel consisted of a full transverse ventilation with 4 ventilation sections. The maximum volume of fresh air, according to the ventilation calculation, is approximately 190 m3/s km and the maximum volume of exhaust air is approximately 114 m3/s km. Exhaust air openings are situated every 6 m in the tunnel ceiling. The accident occurred 750 m from the north portal and was initially caused by a rear-end collision. A truck loaded with various types of spray cans, including paint of class 9 dangerous goods, was travelling north and had to pull up behind a number of vehicles already waiting in front of the traffic lights at the construction site causing the queue. Four other vehicles stopped behind the lorry in a normal way. Four other vehicles stopped behind the lorry in a normal way. Then, another lorry approached and rammed into the waiting traffic pushing two cars under the halted lorry loaded with the spray cans and pressing two cars up against the tunnel wall. After the rear end collision the fuel tanks of the cars were ripped open and the fuel poured out and ignited. A major fire then broke out. When the fire started the fire alarm started the ventilation system in the north fourth section where the accident occurred. The exhaust system extracted 230 m3/s upwards into the exhaust-air duct. Initially, the smoke lay essentially along the ceiling with a smoke-free zone created near the road. This layering was maintained for at least 10 to 15 minutes. Although the smoke was still being successfully extracted, the heat and smoke generated was ultimately so great that it was no longer possible to keep the carriageway free of smoke and the smoke began to flow towards the northern portal. After the fire it was stated that 16 HGVs and 24 cars were consumed in the fire. The damage of the tunnel was mainly in the intermediate ceiling, the inner concrete of the tunnel walls over a length of 350 m, the concrete carriageway surfacing and the niches over a length of 900 m. Based on the limited information given above we can try to estimate the peak heat release rate obtained in this fire. It is obvious that the fire became fully developed and spread to numerous HGVs during at short time period. The main combustion zone has been about 300 m long and the peak heat release rate was most likely dictated by the available oxygen supply. If we assume that 230 m3/s were extracted from the tunnel the same amount would have entered the tunnel at the portals since the supply ventilation was not on in the early stage of the fire. This may be an overestimate if the volume flow was determined for the hot exhaust flow. Usually the temperature should not exceed more than 200 ºC close to the fan in order to not damage them. Thus, the air flow at the portals would be lower or 143 m3/s.

Design Fires for Road Tunnels
Thematic Network Fire in Tunnels
50/161
This means that the mass flow rate of air (oxygen) in the exhaust ducts was either 170 kg/s or 270 kg/s depending on what temperature the volume flow of 230 m3/s was determined at. The ventilation was changed after approximately 40 minutes to full supply of the third section, which must have influenced the fire development considerably. It is not known if the fourth section was still kept in exhaust mode. However, if we assume that all the oxygen was consumed in the fire when it was in the most intense period one could calculate that the heat release rate is in the range of 300 to 400 MW. This appears to be a very high number but it is not unrealistic when considering the good ventilation and the enormous amount of fuel available (16 HGVs and 24 cars). (3) Extinguishing and Rescue Work [14 to 17, 19] The fire broke out on May 29, 1999, at around 5 am. The tunnel fire brigade, which entered the tunnel only a few minutes after the alarm had been given, had to withdraw again immediately, as they encountered thick smoke and very high temperatures. Furthermore, there were also explosions in the tunnel. Not until around midday were investigation teams able to enter the tunnel. Even in the late afternoon a fire was still burning over a length of 50 to 60 metres. It was not possible to fully extinguish the fire until around 9.45 pm. The fire claimed a total of 12 fatalities. A further 57 people were injured. (4) Fire Damage [14 to 17, 19] The tunnel and the tunnel installations had to be repaired over a length of approx. 1.5 kilometres. The following repair work was carried out: a) Cleaning of the incoming and outgoing air channel with high-pressure water b) Replacement of the false ceiling over a total length of 350 meters c) Repair of the wall facing concrete with sprayed concrete d) Repair of the roadway over a length of approx. 1 km (removal down to a depth of 1
meter and subsequent re-concreting) e) Modification of the ventilation system for fire gas extraction to extraction at selected
points (installation of shutters with dimensions of 2.3 x 2.2 meters at intervals of 48 meters).
f) Coating of the tunnel tubes to make them brighter on both sides up to a height of 3 meters over the entire tunnel length of 6.4 km
g) Installation of a fresh air supply for each emergency telephone bay so that these bays can also be used in cases of fire
h) Incorporation of a second, additional two-way radio cable as a backup for maintaining communication during a fire
i) Installation of a picture storage system which allows events in the tunnel to be recorded every 5 seconds over a maximum period of 24 hours.
In conjunction with the closure of the Tauern tunnel, maintenance measures planned for a later date, such as replacement of the partly damaged central channel of the main drainage system of the tunnel over a length of approximately 500 meters, was brought forward.
In total the measures cost: a) Reconstruction measures: approx. 5.8 million EUR b) Improvement measures: approx. 2.2 million EUR c) Maintenance measures brought forward: approx. 0.7 million EUR To these costs must also be added the loss in income from tolls, which is estimated at approx. 19 million EUR. It was possible to reopen the tunnel to traffic on August 28, 1999, approx. 3 months after the fire occurred.

Design Fires for Road Tunnels
Technical report Part 1 ‘Design Fire Scenarios’ 51/161
(5) Summary a) The cause of the fire was a rear-end collision at a road works traffic light in the tunnel. b) The extinguishing and rescue work was hindered by smoke and heat. c) The ventilation system was inadequate for dealing with the fire. 3.1.1.7 Main lessons learnt from the Mt. Blanc- and Tauern-Tunnel fires [131] The Mont Blanc and the Tauern tunnels are both bidirectionnal and transverse ventilated. As the fire in the Tauern tunnel involved a heavy goods vehicle transporting lacquer tins, and because there more people were present in the Tauern tunnel, this fire was potentially more serious than the Mont Blanc fire. The heat release rate of both fires reached quickly high values (chapters 3.1.1.5 and 3.1.1.6). However, the outcome in terms of loss of life for the Mont Blanc fire was far more serious than for the Tauern fire. Several differences between these two fires may have contributed to the outcome in each case. From a human behaviour view, the Tauern tunnel fire occurred shortly after the Mont Blanc catastrophe, and so the people involved were well aware of the possible severe consequences that could result from a tunnel fire and so fled the fire almost immediately. In addition, in the case of the Tauern fire, the fire was located “near” one of the tunnel portals adding evacuation. In the Mont Blanc Tunnel fire, the fire occurred almost in the middle of the tunnel compounding the difficulties with both smoke extraction and evacuation. Furthermore, the two separate control centres within the Mont Blanc tunnel made managing the fire difficult. Other aspects that contributed to the differences in these two situations are given by the fact that the ventilation system of the Tauern Tunnel had a higher performance than the one in the Mont Blanc Tunnel, and the firefighters in the Tauern Tunnel were better equipped than those in the Mont Blanc Tunnel.

Design Fires for Road Tunnels
Thematic Network Fire in Tunnels
52/161
The main lessons drawn from these two fire situations are presented in the following table [131]: Event Consequences Lessons learnt THE FIRE ITSELF The fire grew rapidly, even if the lorry’s load was not considered as dangerous goods
- - • Difficult to reach the fire because of smoke and heat
• Tunnel users could not extinguish the fire with extinguisher
-HGV serious fires can happen even with “non dangerous” goods -Redefine the notion of “dangerous goods” for road tunnels
SAFETY FACILITIES
Fast and precise fire location detection
++ Optimisation of the ventilation operation
Need of fire detection systems able to locate rapidly the fire
Fire detection system out of work
- - Fire location unknown Need of fire detection systems able to locate rapidly the fire
First alarm given by opacimeters
+ Fast alarm Fire detection systems should include a smoke detection in addition to temperature detection
2 people died in a pressurized shelter because of heat
- - 2 victims Pressurized shelters must be related to an evacuation route that is not the tunnel itself
RESPONSE BY RESCUE FORCES
First firemen arrived from the most smoked tunnel side
- - Could not reach the fire Need to inform the firemen on the extend of the smoke plug in the tunnel
Misunderstanding about the fire place
- - Arrived at the tunnel late Need to train the firemen
Firemen entered the tunnel with inappropriate equipment
- - Firemen were trapped in the tunnel. One died, and the evacuation of the others needed several hours
- Need to train the firemen - Cooperation needed between the tunnel operators and the firemen to inform them on the situation inside the tunnel
USERS BEHAVIOUR
Users rapidly decided to flee
++ Less victims Need to inform the users on the behaviour expected from them
Users remained in their vehicles
- - Victims died asphyxiated in the smoke
Need to inform the users on the behaviour expected from them
3 users took refuge in an emergency call niche
- • Perhaps they though that they were in a safe area while it was not the case
• Needed to be rescued by firemen
Emergency call niches have to be identified by the tunnel users as non safe areas. There must be no confusion possible between emergency call niches and pressurized shelters or evacuation routes.
Car drivers entered the tunnel in spite of the red signal and siren
- - • more victims Need to inform the users on the behaviour expected from them
TUNNEL OPERATION
Two separated control centres
- - • Lack of coordination between the tunnel operators of the two centres Complicated emergency ventilation operation
Only one control centre operating the tunnel

Design Fires for Road Tunnels
Technical report Part 1 ‘Design Fire Scenarios’ 53/161
Fresh air supply at full capacity (from the bottom)
- - • Accelerated the smoke velocity towards the portals
• Longer smoke plug
- Reduce fresh air supply if the longitudinal velocity is not controlled - Ventilation procedures have to be checked periodically in the light of available recommendations.
Fresh air supply from the ceiling stopped after the fire alarm
++ Permitted smoke stratification in the minutes following the fire
Fresh air supply must be reduced in the fire zone to favour the smoke stratification
Ventilation procedures were not followed (blowing instead of extraction)
- • No smoke extraction in the fire zone
• blowing from the ceiling contributed to the smoke destratification
Need to train the tunnel operators to react to emergency situations
A vehicle queue build up at the backside of the fire
- - • A high number of people in the dangerous zone
• The fire transmitted to others vehicles
- Fire safety distance must be respected when vehicles have to stop in a tunnel. Need of information for the users. - Barriers should be installed in long tunnels to avoid the accumulation of vehicle in dangerous zones.
The tunnel was closed to the traffic rapidly (3 min after the fire beginning)
++ • Limited the number of people present in the tunnel
- Tunnel users have to be educated- Use physical barrier instead of traffic lights to close the tunnel
Operators could not know how many people were present in the tunnel at and after the fire beginning
- Count the entering and exiting vehicles ?
ranking of event from very good (++) to very bad (- -) 3.1.2 Evaluation of fire growth rate and peak HRR 3.1.2.1 Influence of ventilation on heat release rate (HRR) The influence of ventilation on test fires in the Second Benelux tunnel has been addressed in [108]. The fire development rate with ventilation (4-6 m/s) appeared to be 2 times faster than the development without ventilation. The peak heat output was about 1.5 times higher. The results from model fire tests (1/35) indicate that if the wood cribs are densely packed the increase in peak heat release rate by ventilation can be up to factor of 1.5 and if not densely packed there were little change in the peak heat release rates [109]. However, the Runehamar fire tests [176] showed no significant HRR changes due to ventilation (up to some 2-2.5 m/s). Earlier discussions about a stronger dependence [105, 106, 107] were not confirmed by the above experiments.

Design Fires for Road Tunnels
Thematic Network Fire in Tunnels
54/161
3.1.2.2 Fire growth rate and peak HRR from experiments
Passenger Cars [104] The literature describes numerous measurements of HRRs and total energies of passenger cars: (1) Mangs and Keski-Rahkonen presented HRRs from three full-scale laboratory tests using ordinary passenger cars manufactured in the late 1970s. The total calorific value of the tested cars was about 4 GJ. (2) Steinert [41] presented a HRR of a plastic passenger car from a test in the EUREKA 499 test series. The car was a Renault Espace J11-II manufactured in 1988. The total calorific value of the car was estimated to be about 7 GJ. Recently, Steinert [111] published HRR of three different type of passengers cars (Trabant, Citroen and Austin) in a car park all with different type of car body. The total calorific values were 3.1, 8 and 3.2 GJ, respectively. Tests with combination of 2 and 3 passenger cars were also presented by Steinert [111]. The peak HRR values varied from 5.6 to 8.4 MW for two cars and in one test with three cars the peak HRR was measured to be nearly 9 MW. (3) Shipp and Spearpoint [112] presented the measured HRR for two different types of private cars: a 1982 Austin Maestro and a 1986 Citroën BX. We estimated the total calorific value of the Citroën to be about 5 GJ. It was not possible to derive the total calorific value for the Austin Maestro, since the fire had to be extinguished in order to control the violent fire created when the petrol tank burst, resulting in a large pool fire on the floor. Estimation indicates that it is of the same order as the Citroen BX. (4) Joyeux [113] presented ten HRR measurements from passenger vehicle fires in a simulated car park. The measurements were carried out beneath a 10 MW calorimeter, both with one car and with two cars at the same time. Cars used in the tests included those from Mazda, Renault, BMW, Citroen BX and Peugeot, manufactured in the 80s and 90s. The total calorific value for these cars varied between 2.1 GJ and 8.9 GJ, with the cars from the 90s containing nearly twice the calorific value of the cars from the 80s. (5) Recently, data on heat release rate measurements in a tunnel test with two identical private cars were presented [108]. The cars were Opel Kadetts, year 1990 with 25-30 liters petrol in the fuel tank. The HRR was measured without ventilation and with a ventilation velocity of about 6 m/s. The estimated total calorific value of the Opel Kadett is about 5 GJ. The peak heat release rate with no ventilation was 4.7 MW 11.5 minutes into the test and with ventilation it was obtained in two steps, the first maximum was about 3 MW 13 minutes into the test and the second one about 4.6 MW 37 minutes into the test. An interesting observation is that the high ventilation rate made it difficult for the fire to spread upwards within the cabin. The HRRs for single passenger car (small and large) vary from 1.5 MW to 8 MW, but the majority of the tests show HRR values less than 5 MW. When two cars are involved we find that the peak HRR vary between 3.5 to 9 MW. Based on the data presented here we observe a tendency that peak HRR increase linearly with total calorific value of the passenger cars involved in the fire. An analysis of all data available shows that the average increase is about 0.7 MW/GJ. This is an interesting observation since a French study has showed an increase of cars calorific potential versus years [113].

Design Fires for Road Tunnels
Technical report Part 1 ‘Design Fire Scenarios’ 55/161
As there appears to be a trend for new cars to release more energy than older ones, designers of tunnel safety must consider this when deciding on a design fire rating. The number of passenger cars involved is also an important factor to consider in the design.
Buses [104] Ingason et. al [114] presented within the EUREKA 499 fire test series [40] a measured HRR for a 25-35 year old 12 m long Volvo school bus with 40 seats. The body of the bus was made of glass fibre. Steinert [41] presented corresponding HRR results using more coarse measuring points. The peak HRR was about 30 MW. The total calorific value was estimated to be 41 GJ. A bus fire in the Ekeberg tunnel [115] in Oslo, Norway appears to have developed in a similar way to the one by Ingason et al. The bus had only been in use for three months. In the CFD simulation of the fire, the bus fire was estimated to grow to 36 MW under six minutes, continuing at a steady state of 36 MW for four minutes and then decaying to 1 MW over the next 12.5 minutes. The total calorific value was estimated to be 28 GJ. The difference between the two buses lies in their construction. The body of the Oslo bus was probably made of steel, and it appears from photos that the roof was intact after the fire. The windows, however, were relatively large, and the flames have probably burst out of the windows. In the EUREKA school bus test, the roof and walls of the bus were totally burned away (glass fibre shell) down to the bottom edges of the windows. There are a number of sprinkler tests with buses available [116, 117], but no HRR measurements were carried out in these tests. However, some temperature measurements were performed [118], which can give an indication of the fire growth rate. It appears to fit quite well with the HRR graph data given by Ingason [119]. The importance of buses fire scenarios looks obvious when considering the number of fire records where a bus fire was involved. At least one of those accidents proved to induce multiple fatalities. Moreover, in road tunnels, buses are the only type of vehicle that may easily trap 50 or more users in a single fire event, even if no other vehicle is concerned by the fire in a given occurrence. By contrast, the very high number of fire deaths (39) in the Mont-Blanc fire disaster was due to the related high number of vehicles (including 23 lorries) burnt out in the fire conflagration. It is even possible to identify particular tunnels in the world (e.g. the Homer tunnel in New-Zealand) where the buses representing the majority of large vehicles transiting by tunnels (in areas where tourism represent the main activity and in some urban areas). In the concept of design fires relating to buses, construction characteristics of buses are very different according to main use of the bus. Urban line buses are often designed with limited comfort (refer to the Ekeberg fire in Oslo) and thus less combustible materials are laying inside the structure where the passengers are seated. On the contrary coaches or buses used to convey tourists (sometimes of double-deck frame), that are generally fitted with modern comfort due to longer trips and requirements of users mean the implementation of many plastic and fabric compounds on seats and board linings (although fire retarded most often), and more electronic appliances (TV and video systems, refrigerators, monitors…). New experimental data on modern buses fires would for those reasons be highly desirable to categorise design curves for buses.

Design Fires for Road Tunnels
Thematic Network Fire in Tunnels
56/161
Heavy Goods vehicles (HGVs) With regard to the HGV´s several fire tests were conducted since about 1992 (EUREKA, Second Benelux Tunnel, Runehamar). The results of these tests can be summerized as follows: (1) Simulated truck load (EUREKA) Ingason [114] presented a measured HRR of a Simulated Truck Load (STL) in the EUREKA 499 test series. The fire load was thought to be representative of a lorry (based on field investigation in Austria). It consisted of 2212 kg of densely packed wooden pallets, 310 kg of plastic that was mixed with the pallets and 332 kg of rubber tires that were put onto the wood stack. The fire load was 2.4 m wide, 2.4 m long and about 2.2 m high. The total calorific value was estimated to be about 65 GJ. (2) Heavy Goods Vehicle (EUREKA) One test with a Leyland DAF 310ATi heavy goods vehicle (HGV) was carried out for the Eurotunnel consortium in the EUREKA test series. It was loaded with 2000 kg of upholstered furniture in a trailer unit covered with tarpaulin. The trailer unit was 12.2 m long, 2.4 m wide and 2.5 m high. The total calorific value of the vehicle was estimated to be about 87 GJ. A seat in the driver's cab (the tractor) was ignited with a standard timber pallet and, after nine minutes, a window broke and flames leapt out and ignited the furniture. Once the furniture was alight, it took less than two minutes for the annular space to be completely filled with flames swept back downwind. The HRR was derived by Grant and Drysdale [120], and is based on measurements of CO2 and CO. The HRR was also derived by Steinert and Sørlie et al [41], but their results differs to some extent from those presented by Grant and Drysdale [120]. The HGV test was carried out with forced ventilation of 6 m/s until 13.5 minutes after ignition, when the fan was stopped. This caused the heat release rate to reduce dramatically. The fan was restarted at 16.5 minutes with an air velocity of about 3 m/s, and the HRR increased rapidly again to about 128 MW (peak value). Both the Simulated Truck Load (STL) and the HGV fire load consisted of 75 % of cellulose materials and 25 % of polymeric materials. However, the ventilation conditions within the loads were quite different. The wood pallet fire of the STL became under-ventilated, whereas the furniture on the HGV truck became reasonably well ventilated (stacked furniture with wood frames). This may partly explain the difference in HRR. (3) Simulated truck load with wood pallets (Second Benelux Tunnel) Four large scale fire tests using van mock-up with tarpaulin and standardized wood pallets were performed in the Second Benelux tunnel [108]. Three tests consisted of 36 standardized wood pallets (9 in each pile) performed with different longitudinal velocities (0 m/s, 4-6 m/s and 6 m/s) and one test with 72 wood pallets and longitudinal velocity of 1-2 m/s. The outer dimensions of the 36 wood pallet fire load were 4.5 m long x 2.4 m wide and 2.5 m high. The tests with the 36 wood pallet fire load show that the fire development rate with ventilation was 1.7 to 2 times faster than the fire development without ventilation. The peak heat release rate was 13.5 MW without ventilation, 19 MW with 4-6 m/s ventilation and 16.5 MW with 6 m/s, which corresponds to 1.4 and 1.2 times higher, respectively. The peak heat release rate with 72 wood pallets was 26 MW and the fire growth rate was about 1.5 times faster than the 36 wood pallet fire load and no ventilation. In conclusion the fire growth rate was not more than 2 times higher and the peak heat release rate not more than 1.4 times higher compared to test with no longitudinal ventilation.

Design Fires for Road Tunnels
Technical report Part 1 ‘Design Fire Scenarios’ 57/161
These results comply to some extent with the Runehamar tests [176] but not with the high increase of HRR quoted by Carvel et al [105, 121]. (4) Runehamar tests (Norway) The Runehamar fire tests were initiated, planned and performed by the Swedish National Testing and Research Institute (SP) in the years 2001 to 2003 as a part of the Swedish National Research programm and in collaboration with the European UPTUN-project led by TNO (The Netherlands) [177]. The performance of the tests was further assisted by SINTEF (Norway) [177]. In total four tests were performed using a mocked-up HGV [178, 191]. In three tests mixtures of different cellulose and plastic materials were used, and in one test a “real” commodity, consisting of furniture and fixtures, was used. In all tests the mass ratio was approximately 80 % cellulose and 20 % plastic (Table 3.1). A polyester tarpaulin covered the cargo. The reason for using furniture in one of the tests was to provide a comparison to a past test (EUREKA 499; see under (1) and (2)), which was carried out with similar materials and a very high ventilation rate of 6 m/s at the start of the test. This provided a good point of reference between the data from Runehamar and the EUREKA tests. In the first two fire tests, test 1 and test 2, a pulsation of the fire was experienced during a time period when the fire was over 130 MW. This created a pulsating flow situation at the measuring station, where the measurements showed that the maximum velocity was pulsating in the range of 3 to 4 m/s down to a minimum in the range of 1 to 1.5 m/s. The frequency of the maximum velocities was about 45 seconds during this period. Since the air mass flow rate is dependent on the air velocity the HRR also pulsate during this period. The HRR curves presented in Figure 3.1 are the actual HRR (average for test 1 and 2 during the pulsating period), although a correction has been made for the transportation time.

Design Fires for Road Tunnels
Thematic Network Fire in Tunnels
58/161
Test Nr. Description of the fire load Target1) Total weight
[kg]
Theoretical calorific energy [GJ]
mass ratio of plastic
1 360 wood pallets measuring 1200 x 800 x 150 mm 20 wood pallets measuring 1200 x 1000 x 150 mm 74 PE plastic pallets measuring 1200 x 800 x 150 mm
32 wood pallets and 6 PE pallets 10911 240 18 %
2 216 wood pallets and 240 PUR mattresses measuring 1200 x 800 x 150 mm
20 wood pallets and 20 PUR mattresses 6853 129 18 %
3
Furniture and fixtures (tightly packed plastic and wood cabinet doors, upholstered PUR arm rest, upholstered sofas, stuffed animals, potted plant (plastic), toy houses of wood, plastic toys). 10 large rubber tyres (800 kg)
Upholstered sofa and arm rest 8500 152 18 %
(tyres included)
4
600 corrugated paper cartons with interiors (600 mm x 400 mm x 500 mm; L x W x H) and 15 % of total mass of unexpanded polytyrene (PS) cups (18000 cups) and 40 wood pallets (1200 x 1000 x 150 mm)
4 wood pallets and 40 cartons with PS cups (1800 cups)
3120 67 19 %
1) At a distance of 15 m from the downstream side of the test commodity there was a target consisting of the first row of the same test commodity used in actual test.
Table 3.1: Commodities used as fuel in the four Runehamar tests [178 191]

Design Fires for Road Tunnels
Technical report Part 1 ‘Design Fire Scenarios’ 59/161
Figure 3.1: The HRR from the four large-scale Runehamar fire tests with HGV-trailer fire load [178]
(5) Influence of tarpaulin The structure of the cover / cabinet of a HGV trailer is important for the fire growth rate. The cover can consist of simple polyester tarpaulin or as for refrigerated trailers consists of polyester laminates and polyurethane insulation (50 - 100 mm thick). Arvidson [122] show that polyester tarpaulin contributes significantly to the flame spread of a trailer. Experiments carried out in a cone calorimeter at SP show that PUR insulation of a cabinet from a refrigerator trailer produces about 300 kW/m2, with 50 kW/m2 external radiation. The ignition time is about 30 seconds. If we assume that the cabinet of a refrigerated trailer caught fire, it could theoretically produce a 40 MW fire from 130 m² of burning area (sides and roof). The presence of the cover/cabinet on a HGV trailer is apparently a potential risk for rapid fire spread and high HRR. 3.1.2.3 Multi-vehicle-fires The tunnel linings for road and rail tunnels are usually designed for time-temperature curves such as the ISO, HC, ZTV-ING or RWS curves. What is common with these curves is the fact that they describe the gas temperature as a function of time for the entire tunnel length. Every part of the tunnel should withstand these temperature exposures, irrespective of the fire location, ventilation rate or type. In reality the construction is not exposed to these time temperature curves over the entire tunnel length. In a tunnel with a single vehicle fire the tunnel lining is exposed locally to heat fluxes from the flame volume and the hot smoky gases. In a tunnel accident with multiple vehicles the fire spreads from one vehicle to next resulting in different heat exposure to the tunnel lining depending on time and location.

Design Fires for Road Tunnels
Thematic Network Fire in Tunnels
60/161
The fire moves within the tunnel in a dynamic manner and the heat fluxes to the linings vary depending on the origin of the fire, the ventilation rate, the type and amount of fuel (heat release rate) and the size of the cross-section. The gas temperature, the surrounding wall temperatures, the emissivity of the hot gases in the vicinity of the fire and the surface temperature of the linings govern the net heat flux at the surface of the linings. The net heat flux to the linings will in turn govern the temperature rise inside the lining material. The net heat flux q”s to the lining can be estimated by the following equation:
)()1(" 444lingslinwallgggs TThTTTq −+−−+= σσεσε (4)
where sq" is the net heat flux to the linings and gε is the emissivity of the hot gas, hs is the convective heat transfer coefficient, Tg is the gas temperature, Twall is the surrounding wall and floor temperatures and Tlin is the lining temperature where q”s is determined. In tunnel fires with flames crawling along the ceiling it can be argued that the dominating term in equation (1) is the first term i.e. the incident radiation from the hot gas volume and the flames. The incident thermal radiation from the fire to the tunnel lining is highly dependent on the geometry of the flame volume and its smokiness. The flame volume and its geometry are dependent on the heat release rate and ventilation conditions within the tunnel. The fraction of the flame radiant heat flux of the total heat release varies for most fuels between 0.25 to 0.4. For large tunnel fires the tunnel linings in the vicinity of the fire are mainly affected by this incident flame radiant heat flux. In order to estimate the maximum incident radiation to the linings in the vicinity of the fire we can simply assume that a fraction of the total heat release rate is radiated towards the tunnel linings. The maximum heat flux to the tunnel linings would then be:
fhfh
LD
Q
LD
ππ312
21
31
"max == (5)
where Lf is the flame length (m), Dh is the hydraulic diameter of the tunnel (m) and Q is the total heat release rate (kW). An interesting aspect when considering different time – temperature curves is the case with multiple vehicle/train wagon fires (see also chapter 3.2.3.3). What will be the weakest point; the one directly above the origin of the fire or some vehicle/wagon distances downstream the fire? If we assume that fire start in a vehicle/wagon at a certain location within the tunnel, one would expect that the highest ceiling temperatures are just above the fire origin. In reality this would depend on the vehicle / wagon closeness, ventilation rate and the cross-section of the tunnel. If we assume that vehicle number two and three downstream a fire starts to burn after a while (see Figure 3.2), the ceiling above these vehicles will be exposed to the heat from the vehicle at the origin as the one which starts to burn. If we assume that vehicle at the origin is still burning and the fire has spread to vehicle number three the ceiling is exposed to heat from three vehicles. This will continue as long as vehicle number one is still burning and the fire can continue etc.
Figure 3.2: Ignition sequence of the vehicles
Recent calculations and model scale tests demonstrate these effects. The heat flux at the third vehicle showed the highest fluxes to the lower part of the tunnel. This indicates that the construction become warm and thus we obtain higher heat fluxes as the fire approaches point 3 even if the fire size is similar.
1 2 3

Design Fires for Road Tunnels
Technical report Part 1 ‘Design Fire Scenarios’ 61/161
3.1.3 Design fires referring to the structural load of Road tunnels 3.1.3.1 Principal Engineering Aims on Fire Protection for Road Tunnels The resistance of a tunnel structure to fire characterises its ability to fulfil its functions during and also after a fire. The main engineering aims when regarding this ability are: - avoidance of damage threatening the load-bearing capacity of the tunnel structure - avoidance of resting deformations diminishing the usability of the tunnel construction - retaining the water tightness - avoidance of damage to surrounding buildings - delaying the spalling of concrete and the failure of operating equipment until all tunnel users get
out of the dangerous area either on their own or with the help of rescue teams - keeping the risk for tunnel users to get hurt by a fire event as low as possible - avoidance of a long interruption of the service - avoidance of expensive repair work - minimising the spread of fire along the tunnel - placing enough heat insulation for waterproofing membranes to remain intact In some tunnels, the ventilation and evacuation routes rely heavily on the structural integrity of concrete components. Failure of such components directly affects users still trying to escape and/or rescue workers trying to get in. The way these objectives are translated into precise requirements concerning the accepted time before failure of tunnel structures depends on the consequences of a failure: the larger the consequences, the higher the requirements will be. As a consequence, these requirements will depend on [36]: - the type of tunnel Immersed tunnels are for example more susceptible to failure than tunnels in stable rock;
although Runehamar has shown that severe heating increased the probability of large pieces of rock falling down (“rock-spalling”) [176 to 178].
- the type of structure and its role for safety and protection of property The measures for structural resistance for building foundations near the tunnel can require more
effort than an emergency exit to a parallel tunnel tube. - the type of traffic allowed in the tunnel If dangerous goods are allowed a longer duration of a fire with regard to the fire of a passenger
car should be expected and a longer time before failure is required, more stringent conditions on the approvement on material and equipment will be implemented (e. g. by the selection of a specific temperature-time curve).
In summary a basic engineering aim is to prevent that a local collapse leads to more generalised consequences in the tunnel [36]. Particularly the following two features apply to all tunnels [36]: - prevention of progressive collapse A failure of a part may not lead to a transfer of stress to nearby parts causing them to fail
initiating a stress transfer themselves and so on. - vital longitudinal equipment must be protected against a cut off by a collapse Vital equipment like electrical supply cable, communication cable, fire hoses, fresh air ducts,
escape routes etc. must be located in protected places. The assessment of fire resistance engineering aims is different in the member countries of
PIARC as can be seen from the examples of recommendations and proposals given in chapter 3.1.3 to 3.1.6. The differences reflect e. g. different traffic conditions, geologies, funding of tunnel construction and safety philosophies in the various countries.

Design Fires for Road Tunnels
Thematic Network Fire in Tunnels
62/161
3.1.3.2 Objectives in various Countries and of PIARC At first the objectives of design fire scenarios in France, Germany, The Netherlands and Spain are specified in more detail followed by a summary of the present discussions by PIARC. (1) France The objectives which call for fire resistance of tunnel structures are twofold: safety and protection of property. The new French regulation mostly aims at ensuring safety. However tunnel owners must also take the second aspect into account when setting design objectives. Objectives, standard resistance levels, and fire resistance are the followings [87]: a) The first objective for fire resistance is to make evacuation or protection of users possible:
- During the time necessary for the users inside the tunnel to reach the evacuation facilities, ventilation must remain in working order, nothing heavy must fall from the ceiling, no flooding must occur.
- The evacuation facilities must ensure users' protection during the time necessary for everybody to reach the open.
The evacuation time has been fixed as tev = 60 min for exits which lead to the outside (directly or through another tunnel tube). When shelters are used, the corresponding time is tsh = 120 min.
b) The second objective is to make rescue operations possible and ensure their safety
- During the time tres necessary for rescue teams operation, nothing heavy must fall from the ceiling and ventilation must remain in working order. Beyond the time tres the rescue teams may have to leave the zone of the fire if it is not extinguished yet.
- During the maximum duration tmax of a fire, in order to ensure the safety of emergency services present out of the fire zone, power supply must be maintained on both sides, telecommunications must keep on working across the fire, flooding or catastrophic ground collapse into the tunnel must be avoided.
The time tres allowed for rescue operations in the fire zone is 60 min in reduced-clearance tunnels reserved for passenger cars and vans and 120 min in normal-clearance tunnels.
c) A third objective is to protect the neighbours of the tunnel:
- During the maximum duration tmax of a fire, fire must not spread to buildings on top of or adjacent to the tunnel, and these buildings and other neighbouring structures must not collapse due to a failure of a part of the tunnel.
d) In the protection of property objective, an economic balance must be sought between extra costs for additional fire protection on
the one hand, and cost of repairs and consequences of a traffic disruption after a possible fire on the other hand (including possible losses of toll). It is generally acceptable that repairs are necessary after a large fire, but not that the whole tunnel is lost.
The need for protection of the main structure depends on the type of construction: - A tunnel in a stable ground (rock for instance) would not collapse in case of a fire and normally
does not require any special protection. - In a water bearing soft ground, a collapse of the main structure may be very difficult to repair,
especially the segments of a shield-driven tunnel, which should justify some fire resistance measures.
- A local failure of an immersed tunnel would result in the total loss of the tunnel, so that a protection against the worst possible fire will generally be necessary.

Design Fires for Road Tunnels
Technical report Part 1 ‘Design Fire Scenarios’ 63/161
Secondary structures such as false ceilings are generally easier to repair. From a purely economic point of view they generally do not justify large expenses for fire protection. Nevertheless their preservation may be needed for safety reasons. e) Standard resistance levels In order to answer the objectives described above while avoiding useless expenses, four levels of fire resistance have been defined in France. They correspond to increasing requirements and are described first for normal-clearance tunnels (≥ 3.50 m), then for reduced-clearance tunnels. - Level N0 This level only requires checking that there is no risk of progressive collapse in case of a local failure: the loss of an element must not bring an excessive loading on other structural parts which may then fail. Level N0 is the minimum requirement that any structure must meet. It must be checked during the fire and after it, during the cooling phase. Level N0 is applied when a local failure near the fire place does not have damageable consequences on safety of users or rescue teams who may be present in other tunnel zones where temperature is not so high. Structures which must meet the higher resistance levels described below must also meet this requirement. - Level N1 This level corresponds to resistance to the ISO curve ([5], Figure 3.3) during 120 minutes. For the majority of fires, but not the most violent ones, it ensures the structure resistance during the time tres necessary for rescue operations. It applies to structural elements which are necessary to ensure a function which is important for rescue operations, when this function is anyway not dimensioned for the maximum possible fire (smoke control for instance). - Level N2 This level corresponds to resistance to the HCinc curve ([4],Figure 3.3) during 120 minutes. It applies to structures which must be kept whatever the violence of the fire during the time tres necessary for rescue operations or tsh to evacuate people from shelters.
0
200
400
600
800
1000
1200
1400
0 30 60 90 120 150 180 210time after ignition [minutes]
tem
pera
ture
[ °C
]
[ 1 ]
[ 2 ][ 3 ]
[ 4 ]
[ 5 ]
[ 1 ] ZTV-ING[ 2 ] RWS (Rijkswaterstaat)[ 3 ] HC (Hydrocarbon)[ 4 ] HC (increased)[ 5 ] ISO
Figure 3.3: Determination of the temperature-time curves of reference fires for the bearing capacity of road tunnel structures [33-35, 38, 45-47, 86, 87]

Design Fires for Road Tunnels
Thematic Network Fire in Tunnels
64/161
- Level N3 This level requires resistance to both ISO curve during 240 minutes and (separately) HCinc curve during 120 minutes. It is applied to facilities which must resist the worst fire during its maximum duration. In tunnels with a clearance up to 3.50 m, the definition of level N0 is the same as above; levels N1, N2 and N3 all correspond to resistance to the ISO curve during 60 minutes, because a fire is not supposed to last longer nor produce higher temperatures in these tunnels. Table 3.2 recapitulates the definition of the four levels for both clearance cases. f) Fire resistance of main tunnel structures No requirements are imposed on excavated tunnels without lining because they are not very sensitive to fire and their protection would be very expensive compared to the limited risk of block falls. Table 3.3 outlines the requirements for lined tunnels, cut-and-covers and immersed structures. g) Fire resistance of secondary tunnel structures [87] Many cases are possible and must be examined according to the objectives described above. Table 3.4 outlines usual cases.
Resistance Levels Clearance ≤ 3.50 m Clearance > 3.50 m N0 No risk of progressive collapse N1 ISO during 60 min ISO during 120 min N2 ISO during 60 min HCinc during 120 min
N3 ISO during 60 min HCinc during 120 min + ISO during 240 min
Table 3.2: Definition of the resistance levels [87]
MAIN STRUCTURES (LINED & IMMERSED TUNNELS, CUT-AND-COVERS)
Resist.
levels
Requirements for clearance > 3.50 m
General case as to ground and environment (no risk of catastrophic flooding or ground collapse, no serious risks at the surface or to other structures)
- General case (a local failure has no consequence on safety of users or rescue teams who may be present somewhere else in the tunnel)
N0 No risk of progressive collapse
- Risks for a road above: general case (close the road above in case of a very violent fire) if indispensable to preserve the road above
N1 N2
ISO 2 hrs HCinc 2 hrs
- Risks for the stability of or separation from another tunnel tube: when there are direct exits to the outside (not using the other tube) when there are not direct exits to the outside
N1 N2
ISO 2 hrs HCinc 2 hrs
- Risk to cut ventilation ducts or cables: if they are important for rescue operations if they are indispensable for shelter safety
N1 N2
ISO 2 hrs HCinc 2 hrs
Risk of catastrophic flooding or ground invasion into the tunnel N3 HCinc 2 hrs + ISO 4 hrs
Risk of serious damage at the surface, or to another structure or building N3 HCinc 2 hrs + ISO 4 hrs
Table 3.3: Fire resistance levels required for tunnel main structures [87]

Design Fires for Road Tunnels
Technical report Part 1 ‘Design Fire Scenarios’ 65/161
SECONDARY STRUCTURES Resist. levels
Requirements for clearance > 3.50 m
False ceilings and partitions separating ventilation ducts from tunnel
- General case (a local loss of continuity does not affect the safety of users present in other tunnel zones)
N0 No risk of progressive collapse
- If the duct continuity is important for rescue operations N1 ISO 2 hrs - Ducts for shelter ventilation N2 HCinc 2 hrs Other partitions of the ventilation ducts
- General case N0 No progressive collapse
- Ducts used for smoke control (*) 120 min (*) Partitions separating technical rooms / ventilation plants from tunnel
- Vis-à-vis a fire which happens in the room or plant N1 ISO 2 hrs - Vis-à-vis a fire which happens in the tunnel : general case if risk for use of shelters and their access routes if risk for the continuity of power supply and telecommunications
N1 N2 N3
ISO 2 hrs HCinc 2 hrs Id .+ ISO 4hrs
Facilities for users evacuation and rescue access (global rating for a fire in the tunnel, taking into account several partitions if the case arises)
- Direct escape routes to the outside (**) ISO 1 hr - Connections between tubes (global rating of the connection): if common wall between the tubes if no common wall
≡ wall N2
≡ wall HCinc 2 hrs
- Emergency galleries, shelters and their access routes N2 HCinc 2 hrs Slab which bears the pavement
- General case N0 No progressive collapse
- Slab above a facility which requires a higher resistance level ≡ facil. ≡ facility * 60 min for small tunnel clearance, 120 min for normal clearance; the most unfavourable temperatures should be considered on both sides of each partition ** ISO curve during 60 min in all cases
Table 3.4: Fire resistance levels required for tunnel secondary structures [87]
The French regulations on safety in road tunnels take into account road tunnel construction, operation and safety. Two representative temperature-time curves were selected on the basis of existing regulations and experimental data, with a concern for maximum compatibility with European and international standardisation. They include a new HCinc curve which quickly reaches 1300°C to account for the most violent tunnel fires. The resistance requirements are based on four resistance levels in order to fit the needs of each structural part as closely as possible and ensure safety while avoiding unnecessary costs. (2) Germany Construction design aims listed in the ZTV-ING [33, part 5] are: - Temperatures ≤ 300 °C at the reinforcement during a tunnel fire - no damages threatening the load-bearing capacity of the tunnel structure - no resting deformations diminishing the usability of the tunnel construction - almost retaining the water tightness Escape doors must withstand a 90 minute fire according to the ISO curve ([33, part 1],Figure 3.3).

Design Fires for Road Tunnels
Thematic Network Fire in Tunnels
66/161
(3) The Netherlands In The Netherlands there are many underwater tunnels. To avoid flooding in the case of a fire the tunnel structure must fulfil the following requirements when a fire load due to the RWS-curve (Figure 3.3) is applied: - No loss of water tightness - No collapse of the tunnel A heat resistance lining has to meet the following criteria [32, 35, 38]: - Twice testing according to the RWS curve for two hours; extended by 1 hour - Temperatures ≤ 380 °C at the interface between lining and concrete - Temperatures ≤ 250 °C of the steel reinforcement mesh, 25 mm inside the concrete - Temperatures ≤ 60 °C at rubber joint gaskets In principle all traffic tunnels are one-way traffic; the safety concept is predominantely (except for a limited number of tunnels) based on longitudinal ventilation. Furthermore, two classes are distinguished: class 1 with some limitation to the transportation of dangerous goods and class 2 with a more severe limitation. Generally LPG is not allowed to be transported through tunnels. All tunnels in highways have to meet the RWS standard. (4) Spain In Spain the requirements have to be specified for each individual tunnel project. The only Norm applicable now is the "Instruccion para el proyecto, construccion y explotación de obras subterraneas para el transporte terreste" (IOS 98) (Norm for the design, execution and exploitation of underground works for surface transport), both for road and railway tunnels. The tunnels are divided in 3 categories depending on: if they are urban or not, and on its lenght. This Norm gives only basic criteria and very generic requirements for each categorie. In the railway tunnels area is now in preparation a Code what will give more precise requirements. The last draft of this code says that the designer, taking account of the type of traffic, will determine the curve of fire applicable: well a curve of natural fire if he/she knows the parameters, well the ISO or HC curves. All the elements with structural or separating function will have a fire resistance of 120 minutes. In the part of road tunnels the European Directive on road tunnels will be introduced. The current objectives of PIARC [10] are summarized in Table 3.5 The data presented in Table 3.5 follows latest PIARC recommendations to provide a set of design performance criteria for road tunnel linings. While it may be highly desirable to have such a set of prescriptive design criteria, for these to be truly useful they must be based on a rigorous understanding of fire-structure interaction within the tunnel environment. In adopting the PIARC recommendations, potential users should consider the following: (1) The PIARC criteria ignore the impact of tunnel ventilation on fire growth rate. (2) The ISO test fires recommended for use in the PIARC performance criteria are designed for fully developed building fires and take account of capacities and constraints of available fuel in building fires or gas fired furnaces designed for fire resistance tests. As the tunnel fire environment is very different to that found in buildings, the use of these ISO curves is questionable. (3) The PIARC approach assumes that tunnel lining performance can be determined by simply considering the lining response to a given temperature-time curve. However, in reality, lining response will be primarily governed by the actual surface heat flux. This is turn is influenced by the gas temperature, the surrounding wall temperature and the emissivity of the gas volume in the vicinity of the fire, not simply the temperature-time curve as assumed in the ISO, RWS and HC curves. The lining performance may also be influenced by some chemical aspect bound to fire gas composition (acidity).

Design Fires for Road Tunnels
Technical report Part 1 ‘Design Fire Scenarios’ 67/161
In many cases it is necessary to adopt the prescriptive approach to engineering design. However, where this approach is used, it is essential that acceptance criteria be based using representative and reliable engineering data. As an alternative to this approach, a Performance Based analysis combined with a Risk Analysis - to identify relevant fire scenarios - could be undertaken however, this too will require reliable data. Reference [156] provides some further consideration regarding the development of design fire scenarios in the context of a performance-based approach (see chapter 8 within the quoted reference). Moreover, "WG6" entitled "Design Fire scenarios and design fires" of the standardisation Committee ISO TC 92 SC4 (Fire Safety Engineering) is currently revising the existing technical report ISO TR93 covering the subject of design fire scenarios [157]. In particular, the central role of heat fluxes as outlined above are confirmed in this working document.

Design Fires for Road Tunnels
Thematic Network Fire in Tunnels
68/
Main Structure Secondary Structures Traffic type
Immersed or under / inside superstructure
Tunnel in unstable ground
Tunnel in stable ground Cut & Cover Air Ducts Emergency
exits to open air
Emergency exits to other tube
Shelters6)
Cars / Vans ISO 60 min ISO 60 min 2) 2) ISO 60 min ISO 30 min ISO 60 min ISO 60 min
Trucks / Tankers
RWS / HCinc 120 min1)
RWS / HCinc 120 min1)
3) 3) ISO 120 min ISO 30 min RWS / HCinc 120 min
RWS / HCinc 120 min7)
Remarks: 1) 180 min may be required for very heavy traffic of trucks carrying combustible goods 2) Safety is not a criteria and does not require any fire resistance (other than avoiding progressive collapse). Taking into account other objectives may lead to the following requirements: - ISO 60 min in most cases - no protection at all if structural protection would be too expensive compared to cost and inconvenience of repair works after a fire (e.g. light cover for noise protection) 3) Safety is not a criteria and does not require any fire resistance (other than avoiding progressive collapse). Taking into account other objectives may lead to the following requirements: - RWS/HCinc 120 min if strong protection is required because of property (e.g. tunnel under a building) or large influence on road network - ISO 120 min in most cases, when this provides a reasonably cheap protection to limit damage to property - no protection at all if structural protection would be too expensive compared to cost and inconvenience of repair works after a fire (e.g. light cover for noise protection) 4) Other secondary structures: should be defined on a project basis 5) In case of transverse ventilation 6) Shelters should be connected to the open air 7) A longer time may be used if there is a very heavy traffic of trucks carrying combustible goods and the evacuation from the shelters is not possible within 120 min
Table 3.5: Recommendations of PIARC WG6 (September 2002, [103])

Design Fires for Road Tunnels
Technical report Part 1 ‘Design Fire Scenarios’ 69/161
3.1.3.3 Specifications on the Course of the Fire To quantify temperatures, heat release and smoke flow rates it is on the one hand necessary to analyse real fire events that occurred in road tunnels. Normally values obtained thereby are estimates because of limited knowledge about the evolution of the fire, temperatures and gases with time. Also there is a big scatter in the data because of the different fire load in these accidental fires. Another approach is to do fire tests where real vehicles or specific amounts of gasoline or heptane are burnt under controlled conditions and the burning is supervised by adequate measuring equipment. Such experiments were done for example in tunnels like Ofenegg, Zwenberg, Lappeenranta, Repparfjord, Memorial [41] and Runehamar [176, 177]. When introducing the measured temperatures, heat release rates etc. from these experiments into regulatory or planning work an assessment and grouping (e. g. according to the safety standards in different countries) is necessary. In summary with regard to fire tests and real incidents the following temperatures have to be anticipated during vehicle fires in road tunnels: (1) Maximum temperatures at the tunnel wall The Brussels report of PIARC quoted in the year 1987 the following maximum temperatures during vehicle fires:
a) passenger car: 400 °C b) bus / truck: 700 °C c) petrol tanker: 1000 °C
These temperatures were estimated for a location 10 m downwind of the fire near the tunnel walls and for the minimum air velocity to prevent backlayering. The EUREKA tests confirmed these maximum temperatures [39, 40, 73]. The tests themselves (Figure 3.4 and Figure 3.5) gave slightly higher results for the passenger cars (up to 500 °C, depending on type) and the coach (800 °C) because of the small cross section area and the low air velocity used (0.3 m/s and 0.5 m/s) in the test tunnel. The fire tests of EUREKA and Runehamar also showed that fires due to HGV can produce maximum temperatures between about 1000 °C and 1350 °C at the tunnel ceiling (Figure 3.4, Figure 3.5, Figure 3.6). For fully developed fires of petrol tankers temperatures between 1200 °C and 1400°C are discussed [36, 42-44]. As can be seen by figure 3.1/5 in the EUREKA tests temperatures of more than 300°C which can be dangerous to the steel reinforcement of the concrete tunnel lining were found till about 100 m downstream of the fire and because of back-layering till about 30 m upstream of the fire. According to real fires and to the Memorial tunnel tests [53] the extension of this region can be quite different from these values due to e.g. the ventilation, tunnel inclination and surface roughness. (2) Temperature versus time Many known real tunnel fires and also the EUREKA and Runehamar fires (Figure 3.6 and Figure 3.7) showed a very fast development during the first 5 to 10 (sometimes 15) minutes. The gradient of temperature is especially steep at the beginning of a full car fire with a corresponding high emission of heat and smoke. Between 7 and 10 minutes after ignition a flashover has to be taken into account (even sooner in the case of a passenger car). The temperature during test 1 of the Runehamar fires [178, 192] followed the RWS curve very well (Figure 3.6). Test 1 comprises the largest amount of combustible material of the four tests conducted. In test 4 only 3120 kg of cardboard boxes and polystyrene cups were used, potentially creating the lowest calorifc energy output of all tests. However temperatures were recorded to be in the same magnitude of test 1, although for a shorter period of time (Figure 3.6). The duration of the hot phases of the EUREKA and Runehamar fires covered normally a time interval of about 30 minutes after the ignition stage (Figure 3.6 and Figure 3.7). On the other hand the Mont Blanc fire and the Nihonzaka fire lasted significantly longer [12, 36]. The EUREKA and Runehamar tests showed a steep decline of temperatures just after the hot phase (Figure 3.6 and Figure 3.7).

Design Fires for Road Tunnels
Thematic Network Fire in Tunnels
70/161
Figure 3.4:Maximum surface temperatures of the tunnel lining at the fire during tests with road vehicles [40, 73]
Figure 3.5: Maximum temperatures in the ceiling area of the tunnel during tests with road vehicles [40, 73]

Design Fires for Road Tunnels
Technical report Part 1 ‘Design Fire Scenarios’ 71/161
Figure 3.6: Gas temperature during the Runehamar fire tests [178]
0
200
400
600
800
1000
1200
1400
0 30 60 90 120 150 180 210Time after ignition [min]
Tem
pera
ture
[°C
] Heavy Goods Vehicle
Public bus
Passenger van
Passenger car
ISO
RWS (NL)
ZTV Tunnel (D)
Figure 3.7: Time dependency of temperatures in EUREKA-tunnel-fires and standard curves used in
regulations upon fire prevention [41, 48, 49]

Design Fires for Road Tunnels
Thematic Network Fire in Tunnels
72/161
In several European countries the experience gained has led to temperature-time curves being laid down for road tunnels. The effect in the structure of these temperature-time curves has to be taken into account simultaneously with the static design loads in the dimensioning of tunnel linings. (1) ZTV Curve For the technical dimensioning of the interior works of the tunnel with respect to fire protection or additional fire protection lining, the temperature-time curves stated in the ZTV-ING regulations is used in Germany (Figure 3.3). The temperature-time curve of the ZTV-ING regulations is generally applicable and does not distinguish between, for example, fires with and without dangerous substances. (2) RWS Curve
a) The Netherlands The RWS curve was developed in the Netherlands by TNO in close cooperation with the authorities responsible for operating tunnels, namely the Rijkswaterstaat. This applies to tunnels which are open to the transport of hazardous substances. In contrast to the reference fire of the ZTV-ING regulations, the RWS curve assumes that the interior works of the tunnel are subjected to increased and longer-lasting temperature (up to approx. 1,350°C, Figure 3.1/3, [35, 38, 46]). b) Sweden In Sweden the RWS curve is used as the basis for the dimensioning of the fire protection of the tunnel lining if hazardous materials are to be transported through an underwater tunnel or through tunnels with a small overlap to the superstructure [86]. (3) Hydrocarbon (HC) Curve (Sweden) If a tunnel is involved which is not covered by item 2 above, in Sweden the hydrocarbon curve with a maximum temperature of 1,100°C is used (Figure 3.3, [47, 86]) for dimensioning the fire protection of the tunnel lining. This also applies to fires involving hazardous materials. The type of hazardous material is also taken into account over the duration of the fire (at least 60 minutes, not more than 180 minutes). (4) Raised Hydrocarbon Curve In France, when the reference fires used for the fire protection of tunnel linings were determined, the rate of burning of hazardous materials was also taken into account [45, 87]. If it is assumed that in a certain tunnel the hazardous material is rapidly and fully combusted, a more severe hydrocarbon curve with a maximum temperature of 1,300°C is used (Figure 3.3). Special fire situations are covered by the duration of the maximum temperature stress (Table 3.3 and Table 3.4) (5) ISO-Curve The ISO-curve (Figure 3.3, [45]) is used in France for the situations indicated in the Table 3.3 and Table 3.4 [45, 87]. 3.1.3.4 Specifications of Fire Loads The materials which burn in a fire include elements of the vehicles such as the seats, tyres, plastic materials in the finishing or even in the body work itself, the fuel from the vehicle tanks, which amounts to hundreds of litres for trucks, and the load, principally for goods vehicles. This latter can be extremely varied and lead to many different sorts of fires. Some principle examples of fire loads are given in Table 3.6.
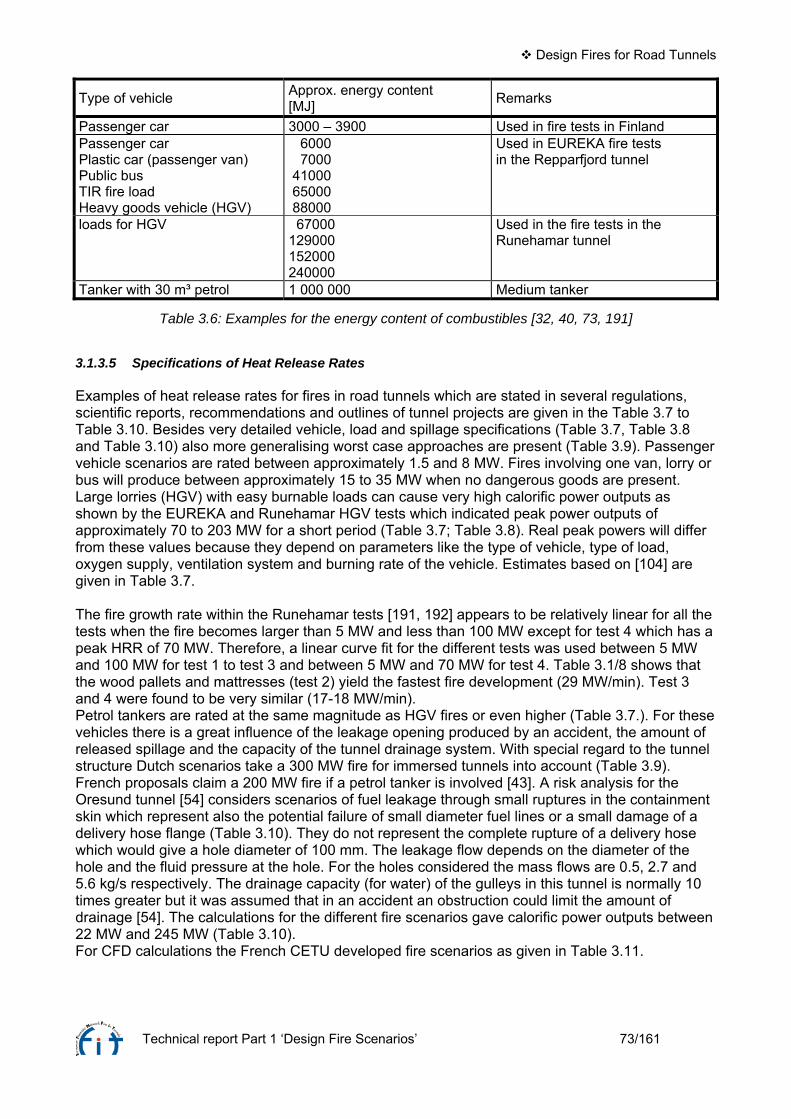
Design Fires for Road Tunnels
Technical report Part 1 ‘Design Fire Scenarios’ 73/161
Type of vehicle Approx. energy content [MJ] Remarks
Passenger car 3000 – 3900 Used in fire tests in Finland Passenger car Plastic car (passenger van) Public bus TIR fire load Heavy goods vehicle (HGV)
6000 7000 41000 65000 88000
Used in EUREKA fire tests in the Repparfjord tunnel
loads for HGV 67000 129000 152000 240000
Used in the fire tests in the Runehamar tunnel
Tanker with 30 m³ petrol 1 000 000 Medium tanker
Table 3.6: Examples for the energy content of combustibles [32, 40, 73, 191]
3.1.3.5 Specifications of Heat Release Rates Examples of heat release rates for fires in road tunnels which are stated in several regulations, scientific reports, recommendations and outlines of tunnel projects are given in the Table 3.7 to Table 3.10. Besides very detailed vehicle, load and spillage specifications (Table 3.7, Table 3.8 and Table 3.10) also more generalising worst case approaches are present (Table 3.9). Passenger vehicle scenarios are rated between approximately 1.5 and 8 MW. Fires involving one van, lorry or bus will produce between approximately 15 to 35 MW when no dangerous goods are present. Large lorries (HGV) with easy burnable loads can cause very high calorific power outputs as shown by the EUREKA and Runehamar HGV tests which indicated peak power outputs of approximately 70 to 203 MW for a short period (Table 3.7; Table 3.8). Real peak powers will differ from these values because they depend on parameters like the type of vehicle, type of load, oxygen supply, ventilation system and burning rate of the vehicle. Estimates based on [104] are given in Table 3.7. The fire growth rate within the Runehamar tests [191, 192] appears to be relatively linear for all the tests when the fire becomes larger than 5 MW and less than 100 MW except for test 4 which has a peak HRR of 70 MW. Therefore, a linear curve fit for the different tests was used between 5 MW and 100 MW for test 1 to test 3 and between 5 MW and 70 MW for test 4. Table 3.1/8 shows that the wood pallets and mattresses (test 2) yield the fastest fire development (29 MW/min). Test 3 and 4 were found to be very similar (17-18 MW/min). Petrol tankers are rated at the same magnitude as HGV fires or even higher (Table 3.7.). For these vehicles there is a great influence of the leakage opening produced by an accident, the amount of released spillage and the capacity of the tunnel drainage system. With special regard to the tunnel structure Dutch scenarios take a 300 MW fire for immersed tunnels into account (Table 3.9). French proposals claim a 200 MW fire if a petrol tanker is involved [43]. A risk analysis for the Oresund tunnel [54] considers scenarios of fuel leakage through small ruptures in the containment skin which represent also the potential failure of small diameter fuel lines or a small damage of a delivery hose flange (Table 3.10). They do not represent the complete rupture of a delivery hose which would give a hole diameter of 100 mm. The leakage flow depends on the diameter of the hole and the fluid pressure at the hole. For the holes considered the mass flows are 0.5, 2.7 and 5.6 kg/s respectively. The drainage capacity (for water) of the gulleys in this tunnel is normally 10 times greater but it was assumed that in an accident an obstruction could limit the amount of drainage [54]. The calculations for the different fire scenarios gave calorific power outputs between 22 MW and 245 MW (Table 3.10). For CFD calculations the French CETU developed fire scenarios as given in Table 3.11.

Design Fires for Road Tunnels
Thematic Network Fire in Tunnels
74/161
For a complete CFD simulation of a fire the time dependency of all outputs of the fire is assumed to include: - a linear growth from zero to the maximum value during the time tg, - a constant maximum value during the time tmax, - a linear decrease from the maximum value to zero during the time td. Table 3.7 contains the adopted values of these times for each design fire as well as the total released energy.

Design Fires for Road Tunnels
Technical report Part 1 ‘Design Fire Scenarios’ 75/161
Heat Release Rates [MW] Recommendations by institutions1) Fire tests PIARC RABT CETU (F) NFPA 502 EUREKA (D) Proposals2
) (USA) research: Fire category
1987 1999 19947) 1996/1997 1998 real fires3) report Ingarson6)
Runehamar Memorial: adopted fire sizes
Estimates from large accidents6)
Passenger car 5 --- 2.5 5 1.5-24) --- --- Passenger car (large) --- --- 5 --- --- --- --- passenger van (plastic) --- --- --- --- 5-65) --- --- 1 – 2 passenger cars --- 5 - 10 --- --- --- --- --- 2 – 3 passenger cars ---
2.5-8
--- 8 --- ---
2.5-9
--- ---
3-10
1 van --- 15 --- 15 --- --- --- --- --- --- 1 public bus --- 20 --- --- --- 29-345) 29-34 --- --- 36 1 bus or 1 lorry (freight of lorry not hazardous) 20 --- 20 - 30 20 20 --- --- --- 20 ---
heavy goods vehicle --- --- --- 30 --- 100-1305) 128 --- --- 150-400 petrol/gasoline tanker with a leak 100 100 50 - 100 200 100 --- 20-100 --- --- 120-300
flammable spill of 400 liters --- --- --- --- --- --- --- --- 50 --- flammable spillof 800 liters or hazardous material --- --- --- --- --- --- --- --- 100 ---
mixed load, 2844 kg, (wood, rubber tyres, plastic material) --- --- --- --- --- 15-175) --- --- --- ---
different HGV loads --- --- --- --- --- --- --- 71-223 --- --- carriage --- --- --- --- --- --- 12-47 --- --- 3-100 1): Dutch recommendations: see table 3.1/8 2): proposals are related to special types of road tunnels (e. g. with height clearance for passenger cars only, see table 3.1/9) 3): energy contents between approx. 3 GJ (passenger car) and approx. 90 GJ (heavy goods vehicle) 4): 3 fire tests done in Lappeenranta, Finland 5): values depend on the measuring system and on the method of data evaluation 6) Report Ingarson: [104] 7) New issue from 2003 [52] recommends fire loads for lorries only, depending on traffic:
- 30 MW if (lorries x km) / (day x table) ≤ 4000

Design Fires for Road Tunnels
Thematic Network Fire in Tunnels
76/161
- 50 MW if (lorries x km) / (day x table) > 4000 - up to 100 MW if (lorries x km) / (day x table) > 6000 depending on expert report
Table 3.7: Heat release rates: measured values and examples for recommendations [36, 37, 39-41, 43, 44, 48-57, 73, 104, 178, 192]

Design Fires for Metro Tunnels
Technical report Part 1 ‘Design Fire Scenarios’ 77/161
Test Nr. Time from ignition to peak HRR [min]
Linear fire growth rate [MW/min]
Peak HRR [MW]
1 18.5 20.5 203 (average) 2 14.3 29.0 158 (average) 3 10.4 17.0 124.9 4 7.7 5-70 MW: 17.7 70.5
Table 3.8: Peak HRR and fire growth rate from the Runehamar tests [192]
Size
Heat Release Rate [MW]
Scenario Remarks
small 6.1 a passenger car is completely burnt estimated duration of the fire: 25 minutes smoke temperature less than 150 °C a few metres from the source of the fire ventilation speed 1.5 m/s boosters will be only impaired if they are right under the fire fire fighting possible from within a few metres from the source of the fire limited damage to the tunnel interior limited amount of soot
---
medium-sized
100 a goods vehicle loaded with wood is completely burnt the temperature of the fumes is about 800 °C at a distance of 50 m from the source ventilation speed 1.5 m/s fire fighting possible at a distance of 10 to 20 m from the source of the fire when protective clothing is worn damage to the tunnel interior, soot formation breakdown of boosters at a distance of 150 to 300 m downstream of the fire expected
scenario applicable to tunnels in urban areas or on secundary roads where the transport of dangerous goods is forbidden
large 300 a tanker loaded with 50 m³ petrol is completely burnt estimated duration of the fire: 2 hours fire fighting possible at a distance from 10 to 20 m from the source possible when the ventilation speed is increased to 3 m/s and protective clothing is worn use of water canons should be considered the temperature of the smoke will be about 1400 °C at a distance of about 20m downstream of the fire all boosters will be damaged over a distance of 300 to 500 m downstream of the fire considerable damage to the interior of the tunnel over a large distance downstream of the fire, distance is increased when the ventilation speed is increased
normative criterium for tunnels which are opened to the transport of dangerous substances
Table 3.9: Dutch fire scenarios for tunnels with longitudinal ventilation in relation to heat release rates (KIVI, [42])

Design Fires for Metro Tunnels
Thematic Network Fire in Tunnels
78/161
Equivalent diameter Leakage mass flow Calorific power [MW] of rupture of petrol Drainage mass flow of petrol: [mm] [kg/s] 0 kg/s 1 kg/s 2 kg/s 5 kg/s 15 0.5 22 --- --- --- 35 2.7 120 76 33 --- 50 5.6 245 201 158 27
Table 3.10: Effect of leakage openings and drainage rates on the fire size of petrol tanker incidents [54]
Clearance of the tunnel Parameter height
< 2.7 m height 2.7 m to 3.5 m
height > 3.5 m no dangerous goods allowed
height > 3.5 m dangerous goods allowed
typical fire 2 - 3 cars 1 van 1 HGV 1 petrol tanker heat release rate [MW] 8 15 30 200 smoke flow rate [m3/s] 30 50 80 3001) growth time tg [min] 5 5 10 10 peak duration tmax [min] 20 30 60 60 decline time td [min] 20 20 30 30 released energy [GJ] 15 40 150 1000
1) in France this smoke flow rate is generally not taken into account for the design of (semi-)transverse ventilation even if the transport of dangerous goods is allowed
Table 3.11: French design fires with complementary data for CFD calculations [56]
3.1.4 Design Fires referring to the Ventilation of Road Tunnels The principal design parameter is the smoke flow rate produced by the fire. Very often countries refer to the PIARC proposal from the year 1987 about smoke flow rates (table 3.1/12). For the smoke flow rates by fires of passenger cars, buses and lorries these assumptions of the PIARC Brussels report were confirmed by the EUREKA fire tests ([39, 40, 73], table 3.1/12). German regulations (RABT from the year 1994) [52] quote smoke production rates somewhat higher than those of PIARC [43]. In recent years CETU issued very detailed proposals to be included in the French regulations on safety in road tunnels [56, 87] (table 3.1/11 and table 3.1/12). CFD calculations made by CETU show for heat release rates above 60 MW a decreasing smoke volume flow with increasing distance to the fire ([56], Figure 3.8). For fires up to 60 MW the volume flow does not depend on this distance, from 10 to 120 m at least: going away from the fire, the smoke cools down, but fresh air is entrained so that the volume flow does not change. For 100-150 MW fires the entrainment of fresh air does not compensate for the very strong reduction of smoke temperature before 50-100 m from the fire [56]. These calculations were performed with no longitudinal airflow. The smoke flow rate was calculated as the volume flow of gases which moved away from the fire in the upper part of two cross-sections located at the given distance on both sides of the fire. Also according to the CFD calculations the smoke flow rate varies nearly linearly with the heat release rate from approx. 50 m³/s at approx. 10 MW to approx. 250 m³/s at approx. 150 MW (Figure 3.9 [56]).

Design Fires for Metro Tunnels
Technical report Part 1 ‘Design Fire Scenarios’ 79/161
0
50
100
150
200
250
300
0 20 40 60 80 100 120 140Distance to fire [m]
Smok
e flo
w ra
te [m
³/s]
150 MW-fire
100 MW-fire
60 MW-fire
30 MW-fire
7 MW-fire
Figure 3.8: Variation of smoke volume flow with (plume flow) distance to fire [56]
0
50
100
150
200
250
300
0 20 40 60 80 100 120 140 160Heat release rate [MW]
Smok
e Fl
ow R
ate
[m³/s
]
CFD calculations
PIARC
Figure 3.9: Smoke flow rate versus fire heat release rate [56]

Design Fires for Metro Tunnels
Thematic Network Fire in Tunnels
80/161
Smoke flow rates1) [m³/s] Recommendations by institutions Fire tests Vehicle category PIARC RABT2)
(D) CETU3) (F)
NFPA 502 (USA)
EUREKA
1987 19947) (proposals 1998 1996/1997) passenger car 20 20 - 404) 20 20 --- passenger van (plastic) --- --- 30 --- 30 2 – 3 passenger cars --- --- 30 --- --- 1 van --- --- 50 --- --- bus/lorry without dangerous goods
60 60 - 90 80 60 50 – 60
1 lorry --- --- 50 - 80 --- --- heavy goods vehicle --- --- 50 - 80 --- ---5) mixed load (see table 3.1/7)
--- --- --- --- 50
petrol tanker 100 – 200 150 - 300 3006) 100 - 200 --- 1): in case of (semi-) transverse ventilation systems entrainment of air into the smoke plume on its way to the
extraction points enlarges the smoke flow rate [56, 58] 2): smoke temperature 300°C 3): proposals are related to special types of road tunnels (e. g. with height clearance for passenger cars only,
see Table 3.11) 4): 1 to 2 passenger cars 5): in [58] the analysis of a semitransverse ventilation system for a 100 MW fire using the experience gained
by the EUREKA fire test of a heavy goods vehicle led to a smoke flow rate of 240 m3/s (temperature 300 °C)
6): in France generally not used for (semi-)transverse ventilation systems, see also Table 3.11 7) New issue from 2003 [52] recommends smoke flow rates for lorries only, depending on traffic:
- 80 m3/s if (lorries x km) / (day x tube) ≤ 4000 - 120 m3/s if (lorries x km) / (day x tube) > 4000 - up to 200 m3/s if (lorries x km) / (day x tube) > 6000 depending on expert report
Table 3.12: Smoke flow rates: measured values and examples of recommendations [36, 37, 39-41, 43, 48-50, 52, 56-58, 73]
3.1.5Design Fires and Road Tunnel Equipment Equipment normally found in road tunnels must be able to function in the event of fire. According to German regulations (RABT) [52] ventilators have to fullfill the following specifications: (1) Jet Fans: Operation at 250 °C over a period of 90 minutes (including all installation
equipment) (2) Ventilators attached at the end of concrete exhaust ducts: Operation at 250 °C over a period
of 90 minutes (by assuming a strong cooling effect of the duct walls). (3) Ventilators mounted close to the tunnel driving space in exhaust ducts: Operation at 400 °C
over a period of 90 minutes (including the ventilator components like blades and motors and also the exhaust dampers within the airduct).
In situations where the separation between the fire and the ventilators is small fires with a heat release rate in excess of 30 MW can require ventilators to have a temperature resistance of 400 °C instead of 250 °C.
The necessary fire resistance of other components for road tunnel equipment is specified with respect to the ISO-temperature-curve (Table 3.13).
Component Requirements

Design Fires for Metro Tunnels
Technical report Part 1 ‘Design Fire Scenarios’ 81/161
electrical equipment and cables for ventilators E 90 actuators for smoke dampers E 90 night- and safety-lighting E 90 electrical equipment and cables for fire fighting installations E 90 Lighting E 30 barriers for tunnel closing E 60 fire barriers (e.g. along cable ducts) S 90 1)short distances between ventilators or fires with a heat release rate above 30 MW can make necessary a temperature resistance of 400º C
Table 3.13: German specifications of design fires for road tunnel equipment [33, 52, 91]
3.1.6 Design Fires referring to the Rescue of Road Tunnel Users 3.1.6.1 Generation of Toxic Gases The dangerous nature of smoke gases in tunnel facilities not only results from the visibility obscuring effect but also from the concentrations of carbon monoxide (CO) and carbon dioxide (CO2) in smoke gases. To address these concerns, during the EUREKA and Runehamar fire tests the CO and CO2 levels were monitored at several measuring points along the tunnel. In the Runehamar fire tests HCN measurements were included also [179]. An example for CO2 measurements with concentrations up to 10 vol-% during the HGV fire is given in Figure 3.10. The mass generation of CO2 can be estimated using a ratio of 0.1 kg/s per MW of heat release rate [56]. The following peak CO concentrations were measured between 20 m to 30 m downstream of the burning vehicles at head height [49]: (1) passenger van (plastic): 300 ppm (2) public bus: 2900 ppm (3) heavy goods vehicle: 6500 ppm CO concentrations of more than 500 ppm were measured over a period of approximately 2 hours during the bus fire (beginning approx. 10 to 15 minutes from the start of the fire) and approx. 15 minutes during the heavy goods vehicle fire (air velocities: see figure Figure 3.10 and figureFigure 3.11). During an experiment with a mixed fire load consisting of spruce wood, tyre rubber and plastic material, CO concentrations of 500 ppm and more occurred not before about 80 minutes after the start of the fire [49] and lasted for 90 minutes (air velocity approx. 0.7 m/s). When analysing the EUREKA tests data a reasonable linear correlation between the production rates of CO2 and CO was found [50]. The ratios of CO mass production to CO2 mass production cover a span from approx. 0.015 to 0.073 when restricting to vehicle and vehicle load fires [50]. These results suggest an average a ratio of 0.051 with a standard deviation of ±0.015. This average is used for the calculation of the CO production rates given in Table 3.14. As an order of magnitude, the volume concentration of CO is also approx. 5 % of the concentration of CO2. The HCN-measurements of the Runehamar tests were made 458 m downstream of the fire and 2.9 m above the road. The following peak concentrations were observed (load details: see table 3.1/1 [179]: (1) wood- and PE-plastic pallets
(9.9 tons (without target); 18 % plastic): 298 ppm (2) wood pallets and PUR-mattresses
(6.1 tons (wothout target); 18 % plastic): 218 ppm

Design Fires for Metro Tunnels
Thematic Network Fire in Tunnels
82/161
(3) furniture (7.7 tons (without target); 18 % plastic): 66 ppm
(4) plastic (PS) cups in cardboard cartons (2.6 tons (without target), 19 % plastic) 94 ppm
Vehicle category Gas production [kg/s] CO2 CO1) passenger van (plastic) 0.4 – 0.9 0.020 – 0.046 bus/lorry without dangerous goods 1.5 – 2.5 0.077 – 0.128 heavy goods vehicle 6.0 – 14.0 0.306 – 0.714 mixed load 1.5 ---
1) CO production rate estimated by correlation with the CO2 production rate [50]
Table 3.14: Generation of toxic gases during the EUREKA experiments [36, 37, 39-41, 43, 48-50, 52, 56, 57, 73]
3.1.6.2 Visibility in a Smoke Environment On the assumption that a luminant light signal should be perceived over a distance of approx. 10 m the optical density (OD) is limited to approx. 0.1 m-1 to 0.3 m-1 depending on the optical behaviour of the smoke produced in the specific fire. During the EUREKA tests the observed optical densities were considerably higher (Figure 3.11) indicating very poor visibility conditions downstream of the vehicle fires. The correlation of the smoke-dependent visibility measured by the OD and the concentration of CO2 indicates a linear relation when a correction for the smoke gas temperature is made [40, 41, 48, 50, 73]. The following formula can be used to estimate the optical density OD from the CO2 volume concentration [56]: OD = α • ( T0 / T ) • [CO2] (6) where T is the local temperature in Kelvin, T0 = 273 K, [CO2] the concentration in percent of volume and α is a coefficient which was approx. 1.3 for the plastic passenger van fire, approx. 0.5 for the bus fire and approx. 0.8 for the HGV fire [56]. Another approach is based on the mass optical density [104]. The theoretical approach given here is based on the work presented in [127] and by [128]. The visibility in smoke can be related to the extinction coefficient, k, [128], with aid of the following equation:
10lnL
ODk = (7)
where OD is the optical density and L is the path length of light through smoke. The optical density per unit optical path length can also be expressed as [127]:
sCL
OD⋅= ξ (8)
where Cs is in kg/m3 and ξ is the specific extinction coefficient of smoke or particle optical density (m2/kg). For an open system, the smoke mass concentration takes the form
Tss VmYC f
••= / (9)
where Ys is the yield of smoke (g/g), fm•
denotes the mass flow of material vapours of the burning
material and TV•
is the total local volumetric flow rate of the mixture of fire products at the actual location (measuring point) and air (m3/s). Combining equations. (2) and (3) gives

Design Fires for Metro Tunnels
Technical report Part 1 ‘Design Fire Scenarios’ 83/161
Ts VmYL
ODf
••⋅⋅= /ξ (10)
The parameter ξ Ys is defined as mass optical density, Dmass (m2/g) and is compiled in [127] for a
number of different materials. The fm.
can also be written as c
A
HQ
m f =.
where QA is the heat
release rate in kW at the actual location and Hc is the effective heat of combustion (kJ/kg). Thus, at a distance where we can assume low stratifications of the smoke and a unified longitudinal ventilation velocity u (m/s) across the tunnel cross-section A (m2) we get:
c
Amass uAH
QD
LOD
= (11)
We know also from Jin [128] that for objects such as walls, floors and doors in an underground arcade or long corridor that the relation between visibility and the extinction coefficient is:
kV 2= (12)
Thus, by combining equation (1) and equations (5) and (6) we obtain a correlation between the visibility V and the heat release rate in a tunnel at an actual position downstream the fire with a ventilation rate of u:
massA
c
DQuAH
V 87.0= (13)
There is not much information available in the literature on mass optical density, Dmass, for real fire loads. Tewarsson [127] presents an extensive list for a variety of fuels. In Table 3.15 values of Dmass for different types of vehicles are given based on large scale tests [40]. These values may be used as an engineering tool for determining the visibility in fires depending on the fuel load with aid of equation (7) or within CFD calculations.
Type of vehicle Average mass optical density Dmass [m2/kg]
car (steel) 381 car (plastic) 330 bus 203 truck 76-102
Table 3.15: Average mass optical density, Dmass from burning vehicles in experiments given in [41]. The values given here are quoted in [104] and are therein recalculated from data presented by
Steinert [41].

Design Fires for Metro Tunnels
Thematic Network Fire in Tunnels
84/161
EUREKA HGV fire test: CO2-concentration 100 m downstream of the fire
0
2
4
6
8
10
0 10 20 30 40Time after ignition [min]
CO
2-co
ncen
trat
ion
[vol
-%]
Figure 3.10: Time history of CO2 concentrations (main features, [44]) during the HGV fire test (air speed in the obstacle-free tunnel upstream of the fire: 6-8 m/s till 12:30 minutes, then
changed to 3-4 m/s from 16:30 minutes onward)
EUREKA fire tests: Optical densities 2 m above the floor
0
1
2
3
4
5
6
0 10 20 30 40 50 60Time after ignition [min]
Opt
ical
den
sity
[1/m
] Passenger car(200 m / 0,3 m/s)Passenger van(300 m / 0,3 m/s)Public bus(100 m / 0,3 m/s)Heavy goods vehicle(300 m / 6,8 m/s / 3,4 m/s)
Figure 3.11: Time histories of optical densities (main features) during the EUREKA fire tests

Design Fires for Metro Tunnels
Technical report Part 1 ‘Design Fire Scenarios’ 85/161
(1) numbers in the key: - distance of the measuring point from the burning vehicle - airspeed in the obstaclefree tunnel (HGV: see Figure 3.11) (2) high airspeed and fierce burning during the HGV fire resulted in small optical densities compared to the other fire tests 3.1.6.3 Specifications on the Length of Emergency Exit Routes in Road Tunnels The requirements placed on emergency exit routes, their intervals and marking are formulated in the international lists of regulations and recommendations of PIARC [36] (Table 3.16). Emergency exit routes are usually provided in tunnels that have a length of between 300 to 600 metres. In the case of parallel tunnel tubes, the distance of the emergency exit routes from one another should be between approx. 100 to 400 meters, depending on the traffic situation in the various countries (Table 3.16). Lighting fixtures installed near to the road surface are partly used for marking (Table 3.16). The German regulations [59] also contain the following provisions, among others, pertaining to emergency exit routes and their marking:

Design Fires for Metro Tunnels
Thematic Network Fire in Tunnels
86/161
No Country or Institution
Emergency Escape Routes
required above a Tunnel Length of
[m]
Maximum Escape Route Interval [m] Escape Route Marking Source
1 Germany 400 300
a) Signs / Emergency fire lighting b) Individual connection to nearest electrical distributor, USV connection required c) Max. distance 25 m d) Height (lower edge of housing) 1 m above emergency footpath e) white flashlights switched on at the emergency exits in the case of fire
[52]
2 France Cross-country Tunnel: 500
a) Urban Tunnel:200 b) Cross-country Tunnel: 400
Lighting interval 10 m [63]
3 Great Britain 500 100 [65]
4 Japan 300 to 400 with heavy traffic Escape route direction board [64]
5 Netherlands
100 Eye-catching marking of the emergency exit doors which are at least 0.8 m wide and 2 m high
[62b]
6 Norway 250 Illuminated signs with exit information [60]
7 Switzerland 600
a) Parallel Tubes: 300 b) One tube with longitudinal ventilation without false ceiling: escape route in centre of tunnel, over 1,000 m also in third points c) One tube with false ceiling: - length up to 3,000: 1 escape route - 3,000 to 4,500: 2 escape routes - 4,500 to 6,000: 3 escape routes
[61a, 61c]
8 PIARC
100 to 200
a) Lights with USV supply b) Illuminated signs at a height of 1 m (or lower) above footpath c) Max. interval 25 m
[36]
Table 3.16: Requirements and Recommendations for Escape Routes and Tunnels
(1) Dimensions of rescue routes accessible on foot in emergency exits: at least 2.25 m x 2.25 m, door openings at least 2 m high and 1 m wide. (2) Dimensions of rescue routes accessible by road vehicles: > 2.80 m internal width, > 3.10 m internal height

Design Fires for Metro Tunnels
Technical report Part 1 ‘Design Fire Scenarios’ 87/161
(3) Doors The emergency corridors are to be sealed by doors of fire resistance category F 90 (crosscut on both sides). The doors should open in the direction of flight. In the case of double-tube tunnels the doors are to be marked with a suitable inscription showing the direction of opening.
3.2 Design Fires for Mainline Railway Tunnels 3.2.1 The Course of some actual Fires in Mainline Railway Tunnels As an introduction to the development of design fires the course of some exemplary real tunnel fires is described: (1) Channel Tunnel, France / Great Britain (1996) (2) Leinebusch Tunnel, Germany (1999) (3) Baltimore Howard Street Tunnel (2001) More fire incidents are included e.g. in the reports about the European UPTUN and NEDIES project as well as in [3, 74]. 3.2.1.1 Fire in the Channel Tunnel, France / Great Britain (1996) (1) Fire Event [20 to 23] A large fire involving ten HGVs occurred in the 50 km Channel tunnel between France and England on November 18th, 1996. A shuttle train travelling from France to the UK caught fire and stopped approximately 19 km from the French portal. The shuttle train on which the fire occurred had a length of approx. 800 meters and consisted of two groups of 14 railway wagons each for lorries, a passenger car and one locomotive at either end. The enclosed passenger car was located immediately behind the driving locomotive of the train, which was travelling in the direction of Great Britain. The lorry drivers and the train staff were in this passenger car. In contrast to the passenger car, the lorry wagons were open and had large-meshed grating at the sides. The burning lorry was located on a transport wagon more or less in the middle of the shuttle train. The southern tube of the tunnel was completely closed for three days. Until the middle of 1997 the tunnel was subjected to restricted operation. Not until June 15, 1997, was it possible to resume full service. (2) Course of the Fire [20 to 23, 104] Estimates in the inquiry report [124] say that the fire was detected at 21:53, and the train stopped at 21:58. At this stage, the ventilation direction was towards the UK. After the train stopped, and until the Supplementary Ventilation System (SVS) (100 m³/s) was activated at 22:22, the fire involved at least three HGVs. The load on two of them consisted of pineapples, and one was loaded with cornflakes. It is concluded in the inquiry report [124] that the pineapples did not contribute significantly to the fire, but the structures of the refrigerated trailers did. The fact that the fire load in these two HGVs consisted of pineapples contributed to the slow spread of fire towards the UK. Once the SVS was activated, the flow direction changed from the UK to France. The total volume flow was 100 m3/s, or an average of about 2.2 m/s over the cross-section. The fire became much larger and spread rapidly towards France, involving seven more HGVs. Although few of the loads were particularly combustible, the trailers themselves would have contributed to the fire.

Design Fires for Metro Tunnels
Thematic Network Fire in Tunnels
88/161
Only frozen fat (20 tonne) and clothing loads provided significant combustible materials, with the frozen fat becoming a major source of fuel. During the period of burning during this phase (over three hours), the fire did not spread substantially towards the UK. Towards France, the seven HGVs burned violently, creating a 370 MW fire at its peak according to the inquiry report [124]. This number is based on the assumption that all available oxygen (100 m3/s) was consumed in the fire. It is unlikely, however, that heat release was sustained at that level for very long. The average heat release rate over the three-hour time period was estimated to be 150 MW. Liew et al [125] presented a heat release rate curve of the entire fire development, which show that the peak heat release rate of 370 MW occurred 60 minutes into the fire and the main fire duration is about 2.5 hours. The Channel tunnel fire shows the importance of fire ventilation on the spread of flame and the fire size. If the ventilation system had not been activated, the fire would not have spread to the other HGVs as quickly. However, fire fighting and rescue of persons from the train would have been much more complicated. The real catastrophe would have occurred if the SVS (100 m3/s) had been directed from France towards the UK. This would have involved 18 HGVs instead of seven, and victims would have died in the passenger coach at the front of the train. This clearly shows the importance of correct ventilation management and the effect of it on fire development. (3) Extinguishing and Rescue Work [20 to 23] As the lorry transporter wagon is able to continue moving for at least 30 minutes in cases of fire, the driver of the drive locomotive was supposed to drive the entire train out of the tunnel, for which approx. 35 minutes would have been required. However, the locomotive driver was given a warning signal to the effect that some of the telescopic supports which are extended while the wagon is being loaded to relieve the suspension had not been fully retracted. He therefore stopped the train after it had been travelling for approx. 18 km in the tunnel. He wanted to avoid the train being derailed by the telescopic supports jutting into the rails. The emergency procedure in such cases was that the drive locomotive should be uncoupled together with the passenger car from the remainder of the train and should then drive out of the tunnel in order that at least the passengers could be brought to safety. The intensity of the fire, however, was now so great that the overhead contact line melted and the electricity supply was cut off. This meant that the shuttle train was stuck in the southern tunnel. Other trains travelling through the tunnel caused suction to be produced which forced the smoke from the seat of the fire to travel forwards to the passenger car and to the locomotive at the front of the train. As the doors had been temporarily opened, this smoke entered the interior of the locomotive and the passenger car. This resulted in the people who were here suffering from poisoning by smoke inhalation. The railway control centre in Folkestone ensured that a) no further trains were allowed to enter the southern tunnel, and b) the pressure-relief galleries between the two tubes of the tunnel were closed in order to prevent smoke entering the northern tube. The French and English fire brigade units approached the scene of the fire through the rescue tunnel: a) French fire brigade units: Departure 9.56 pm, arrival at the scene of the fire at 10.18 pm b) English fire brigade units: Departure 10.04 pm, arrival at the scene of the fire at 10.36 pm Initially the lorry drivers and the train staff were evacuated (altogether 34 people). It was advantageous that when the doors between the tunnel tube and the rescue tunnel were opened, air from the rescue tunnel, which was at a higher pressure, flowed into the rail tunnel and displaced the smoke to such an extent that visibility for the evacuation was sufficient.

Design Fires for Metro Tunnels
Technical report Part 1 ‘Design Fire Scenarios’ 89/161
Those people who suffered poisoning from smoke inhalation - some of them considerably - were taken to a car shuttle train waiting in the northern tunnel and then back to France. These people spent a total of 86 minutes in the tunnel. It was only possible for the English and French fire services to completely extinguish the fire after approx. 8 hours. During the fire the temperatures reached approx. 800 - 1,000°C. (4) Fire Damage [20 to 23] 15 lorries burnt out together with the shuttle train wagons on which they were located. Other lorries were damaged. The drive locomotive at the back of the train was also destroyed. The concrete spalled over a length of approx. 500 meters, with the spalling depth being up to approx. 30 cm. Permanent operational equipment had to be renewed over a length of approx. 3 km. Soiling from the smoke was found over a length of approx. 3-5 km. Furthermore, bent rails had to be replaced. Similarly, the water pipes in the tunnel had to be repaired. For the repair work two trains were used simultaneously. Depending on the degree of damage to the tunnel the following work was carried out from these trains: a) Re-anchoring in the surrounding chalk of the reinforced concrete segments which had become weakened by spalling b) Incorporation of tunnel and grid arches to support the tunnel lining c) Cleaning of the tunnel lining of fire residues d) Removal of the materials damaged by the fire e) Repair of the reinforcement to the reinforced concrete segments (depending on condition and extent of damage caused by the fire) f) Preparation of the concrete surfaces for an application of sprayed concrete g) Application of the sprayed concrete and, if necessary, installation of welded wire mesh The total cost of repairing the damage caused by the fire was approx. 59 million EUR, whereby the repair work to the tunnel tube was approx. 7.7 million EUR. The remaining costs were distributed over renewal of the tunnel infrastructure in the section which was burned. These included, for example, the superstructure, the overhead power lines and the signals. If one calculates the costs for the replacement of the rolling stock damaged by the fire, loss of income through the partial closure of the tunnel and claims for damages (lorries, freight), the total costs that arose from the fire were approx. 306 million EUR. (5) Summary a) The fire started on a lorry (short circuit or arson) b) There were no problems in rescuing the persons involved owing to the fact that the service t unnel was used, besides other reasons (appearance of the English and French fire brigades, additional ventilation during rescue of the passengers). c) There were no fire alarm systems installed which could have stopped the train upon its entry into the tunnel owing to the smoke which the lorry was producing. d) Parts of the rescue concept (continuation of the journey in spite of fire) could not be implemented as planned (alarm indicating danger of derailment prevented continuation of the journey). e) When the train stopped smoke entered the drive locomotive and the passenger car and caused smoke poisoning. f) There was considerable material damage to the tunnel and the technical equipment which cost approx. 59 million EUR to repair.

Design Fires for Metro Tunnels
Thematic Network Fire in Tunnels
90/161
3.2.1.2 Leinebusch Tunnel, Germany (1999) (1) Fire Event [24 to 26] On the ICE (InterCity Express) line between Hanover and Würzburg a wagon of an express freight train left the rails on March 1, 1999, at around 11.20 pm shortly before entering the Leinebusch tunnel near Göttingen [24 to 26]. The derailed wagon, which was travelling at 120 km per hour, was pulled into the tunnel by the train. The freight train then stopped inside the tunnel. At around 1.00 am the driver of the train noticed a smell of burning and found that the derailed wagon, which was more or less in the centre of the train and laden with paper and cellulose, had caught fire. He then uncoupled the first 13 wagons of the train (which had 24 freight wagons in all) and drove them out of the 1.7 km-long tunnel. 11 wagons, including the burning one, remained in the tunnel. (2) Course of the Fire and Extinguishing and Rescue Work [24 to 26] The fire brigade was alarmed with the message, "A freight train is burning at km 109.4." On the basis of this message the fire service head of operations in Göttingen assumed that the fire was on an open stretch of track and alarmed three local fire brigades and a support fire brigade. These fire brigades turned out at around 1.20 am. Only when they arrived on the scene and two groups of firemen wearing heavy respiratory protection went to investigate did it become clear that the burning freight wagon was approx. 650 meters deep inside the tunnel. Thereupon the fire brigade head of operations requested via two-way radio that the rescue train be sent from Kassel (1.51 am). This rescue train is specially equipped for use in train accidents inside tunnels. Among other things it includes fire extinguishing wagons and transport wagons for fire brigade equipment. The railway staff informed the fire brigade that the burning wagon was laden with cellulose and paper. The freight being transported on the remaining wagons located in the tunnel was not initially known. In order to prepare for the deployment of the rescue train as well as the other fire brigades the overhead power supply was earthed by the head of emergency operations of the German railways (DB AG) and officers of the Federal Border Guard. This work was completed at around 2.31 am. At 2.55 am the first documentation was received relating to the freight that was loaded on the wagons still in the tunnel. Among other things it consisted of pyrotechnic items (hazard class UN 0432), seat belts tensioners (hazard class UN 3268), car airbags and paper. At 3.05 am the rescue train reached the tunnel portal. At 3.39 am the rescue train entered the tunnel and began extinguishing the fire at about 3.51 am. At about 12.08 pm the fire was under control, and completely extinguished at around 2.20 pm. Approximately 230 firemen were involved in extinguishing the fire. It was only possible to fight the fire in the tunnel wearing heavy breathing apparatus. As paper and cellulose are very difficult to extinguish if they are stacked on top of one another, the entire wagon had to be emptied in order for it to be possible to extinguish the burning materials. The extinguishing work was mainly carried out outside the wagon. The water supply of the rescue train was sufficient for approx. 45 minutes of use. In order to supply further fire-fighting water it was necessary to lay a hose which was approx. 3.6 km long. Ventilation in the tunnel was very weak, and there was hardly any movement of the smoke. (3) Fire Damage [24 to 26] Damage was caused by the fire to the freight train wagons, the load, the tunnel structure and the tunnel equipment. In addition, hundreds of concrete sleepers were smashed as the derailed freight wagon was dragged over a long distance.

Design Fires for Metro Tunnels
Technical report Part 1 ‘Design Fire Scenarios’ 91/161
(4) Summary a) As a result of the derailment of the freight wagon laden with paper and cellulose the load caught fire. The initial smouldering fire was only discovered at a later time. b) After the fire brigade and tunnel rescue trains had been alarmed, delays occurred during the journey of the rescue trains to the tunnel and in informing the fire brigade of the load contained on the freight train. c) The authority to request the rescue trains was not clearly laid down. d) The fire-fighting water supply was not initially sufficient for extinguishing tightly packed smouldering materials. 3.2.1.3 Baltimore Howard Street Tunnel (2001) [167] At 3.07 p.m. on Wednesday, July 18, 2001, a CSX Transportation train derailed and got fire in the Howard Street Tunnel under the streets of Baltimore, Maryland. Fire officials believe that the derailment ruptured a tanker car carrying a flammable liquid chemical that fueled the fire. Complicating the scenario was the subsequent rupture in a 40-inch water main that ran directly above the tunnel. The flooding hampered extinguishing efforts, collapsed several city streets, knocked out electricity to about 1.200 Baltimore Gas and Electric customers, and flooded nearby buildings. The crash interrupted a major line associated with the Internet and an fiber optic telephone cable. The fire response quickly jumped to five alarms within the first two hours of the incident. Thick black smoke emanated from both ends of the tunnel and seeped through manhole covers along Howard Street and other nearby streets. Firefighters first attempted to fight the fire by entering the tunnel from either end, using vehicles with special rail wheels, but they were forced back by intense heat and a lack of visibility. They then lowered large diameter hoses from the street above into the tunnel where attack lines were set up for suppression operations. Firefighters were finally able to reach the burning cars at about 10:00 p.m. The initial attack significantly lowered the temperature of the burning cars within a few hours. At the height of the incident, 150 firefighters were on the scene working to extinguish the fire. For the first time since they were installed in 1952, civil defense sirens were activated at 5:45 p.m. to warn citizens of impending danger from the fire and hazardous materials. On the night of the derailment, city officials closed down entrances to the city from all major highways. Baseball games between the Baltimore Orioles and the Texas Rangers at nearby Camden Yards were postponed that night and the following night because of the hovering cloud of black smoke from the tunnel fire. 3.2.2 Evaluation of fire growth rate and peak HRR from experiments Ingason et. al.[114] presented a measured HRR of a German Intercity passenger railway car (IC) that was burnt in the EUREKA 499 test series. Steinert [41] has presented corresponding results for the same test. The railway car was 26.1 m long, 2.9 m wide and 2.4 m high, with interior materials of 'the older' type [40]. There were 80 seats, giving a total heat content of the seats of nearly 9 GJ. The total calorific value of the railway car was calculated to be 77 GJ [40]. The peak heat release rate was measured to be 12 MW. Steinert [41] presented a measured heat release rate of a German Intercity-Express railway car (ICE), burned in the EUREKA 499 test series. It was also 26.1 m long, 2.9 m wide and 2.4 m, with interior materials of the 'latest' type. The total calorific value of the railway car was calculated to be 63 GJ [41]. The peak heat release rate was measured to be 19 MW. The Joined Railway car was two half cars, one of aluminium and one of steel. The aluminium car was a 'latest' design, and the steel car was a 'former' design. The fire was ignited in the aluminium car.

Design Fires for Metro Tunnels
Thematic Network Fire in Tunnels
92/161
Due to the high quality of the glazed windows, the fire did not increase rapidly in size until the windows were broken, which occurred after about 40 minutes. After the fire spread to the steel car, a fully developed fire yielding a HRR of 43 MW developed. 3.2.3 Design Fires referring to the Structural Load of Mainline Railway Tunnels 3.2.3.1 Principal Engineering Aims on Fire Protection for Mainline Railway Tunnels Structural fire protection measures on a tunnel construction are intended to meet the following targets in cases of fire: limitation of damage to the tunnel structure and its equipment, facilitation of rescue and extinguishing measures and minimisation of tunnel closure times for repair work [33, 38, 46, 52, 66-68]. In the German ZTV-ING regulations which apply to road tunnels these requirements are summarised in the following protection targets [33 (part 1, section 10.1; part 2, section 9.1)]: In order to achieve sufficient structural fire protection the internal shell of the tunnel is to be designed in such a way that - no damage occurs from the effects of fire which jeopardises the structural stability of the tunnel - no permanent deformation of the structure occurs which limits the usability of the tunnel - the impermeability of the tunnel is largely guaranteed. These requirements can also be directly used as a basis for railway tunnels. In conjunction with the material properties of concrete and steel as well as a special temperature-time curve for fire loads, structural requirements are derived from these protection targets with respect to fire protection (e.g. maximum temperature of 300° C at the reinforcement, nominal size of the concrete cover 6 cm). Also in the German EBA guideline protection targets are mentioned in various places [66]: - The measures described mainly serve the purpose of protecting and rescuing individuals [66, section 1.1]. - The safety measures must ensure adequate protection of the passengers, the railway personnel and the rescue services [66, section 1.3]. - In cases of fire, individuals must not be placed in danger by local damage to the tunnel lining [66, section 2.1]. - Emergency lighting, means of communication .... must remain fully functioning as a system during a fire for a minimum period of 90 minutes [66, section 2.1]. 3.2.3.2 Objectives in various Countries / Institutions Besides national institutions also international organisations are dealing with the safety in mainline railway tunnels [161, 162]. In the following the objectives of regulations, standards and codes covering the rolling stock in the UK are summarised according to [136]. Many of the standards and codes that guide the railway industry have evolved on the back of the aftermath of major incidents and fire disasters. In the UK, some major incidents include Summit Railway Tunnel fire (December, 1984; no fatalities) [139], King’s Cross fire [140] in the London Underground sub-way system (1987; 31 fatalities), Channel Tunnel fire [141] (November 1996; no fatalities), Ladbroke Grove rail crash fire (October 1999, 31 fatalities) [142]. The Summit Tunnel fire (brick-lined single bore rail tunnel, 2.6km long) [139] involved a train carrying petrol and demonstrates how the ventilation of a tunnel can assist in the development of a fire. The flow of air through the tunnel and out of the ventilation shafts led to furnace-like conditions within the tunnel and temperatures in excess of 1530oC, sufficient to soften brick and to melt or oxidise away steel. The King’s Cross Fire Enquiry [140] represented a landmark in the use of Computational Fluid Dynamics (CFD) modelling [143, 144] that explained how the rapid spread of fire up the trench of the Escalator led to 31 fatalities and many serious injuries to passengers. The Channel Tunnel fire [141] occurred on Heavy Goods Vehicle Shuttle on the French side of the Channel Tunnel. There were no fatalities but passengers were treated for smoke inhalation. One

Design Fires for Metro Tunnels
Technical report Part 1 ‘Design Fire Scenarios’ 93/161
half of the Tunnel was out of service for about six months, which resulted in considerable financial losses of about 240 million Euro. In the Ladbroke Grove rail crash fire [142], the crash between a high speed train travelling towards the London terminus and a three-car commuter shuttle turbo class diesel unit, travelling in opposite directions, led to multiple fires, one of which was comparatively caused by rupture of the fuel tank major fire causing multiple fatalities and injuries to passengers. The British Standard Code of practice for fire precautions in the design and construction of railway passenger carrying trains, BS 6853 [145] covers "railway vehicles comprising or forming part of passenger carrying trains", and applies to new vehicles and to substantial changes to existing vehicles. The Code is essentially an "engineering" guide and it allows for other means to demonstrate that the key objectives; reducing the risk of fire, controlling the fire performance of materials and providing protection from the spread of fire, have been achieved. A similar standard has been issued by for the protection of the infrastructure, and people using the infrastructure, from a train fire [146, 147]. The main objective is to be to avoid a train fire reaching flashover, i.e. becoming fully developed. The HSE HM Railway Inspectorate's "Blue Book" [148], is primarily a functional code, without explicit requirements. The Association of Train Operating Companies (ATOC) has published in May 2002 a vehicle standard on vehicle interiors design for evacuation and fire safety [150]. Purpose of the standard is to ensure that the interior design of rail vehicles provides passengers and crew with adequate opportunity to evacuate and escape from a vehicle in the event of an emergency. It prescribes the vehicle design and performance requirements, which control the risks to passengers and crew by a fire in a vehicle. The important fire issues and the current approach adopted by the UK rail industry are discussed in more detail below within the framework of the British Standard Code of practice for fire precautions in the design and construction of railway passenger carrying trains, BS 6853 [145]. The standards deal with issues in relation to fire safety under conventional topic headings, namely • Ignition scenarios • Fire growth, fire development and reaction to fire • Fire resistance and compartmentation • Detection • Alarm and warning systems • Smoke control systems • Occupancy, response times, pre-movement times, travel times and travel distances • Means of escape, egress provisions, refuse areas, • Fire suppression, fire fighting and fire service response • Management/staff relationship with occupants, fire safety management and general
management issues Ignition scenarios The ignition sources relevant to the railway industry include: • old or faulty appliances; not disconnecting electrical appliances, not designed for continuous
operation, at night or when unattended; • "hot work", such as welding; • faulty mechanical equipment (such as brakes, axle boxes); mechanical sparks; • faulty electrical equipment (such as motors); electrical sparks; • deliberate fires (arson). • The types of ignition may be categorised as: • Accidental • Deliberate • Consequential

Design Fires for Metro Tunnels
Thematic Network Fire in Tunnels
94/161
Deliberate fires include, amongst others, vandalism, arson for revenge, arson for gain, military action and terrorist action. Consequential fires follow events such as crash, collision, explosion, earthquake, structural collapse, flood, tidal wave, meteorite impact, etc. In these latter fires it is assumed that some or all of the fire safety systems, active, passive or procedural, are damaged or otherwise inoperable. BS 6853 [145] provides a number of design recommendations to reduce the likelihood of a fire starting. These include avoidance of hiding places for fire sources, minimising combustible material, provision for cleaning, fire-resistant litter bins, provision for smoking, the protection of combustible materials from heaters, designated luggage areas and features relating to catering and cooking areas. Other recommendations relate specifically to electrical fires and include electrical protection, protection against power arcs, protection against high current, circuit breaker output, protection against sparks from current collectors and requirements for cables and wiring. A major risk for railway vehicles is a fire involving fuel; primarily diesel. There are clearly a very limited range of options to deal with this; the transport system is dependent on this energy source. Electrification of the railway network will reduce the need for trains to carry liquid hydrocarbons, but these risks are replaced by different risks from arcing. The railway industry assumes that deliberate fires are the most likely. Although, most deliberate fires in trains are acts of vandalism and are normally of limited severity, this would need to reviewed following the fire on 18 February 2003 from two crowded sub-way trains in Daegu, South Korea, which was reported to be an arson attack that resulted in 196 killed people (including 142 fatalities in the second train, found later) and 147 injured (including 10 firefighters). Following the Ladbrook Grove rail crash fire, the investigation undertaken by the Railtrack have reviewed the implications of the fires following crashes or collisions. Fire growth, fire development and reaction to fire BS 6853 [145] provides a number of tabulated recommendations to control the reaction-to-fire performance of all the materials that comprise a passenger railway vehicle. Materials are categorised according to type or application, with seats, textiles, mattresses and cables being explicitly identified. Criteria relate to spread-of-flame, fire propagation, smoke production and production of toxic fumes, amongst others. Some materials, in particular those that form long strips, such as door seals and pipes, do not comfortably fall into any specified category. But no other industry (including the aircraft industry) applies such a range of standards. It may be noted that on trains, seating is a "fixture", and is considered part of the construction, whereas in buildings seating is a "brought in" item. Different industries apply different standards, dependent upon the risk and ignition scenario. On trains, the seat fire scenario is based on a burning newspaper. The UK regulations for furniture (in buildings) [19] presume a number of ignition scenarios, the simplest being a single burning match. Such a mild test does not necessarily provide any protection against a bigger fire. Most networks, especially for inter-city travel, consider soft seating essential, but some railway networks (notably MTRC in Hong Kong) reduce the risks from seating by use of incombustible materials (such as stainless steel). Few networks control "brought on" items but some try to limit the risks by not having special luggage areas so as to avoid a large accumulation of "fuel". In the UK there are requirements in BS 6853 to limit the toxicity and quantity of smoke produced by any of the materials built into the vehicle and similar requirements will probably be introduced across Europe [151]. No such criteria are currently applied to building construction products [152]. However, the increasing use of polymeric materials for energy saving in all areas, will increase the importance of toxicity and smoke criteria.
Design Fires for Metro Tunnels
Technical report Part 1 ‘Design Fire Scenarios’ 95/161
There are addition hazards if the train stops in a tunnel since passengers must escape into the tunnel that might be filling with smoke. A fire in a tunnel is usually presumed to be fairly well developed before any tunnel safety systems come into action. The fire development is subject to the transport system itself so post-crash or post-derailment fires in tunnels are of particular concern. It is usually assumed that the contents of the tunnel itself make only a minor contribution to the fire. There is a substantial body of research into developing plausible design scenarios for tunnels [153]. Fire resistance and compartmentation The role of fire resistance is usually to provide one or more of three functions, firstly; to contain the fire and restrict its air supply to reduce the production of fire, heat and smoke, secondly; to prevent local structural damage to protected escape routes which would allow the spread of fire, heat and smoke, and thirdly; to prevent collapse or the overall structure, which could injure occupants or fire fighters. In the UK rail vehicles, fire resistance is provided to protect floors, end walls and cab walls, assessed against the "standard curve" [154]. The floor protection appears to be required to protect passengers against an under-body fire whilst the end-wall protection should prevent a fire in one carriage spreading to the next. However, neither the roof, nor, more importantly, the walls of the vehicle are protected. It is therefore not clear how this protection might perform given a reasonably severe fire, especially from an exterior spill fire. It has been suggested, however, that the fire resistance of the vehicle floor is to protect the brakes from a fire within the vehicle; thus is the rationale for a safety measure lost in history. There are similar debates regarding end walls; is the barrier to stop a fire in a saloon breaking out, or a fire outside (say, on the track) breaking in? In the UK we tend to the former since BS 6853 specifies the fire resistance of a pair of end wall. Many, but not all, constructions are symmetrical. Other recommendations in BS 6853 relate to preventing or limiting the spread of fire or smoke in hidden spaces. This can be difficult to achieve since many such spaces form equipment cupboards, which require a flow of air for cooling and cannot therefore be sealed against the passage of smoke or fire. Various requirements between different parts of a train are likely to be specified in the proposed European code [151]. This will include protection of corridors on compartment trains and protection of floors on double-deck trains. Double deck trains are not mentioned in BS 6853 and it will be an interesting challenge if they are introduced (again) in the UK. Detection systems The fire and smoke detection systems that might be used in rail vehicles include detectors for: • flame (infrared or ultraviolet); • heat (of various sorts); • smoke (ionisation or particulate); • carbon dioxide; • carbon monoxide; and • hydrocarbons. The optimum detector depends both on the fire scenarios and the geometry of the vehicle. However, the need for smoke detection in trains appears to be variable. In BS 6853 they are specified for "…area or vehicle which has the potential to present an increased risk…". These include sleeping cars and locomotives. The type of detector is not mentioned. Most serious fires grow exponentially so they need to be detected as rapidly as possible; every second saved in the early stages of the fire is worth far more than a second later on. It follows that early detection is essential, followed by an alarm.

Design Fires for Metro Tunnels
Thematic Network Fire in Tunnels
96/161
Alarm and warning systems Once the fire is detected then it is essential to warn those in the tunnel. Methods include: • Bells, sirens and hooters (often ignored); • Voice alarms (must be heard over the background noise in the vehicle, or the radio or CD
player); • Warning lights; • Visual display information; • Complex instructional messages; • Complex instructional visual displays. In general, there are no “alarms” since direct messages from the driver or steward are now commonplace. The driver should receive am alarm if any detection or suppression system operates, but BS 6853 depends upon passenger communication devices to staff. Smoke control systems Smoke from a fire is recognised as being as great a threat to life as flames and heat. In multiple-fatality fires it is often the smoke which is the killer, and even in small fires the fumes may do the injury long before the fire has grown. Smoke can be toxic, but also can be irritant, which can affect occupants and inhibit escape. In addition the smoke can limit visibility and at high densities can make escape impossible. Methods to limit the spread of smoke from a fire must increase the chances for escape. Only the most simple smoke control is provided on normal trains: the end fire doors limit the spread of smoke from one wagon to the next and voids should be sealed. The more fundamental strategy is adopted of seeking to limit the amount of smoke that is produced when materials burn. Of increasing interest, especially for metros, are fully open vehicles which give no opportunity to protect passengers from smoke from a fire anywhere on the train. Occupancy, response times, pre-movement times and travel times, and travel distances The occupancy of any construction will be determined by its function, practicality and historical expectations. Estimating the occupancy, in particular for the purposes of providing adequate escape provisions, can be a mixture of guesswork, past experience, simple space considerations, balanced against the design needs, which often may tend towards the optimistic. Historically, travel distances have been determined by simplistic assumptions regarding the movement of people in corridors and passageways, often based on "ball-bearing" type flow models. More realistically, it is now realised that the time to escape is largely controlled by the pre-movement time, while people decide if there is an emergency, meet and discuss with family, friends or colleagues and then choose to leave. The actual time "travelling" can be quite a small proportion of this time. The staffing, and the relationship between staff and public, can be a major influence. There have been a number of experiments and tests on the evacuation of passenger rolling stock recently which are reported elsewhere. There appear to be no limits set on the occupancy of trains; “crush loaded” conditions, especially in rush-hour periods, are accepted as normal. Pre-movement time in particular becomes largely irrelevant in conditions in which it can take hours to evacuate a metro train in a tunnel – even without the impetus of a fire. No other industry would accept occupancy densities like this [152]. Travel distances are quite short – once the train has stopped – being around 20 m maximum for a carriage. In the UK, requirements specify that no passenger should be more than 12 m from a body-side exit [145, 147]. There is (or has been) a requirement to demonstrate that (in tests) all passengers can evacuate via side doors onto a platform within 90 seconds, and an evacuation rate of 30 passengers per minute using the end door to track level [147].

Design Fires for Metro Tunnels
Technical report Part 1 ‘Design Fire Scenarios’ 97/161
Means of escape, egress provisions (doors, windows or hatches), places of relative safety and places of safety. The means by which occupants of a vehicle can make their way to a place of safety or of relative safety is fundamental to almost every fire safety system. These provisions must be clearly indicated and protected, and must be trust-worthy. The means of escape on trains is through the train doors into the adjoining carriage, out onto a station, or, more likely, out onto the track. The latter requires a drop to track level, and essentially presumes that the train has stopped. Once on the track there are dangers from other trains, as occurred in the UK Maidenhead train fire in 1996 (causing 1 fatality), or dangers from an arcing catenery. The UK Health and Safety Report suggested that access to the train was hindered by the glass covering the door lock on the exterior of the train. The windows might form a means of escape but different countries have different approaches to this. Breakable windows, using special hammers, are an accepted option in the UK [147]. The use of breakable windows and hammers was an issue that raised concern in the Ladbroke rail crash [142, 187] as this means of egress can prove extremely difficult as passengers must be able to a) Understand that an implement (hammer) is required to open the window b) Locate and retrieve the implement c) Understand the correct operation of the implement d) Possess sufficient strength to wield the implement In addition, these actions are usually undertaken under extremely stressful situations, possibly in reduced visibility and possibly in an overturned carriage [187]. Portable ladders are provided to assist escape down to track level. Unfortunately, any form of escape provision is accessible to vandalism. The use of the exit doors must be controlled since the exterior doors should not be openable while the train is moving. BS 6853 [145] gives recommendations for all types of emergency exit, and the need for unobstructed escape routes. Emergency lighting is also specified. Once out of the train, the passengers may not be safe from the fire. Means of escape from tunnels may be very good or very poor. In parallel tunnels or tunnels with special service tunnels or escape tunnels, escape may be effective subject only to the number of escape doors provided. But this presumes that passengers know of them. There is no question that the pressurised cross-passages in the Channel Tunnel saved the lives of those trapped in the fire of November 1996 [141]. These offer places of relative safety, although if the protection is powerful enough they may be effectively treated as final safety. It is only on transportation systems that there is a need to be able to escape while the vehicle is on its side or upside-down and where special escape equipment (such as portable ladders) may be needed. Following the Ladbroke Grove train crash an experiment was conducted to measure the ability of people to escape from overturned rail carriages (see figure Figure 3.12), both in conditions of smoke and non-smoke [186-189]. These experiments provided some of the only data available that quantifies exit flow rates from carriage end doors in overturned conditions. The average flow rate capacity of the exit without smoke was found to be approximately 9.2 persons/minute while in the presence of theatrical smoke, the average flow rate was reduced to 5.0 persons/minute [186-189].

Design Fires for Metro Tunnels
Thematic Network Fire in Tunnels
98/161
Figure 3.12: Passenger attempting to escape from an overturned rail carriage from carriage end door [186,187].
Similarly, there is a risk with transport fires (far less likely with building fires) of a major fire engulfing all of the exits. A place of final safety is not immediately available on a train, which must first slow down and come to a halt. In such circumstances, the use of smoke-hoods becomes an option, and as the technology improves so the availability of smoke hoods may become routinely acceptable. Fire suppression and availability of fire fighting media, fire fighting and fire service response As mentioned above with regards to detection and alarm, the often exponential growth of a fire means that any method that rapidly prevents the fire from growing has significant benefits. Rapid suppression requires the speedy use of a portable extinguisher or a fixed system, since many fires will be well developed by the time the fire service are in attendance. BS 6853 gives recommendations on the provision of portable extinguishers. The best extinguisher to use on a particular fire is not always immediately apparent and first-aid fire fighting can be dangerous; few members of the public know, for example, how to tackle a medium sized fire successfully and safely. Suppression systems, typically AFFF, are provided on UK trains to control engine fires (locomotives and DMUs) and in other specific applications. No suppression is put in the passenger areas, although, as mentioned above, fire extinguishers may be provided. In practice few are used on fires. London Underground have experience so much vandalism, and risks to passengers from inappropriate use, that they have successfully argued with the regulatory authorities for the removal of extinguishers in the passenger areas of some trains.
Fire service response is likely to be limited by the location of the train when it stops, due to communications, distance and geography, including access to the site of the incident, and the availability of water supplies. Interaction with the infrastructure As mentioned earlier, the risks to passengers on trains need not be over once they have left the vehicle. There are evident dangers from any rail system (live rails, moving trains) but if the train of fire is in a tunnel, then the smoke will continue to be a danger. BS 6853 recognises this, through

Design Fires for Metro Tunnels
Technical report Part 1 ‘Design Fire Scenarios’ 99/161
the category of vehicle, and trains that spend substantial time in tunnels need a better fire performance than those that are in the open. The European standard takes a similar position. There is, however, no other direct interaction in the design of either the train or the tunnel. For stations, the risks can go either way; while a fire on a train is a risk to those in the station, a fire in a station is a risk to those on a train. Little consideration is given to this. As mentioned above, the special need to avoid having a rail vehicle go to flash-over in a station is an objective of Railtrack requirements [147]. Management/staff relationship with occupants, fire safety management and general management issues Management, both generally and in specific the management of fire safety, is now seen as fundamental to fire safety. The fire safety provisions in any construction should be such that a fire is very unlikely to occur and/or that the occupants of the construction will, in the event of fire, be able to reach a place of safety beyond the threat of the fire. However, given even the most comprehensive fire safety provisions that modern technology can provide, the one key factor that needs to be present if disaster is to be averted is adequate management of fire safety. One of the common elements in multi-fatality fires is that, when fire is discovered or when the alarm is raised, the occupants, be they staff or members of the public, react and respond in ways which are different from those assumed or expected by the designer. Only effective management, combined with adequate and appropriate training, is likely to ensure that the necessary and speedy actions are taken and that the occupants will be able to escape safely. Trains are reasonably well maintained and safety systems mostly kept in good order. They have a trained staff who are visible to passengers but there is not necessarily a clear management hierarchy since the driver does not work with the crew and lines of command are not evident. The number of staff per passenger may be fairly low. However, the ability of the crew to assist passengers can be very limited if the vehicle has been involved in a crash, or is derailed. Safety management should be a fundamental part of the normal operation of the infrastructure and issues such as "house-keeping" and equipment maintenance should be routine. As is all environments, some items can be neglected due to familiarity. Infrastructure staff will primarily manage an incident from a control room, where it would be hoped that they have adequate and accurate information, and they may not be seen by passengers during an incident. They should be well trained. BS 6853, in common with most "design guides" has little to say about management. But much of the fire safety system entails long term issues, such as routine maintenance, testing and repair, ageing, weathering, wear and tear, vandalism and the effects of cleaning. European and International Standards The European standard which will impact on UK railways over the next few years is the European Standard Draft prEN 45545 Railway applications – Fire protection on railway vehicles [151]. Representatives of the UK British Standards Sub-committee, BS FSH/19, Fire precautions in railway rolling stock, are contributing to the European standard. The European draft prEN 45545-1 covers locomotives and dedicated power cars, multiple units, coaches, light rail vehicles, underground vehicles, trams, baggage- and post vans running as part of a passenger train, passenger occupied motor vehicle transporters, track-guided buses, trolley buses, and magnetic levitation vehicles. It does not include freight wagons. The International Organisation for Standardisation (ISO) established a subcommittee (ISO/TC92/SC4) that is publishing technical Reports to consider guidance on fire safety engineering [153, 166].

Design Fires for Metro Tunnels
Thematic Network Fire in Tunnels
100/161
3.2.3.3 Specifications on the Course of the Fire Research on fires in mainline railway tunnels has concentrated mainly on passenger trains. In contrast to freight trains, such fires may affect many individuals. In the case of freight trains only the train driver and, as in the case of "piggyback traffic", i.e. motorail transport such as in the Channel Tunnel, some lorry drivers are placed in danger by the fire. Furthermore, owing to the great variety of loads carried, it is scarcely possible to predict fire loads. The German long-distance passenger carriages used in the EUREKA fire trials only put the tunnel structure under considerable stress after the fire had been burning between approx. 50 minutes and approx. 100 minutes (Figure 3.13). In each case only one individual wagon was burned. The German Federal Railway Office in Bonn then laid down a temperature-time curve which is to be taken into account in the dimensioning of the permanent lining of the tunnel as well as in the case of rescue measures carried out by themselves or third parties. This EBA curve (Figure 3.13) which was also adapted by RENFE (Spain) [165] includes the fire curves observed in the EUREKA trials on a single long-distance passenger carriage.
0
200
400
600
800
1000
1200
0 20 40 60 80 100 120 140 160 180 200 fire duration in minutes
tem
pera
ture
[°C
] EBA
1/2 ICE (Alu) 1/2 D-Zug
ICE Stahl
IC Stahl
Figure 3.13: EUREKA fire curves for single long-distance passenger carriages (schematised) in comparison to the fire curve assumed in the EBA guideline [76]
The EBA curve therefore also takes into account the courses taken by fires on steel long-distance passenger carriages where the tunnel structure is only subjected to major stress after a fire has been burning for approx. 80 to 100 minutes as before this time the steel roof and steel walls of the carriage held the major part of the fire inside the carriage. Furthermore, the EBA curve also includes carriages built of aluminium in which the tunnel structure is subjected to a high degree of stress from the fire after approx. 50 minutes owing to the melting roof (Figure 3.13). In practice, however, it cannot be excluded that in the case of a full fire in the tunnel the fire will not flash over from the passenger carriage that is initially affected to other carriages. This flashover from one vehicle to the neighbouring vehicle has been observed, for example, in large fires in traffic tunnels, where it resulted in catastrophic effects. In the Eurotunnel, Mont Blanc tunnel and Tauern tunnel several vehicles were completely burned out in each case (section 3.1.1).

Design Fires for Metro Tunnels
Technical report Part 1 ‘Design Fire Scenarios’ 101/161
The results of these fires where the fire flashed over show that when a fire is burning with full intensity the fire brigades are not always able to fight the fire effectively with sufficient speed or get close enough to the seat of the fire. The reasons for this, among others, are the enormous amount of heat produced, explosive concrete spalling, the large quantities of smoke produced, unfavourable ventilation during the fire in some cases, and sometimes inadequate equipment supplied to the fire brigades for this type of conflagration. The flashover of the fire must therefore be accounted for in the temperature-time curve in order that the stress to which a tunnel structure is subjected by a fire event can be correctly assessed. In such a scenario it can be assumed that the tunnel cross-section affected by the first vehicle to catch fire will be subjected to further temperature stress and a further influx of heat when the second and third vehicles are burning. For the mathematical calculation of the above, the energy release rate for the long-distance passenger carriage concerned was assumed to be 20 MW. Furthermore, a tunnel without a gradient was assumed for the calculations that also did not have any mechanical or natural ventilation. In the case of a fire flashover this ensures that the new fires which occur have the maximum possible effect on the location where the initial fire broke out. If a tunnel with a gradient is assumed, the chimney effect causes an air current in the tunnel from the lowest to the highest point which results in the heat being carried away more quickly. A similar effect occurs if there is a current of air in the tunnel caused, for example, by previous vehicles that have passed through the tunnel or by meteorological effects. Spreading of the fire by hot-gas currents over large distances from the original scene of the fire (for example the fire in the Mont Blanc road tunnel with the fire spreading over a 250 meter section of the tunnel where there were no vehicles) was not investigated separately. Although such a carry-over of the fire results in a further fire being created in the tunnel, the static load on the tunnel structure at this new location develops largely independently of the initial fire owing to the large distance between them. The analysis of a single fire with progressive flashovers to neighbouring passenger carriages was therefore sufficient for determining the greatest fire load in a certain tunnel cross-section. The fire flashover between neighbouring passenger carriages should occur after 15 minutes in each case. This corresponds somewhat to the experience gained from the EUREKA trials. Figure 3.14 shows the calculated hot gas temperatures in the tunnel. The influence of the passenger carriages subsequently affected by the fire on the development of the hot gas temperatures can be clearly seen from the points of discontinuity in the temperature curve. Therefore the temperature development follows the energy release rate of the first burning carriage for 900 seconds, but after this time the temperatures increase markedly owing to the energy released by the second and third burning carriages. The influence of the following carriages (fourth and fifth, sixth and seventh, eighth and ninth) on the way the temperatures develop becomes smaller as the additional sources of fire become increasingly more distant - 26 meters in each case - from the first burning carriage. The maximum hot gas temperatures calculated for the tunnel are approximately 1,200°C after 4,200 seconds (70 minutes).

Design Fires for Metro Tunnels
Thematic Network Fire in Tunnels
102/161
0 600 1200 1800 2400 3000 3600 4200 4800 5400 6000 6600 7200 7800
time (s)
0
200
400
600
800
1000
1200
1400
tem
pera
ture
(°C
)
Figure 3.14: Temperature development in the tunnel [76]
0
200
400
600
800
1000
1200
1400
EBA-curve
temperatureversus time
0 6030 90 120
temperature [°C]
duration of fire [min]
Figure 3.15: Comparison of the temperature-time curve for the dimensioning of structural fire protection measures from the EBA guideline 07/97 and the calculated maximum hot gas
temperatures [76]

Design Fires for Metro Tunnels
Technical report Part 1 ‘Design Fire Scenarios’ 103/161
In Figure 3.15 the temperature-time curve for the dimensioning of structural fire protection measures from the German EBA guideline 07/97 [66] and the calculated maximum hot gas temperatures are compared. The dimensioning curve, hereafter designated the "EBA curve" for reasons of simplification, includes the calculated temperatures over almost the entire fire curve. The EBA curve takes into account in particular the rapid increase in temperature in the first minutes of a fire if, for example, when the windows suddenly fall out the tunnel structure is subjected to an almost shock-like temperature load. Although the EBA curve is exceeded between the 60th and 70th minute this is more than compensated for by the level to which it is not reached in the left-hand area of the curve. From this point of view, the EBA curve is a good representation of the derived fire scenario for German railway passenger carriages. 3.2.3.4 Specifications on Fire Loads In terms of the fire load of mainline railway rolling stock, the German railway authority (Deutsche Bahn AG) assumes for its own rolling stock the values listed in Table 3.17 [70].
Item of Rolling Stock Fire Load [GJ] Remarks
Diesel locomotive 61 Fuel as protected fire load
Electric locomotive 42 Transformer oil as protected fire load
Passenger carriage (aluminium and steel housing) 64
Carriages with compartments have a higher fire load than open carriages; however, the full fire occurs in open carriages at an earlier point in time.
Closed freight wagon - steel housing 141
Fire load depends on freight carried; fire begins to burn intensely only after sliding doors are opened; otherwise combustion occurs with a high degree of underventilation
Open freight wagon (flatbed truck) 85 For transporting lorries
Transporter for cars 24 Three cars burn simultaneously.
Table 3.17: Information provided by the Deutsche Bahn AG on the fire loads of their rolling stock [70]
Determination of the fire loads for these items of rolling stock is based on investigations performed with respect to fires in railway rolling stock, the EUREKA tunnel fire trials in Norway and details on the type and quantity of combustible materials for various items of rolling stock [70]. In the evaluation of the fire loads, 500 kg of mixed combustible materials per passenger carriage was assumed for the luggage. It was assumed that approx. 10% of the combustible materials would not burn in a fire involving rolling stock. 3.2.3.5 Specifications on Energy Release Rates In conjunction with the determination of fire loads for their current rolling stock, the German railway authorities (Deutsche Bahn AG) have also determined the change over time and the maximum value of the relevant energy release rates ([70], Table 3.18). This assumes unhindered fire development without any effective extinguishing measures. Development of the fire is controlled only by the apertures present on the item of rolling stock [70].

Design Fires for Metro Tunnels
Thematic Network Fire in Tunnels
104/161
Time in min
Electric locomotive
Diesel locomotive
Passenger carriages1)
Closed freight wagons
Open freight wagons with lorries
Car transporters2)
0 0 0 0 0 0 0 5 850 700 1,800 1,700 1,800 2,000 10 3,200 2,800 6,000 2,500 8,260 4,000 15 7,600 8,400 14,000 4,000 30,215 4,000 20 12,000 12,000 21,000 6,500 52,440 7,800 25 12,000 15,100 25,000 8,000 46,300 11,500 30 12,000 20,000 25,000 8,000 43,000 8,000 35 12,000 20,000 25,000 8,000 40,000 11,500 40 12,000 20,000 25,000 8,000 24,700 8,000 45 12,000 20,000 25,000 8,000 20,000 2,100 50 25,000 15,000 500 55 25,000 7,000 60 10,000 2,500
1) In passenger carriages with a superstructure made of aluminium brief peak values (max. 10 minutes) of approx. 30 MW may occur. 2) It is assumed that 3 cars with steel bodywork burn out one after the other.
Table 3.18: Energy release rates in kW of rolling stock of the Deutsche Bahn AG [70]
In the case of a fire in a tunnel the ventilation of the fire may be reduced (significant obstruction of the tunnel cross-section by the item of rolling stock), so that the rate of combustion may be lower [70]. If the fire brigade can take effective action after approx. 15 to 20 minutes, the energy release rates can be limited to 15 to 20 MW as a result of the extinguishing measures [70]. 3.2.4 Design Fires referring to the Ventilation of Mainline Railway Tunnels There is no experimentally confirmed data available relating to the smoke release rate in fires in railway rolling stock. The smoke gas currents determined in the EUREKA fire trials on road vehicles can only serve as an approximation (section 3.1.4). In CFD calculation models the smoke release rate is coupled to the energy release rate and the mixing of ambient air with the rising fire gases. Using this procedure, the smoke gas quantities listed in section 3.1.4 were determined by CETU (France), and can also be used as an initial guide. Additionally, there are estimates available from the Deutsche Bahn AG relating to the total primary smoke gas quantities for some rolling stock ([70], Table 3.19). However, in order to obtain smoke gas volume currents in m³/secs that are useful in terms of ventilation, other assumptions are required that are dependent on the relevant fire situation, such as the change over time of the release of smoke, the mixing with fresh air and the smoke gas temperature. Rolling Stock Item Total Primary Smoke Gas Volume1) approx. [N m³]
Passenger carriage 23,200 Diesel locomotive 39,700
Electric locomotive 11,000 Closed freight wagon 86,400
1) no fresh air mixing or volume expansion contained at the fire temperature
Table 3.19: Primary smoke gas volumes for some items of rolling stock of the Deutsche Bahn AG [70]

Design Fires for Metro Tunnels
Technical report Part 1 ‘Design Fire Scenarios’ 105/161
3.2.5 Design Fires referring to the Equipment of Mainline Railway Tunnels
At present detection and monitoring equipment is installed in German mainline railway tunnels only to a limited stage. The philosophy of e.g. Deutsche Bahn AG is not to stop within a tunnel. A train should go out of the tunnel in any possible case. Like in channel tunnel, it is recommended to equip trains with onboard extinguishing systems [91]. According to [66] systems like power supply, emergency lighting, communication, electrically acuated locks of emergency doors must remain functioning for at least 90 minutes with respect to a standard ISO-fire. 3.2.6Design Fires referring to the Rescue of Passengers in Mainline Railway Tunnels 3.2.6.1 Generation of Toxic Gases Within [164] the following clues for flue gas emissions are quoted for the fire of a passenger train on the new HSL in The Netherlands in relation to the HRR of the fire: (1) CO: 3330 mg / MW (2) HCl: 1950 mg / MW (3) HCN: 12.5 mg / MW (4) NOx: 122 mg / MW With regard to CFD-calculations yield numbers [g/g] are often more appropriate. The numbers depend very much on materials used for the construction of the train and therefore need to be evaluated again for each fire scenario [166, 207].
3.2.6.2 Visibility in a Smoke Environment Examples of the mass optical density for the calculation of the visibility according to chapter 3.1.6.2 or within CFD-programs are given in Table 3.20 [104].
Type of vehicle
Average mass optical density Dmass [m2/kg]
IC-type (steel) 153 ICE-type (steel) 127-229 2 joined ½ vehicles (steel) 127-178
Table 3.20: Average mass optical density, Dmass from burning railway vehicles in experiments given in [41]. The values given here are quoted in [104] and are therein recalculated from data
presented by Steinert [41].
3.2.6.3 Specifications on the Length of Escape Routes in Mainline Railway Tunnels The intention in Germany is only to equip new mainline railway tunnels with 1.20 meter-wide escape routes. From every point in such a tunnel there must be a safe area within 500 meters [66]. In the case of a fire in such tunnels, in Germany the fire services expect to find the following situation if there is a fire in a passenger train [71]: (1) A passenger train (length approx. 400 m) is located in the middle of a 1,000 m-long tunnel
section. It is possible for the fire brigade to approach from two tunnel portals/emergency exits facing one another.
(2) In the middle of the train a fire starts in one of the carriages (length approx. 26 meters). The attempts by the train staff to extinguish the fire have been unsuccessful. The fire brigade is expected to reach the tunnel portals/ emergency exits after approx. 15 minutes. It cannot be excluded that the fire will spread

Design Fires for Metro Tunnels
Thematic Network Fire in Tunnels
106/161
throughout the carriage within 7-10 minutes of the fire starting. It is assumed that when the fire brigade arrives, the fire in the carriage will be burning with maximum intensity. The tunnel is full of smoke.
(3) It is assumed that the average level of occupancy of the carriage is approx. 300 people (the maximum number of passengers is 670 when all seats are taken).
(4) 90 % of the passengers can save themselves, either alone or with the help of the train staff. (5) 10 % of the passengers, i.e. approx. 30 people, have to be saved by the fire brigade (15 for
each portal/emergency exit). For each direction 5 people are no longer able to walk. (6) All the people who are to be rescued have to be protected against breathing in toxic gases. The most important preconditions for the fire brigade successfully saving the passengers and extinguishing the fire are [71]: (1) The tunnel operator notifies and/or verifies the accident as quickly as possible to the control
centre responsible for the fire brigade and rescue service operations, stating the location of the accident.
(2) The tunnel operator must ensure that the overhead power lines are switched off and earthed at the tunnel portals/emergency exits.
(3) Unambiguous information must be given concerning the operational and equipment status (rail traffic; state of the electrical equipment). Changes may only be made to the situation relating to safety with the approval of the head of operations.
(4) The self-rescue concept of the railway company must be realistic. (5) The train staff must be informed of, and receive training at regular intervals in, fire-fighting,
first-aid measures and the correct behaviour in emergency situations. (6) The public fire services responsible for fighting the fire must be informed of the local
conditions. (7) It is advantageous if at least one suitable transportable heat imaging camera is available at
each portal for the use of the first rescue teams to reach the scene in order to accelerate their advance and locate any injured people lying in the smoke more quickly.
3.3 Design Fires for Metro Tunnels 3.3.1 The Course of some actual Fires in Metro Tunnels As an introduction to the development of design fires the course of some exemplary real tunnel fires is described: (1) King's Cross Underground Station, London, Great Britain (1987) (2) "Deutsche Oper” Underground Station, Berlin (2000) (3) Heinrich-Heine-Allee Underground Station, Düsseldorf (1991) (4) The Baku fire (1995) (5) The Kaprun fire [104, 126] (2000) (6) The Daegu Metro fire [194] (2003) 3.3.1.1 King's Cross Underground Station, London, Great Britain (1987) (1) Fire Event [27] On November 18, 1987, at around 7.25 pm, grease and dirt was ignited under escalator number 4 (Piccadilly line) at King's Cross London underground station, most probably by a burning match which was thrown onto the escalator (The escalator was mainly of wooden construction). The fire was discovered by a passer-by, who informed an underground railway employee in the ticket office (7.30 pm). At the same time another passer-by operated the emergency off switch of the escalator. By chance, two policemen passed who also noticed the fire. They tried to inform the fire brigade by two-way radio, but found that the radio contact did not reach up to street level. Therefore one of the policemen had to go up to the street level in order to inform the fire brigade (7.32 pm).

Design Fires for Metro Tunnels
Technical report Part 1 ‘Design Fire Scenarios’ 107/161
(2) Course of the Fire and Extinguishing and Rescue Work [27] The deputy stationmaster reached escalator number 4 at about 7.35 pm but could discover no signs of fire in the relevant upper machine room. One minute later underground railway employees saw smoke coming out of the escalator and switched off all escalators on the Piccadilly line section. Passengers were requested to leave the underground station from the Piccadilly line section via the Victoria line section. At 7.38 pm a fire was discovered by descending under the escalator from the upper machine room of escalator number 5. However, it was not possible to extinguish this with a handheld fire extinguisher because of the heat. The fire brigade reached the scene of the fire at 7.42 pm and attempted to begin extinguishing the fire. At the same time the staff were evacuated from the ticket office. The Victoria line and the Piccadilly line allowed passengers to enter the platforms and to get off at the King's Cross Underground Station until 7.44 pm. Only then did they receive instructions not to stop at King's Cross owing to the fire. The fire now spread extremely rapidly across the ceiling of the ticket office hall. At 7.45 pm it had developed into a full-blown fire. The fire brigade had to withdraw quickly owing to the extreme heat and smoke. Approximately 200 people were rescued between 7.46 pm and 7.55 pm from the platform by trains of the Victoria line which stopped at the station. At 8.03 pm the attempts to extinguish the fire were continued with renewed vigour and with additional firemen. Fifty minutes later the fire was under control, and at 1.46 am it had been extinguished. A total of 31 people were killed in this incident, primarily during the initial few seconds when fire from the escalator spread into the Booking Hall being used for evacuation, and approximately 100 injured. (3) Fire Damage [27] There was a large amount of material damage to the station building at King's Cross. No underground railway carriages were damaged. (4) Particular Aspects [27] On the London underground there were 9 fires in the period between 1976 and 1987. Most of the fires were caused by cigarette ends and matches that were carelessly thrown away. The incident accelerated an existing programme of replacement of the older, wooden escalators. (5) Summary a) An escalator caught fire due to carelessness (discarded match). b) The danger of the initial fire was underestimated (police, underground railway employees). Evacuation of the station was ordered after a delay. 31 people could not save themselves and died. c) The two-way radio equipment in the station area was inadequate. d) Smoke and heat hindered the extinguishing and rescue work.
3.3.1.2 "Deutsche Oper” Underground Station, Berlin (2000) (1) Fire Event [29] On July 8, 2000, at about 3.10 pm, in the last carriage of an eight-carriage underground train there was a flashover with arcing to the body of the train. Owing to the relatively weak current and the attenuated increase in the current, the short-circuit was not picked up by the transformer

Design Fires for Metro Tunnels
Thematic Network Fire in Tunnels
108/161
substation. The drive voltage therefore remained switched on so that the arcing remained in place before setting the superstructure of the carriage on fire. (2) Course of the Fire and Extinguishing and Rescue Work [28, 29] The carriage superstructure ignited immediately upon the train entering the Deutsche Oper Station. The train driver informed the control centre, which passed on the message to the fire service. The action of the train driver - which had become second nature to him owing to the repeated training sessions - to first activate the short-circuiting device in order to switch off the drive current failed, as the arc had already destroyed the main air pipe in the area of the pivoted bogie and there was no longer any air available to activate the short circuiting device. The driver of the train that had arrived at the platform opposite in the meantime also noticed the smoke and therefore also activated his short circuiting device. However, this did not switch off the power rail of the burning train, as it was on a different circuit. The drive current, and therefore also the source of ignition in the form of the permanent arc, were only switched off by the control centre. On the day of the incident a major event was taking place and so the train was occupied by 350 passengers - far more than usual for this time of day. Passengers left both underground trains. The smoke was concentrated in the station area where the burning carriage was standing. Approximately half of the platform at the other end remained more or less free of smoke. However, the only staircase in this station was located in the area that had become smoke-logged. In addition, the station lies at 1.5 times the normal depth for this type of station. The result was that after a short time the passengers could not leave the platform by the normal exit. The passengers then initially withdrew to the smoke-free part of the platform and waited for instructions. Unfortunately, loudspeaker messages from the control centre did not reach the people on the platform. Without panicking, the first passengers began self evacuation via the adjoining railway tunnel, which was now illuminated, in the direction of the neighbouring Ernst-Reuter-Platz underground station. This was not a hazardous undertaking, as in the meantime the control centre had switched off the power rail. Passengers eventually escaped into the open air via an emergency exit located approximately 160 m away. At 3.20 pm the first of the 150 firemen reached the scene and helped the passengers leave the underground railway facilities on the way through the tunnel. At approximately 3.30 pm the passengers of both the trains were in safety. At 4.43 pm the fire brigade had the situation in the area of operations under control. The platforms were cleared of smoke, using mobile ventilators. The underground railway traffic on the U 2 stretch of the line was resumed at 3.40 pm on the sections before and after the "Deutsche Oper" station. After midnight it was also possible for trains of the U 2 line to pass through the "Deutsche Oper" underground station. The underground station remained closed for approximately one month owing to repair work. The 30 passengers who suffered from slight smoke inhalation were mainly people who tried to leave the station by the normal exit. One passenger broke a leg. (3) Fire Damage [28, 29] The last carriage of the underground train was completely burned out. The heat produced by the fire also damaged the tiled lining of the station. The material damage was estimated at approx. 3.6 million EUR. (4) Summary [29] a) Under certain unfavourable conditions when a short-circuit arises it is possible that the protective equipment of the transformer substations are not activated. This requires further investigation. b) The lack of any information was severely criticised by the passengers. Even conversations held by the individual passengers via the emergency telephones were of little help. Although the

Design Fires for Metro Tunnels
Technical report Part 1 ‘Design Fire Scenarios’ 109/161
remaining boundary conditions meant that passengers did not panic, it is nevertheless a fact that the provision of clear information by trained and qualified staff at the control centre is absolutely essential in order to remain in control of such situations even where the initial circumstances are extremely serious. 3.3.1.3 Heinrich-Heine-Allee Underground Station, Düsseldorf (1991) (1) Fire Event and Damage [30, 31] On October 20, 1991, shortly before 6 am, a fire was discovered by the underground railway staff in the second basement storey of the Heinrich-Heine-Allee underground station on a cable line underneath the platform. Arsonists had set wood and leaves alight that had collected there, and this ignited a cable harness belonging to the transport authorities. Through the burning of chlorine-containing plastics, such as the PVC cable insulation, polychlorinated dibenzoparadioxins, dibenzofurans and hydrochloric acid were formed which were bound to the smoke condensation products. These smoke condensation products caused an estimated 2.3 million EUR worth of damage owing to the protection measures required for the workers and the environment during the repair work. The actual fire damage to the structure of the building was relatively small. (2) Course of the Fire and Extinguishing and Rescue Work [30, 31] At 5:49 am the fire brigade was informed of the fire by the control centre of the transport authorities. Attempts to extinguish the fire with hand held extinguishers by the underground railway employees were unsuccessful and the fire spread to the insulation of signal and communication cables, as well as the suspended ceiling lining. In the meantime the fire had spread to such an extent and had reached temperatures of approximately 800°C, so that the concrete of the reinforced concrete wall and ceiling began to spall. The hot smoke gases drifted from track 4 over the entire station with two platforms and the U1 shop level as far as the Bilker Strasse exit, and condensed on the ceiling. Five to ten minutes after the alarm had been raised the fire brigade arrived. By short-circuiting the power cable they were able to switch off the drive current, and three teams of firemen wearing compressed air breathing apparatus then began an attempt at extinguishing the fire. The fire-fighting water was provided by a tank that they had brought with them, and the first lower story of the Heinrich-Heine-Allee station was cleared of smoke by means of 3 pressure fans. The fire brigade teams approached the scene of the fire from the neighbouring Steinstrasse underground station through the tube of the tunnel as well as from the Ratinger Tor tunnel entrance. The fire brigade was able to restrict the fire to the area where it had started, and it was soon put out. Two people suffered poisoning by smoke inhalation and were taken to hospital. One fireman suffered bruises when he fell from the platform on to the track. 3.3.1.4 The Baku fire [104, 123] (1995) The disastrous fire in the subway of Baku, the capitol of Azerbaijan, occurred 28th of October 1995 and 289 people where killed and 256 severely injured. At the Uldus station a failure in the electrical equipment of the rear bogie of the fourth car. The train had five cars, with the driver situated in car number one. The total length of the train was 100 m and each car was 19.2 m long. When the train started towards the Narimanov station, 2.2 km from Uldus, the passengers of car number five smelt smoke. The smoke was sucked into the car by the ventilation system. The train driver noticed that an unknown malfunction of the train had occurred and the train stopped at a distance of 200 m from the Uldus station. When the train stopped, the tunnel was quickly filled with smoke, but the first, second and the third cars were quite free from smoke due to the direction of the prevailing ventilation. In the fourth car, the fire had not yet spread to the interior material to any greater extent. The main structure of the car was made from steel,

Design Fires for Metro Tunnels
Thematic Network Fire in Tunnels
110/161
the windows of tempered glass, and the door of aluminium. The combustible material mainly consisted of linoleum floor, seats made from expanded plastic foam and wood, and wall and ceiling plastic laminate coverings. Other combustible materials included the electrical cables and other electric equipment. Under the fourth car the intensity of the electric arc grew and new electric arcs occurred. A hole was created through the floor of the fourth car (blowtorch effect due to a hole in an air compressor) and the cable fire under the car started to spread upwards through the hole and ignited the seats. At the same time the fire spread under the car to both sides. The fire started to spread into the fourth car after approximately 15 minutes from when the train stopped. The fire spread from the fourth car to the fifth and the combustible material in both cars were almost entirely consumed in the fire. Approximately 220 passengers were killed and later found in the first three cars. The ventilation direction was changed (Uldus ->Narimanov) sometime during the fire development. While the fire did not spread to the first three cars the smoke concentration was very high in these vehicles which resulted in the high number of deaths in these cars. Based on the information given above it can be estimated that the peak heat release rate in the fourth car occurred some 20 – 30 minutes after the train was stopped. The fire may have spread to the fifth car within 30 minutes and the peak heat release for the fourth and the fifth car is estimated to be nearly 100 MW. The peak heat release rate of both cars most likely occurred within 30 - 45 minutes of the train coming to rest. This is based on a flash-over compartment fire (steel body with a window and door area of approximately 30 m2 in each car) calculation where it is assumed that the maximum is obtained when both fourth and the fifth car are burning [119]. The doors were made of aluminium, which most likely melted when the fire intensity was at its peak. The maximum intensity of the fire in the fourth car does not necessarily occur when the fire in the fifth car reaches its peak value. However, the total of both should be approximately 100 MW assuming the time frame given above and the size of the tunnel cross-section. In this fire we can expect that the rate at which air enters the car compartment through window and doors is insufficient to burn all the volatiles pyrolysed within the car compartment and the excess volatiles will be carried through the opening with the outflowing combustion products. This is normally accompanied by external flaming outside the opening. 3.3.1.5 The Kaprun fire [104, 126] (2000) The Kaprun tunnel fire occurred on the 11th of November 2000. It took place in a mass transit transport system of a special type (funicular train) compared to conventional metro systems, since the use of the Kaprun tunnel (other installations of that type are existing for same purpose in Europe) is dedicated to the transportation of ski practitioners from ski station to the snow fields. The tunnel is 3.300 m long with an average slope of 43%. The cross-section is like a circular tube with a diameter ranging from approximately 3.4 to 3.6 m. The total cross-sectional area is therefore approximately 9 – 10 m2. The fire started in the lower driver’s cabin and resulted in a stop 600 m from the entrance of the tunnel. At the same time there was another funicular train on the way down which also stopped 1.5 km from the other train. The only witness information given about the fire development is from the 12 people who escaped downwards in the tunnel. They saw smoke in the lower drivers cab and, after the train entered the tunnel, a small fire in the area of the floor of the drivers cab. They could roughly indicate the location of the initial fire. An investigation performed after the accident blamed a faulty heater (radiator) in the drivers cab as the cause of the fire. The heater's ventilator in the driver's cab had either become stuck or was blocked. Leaking hydraulic oil from a cable trickled into the heater and the surrounding area where it then ignited. The fire probably started to spread within the cabin due to the fact that the driver opened the doors and a window in the lower part of the train was smashed. The flames in the cabin where probably influenced by the high flow currents created by the natural ventilation outside the train. The natural ventilation in the tunnel at that time was estimated to be 10 m/s, which would mean that the velocity around the train was at least 20 m/s. This must have been a crucial factor for the continued fire spread. How the fire spreads within the

Design Fires for Metro Tunnels
Technical report Part 1 ‘Design Fire Scenarios’ 111/161
train is not known at the time of writing but we can assume that it became fully developed and that the aluminium body would have melted at some stage. We thus have a fire that is limited to the floor area of the train and on the tunnel lower surface down under and beside the train. The composition of the material in the train is not known. It would however appear that the amount of combustible material was underestimated. If we accept the fact that the fire transformed from an enclosure fire to a pool fire within a certain time we can make an estimation of the peak heat release rate. Since the body construction was of aluminium it is likely that the fire transformed into a pool fire. If we assume that most of the material burning was a mixture of clothes, plastics and oil the average heat release rate per square meter is estimated to be in the range of 300 – 600 kW/m2. This number is based on calorimeter tests. The total burning surface would be somewhere between 55 – 90 m2. This would give us the order of magnitude of the fire, i.e. somewhere in the range of 15 – 50 MW. This peak value was probably attained within a time frame of 10 to 30 minutes from the time the train stopped, after which the fire intensity started to decay. This estimation is based on model scale experiments performed in a tunnel with the same slope. With more information about the material involved it is possible to produce more accurate information concerning the fire size and fire duration. We can, however, state that the fire was not ventilation-controlled like the Eurotunnel, Mont Blanc or the Tauern tunnel fires. Calculations show that the ventilation rate is approximately 100 m3/s in the early stages of the fire and about 150-200 m3/s when the fire is in its most intense period (average velocity of 15 - 20 m/s). If the fire were ventilation-controlled it would have been over 400 MW, which is not realistic for such low fire load. 3.3.1.6 The Daegu Metro fire, Korea [194] The latest significant example of a metro fire that deserved a quotation in the context of this report is the one that happened in Daegu on the 18th of February 2003, at the level of the Jungagno station. This fire occcurence quickly revealed to be a human tragedy, since the accident finally claimed nearly 200 hundred lifes and many more people were injured, mainly due to toxic fume inhalation. Although the whole feedback from that recent accident has not yet been made available, important facts with regard to design fire scenarios are as follows : a) even rather recent metro networks are existing in some countries with fairly limited prerequested
technical safety measures in terms of fire prevention : in the case of the Daegu metro, no significant requirements in terms of fire rating of materials used for the rolling stock was imposed at the time of construction
b) careful considerations must be addressed of such accidental scenarios liable to happen at metro stations where the fire danger may be increased due to train stops (to allow passenger transfer), simultaneous presence at stop of trains in both directions on a given line and level of complexity (several basement levels possible) of passenger interchanges. In that case of interest, fire jump between cars of the same train as well as fire jump from one train to the other on the opposite wharf were real sub-events of the full fire scenario that, given the information available today, might have been identified as a potential worst case.
This event also draw attention on the role that the „cultural heritage“ may play in terms of human factors affecting the associated evacuation scenario (see Marlair et al [194]) and on the fact that the ignition process, as a result of arson (in that case use was made of a container of flammable liquid by a mentally disable man), may be of significant thermal power, as compared to existing burning materials present in standard carriages. 3.3.2 Evaluation of fire growth rate and peak HRR from experiments When regarding the fire growth it is possible to distinguish between two types of the development of a vehicle fire [129, 137]: (1) A slowly progressing fire
Design Fires for Metro Tunnels
Thematic Network Fire in Tunnels
112/161
A fire ignited by arson (for example) will, in many cases, have a relatively slow progress and may even go out rather than continue to develop into a full fire. According to research work done on the rolling stock of the Frankfurt transportation company in Germany this is because the ignition source used to start the fire has a low energy (e. g. cigarette lighter, torch) while the vehicles built according to DIN 5510 use materials with a high resistance against burning [129]. With regard to their rolling stock the Frankfurt transportation company specifies design against a slowly progressing fire with a HRR of about 6 MW 30 minutes after the start of the fire and about 15 MW after one hour [129]. (2) A rapid progressing fire with a full fire phase When there is a high ignition energy to start and sustain the fire in less fire resistant vehicles (e.g. several litres of gasoline (Daegu attack, Korea, see section 3.3.1.6) or alcohole ( EUREKA tests) a rapidly progressing fire may develop. In the EUREKA 499 test series a German subway car was burned which was modernised with respect to the seats [129, 137]. Corresponding results of a measured HRR have been presented by Ingason et. al [114] and Steinert [41]. The subway car, which was 18 m long, 2.8 m wide and 3 m high, was made of aluminium. There were 40 seats, made of polyurethane foam (a total of 210 kg) covered with textile. The total heat content of the seats was calculated as 6 GJ, with a total calorific value of the whole car estimated to be about 41 GJ [40]. The HRR reached a peak after only five minutes. Depending on the method used to evaluate the HRR, the peak values were between about 24 MW [41] and about 35 MW [114]. It appears that the use of aluminium for car bodies leads to more violent fires. Aluminium melts at 660 °C, and so the fire can easily burn through the roof. This means that the fire does not become ventilation-controlled and the risk of fire spreading between two adjacent cars increases as the flames can propagate more easily at roof height, particularly if there is good longitudinal ventilation. 3.3.3 Design fires referring to the structural load of metro tunnels 3.3.3.1 Principal Engineering Aims on Fire Protection in Metro Tunnels As similarly high temperatures occur in rolling stock fires in tunnels used by local passenger trains as in road or mainline railway tunnels, the structural protection targets stated in sections 3.1.3 and 3.2.3 can be applied with respect to the tunnel structure. Further protection targets concern the opportunities for the passengers to rescue themselves in a fire. These include: (1) Maintaining the ability of the train to keep moving Escape at a station is preferred, as the chances of fleeing the fire are greater owing to the wide illuminated pathways and staircases, for example. The use of emergency brake bridging mechanisms will help to ensure that, even in the case of a fire, a running train is able to continue travelling to the next station. However, if a train is forced to stop in a tunnel, for example as a result of a derailment, technical defect or to avoid passing a “stop” signal, it must be possible for the passengers to rescue themselves from the tunnel. (2) Maintenance of a layer of air with a minimum amount of smoke above the pedestrian escape routes (such as the floor of the platform) will help the individuals caught up in the fire to find their way when escaping, as well as avoiding as much as possible injuries from smoke gases. For example, in Germany, fire brigades demand a layer at least 2.5 metres deep with an extinction coefficient of not more then 0.3 m -1 to give sufficient visibility for self-rescue, for a period of at least 15 minutes following the start of a fire [137]. During the following 15 minutes (i.e. up to 30 minutes

Design Fires for Metro Tunnels
Technical report Part 1 ‘Design Fire Scenarios’ 113/161
from the start of the fire) the thickness of the layer may reduce to 1.5 m with visibility conditions as mentioned above [137]. 3.3.3.2 Objectives in various Countries The objectives cited in chapter 3.2.3.2 for railways apply also for the operation of metro systems in tunnels. Regulations in various countries are listed in Table 3.21. In the UK London Underground Limited (LUL) has recently published a Engineering Standard [149] stating their requirements for fire safety performance of materials in terms of flammability, smoke emission and toxic fume emission. These will apply to vehicles operating on the LUL network. The business objective of the standard is “to ensure that the risk to which the public and employees are exposed is controlled to a level as low as reasonably practical (ALARP)”. This standard is applicable to both permanent and temporary installations. These are in addition to the normal standards for UK rail vehicles contained in the “Group Standard” GC/RT2120, the specified objectives of which are, “to minimise the risks of ignition and fire development”, “to ensure…that the required mechanical strength of the vehicle structure is retained” and “to ensure…that the train can be brought safely to a stand”. The UK rail standard for tunnels (GC/RT5180) requires a tunnel-by-tunnel treatment of safety, including fire safety, without giving prescriptive measures that are required. Fire precautions in all UK underground railway stations are covered by specific legislation (The “Fire Precautions (Sub-Surface Railway Stations) Regulations 1989 [138]. The UK standards concentrate principally on reducing the risks of ignition and fire spread, and make no reference to overall fire loads or heat output. The metro station regulations require 1 hour fire rating for structural components, based on a standard ISO curve (i.e. 950°C after 60 minutes).
Country Regulations Remarks Belgium no own regulations for the fire
protection of trains use of French (having priority), British or German regulations, if necessary together with further demands
Germany DIN 5510-1 (10/1988) E DIN 5510-2 (06/2001), DIN 5510-4 (10/1988), DIN 5510-5 (10/1988), DIN 5510-6 (10/1988)
part 2 only drafted part 3 not put forward ("stand still" because of European fire protection regulations)
France NF F 16-101 (10/1986), NF F 16-102 (04/1992), NF F 16-103 (07/1989)
SNCF and RAPT: also STM-S-001
United Kingdom BS 6853 (01/199), Railway Group Standards: GC/RT5180 GM/RT 2120 (08/1998) and GM/RC 2506) (08/1998)
The Association of Train Operating Companies standard for all vehicles (ATOC AVST9002) has specific categories for trains used mainly in tunnels.
Italy UNIFER prE 10.02.997-1; UNIFER prE 10.02.997-2; UNIFER prE 10.02.997-3;
up to now also internal regulations of FS: FS No. 306574 FS No. 30414 FS No. 304692
The Netherlands BPRM Mw3R/094/52/5 (03/1988)
UIC 564-2 and UIC 642, also acceptance of French, British or German regulations, if necessary together with further demands
Norway NSB-standard "Trykk 408" (based on UIC 564-2, partly test methods according to NordTest-Fire standards)
also acceptance of French, Britishor German regulations, if necessary together with further demands

Design Fires for Metro Tunnels
Thematic Network Fire in Tunnels
114/161
Austria no own regulations for the fire
protection of trains if necessary acceptance of German regulations, when demanded by an independent external expert report
Sweden no own regulations for the fire protection of trains
often use of UIC 564-2 and for seats BS 5852, crib 7; but also acceptance of the French, British or German regulations
Switzerland no own regulations for the fire protection of trains
also acceptance of French or German regulations
Spain RENFE technical specification DT/PCI-5A
this specification only deals with interior equipment
Europe EN 45545, part 1 to 7 only drafts for part 1, 3 and 5 existing
UIC UIC 564-2 (01/1991), UIC 642 (09/2001), UIC 660 (draft =!/1997)
Table 3.21: Fire protection regulations for trains in Europe [159]
In Germany most objectives referred to in chapter 3.2.3.2 are included in the regulations of the BOStrab [85], the DIN 5510 [77]and the DIN 45545 [151]. In France standards have been in place for 15 years concerning the requirements for fire safety performance of rolling stock materials, devices and cables ( NF 16101 to NF 16104) and for cables in tunnels. They define the fire behaviour of materials which leads to M and I classification; smoke, opacity and toxicity leading to F classification. Moreover RAPT defines new requirements for many devices in stations for the new METEOR line (e. g. cables, shops). The French requirements do not limit the amount of combustible or non-combustible materials implemented but impose restrictive conditions in relation to the amount of chlorine and nitrogen contained by volume unit of the area were they are implemented. 3.3.3.3 Specifications on the Course of the Fire A distinction between a slow and a rapid progression of a carriage fire must be made (chapter 3.3.2). For a rapidly growing fire on a multi-carriage train (train lengths of up to approx. 199 m for metro systems and up to approx. 225 m for systems like RER in France and the S-Bahn in Germany) a fire spread to the neighbouring carriages in front of and behind the burning carriage has to be taken into account when considering a fully-developed fire. In this case it should be assumed, for example, that the fire will develop within approx. 10 minutes from ignition into a fully-developed fire in the carriage initially involved and then that, after approx. 15 minutes from ignition, it will spread simultaneously to the two neighbouring carriages. It can be assumed that within the central areas of a town or city the fire brigade will arrive quickly (for example arriving at a station within approx. 10 minutes of receiving the alarm, and being on the station platform within approx. 15 minutes). Moreover, in many tunnels there are frequently spaced fire hydrants so that the time-consuming process of laying fire hoses is not necessary. In such tunnels, therefore, it can be assumed that the two neighbouring carriages will not burn out completely, as the fire will be limited or extinguished by the action of the fire brigade. 3.3.3.4 Specifications on Fire Loads The rolling stock of metropolitan railways differs widely due to age, vehicle dimensions and use of materials for e.g. seats. Consequently, it is not possible to give unique fire loads for underground railway carriages. Some clues can be drawn from the results of the EUREKA-trials in Norway [40, 72, 73, 78], of an actual German research project [129] and of French investigations.

Design Fires for Metro Tunnels
Technical report Part 1 ‘Design Fire Scenarios’ 115/161
(1) Vehicles under planning in Germany For the new rolling stock of two metropolitan transportation systems fire loads of approximately 54 GJ and 79 GJ were determined from the quantities of combustible material of the carriages (length about 30 m) [137]. (2) Partly modernised vehicles Within the EUREKA-trials an approximately 14 m long steel carriage and an approximately 18 m long aluminium carriage were used (from Hamburg and Munich underground). The fire loads determined for this rolling stock were about 33 GJ and 41.5 GJ respectively [73]. For the Frankfurt U2-carriage (length about 23 m) a combustible load of approx. 74 GJ is quoted [129]. (3) French results Some calculations made by RAPT on their rolling stock of the seventieth generation showed that the total calorific value of a whole car is estimated to be about 28 GJ for a metro car (15 m long) and 39 GJ for a RER car (25 m long). This shows that high fire loads are not confined to older vehicles, but may also be found on modern trains. 3.3.3.5 Specifications on Energy Release Rates According to the results of an actual German research project and the EUREKA-trials the maximum heat release rates of metropolitan railway carriages can be specified as follows (chapter 3.3.2 ) [129, 137]: (1) Use of low ignition energies to start the fire (e. g. by arson) Recent research work on the modernised Frankfurt U2-metropolitan carriage showed no full fire when a low ignition energy was used [129]. Based on the tests an almost linear rising heat release rate was recommended which should reach about 6 MW 30 minutes after the start of the fire (chapter 3.3.2) [129, 137]. (2) Use of high ignition energies to start the fire (e. g. fire attack) The aluminium underground railway car burned within the EUREKA-trials in Norway was ignited by about 6.3 kg isopropanol and showed a full fire. Depending on the method for evaluating the experiment a heat release rate between approx. 24 MW and 35 MW was calculated (chapter 3.3.2) [41, 114]. In evaluating this information it must be remembered also that in the case of aluminium rolling stock, the heat caused relatively early the melting of areas in the roof zone. Items of rolling stock constructed of extruded sections (e.g. passenger carriages made of aluminium) show greater resistance over time to the effects of fire than those of differential construction. This is very probably attributable to the fact that the sections used in the extruded section construction method are thicker.

Design Fires for Metro Tunnels
Thematic Network Fire in Tunnels
116/161
3.3.4 Design Fires referring to the Ventilation of Metro Tunnels According to recent German experiments and the EUREKA-trials the following qualitative smoke release rates during fires of metropolitan carriages can be quoted: (1) Use of low ignition energy to start the fire (e. g. by arson) According to [129] there is a slow mostly linear increase in the smoke release rate from about 10 m³/s to about 32 m³/s between the 5th and 30th minutes of the fire. (2) Use of high ignition energy to start the fire (e. g. fire attack) Based on the EUREKA-trials smoke release rates of at least about 70 m³/s should be taken. When using a CFD simulation, the output of smoke is coupled to the heat release rate, which in turn depends on the chemical process of burning. In this case the parameters of the CFD simulation should be chosen in an appropiate way to get smoke release rates in the vicinity of the fire (e. g. in a height of approx. 5 m) as given above. 3.3.5 Design Fires referring to the Equipment of Metro Tunnels The recommendations in American, French and German standards are summarized in Table 3.22.
Standard Item Specification
BOStrab-guidelines for electrical installations
Cabling of emergency lights
functioning for at least 20 minutes
DIN EN 12101-1 smoke curtains 600° C for 30 minutes
fans in stations 400° C for at least 60 minutes French standard
IT 98300 fans in tunnels 200° C for at least
120 minutes materials for use as conduits, raceways, ducts, boxes, cabinets, equipment enclosures, and their surface finishing materials
500° C for at least 60 minutes
NFPA 130
emergency ventilation fans, their motors, and all related components to the exhaust air flow
250° C for at least 60 minutes
Table 3.22: Recommendations for design fires referring to equipment of metro tunnels [83, 92, 93, 158]

Design Fires for Metro Tunnels
Technical report Part 1 ‘Design Fire Scenarios’ 117/161
3.3.6 Design Fires referring to the Rescue of Passengers in Metro Tunnels 3.3.6.1 Generation of Toxic Gases Again with reference to the recent German research work and the EUREKA-trials the following clues for the gas emission can be quoted [41, 207]: (1) CO-production: approx 0.02 to 0.08 g/g (2) CO2-production: approx 1.5 to 1.9 g/g 3.3.6.2 Visibility in a Smoke Environment Where there are no specific regulations about the permissible visibility in a smoky environment calculations may use the parameters given below. Measures for controlling the spreading of smoke in the stations or tunnels (e. g. extraction systems, smoke curtains) should be evaluated (e. g. by CFD calculations using the parameters below and must be chosen in a way that a layer containing little smoke is maintained, to make rescue operations possible. This layer should have an extinction coefficient of not more than 0.3 m-
1 for a visibility of at least approx. 10 m. The thickness of this layer should be at least about 2.5 m for 15 minutes from the start of the fire (self-rescuing phase) and thereafter at least about 1.5 m for another 15 minutes (main phase of rescue by the fire brigade). Average values for the mass optical density Dmass [m2/kg] needed for the calculation of the visibility according to the chapter 3.1.6.2 or within CFD calculations are given in Table 3.23 for the EUREKA experiments [104]. Recent research work in Frankfurt (Germany) on the modernised U2-carriage indicates an average mass optical density of only 190 m2/kg [129, 207].
Type of vehicle Average mass optical density Dmass [m2/kg]
subway (steel) 407 subway (aluminium) 331
Table 3.23: Average mass optical density, Dmass from burning railway vehicles in experiments given in [41]. The values given here are quoted in [104] and are therein recalculated from data
presented by Steinert [41].
3.3.6.3 Specifications on the Length of Escape Routes in Metro Tunnels The measures taken to rescue individuals and remove the smoke from the scene of the fire must be harmonised in such a way that the evacuation times for the escape of the passengers from the stations and from the tunnels are shorter than the times of critical smoke spreading. As far as the rolling stock is concerned, the use of emergency brake bridging can be provided for, which is intended to ensure that - especially in the case of a fire in a carriage - the train can still continue its journey to the next station. At the station the passengers can leave the train considerably faster and more easily (on the same level), particularly if smoke is effectively removed from the track area and kept clear of the higher station areas and the passenger circulation level (e.g. by smoke extraction or protective smoke curtains). The escape route from the station is also usually shorter and easier to follow than through the tunnel. Nonetheless, the possibility remains that a burning train may be stopped in the running tunnel. In this case it is necessary for the passengers and staff to escape via the next available station or the next available emergency exit. In Germany it is legally prescribed (BOStrab, [85]) that in subway systems the distance between an emergency exit and the nearest station, or between two emergency exits, must not be greater than 300 meters on average. In France the maximum distance between two stations or fire brigades access points is fixed to 400 m.

Design Fires for Metro Tunnels
Thematic Network Fire in Tunnels
118/161
With respect to evacuation, the following cases should be taken into account: (1) Evacuation from stations In cases where individuals escape at a station, the times required to empty the train and leave the stations have to be taken into account. In NFPA 130 [83] for example, it is required, that the stations are designed in such a way that they can be evacuated within 6 minutes (platforms within 4 minutes) if not explicit calculations about smoke propagation and evacuation times are made which could relieve the time limits. There may be specific considerations when making evacuation calculations, for instance in the UK it is acceptable to include escalators as a means of escape, but it must be assumed that one of the escalators in a given area is not available (e.g. under repair at the time of the fire). Investigations on underground stations planned in the city of Amsterdam have shown (Table 3.24) that they can be cleared as a rule within 2 to 6 minutes. If escape conditions are particularly unfavourable, for example if one of the two intermediate floors provided for is full of smoke and therefore can no longer be accessed, the evacuation times found for the stations analysed in Amsterdam were approx. 10 minutes [84]. When the time required by the personal to check the situation and by the passengers to react on the fire alarm is also included it must be assumed that the time needed to escape from the platform level of a station to the surface is approx. 10 minutes. Numerical tools to check the evacuation time for a specific station are given within NFPA 130 [83], by Predtetschenki / Milinski [160] and within several simulation programs like SIMULEX [81], STEPS [82], buildingEXODUS [185], CRISP [184] and ASERI [186]. The time calculated has to be shorter than the time for a critical accumulation of smoke in the station (chapter 3.3.6.2). (2) Evacuation from the running tunnels Investigations on various fire scenarios [81, 82, 84] show very different assessments of the escape possibilities and therefore also the evacuation times (Table 3.24). If, for example, the walking speed of approx. 1 m/s (or 60 m/min) mentioned in the American standard NFPA 130 is assumed for a 400 meter-long escape route, it is possible to leave this tunnel within approx. 6½ minutes on an escape route which is only 1 meter wide [82]. According to other calculations for this situation, however, considerably more time is required, in some cases up to 13½ minutes [82] (Table 3.24) due to the bottleneck for queuing up of the passengers on the escape way beside the train. No.
Boundary Conditions Evacuation Times Source
1
Mainline Traffic
- Evacuation of a single passenger carriage with central corridor
- Stationary train: evacuation via side doors
- Moving train: evacuation via doors at end of carriage
- No. of people in passenger carriage: 98 in each case
- Train at the platform: 27 seconds
- Train stationary on open stretch: 19 seconds
- Moving train, moving to neighbouring carriage: 47 seconds
[80]

Design Fires for Metro Tunnels
Technical report Part 1 ‘Design Fire Scenarios’ 119/161
No.
Boundary Conditions Evacuation Times Source
Distance crosscut [m]
Time required to reach safe area
125 11 min:52 s
250 15 min:14 s
375 18 min:08 s
Clearance width 1.10 m
500 21 min:45 s
2 - 2 parallel tunnels, 10 m long crosscuts, 90 cm wide footpath
- Train with 4 carriages, each 22.5 m long, total length 90 m
- No. of people: 150 per carriage, 600 people in total
Clearance width 2.10 m
125 11 min:45 s
[81]
3 - 400 m long way to the nearest platform
- Escape route width 1 m
- No smoke in the escape routes
- Train with 3 passenger carriages
- Total number of people: 962
- Broken down in the tunnel
- a) Walking distances only:
- - 1 person: at least 3 min:22 s, maximum 5 min:03 s
- - Group acc. to NFPA 130: approx. 6 min:30 s
- b) Including walking distances and train evacuation:
- - Calculation with STEPS program at speeds according to NFPA 130: 13 min:25 s
- - Calculation with STEPS program and 10 groups of people at various walking speeds: 9 min:17 s
[82]
Escape route length [m]
Evacuation times [minutes]
100 approx. 8.0
4 Local Traffic
- Escape from the tunnel
- 400 to 500 people in the rush hour traffic
- Escape route: width next to the train 0.70 m; after passing by the train the 175 approx. 10.0
[84]

Design Fires for Metro Tunnels
Thematic Network Fire in Tunnels
120/161
No.
Boundary Conditions Evacuation Times Source
entire width of the tunnel can be used 350 approx. 17.0
Evacuation times *), examples 5 Escape from the station during morning peak traffic a) all escalators moving upwards:
b) 1 escalator undergoing maintenance and 1 escalator moving downwards when fire breaks out:
c) all escalators stopped, capacity reduced to 2/3 compared to full operation:
approx. 2-4 minutes
approx. 3-6 minutes
approx. 3-5 minutes
[84]
Table 3.24: Information contained in literature on evacuation times for mainline and local railway tunnels
Numerical tools to check the evacuation time for a specific tunnel are given within the NFPA 130 [83] (applicable e. g. for the escape way along the tunnel and the staircases from the escape way to the platform within the station), by Predtetschenki / Milinski [160] (applicable e. g. for the leaving of the train and the bottleneck on the escape way beside the train) and within several simulation programs like SIMULEX [81], STEPS [82], buildingEXODUS [185], CRISP [184] and ASERI [186]. For a successful evacuation the escape time from the running tunnel has to be shorter than the time for a critical accumulation of smoke in the tunnel (chapter 3.3.6.2).

Current Considerations in the EU countries on Future Developments in the Fire Scenarios for Traffic Tunnels within the DARTS project
Technical report Part 1 ‘Design Fire Scenarios’ 121/161
CHAPTER 4 : CURRENT CONSIDERATIONS IN THE EU COUNTRIES ON FUTURE DEVELOPMENTS IN THE FIRE SCENARIOS FOR TRAFFIC TUNNELS WITHIN THE DARTS PROJECT [132 TO 135]
4.1 Application of Natural Fire Safety Concept to Road, Rail and Metro Tunnels [132 to 135] The Natural Fire Safety Concept (NFSC) was established in 1994 with the objective of establishing a more realistic and credible approach to analysis of structural fire safety in case of fire that takes account of active fire fighting measures and real fire characteristics [133]. The approach aims to consider all of the physical factors that influence fire development in a systematic way, and based on this, to define for each building a ‘natural’ fire curve. The natural fire curve is then used as an input parameter to numerical models in order to assess the impact of the fire on the building’s structure. The parameters that influence fire development include: • Fire (probability of fire occurrence, fire spread, fire duration, fire load, severity of the fire); • Ventilation conditions; • Fire compartment; • Type of structural elements; • Evacuation conditions; • Safety of the rescue teams; • Risk for the neighbouring buildings; • Active fire fighting measures. The assessment of the global behaviour of the structure, as shown in Figure 4.1, is based on the natural fire curve and a realistic structural load, which in turn are based on the parameters above. The construction fire safety is determined through comparing the resistance against fire, nat
d,fit , to the required fire resistance, which depends on the necessary evacuation time, t fi, requ, and the consequence of possible failure of the structure.
Figure 4.1: The Natural Fire Safety Concept (Flow chart adapted from [133]).
natd,fit ≥t fi, requ
Realistic load combination
Global behaviour of the structure

Current Considerations in the EU countries on Future Developments in the Fire Scenarios for Traffic Tunnels within the DARTS project
Thematic Network Fire in Tunnels
122/161
In order to apply the NFSC, the characteristics of the building should be known. The methodology is applied compartment by compartment of the building. The compartment is defined not only in terms of geometry, but also in terms of thermal characteristics of its boundaries and openings in the compartment. The concept has been developed for and applied to buildings; tunnels have not yet been treated by this approach. In order to extend this concept to tunnels, the differences between tunnels and buildings should be highlighted. Within the NFSC the important parameters for buildings are discussed. These parameters are repeated here in this report and an assessment is made of whether these parameters are of significance for tunnels. In doing so, an ‘analysis’ of the differences between tunnels and buildings will be made. 4.1.1 Fire characteristics contributing to natural fire curve This section describes how the parameters contribute to the fire development. (1) Boundary elements This relates to the behaviour of the boundary elements of the compartment under ‘natural’ fire conditions. In a building, compartmented enclosures can be provided in order to prevent or reduce the spread of fire through the building. For a tunnel, individual bores can be considered to be compartments whereby the spread of fire in a tunnel bore to other bores will be determined by the presence of fire resisting partitions between the bores. However, the traditional definition of a fire compartment is not directly applicable to tunnels. Hence, a fully developed fire inside a tunnel generally will be limited to a certain length of the tunnel. (2) Wall thermal characteristics Heat transfer into the tunnel walls via convection and radiation can be determined in the same way as heat transfer to the walls in a building, where the thermal properties of the wall are characterised by the thermal conductivity, specific heat and unit mass of the material. In tunnels, the wall will typically be constructed of concrete. The heat transfer through the wall is determined by the type of concrete, moisture content and the wall thickness. Because of the necessity of protecting the construction against fire, a tunnel lining can be insulated by a fire protective layer. This layer can be sprayed or applied as board, and will in any case slow down the heat transfer through the tunnel wall. Since the tunnel wall is a relatively thick concrete construction, it is insufficient to assume a uniform temperature distribution in the construction. Transient heat-flow analyses can give information on the temperature distribution in the wall. Such calculations are part of the NFSC. (3) Geometry This deals with the effect the compartment geometry has on the fire development. A tunnel is a confined space and presents one of the ‘worst case’ type of geometries for fire development. The low ceiling and small cross-section provide conditions that are conducive to high thermal loads to the tunnel structure. (4) Ventilation Unlike a building, a tunnel does not consist of numerous openings (windows, doors) directly to the outside. Air can naturally enter and leave the tunnel via the portals, ventilation openings and passageways between bores. In longer tunnels mechanical ventilation is of greater significance than natural ventilation. A number of ventilation regimes are available: transverse, semi-transverse and longitudinal. The primary objective of mechanical ventilation during the fire is to manage

Current Considerations in the EU countries on Future Developments in the Fire Scenarios for Traffic Tunnels within the DARTS project
Technical report Part 1 ‘Design Fire Scenarios’ 123/161
smoke. However, it is thought by some authors that mechanically ventilating the fire could result in a more rapid fire development. (5) Fire load A tunnel will have a ‘fixed’ and a ‘variable’ fire load. The fire load due to fixed tunnel components, e.g. wall linings and contents such as cables, track, power supply network, signalling system, lighting system and radio transmission equipment, can be assessed based on a statistical survey of typical tunnels. In rail and metro tunnels the variable fire load is due to carriages and can be determined statistically by surveying typical rail and metro carriages. In a road tunnel the variable fire load consists of road vehicles and is more difficult to define since the density of vehicles present in the tunnel is variable and a tunnel fire would not be expected to involve all of the vehicles in the tunnel. Analogous to the data on fire load density for different buildings, a table could be presented for the statistically determined fire load for road, rail and metro tunnels and their contents. (6) Type of fire In a tunnel fire, it is unlikely that the fire will involve all of the available fuel. In the growth stages of the fire, the rail/metro carriage or road vehicles are of most interest. Later, elements of the tunnel, e.g. linings, might become involved. The NFSC divides the type of fire into two categories: localised and fully developed. In the former case, a stratified smoke layer is considered and in the latter case, a fully mixed smoke layer. With regards to tunnels, both types of fires are possible corresponding to stratification in the growth stage (possibly when the fire is confined to the carriage/vehicle) followed by full mixing in the fully developed stage of the fire. However, full mixing might not extend over the entire length of the tunnel. (7) Fire position A tunnel may be more vulnerable to collapse or significant structural damage depending on the location of the fire. 4.1.2 Structural behaviour The tunnel structure generally consists of a concrete lining. The primary function of the tunnel lining is to bear the loads acting on the structure, also in the event of fire. Different types of concrete are used in tunnels. Depending on the type of tunnel generally normal strength or high strength concrete are used. Different kinds of concrete will react differently to fires. The goal is to have cost-effective, durable, concrete that will have sustained load bearing capacity during fire and eventually without structural damage. Concrete tunnel structures can lose their load bearing capacity due to several failure mechanisms. The main mechanisms, relevant for tunnel linings are - Bending - Buckling - Shear - Spalling A loss of resistance against these mechanisms is caused by a loss of strength of both concrete and reinforcement and in case of buckling, shear and spalling also due to additional internal stresses that arise during fire. When concrete is heated the temperature increase will result in a loss of (compressive and tensile) strength. Although this effect is dependent on the composition of the concrete, e.g. type of aggregate material, the best way to prevent strength loss of the concrete is by reducing the heat

Current Considerations in the EU countries on Future Developments in the Fire Scenarios for Traffic Tunnels within the DARTS project
Thematic Network Fire in Tunnels
124/161
penetration. This can be obtained by applying a heat-isolating layer on the concrete surface (thickness approx. 30 mm). Internal stresses are caused by thermal expansion and evaporation of moisture. When concrete is heated the surface will be compressed due to (partially) prevented thermal expansion. This effect is dependent on the thermal gradient and therefore will be less severe when the heating rate is lower. During heating the (free, physically bound and chemically bound) water inside the material will gradually evaporate. In concrete types with dense structures (e.g. high strength concrete) the vapour pressure will rise. The combination of a thermal gradient with vapour pressure can lead to the explosive separation of parts of the concrete from the construction (spalling). A high permeability of the concrete can prevent spalling. Avoiding the usage of micro-fillers such as silica-fume will increase concrete permeability. Using polypropylene fibres can also prevent spalling. Among other theories, it is assumed that these fibres melt at a certain temperature, creating small channels that release the vapour pressure. The diameter of these fibres is in the order of 10 micron and the dosage approximately 2 to 3 kg/m3. Another way of reducing spalling is the addition of steel fibres. These fibres bridge the cracks that develop in the concrete, thus keeping the material together. There is little experience on the effectiveness of different types, dosages and sizes of fibres. Finally an isolating layer can be applied. In this case the layer has to be relatively thick (approx. 50 mm) because the temperature in the concrete is limited by the evaporation of moisture. 4.1.3 Parameters contributing to realistic structural load In a tunnel the structural loads considerably differ from the loads in a building. In the NFSC approach of designing a building, single construction elements are considered to be subjected to a certain time-temperature curve. For tunnels however, considering single elements is insufficient for a realistic prediction of the structural behaviour. In many situations the thermal expansion is restrained, and therefore large stresses will occur in the tunnel lining during a fire. Due to the large thickness of tunnel linings, thermal gradients play an important role as well. Restraint of thermal expansion and the development of thermal gradients are largely dependent on the type of construction of the tunnel. Taking into account the parameters discussed in this section, a realistic structural load can be determined by advanced non-linear finite element simulations. For concrete construction, a main failure mechanism is spalling. When concrete is heated, spalling can lead to extensive damage to the construction. Therefore it is of vital importance to consider the risk of spalling. (1) Immersed tunnels Immersed tunnels are built with high wall thickness in soft soil conditions, and with relatively low concrete strength. The high wall thickness is needed as self-weight to be able to submerge the floating tunnel segment by adding a little weight. In the final position the stresses in the walls and ceiling due to ground pressure is relatively low. The ceiling and walls are subject to shear and bending moment. Due to the large concrete thickness, during heating a large thermal gradient will develop, resulting in large stresses. To avoid this, fire resistant material can be applied to the ceiling. Tests on wall segments have proved that no spalling is to be expected, but this is strongly dependent on the concrete mix. (2) Bored tunnels In bored tunnels, with circular cross-sections, the ground pressure results in bending moment and compressive forces in the tunnel-lining. If the tunnel-lining is built up with precast segments, the

Current Considerations in the EU countries on Future Developments in the Fire Scenarios for Traffic Tunnels within the DARTS project
Technical report Part 1 ‘Design Fire Scenarios’ 125/161
construction has a certain level of flexibility. In axial direction a bored tunnel can be under compression due to the construction process, in which this compression results from the propulsion for the tunnel boring machine. Bored tunnels are built with smaller wall thicknesses than immersed tunnels. For this reason, the heat transfer in the tunnel wall will heat up the cross-section of the construction faster. Heating up the construction results in expansion of the construction. The stiffness of the tunnel is generally larger than the stiffness of the surrounding soil, and therefore the tunnel will not be restrained in its expansion. In a tunnel through rocks there can be considerable lateral restraint, causing large compression in the tunnel lining. Heating up also results in a thermal gradient over the tunnel-lining. When the inside is heated, the thermal expansion is restrained due to the colder temperature in the major part of the cross-section. This restraint causes large compression at the inner surface of the tunnel-lining. Combined with the high strength concrete grades that are used in bored tunnels, the risk of spalling is relatively high. It is important to note that spalling of concrete is not directly dependent on the strength of the concrete, but more on compression, concrete mix design, permeability and moisture in the concrete. 4.1.4 Safety measures in the NFSC approach According to the NFSC approach, each safety measure is represented by a partial safety coefficient. These coefficients give a decrease of the fire load, following: qd = γ1 γ2 γ3… γn qchar (14) in which qd = design fire load qchar = characteristic fire load γ1 γ2 γ3… γn = partial safety factors for different safety measures In this way, the application of safety measures is translated into a less severe fire. The determination of the partial safety factors is based on statistics. For a translation of NFSC to a tunnel fire, it should be questioned whether the approach of reduction of the fire load with partial safety factors is appropriate for tunnels. First of all, the accepted risk of structural collapse, as adopted in NFSC should be discussed. In NFSC, the collapse is accepted provided that the time to failure exceeds the time required for escape and rescue. However, the consequences of collapse can be completely different for a tunnel than for a building. Moreover, an accepted risk of structural damage rather than structural collapse can be considered in view of the direct and indirect costs of repair. Furthermore, in NFSC, the effect of safety measures on the risk of structural collapse is taken into account by a modification of the fire load. Other parameters influencing the fire development, such as ventilation conditions are not modified. This approach is based on the assumption that the fire load predominantly determines the risk of failure, i.e. designing the structure for a higher fire load results in a lower probability of failure once flash–over has already occurred. In this way, the effect of safety measures on the probability of flashover is compensated. This approach might be satisfactory for failure mechanisms that depend mainly on the temperature alone, such as failure due to yielding of steel. However, spalling is a highly relevant failure mechanism in concrete tunnel structures, which is rather driven by temperature increase rate and thermal gradient over the structure than by temperature alone. As a result, a conservative upper bound for the fire curve can not be obtained just by modification of the fire load but should include other parameters as well, such as ventilation conditions and wall properties. If appropriate, new partial safety factors will have to be determined for safety measures used in tunnels. A problem with this is the lack of statistics for tunnel fires. In the following sections an overview is given of the fire frequency in road tunnels and the safety measures at hand for such tunnels.

Current Considerations in the EU countries on Future Developments in the Fire Scenarios for Traffic Tunnels within the DARTS project
Thematic Network Fire in Tunnels
126/161
4.1.4.1 Risk of fire (road tunnels) Some work on the fire start rates in road tunnels has been undertaken in the Durable and Reliable Tunnel Structures (DARTS) project. Observations of the number of fires can be transformed into fire rates. The certainty of the information about rates is dependent on the observation period in relation to the tunnel traffic. It should also be mentioned that the method of observation may vary from tunnel to tunnel. In a tunnel with a dedicated control room manned with fire personnel, any fire may be recorded, whereas in other tunnels only the fires which are actively reported to the fire department will be recorded. Another source of uncertainty is the traffic culture and the quality of infrastructure and vehicles. A general observation of traffic safety reveals also differences from country to country. In Table 4.1 is given a list of fire rates (PIARC 1999), for 45 named tunnels from 13 countries with indication of annual traffic, tunnel length, and observation period. Distinction is made between fire rates for various vehicle types, urban tunnels, and rural- and mountain tunnels with unidirectional and bidirectional traffic. The definition of fire rate is the number of fires per vehicle kilometre in the tunnel. For some of the tunnels in the survey it is indicated that no fires have occurred in the observation period. An estimated rate of 0 fires per 108 vehicle km, is of course the lowest possible value, and it will be misleading as a general value. The reason why no fires have been recorded can be: the traffic is very limited and no fires would be expected in the period or simply good fortune in the period. For some of the cases the reason may be that the tunnels are very short, which gives a good chance to drive a possibly burning car out of the tunnel. Finally fires may have occurred, which have not been recorded. 4.1.4.2 Active and Passive Safety Measures for roads Within the Durable and Reliable Tunnel Structures (DARTS) project [134], an inventory of safety measures has been presented. All measures can be of a structural type (two tunnel tubes instead of one, frequent cross connections between tunnel tubes, special types and qualities of concrete), a non-structural but physical type (sprinklers, ventilation), or an organisation type (communication, instructions). (1) Two tubes – one-way traffic One-way traffic can be preferable because of safety reasons. Mainly because the number of head-on collisions will be diminished and thus the risk of a fire. The traffic ahead of the accident will be able to escape quickly and traffic behind the accident can escape through the other tube if passable crosspassages are installed. In the case of longitudinal ventilation the people behind the accident will get fresh air to breathe. In the case of multiple accidents or queues in one-way traffic tunnels care should be taken not to use longitudinal ventilation. Transversal ventilation in one-way traffic could pose a problem for cars behind the accident, in case of congestion behind the accident and eventual mixing of smoke with the air. In case of congestion in front of the accident the same applies. (2) One tube – one-way traffic One-way traffic in only one tube can be impractical for transport reasons. The reason for using this construction is to limit head-on accidents.

Current Considerations in the EU countries on Future Developments in the Fire Scenarios for Traffic Tunnels within the DARTS project
Technical report Part 1 ‘Design Fire Scenarios’ 127/161
(3) Truck-lanes When large climbing slopes are present it can be useful to create an extra truck-climbing lane. This could reduce the risk of collisions because of large speed differences between trucks and cars, and would avoid a negative impact on the maximum servicing level. (4) Speed limitation and control A speed limitation should have as a goal to limit people's speed inside the tunnel and control would be present in order to ensure that people follow the speed limit. A clear warning about this should be marked at the entrance of the tunnel. The limitation and control of speed would limit the number of (large) accidents. (5) Obligatory distances to other vehicles An obligatory distance between vehicles could be made by indicating distances to be held by paintings on the road. The controlling of the distances would ensure that these are held. This would decrease the number of accidents. A possible positive side effect of this would be created if the cars then would be able to stop at the distances they had held. This could decrease the total size of the fire by decreasing the risk of fire spread from car to car. (6) Interdiction to overtake An interdiction to overtake could be created for HGV’s and buses or for all vehicles. This will decrease the number of accidents caused by overtaking and changing lanes. This could easily be done by creating white lines on the road surface. (7) Wide lateral clearance The right lane can be made wider in order to give more space to HGV's. Wide lateral clearance will ensure that the vehicle will not bump into another vehicle or the wall in case of small sideways movements, either accidental or in order to avoid objects. These could also be constructed as emergency lanes. In tunnels with dense traffic an emergency lane can have the same use as a wide lateral clearance and thus allow rescue vehicles to reach an accident site. (8) Wall coating Walls should be coated in such a way that the reflection of light will be sufficient all over the tunnel. This is important at the entrance of the tunnel where there often is a dark spot. Lights and roof constructions could also be designed to avoid the dark spot. (9) Lay or turning by's Lay or turning by's will allow vehicles to stop on other places than in the road in case of a problem. They will also facilitate the turning around of vehicles in case of a fire further ahead (this may in some cases not be recommendable).

Current Considerations in the EU countries on Future Developments in the Fire Scenarios for Traffic Tunnels within the DARTS project
Thematic Network Fire in Tunnels
128/161
Observation period AADT t R
ural
/urb
anbi
- /un
i dire
ctio
nal
mou
ntai
ntun
nel
Name, Country years vh/day PV HGV all LVAmberg A 5 14795 0 R bTauern A 5 12329 0 R b mKatschberg A 5 10685 0 R b mPfänder A 4 9863 0,7 R bPerjen A 5 8219 0 R bArlberg A 5 4658 2,5 R b mGotthard CH 7 10137 3 R b mSan Berardino CH 20 4658 5 R b mChamoise F 5 23288 1,5 22,6 6,8 R bl'Epine F 8 15890 0,6 40 1,1 R bMont Blanc F/I 8 5205 1,5 12,9 5,4 R b mFrejus F/I 12 2740 3,5 12,7 8,6 R b mKan-etsu J 11 20000 1,5 R b mEllingsøy N 3 3014 0 R bValderøy N 3 2466 0 R bFlekkerøy N 2 822 0 R bHvaler N 2 548 0 R bWindö S 5 4384 0 R bBelchen CH 9 30137 1 R u mSeelisberg CH 7 11507 2 R u mSt.Germain de Joux F 3 16438 0 3,4 8,1 R uVuache F 4 13151 3 0 2 R uChatillon F 3 16438 10,4 0 8 R uAguas Santas P 1 20822 0 R uKarra S 5 21096 0 R uSorvik S 5 21096 0 R uAskloster S 5 10959 19 R uDullin F 8 20000 1,6 0 1,3 R uHyppolyte CDN 5 109589 0 UVille Marie CDN 4 78082 0,3 UElbe D 2 101370 6,3 24,6 9 UFourviere F 7 95616 1,8 1,9 1,81 UCroix Rousse F 7 80548 2 0 1,8 UVieux Port F 6 65479 2 0 1,8 UOslo N 4 50137 2 UCoen NL 3 82192 0 UBenelux NL 3 68493 0 USöder S 5 70137 0,7 UFredhall S 5 100822 0 UKlara S 5 26301 15,5 UKarlberg S 5 26301 0 UTyne UK 6 26575 25 ULincoln USA 5 104932 15 UQueens USA 3 72329 14 UBrooklyn Battery USA 3 57534 23 U
Fire rates per 100 mill vh-km
Table 4.1: Fire rates in road tunnels (PIARC, 1999 [132, 36])

Current Considerations in the EU countries on Future Developments in the Fire Scenarios for Traffic Tunnels within the DARTS project
Technical report Part 1 ‘Design Fire Scenarios’ 129/161
(10) Double electrical appliances The electrical appliances are designed in such a way that in the case of an error on one of the generators a second generator assures that at least half of the lights and appliances are working. The generators should be independent and eventually situated on opposite sides of the tunnel. The systems should also be connected to an emergency generator. (11) Middle barrier in tunnel A barrier between lanes in a two-way tunnel would allow the accident to be kept on one side of the tunnel and avoid head-on collisions. However this puts requirements on the height and the stiffness of the barrier. (12) Middle barrier before entrance At the entrance of the tunnel a barrier separates the tunnel tube coming out and the tunnel tube going in. This is to ensure that no cars will go into the wrong tunnel tube. This middle barrier could also be constructed as a moveable barrier. This will allow the lanes to be changed and traffic through the tunnel to continue if one of the two tubes is closed. (13) Cables under the road surface All electrical cables can be present under the road surface and thus be completely separated from the traffic lanes. This allows all maintenance to be performed without closing off the tunnel or disturbing the traffic. (14) Signs Correct and appropriate signs should be present through the entire tunnel in order to avoid accidents and allow safe escape. An attempt should be made to improve and standardise road-signing systems at international level. (15) Traffic control system There is a traffic control system present to control the traffic in case of a break down or an accident. Within a number of seconds this system will allow the traffic to be stopped and all present measures to be taken. (16) Appropriate lights Appropriate lights, both emergency and normal lights should be present in the tunnels in order to decrease the risk of accidents and in order to allow safe escape. (17) Road surface The road surface should be designed in such a way that the evaporation surface of an eventual spill of dangerous goods is limited. The road surface could also be made inclined in order to allow the spills to be drained.

Current Considerations in the EU countries on Future Developments in the Fire Scenarios for Traffic Tunnels within the DARTS project
Thematic Network Fire in Tunnels
130/161
(18) Leakage draining This should be present in order to drain rain, cleaning, extinguishing, and leakage water but also in order to drain eventual dangerous liquids that have been released. The number of victims can be decreased with drainage especially for motor vapour cloud explosions. For a normal pool fire the effect has shown to be smaller. (19) I-com: Alarm phone centrals Alarm phone centrals along the tunnel at appropriate distances would allow the operator to be informed of the fire at an early stage. (20) Safety officer All tunnels above a certain length, for example 1000m, should have a safety officer. The safety officer should be responsible for the planning and organisation of the emergency operations, the training of staff, and the organising of emergency exercises with the emergency services. (21) Emergency button An emergency button should allow the tunnel operator to start a pre-programmed emergency plan. This will avoid panic by the tunnel operator and ensure a correct handling of the accident. (22) Too low speed control A measuring system to measure when the velocities of the cars are below a certain limit (for example 15m/s) could be present. An automatic alarm will then allow the incident to be looked at with a CCTV and alarm the tunnel operator. (23) Automatic alarm system An automatic fire detection system could be used in order to detect the fire as fast as possible. (24) Video surveillance If a tunnel is surveyed with video surveillance the possibility of early detection of a fire or an accident exists. The early detection of the severity of an accident or a fire following an alarm will also be made possible with this measure. (25) Heavy vehicle and dangerous goods traffic The limitation or total stop of heavy vehicle or dangerous goods traffic would decrease the risk of a large fire. The heavy vehicle and dangerous goods traffic could also only be allowed during certain hours where the stream of other vehicles is very low. Dangerous goods should in any case not be in a tunnel at the same time as other vehicles in order to limit the risk of collision and to limit the consequences of an accident. The number of dangerous goods traffic vehicles that ride through the tunnel at the same time should also be strictly limited. Another possibility is to have separate lanes / tubes for personal vehicles and heavy (not dangerous) goods vehicles. This could decrease the risk and / or the consequences of an accident. (26) Extinguishers Hose or / and hand extinguishers should be present at appropriate distances in the tunnel. These are useful in order to stop a beginning fire. According to statistics from PIARC 3 out of 5 fires can be extinguished using hand extinguishers.

Current Considerations in the EU countries on Future Developments in the Fire Scenarios for Traffic Tunnels within the DARTS project
Technical report Part 1 ‘Design Fire Scenarios’ 131/161
(27) Sprinklers The goal of using sprinkler systems is to discover a fire in its early stages and to react immediately in order to limit or to extinguish the fire. In tunnels the cooling down of walls could also be accomplished by using sprinklers. In the early stages of a fire the temperature will increase. Liquid in a glass container in the sprinkler head will expand and the glass will brake, i.e. the sprinkler will be activated. A sprinkler can generally reach an area of 6 to 20 m2 and normally commercial sprinklers available have flows around 0.1 m3/min but there are sprinklers that have capacities up to 0.4 m3/min. There are different kinds of sprinklers: Most of the sprinklers used in buildings in the Netherlands are so called "Wet" sprinkler systems, i.e. they are continuously filled with water and will be activated directly when the glass breaks. For areas where the freezing point can be reached so called dry systems can be used. In these systems all pipes are filled with dry air, when a fire is detected the water will be released into the pipes and the sprinkler will be activated. Pre-action sprinklers are a third kind of sprinklers. These can be used in rooms where water damage is highly unwanted. When a fire is detected the pipes fill with water, if the glass breaks the sprinkler will start. If the glass is damaged by accident there will be no water in the pipes and thus no water damage to the room will be caused. The fourth kind of sprinkler systems is so-called deluge sprinklers. With this system all sprayers will start functioning at the same time. This system is suitable for areas where the fire propagation is expected to be extremely rapid. Another kind of sprinkler systems is the so-called mist systems. Mist systems are sprinkler systems that discharge water in form of a mist pattern. This increases the vaporised surface of the water and demands less water than other sprinkler systems. The advantages are: a) Early detection and extinguishing attempt of fire: A sprinkler is as said above designed to react
automatically in case of fire. It will be able to extinguish or limit a beginning fire before the firemen arrive.
b) Reaching the fire: In the case of tunnels where heavy smoke and high temperatures might make it difficult for firemen to reach the fire source sprinklers are generally situated so that they will be able to reach the source of the fire.
c) Limitation of fire size or development: Early detection and early extinguishing attempt will imply that the development of the fire will be slowed down and hopefully also the fire size and duration.
d) Limitation of damage: By limiting the development of the fire the duration of the fire can be limited and the structure of the tunnel will be subjected to less harsh conditions. A sprinkler system will also generally use less water than a fire department to extinguish a fire.
Some disadvantages a) Defect systems: If a system (a normal wet sprinkler) is activated by a defect such as breaking
of the glass, water will be sprinklered into a tunnel with a possibility of causing an accident. If correct service is given to the sprinklers and the conditions around the sprinklers are considered these problems can mostly be avoided. An example of incorrect consideration would be an installation of a sprinkler close to a heating unit where temperatures can rise above the breaking temperature of the glass.
b) Cooling of smoke and thus smoke mixed with air: The cold water particles will cool down the smoke and prevent stratification. The smoke will quickly mix with the underlying smoke-free air and prevent escape.
c) Limitation of visibility with evaporating water: When the sprinkler system is activated on an already large fire a large amount of water will be evaporated and thus the visibility will be further diminished.

Current Considerations in the EU countries on Future Developments in the Fire Scenarios for Traffic Tunnels within the DARTS project
Thematic Network Fire in Tunnels
132/161
d) Fires that will develop inside a car: Fires that develop inside a cars will generally be fully developed before they will be able to break out of the cars. The sprinkler system will only be able to reach the fire when it is outside the car and will not serve its' purpose which is to limit the size of a small fire
e) Evacuation of water needs to be treated: The sprinklers will create an amount of water inside the tunnel and facilities to evacuate the water should be provided. These facilities are usually available.
f) Dangerous goods: Sprinklers will not have an effect on fires that develop to large fires immediately because they will be expected to break down after being subjected to a certain amount of heat.
Conclusion: If escape routes and lights are available that allow rapid escape of persons inside a tunnel a well -serviced and accurate sprinkler system can be a good way of limiting damage done to the structure of the tunnel for some -but not all- types of fire. (28) Inflammable materials Care should be taken that all materials used in the tunnel are inflammable and/or do not give away any toxic gases when burning / heated. (29) Extinguishing water supplies On both sides of the tunnel there should be enough water, through reservoirs and public water appliances to ensure the extinguishing of the fire. (30) Regulate internationally dangerous goods At the moment there are differences in the regulation of dangerous goods through tunnels within and between countries. In [safety in tunnels; transport of dangerous goods through tunnels] the following system is presented. Every type of dangerous goods is classified in a group from little to very dangerous. Tunnels are to be classified according these groups, so it is known which dangerous goods are allowed and which are not. Whether this particular system is accepted or not, there is a need to harmonise regulations nationally and internationally. (31) Thermal Isolation Isolation can be placed in the tunnel in order to protect the structure of the tunnel against the heat during a fire and in order to decrease the total structural damage. (32) Concrete Alignment With tunnel alignment one means the vertical and horizontal alignment. Vertical alignment should not be too large in order to allow traffic flow freely, including for HGV’s. It has been shown that 60-70% of HGV fires are caused by overheated breaks (PIARC). However in the same document it is said that the number of fires caused by breakdowns tends to decrease and the number of fires caused by accidents tends to increase. Horizontal alignment should be kept to a minimum so that the tunnel users can see the entrance and exits as long/as soon as possible. (33) Height detection heavy goods vehicles At a suitable distance before the entrance of the tunnel the height of the incoming vehicles could be checked. The trucks that are too high can then be stopped with red lights or barriers before the tunnel in order for them to choose another route. This can be done in order to limit the damage on sensitive installations on the ceiling of the tunnel such as video cameras, loud speakers, ventilation etc.

Current Considerations in the EU countries on Future Developments in the Fire Scenarios for Traffic Tunnels within the DARTS project
Technical report Part 1 ‘Design Fire Scenarios’ 133/161
(34) Correct maintenance Correct maintenance of roadways, walls, ceilings, fire extinguishers, signs etc. should be ensured in order to avoid the risk of an accident and in order to allow early extinction of a fire and safe escape. (35) Entrance control Entrance and exit control means to have control and eventual resting time for vehicles at the entrance of the tunnel. This would be mainly be applicable for tunnels in high altitudes where vehicles can have over-heated because of driving on long slopes. The goal of this measure would be to decrease the risk of a fire in the tunnel. (36) Escorting dangerous goods vehicles Escorting dangerous goods vehicles will almost limit accidents caused by crashes with DG vehicles involved to zero. It will also allow an eventual fire to be detected immediately. This will however not reduce the consequences if there is a fire with dangerous goods vehicles involved caused by self-ignition of the motor or a crash. (37) Ventilation There are two main reasons to ventilate tunnels: pollution reasons and fire reasons. This document treats only the fire reasons. Ventilation for pollution reasons will normally not be needed in one directional traffic. An air stream from the entrance to the exit will be created naturally with the traffic. Ventilation will only be needed during low velocities, congestion, and large densities of traffic or for long tunnels. The danger of fire will normally be a main criterion for choosing and dimensioning the ventilation system. Ventilation should be applied during a fire in order to keep escape routes free from smoke and to create possibilities for the fire brigade and others to reach the accident site. Mechanical ventilation will also lead to a full burning of the fire. Thus the total duration of the fire will be limited and the structure will not by subjected to a high thermal load concentration. The fire situation can also be estimated to be the probability of a fire multiplied by the consequences of a fire. The probability of a fire will be determined by the road situation, the tunnel length, the geometry of the tunnel and the velocity of the traffic. The consequences of a fire will be decided by the traffic density (HGV density), the escape routes, and the geometry of the tunnel. a) Smoke movement During fire tests in the Memorial tunnel it was said that smoke mixed with air after 3 to 5 minutes
for fires with intensities of 50 W respectively 20 MW. Stratification was mainly seen for fires with intensities 5 - 10 MW. During larger fires the smoke will fill up the cross-section of the tunnel relatively fast (within 5 minutes).
The influence of wind is that of longitudinal ventilation. It will be larger in short tunnels than in large.
For smoke in long tunnels it will have to be taken into consideration that at a certain distance from the fire smoke will mix with air. This is why ventilation in long tunnels is necessary.
In short tunnels the smoke caused by a fire can most of the time escape before it will stagnate and ventilation will not be necessary.
b) The desired behaviour of the road user in case of fire The users are expected to attempt to extinguish the fire and then escape. When no ventilation is
available the time to escape will be low and the escape routes should be designed taking that into account.
c) Tunnel Character The consequences of a fire in a tunnel will depend on the tunnel type, depending on size,
placement (water around or not) and replaceability of the tunnel. The fire extinguishing strategy should be designed thereafter.

Current Considerations in the EU countries on Future Developments in the Fire Scenarios for Traffic Tunnels within the DARTS project
Thematic Network Fire in Tunnels
134/161
Another important aspect is the formation of queues by the tunnel. If cars will be stuck in front and behind the fire, ventilation will not help people to escape safely. In this case it is suggested that a number of small tunnels without ventilation is preferable instead of long tunnels. It is stated that in France this problem is solved by creating an opening in the roof every 800 m to which the ventilation will direct the smoke.
d) Possible Ventilation Systems Depending on the type of ventilation used, the structure of the tunnel will have to be adapted. If
for example longitudinal ventilation is used care should be taken to make a higher tunnel so that the free passage height under the ventilators is not decreased.
Transverse Semi -Transverse Longitudinal Openings in roof with or without mechanical exhaust A) Transverse While using transverse ventilation the air in the tunnel will have a movement perpendicular to
the traffic direction. The air will be blown in and exhausted through separate air-channels. This ventilation will almost always be influenced by the traffic. The exhaust will almost always become limited during a large fire.
B) Semi-Transverse This is a combination of longitudinal and transverse ventilation. The air will be blown in all over
the tunnel and will escape through both exits of the tunnel if no longitudinal streams are present. If longitudinal streams are present air will also enter through one end of the tunnel and all air will exit through the other end. Also in this case a longitudinal stream caused be a fire will be difficult to manage. According to Ineris [ref] semi transverse ventilation can lower the number of victims with a factor of two in small fires, during large fires the effect will be lower.
C) Longitudinal The tunnel will be used as a ventilation channel. The air will be blown in through the entrance
portal and exited through the exit portal. The ventilation can also be turned around. This will be a good way of ventilating in one-directional tunnel if there is no second accident or no congestion. According to Ineris [ref] longitudinal ventilation can result in a substantial decrease in number of victims in both small and larger fires.
D) Openings with or without mechanical ventilation This means to separate the tunnel into smaller sections and will permit to evacuate the smoke
through the closest exits. e) Border between long and short tunnels Based on a literature review borders between different kinds of ventilation systems can be
found. It can be seen that maximum tunnel length where ventilation is not needed is up to 800 to
1000m. It is clear that for tunnel lengths below 250 – 300 m and fire intensities below 50 MW no forced
ventilation is needed. A smoke free layer will always be present in these conditions. In these cases it is also considered that escape is possible. To not have ventilation will be to accept that there will be a risk that the tunnel will not be able to be repaired after a fire. One should always decide if this is acceptable or not.
The use of longitudinal ventilation will always be limited with the risk of a second accident and queues, a maximum value of 4 km for tunnels in the countryside for fires without extreme intensities is suggested. In more dense population areas a value of 800 - 1000 m is suggested.
The pollution criteria will also be important concerning longitudinal ventilation in very long tunnels. In the Netherlands no very long tunnels are present and this aspect is not considered further in the above mentioned study.
f) Suggested Guidelines A summary of the suggested guidelines for the Netherlands is presented here.

Current Considerations in the EU countries on Future Developments in the Fire Scenarios for Traffic Tunnels within the DARTS project
Technical report Part 1 ‘Design Fire Scenarios’ 135/161
For tunnels that are shorter than 250 m no mechanical ventilation is necessary. However escape routes will have to be designed accordingly.
For tunnels longer than 500 to 600 m mechanical ventilation is always necessary and longitudinal ventilation is suggested. For lengths between the two: - The design without ventilation should be studied - The design with ventilation should be studied - The safety gains and extra costs should be studied and compared. In cases where a lot of traffic is present and the probability of queues is large one could consider transverse ventilation, it is stated that however this should be considered with hesitation because the reliability of this system is limited. A possibility would be to cut the tunnel into smaller sections. For very long tunnels the pollution criteria can become very important and ventilation openings can become a good solution. In order to calculate the number of needed ventilators the following should be considered: A critical air inflow of 88 m3/s is suggested in order to allow total burning of a 300 MW fire and a critical airflow velocity needed to avoid back layering in the case of a 100 MW fire. Interesting tests on ventilation have been done in the Memorial tunnel in West Virginia, USA. This tunnel is a two-lane 853 m long mountain tunnel having a 3.2 % upgrade from the south to the north tunnel portal. The cross sectional area of the tunnel is approximately 36 m2 with the ceiling and 60.4 m2 without the ceiling. A short summary of some results: - Longitudinal ventilation system The thermal effects of a fire can significantly reduce tunnel airflows from non-fire conditions. Air flow reductions of 10 % (10 MW fire) to 50 – 60 % (100 MW fire) were seen. Fans positioned 50 m downstream of the fire were subjected to 200 ºC (20 MW fire), 330 ºC (50 MW fire), and 670 ºC (100 MW fire). This condition should be considered in the ventilation system design. 2.5 -3 m/s were sufficient velocities in order to avoid backlayering of the smoke. - Transverse ventilation Single zone balanced full transverse ventilation (0.155 m3/s/lm) was ineffective in smoke and heat management for 20 MW fires and higher. Balanced ventilation allowed no control of longitudinal air velocity in the tunnel and very little smoke management was possible. Single zone unbalanced full transverse ventilation generated some longitudinal airflow in the tunnel. However there is no control of the direction in the longitudinal airflow the effectiveness is very sensitive to the location of the fire in the tunnel. Multiple zone ventilation systems can enhance the effectiveness of full transverse ventilation since the tunnel is divided into multiple zones and the direction of the longitudinal airflow can be selected. Multiple zone transverse ventilation consisted in this case of blowing in air uniformly over the north part of the tunnel and exhausting air uniformly over the south part of the tunnel. - Enhancements to transverse ventilation system Localised extraction is possible with the application of single point extraction (SPE) openings and oversize exhaust ports. Smoke and heat drawn from the fire to the SPE could pass over or possibly around stalled traffic. A SPE located upgrade of the fire showed to be effective in temperature and smoke management. If the SPE was located downgrade of the fire only minimal improvement was achieved. - Smoke and heat movement The spread of hot gases and smoke was significantly greater with a larger fan response time. Fan response time should thus be minimised, since hot smoke layers tend to spread very quickly. Natural ventilation resulted in extensive spread upgrade of the fire but relatively clear conditions downgrade of the fire. The smoke and hot gas layer migrating along the arched roof did not descend into the occupied zone as quickly as in the tests with the ceiling in place. The effectiveness of tunnel lighting systems having fixtures mounted near the ceiling will be quickly degraded decreasing visibility and seriously compromising evacuation capability. - Design and operation conditions

Current Considerations in the EU countries on Future Developments in the Fire Scenarios for Traffic Tunnels within the DARTS project
Thematic Network Fire in Tunnels
136/161
The results have shown that ventilation systems that combine extraction with longitudinal airflow are highly effective in temperature and smoke management. Longitudinal airflow has shown to be as important as extraction rate. (38) Portable ventilation fans Portable ventilation fans can be useful in tunnels where no ventilation is available, as in a short tunnel. They can be used in order to allow the rescue services to reach the fire source and not be disturbed by the smoke. (39) Asymmetric Openings A certain distance or large barriers can separate the two tunnel openings in order to avoid smoke coming out of one tunnel tube to be sucked into the adjacent tube. (40) Accident signalisation lights / beams Beams and red-lights can be activated when an incident has taken place inside the tunnel. These should be visible even in the beginning of the fire when smoke will spread over the ceiling. Red lights should also be situated on the sides of the roads for this purpose. Beams that close would allow stopping traffic and avoiding congestion of traffic at the accident area. This will also limit the size of the fire and the severity of the accident, by limiting the number of vehicles involved in the fire and the number of casualties. (41) Automatic Vehicle Identification By using a GPS or similar system, dangerous goods vehicles could be positioned and their goods can be identified. This way a tunnel operator will always be aware of the position of the vehicle in the tunnel and the kind of goods that the vehicle is carrying. (42) Pressurising system escape routes Escape routes can be pressurised in order to avoid that smoke will come into the escape routes. Care must be taken in order to mark that the door really is open so that the escaping person does not get the impression that the door is closed because of the extra pressure needed to open the door. (43) Escape routes and rooms Escape routes should be designed as simple and logical as possible, clear simple marks should be available in order to show what route to follow. No obstacles should be present on the floor. Care should be taken into the fact that tunnel users will escape through the tunnel side they came in through, especially if the exit can be seen. No dead-ends should be indicated, other than in the case of escape rooms. Escape rooms at appropriate distances along the tunnel will allow stranded people in the vicinity of the fire to get away from the fire into a shelter and is mainly used in longer tunnels where no possibility to create separate escape routes is possible. This shelter can be ventilated depending on the length of the tunnel and the traffic through it. Ventilation will be necessary if a very long fire is expected. These shelters should be present at appropriate distances along the tunnel. Closer exit spacings will allow a decrease in the number of victims. After the accident in Mont Blanc where a number of people died in such shelters it has been recommended not to construct these anymore. (44) Emergency lights

Current Considerations in the EU countries on Future Developments in the Fire Scenarios for Traffic Tunnels within the DARTS project
Technical report Part 1 ‘Design Fire Scenarios’ 137/161
Emergency lights should be visible and placed both on the ground and on the walls in order to allow safe escape of persons in the tunnel. They should not only be placed high up because smoke spread early in a fire will impair visibility on the roof. (45) Middle Escape Tube / Crossings In a one way tunnel with two tubes, middle escape tubes can be constructed. Escape will be facilitated because of simple escape to the tube next to the one way tube. Escape tubes can be constructed in between the two tunnel tubes. These escape tubes could allow safe escape of persons nearby the fire and allow the rescue services to reach the middle of the tunnel. In case of a middle escape crossing care should be taken to stop the traffic in the opposite tube in order to avoid that no other accidents are created. (46) I-com: Communication with persons in shelters Communication with persons stranded in shelters using for example intercom installation, telephones or television systems would be a way to avoid panic in the shelters and keep persons notified of what will happen and actions that should be taken. (47) I-com: HF-Radio HF-radio could be used for the communication with firemen and rescue services. (48) I-com: Radio messages Radio messages in different languages could be transmitted throughout the tunnel with general information about the tunnel, the exit roads, speed limits, etc. This will keep the driver informed of the exit possibilities as well as any problems in the tunnel. (49) I-com: Loud-speakers Loud speakers have the same benefits as radio messages but will mainly be useful during an accident in order to reach persons in and outside vehicles. (50) Signs marking distance to exit Signs marking the distance to each exit will allow people stranded in the vicinity of the fire to decide which exit is the nearest way out. (51) Automatic measuring systems Automatic CO and soot measuring systems will give information about the gas content in the tunnel continuously. This measuring system can give information on when the ventilation needs to be switched on. (52) No entrance when queues Traffic lights could be set-up at the entrance of the tunnel to avoid congestion in the tunnel. This could limit the number of victims in case of a fire. (53) Communication with firemen

Current Considerations in the EU countries on Future Developments in the Fire Scenarios for Traffic Tunnels within the DARTS project
Thematic Network Fire in Tunnels
138/161
The local fire brigade should be aware of the design of the tunnel and how to act in case of an emergency. Contact should be kept with tunnel staff at all times during the fire in order to be informed of number of stranded users, ventilation conditions, etc. (54) Information campaigns Information campaigns should cover the correct behaviour of road users when approaching or in tunnels. This should also cover the actions to take in case of emergency. (55) Driving tests Driving tests and lessons for all classes of drivers should include correct behaviour in tunnels. For professional drivers this should also include regular tests and information about extinguishing equipment. (56) Information at / before entrance Information slips can be given out at the entrance of a tunnel, for example at a paying station. These information papers should include how to react in the case of a fire, including where one should go for safe escape. Information boards, such as publicity boards, could be placed along the road before the tunnel in order to point out main aspects such as "By red light in tunnel stop", "Keep your distance" etc. (57) Emergency plan Every tunnel should have an emergency plan, which includes the actions to take during a fire that should be designed together with the appropriate organisations, such as police or fire brigade. This includes emergency exercises at regular intervals. A delay of action from 1 to 11 minutes will, depending on the scenario and the tunnel decrease the number of victims with a factor of 20 to a factor of 0 according to [document Ineris]. (58) Instruction and training personnel All personnel should know what to do in case of an emergency. This should include items such as calling the fire brigade, switching on ventilation system or not, and communication to tunnel users etc. (59) Dragging out burning vehicles The burning vehicle can be dragged out of the tunnel in order to limit the damage inside the tunnel. (60) Transport vehicle for victims under road surface in tunnel tube A small vehicle can be used in order to get victims out of the tunnel tube as fast as possible. This vehicle can (in the case of a bored tunnel) be placed under the main road surface in a space that connected to the traffic tube through emergency exits. The parameters described in this section in addition to the natural fire curve and the information of the fire characteristics section can be used to propose a ‘design natural fire curve’.

Current Considerations in the EU countries on Future Developments in the Fire Scenarios for Traffic Tunnels within the DARTS project
Technical report Part 1 ‘Design Fire Scenarios’ 139/161
4.1.4.3 Safety measures for metro carriages London Underground Ltd present a number of measures that it takes in order to minimise the risk of fire in its underground trains [132]. These can be categorised in the following groups: (1) Avoid use of combustible materials (2) Avoid ignition sources – the most common ignition sources are sparks and incandescent particles from e.g. current collector shoes, brake blocks/wheels; brief sparking and overheating (3) Extinguish the developing fire (4) Contain the fire (5) Remove the combustion products (6) Minimise escape time
4.2 Effect of ventilation on rate of heat release during fire tests in the Second Benelux road tunnel 4.2.1 Fire development for cars [132, 135] The Figure 4.2 shows the measured RHR for two car fire tests, Test 6, without ventilation and Test 7, with a ventilation velocity of about 6m/s. Identical cars were used in Tests 6 and 7: Opel Kadetts circa 1990 with 25-30 litres petrol in the petrol tank.
0
1
2
3
4
5
6
0 5 10 15 20 25 30 35 40 45 50Time (minutes)
Rat
e of
hea
t rel
ease
(MW
)
Test 6 no ventilation
Test 7 6m/s
Figure 4.2: Fire development for cars [132, 135]
The fire development is apparently affected by the longitudinal ventilation. The tests show that the Rate of Heat Release (RHR) is considerably lower with 6 m/s air velocity compared with no ventilation during the first 20 minutes. After about 38 minutes from ignition in the test with 6 m/s air velocity a new RHR-peak is reached probably because the windows in the back of the coupé were smashed and the entire coupé became engulfed in flames.

Current Considerations in the EU countries on Future Developments in the Fire Scenarios for Traffic Tunnels within the DARTS project
Thematic Network Fire in Tunnels
140/161
The video analysis of the tests shows that when the fire is ignited at the front of the vehicle, the ventilation hinders the spread of fire to the rear of the vehicle. However, the conclusion that the fire development is delayed by ventilation cannot be drawn because the influence of the location of fire ignition has not yet been researched. Attention should be given to the fact that the observed fire behaviour does not rule out the possibility that a fire starting at the rear of the vehicle will not spread faster along the vehicle due to the effect of the wind. 4.2.2 Fire development for vans A number of fire tests on van mock-ups were performed in Test 8 to Test 10 (see Table 4.2 below). The measured heat outputs for these tests are shown in the Figure 4.3 below.
Material Ventilation (m/s)
Test 8 790 kg wooden pallets & 4 tyres under a canvas covering None
Test 9 As for Test 8 4-6 Test 10 As for Test 8 6
Table 4.2: Fire loads within the Second Benelux Tunnel tests [132, 135]
0
5
10
15
20
25
0 5 10 15 20 25 30 35 40Time (minutes)
Rat
e of
hea
t rel
ease
(MW
)
Test 8 no ventilation
Test 9 4-6m/s
Test 10 6m/s
Figure 4.3: Fire development by vans [132, 135]

Current Considerations in the EU countries on Future Developments in the Fire Scenarios for Traffic Tunnels within the DARTS project
Technical report Part 1 ‘Design Fire Scenarios’ 141/161
Test 10 was a repetition of Test 9 and shows that the observations due to activating ventilation are well reproduced by Test 10. Test 9 and 10 can be compared to Test 8. The influence of ventilation is primarily noticeable by its effect on the fire development during the initial stages. The fire development with ventilation (5-6m/s) appeared to be 2-3 times faster than the development without ventilation. The maximum heat output was about 1.2-1.5 times higher. A comparison with the prediction of Carvel et al. [ref] shows that the maximum power does not increase by a factor 8, but rather by a factor 1.2 to 1.5. Also, the fire growth was not 20 times faster, but only 2-4 times faster. Even the predictions of the ‘experts’ was on the conservative side. 4.2.3 Conclusions from the Second Benelux tunnel tests A comparison of measured heat output with theory shows that the actual speed of fire development and the final fire size considerably deviate from the model proposed by Carvel et al. This is probably caused by the fact that the theory was based on tests in small tunnels where the effects due to tunnel geometry are significant and that increased velocity result in more effective heat transfer from the flames to the fuel surface (e. g. tilted flames enhance the flame spread) and more effective transport of oxygen into the fuel bed leading to the enhancement of the mixing of oxygen and fuel. The fire may be locally under-ventilated under normal conditions (e. g. wood cribs or densely packed goods) but in a forced ventilation flow the transport of oxygen to the under-ventilated regions enhances the combustion rates. In a traffic tunnel such as the Benelux Tunnel there is a large amount of oxygen already available and the availability of oxygen is not increased by the ventilation. At the same time, the ventilation has a cooling effect on the fire environment whereby the heat can be easily given up to the environment. Ventilation has an influence on the fire development that does not always conform to expectations: (1) Due to increased ventilation the fire development for a car can be slowed if the fire is ignited at
the front of the car. This is in contrast to the accepted view of supposed accelerated development due to ventilation.
(2) Attention should be given to the fact that the influence of increased ventilation on the observed fire behaviour depends on the ignition location. It should be noted that 95% of fires begin in the engine, i.e at the front.
(3) Under the influence of a high ventilation velocity, the fire development accelerates for a load under a covering at a rate 2-3 times faster, and not by a factor 20 as predicted by some authors. The fire size was 20-50% higher due to a high ventilation speed.
(4) The natural variation between almost identically set-up tests, e.g. a canvas mock-up covering versus an aluminium mock-up covering, is just as big as the variation resulting from the increase in ventilation. This suggests that a general statement regarding the fire development of a vehicle is not possible, especially if different fire loads are to be considered or if the fire is ignited in the driver’s cabin.
4.3 Summary Chapter 4 describes the possibility to transform the natural fire safety concept (NFSC) from buildings to tunnels. Furthermore, the effect of ventilation on the rate of heat release (RHR) was presented for the Benelux Tunnel tests. With respect to the applicability of NFSC, the following conclusions were drawn [132 to 135]: (1) Given the relative rarity of tunnel fires, compared to building fires, there might be a lack of
statistical data to develop a comprehensive method to compare various safety measures as was done in NFSC.
(2) The objective of the NFSC is to arrive at a structural design. All safety measures are compared in terms of their effectiveness for the structural safety. In tunnels, a comparison aiming at other safety issues might be relevant.

Current Considerations in the EU countries on Future Developments in the Fire Scenarios for Traffic Tunnels within the DARTS project
Thematic Network Fire in Tunnels
142/161
(3) In NFSC, the fire load density is the only parameter that is adapted to account for the effect of other active and passive safety measures on the structural behaviour. For tunnel structures, other parameters should be adapted as well.
(4) The NFSC is based on the principle of compartmentation, i.e. the natural fire is calculated, assuming no fire spread occurs. The overall objective of the NFSC is to achieve a quantified limited risk of fire spread. In tunnels, no clear compartment can be defined, nor fire spread.
(5) Calculation of tunnel fires is not straight forward, since highly non-uniformly distributed temperatures in the tunnel develop. It requires advanced CFD calculations. However, the large-scale character of tunnel projects justifies such an advanced design approach.

Conclusions
Technical report Part 1 ‘Design Fire Scenarios’ 143/161
CHAPTER 5 : CONCLUSIONS
5.1 Introduction Fires cause additonal loads for the tunnel structure. Further tunnel fires differ often from fires of normal buildings (e.g. the rapid increase of temperature). To deal with this situation in the planning phase of tunnels several countries, organisations and participants of research projects specified special design fires. Most work was done on design fires for road tunnels, for which information was readily available especially from Germany, France, The Netherlands, Sweden, ITA, PIARC and research projects like EUREKA, Memorial Tunnel, the European UPTUN-Project and last but not least the FIT-Project itself. With regard to the railway and metro tunnels much less information about design fires was available. Sometimes it only was possible to present the German method to obtain an insight into which characteristics of the design fire should be included. This should be kept in mind when evaluating the different topics about design fires presented hereafter.
5.2 Design fire objectives The main fire protection engineering aims for the design of road and rail vehicle tunnels are: (2.1) Objectives related to life safety a) Minimise the risk of injury or death for tunnel users in the event of a fire b) Minimise the risk for people outside of the tunnel More and more also external safety is an issue. In densely populated areas, people outside
the tunnel may also be affected by the fire inside the tunnel; e.g. when buildings are present above the tunnel or when dense and toxic smoke may cause secondary incidents on roads adjacent to the tunnel.
c) Minimise the risk of injury or death for rescue teams and repair workers (2.2) Objectives related to economic consequences and to the quality of life. a) Avoid damage which threatens the load bearing capacity and resting deformations diminishing
the usability of the tunnel construction b) Avoid the need to incur expensive repair work c) Avoid long term interruption of service Depending upon the specific geographic and economic situation, the sequence of the above listed priorities may significantly change (e.g. for a tunnel predominantly used by un-manned goods trains, the high probability of a long term interruption of service may be governing the design). To meet these aims relevant design fires should be specified which allow the investigation of the influence of different realistic fires. Design fires should be suitable to satisfactorily challenge and evaluate the performance of the tunnel structure and equipment, the ventilation, evacuation/rescue of people and fire fighting. When considering tunnel safety ventilation, air capacity and evacuation/rescue, issues associated with visibility, toxic and irritant gas concentrations and convective and radiative heat transfer must be considered. Sound engineering judgement can be used to provide some insight into these issues while numerical simulations of fire and evacuation provide a more detailed evaluation. In such cases, in addition to the specification of the heat release rate, production rates of gases and particulate matter (soot) and smoke (light obscuration) must also be provided. These data can then be coupled to evacuation calculations or evacuation simulations to evaluate life safety issues. There is a difference between the concept of material testing and evaluating different fire situations concerning materials in place within the tunnel. Material testing is achieved by placing material specimens into an oven which is used to heat the specimen according to a time-temperature-curve. To assess the performance of a component in the finished structure, it is necessary to include any additional static loading that would occur when the surrounding components are also heated.

Conclusions
Thematic Network Fire in Tunnels
144/161
These can be calculated by either assuming specific temperatures as they are used for material testing or by a numerical simulation of fire described by a time dependant heat release rate and calculating the heat transfer to the tunnel structure. Attempts to meet the above criteria by design fires for different types of tunnel usages are listed below.
5.3 Proposals for design fires 5.3.1 Road tunnels If the specific fire scenario is known (e.g. truck with specific load) it is recommended to use this scenario for the consideration of the tunnel structure, ventilation, equipment and rescuing thereby taking the particular national regulation into account (e.g. the time-temperature-curves given in Figure 5.1) Ideally for a given fire scenario (e.g. a single burning car) the same (harmonised) fire curve should be used together with different resistance times depending on the relevance or importance of the tunnel (or its damage or collapse). At the moment from the curves listed by the World Road Association (PIARC) and the International Tunnelling Association (ITA) the Dutch RWS-temperature-curve includes the most stringent temperature requirements (Figure 5.1).
0
200
400
600
800
1000
1200
1400
0 30 60 90 120 150 180Time since fire started [ minutes ]
Tem
pera
ture
[ °C
]
[ 1 ] ZTV-ING
[ 2 ] RWS (Rijkswaterstaat)
[ 3 ] HC (Hydrocarbon)
[ 4 ] HC (increased)
[ 5 ] ISO
[ 1 ]
[ 2 ]
[ 3 ]
[ 4 ]
[ 5 ]
Figure 5.1: Time-temperature-curves according to different regulations for road tunnels
When using heat release rates (HRR) instead of time-temperature-curves for calculating structural stresses due to a fire a rapid increase of the heat-release-rate should be used as it was observed e.g. in the Runehamar tests in Norway in late 2003. This phase should be followed by a constant heat release rate according to the type of vehicle which is investigated. This often will be an HGV

Conclusions
Technical report Part 1 ‘Design Fire Scenarios’ 145/161
fire scenario. The heat release rate within this scenario will be determined by the type of load which is allowed to pass through the tunnel as well as by the ventilation conditions. For the subsequent decay of the fire a linear or steeper decrease should be used. The duration of the constant heat release rate is determined by, for example, the burning load and the possibilities of fire fighting (e.g. the arrival time of the fire brigade). For equipment testing the use of the equipment in the road tunnel must be considered. At the very least, the equipment must be able to function for the duration of the anticipated escape and rescue time. It also must be considered that equipment in the direct fire zone can not withstand the fire for a very long time (e.g. lighting). For dimensioning the air capacity of the ventilation system the capacities quoted in the national regulations should be used. When anticipating particular situations like the burning of large HGV loads (Runehamar tests) numerical simulations of the fire have to be evaluated with regard to the emerging smoke flow. 5.3.2 Mainline railway tunnels For main railway tunnels, the primary focus of design fires should be the representation of fires in passenger trains. This is where the greatest threat to life will occur due to the number of people involved. The choice of design fires depends on the nature of the rolling stock which varies from country to country. When stringent fire resistance regulations have to be obeyed (e.g. DIN 5510, BS 6853) a less severe fire may be considered. In Germany for structural purposes the EBA-time-temperature-curve is specified with a maximum temperature of 1200 °C (Figure 5.2). In Germany when using numerical calculations to address the propagation of smoke and gas during the evacuation phase a time dependent heat release is also specified (Figure 5.3). The specification of this heat release rate has to be accompanied by appropriate production rates of smoke and gases. For a fire involving a single German carriage which attains a maximum heat release rate of 25 MW after 25 minutes, the smoke flow may be as high as about 93 m³/s in the fully developed fire phase. For more recently designed and built carriages according to DIN 5510 or EN 45545 a smaller heat release rate of 6 MW after 30 minutes and accordingly a smaller value of smoke release rate of about 32 m³/s at this time are under discussion in Germany. When planning numerical calculations also comparison with the more recently developed heat release rates of metro carriages should be taken into account.

Conclusions
Thematic Network Fire in Tunnels
146/161
0
200
400
600
800
1000
1200
1400
0 30 60 90 120 150 180Time since fire started [ minutes ]
Tem
pera
ture
[ °C
]
Figure 5.2: Time-temperature-curve for passengers carriage fires in German mainline railway tunnels
0
5
10
15
20
25
30
0 10 20 30 40 50 60
Time [min]
Hea
t-rel
ease
-rat
e [M
W]
Figure 5.3: Heat release during a passenger carriage fire in a German mainline railway tunnel

Conclusions
Technical report Part 1 ‘Design Fire Scenarios’ 147/161
5.3.3 Metro tunnels Based on the limited experience with real fires and tests with metro carriages a time-temperature-curve to be used for structural considerations is proposed here with the following characteristics (Figure 5.4): a) maximum temperature: 1000 °C b) Incline of temperature: 200 °C/min c) duration of full fire: 45 min d) decline of temperature: 10 °C/min
0
200
400
600
800
1000
1200
0 10 20 30 40 50 60 70 80 90
time
tem
pera
ture
Figure 5.4: Time-temperature-curve for passenger carriage fires in metro tunnel
For numerical calculations addressing the propagation of smoke and toxic gases, appropriate production rates for these products must also be specified together with a time dependent heat release rate. Without further knowledge and experimental evidence, when regarding a modern metro carriage fullfilling the EN 45545 or DIN 5510 a linear increase of the heat release rate to 6 MW after a fire duration of 30 minutes and a further increase to 15 MW after a fire duration of 60 minutes may be a practical choice. Especially older carriages with less fire resistance may burn more severely so that a rapid increase to a maximum of about 25 MW within 12 to 15 minutes after beginning of the fire may be more appropriate.

Conclusions
Thematic Network Fire in Tunnels
148/161
5.4 Future work The application of modern fire engineering practice has led to significant improvements in the safety of tunnel construction and operation. Within Europe, several design fires have evolved to address different national requirements for the design and operation of the tunnel structure, the operation of emergency equipment, ventilation and evacuation/rescue. Conservative design procedures which utilise time-temperature-curves and specific emission rates for heat and smoke are complemented by sophisticated numerical analysis of both the tunnel fire and human behaviour and evacuation. However, despite our improved knowledge and understanding of tunnel fire phenomena derived from numerous recent full scale fire tests, computer simulation and practical experience gained through regrettable recent major fire incidents, further research focusing on design fires is necessary. (1) Short term goals The necessary research efforts with short term goals are summarized as follows: a) Fire spread The investigation of the conditions under which fire can spread between adjacent vehicles
should be given a high priority though the effort for this investigation will be small. Tunnels can be designed to cope with the effects from a fire involving a single car, truck or
bus. However, fire spread may cause the fire to get out of control, involving more cars, trucks, buses. The conditions under which one might expect fire spread (leakage of tanks, spread via cable canals, spread due to radiation of heat; spread as a consequence of flammable gases, etc.) need to be investigated such that preventing and mitigating measures can be developed and designed.
b) Numerical fire and evacuation simulation The harmonising of the design parameters for numerical fire and evacuation simulations
should be given a high priority though it needs a large effort. c) Structural reaction to temperature loading The harmonisation within the European Union of time-temperature-curves currently used
should be assigned a high priority. The effort for this harmonisation procedure may be small. d) Human behaviour A systematic investigation of the behaviour of humans subjected to fire in road, rail and metro
tunnels should lead to better evacuation measures. This research can be done by the detailed investigation of human performance in past fires and through the design and implementation of human based experiments.
(2) Ongoing activities On the following items the work needs to be continued: a) Verification of numerical fire simulation codes The verification should be done through the performance of additional vehicle fire tests with the special aim of measuring the production rates for toxic gases (e.g. CO, CO2, HCN, etc.), smoke particles and factors related to the light absorption by smoke (e.g. mass optical densities). The need for full-scale fire experiments is well recognised but there has only been a limited number performed (especially on rail passengers vehicles) and the data collected is not sufficent yet. There is little or no evidence available for real modern cars, buses and trucks as well as rolling stock. The effort for the necessary laboratory fire tests will be medium. They should be given a relatively high priority.

Conclusions
Technical report Part 1 ‘Design Fire Scenarios’ 149/161
b) Options for mitigating tunnel fires The activities within the UPTUN project should be continued within appropriate follow-up-projectsand focus further on the evaluation of the technological options, as well as economic consequences for taking or skipping measures, for mitigating and fighting catastrophic tunnel fires. c) Evaluation of the state of the art of the numerical fire and evacuation simulation A medium priority should be assigned to the evaluation of numerical methods. It should be linked to other fire safety areas (buildings, maritime). Distinguishment is necessary between models for - spread of fire - spread of heat and smoke - evacuation - structural integrity Capabilities to capture effects of mitigating measures such as early or delayed suppression (waterbased, foam, fixed, mobile, etc.), ventilation, insulation, smoke compartmentation (plug, curtain, galleries, etc.), operator interventions, etc. have to be included. (3) Long-term-goals The activities should focus on the coupling of numerical fire simulation with structural calculation methods. This item should eventually also be coupled to evacuation models. Also more probabilistic analyses should be investigated. It may be necessary to distinguish between scenarios for a) the construction phase and b) the operating phase, each phase related to small and large fires. (4) Funding Responsible for the necessary research work and the funding are the stakeholders involved in the design, the construction, the operation and the use of traffic tunnels and the related rolling stock like: a) the owner of the vehicle, b) the owner of the infrastructure, c) the operator of the vehicle, d) the operator of the infrastructure, e) the regulator of the vehicle, f) the regulator of the infrastructure, g) the organisation that maintains the vehicle, h) the organisation that maintains the infrastructure, and i) the represantatives of the travelling public. In tackling the items listed above the design, construction and operation of traffic tunnels for both road and rail will reach a higher safety level than achievable today.

Conclusions
Thematic Network Fire in Tunnels
150/161

Bibliography
Technical report Part 1 ‘Design Fire Scenarios’ 151/161
CHAPTER 6 : BIBLIOGRAPHY [1] PIARC/OECD: Transport of Dangerous Goods through Road Tunnels, 21st World Road Congress,
Kuala Lumpur, October 1999
[2] Falkenhainer, K.H.: Auswertung von Brandereignissen in Straßentunneln, report prepared during the training course with the Berufsfeuerwehr Hamburg, August 1993
[3] US-Department of Transportation, Federal Highway Administration: Prevention and Control of Highway Tunnel Fires; report FHWA-RD-83-032, issue: 26.07.1999
[4] Report of the Tokyo Fire Department to the Berufsfeuerwehr Hamburg, dated 30.08.1979
[5] Japan Highway Public Corporation: Report on the Nihonzaka-Tunnel-Fire and the Resauration Works, January 1980
[6] N.N.: Fire desaster in the Nihonzaka-Tunnel near Shizuoka-City, Eternit leaflet, Tunnel and Metro-Station-Cladding, Belgium, 1988
[7] Pfändertunnel, Brandkatastrophe am 10. April 1995; report of the Amt der Vorarlberger Landesregierung, Abt. Straßenbau; May 1995 about damages and repair
[8] Romen, E.: Tod im Pfändertunnel; Feuerwehr-Magazin 1995, issue 8, pages 34 - 37
[9] Henke, A.; Learning from real Events-Dealing with Truck fires in the St. Gotthard Road Tunnel; Conference „Tunnel Fires and Escape from Tunnels“; Lyon, 1999, Proceedings, pages 369 - 378
[10] Report of the technical commission on the fire from the 24. March 1999 in the Mont-Blanc-Tunnel, prepared by: Duffé, P./Marec, M., Französisches Innenministerium und Französisches Ministerium für Bauen, Verkehr und Wohnungswesen, issue June 1999
[11] Falconnat, B.: Der Brand im Mont-Blanc-Tunnel, BASt-Workshop „Sicherheit in Tunneln“, Bergisch Gladbach, 15./16. November 1999
[12] Brux, G.: Brand im Mont-Blanc-Tunnel, Tunnel 1999, issue 3, pages 4 - 5
[13] Brux, G.: Mont-Blanc-Tunnel ab Herbst 2000 wieder offen, Tunnel 2000, issue 3, pages 4 - 5
[14] NN: Tauern-Tunnel seit 28.08.1999 wieder in Betrieb, Tunnel 1999, issue 6, pages 2 - 6
[15] Hamburger Abendblatt: Die Hölle im Tunnel, 31.05.1999 (report about the fire in the Tauern-Tunnel)
[16] Hörhan, R.: Der Brand im Tauerntunnel; BASt-Workshop „Sicherheit in Tunneln“, Bergisch Gladbach, 15./16. November 1999
[17] Brux, G.: Brandschadenbeseitigung im Tauerntunnel – Technische Maßnahmen, Tunnel 1999, issue 8, pages 57 - 59
[18] Day, J.: Tunnel Safety and ventilation design and specification, Tunnel Management International 1999, October issue, pages 8 - 11
[19] Brux, G.: Brandschadensaufstellung im Tauern-Tunnel; Tunnel 2000, issue 1, pages 57 - 58
[20] Brux, G.: Brand im Kanaltunnel; Eisenbahningenieur (48) 1997, issue 11, pages 50 - 53
[21] Brux, G.: Der Kanaltunnel; Eisenbahningenieur (49) 1998, issue 3, pages 37 - 39
[22] Liew, S. K. / Deaves, D. M.: Eurotunnel HGV fire on 18th november 1996 – Fire development and effects, Proceedings of the 3rd international conference "Safety in Road and Rail Tunnels“, March 1998, pages 29 - 40
[23] Bradbury, W.: Smoke control during the channel tunnel-fire of 18th november 1996; Proceedings of the 3rd international conference „Safety in Road and Rail Tunnels“, March 1998, pages 626 - 640

Bibliography
Thematic Network Fire in Tunnels
152/161
[24] Kölner Stadt-Anzeiger vom 3. März 1999 with a report about the fire in the Leinebusch-Tunnel
[25] Vorläufiger Untersuchungsbericht des EBA vom 17.03.1999 zum Brand im Leinebusch-Tunnel
[26] Kreisfeuerwehr Göttingen: Vorläufiger Abschlußbericht über den Brand im Leinebuschtunnel; Stand 13.04.1999
[27] Fennell, D.: Investigation into the King´s Cross Underground Fire, Department of Transport, London, October 1988
[28] Zeitungsartikel der verschiedenen Berliner Tageszeitungen vom 10. bis 15. Juli 2000 zum Brand in der Haltestelle "Deutsche Oper" am 8.7.2000
[29] Schreiben der Senatsverwaltung für Stadtentwicklung, Berlin, vom 9.10.2000 an den Bundesminister für Verkehr, Bau- und Wohnungswesen, EW14, zum Brand in der U-Bahn-Station „Deutsche Oper“ am 8. July 2000
[30] Gutachterliche Stellungnahme zum Feuerschaden vom 20. Oktober 1991 im U-Bahnhof Heinrich-Heine-Allee des Chemischen Sachverständigenbüros Dr. rer. nat. Dieter Rackwitz, 4.11.1991
[31] Bericht der Feuerwehr vom 3.11.1991 zum Brand am 20.10.1991 im U-Bahnhof Heinrich-Heine-Allee, Einsatz-Nr. 5132
[32] Royal Institute of Engineers (KIVI): Ventilation of Road Tunnels; Netherland, November 1991
[33] ZTV-ING: Zusätzliche Technische Vertragsbedingungen und Richtlinien für den Bau von Straßentunneln; Herausgeber: Bundesanstalt für Strassenwesen (BASt), Verkehrsblatt-Verlag, Dortmund
Teil 5: Tunnelbau:
Abschnitt 1: Geschlossene Bauweise (Januar 2003)
Abschnitt 2: Offene Bauweise (Januar 2003)
Abschnitt 4: Betriebsausstattung (Entwurf Februar 2000)
[34] Lacroix, D.: New requirements for fire resistance of road tunnels in France, World Tunnel Congress ’98: Tunnels and Metropolises, 25-30 April 1998, São Paulo (Brazil)
[35] Vervoer Gevaarlijke Stoffen door tunnels; Ministerie van Verkeer en Waterstaat, Directoraat-Generaal Rijkswaterstaat, Bouwdienst Rijkswaterstaat, Richtlijnen, December 1992
[36] PIARC Committee on Road Tunnels: Fire and Smoke Control in Road Tunnels; PIARC report 05.05.B, Paris, 1999, ISBN 2-84060-064-1
[37] Lacroix, D.: The new PIARC report on fire and smoke control in road tunnels; proposed for the 3rd International Conference on Safety in Road and Rail Tunnels, 9. – 13. March, Nice, France
[38] Tan, G. L.: Fire protection in tunnels open to hazardous goods transport - experience in The Netherlands; paper presented at the meeting "La Sécurité Dans Les Tunnels Routiers" at the "Ecole Nationale Des Ponts Et Chaussees", Paris, december 1997
[39] Report for the XVIIIth World Road Congress, Brussels, 13-19 September 1987
[40] EUREKA-project EU 499 Firetun: Report on Full-Scale Tests on Fires in Transport Tunnels, ed.: Studiengesellschaft Stahlanwendung e.V., Düsseldorf, May 1995
[41] Proceedings of the International Conference on Fires in Tunnels; Børas, 10-11 October 1994, ed.: Ivarson, E.; Swedish National Testing and Research Institute
[42] Royal Institute of Engineers (KIVI): Ventilation of Road Tunnels; contributors: Glerum, A. / Swart, L. / `t Hooft, E. N. / Costeris, N. P. / Franken, A. / Hartman, P. F. / Rijkeboer, R. C. / Speulman, H. / den Tonkelaar, W. A. M., Netherlands, November 1993
[43] Lacroix, D.: Research Advancement in France on Road Tunnel Safety; Conference on ”Protection from fire of rail and road tunnels”; Rome, 20.-21. June 1996

Bibliography
Technical report Part 1 ‘Design Fire Scenarios’ 153/161
[44] French, S. E.: EUREKA 499 – HGV Fire Test (Nov. 1992); Børas, 10-11 October 1994, ed.: Ivarson, E.; Swedish National Testing and Research Institute, pages 63 – 85
[45] DIN 4102: Brandverhalten von Baustoffen und Bauteilen – Begriffe, Anforderungen und Prüfung; Beuth-Verlag, Berlin
Teil 1: Baustoffe (Mai 1981)
Teil 2: Bauteile (September 1977)
[46] Both, C. / van de Haar, P./ Tan, G. / Wolsink, G.: Evaluation of passive fire protection measures for concrete tunnel linings; Conference "Tunnel Fires and Escape from Tunnels“, Lyon, 1999, Proceedings, pages 95 bis 104
[47] Eurocode 1: Basis of design and actions on structures; Part 2-2: Actions on structures exposed to fire, ENV 1991-2-2; European Committee for Standardization, 1994
[48] Proceedings of the International Conference on Fire Protection in Traffic Tunnels; Dresden, 12-13 September 1995, eds.: Bundesministerium für Bildung, Wissenschaft, Forschung und Technologie; Studiengesellschaft Stahl e.V.; iBMB der TU Braunschweig; STUVA e.V.
[49] Blume, G.: Smoke and hot gas movements during tunnel fire tests with realistic fire loads; Tunnel, 1995, issue 2, pages 90-99
[50] Chassé, P.: EUREKA 499 – Caracterisation des feuy de vehicules routiers; internal paper of the French Centre d’Etudes des Tunnels and the Direction de la Sécurité Civile; size: 14 pages; Lyon 1995; not published
[51] CETU-remarks on fire risk; January 1996
[52] Richtlinien für die Ausstattung und den Betrieb von Straßentunneln (RABT); Forschungsgesellschaft für Straßen- und Verkehrswesen, Cologne a) issue 1994 b) issue 2003
[53] Memorial Tunnel Fire Ventilation Test Program; a collection of papers from the ASHRAE Meeting in Boston, Massachusetts June – July 1997; ASHRAE Technical Data Bulletin, Volume 13, Number 1
[54] Barber, Ch./Gardiner, A./Law, M.: Structural fire design of the Oresund Tunnel; Børas, 10-11 October 1994, ed.: Ivarson, E.; Swedish National Testing and Research Institute, pages 313 - 322
[55] Ingason, H.: Heat release rate measurements in tunnel fires; Børas, 10-11 October 1994, ed.: Ivarson, E.; Swedish National Testing and Research Institute, pages 86 – 103
[56] Lacroix, D.: New French recommendations for fire ventilation in road tunnels; 9th International Conference on Aerodynamics and Ventilation of Vehicle Tunnels; Aosta Valley; 6. – 8. October 1997
[57] NFPA 502: Standard for Road Tunnels, Bridges, and Other Limited Access Highway (also American National Standard), National Fire Protection Association, Quincy, Massachusetts, USA a) Edition 1998 b) Edition 2004
[58] Steinert, C: Dimensioning semicross Ventilation Systems for Cases of Emergency, Tunnel, 1999, issue 1, pages 42 - 45 and issue 2, pages 36 – 52
[59] Rundschreiben Nr. AA 3.6/02-2001 vom 6.2.2001 des Bundesministeriums für Verkehr, Bau- und Wohnungswesen an die Mitglieder des für die Ausstattung und den Betrieb von Straßentunneln zuständigen RABT-Ausschusses
[60] Norwegian Design Guide for Road Tunnels; Public Road Administration, Oslo, 1990
[61] Schweizerisches Bundesamt für Strassen (ASTRA):

Bibliography
Thematic Network Fire in Tunnels
154/161
a) Systemwahl, Dimensionierung und Betrieb von Tunnellüftungsanlagen; Richtlinien-Entwurf, 21. August 2000
b) Signalisierung der Sicherheitseinrichtungen in den Tunneln; Richtlinie (Erstfassung), 6. October 2000
c) Schweizerische Nationalstrassen - Richtlinien für die Projektierung von Strassentunneln; 1970
[62] Dutch Ministry of Transport, Public Works and Water Management:
a) Ventilation of Road Tunnels, Report of the Royal Institute of Engineers (KIVI), November 1993
b) Richtlijnen Vervoer Gevaarlijke Stoffen door Tunnels gelegen in Autosnelwegen; January 1995
[63] Moret, C.: Safety-related regulations in French road tunnels; Proceedings of the Fourth International Conference on Safety in Road and Rail Tunnels, Madrid, April 2001, pages 83 bis 96
[64] Ota, Y.: Sicherheitsaspekte und -standards in japanischen Verkehrstunneln, Konferenzband zur Tagung über Brandschutz in Verkehrstunneln, pages 164 bis 177, Dresden, September 1995
[65] British Department of Transport, Highways and Traffic: Design Guidelines for Planning, Equipping and Operating Tunnels on Motorways and other Trunk Roads; draft 20. June 1990
[66] Richtlinie über Anforderungen des Brand- und Katastrophenschutzes an den Bau und Betrieb von Eisenbahntunneln, issue 1.7.1997; Eisenbahn-Bundesamt (EBA), Bonn
[67] Arnbjerg-Nielsen, T. / Karlsson, M.: Eurocode application and probabilistic fire analysis; Conference "Safety in Road and Rail Tunnels", Granada, 1998, Proceedings, pages 467 to 474
[68] Richter, E.: Heißgasentwicklung bei Tunnelbränden mit Straßen- und Schienenfahrzeugen - Ver-gleich gemessener und in Versuchen enthaltener Temperatur-Zeit-Verläufe; Forschung und Praxis, Band 35 "Innovationen im unterirdischen Bauen", pages 131 - 137, Alba Fachverlag, Düsseldorf, 1994
[69] Haack,, A.: Brandsicherheit bestehender Verkehrstunnel: Überprüfung, Bewertung und Nachrüstung bei U-, Stadt- und S-Bahnen; STUVA-Tagungsband 2001, pages 223-228
[70] Ergebnisbericht zur Beurteilung von Branden an Schienenfahrzeugen als Bemessungsbrände zur brandschutztechnischen Auslegung von oberirdischen Personenverkehrsanlagen der Deutschen Bahn AG; Deutsche Bahn AG, DB Station & Service, Fachstelle Brandschutz, Frankfurt am Main, September 2000
[71] Empfehlungen zur Schadensbekämpfung bei Brand und Kollision von Reisezügen in Tunnelanlagen der Deutschen Bahn AG durch öffentliche Feuerwehren; Ergebnis der Arbeitsgruppe "Tunnelbrandbekämpfung" im Referat 5 – Brandbekämpfung – der vfdb; Verein zur Förderung des Deutschen Brandschutzes e.V, Referat 5, Hamburg, November 2000
[72] Haack, A.: Einführung in das EUREKA-Projekt/BMBF-Forschungsprojekt "Brandschutz in unterirdischen Verkehrsanlagen"; Proceedings of the international Conference "Brandschutz in Verkehrstunneln", Dresden, pages 6 bis 18
[73] Studiengesellschaft Stahlanwendung e.V.: Brände in Verkehrstunneln – Bericht über Versuche im Maßstab 1:1; Final report from July 1998 , Fördernummern RGB 8817 und 13 RG 9004 des vom BMBF geförderten EUREKA-Projektes
[74] "Brandschutz in Verkehrstunneln", Final report about the BMVBW-Workshop "Sicherheit in Tunneln", BASt – Bundesanstalt für Straßenwesen, Bergisch Gladbach, 15./16. November 1999; STUVA/STUVAtec, Köln, December 2000
[75] Winselmann, D./Städing, A.: Brandschutz im Tunnelbau; verbesserte rechnerische Nachweise für die Konstruktion, STUVA-Tagungsband 2001, pages 212-216
[76] Sicherheitstechnische Beurteilung und Anforderungen an den baulichen Brandschutz in Eisenbahntunneln mit Innenschalen in Stahlbeton; STUVA, Köln und Institut für Brandschutz und Massivbau (iBMB) der TU Braunschweig, April 2001, Gutachten für die DB Netz AG

Bibliography
Technical report Part 1 ‘Design Fire Scenarios’ 155/161
[77] DIN 5510: Vorbeugender Brandschutz in Schienenfahrzeugen
Teil 1: Brandschutzstufen, brandschutztechnische Maßnahmen und Nachweise
Teil 2: Brennverhalten und Brandnebenerscheinungen von Werkstoffen und Bauteilen; Klassifizierungen, Anforderungen und Prüfverfahren
Teil 3: Raumabschließende Systeme
Teil 4: Konstruktive Gestaltung der Fahrzeuge; Sicherheitstechnische Anforderungen
Teil 5: Elektrische Betriebsmittel, Sicherheitstechnische Anforderungen
Teil 6: Begleitende Maßnahmen; Funktion der Notbremseinrichtung, Informationssysteme, Brandmeldeanlagen, Brandbekämpfungseinrichtungen; Sicherheitstechnische Anforderungen
[78] Brandverhalten der bei den EUREKA-Versuchen benutzten Schienenfahrzeuge in Stahl- bzw. Aluminiumbauweise; report of the Studiengesellschaft für unterirdische Verkehrsanlagen e.V. – STUVA – to the Studiengesellschaft Stahl, Düsseldorf, February 2001
[79] Haack, A. / Meyeroltmanns, W. / Heins, Th.: Brandschutztechnische Stellungnahme zur Rauchausbreitung in der U-Bahnlinie Nord-Süd in Köln, report of STUVAtec GmbH, October 2001
[80] Müller, K.: Evakuierung von Reisenden aus Zügen im Gefahrenfall; 112 - Magazin der Feuerwehr 2001, issue 4, pages 228 to 231
[81] Li, S. / Kennedy, B. / Harvey, N.: Simulation of Escape from Road and Rail Tunnels using SIMULEX; Proceedings of the 4th international conference "Safety in Road and Rail Tunnels", Madrid, April 2001, pages 323 to 334
[82] Hoffmann, N. A. / Henson, D. A. / Pope, C.: Analysis of the Evacuation of a Crush Loaded Train in a Tunnel; Proceedings of the 3rd international conference "Safety in Road and Rail Tunnels", Nizza, March 1998, pages 677 to 687
[83] NFPA 130: Standard for Fixed Guideway Transit Systems, National Fire Protection Association, Quincy, USA a) Edition 2000 b) Edition 2003
[84] Bosch, J.W.: North-South-Line: The Development of a new Safety Concept; International Tunnel Fire and Safety Conference, Rotterdam, December 1999
[85] Bundesministerium für Verkehr: Richtlinien für den Bau von Tunneln nach der Verordnung über den Bau und Betrieb der Straßenbahnen (BOStrab) (BOStrab-Tunnelbaurichtlinien); issue April 1991; Verkehrsblatt 45 (1991), issue 10, Seite 464 to 469
[86] Allmän teknisk beskrivning (Allgemeine technischen Anforderungen) TUNNEL 98, Swedish National Road Administration
[87] Lacroix, D.: To what extend should road tunnel structures resist fire? The French approach; Paper for the 3rd International Conference “Tunnel fires”, Washington, October 2001
[88] Huijben, J.W.: Emergency exits in unclosed road structures; paper presented on the PIARC WG-6 meeting in Graz, April 2002
[89] Dahl, J./Richter, E.: Brandschutz: Neuentwicklung zur Vermeldung von Betonabplatzungen; Tunnel 2001, issue 6, pages 10-22
[90] Haack, A.: Kommentar zum neu entwickelten Brandschutz im einschaligen Tunnelausbau; Tunnel 2001, issue 6, pages 23-31
[91] Email by H. Hejny, DMT, Germany, from 10. October 2002 with comment about design fires
[92] DIN EN 12101-1 (issue September 1995): Smoke and heat control systems, part 1: Specification for smoke curtains-requirements and test methods
[93] Guidelines for electrical installations according to the German BOStrab; issue August 1990

Bibliography
Thematic Network Fire in Tunnels
156/161
[94] Galea, E.: Impact of fire tenability levels on evacuation efficiency; email form 15. September 2002 with regard to the WP 2 document (2. draft)
[95] Purser, D.A.: Toxicity Assessment of combustion products. In: C.L.Beyler (Ed) SFPE Handbook of Fire Protection Engineering, National Fire Protection Association, Quincy M.A., 1-200 - 1-245, 1988.
[96] Purser, D.,A.: Inaugural Lecture Series, University of Greenwich, ISBN 1861661177, 1999.
[97] Hymes, I., Boydell, W., and Prescott, B.: Thermal radiation: Physiological and pathological effects, IChemE Major Hazards Monograph, 1996.
[98] Hymes, I., Brearley, S., Prescott, B.L. and Zahid, M.: The prognosis of burn injury victims. SRD/HSE/600, AEA Technology, 1993.
[99] D King: Report on the accident to Boeing 737-236 series 1, G-BGJL at Manchester International Airport on 22 August 1985. Aircraft Accident Report 8/88. HMSO LONDON, 1988.
[100] Purser, D.A.: Toxicity Assessment of combustion products. In: P.J.DiNenno (Ed) SFPE Handbook of Fire Protection Engineering, National Fire Protection Association, Quincy M.A., 2-83 - 2-171, 2002.
[101] Jin, T.: Visibility through fire smoke, Journal of Fire and Flammability, 9, 135-155, 1978.
[102] Jin, T. and Yamada, T.: Experimental Study of Human behaviour in smoke filled corridors. In: T. Wakamatsu, Y. Hasemi, A. Sekizawa, P. Seeger, P. Pagni and C. Grant (Eds.) Fire Safety Science Proceedings of the Second International Symposium, Hemisphere Publishing Company, New York, 561-570, 1989.
[103] R. Hörhan (Austria) on behalf of PIARC-Working Group 6; 17. September 2002
[104] Ingason, H.: Working group 2 –WG2- Fire Scenarios; document mailed to STUVA on 14. October 2002
[105] Carvel, R. O. / Beard, A. N. / Jowitt, P. W. / Drysdale, D. D.: Variation of Heat Release Rate With Forced Longitudinal Ventilation for Vehicle Fires in Tunnels, Fire Safety Journal, Vol. 36, No. 6, 569-596, September 2001.
[106] Egan, M.R., and Litton, C.D.: Wood Crib Fires in a Ventilated Tunnel, RI 9045, Bureau of Mines Report of Investigations/1986.
[107] Private communication with Dr. John L. DeRis, Factory Mutual Global Research, USA.
[108] Project ’Safety Proef’ Rapportage Brandproeven, Augustus 2002, Ministerie van Verkeer en Watestaat, Directoraat-Generaal Rijkswaterstaat.
[109] Ingason, H.: Influence of ventilation rate on heat release rate in tunnel fires, Draft Report prepared for the Swedish Fire Research Board (Brandforsk) 2002.
[110] Mangs, J. / Keski-Rahkonen, O.: Characterization of the Fire Behavior of a Burning Passenger Car, Fire Safety Journal, Vol. 23, 37-49, 1994.
[111] Steinert, C.: Experimentelle Untersuchungen zum Abbrand- und Feuerübersprungsverhalten von Personenkraftwagen, vfdb-Zeitschrift, Forschung, Technik und Management im Brandschutz, 4/2000, pp 163-172.
[112] Shipp, M. / Spearpoint, M.: Measurements of the Severity of Fires Involving Private Motor Vehicles, Fire and Materials, Vol. 19, p.143-151, 1995.
[113] Joyeux, D.: Natural Fires in Closed Car Parks, Car fire tests, INC-96/294d-DJ/NB, 1997.
[114] Ingason, H. / Gustavsson, S. / Dahlberg, M.: Heat Release Rate Measurements in Tunnel Fires, SP Report 1994:08, Swedish National Testing and Research Institute.
[115] Skarra, N.: Bussbrannen i Ekebergstunnelen 21.8.1996 [The Bus Fire in the Ekeberg Tunnel on 21st August 1996], ISBN 82-994196-0-3, Statens Vegvesen, Oslo, Norway.
[116] Stephens, J.N.: Using Sprinklers in Bus Garages, Fire Prevention 253, October.

Bibliography
Technical report Part 1 ‘Design Fire Scenarios’ 157/161
[117] Sprinkler Tests in a Bus Garage; Video, ESO, Organisation of Regional Transport Companies, P O Box 9300, 3506 GH Utrecht, Holland
[118] Stephens, J. N.: Private Communication, The Loss Prevention Council, 1994.
[119] Ingason, H.: Overview of vehicle fires, Proceedings of the fourth International Conference on Safety in Road and Rail Tunnels, Madrid 2001.
[120] Grant, G.B. / Drysdale, D.D.: Estimating Heat Release Rates from Large-scale Tunnel Fires, Fire Safety Science, Proceedings of the Fifth International Symposium, pp. 1213-1224.
[121] Carvel, R. / Beard, A. / Jowitt, P.: The effect of Forced Longitudinal Ventilation on an HGV Fire in a Tunnel, Proceedings of the International Conference on Tunnel Fires and Escape from Tunnels, Independent Technical Conferences, p191-211.
[122] Arvidson, M.: Large Scale Ro-Ro Vehicle Deck Fire Test, Swedish National Testing and Research Institute, SP-Report 1997:15,
[123] Hedenfalk, J. / Wahlström, B. / Rohlen, P.: Lessons from Baku Subway Fire, Proceedings of the third International Conference on Safety in Road and Rail Tunnels, Nice 1998.
[124] Channel Tunnel Safety Authority, Inquiry into the Fire on Heavy Goods Vehicle Shuttle 7539 on 18 November 1996.
[125] Liew, S.K. / Deaves, D.M.: Eurotunnel HGV fire on 18th November 1996 – Fire development and effects, Proceedings of the third International Conference on Safety in Road and Rail Tunnels, Nice 1998.
[126] Eberl, G.: The Tauern tunnel incident. What happened and what has to be learned?, Proceedings of the fourth International Conference on Safety in Road and Rail Tunnels, Madrid 2001.
[127] Tewarson A.: "Generation of heat and chemical compounds in fires", SFPE Handbook, Section 1/Chapter 13, 1988.
[128] Jin, T. / Yamada, T.: Irritating effects of fire smoke on visibility, Fire Science and Technology Vol. 5 No. 1, 1985.
[129] Wilk, E.: Bericht zur Bestimmung eines Bemessungsbrandes für Triebfahrzeuge der U-Bahn / Frankfurt a.M.; Report of the Brandschutz Consult Ingenieurgesellschaft mbh:, Leipzig, July 2002
[130] Contribution to car fire statistics by a) E. Galea, UK b) H. Ingason, Sweden c) S. Kumar, UK d) G. Malair, France
[131] Bendelius, L.: Compared Analysis of Mt. Blanc and Tauerntunnel fires; document received by email 0n 14. October 2002 via [email protected]
[132] Both, K.: Application of Natural Fire Safety Concept to Road, Rail and Metro Tunnels and the Effect of ventilation on rate of heat release; draft text from TNO Delft for WP2-report from 16. October 2002
[133] “Valorisation Project: Natural Fire Safety Concept”, March 2001
[134] “Identification and quantification of Hazards – WP 4.1 Part Fire and Smoke”, DARTS / 4.1, 2002
[135] Lemaire, T.: “Tweede Benelux tunnel”, September 2002
[136] Kumar, S.: Regulations, Standards and Codes covering the Rolling Stock in the UK; paper prepared for FIT Work Package 2 “Design fire scenarios”, March 2003
[137] Notfallszenarien für Tunnelanlagen des schienengebundenen ÖPNV und deren Bewältigung”, running research project of STUVA e.V., financed by the German Ministry of Transport (FE no. 70.653/2001)

Bibliography
Thematic Network Fire in Tunnels
158/161
[138] The Fire Precautions (sub-surface Railway Stations) Regulations 1989, Statutory Instrument 1989, No. 1401, Crown Copyright 1989 (as amended SI 1991/No. 259, S21 and SI 1994/No. 2184)
[139] Railway Accident: Report on the Derailment and Fire that occurred on 20th December 1984 at Summit Tunnel, Department of Transport, UK, London: HMSO, 1986
[140] Fennel, D.: Investigation into the King´s Cross Underground Fire, Department of Transport, London, October 1988
[141] The Channel Tunnel Safety Authority, “Inquiry into the Fire on Heavy Goods Vehicle Shuttle 7539 on 18. November 1996”, The Stationery Office, May 1997
[142] Cullen, P.C.: The Ladbroke Grove Rail Inquiry, Parts 1 and 2 Reports, Health and Safety Commission, 2001
[143] Simcox, S. / Wilkes, N.S. / Jones, I.P.: Fire at King´s Cross underground Station, 18. November 1987: Numerical Situation of the Buoyant Flow and Heat Transfer, AERE-G 4677 (May 1988), cited in ref. 1, pp. 107, 211, 1988
[144] Cox, G. / Chitty, R. / Kumar, S.: Fire Modelling and the King´s Cross Fire Investigation, Fire Safety Journal, 15, pp. 103-106, 1989
[145] British Standard Code of practice for fire precautions in the design and construction of railway passenger carrying trains. BS 6853, 1999
[146] Railtrack Railway Group Standard GM/RT2120 Requirements for the Control of Risks Arising from Fires on Railway Vehicles, August 1998
[147] Emergency Egress from Passenger Rolling Stock, Group Standard, Go/OTS220, British Railway Board, May 1993
[148] Health and Safety Executive HM Railway Inspectorate. Railway Safety Principles and Guidance, part 2 Section F Guidance on trains. HSE Books 1996
[149] Engineering standard (Cat 1) E 1042 A6, Fire safety performance of materials, London underground Limited, Chief Engieer´s Directorate, March 2002
[150] Vehicle Interiors Design for Evacuation and Fire Safety, ATOC Vehicle Standard, AV/ST 9002, Association of Train Operating Companies (ATOC), May 2002
[151] European Standard EN 45545 Railway applications – Fires protection on railway vehicles, Parts 1 to 7
[152] The Building regulations 1991 Approved Document B Fire Safety, HMSO, 1992
[153] Munro, J. / Scott, P.: Tunnel design fire assessment, International Conference on Tunnel Fires, Lyon, France, 1999
[154] Method for determination of the fire resistance of elements of construction (general principles), BS 476: Part 20, 1987
[155] Fire Safety Engineering, international Organisation for Standardisation (ISO), ISO TR 13387, parts 1-8, 1999
[156] SFPE, "SFPE Engineering Guide to Performance Based Protection, Analysis and Design of Buildings", NFPA-SFPE, Quincy, Ma, 2000
[157] ISO TC92/SC4/WG6 N58, "ISO/WD 16733 - Fire Safety Engineering - Selection of design fires", draft dated 2003-11-28 for discussion at the Kyoto meeting of SC4 subcommittee (April 2003)
[158] French standards concerning the requirements of fire safety performance of rolling stock materials, devices and cables:
a) NF 16101, part 1 to part 4
b) NF 16102
c) NF 16103

Bibliography
Technical report Part 1 ‘Design Fire Scenarios’ 159/161
d) NF 16104
e) IT 98300
[159] Grupp, F.: Further development on preventive fire protection by the European standardization; ZEVrail Glasers Annalen 127 (2003), issue 3/4, pages 152 to 161
[160] Predtetschenski / Milinski: Personenströme in Gebäuden; Rudolf Müller Verlag, Köln, 1971
[161] United nations, Economic commission for Europe, Inland transport committee: Recommendations of the group of experts on safety in tunnels (rail), draft TRANS/AC.9/8 from 30 July 2003
[162] UIC-Codex 779-9: Safety in railway tunnels, draft from September 2002
[163] Kumar, S: email from 18 March 2003 to STUVA with information about UK fire statistics on vehicle fires
[164] NN:Realistic fire scenarios for safety assessments of train fires in tunnel; 10 pages; paper related to the Green Hart tunnel (NL)
[165] RENFE (Spain]: Medidas de seguridad en nuevos tuneles ferroviarios; version 2000.01 from April 2000
[166] Steinert, C.: Zur Entstehung und Charakterisierung von Brandrauch; vfdb-Zeitschrift 2002, no. 4, pages 135 to 147
[167] Styron, H.C.: CSX Tunnel fire, Baltimore MD; FEMA US Fire Administration Technical Report Series USFA-TR-140, July 2001
[168] ISO/TR 13387-2: 1999(E), Fire Safety Engineering – Part 2: Design fire scenarios and design fires, Technical Report, 1999
[169] Massachusetts Highway Department & Bechtel/Parsons Brinckerhoff, Memorial Tunnel Fire Ventilation Test Program – Test Report, 1995
[170] Yumoto, T.: ‘ Radiation from oll tank fires’, J. Japan Society for Safety Engineering, 10, no.3, 1971
[171] Kumar, S.: 'Fire development and smoke spread in tunnel - some modelling considerations'. In Proc. 1st International Conference on the Safety in Road and Rail Tunnels, Basel, Switzerland, 1992, p. 379
[172] Kumar, S. / Cox, G.: ‘The development of best practice for the “correct” use of CFD for fire applications with examples’, Proc. INTERFLAM2001 conference, Edinburgh, UK, 17-19 September 2001, pp. 823-834
[173] Cox, G. / Kumar, S.: ‘Modelling enclosure fires using CFD modelling’ SFPE Handbook, 3rd Edition, 2002, pp. 3-194 to 3-218
[174] Gobeau, N. / Ledin H. S. / Lea C. J.: ‘Guidance for HSE Inspectors: Smoke movement in complex enclosed spaces – Assessment of computational fluid dynamics, Health and Safety Laboratory, Report no. CM/01/17, April 2003
[175] Kumar, S.: ‘Recent Achievement in modelling the transport of smoke and toxic gases in tunnel fires, In Proc. 1st International Symposium on Safe and Reliable Tunnels, Prague, Czezch Republic, 4-6 February 2004, pp 97-105
[176] Ingason, H. / Lönnermark, A. / Blomquist, P.: “Runehamar fire tests 2003 – Summary”, In International Symposium on Catastrophic Tunnel Fires (CTF), (H. Ingason, Ed.) SP Swedish National Testing and Research Institute, Borås, Sweden, 2003
[177] Ingason, H. / Lönnemark, A: “Runehamar fire tests 2003”, In International Symposium on Catastrophic Tunnel Fires (CTF), (H. Ingason, Ed.) SP Swedish National Testing and Research Institute, Borås, Sweden, 2003
[178] Ingason, H. / Lönnermark, A.: “Large-scale Fire Tests in the Runehamar tunnel”, In International Symposium on Catastrophic Tunnel Fires (CTF), (H. Ingason, Ed.) SP Swedish National Testing and Research Institute, Borås, Sweden, 2003

Bibliography
Thematic Network Fire in Tunnels
160/161
[179] Brandt, A. W.: “Presentation of test results from full-scale fire test at Runehamar tunnel; Large-scale Fire Tests in the Runehamar tunnel”, In International Symposium on Catastrophic Tunnel Fires (CTF), (H. Ingason, Ed.) SP Swedish National Testing and Research Institute, Borås, Sweden, 2003
[180] Galea, E.R.: On the Field Modelling approach to the Simulation of Enclosure Fires. J of Fire Protection Eng 1 (1), pp11-22, 1989.
[181] Jia, F. / Galea, E.R. / Patel, M.K.: The Numerical Simulation of Enclosure Fires using a CFD Fire Field Model Coupled with a Pyrolysis Based Solid Fuel Combustion Submodel – A First Approximation, Journal of Fire Protection Engineering, Vol. 9, No.4, pp.1-17, 1999.
[182] Jiang, H. / Gwynne, S. / Galea, E.R. / Lawrence, P. / Jia, F. / Ingason, H.: The use of Evacuation simulation, Fire Simulation and Experimental Data in Forensic Fire Analysis. Proceedings 2nd International Pedestrian and Evacuation Dynamics Conference, Ed: E.R.Galea, CMS Press, Greenwich, UK, ISBN 1904521088, pp341-354, 2003.
[183] Galea, E. R. / Gwynne, S. / Lawrence, P. / Wang. Z.:The Representation of Occupant Sensitivity to Irritant Fire Gases, Within Evacuation Analysis. 10th International Interflam Fire Science & Engineering Conference, Edinburgh, 5-7 July 2004, vol. 1, pp 353-364, ISBN 0 9541216 4 3.
[184] Fraser-Mitchell, J: Simulated evacuations of an airport terminal bulding, using the CRISP Model. Proceedings of the 2nd International Symposium Human Behaviour in Fire, ISBN 0953231267, Boston, USA, 2001,pp 89-100.
[185] Gwynne, S. / Galea, E. R. / Lawrence, P. / Filippidis, L.: Modelling Occupant Interaction with Fire Conditions Using the buildingEXODUS model”. Fire Safety Journal, 36, pp327-357, 2001.
[186] Schneider, V.: Simulating the evacuation of large assembly occupancies. Proceedings 2nd International Pedestrian and Evacuation Dynamics Conference, Ed: E.R.Galea, CMS Press, Greenwich, UK, ISBN 1904521088, pp341-354, 2003.
[187] Galea, E. R. / Gwynne, S. : Evacuating an overturned smoke filled rail carriage. Proceedings of the 2nd International Symposium Human Behaviour in Fire, ISBN 0953231267, Boston, USA, 2001,pp 135-146.
[188] Galea, E. R. / Gwynne, S. : Estimating the flow rate capacity of an overturned rail carriage end exit in the presence of smoke. Fire and Materials, 24, pp 291-302, 2000.
[189] Galea, E.R.: Issues Relating to Passenger Egress From Rail Carriages: Ladbroke Grove Incident, 5 October 1999. Report prepared for The Ladbroke Grove Rail Inquiry. 8th June 2000.
[190] Methods for the determination of possible damage to people and objects from releases of hazardous materials; The Green Book, Committee for Prevention of Disasters, CPR 16E, ISBN 90-5307-052-4.
[191] Brekelmans, J. / van den Bosch, R.: Researching release rates at Runehamar, In Tunnels & Tunneling International, vol. 36 no. 6, June 2004, pp 23-27
[192] Brekelmans, J. / van den Bosch, R.: Summary of Large Scale Fire Tests in the Runehamar Tunnel in Norway, conducted in association with the UPTUN Research Program, September 2003
[193] Ingason, H. / Lönnermark, A / Nelisse, M. / Brekelmans, J. / Lemaire, A.: Overview over the large-scale fire tests in the Runehamar Tunnel; Tunnel 23 (2004), no. 5; pages 34 to 37
[194] Marlair, G / Lecoze, J.C. / Woon-Hyung, K. / Galea, E.R: „Human Behavior as a Key Factor in Tunnel Fire Safety Issues“, 6th Asia-Oceania Symposium on Fire Science and Technology, 17-20 March 2004, Daegu, Korea, Proceedings p 658- 668
[194] Haack, A.: Tunnel Fire Safety Is Quickly Progressing Thanks To Cooperative Efforts; Routes no. 324, pp 7-17, October 2004
[195] Voeltzel, A. / Dix, A.: A Comparative Analysis Of The Mont Blanc, Tauern And Gotthard Tunnel Fires; in Routes no. 324, pp 18-34, October 2004

Bibliography
Technical report Part 1 ‘Design Fire Scenarios’ 161/161
[196] West, A.: The Role of PIARC Technical Committee C3.3 In Fire Safety In Tunnels; Routes no. 324, pp 35-44, October 2004
[197] Haack, A.: ITA Presentation And Role In Fire Safety In Tunnels; Routes no. 324, pp 45-51, October 2004
[198] Bendelius, A. / Brinckerhoff, P.: The Latest PIARC Road Tunnel Fire And Smoke Control Publications; Routes no. 324, pp 52-61, October 2004
[199] Lacroix, D. / Haack, A.: PIARC Design Criteria For Resistance To Fire For Road Tunnel Structure; Routes no. 324, pp 64-71, October 2004
[200] Russell, H. A.: ITA Guidelines For Structural Fire Resistance Of Road Tunnels; Routes no. 324, pp 72-81, October 2004
[201] Pesut, A. / Smith, C.: Activities Of The United Nations Economic Commission For Europe To Promote Safety In Tunnels; Routes no. 324, pp 82-89, October 2004
[202] Thamm, B.: The New Directive 2004/54/EC On Road Tunnel Safety; in Routes no. 324, pp 90-98, October 2004
[203] Muncke, M. / Zuber, P.: Safety In Railway Tunnels: Current UIC Recommendations And European Regulations; Routes no. 324, pp 99-104, October 2004
[204] Electrical Installations and Safety Systems (Subcommittee of the UITP Metro Division (1)): Preventing And Combating Fires In Metro Systems; Routes no. 324, pp 105-109, October 2004
[205] Mijnsbergen / J. Rostam, S. / Van Dessel, J. / Both, K.: Safe And Reliable Tunnels: Community R&D; Routes no. 324, pp 110-44, October 2004
[206] Haack, A.: Latest achievment and perspectives in tunnel safety; proceedings of the 30th ITA-AITES World Tunnel Congress “Underground Space for Sustainable Urban Development; Singapore 22-27 May 2004; Tunnelling and Underground Space Technology, Vol. 19, No. 4-5, July – September 2004
[207] Wilk, E. / Rudolph, D.: Bestimmung eines Bemessungsbrandes an einem Schienenfahrzeug; vfdb-Zeitschrift 2003, no. 3, pages 107 to 117
[208] Dowling, V.P. / White, N.: Fire sizes in railway passengers saloons; Prodeedings of the 6th Asia-Oceania Symposium on Fire Science and Technology (Ed. Kim, E. S. et al), pages 601 to 611, Korean Institute o Fire Science and Engineering; Deagu; March 2003