Isotopic Yields of Fission Fragments from Transfer-Induced Fission
RI 2008-1J 177
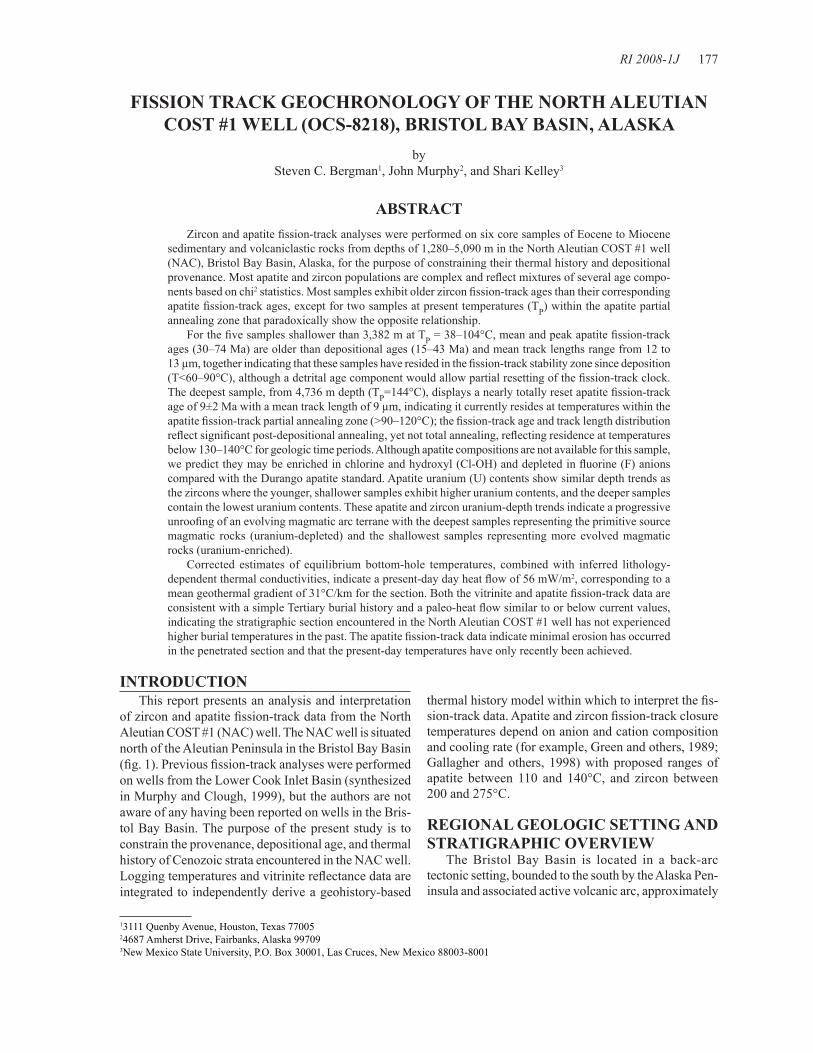
INTRODUCTIONThis report presents an analysis and interpretation
of zircon and apatite fi ssion-track data from the North Aleutian COST #1 (NAC) well. The NAC well is situated north of the Aleutian Peninsula in the Bristol Bay Basin (fi g. 1). Previous fi ssion-track analyses were performed on wells from the Lower Cook Inlet Basin (synthesized in Murphy and Clough, 1999), but the authors are not aware of any having been reported on wells in the Bris-tol Bay Basin. The purpose of the present study is to constrain the provenance, depositional age, and thermal history of Cenozoic strata encountered in the NAC well. Logging temperatures and vitrinite refl ectance data are integrated to independently derive a geohistory-based
thermal history model within which to interpret the fi s-sion-track data. Apatite and zircon fi ssion-track closure temperatures depend on anion and cation composition and cooling rate (for example, Green and others, 1989; Gallagher and others, 1998) with proposed ranges of apatite between 110 and 140°C, and zircon between 200 and 275°C.
REGIONAL GEOLOGIC SETTING AND STRATIGRAPHIC OVERVIEW
The Bristol Bay Basin is located in a back-arc tectonic setting, bounded to the south by the Alaska Pen-insula and associated active volcanic arc, approximately
13111 Quenby Avenue, Houston, Texas 7700524687 Amherst Drive, Fairbanks, Alaska 997093New Mexico State University, P.O. Box 30001, Las Cruces, New Mexico 88003-8001
FISSION TRACK GEOCHRONOLOGY OF THE NORTH ALEUTIAN COST #1 WELL (OCS-8218), BRISTOL BAY BASIN, ALASKA
bySteven C. Bergman1, John Murphy2, and Shari Kelley3
ABSTRACTZircon and apatite fi ssion-track analyses were performed on six core samples of Eocene to Miocene
sedimentary and volcaniclastic rocks from depths of 1,280–5,090 m in the North Aleutian COST #1 well (NAC), Bristol Bay Basin, Alaska, for the purpose of constraining their thermal history and depositional provenance. Most apatite and zircon populations are complex and refl ect mixtures of several age compo-nents based on chi2 statistics. Most samples exhibit older zircon fi ssion-track ages than their corresponding apatite fi ssion-track ages, except for two samples at present temperatures (TP) within the apatite partial annealing zone that paradoxically show the opposite relationship.
For the fi ve samples shallower than 3,382 m at TP = 38–104°C, mean and peak apatite fi ssion-track ages (30–74 Ma) are older than depositional ages (15–43 Ma) and mean track lengths range from 12 to 13 μm, together indicating that these samples have resided in the fi ssion-track stability zone since deposition (T<60–90°C), although a detrital age component would allow partial resetting of the fi ssion-track clock. The deepest sample, from 4,736 m depth (TP=144°C), displays a nearly totally reset apatite fi ssion-track age of 9±2 Ma with a mean track length of 9 μm, indicating it currently resides at temperatures within the apatite fi ssion-track partial annealing zone (>90–120°C); the fi ssion-track age and track length distribution refl ect signifi cant post-depositional annealing, yet not total annealing, refl ecting residence at temperatures below 130–140°C for geologic time periods. Although apatite compositions are not available for this sample, we predict they may be enriched in chlorine and hydroxyl (Cl-OH) and depleted in fl uorine (F) anions compared with the Durango apatite standard. Apatite uranium (U) contents show similar depth trends as the zircons where the younger, shallower samples exhibit higher uranium contents, and the deeper samples contain the lowest uranium contents. These apatite and zircon uranium-depth trends indicate a progressive unroofi ng of an evolving magmatic arc terrane with the deepest samples representing the primitive source magmatic rocks (uranium-depleted) and the shallowest samples representing more evolved magmatic rocks (uranium-enriched).
Corrected estimates of equilibrium bottom-hole temperatures, combined with inferred lithology-dependent thermal conductivities, indicate a present-day day heat fl ow of 56 mW/m2, corresponding to a mean geothermal gradient of 31°C/km for the section. Both the vitrinite and apatite fi ssion-track data are consistent with a simple Tertiary burial history and a paleo-heat fl ow similar to or below current values, indicating the stratigraphic section encountered in the North Aleutian COST #1 well has not experienced higher burial temperatures in the past. The apatite fi ssion-track data indicate minimal erosion has occurred in the penetrated section and that the present-day temperatures have only recently been achieved.
178 RI 2008-1J Bristol Bay–Alaska Peninsula region, overview of 2004–2007 geologic research
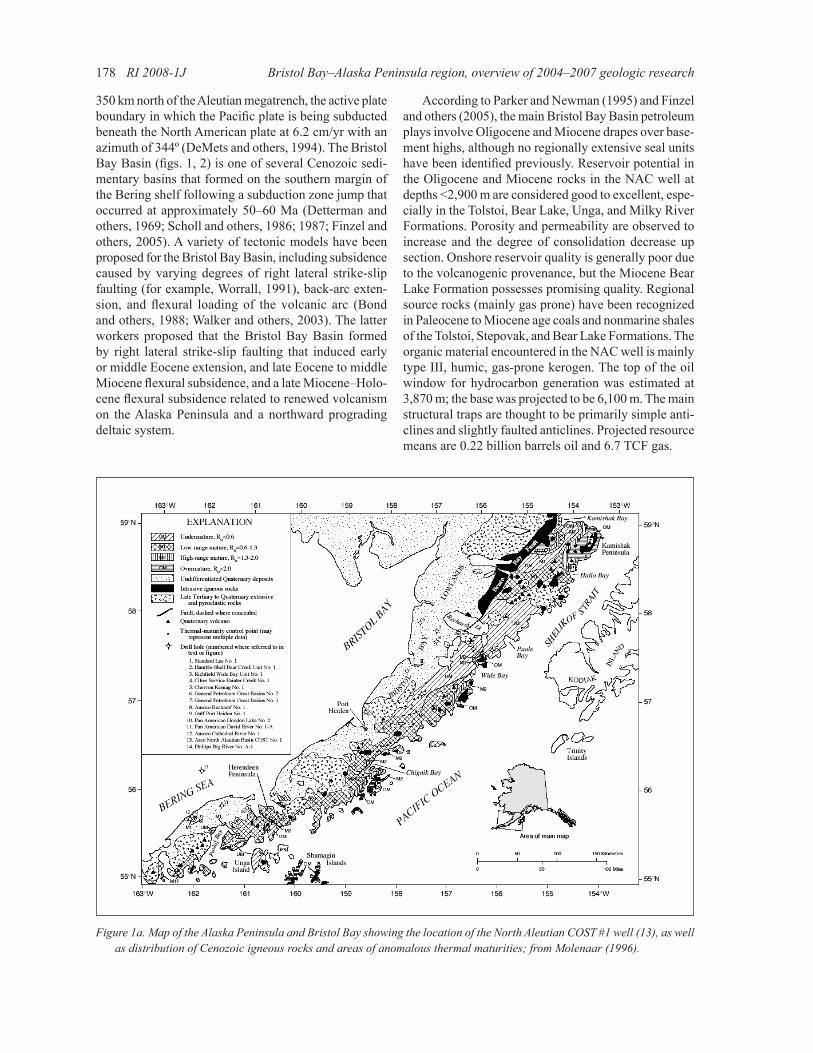
350 km north of the Aleutian megatrench, the active plate boundary in which the Pacifi c plate is being subducted beneath the North American plate at 6.2 cm/yr with an azimuth of 344º (DeMets and others, 1994). The Bristol Bay Basin (fi gs. 1, 2) is one of several Cenozoic sedi-mentary basins that formed on the southern margin of the Bering shelf following a subduction zone jump that occurred at approximately 50–60 Ma (Detterman and others, 1969; Scholl and others, 1986; 1987; Finzel and others, 2005). A variety of tectonic models have been proposed for the Bristol Bay Basin, including subsidence caused by varying degrees of right lateral strike-slip faulting (for example, Worrall, 1991), back-arc exten-sion, and fl exural loading of the volcanic arc (Bond and others, 1988; Walker and others, 2003). The latter workers proposed that the Bristol Bay Basin formed by right lateral strike-slip faulting that induced early or middle Eocene extension, and late Eocene to middle Miocene fl exural subsidence, and a late Miocene–Holo-cene fl exural subsidence related to renewed volcanism on the Alaska Peninsula and a northward prograding deltaic system.
According to Parker and Newman (1995) and Finzel and others (2005), the main Bristol Bay Basin petroleum plays involve Oligocene and Miocene drapes over base-ment highs, although no regionally extensive seal units have been identifi ed previously. Reservoir potential in the Oligocene and Miocene rocks in the NAC well at depths <2,900 m are considered good to excellent, espe-cially in the Tolstoi, Bear Lake, Unga, and Milky River Formations. Porosity and permeability are observed to increase and the degree of consolidation decrease up section. Onshore reservoir quality is generally poor due to the volcanogenic provenance, but the Miocene Bear Lake Formation possesses promising quality. Regional source rocks (mainly gas prone) have been recognized in Paleocene to Miocene age coals and nonmarine shales of the Tolstoi, Stepovak, and Bear Lake Formations. The organic material encountered in the NAC well is mainly type III, humic, gas-prone kerogen. The top of the oil window for hydrocarbon generation was estimated at 3,870 m; the base was projected to be 6,100 m. The main structural traps are thought to be primarily simple anti-clines and slightly faulted anticlines. Projected resource means are 0.22 billion barrels oil and 6.7 TCF gas.
Figure 1a. Map of the Alaska Peninsula and Bristol Bay showing the location of the North Aleutian COST #1 well (13), as well as distribution of Cenozoic igneous rocks and areas of anomalous thermal maturities; from Molenaar (1996).
Fission track geochronology of the North Aleutian COST #1 Well (OCS-8218), Bristol Bay Basin, Alaska 179
Larson (1988) reported the following conventional K-Ar ages on whole rock samples from the NAC well (Teledyne Isotopes, analysts):
●4,882 m (16,016 ft) (core 18), altered volcanic pebble-conglomerate, 31.6±2 Ma;
●5,081 m (16,670 ft; cuttings) devitrifi ed amygda-loidal volcanics, 41±10 Ma;
●5,087–5,090 m(16,690–16,700 ft, cuttings) salt and pepper textured diabase intrusive, 47±18 Ma (un-certainties not specifi ed, but assumed to be 2).
The K-Ar ages show both consistencies and incon-sistencies with the biostratigraphic ages reported for the well, and primary analytical data were not provided to evaluate the quality of these data, and because they refl ect whole rock and not mineral separate analyses, they should be treated as suspect as evidenced by the sizable relative uncertainties of 20–40 percent.
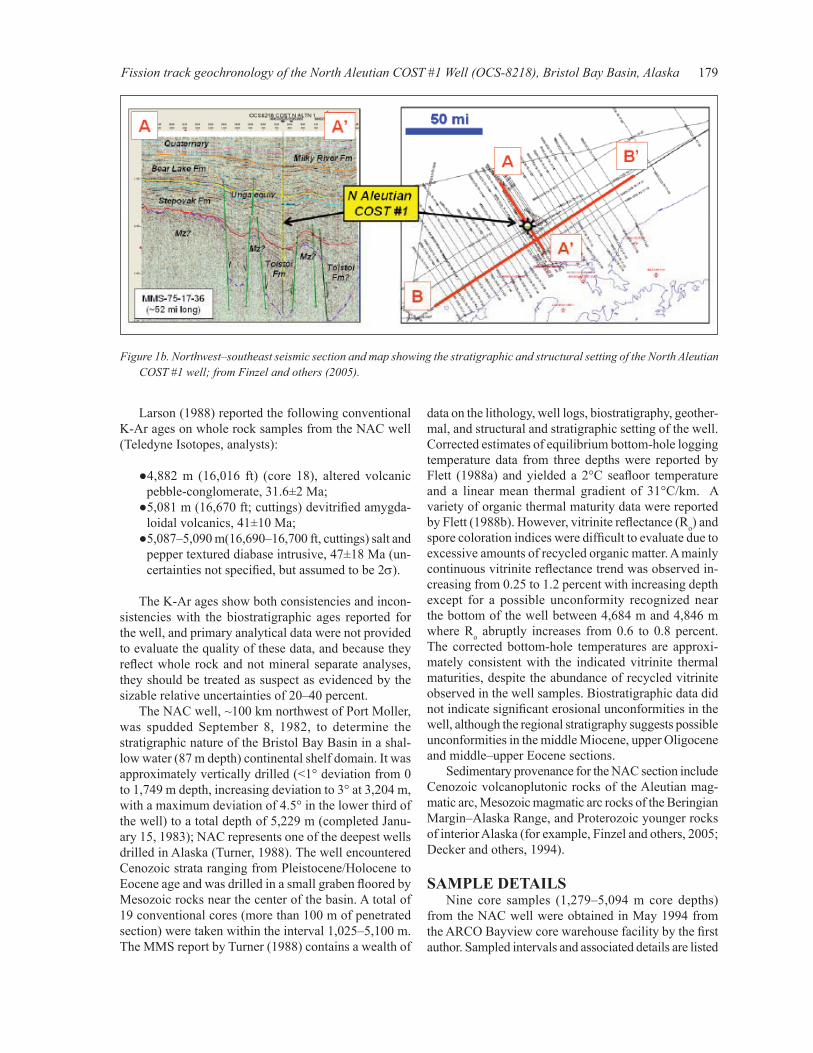
The NAC well, ~100 km northwest of Port Moller, was spudded September 8, 1982, to determine the stratigraphic nature of the Bristol Bay Basin in a shal-low water (87 m depth) continental shelf domain. It was approximately vertically drilled (<1° deviation from 0 to 1,749 m depth, increasing deviation to 3° at 3,204 m, with a maximum deviation of 4.5° in the lower third of the well) to a total depth of 5,229 m (completed Janu-ary 15, 1983); NAC represents one of the deepest wells drilled in Alaska (Turner, 1988). The well encountered Cenozoic strata ranging from Pleistocene/Holocene to Eocene age and was drilled in a small graben fl oored by Mesozoic rocks near the center of the basin. A total of 19 conventional cores (more than 100 m of penetrated section) were taken within the interval 1,025–5,100 m. The MMS report by Turner (1988) contains a wealth of
data on the lithology, well logs, biostratigraphy, geother-mal, and structural and stratigraphic setting of the well. Corrected estimates of equilibrium bottom-hole logging temperature data from three depths were reported by Flett (1988a) and yielded a 2°C seafl oor temperature and a linear mean thermal gradient of 31°C/km. A variety of organic thermal maturity data were reported by Flett (1988b). However, vitrinite refl ectance (Ro) and spore coloration indices were diffi cult to evaluate due to excessive amounts of recycled organic matter. A mainly continuous vitrinite refl ectance trend was observed in-creasing from 0.25 to 1.2 percent with increasing depth except for a possible unconformity recognized near the bottom of the well between 4,684 m and 4,846 m where Ro abruptly increases from 0.6 to 0.8 percent. The corrected bottom-hole temperatures are approxi-mately consistent with the indicated vitrinite thermal maturities, despite the abundance of recycled vitrinite observed in the well samples. Biostratigraphic data did not indicate signifi cant erosional unconformities in the well, although the regional stratigraphy suggests possible unconformities in the middle Miocene, upper Oligocene and middle–upper Eocene sections.
Sedimentary provenance for the NAC section include Cenozoic volcanoplutonic rocks of the Aleutian mag-matic arc, Mesozoic magmatic arc rocks of the Beringian Margin–Alaska Range, and Proterozoic younger rocks of interior Alaska (for example, Finzel and others, 2005; Decker and others, 1994).
SAMPLE DETAILSNine core samples (1,279–5,094 m core depths)
from the NAC well were obtained in May 1994 from the ARCO Bayview core warehouse facility by the fi rst author. Sampled intervals and associated details are listed
Figure 1b. Northwest–southeast seismic section and map showing the stratigraphic and structural setting of the North Aleutian COST #1 well; from Finzel and others (2005).
180 RI 2008-1J Bristol Bay–Alaska Peninsula region, overview of 2004–2007 geologic research
in table 1. Mineral separation followed at Geochron Laboratories (Cambridge, MA) and workable apatite and zircon splits were recovered from six of the nine samples attempted. Fission-track analysis of apatite was performed by John Murphy at the University of Wyoming and of zircon by Shari Kelley at Southern Methodist University to constrain the thermal history and provenance of the section encountered in the NAC well. Detailed analytical methods are described in Ap-pendix 1 and an overview of the fi ssion-track method and discussion of important compositional controls is provided in Appendix 2.
AMBIENT THERMAL STRUCTURE, MATURITY DATA, AND GEOHISTORY ANALYSIS
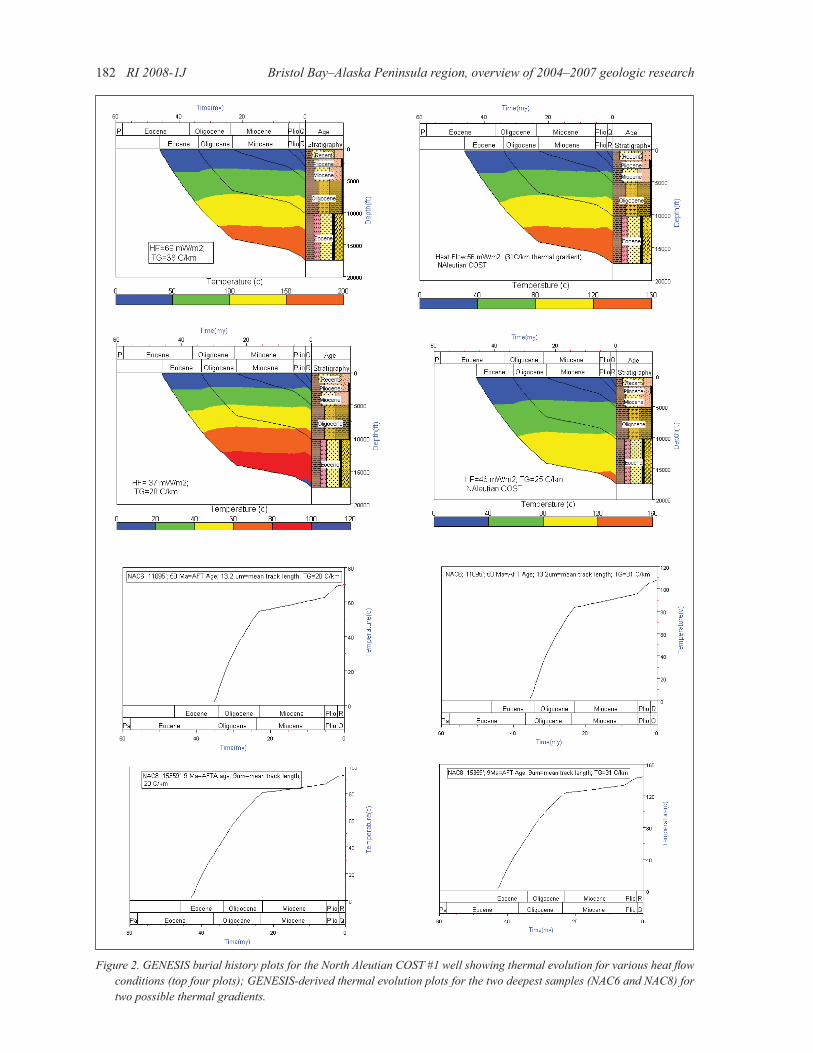
Burial history analyses (fi g. 2) were performed using the ZetaWare GENESIS software (http://www.zetaware.com) to evaluate the thermal history of the well (Zhiyong He, oral commun., 2004). Three bottom-hole tempera-tures are available from 1,378 to 4,975 m depths (Flett, 1988a). On the basis of the well stratigraphy (yielding a mean thermal conductivity of 1.8 W/mK) and observed corrected bottom-hole temperature-derived geothermal gradient of 31°C/km, the present-day heat fl ow in well is estimated at 56 mW/m2, which is signifi cantly below that estimated for the Bristol Bay area (70–90 mW/m2) using the recent compilation by Blackwell and Rich-ards (2004). The in-well heat fl ow is within the range observed for the Alaska Peninsula by Molenaar (1996), who summarized wells in the Bristol Bay Lowland with thermal gradients in the range 29–38°C/km. These lower gradients contrast with higher gradients associated with wells to the south along the Alaska Peninsula, near the active magmatic arc, that possess gradients in excess of 34–60°C/km.
RESULTSFission-track data are summarized in table 2,
comprising six samples in which a total of 181 apatite grains and 154 zircon grains were dated. Fission-track age and length data are summarized on depth plots in fi gure 3. Apatite fi ssion-track age and length distribu-tions are illustrated in histograms and radial plots in fi gure 4. Individual grain fi ssion-track age and uranium contents are plotted for the entire core population and individual samples in fi gure 5. Individual apatite and zircon fi ssion-track grain age data tables, and associated fi ssion-track age and length plots are presented in Ap-pendix 3. Electron microprobe analyses are not available for the NAC apatites, however, many dated apatites from other southern Alaska wells have been analyzed with the electron microprobe and summarized herein to illustrate possible compositional attributes (fi gs. 6, 7). The detailed discussion of these other samples is beyond the scope of this paper and the summary plots are only presented here to demonstrate some preliminary observations on nearby well samples and to highlight potential for future research.
DISCUSSIONPROVENANCE
All apatite and zircon populations are complex and refl ect mixtures of several age components based on chi2 statistics, which indicate multiple age populations for four of the six apatite samples and all of the zircon samples. Spectral peak analysis of the zircon fi ssion-track ages show the following fi ve peak age groups for the entire sample suite: 12±3, 25±3, 35±3, 48±3, and 84±3 Ma. For the deepest two Eocene cores (3,382 and 4,681 m core depths), the zircon fi ssion-track data are consistent with a relatively simple consanguineous volcanoplutonic arc source (~40 Ma mean zircon fi ssion-
Table 1. Sample details for cores from the North Aleutian COST #1 well, Alaska
Ave. Depth Temperature Approx. depositional Depth (ft) (ft) (m) °C core# Epoch Ma Formation Lithology
94NAC1 4,191–4,199 4,195 1,279 38 C2 Middle Miocene 15 Bear Lake/Unga fg volc ss/tuff94NAC2 5,970–5,999 5,985 1,824 55 C4 Late Oligocene 24 Stepovak fg volc ss94NAC3 8,056–8,069 8,063 2,458 75 C7 Early Oligocene 29 Stepovak vfg ss/siltstone94NAC4 8,640–8,648 8,644 2,635 80 C8 Early Oligocene 33 Stepovak vfg ss94NAC5 9,951–9,959 9,955 3,304 93 C10 Late Eocene 38 Stepovak vfg volc ss/tuff94NAC6 11,089–11,100 11,095 3,382 104 C13 Eocene 40 Tolstoi f-mg xl lith tuff94NAC7 12,249–12,257 12,253 3,735 115 C14 Eocene 42 Tolstoi vfg volc ss/tuff94NAC8 15,355–15,362 15,359 4,681 144 C17 Eocene 47 Tolstoi f-mg volc ss94NAC9 16,709–16,714 16,712 5,094 157 C19 Eocene 50 Tolstoi lapilli tuff
NotesTemperatures interpolated from corrected bottom hole temperatures; subsea temperature=2°C; linear geothermal gradient =31.1°C/km.Depositional epoch from Turner (1988); absolute ages approximated using the ICS timescale (http://www.stratigraphy.org).Formation nomenclature from Finzel and others (2005); lithologies based on thin section inspection.v=very , f=fi ne, m=medium, g=grained, volc=volcaniclastic, ss=sandstone.
Fission track geochronology of the North Aleutian COST #1 Well (OCS-8218), Bristol Bay Basin, Alaska 181
Table 2. Summary of apatite and zircon fi ssion-track age data for the North Aleutian COST #1 well, Alaska
Apatite Apatite Apatite Zircon Zircon Ave. Depth Temp. Depos. Depos. age (Ma) mtl (μm) U age (Ma) U (ft) (m) °C age Ma Epoch (no. grains) (sd, ntr) (ppm) (no. grains) (ppm)
94NAC1 4,195 1,279 38 15 M Mioc 30±4.0 (31) 12.2±0.25 (2.2, 75) 29 69±10 (20) 58094NAC2 5,985 1,824 55 28 L Olig 32±3.1 (31) 12.6±0.16 (1.6, 100) 20 58±5.2 (30) 61794NAC3 8,063 2,458 75 33 E Olig 74±7.4 (31) 12.5±0.17 (1.7, 106) 15 50±5.5 (29) 45394NAC5 9,955 3,304 93 38 L Eoc 35±3.7 (31) 13.4±0.26 (2.6, 101) 7 47± 4 (41) 57394NAC6 11,095 3,382 104 43 Eoc 50±5.6 (26) 13.3±0.24 (1.9, 63) 3 37± 3 (20) 51594NAC8 15,359 4,681 144 50 Eoc 8.9±1.7 (31) 9.0±1.3 (3.1, 6) 4 39± 4 (14) 428
Ave.=average, Temp.=temperature, Depos.=depositional, mtl=mean track length, sd=standard deviation, ntr=number of tracks
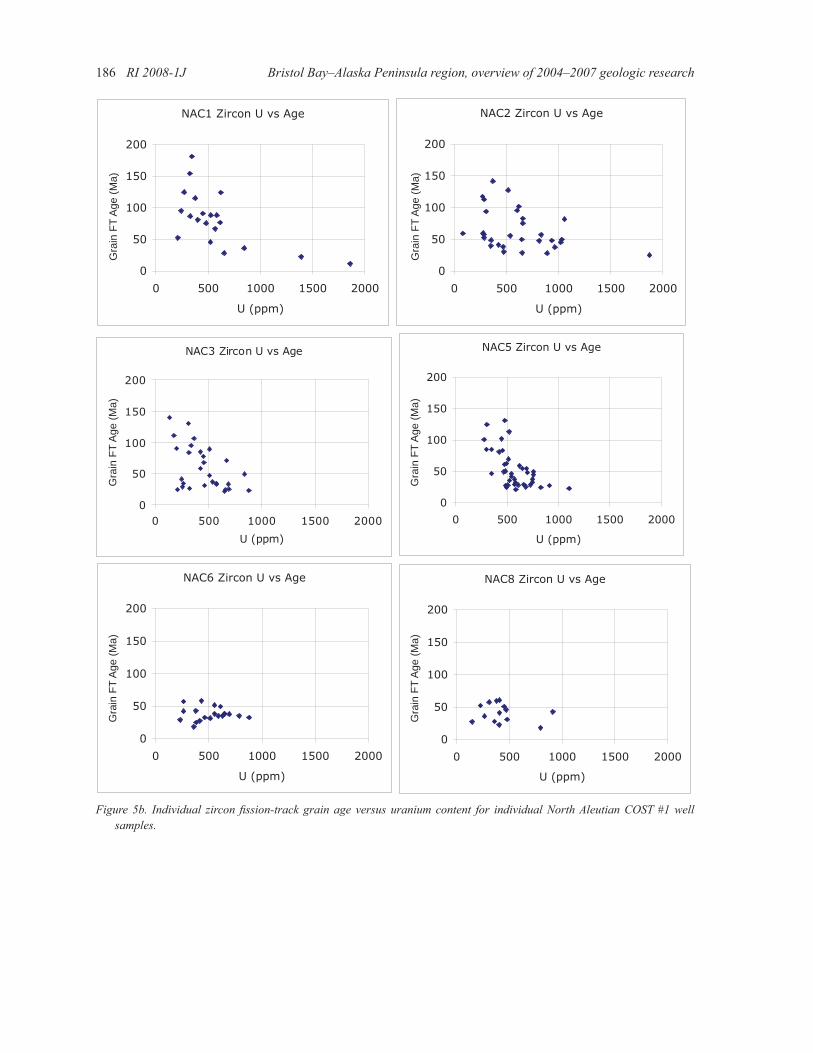
track ages, yet failing the chi2 test for a single population) and a more complex assemblage of Mesozoic plutonic basement rocks and Cenozoic volcanic source terranes for younger Eocene to Miocene deposits based on four cores shallower than 3,034 m. The mean zircon ages of the shallower four cores range from 53 to 82 Ma, systematically increasing in age going upsection, with individual grain ages in the range 20–200 Ma. All sam-ples show a broadly negative correlation between zircon fi ssion-track grain age and uranium content. The zircon fi ssion-track ages from Eocene to Miocene cores indi-cate systematic Mesozoic to Cenozoic source terranes with ages averaging 10–50 m.y. older than depositional ages. Apatite grains are therefore inferred to possess a detrital age component that may be 10–50 m.y. older than depositional ages. The shallowest four samples contain zircons with the widest range in both fi ssion-track age and uranium content, indicating a more complex prov-enance than that of the deeper two samples, which show very limited age and uranium content ranges.
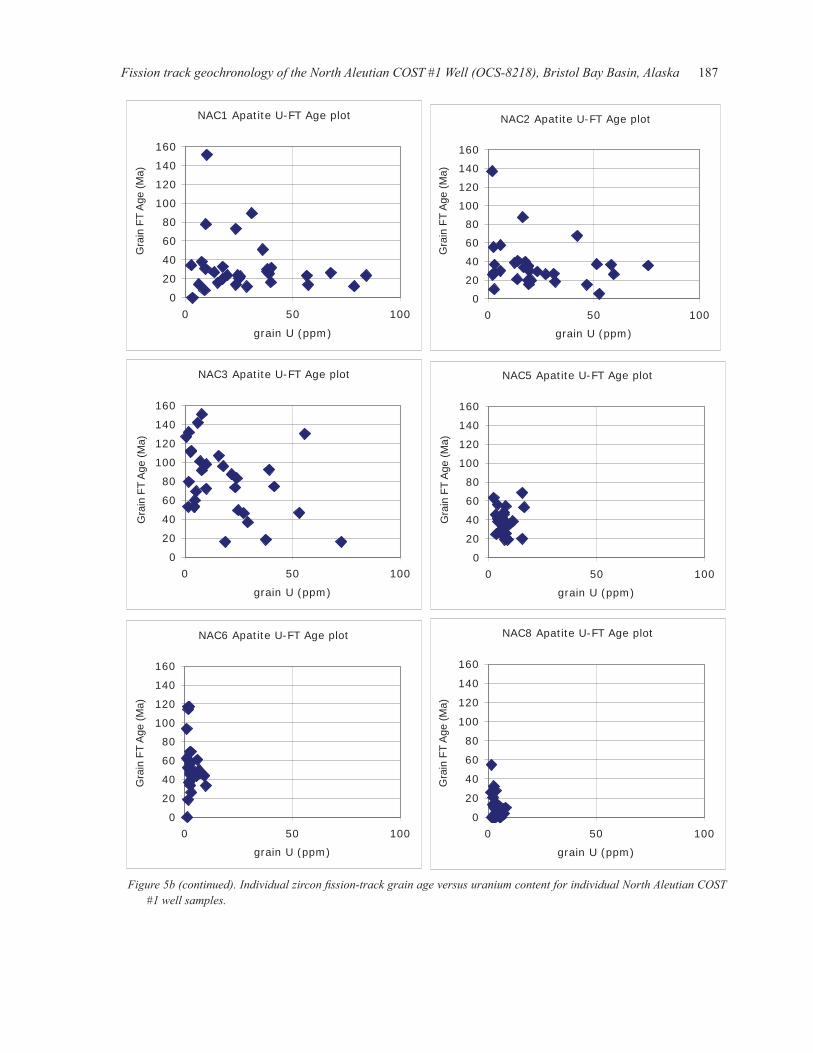
Apatites display similar, yet slightly contrasting trends, with the shallowest three samples similarly possessing the widest range in both fi ssion-track age and uranium content, whereas the three deeper samples possess apatites with limited uranium contents, but only samples NAC5 and NAC8 show limited fi ssion-track age range (fi g. 5). Both zircon fi ssion-track ages and uranium contents both systematically decrease with increasing depth (table 2, fi gs. 3 and 5). Similarly, apatite uranium content also decreases with increasing depth, whereas apatite fi ssion-track age shows a more complex depth trend due to partial resetting of the deepest sample, NAC8. The zircon and apatite uranium contents are consistent with these phases having been derived by progressive unroofi ng of an evolving Mesozoic to Ce-nozoic magmatic arc terrane with the deepest samples representing a more primitive (lower-uranium) source magmatic rocks and the youngest samples represent-ing more evolved (higher-uranium) magmatic rocks. Therefore, initially primitive late Mesozoic- to early
Cenozoic-age mafi c to intermediate magmatic rocks represented the dominant provenance during the Eocene deposition, whereas the younger Oligocene to Miocene deposits refl ect more diverse provenance including late Mesozoic- to early Cenozoic-age mafi c, intermediate, and felsic magmatic rocks.
THERMAL HISTORYFive of the six samples possess apatite central fi s-
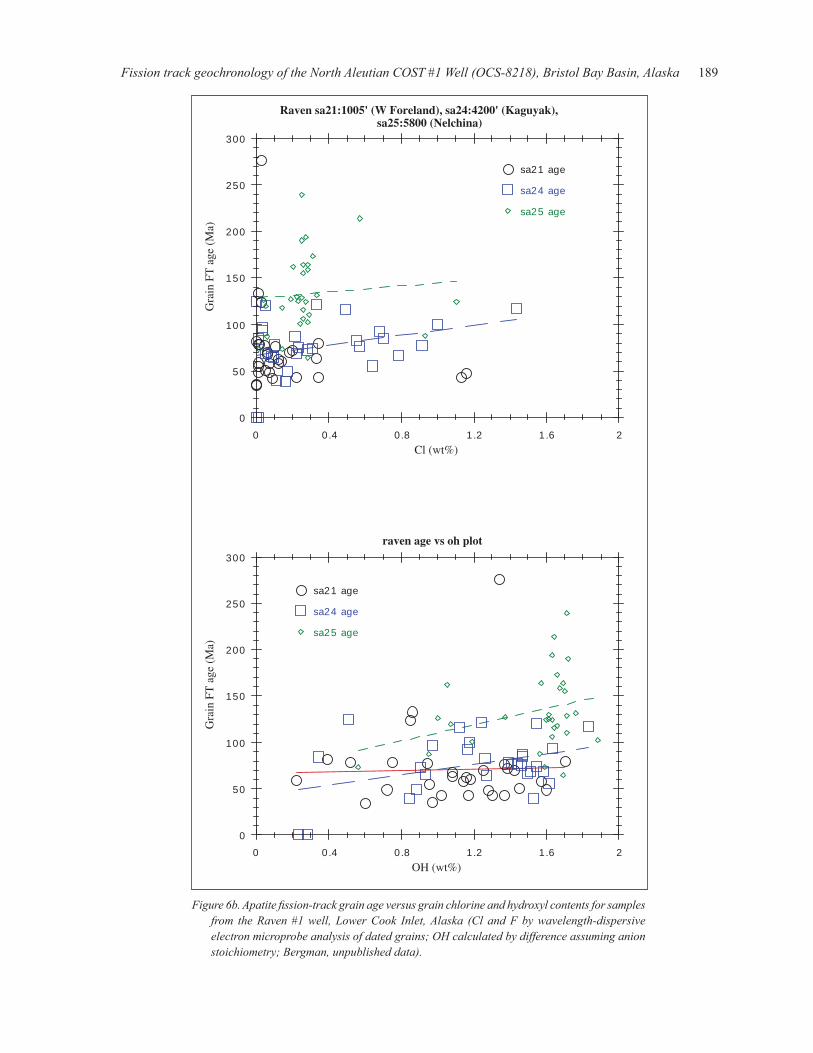
sion-track ages within analytical uncertainty of, or older than, depositional ages; mean track lengths vary between 12 and 13 μm (fi g. 5). These samples currently reside at temperatures of 38–100±10°C, below or within the zone of fl uorine-rich apatite fi ssion track partial stability (~60–120°C), hence the ages and track length distribu-tions may refl ect minimal post-depositional annealing and age reduction. The deepest sample, NAC8, however, currently resides at a temperature of 144°C, signifi cantly above the apatite fi ssion-track annealing temperature (120–130°C), yet displays an apatite fi ssion-track age of 9 Ma, refl ecting a 75–90 percent age reduction, and a mean track length of 9 μm, refl ecting a 40 percent length reduction. Based on the abundance of chlorine- and hydroxyl-rich apatites observed in southern Alaska wells and apatites in general (fi gs. 6, 7), the NAC apatites are likely to possess similar diverse anion compositions, and therefore require higher fi ssion-track closure tempera-tures of 130–150°C. If NAC8 apatites are fl uorine-rich, then the apatite age and length data are more consistent with a sample that has experienced temperatures of 100–120°C for the last 1–10 m.y., signifi cantly below the observed 144°C temperature based on the corrected bot-tom-hole temperatures. It is more likely that the NAC8 apatites contain a signifi cant population of chlorine- and hydroxyl-rich (1–2 wt %) grains, consistent with the indicated thermal history assuming the present-day heat fl ow of 56 mW/m2 has existed in the past. As shown in the apatite fi ssion-track age-chlorine plots in fi gure 6a, the Lower Cook Inlet COST well and many others in the region contain a majority of apatites with 0.5–2 wt %
182 RI 2008-1J Bristol Bay–Alaska Peninsula region, overview of 2004–2007 geologic research
Figure 2. GENESIS burial history plots for the North Aleutian COST #1 well showing thermal evolution for various heat fl ow conditions (top four plots); GENESIS-derived thermal evolution plots for the two deepest samples (NAC6 and NAC8) for two possible thermal gradients.
Fission track geochronology of the North Aleutian COST #1 Well (OCS-8218), Bristol Bay Basin, Alaska 183
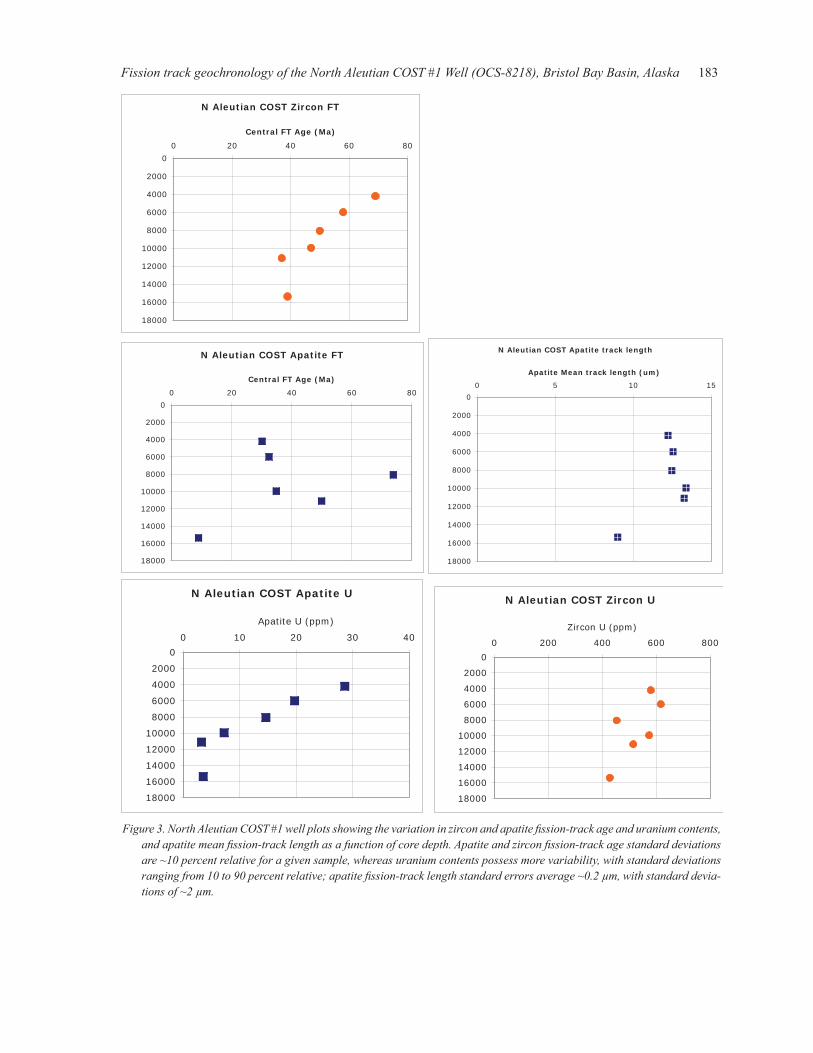
Figure 3. North Aleutian COST #1 well plots showing the variation in zircon and apatite fi ssion-track age and uranium contents, and apatite mean fi ssion-track length as a function of core depth. Apatite and zircon fi ssion-track age standard deviations are ~10 percent relative for a given sample, whereas uranium contents possess more variability, with standard deviations ranging from 10 to 90 percent relative; apatite fi ssion-track length standard errors average ~0.2 μm, with standard devia-tions of ~2 μm.
N Aleutian COST Zircon FT
0
2000
4000
6000
8000
10000
12000
14000
16000
18000
0 20 40 60 80
Central FT Age (Ma)
N Aleutian COST Apatite FT
0
2000
4000
6000
8000
10000
12000
14000
16000
18000
0 20 40 60 80
Central FT Age (Ma)
N Aleutian COST Apatite track length
0
2000
4000
6000
8000
10000
12000
14000
16000
18000
0 5 10 15
Apatite Mean track length (um)
N Aleutian COST Apatite U
0
2000
4000
6000
8000
10000
12000
14000
16000
18000
0 10 20 30 40
Apatite U (ppm)
N Aleutian COST Zircon U
0
2000
4000
6000
8000
10000
12000
14000
16000
18000
0 200 400 600 800
Zircon U (ppm)
184 RI 2008-1J Bristol Bay–Alaska Peninsula region, overview of 2004–2007 geologic research
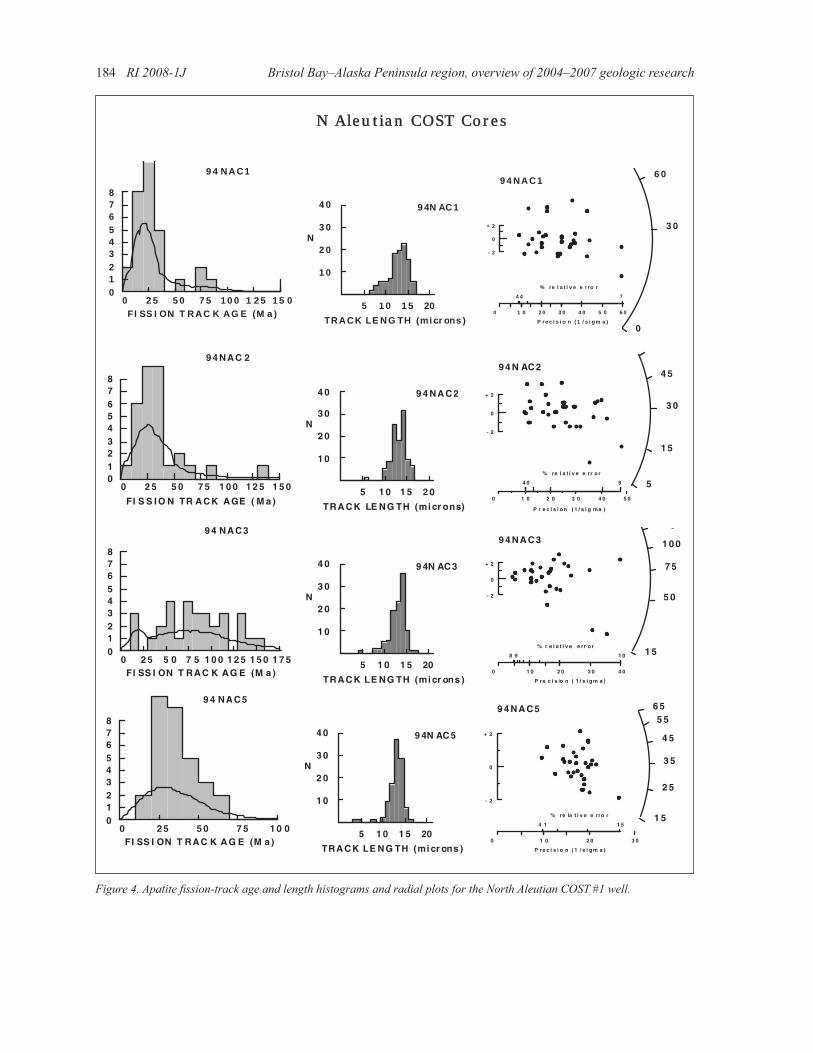
Figure 4. Apatite fi ssion-track age and length histograms and radial plots for the North Aleutian COST #1 well.
N Aleutian COST Cores
012345678
1 5 01 2 51 0 07 55 02 50FI SS I ON T RAC K AG E (M a )
9 4 NAC1
1 0
2 0
3 0
4 0
5 1 0 1 5 20TRACK LE NG TH (mi cr ons )
9 4N AC1
N
9 4 NAC1
0
3 0
6 0
- 2
0
+ 2
4 4 7
% re l a t i v e e rro r
0 1 0 2 0 3 0 4 0 5 0 6 0
P re c i s i o n ( 1 / s i gm a )
012345678
1 5 01 2 51 0 07 55 02 50
FI S S I O N TR ACK AGE ( M a )
9 4 NAC 2
1 0
2 0
3 0
4 0
5 1 0 1 5 2 0
TRACK LE NG TH (mi cr ons)
9 4 NAC2
N
9 4 N AC2
5
1 5
3 0
4 5
- 2
0
+ 2
4 0 9
% re l a t i v e e rr o r
0 1 0 2 0 3 0 4 0 5 0
P r e c i s i o n ( 1 / s i g ma )
012345678
1 7 51 5 01 2 51 0 07 55 02 50FI SS I ON T RAC K AG E (M a )
9 4 NAC3
1 0
2 0
3 0
4 0
5 1 0 1 5 20
TRACK LE NG TH (mi cr ons )
9 4N AC3
N
9 4 NAC3
1 5
5 0
7 5
1 0 0
5
- 2
0
+ 2
8 9 1 0
% r e l a t i v e e rr o r
0 1 0 2 0 3 0 4 0
P re c i s io n ( 1 / s i gm a )
012345678
1 0 07 55 02 50FI SS I ON T RAC K AG E (M a )
9 4 NAC5
1 0
2 0
3 0
4 0
5 1 0 1 5 20
TRACK LE NG TH (mi cr ons )
9 4N AC5
N
9 4 NAC5
1 5
2 5
3 5
4 5
5 56 5
- 2
0
+ 2
4 1 1 5
% re la t i v e e rro r
0 1 0 2 0 3 0
P re c i s i o n ( 1 / s i gm a )
Fission track geochronology of the North Aleutian COST #1 Well (OCS-8218), Bristol Bay Basin, Alaska 185
012345678
1 2 51 0 07 55 02 50FI SS I ON T RAC K AG E (M a )
9 4 NAC6
1 0
2 0
3 0
4 0
5 1 0 1 5 20
TRACK LE NG TH (mi cr ons )
9 4N AC6
N
9 4 NAC6
2 5
5 0
7 5
1 0 0
- 2
0
+ 2
1 0 0 2 2
% re l a t i v e e rro r
0 4 8 1 2 1 6
P re c i s i o n ( 1 / s i g m a )
012345678
7 55 02 50FI SS I ON T RAC K AG E (M a )
9 4 NAC8
1 0
2 0
3 0
4 0
5 1 0 1 5 20TRACK LE NG TH (mi cr ons )
9 4N AC8
N
9 4 NAC8
0
1 0
2 0
3 04 0
- 2
0
+ 2
5 5 2 2
% r e l a t i v e e rr o r
0 4 8 1 2 1 6
P re c i s i o n ( 1 / s i gm a )
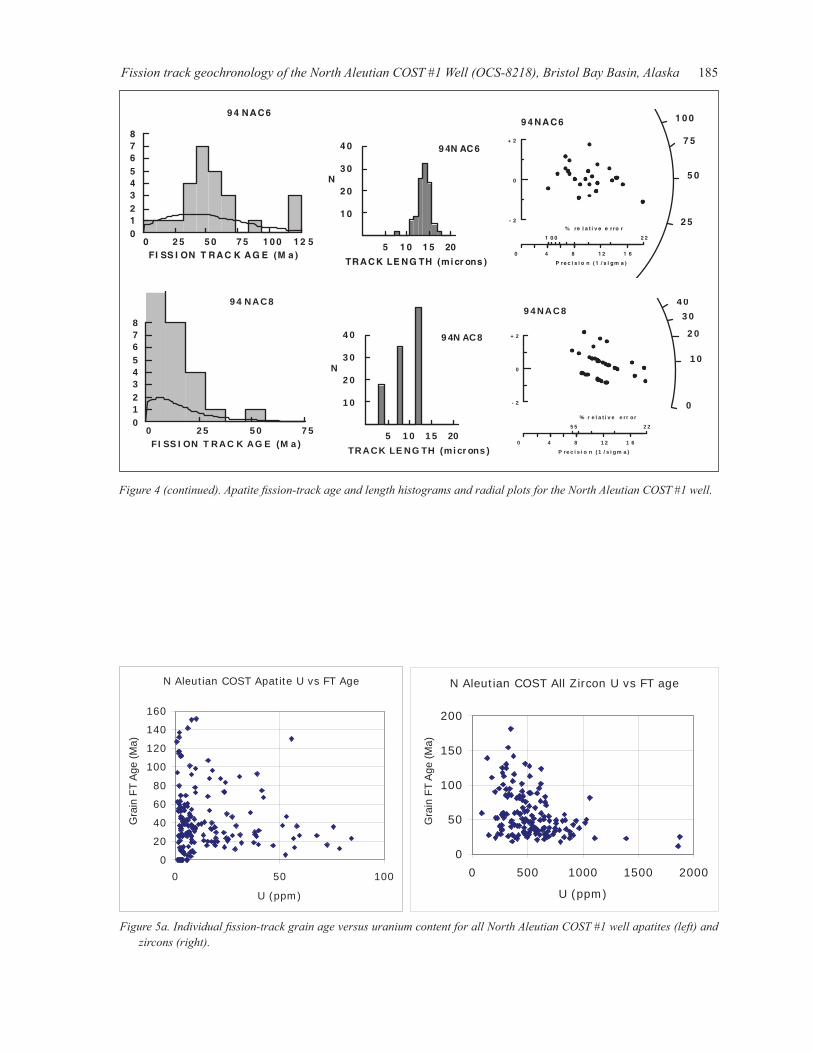
Figure 4 (continued). Apatite fi ssion-track age and length histograms and radial plots for the North Aleutian COST #1 well.
N Aleutian COST Apatite U vs FT Age
0
20
40
60
80
100
120
140
160
0 50 100
U (ppm)
N Aleutian COST All Zircon U vs FT age
0
50
100
150
200
0 500 1000 1500 2000
U (ppm)
Figure 5a. Individual fi ssion-track grain age versus uranium content for all North Aleutian COST #1 well apatites (left) and zircons (right).
Gra
in F
T A
ge (M
a)
Gra
in F
T A
ge (M
a)
186 RI 2008-1J Bristol Bay–Alaska Peninsula region, overview of 2004–2007 geologic research
Figure 5b. Individual zircon fi ssion-track grain age versus uranium content for individual North Aleutian COST #1 well samples.
Gra
in F
T A
ge (M
a)
Gra
in F
T A
ge (M
a)
Gra
in F
T A
ge (M
a)
Gra
in F
T A
ge (M
a)
Gra
in F
T A
ge (M
a)
Gra
in F
T A
ge (M
a)
Fission track geochronology of the North Aleutian COST #1 Well (OCS-8218), Bristol Bay Basin, Alaska 187
NAC1 Apatite U-FT Age plot
0
20
40
60
80
100
120
140
160
0 50 100
grain U (ppm)
NAC2 Apatite U-FT Age plot
0
20
40
60
80
100
120
140
160
0 50 100
grain U (ppm)
NAC3 Apatite U-FT Age plot
0
20
40
60
80
100
120
140
160
0 50 100
grain U (ppm)
NAC5 Apatite U-FT Age plot
0
20
40
60
80
100
120
140
160
0 50 100
grain U (ppm)
NAC6 Apatite U-FT Age plot
0
20
40
60
80
100
120
140
160
0 50 100
grain U (ppm)
NAC8 Apatite U-FT Age plot
0
20
40
60
80
100
120
140
160
0 50 100
grain U (ppm)
Figure 5b (continued). Individual zircon fi ssion-track grain age versus uranium content for individual North Aleutian COST #1 well samples.
Gra
in F
T A
ge (M
a)
Gra
in F
T A
ge (M
a)
Gra
in F
T A
ge (M
a)
Gra
in F
T A
ge (M
a)
Gra
in F
T A
ge (M
a)
Gra
in F
T A
ge (M
a)

188 RI 2008-1J Bristol Bay–Alaska Peninsula region, overview of 2004–2007 geologic research
Figure 6a. Apatite fi ssion-track grain age versus grain chlorine content for samples from the Lower Cook Inlet COST #1 and SCU 33–33 wells, Lower Cook Inlet, Alaska (Cl by wavelength-dispersive electron microprobe analysis of dated grains; Bergman, unpublished data).
0
50
100
150
200
250
300
350
400
0 0.4 0.8 1.2 1.6Cl (wt%)
SCU 33-33 sa26:10900' W Foreland, gc104-4:11796' Naknekgc104-5:15759' Tuxedni, gc104-6:17632' Talkeetna
sa26 age
gc104-4 age
gc104-5 age
gc104-6 age
2
0
50
100
150
200
250
300
0 0.5 1 1.5 2 2.5Cl (wt%)
LCI COST-1 sa1:5395' Nelchina, sa2:7014' Jurassic,sa3:9336' Naknek, sa4:12358' Naknek
sa1 age
sa2 age
sa3 age
sa4 age
Gra
in F
T A
ge (M
a)G
rain
FT
Age
(Ma)
Fission track geochronology of the North Aleutian COST #1 Well (OCS-8218), Bristol Bay Basin, Alaska 189
Figure 6b. Apatite fi ssion-track grain age versus grain chlorine and hydroxyl contents for samples from the Raven #1 well, Lower Cook Inlet, Alaska (Cl and F by wavelength-dispersive electron microprobe analysis of dated grains; OH calculated by difference assuming anion stoichiometry; Bergman, unpublished data).
0
50
100
150
200
250
300
0 0.4 0.8 1.2 1.6 2Cl (wt%)
Raven sa21:1005' (W Foreland), sa24:4200' (Kaguyak), sa25:5800 (Nelchina)
sa21 age
sa24 age
sa25 ageG
rain
FT
age
(M
a)
0
50
100
150
200
250
300
0 0.4 0.8 1.2 1.6 2OH (wt%)
raven age vs oh plot
Gra
in F
T a
ge (
Ma)
sa21 age
sa24 age
sa25 age
190 RI 2008-1J Bristol Bay–Alaska Peninsula region, overview of 2004–2007 geologic research
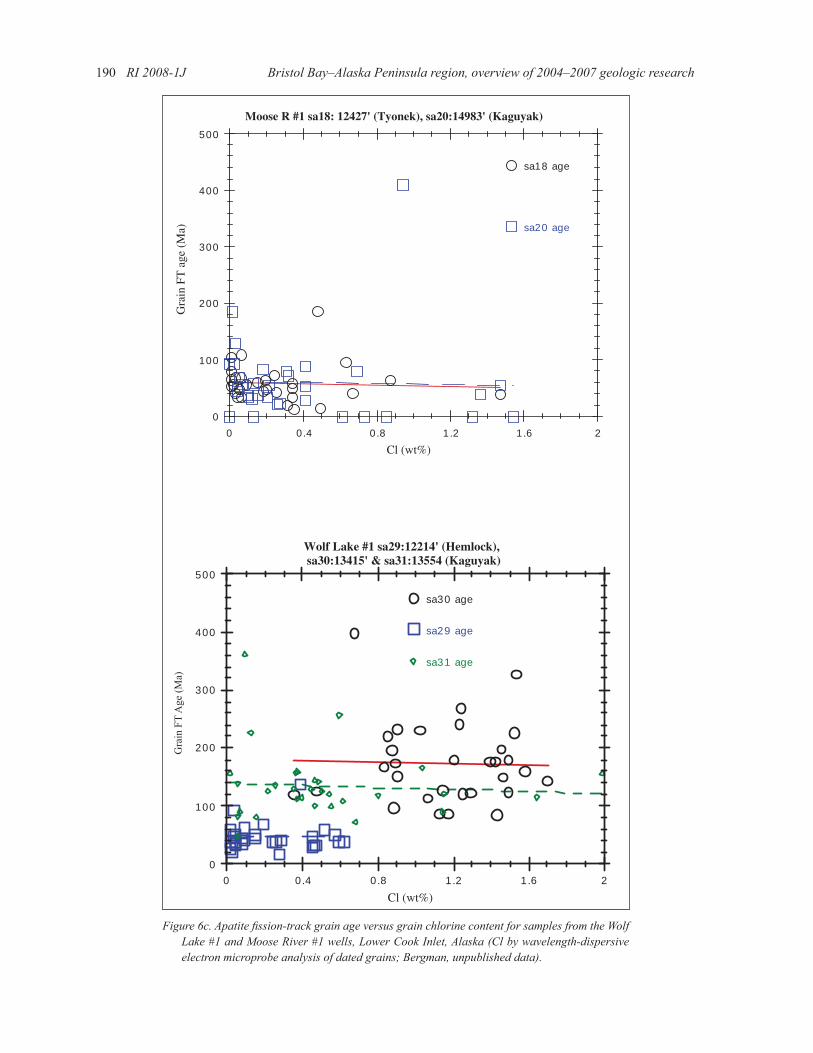
Figure 6c. Apatite fi ssion-track grain age versus grain chlorine content for samples from the Wolf Lake #1 and Moose River #1 wells, Lower Cook Inlet, Alaska (Cl by wavelength-dispersive electron microprobe analysis of dated grains; Bergman, unpublished data).
0
100
200
300
400
500
0 0.4 0.8 1.2 1.6 2Cl (wt%)
Moose R #1 sa18: 12427' (Tyonek), sa20:14983' (Kaguyak)
sa18 age
sa20 age
Gra
in F
T a
ge (
Ma)
0
100
200
300
400
500
0 0.4 0.8 1.2 1.6 2
sa30 age
Cl (wt%)
Wolf Lake #1 sa29:12214' (Hemlock), sa30:13415' & sa31:13554 (Kaguyak)
sa29 age
sa31 age
Gra
in F
T A
ge (M
a)
Fission track geochronology of the North Aleutian COST #1 Well (OCS-8218), Bristol Bay Basin, Alaska 191
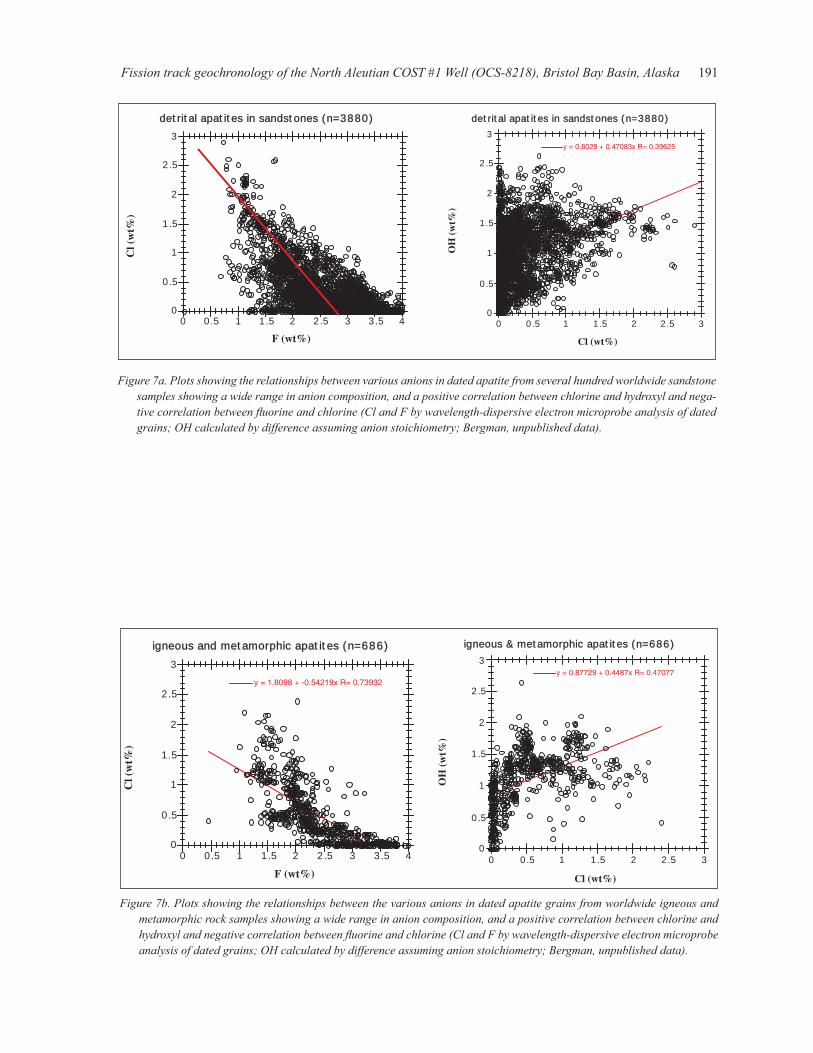
Figure 7a. Plots showing the relationships between various anions in dated apatite from several hundred worldwide sandstone samples showing a wide range in anion composition, and a positive correlation between chlorine and hydroxyl and nega-tive correlation between fl uorine and chlorine (Cl and F by wavelength-dispersive electron microprobe analysis of dated grains; OH calculated by difference assuming anion stoichiometry; Bergman, unpublished data).
0
0.5
1
1.5
2
2.5
3
0 0.5 1 1.5 2 2.5
F (wt%)
detrital apatites in sandstones (n=3880)
3 3.5 4
Cl (
wt%
)
detrital apatites in sandstones (n=3880)
detrital apatites in sandstones (n=3880)
0
0.5
1
1.5
2
2.5
3
0 0.5 1 1.5 2 2.5 3
Cl (wt%)
detrital apatites in sandstones (n=3880)
y = 0.8029 + 0.47083x R= 0.39625
OH
(w
t%)
Figure 7b. Plots showing the relationships between the various anions in dated apatite grains from worldwide igneous and metamorphic rock samples showing a wide range in anion composition, and a positive correlation between chlorine and hydroxyl and negative correlation between fl uorine and chlorine (Cl and F by wavelength-dispersive electron microprobe analysis of dated grains; OH calculated by difference assuming anion stoichiometry; Bergman, unpublished data).
0
0.5
1
1.5
2
2.5
3
0 0.5 1 1.5 2 2.5
F (wt%)
igneous and metamorphic apatites (n=686)
3 3.5 4
Cl (
wt%
)
y = 1.8098 + -0.54219x R= 0.73932
igneous & metamorphic apatites (n=686)
igneous and metamorphic apatites (n=686)
0
0.5
1
1.5
2
2.5
3
0 0.5 1 1.5 2 2.5 3
y = 0.87729 + 0.4487x R= 0.47077
Cl (wt%)
igneous & metamorphic apatites (n=686)
OH
(w
t%)
192 RI 2008-1J Bristol Bay–Alaska Peninsula region, overview of 2004–2007 geologic research
chlorine, and positive fi ssion track age–chlorine content correlations, suggesting that higher apatite fi ssion-track closure temperatures of 130–150°C may be more ap-propriate for southern Alaska well apatite fi ssion-track analysis interpretations.
CONCLUSIONSCorrected bottom-hole temperatures, combined with
inferred lithology-dependent thermal conductivities indicate a present-day day heat fl ow of 56 mW/m2 for the NAC well site. The stratigraphic section encoun-tered in the NAC well is currently at or near maximum experienced burial temperatures. Both the vitrinite and apatite fi ssion-track data are consistent with a simple Cenozoic burial history and a Cenozoic heat fl ow near or below 56 mW/m2. Due to an abundance of chlorine- and hydroxyl-rich apatites observed in southern Alaska wells, slightly higher closure temperatures may be ap-propriate for the valid interpretation of apatite fi ssion track thermochronology data. New apatite and zircon FT and Uranium data provide constraints on the nature of the provenance of volcaniclastic and sedimentary strata encountered in the Bristol Bay Basin.
ACKNOWLEDGMENTSThese data were released by ARCO in 2000; many
thanks to Barry Davis. The authors thank ARCO Re-search Thermochronology Lab colleagues Jeff Corrigan and James Talbot, ARCO Alaska colleagues John Decker and Dave Doherty, Alaska Division of Geological & Geophysical Surveys colleagues Rocky Reifenstuhl and Jim Clough and former colleague Mark Robinson, as well as Alaska Division of Oil & Gas colleague Paul Decker, for their valued support. Zhiyong He kindly pro-vided access to the Genesis burial modeling software for this study. Paul Layer and Rocky Reifenstuhl provided thoughtful reviews that improved the manuscript and for which the authors are most appreciative.
REFERENCES CITEDBlackwell, D.D., and Richards, M., editors, 2004, Geo-
thermal Map of North America: Tulsa, OK, Ameri-can Association of Petroleum Geologists, 1 sheet, scale 1:6,500,000; http://www.smu.edu/geothermal/2004NAMap/2004NAmap.htm.
Bond, G.C., Lewis, S.D., Taber, J., Steckler, M.S., and Kominz, M.A., 1988, Evidence for formation of a fl exural back arc basin by compression and crustal thickening in the central Alaska Peninsula: Geology, v. 16, p. 1,147–1,150.
Carlson, W.D., 1990, Mechanisms and kinetics of apatite fi ssion track annealing: American Mineralogist, v. 75, p. 1,120–1,139.
Carlson, W.D., Donelick, R.A., and Ketcham, R.A., 1999, Variability of apatite fi ssion track annealing kinetics I; Experimental results: American Mineralogist, v. 84, p. 1,213–1,223.
Crowley, K.D., 1985, Thermal signifi cance of fi ssion track length distributions: Nuclear Tracks, v. 10, p. 311–322.
Decker, J., Bergman, S.C., Blodgett, R.B., Box, S.E., Bundtzen, T.K., Clough, J.G., Coonrad, W.L., Gilbert, W.G., Miller, M.L., Murphy, J.M., Robinson, M.S., and Wallace, W.K., 1994, Geology of southwestern Alaska, in Plafker, G., and Berg, H.C., eds., The geology of Alaska: Boulder, CO, Geological Society of America, The Geology of North America, v. G1, p. 285–310.
DeMets, Charles, Gordon, R.G., Argus, D.F., and Stein, Seth, 1994, Effects of recent revisions to the geo-magnetic reversal time scale on estimates of current plate motions: Geophysical Research Letters, v. 21, p. 2,191–2,194.
Detterman, R.L., Case, J.E., Miller, J.W., Wilson, F.H., and Yount, M.E., 1996, Stratigraphic framework of the Alaska Peninsula: U.S. Geological Survey Bul-letin 1969-A, 74 p.
Dodson, M.H., and McClelland-Brown, E., 1985, Isoto-pic and paleomagnetic evidence for rates of cooling, uplift, and erosion, in Snelling, N.J., ed., The chronol-ogy of the geological record: Geological Society of London, Memoir 10, p. 315–325.
Donelick, R.A., Ketcham, R.A., and Carlson, W.D., 1999, Variability of apatite fi ssion-track annealing kinetics; II, Crystallographic orientation effects: American Mineralogist, v. 84, p. 1,224–1,234.
Donelick, R.A., O’Sullivan, P.B, and Ketcham, R.A., 2005, Apatite fi ssion-track analysis: Reviews in Min-eralogy and Geochemistry, v. 58, no. 1, p. 49–94.
Finzel, E.S., Reifenstuhl, R.R., Decker, P.L., and Ridg-way, K.D., 2005, Sedimentology, stratigraphy, and hydrocarbon reservoir-source rock potential, using surface and subsurface data, of Tertiary and Mesozoic strata, Bristol Bay Basin and Alaska Peninsula: Alaska Division of Geological & Geophysical Surveys Pre-liminary Interpretive Report 2005-4, 67 p.
Fleischer, R.L., Price, P.B., and Walker, R.M., 1975, Nuclear tracks in solids: Los Angeles, University of California Press, 605 p.
Flett, T.O., 1988a, Geothermal gradient, in Turner, R.F., ed., Geological and operational summary, North Aleu-tian Shelf COST No. 1 well, Bering Sea, Alaska: U.S. Minerals Management Service, OCS Report MMS 88-0089, p. 180–183.
Flett, T.O., 1988b, Organic geochemistry, in Turner, R.F., ed., Geological and operational summary, North Aleu-tian Shelf COST No. 1 well, Bering Sea, Alaska: U.S.
Fission track geochronology of the North Aleutian COST #1 Well (OCS-8218), Bristol Bay Basin, Alaska 193
Minerals Management Service, OCS Report MMS 88-0089, p. 184–202.
Gallagher, K., Brown, R.W., and Johnson, C., 1998, Fis-sion track analysis and its applications to geological problems: Annual Reviews of Earth and Planetary Sciences, v. 26, p. 519–572.
Gleadow, A.J.W., and Duddy, I.R., 1981, A natural long term annealing experiment for apatite: Nuclear Tracks, v. 5, p. 169–174.
Gleadow, A.J.W., Duddy, I.R., and Lovering, J.F., 1983. Fission track analysis; A new tool for the evalua-tion of thermal histories and hydrocarbon potential: Australian Petroleum Association Journal, v. 23, p. 93–102.
Gradstein, F.M., Ogg, J.G., Smith, A.G., Agterberg, F.P., Bleeker, W., Cooper, R.A., Davydov, V., Gibbard, P., Hinnov, L.A., House, M.R., Lourens, L., Luter-bacher, H.P., McArthur, J., Melchin, M.J., Robb, L.J., Shergold, J., Villeneuve, M., Wardlaw, B.R., Ali, J., Brinkhuis, H., Hilgen, F.J., Hooker, J., Howarth, R.J., Knoll, A.H., Laskar, J., Monechi, S., Plumb, K.A., Powell, J., Raffi , I., Röhl, U., Sadler, P., Sanfi lippo, A., Schmitz, B., Shackleton, N.J., Shields, G.A., Strauss, H., Van Dam, J., van Kolfschoten, T., Veizer, J., and Wilson, D., 2004, A geologic time scale 2004: Cambridge University Press, 589 p.
Green, P.F., Duddy, I.R., Gleadow, A.J.W., and Lovering, J.F., 1989, Apatite fi ssion track analysis as a paleo-temperature indicator for hydrocarbon exploration, in Naeser, N.D., and McCulloch, T.H., eds., Thermal history of sedimentary basins; methods and case his-tories: New York, Springer-Verlag, p. 181-195.
Green, P.F., Duddy, I.R., Laslett, G.M., Hegarty, K.A., Gleadow, A.J.W., and Lovering, J.F., 1989, Thermal annealing of fi ssion tracks in apatite; 4, Quantitative modeling techniques and extension to geological timescales: Chemical Geology (Isotope Geoscience Section), v. 79, no. 2, p. 155–182.
Larson, J.A., 1988, Paleontology and Biostratigraphy, in Turner, R.F., ed., Geological and operational sum-mary, North Aleutian Shelf COST No. 1 well, Bering Sea, Alaska: U.S. Minerals Management Service, OCS Report MMS 88-0089, p. 159–179.
Laslett, G.M., Green, P.F., Duddy, I.R., and Gleadow, A.J.W., 1987, Thermal modeling of fi ssion tracks in apatite: 2. A quantitative analysis: Chemical Geology, v. 65, p. 1–13.
Molenaar, C.M., 1996, Thermal-maturity patterns and geothermal gradients on the Alaska Peninsula, in Johnsson, M.J., and Howell, D.G., eds., Thermal evolution of sedimentary basins in Alaska: U.S. Geo-logical Survey Bulletin 2142, p. 11–19.
Murphy J.M., and Clough, J.G., 1999, Low-temperature thermal history using fi ssion track dating in three wells in southern Alaska offshore basins; Lower Cook Inlet,
Shelikof Strait, and Stevenson Trough: Marine Geo-resources and Geotechnology, v. 17, p. 271–281.
Naeser, C.W., 1979. Fission track dating and geological annealing of fi ssion tracks, in Jager, E. and Hunziker, J.C., eds., Lectures in Isotope Geology: New York, Springer-Verlag, p. 154–169.
Naeser, C.W., 1981. The fading of fi ssion tracks in the geologic environment; Data from deep drill holes: Nuclear Tracks, v. 5, p. 248–250.
Naeser, C.W., and Faul, H., 1969, Fission track anneal-ing in apatite and sphene: Journal of Geophysical Research, v. 74, p. 705–710.
Parker, J., and Newman, R., 1995, Alaska federal offshore; descriptions of geologic plays; 1995 national resource assessment: U.S. Minerals Management Service, North Aleutian Basin Assessment Province http://www.mms.gov/alaska/re/asmtdata/naleutia/naleplay.htm
Paul, T.A., and Fitzgerald, P.G., 1992, Transmission electron microscopic investigation of fi ssion tracks in fluorapatite: American Mineralogist, v. 77, p. 336–344.
Price, P.B., and Walker, R.M., 1963, Fossil tracks of charged particles in gneiss and the age of min-erals: Journal of Geophysical Research, v. 68, p. 4,847–4,862.
Scholl, D.W., Vallier, T.L., and Stevenson, A.J., 1986, Terrane accretion, production, and continental growth; A perspective based on the origin and tectonic fate of the Aleutian–Bering Sea region: Geology, v. 14, p. 43–47.
Scholl, D.W., Vallier, T.L., and Stevenson, A.J., 1987, Geologic evolution and petroleum geology of the Aleutian Ridge, in Scholl, D.W., Grantz, Arthur, and Vedder, J.G., eds., Geology and resource potential of the continental margin of western North America and adjacent ocean basins, Beaufort Sea to Baja Califor-nia: Houston, TX, Circum-Pacifi c Council For Energy and Mineral Resources, Houston, TX, p. 73–102.
Tagami, T., and O’Sullivan, P.B., 2005, Fundamentals of fi ssion-track thermochronology: Reviews in Mineral-ogy and Geochemistry, v. 58, p. 19–47.
Turner, R.F., ed., 1988, Geological and operational sum-mary, North Aleutian Shelf COST No. 1 well, Bering Sea, Alaska: U.S. Minerals Management Service, OCS Report MMS 88-0089, 256 p., 2 plates.
Walker, K.T., McGeary, S.E., and Klemperer, S.L., 2003, Tectonic evolution of the Bristol Bay basin, southeast Bering Sea: Constraints from seismic refl ection and potential fi eld data: Tectonics, v. 22, no. 5, p. 19
Worrall, D.M., 1991, Tectonic history of the Bering Sea and the evolution of Tertiary strike-slip basins of the Bering Shelf: Geological Society of America Special Paper 257, 120 p., 1 oversize sheet, 4 plates.

THIS PAGE INTENTIONALLY LEFT BLANK
Fission track geochronology of the North Aleutian COST #1 Well (OCS-8218), Bristol Bay Basin, Alaska 195
APPENDIX 1ANALYTICAL METHODS
Core slabs from nine different 5 ft to 29 ft intervals (see table 1), each weighing a total of 2-4 kg, were aggregated, crushed and washed.Apatite and zircon concentrates were prepared in the laboratories of Geochron Inc., Cambridge, MA, using conventional isodynamic magnetic (Frantz barrier separator) and heavy liquid (tetrabromoethane and methylene iodide) techniques.The apatite yields were generally very poor (three samples: NAC4 from 8,644 ft, NAC7 from 12,253 ft, and NAC9 from 16,712 ft lacked workable apatite) to excellent.Many samples contained abundant pyrite.Those splits with excessive pyrite and barite were treated with aqua regia to concentrate zircon.
The external detector method was used for single grain apatite and zircon fi ssion track dating in the laboratories of John Murphy at the University of Wyoming and Shari Kelley at Southern Methodist University Department of Geological Sciences, respectively.Apatite and zircon mounts were covered with low-U muscovite detectors, apatites sandwiched between standards including Durango apatite, NBS glass SRM692, and Corning glass CN-6, and zircons between Fish Canyon and Myalla Road syenite zircon age standards as well as the two glasses.Both packages were irradiated at the Texas A & M reactor at fl uences in the range 6.4-7.0 x 10¹⁵ neutrons/cm2, and apatites at 0.7-1.4 x 10¹⁶ neutrons/cm2. Reactor neutron fl uence was calculated using accepted ages of 27.9, 172.8, and 31.4 Ma for Fish Canyon, Myalla Road, and Durango standards and the fl ux gradient was verifi ed using the glass standards.Muscovite detectors were etched for 13 minutes in 48 percent HF to reveal induced 235U fi ssion tracks.Individual grain ages were calculated using the zeta correction formulation of Price and Walker (1963); age uncertainty calculations of grains with non-zero ages are those of Hurford and others. (1984). Small fragments of the Durango apatite were mounted with the samples and analyzed as internal standards.The resulting zeta cali-bration factors for eight grains (assuming an age of 31.4 Ma) average 352±45, compared with the zeta factor for SRM612 of 349±14.
Apatite confi ned track length measurements were made on those samples yielding suffi cient quantities of workable apatite using a 100x air objective, digitizing tablet, and a camera-lucida tube.Mounted and polished length mounts were irradiated prior to etching with vertical 252Cf fragments (induced density approximately 106 tracks/cm2) at the ARCO Plano fi ssion track laboratory in order to increase the etchable spontaneous confi ned track yields.The means of spontaneous and induced confi ned tracks analyzed in the Durango apatite standard concurrent with these analyses were: 14.36±0.07 μm (1 sigma=0.88 μm, n=150) and 16.15±0.07 μm (1 sigma=0.80 μm, n=150), respectively.

196 RI 2008-1J Bristol Bay–Alaska Peninsula region, overview of 2004–2007 geologic research
APPENDIX 2OVERVIEW OF THE FISSION TRACK GEOCHRONOLOGY TECHNIQUE
Fission track analysis is a geothermochronologic technique for constraining the thermal history of rocks (Fleischer others, 1975; Naeser, 1979; Gleadow others, 1983; Gallagher others, 1998). Detrital grains of apatite and zircon in sedimentary rocks contain minor to trace amounts of 238U. Each year, about one in 10 billion 238U atoms decays and one in a million of those undergoes spontaneous fi ssion, or splits into two fragments. Fission tracks are zones of radiation damage in crystals produced by the destructive interaction (creating defects, ionizing atoms, and strip-ping their electrons) of highly energetic (100–200 Mev), highly charged (>+20e) fi ssion particles (atoms such as Rb, Sr, Ba, Yb, Zr) of variable mass (ca. 85-110, 125–155 amu) (Price and Walker, 1963). Fission tracks are only preserved in dielectric (non-conducting: >2000 ohm-cm resistivity) solids (crystals or glasses); conducting solids immediately repair the fragment damage since an abundance of free electrons exist in metals. Although the true identity of fi ssion tracks remains an enigma, recent TEM imaging studies suggest they are probably glassy zones of defects in crystalline matter which are on the order of 50-100 Å in diameter and <20 μm long in natural oxide minerals such as apatite and zircon (Paul and Fitzgerald, 1992). This damage zone can be enlarged (to >1–5 μm diameter) by etching with a solvent such as nitric acid (apatite) and NaOH–KOH (zircon) and studied with an optical microscope.
Since the fi ssion damage zones heal as a function of time and temperature and are rendered unetchable, each mineral possesses a characteristic blocking temperature (usually expressed for a given time scale and cooling rate; Dodson, 1973), above which tracks form but spontaneously anneal, and below which tracks shorten at very slow rates (Naeser, 1979). For rapid cooling rates (30°C/m.y.) and geologic time scales (1–10 m.y.), the respective blocking temperatures for apatite and zircon are approximately 120±10°C and 200±30°C (Naeser, 1979; Gleadow others, 1983). Therefore, fi ssion track analysis of apatite and zircon are useful for constraining the low temperature (<200°C), shallow (<6 km) thermal history of the upper crust.
Etchable fi ssion tracks in apatite are initially long, ca 16.5 μm, and shorten by annealing as a function of time and temperature. Apatites that rapidly cool (>10–100°C/m.y.) through temperatures >150°C to <60°C, possess long tracks (14–15 μm), whereas those that experienced a protracted cooling history (<1°C/m.y.) possess shorter tracks (<13 μm). Fission tracks in apatite fade and are rendered unetchable if subjected to temperatures >100 to >130°C for time scales of 100 to 10 m.y., respectively. The age of a given mineral grain is a function of the fi ssion track density, the length of fi ssion tracks relative to those of the age standard, and uranium concentration. The fi ssion-track age in apatite may represent a geologic event, if the apatite cooled rapidly and the tracks are long (>13.5 μm), or alternatively some complicated thermal history in the temperature range 60–130°C, if the apatite cooled slowly and the tracks are short (<13.5 μm).
A large body of high temperature (100–400°C), short term (<1.5 yr) experimental data is available that describes the effect of time and temperature on track shortening and age reduction in apatite (Zimmerman, 1977; Naeser and Faul, 1969, Green others, 1986; Crowley others, 1991). Longer term constraints on track annealing include well documented subsurface samples from wells thought to be at maximum thermal conditions (Naeser, 1981; Gleadow and Duddy, 1981). Kinetic models have been developed by many workers (Crowley, 1985; Laslett others, 1987; Carlson, 1990) that predict the degree of length and age reduction as a function of time and temperature. A compositional effect of annealing kinetics has been recognized by Duddy others (1988) and Green others (1989) and many subsequent workers in which apatites from the Otway Basin with >1 wt% Cl possess higher effective blocking temperatures than F-rich varieties (<0.4 wt% Cl). It is thought that 1–3 wt% Cl in apatite produces a 10–30°C increase in fi ssion track blocking temperature. Alternatively, Cl-rich apatites may possess longer tracks and older ages because they etch at greater rates than Cl-poor varieties. Figure 6 shows the relationship between anion composition and apatite FT age for Mesozoic and Cenozoic samples from fi ve selected wells in the Lower Cook Inlet Alaska. Figure 7 shows that several thousand worldwide apatites from igneous, metamorphic and sedimentary rocks vary widely in anion composition, with a positive correlation between Cl and OH and negative correlation between F and Cl (Bergman, unpublished data). As Cl and OH are positively correlated, either OH or Cl may be the cause of the higher blocking temperatures for those apatites depleted in Fluorine.
Fission track geochronology of the North Aleutian COST #1 Well (OCS-8218), Bristol Bay Basin, Alaska 197
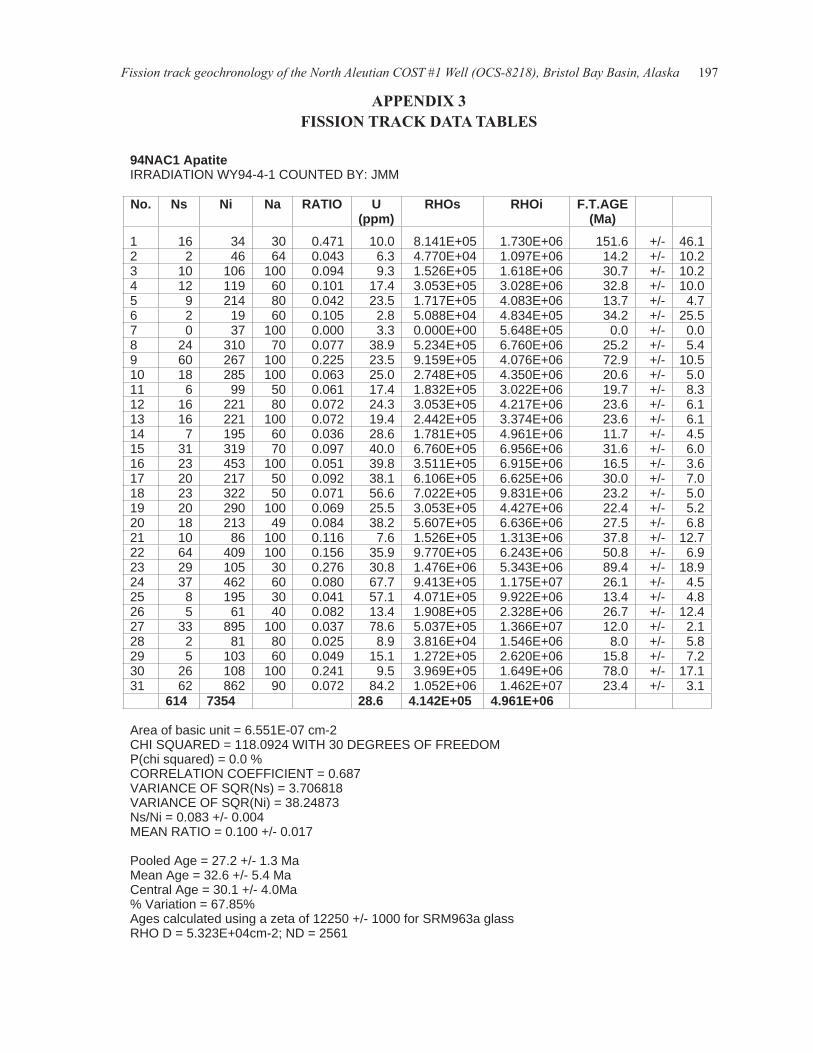
APPENDIX 3FISSION TRACK DATA TABLES
94NAC1 Apatite IRRADIATION WY94-4-1 COUNTED BY: JMM
No. Ns Ni Na RATIO U (ppm)
RHOs RHOi F.T.AGE (Ma)
1 16 34 30 0.471 10.0 8.141E+05 1.730E+06 151.6 +/- 46.12 2 46 64 0.043 6.3 4.770E+04 1.097E+06 14.2 +/- 10.23 10 106 100 0.094 9.3 1.526E+05 1.618E+06 30.7 +/- 10.24 12 119 60 0.101 17.4 3.053E+05 3.028E+06 32.8 +/- 10.05 9 214 80 0.042 23.5 1.717E+05 4.083E+06 13.7 +/- 4.76 2 19 60 0.105 2.8 5.088E+04 4.834E+05 34.2 +/- 25.57 0 37 100 0.000 3.3 0.000E+00 5.648E+05 0.0 +/- 0.08 24 310 70 0.077 38.9 5.234E+05 6.760E+06 25.2 +/- 5.49 60 267 100 0.225 23.5 9.159E+05 4.076E+06 72.9 +/- 10.510 18 285 100 0.063 25.0 2.748E+05 4.350E+06 20.6 +/- 5.011 6 99 50 0.061 17.4 1.832E+05 3.022E+06 19.7 +/- 8.312 16 221 80 0.072 24.3 3.053E+05 4.217E+06 23.6 +/- 6.113 16 221 100 0.072 19.4 2.442E+05 3.374E+06 23.6 +/- 6.114 7 195 60 0.036 28.6 1.781E+05 4.961E+06 11.7 +/- 4.515 31 319 70 0.097 40.0 6.760E+05 6.956E+06 31.6 +/- 6.016 23 453 100 0.051 39.8 3.511E+05 6.915E+06 16.5 +/- 3.617 20 217 50 0.092 38.1 6.106E+05 6.625E+06 30.0 +/- 7.018 23 322 50 0.071 56.6 7.022E+05 9.831E+06 23.2 +/- 5.019 20 290 100 0.069 25.5 3.053E+05 4.427E+06 22.4 +/- 5.220 18 213 49 0.084 38.2 5.607E+05 6.636E+06 27.5 +/- 6.821 10 86 100 0.116 7.6 1.526E+05 1.313E+06 37.8 +/- 12.722 64 409 100 0.156 35.9 9.770E+05 6.243E+06 50.8 +/- 6.923 29 105 30 0.276 30.8 1.476E+06 5.343E+06 89.4 +/- 18.924 37 462 60 0.080 67.7 9.413E+05 1.175E+07 26.1 +/- 4.525 8 195 30 0.041 57.1 4.071E+05 9.922E+06 13.4 +/- 4.826 5 61 40 0.082 13.4 1.908E+05 2.328E+06 26.7 +/- 12.427 33 895 100 0.037 78.6 5.037E+05 1.366E+07 12.0 +/- 2.128 2 81 80 0.025 8.9 3.816E+04 1.546E+06 8.0 +/- 5.829 5 103 60 0.049 15.1 1.272E+05 2.620E+06 15.8 +/- 7.230 26 108 100 0.241 9.5 3.969E+05 1.649E+06 78.0 +/- 17.131 62 862 90 0.072 84.2 1.052E+06 1.462E+07 23.4 +/- 3.1 614 7354 28.6 4.142E+05 4.961E+06
Area of basic unit = 6.551E-07 cm-2CHI SQUARED = 118.0924 WITH 30 DEGREES OF FREEDOMP(chi squared) = 0.0 %CORRELATION COEFFICIENT = 0.687VARIANCE OF SQR(Ns) = 3.706818VARIANCE OF SQR(Ni) = 38.24873Ns/Ni = 0.083 +/- 0.004MEAN RATIO = 0.100 +/- 0.017
Pooled Age = 27.2 +/- 1.3 MaMean Age = 32.6 +/- 5.4 MaCentral Age = 30.1 +/- 4.0Ma% Variation = 67.85%Ages calculated using a zeta of 12250 +/- 1000 for SRM963a glassRHO D = 5.323E+04cm-2; ND = 2561
198 RI 2008-1J Bristol Bay–Alaska Peninsula region, overview of 2004–2007 geologic research
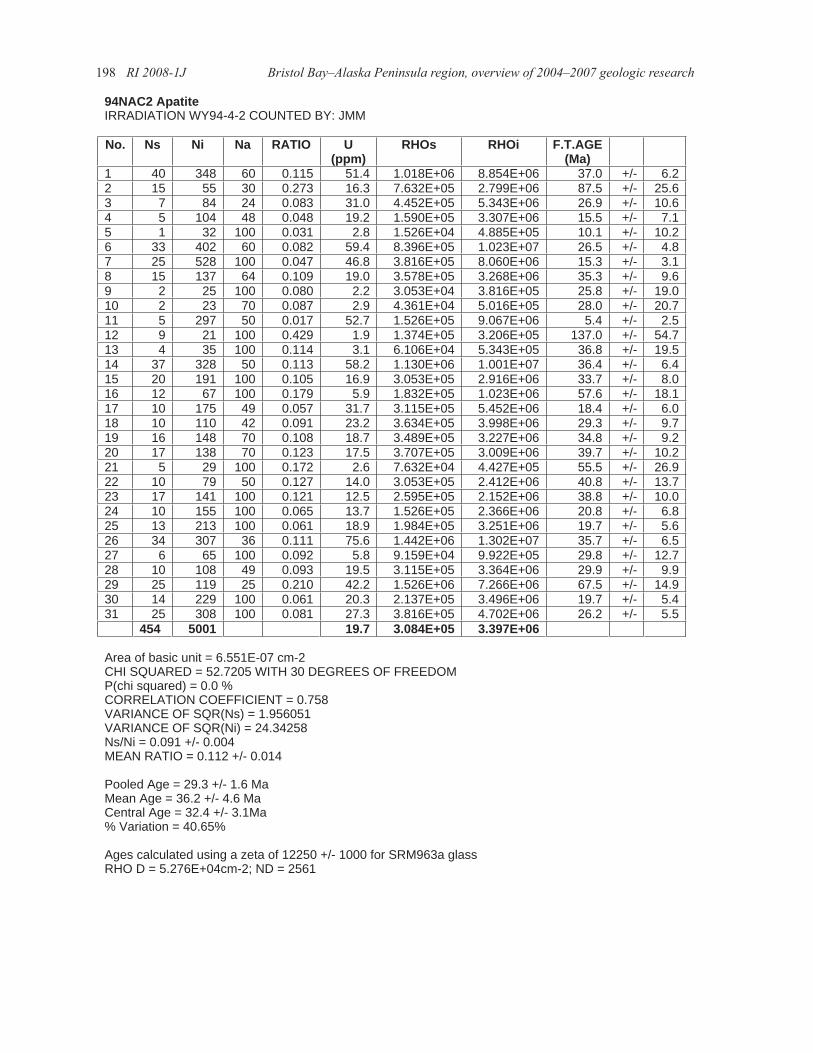
94NAC2 Apatite IRRADIATION WY94-4-2 COUNTED BY: JMM
No. Ns Ni Na RATIO U (ppm)
RHOs RHOi F.T.AGE (Ma)
1 40 348 60 0.115 51.4 1.018E+06 8.854E+06 37.0 +/- 6.22 15 55 30 0.273 16.3 7.632E+05 2.799E+06 87.5 +/- 25.63 7 84 24 0.083 31.0 4.452E+05 5.343E+06 26.9 +/- 10.64 5 104 48 0.048 19.2 1.590E+05 3.307E+06 15.5 +/- 7.15 1 32 100 0.031 2.8 1.526E+04 4.885E+05 10.1 +/- 10.26 33 402 60 0.082 59.4 8.396E+05 1.023E+07 26.5 +/- 4.87 25 528 100 0.047 46.8 3.816E+05 8.060E+06 15.3 +/- 3.18 15 137 64 0.109 19.0 3.578E+05 3.268E+06 35.3 +/- 9.69 2 25 100 0.080 2.2 3.053E+04 3.816E+05 25.8 +/- 19.010 2 23 70 0.087 2.9 4.361E+04 5.016E+05 28.0 +/- 20.711 5 297 50 0.017 52.7 1.526E+05 9.067E+06 5.4 +/- 2.512 9 21 100 0.429 1.9 1.374E+05 3.206E+05 137.0 +/- 54.713 4 35 100 0.114 3.1 6.106E+04 5.343E+05 36.8 +/- 19.514 37 328 50 0.113 58.2 1.130E+06 1.001E+07 36.4 +/- 6.415 20 191 100 0.105 16.9 3.053E+05 2.916E+06 33.7 +/- 8.016 12 67 100 0.179 5.9 1.832E+05 1.023E+06 57.6 +/- 18.117 10 175 49 0.057 31.7 3.115E+05 5.452E+06 18.4 +/- 6.018 10 110 42 0.091 23.2 3.634E+05 3.998E+06 29.3 +/- 9.719 16 148 70 0.108 18.7 3.489E+05 3.227E+06 34.8 +/- 9.220 17 138 70 0.123 17.5 3.707E+05 3.009E+06 39.7 +/- 10.221 5 29 100 0.172 2.6 7.632E+04 4.427E+05 55.5 +/- 26.922 10 79 50 0.127 14.0 3.053E+05 2.412E+06 40.8 +/- 13.723 17 141 100 0.121 12.5 2.595E+05 2.152E+06 38.8 +/- 10.024 10 155 100 0.065 13.7 1.526E+05 2.366E+06 20.8 +/- 6.825 13 213 100 0.061 18.9 1.984E+05 3.251E+06 19.7 +/- 5.626 34 307 36 0.111 75.6 1.442E+06 1.302E+07 35.7 +/- 6.527 6 65 100 0.092 5.8 9.159E+04 9.922E+05 29.8 +/- 12.728 10 108 49 0.093 19.5 3.115E+05 3.364E+06 29.9 +/- 9.929 25 119 25 0.210 42.2 1.526E+06 7.266E+06 67.5 +/- 14.930 14 229 100 0.061 20.3 2.137E+05 3.496E+06 19.7 +/- 5.431 25 308 100 0.081 27.3 3.816E+05 4.702E+06 26.2 +/- 5.5 454 5001 19.7 3.084E+05 3.397E+06
Area of basic unit = 6.551E-07 cm-2CHI SQUARED = 52.7205 WITH 30 DEGREES OF FREEDOMP(chi squared) = 0.0 %CORRELATION COEFFICIENT = 0.758VARIANCE OF SQR(Ns) = 1.956051VARIANCE OF SQR(Ni) = 24.34258Ns/Ni = 0.091 +/- 0.004MEAN RATIO = 0.112 +/- 0.014
Pooled Age = 29.3 +/- 1.6 MaMean Age = 36.2 +/- 4.6 MaCentral Age = 32.4 +/- 3.1Ma% Variation = 40.65%
Ages calculated using a zeta of 12250 +/- 1000 for SRM963a glassRHO D = 5.276E+04cm-2; ND = 2561
Fission track geochronology of the North Aleutian COST #1 Well (OCS-8218), Bristol Bay Basin, Alaska 199
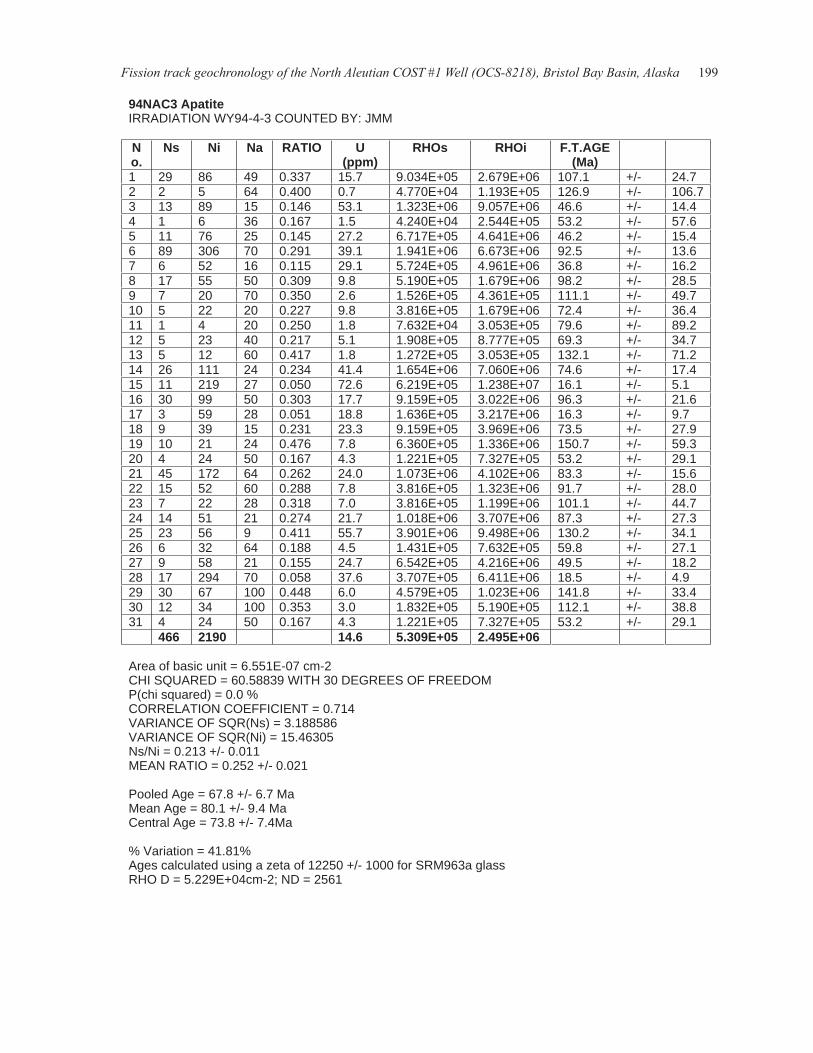
94NAC3 ApatiteIRRADIATION WY94-4-3 COUNTED BY: JMM
No.
Ns Ni Na RATIO U (ppm)
RHOs RHOi F.T.AGE (Ma)
1 29 86 49 0.337 15.7 9.034E+05 2.679E+06 107.1 +/- 24.7 2 2 5 64 0.400 0.7 4.770E+04 1.193E+05 126.9 +/- 106.73 13 89 15 0.146 53.1 1.323E+06 9.057E+06 46.6 +/- 14.4 4 1 6 36 0.167 1.5 4.240E+04 2.544E+05 53.2 +/- 57.6 5 11 76 25 0.145 27.2 6.717E+05 4.641E+06 46.2 +/- 15.4 6 89 306 70 0.291 39.1 1.941E+06 6.673E+06 92.5 +/- 13.6 7 6 52 16 0.115 29.1 5.724E+05 4.961E+06 36.8 +/- 16.2 8 17 55 50 0.309 9.8 5.190E+05 1.679E+06 98.2 +/- 28.5 9 7 20 70 0.350 2.6 1.526E+05 4.361E+05 111.1 +/- 49.7 10 5 22 20 0.227 9.8 3.816E+05 1.679E+06 72.4 +/- 36.4 11 1 4 20 0.250 1.8 7.632E+04 3.053E+05 79.6 +/- 89.2 12 5 23 40 0.217 5.1 1.908E+05 8.777E+05 69.3 +/- 34.7 13 5 12 60 0.417 1.8 1.272E+05 3.053E+05 132.1 +/- 71.2 14 26 111 24 0.234 41.4 1.654E+06 7.060E+06 74.6 +/- 17.4 15 11 219 27 0.050 72.6 6.219E+05 1.238E+07 16.1 +/- 5.1 16 30 99 50 0.303 17.7 9.159E+05 3.022E+06 96.3 +/- 21.6 17 3 59 28 0.051 18.8 1.636E+05 3.217E+06 16.3 +/- 9.7 18 9 39 15 0.231 23.3 9.159E+05 3.969E+06 73.5 +/- 27.9 19 10 21 24 0.476 7.8 6.360E+05 1.336E+06 150.7 +/- 59.3 20 4 24 50 0.167 4.3 1.221E+05 7.327E+05 53.2 +/- 29.1 21 45 172 64 0.262 24.0 1.073E+06 4.102E+06 83.3 +/- 15.6 22 15 52 60 0.288 7.8 3.816E+05 1.323E+06 91.7 +/- 28.0 23 7 22 28 0.318 7.0 3.816E+05 1.199E+06 101.1 +/- 44.7 24 14 51 21 0.274 21.7 1.018E+06 3.707E+06 87.3 +/- 27.3 25 23 56 9 0.411 55.7 3.901E+06 9.498E+06 130.2 +/- 34.1 26 6 32 64 0.188 4.5 1.431E+05 7.632E+05 59.8 +/- 27.1 27 9 58 21 0.155 24.7 6.542E+05 4.216E+06 49.5 +/- 18.2 28 17 294 70 0.058 37.6 3.707E+05 6.411E+06 18.5 +/- 4.9 29 30 67 100 0.448 6.0 4.579E+05 1.023E+06 141.8 +/- 33.4 30 12 34 100 0.353 3.0 1.832E+05 5.190E+05 112.1 +/- 38.8 31 4 24 50 0.167 4.3 1.221E+05 7.327E+05 53.2 +/- 29.1 466 2190 14.6 5.309E+05 2.495E+06
Area of basic unit = 6.551E-07 cm-2CHI SQUARED = 60.58839 WITH 30 DEGREES OF FREEDOMP(chi squared) = 0.0 %CORRELATION COEFFICIENT = 0.714VARIANCE OF SQR(Ns) = 3.188586VARIANCE OF SQR(Ni) = 15.46305Ns/Ni = 0.213 +/- 0.011MEAN RATIO = 0.252 +/- 0.021
Pooled Age = 67.8 +/- 6.7 MaMean Age = 80.1 +/- 9.4 MaCentral Age = 73.8 +/- 7.4Ma
% Variation = 41.81%Ages calculated using a zeta of 12250 +/- 1000 for SRM963a glassRHO D = 5.229E+04cm-2; ND = 2561
200 RI 2008-1J Bristol Bay–Alaska Peninsula region, overview of 2004–2007 geologic research
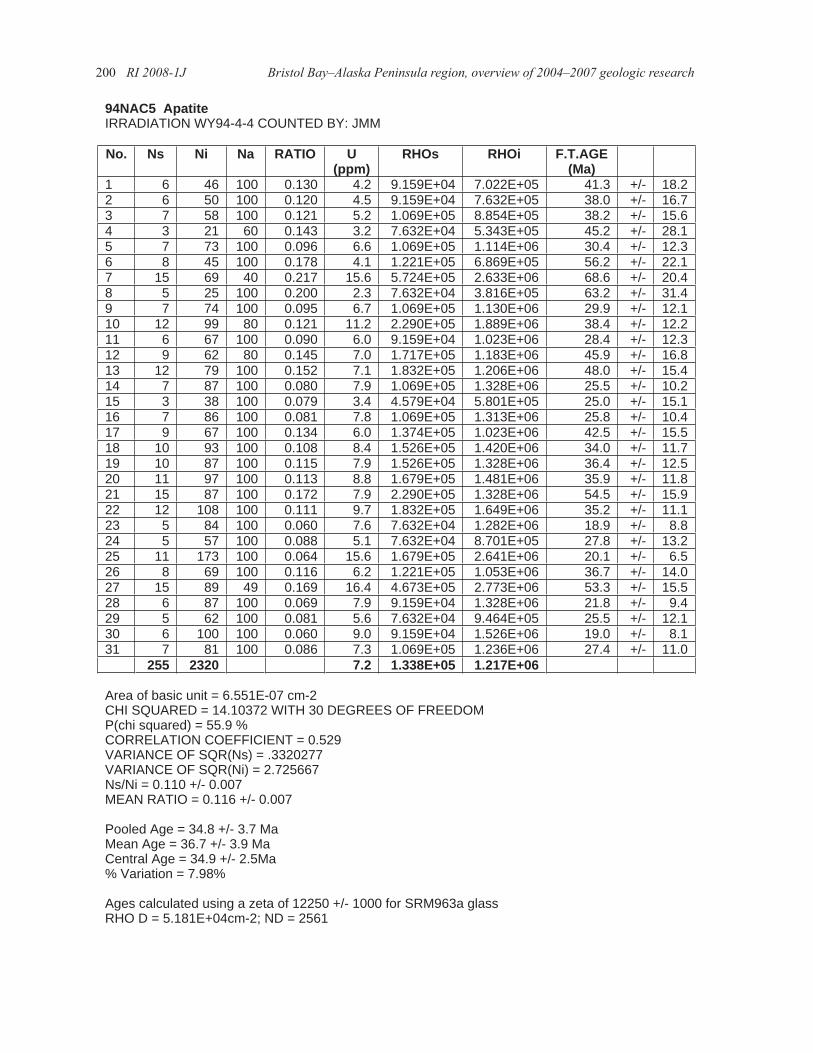
94NAC5 ApatiteIRRADIATION WY94-4-4 COUNTED BY: JMM
No. Ns Ni Na RATIO U (ppm)
RHOs RHOi F.T.AGE (Ma)
1 6 46 100 0.130 4.2 9.159E+04 7.022E+05 41.3 +/- 18.22 6 50 100 0.120 4.5 9.159E+04 7.632E+05 38.0 +/- 16.73 7 58 100 0.121 5.2 1.069E+05 8.854E+05 38.2 +/- 15.64 3 21 60 0.143 3.2 7.632E+04 5.343E+05 45.2 +/- 28.15 7 73 100 0.096 6.6 1.069E+05 1.114E+06 30.4 +/- 12.36 8 45 100 0.178 4.1 1.221E+05 6.869E+05 56.2 +/- 22.17 15 69 40 0.217 15.6 5.724E+05 2.633E+06 68.6 +/- 20.48 5 25 100 0.200 2.3 7.632E+04 3.816E+05 63.2 +/- 31.49 7 74 100 0.095 6.7 1.069E+05 1.130E+06 29.9 +/- 12.110 12 99 80 0.121 11.2 2.290E+05 1.889E+06 38.4 +/- 12.211 6 67 100 0.090 6.0 9.159E+04 1.023E+06 28.4 +/- 12.312 9 62 80 0.145 7.0 1.717E+05 1.183E+06 45.9 +/- 16.813 12 79 100 0.152 7.1 1.832E+05 1.206E+06 48.0 +/- 15.414 7 87 100 0.080 7.9 1.069E+05 1.328E+06 25.5 +/- 10.215 3 38 100 0.079 3.4 4.579E+04 5.801E+05 25.0 +/- 15.116 7 86 100 0.081 7.8 1.069E+05 1.313E+06 25.8 +/- 10.417 9 67 100 0.134 6.0 1.374E+05 1.023E+06 42.5 +/- 15.518 10 93 100 0.108 8.4 1.526E+05 1.420E+06 34.0 +/- 11.719 10 87 100 0.115 7.9 1.526E+05 1.328E+06 36.4 +/- 12.520 11 97 100 0.113 8.8 1.679E+05 1.481E+06 35.9 +/- 11.821 15 87 100 0.172 7.9 2.290E+05 1.328E+06 54.5 +/- 15.922 12 108 100 0.111 9.7 1.832E+05 1.649E+06 35.2 +/- 11.123 5 84 100 0.060 7.6 7.632E+04 1.282E+06 18.9 +/- 8.824 5 57 100 0.088 5.1 7.632E+04 8.701E+05 27.8 +/- 13.225 11 173 100 0.064 15.6 1.679E+05 2.641E+06 20.1 +/- 6.526 8 69 100 0.116 6.2 1.221E+05 1.053E+06 36.7 +/- 14.027 15 89 49 0.169 16.4 4.673E+05 2.773E+06 53.3 +/- 15.528 6 87 100 0.069 7.9 9.159E+04 1.328E+06 21.8 +/- 9.429 5 62 100 0.081 5.6 7.632E+04 9.464E+05 25.5 +/- 12.130 6 100 100 0.060 9.0 9.159E+04 1.526E+06 19.0 +/- 8.131 7 81 100 0.086 7.3 1.069E+05 1.236E+06 27.4 +/- 11.0
255 2320 7.2 1.338E+05 1.217E+06
Area of basic unit = 6.551E-07 cm-2CHI SQUARED = 14.10372 WITH 30 DEGREES OF FREEDOMP(chi squared) = 55.9 %CORRELATION COEFFICIENT = 0.529VARIANCE OF SQR(Ns) = .3320277VARIANCE OF SQR(Ni) = 2.725667Ns/Ni = 0.110 +/- 0.007MEAN RATIO = 0.116 +/- 0.007
Pooled Age = 34.8 +/- 3.7 MaMean Age = 36.7 +/- 3.9 MaCentral Age = 34.9 +/- 2.5Ma% Variation = 7.98%
Ages calculated using a zeta of 12250 +/- 1000 for SRM963a glassRHO D = 5.181E+04cm-2; ND = 2561

Fission track geochronology of the North Aleutian COST #1 Well (OCS-8218), Bristol Bay Basin, Alaska 201
94NAC6 ApatiteIRRADIATION WY94-4-5 COUNTED BY: JMM
No. Ns Ni Na RATIO U (ppm)
RHOs RHOi F.T.AGE (Ma)
1 3 10 100 0.300 0.9 4.579E+04 1.526E+05 93.7 +/- 62.12 7 19 100 0.368 1.7 1.069E+05 2.900E+05 114.8 +/- 51.73 6 40 49 0.150 7.4 1.869E+05 1.246E+06 47.0 +/- 21.04 3 8 36 0.375 2.0 1.272E+05 3.392E+05 116.9 +/- 79.75 2 9 30 0.222 2.7 1.018E+05 4.579E+05 69.5 +/- 54.66 2 10 100 0.200 0.9 3.053E+04 1.526E+05 62.6 +/- 48.87 3 28 100 0.107 2.6 4.579E+04 4.274E+05 33.6 +/- 20.68 4 21 100 0.190 1.9 6.106E+04 3.206E+05 59.6 +/- 32.99 3 8 50 0.375 1.5 9.159E+04 2.442E+05 116.9 +/- 79.710 1 17 100 0.059 1.5 1.526E+04 2.595E+05 18.5 +/- 19.111 6 27 100 0.222 2.5 9.159E+04 4.122E+05 69.5 +/- 31.912 3 20 70 0.150 2.6 6.542E+04 4.361E+05 47.0 +/- 29.413 7 44 60 0.159 6.7 1.781E+05 1.119E+06 49.8 +/- 20.714 4 29 70 0.138 3.8 8.723E+04 6.324E+05 43.2 +/- 23.315 2 24 70 0.083 3.1 4.361E+04 5.234E+05 26.2 +/- 19.416 8 75 70 0.107 9.8 1.745E+05 1.636E+06 33.5 +/- 12.817 4 24 80 0.167 2.7 7.632E+04 4.579E+05 52.2 +/- 28.518 7 50 50 0.140 9.1 2.137E+05 1.526E+06 43.9 +/- 18.119 4 29 49 0.138 5.4 1.246E+05 9.034E+05 43.2 +/- 23.320 2 11 40 0.182 2.5 7.632E+04 4.198E+05 56.9 +/- 44.021 1 6 40 0.167 1.4 3.816E+04 2.290E+05 52.2 +/- 56.622 3 23 60 0.130 3.5 7.632E+04 5.852E+05 40.9 +/- 25.323 0 4 30 0.000 1.2 0.000E+00 2.035E+05 0.0 +/- 0.024 2 14 49 0.143 2.6 6.231E+04 4.361E+05 44.8 +/- 34.025 2 17 80 0.118 1.9 3.816E+04 3.244E+05 36.9 +/- 27.726 7 36 56 0.194 5.9 1.908E+05 9.813E+05 60.9 +/- 25.7
96 603 3.2 8.427E+04 5.293E+05
Area of basic unit = 6.551E-07 cm-2CHI SQUARED = 7.004144 WITH 25 DEGREES OF FREEDOMP(chi squared) = 96.2 %CORRELATION COEFFICIENT = 0.810VARIANCE OF SQR(Ns) = .4142963VARIANCE OF SQR(Ni) = 2.447244Ns/Ni = 0.159 +/- 0.017MEAN RATIO = 0.176 +/- 0.018
Pooled Age = 49.9 +/- 6.9 MaMean Age = 55.2 +/- 7.3 MaCentral Age = 49.9 +/- 5.6Ma% Variation = 0.02%
Ages calculated using a zeta of 12250 +/- 1000 for SRM963a glassRHO D = 5.134E+04cm-2; ND = 2561
202 RI 2008-1J Bristol Bay–Alaska Peninsula region, overview of 2004–2007 geologic research
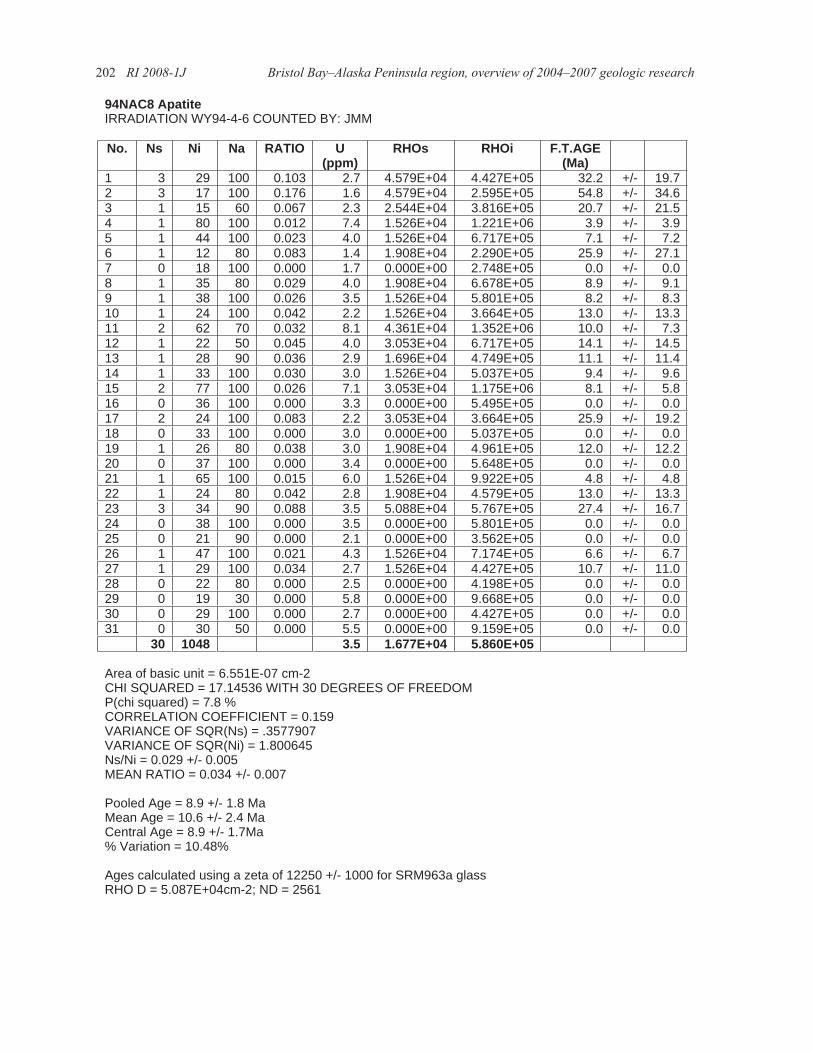
94NAC8 ApatiteIRRADIATION WY94-4-6 COUNTED BY: JMM
No. Ns Ni Na RATIO U (ppm)
RHOs RHOi F.T.AGE (Ma)
1 3 29 100 0.103 2.7 4.579E+04 4.427E+05 32.2 +/- 19.72 3 17 100 0.176 1.6 4.579E+04 2.595E+05 54.8 +/- 34.63 1 15 60 0.067 2.3 2.544E+04 3.816E+05 20.7 +/- 21.54 1 80 100 0.012 7.4 1.526E+04 1.221E+06 3.9 +/- 3.95 1 44 100 0.023 4.0 1.526E+04 6.717E+05 7.1 +/- 7.26 1 12 80 0.083 1.4 1.908E+04 2.290E+05 25.9 +/- 27.17 0 18 100 0.000 1.7 0.000E+00 2.748E+05 0.0 +/- 0.08 1 35 80 0.029 4.0 1.908E+04 6.678E+05 8.9 +/- 9.19 1 38 100 0.026 3.5 1.526E+04 5.801E+05 8.2 +/- 8.310 1 24 100 0.042 2.2 1.526E+04 3.664E+05 13.0 +/- 13.311 2 62 70 0.032 8.1 4.361E+04 1.352E+06 10.0 +/- 7.312 1 22 50 0.045 4.0 3.053E+04 6.717E+05 14.1 +/- 14.513 1 28 90 0.036 2.9 1.696E+04 4.749E+05 11.1 +/- 11.414 1 33 100 0.030 3.0 1.526E+04 5.037E+05 9.4 +/- 9.615 2 77 100 0.026 7.1 3.053E+04 1.175E+06 8.1 +/- 5.816 0 36 100 0.000 3.3 0.000E+00 5.495E+05 0.0 +/- 0.017 2 24 100 0.083 2.2 3.053E+04 3.664E+05 25.9 +/- 19.218 0 33 100 0.000 3.0 0.000E+00 5.037E+05 0.0 +/- 0.019 1 26 80 0.038 3.0 1.908E+04 4.961E+05 12.0 +/- 12.220 0 37 100 0.000 3.4 0.000E+00 5.648E+05 0.0 +/- 0.021 1 65 100 0.015 6.0 1.526E+04 9.922E+05 4.8 +/- 4.822 1 24 80 0.042 2.8 1.908E+04 4.579E+05 13.0 +/- 13.323 3 34 90 0.088 3.5 5.088E+04 5.767E+05 27.4 +/- 16.724 0 38 100 0.000 3.5 0.000E+00 5.801E+05 0.0 +/- 0.025 0 21 90 0.000 2.1 0.000E+00 3.562E+05 0.0 +/- 0.026 1 47 100 0.021 4.3 1.526E+04 7.174E+05 6.6 +/- 6.727 1 29 100 0.034 2.7 1.526E+04 4.427E+05 10.7 +/- 11.028 0 22 80 0.000 2.5 0.000E+00 4.198E+05 0.0 +/- 0.029 0 19 30 0.000 5.8 0.000E+00 9.668E+05 0.0 +/- 0.030 0 29 100 0.000 2.7 0.000E+00 4.427E+05 0.0 +/- 0.031 0 30 50 0.000 5.5 0.000E+00 9.159E+05 0.0 +/- 0.0
30 1048 3.5 1.677E+04 5.860E+05
Area of basic unit = 6.551E-07 cm-2CHI SQUARED = 17.14536 WITH 30 DEGREES OF FREEDOMP(chi squared) = 7.8 %CORRELATION COEFFICIENT = 0.159VARIANCE OF SQR(Ns) = .3577907VARIANCE OF SQR(Ni) = 1.800645Ns/Ni = 0.029 +/- 0.005MEAN RATIO = 0.034 +/- 0.007
Pooled Age = 8.9 +/- 1.8 MaMean Age = 10.6 +/- 2.4 MaCentral Age = 8.9 +/- 1.7Ma% Variation = 10.48%
Ages calculated using a zeta of 12250 +/- 1000 for SRM963a glassRHO D = 5.087E+04cm-2; ND = 2561
Fission track geochronology of the North Aleutian COST #1 Well (OCS-8218), Bristol Bay Basin, Alaska 203
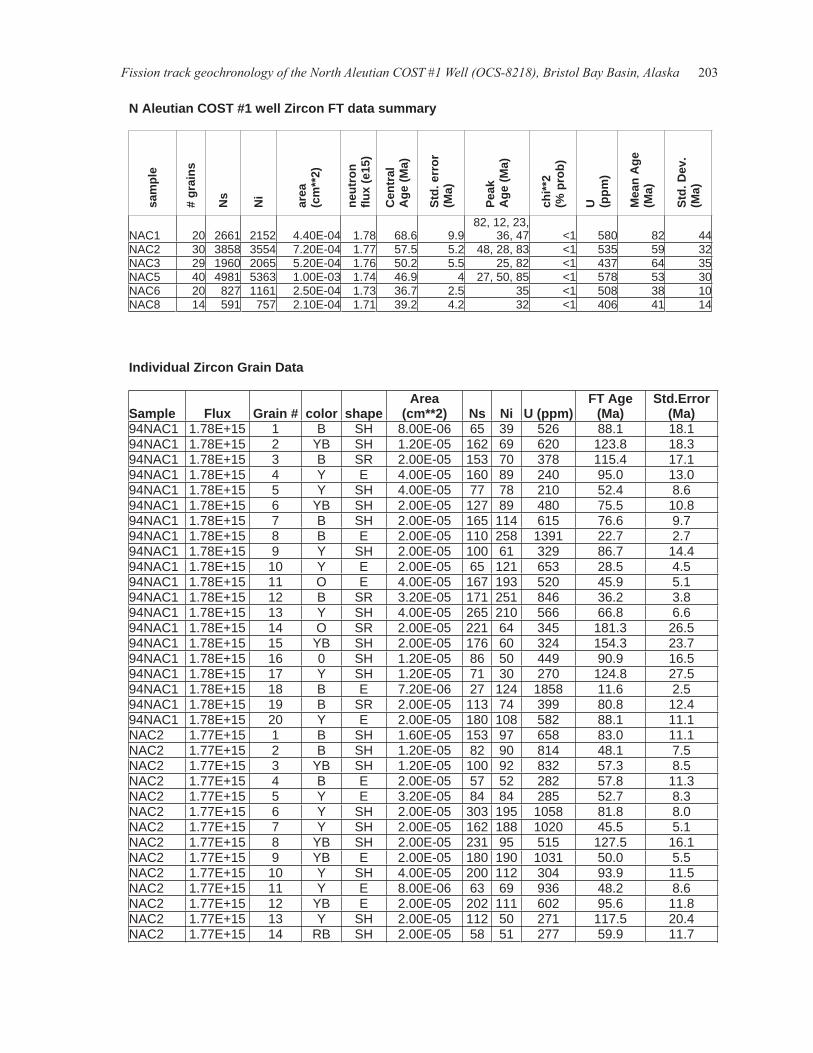
N Aleutian COST #1 well Zircon FT data summary
sam
ple
# gr
ains
Ns
Ni
area
(cm
**2)
neut
ron
flux
(e15
)
Cen
tral
Age
(Ma)
Std.
err
or
(Ma)
Peak
Age
(Ma)
chi**
2(%
pro
b)
U (ppm
)
Mea
n A
ge
(Ma)
Std.
Dev
. (M
a)
NAC1 20 2661 2152 4.40E-04 1.78 68.6 9.982, 12, 23,
36, 47 <1 580 82 44NAC2 30 3858 3554 7.20E-04 1.77 57.5 5.2 48, 28, 83 <1 535 59 32NAC3 29 1960 2065 5.20E-04 1.76 50.2 5.5 25, 82 <1 437 64 35NAC5 40 4981 5363 1.00E-03 1.74 46.9 4 27, 50, 85 <1 578 53 30NAC6 20 827 1161 2.50E-04 1.73 36.7 2.5 35 <1 508 38 10NAC8 14 591 757 2.10E-04 1.71 39.2 4.2 32 <1 406 41 14
Individual Zircon Grain Data
Sample Flux Grain # color shapeArea
(cm**2) Ns Ni U (ppm) FT Age
(Ma)Std.Error
(Ma)94NAC1 1.78E+15 1 B SH 8.00E-06 65 39 526 88.1 18.1 94NAC1 1.78E+15 2 YB SH 1.20E-05 162 69 620 123.8 18.3 94NAC1 1.78E+15 3 B SR 2.00E-05 153 70 378 115.4 17.1 94NAC1 1.78E+15 4 Y E 4.00E-05 160 89 240 95.0 13.0 94NAC1 1.78E+15 5 Y SH 4.00E-05 77 78 210 52.4 8.6 94NAC1 1.78E+15 6 YB SH 2.00E-05 127 89 480 75.5 10.8 94NAC1 1.78E+15 7 B SH 2.00E-05 165 114 615 76.6 9.7 94NAC1 1.78E+15 8 B E 2.00E-05 110 258 1391 22.7 2.7 94NAC1 1.78E+15 9 Y SH 2.00E-05 100 61 329 86.7 14.4 94NAC1 1.78E+15 10 Y E 2.00E-05 65 121 653 28.5 4.5 94NAC1 1.78E+15 11 O E 4.00E-05 167 193 520 45.9 5.1 94NAC1 1.78E+15 12 B SR 3.20E-05 171 251 846 36.2 3.8 94NAC1 1.78E+15 13 Y SH 4.00E-05 265 210 566 66.8 6.6 94NAC1 1.78E+15 14 O SR 2.00E-05 221 64 345 181.3 26.5 94NAC1 1.78E+15 15 YB SH 2.00E-05 176 60 324 154.3 23.7 94NAC1 1.78E+15 16 0 SH 1.20E-05 86 50 449 90.9 16.5 94NAC1 1.78E+15 17 Y SH 1.20E-05 71 30 270 124.8 27.5 94NAC1 1.78E+15 18 B E 7.20E-06 27 124 1858 11.6 2.5 94NAC1 1.78E+15 19 B SR 2.00E-05 113 74 399 80.8 12.4 94NAC1 1.78E+15 20 Y E 2.00E-05 180 108 582 88.1 11.1 NAC2 1.77E+15 1 B SH 1.60E-05 153 97 658 83.0 11.1 NAC2 1.77E+15 2 B SH 1.20E-05 82 90 814 48.1 7.5 NAC2 1.77E+15 3 YB SH 1.20E-05 100 92 832 57.3 8.5 NAC2 1.77E+15 4 B E 2.00E-05 57 52 282 57.8 11.3 NAC2 1.77E+15 5 Y E 3.20E-05 84 84 285 52.7 8.3 NAC2 1.77E+15 6 Y SH 2.00E-05 303 195 1058 81.8 8.0 NAC2 1.77E+15 7 Y SH 2.00E-05 162 188 1020 45.5 5.1 NAC2 1.77E+15 8 YB SH 2.00E-05 231 95 515 127.5 16.1 NAC2 1.77E+15 9 YB E 2.00E-05 180 190 1031 50.0 5.5 NAC2 1.77E+15 10 Y SH 4.00E-05 200 112 304 93.9 11.5 NAC2 1.77E+15 11 Y E 8.00E-06 63 69 936 48.2 8.6 NAC2 1.77E+15 12 YB E 2.00E-05 202 111 602 95.6 11.8 NAC2 1.77E+15 13 Y SH 2.00E-05 112 50 271 117.5 20.4 NAC2 1.77E+15 14 RB SH 2.00E-05 58 51 277 59.9 11.7
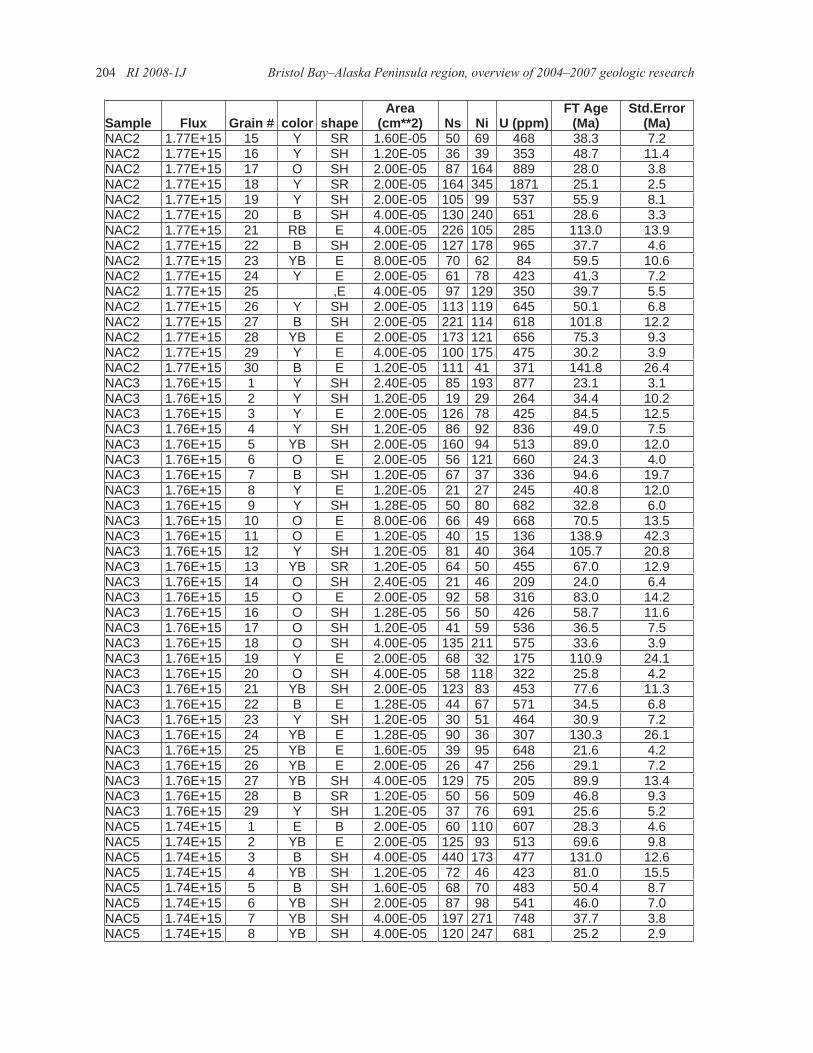
204 RI 2008-1J Bristol Bay–Alaska Peninsula region, overview of 2004–2007 geologic research
Sample Flux Grain # color shapeArea
(cm**2) Ns Ni U (ppm) FT Age
(Ma)Std.Error
(Ma)NAC2 1.77E+15 15 Y SR 1.60E-05 50 69 468 38.3 7.2 NAC2 1.77E+15 16 Y SH 1.20E-05 36 39 353 48.7 11.4 NAC2 1.77E+15 17 O SH 2.00E-05 87 164 889 28.0 3.8 NAC2 1.77E+15 18 Y SR 2.00E-05 164 345 1871 25.1 2.5 NAC2 1.77E+15 19 Y SH 2.00E-05 105 99 537 55.9 8.1 NAC2 1.77E+15 20 B SH 4.00E-05 130 240 651 28.6 3.3 NAC2 1.77E+15 21 RB E 4.00E-05 226 105 285 113.0 13.9 NAC2 1.77E+15 22 B SH 2.00E-05 127 178 965 37.7 4.6 NAC2 1.77E+15 23 YB E 8.00E-05 70 62 84 59.5 10.6 NAC2 1.77E+15 24 Y E 2.00E-05 61 78 423 41.3 7.2 NAC2 1.77E+15 25 ,E 4.00E-05 97 129 350 39.7 5.5 NAC2 1.77E+15 26 Y SH 2.00E-05 113 119 645 50.1 6.8 NAC2 1.77E+15 27 B SH 2.00E-05 221 114 618 101.8 12.2 NAC2 1.77E+15 28 YB E 2.00E-05 173 121 656 75.3 9.3 NAC2 1.77E+15 29 Y E 4.00E-05 100 175 475 30.2 3.9 NAC2 1.77E+15 30 B E 1.20E-05 111 41 371 141.8 26.4 NAC3 1.76E+15 1 Y SH 2.40E-05 85 193 877 23.1 3.1 NAC3 1.76E+15 2 Y SH 1.20E-05 19 29 264 34.4 10.2 NAC3 1.76E+15 3 Y E 2.00E-05 126 78 425 84.5 12.5 NAC3 1.76E+15 4 Y SH 1.20E-05 86 92 836 49.0 7.5 NAC3 1.76E+15 5 YB SH 2.00E-05 160 94 513 89.0 12.0 NAC3 1.76E+15 6 O E 2.00E-05 56 121 660 24.3 4.0 NAC3 1.76E+15 7 B SH 1.20E-05 67 37 336 94.6 19.7 NAC3 1.76E+15 8 Y E 1.20E-05 21 27 245 40.8 12.0 NAC3 1.76E+15 9 Y SH 1.28E-05 50 80 682 32.8 6.0 NAC3 1.76E+15 10 O E 8.00E-06 66 49 668 70.5 13.5 NAC3 1.76E+15 11 O E 1.20E-05 40 15 136 138.9 42.3 NAC3 1.76E+15 12 Y SH 1.20E-05 81 40 364 105.7 20.8 NAC3 1.76E+15 13 YB SR 1.20E-05 64 50 455 67.0 12.9 NAC3 1.76E+15 14 O SH 2.40E-05 21 46 209 24.0 6.4 NAC3 1.76E+15 15 O E 2.00E-05 92 58 316 83.0 14.2 NAC3 1.76E+15 16 O SH 1.28E-05 56 50 426 58.7 11.6 NAC3 1.76E+15 17 O SH 1.20E-05 41 59 536 36.5 7.5 NAC3 1.76E+15 18 O SH 4.00E-05 135 211 575 33.6 3.9 NAC3 1.76E+15 19 Y E 2.00E-05 68 32 175 110.9 24.1 NAC3 1.76E+15 20 O SH 4.00E-05 58 118 322 25.8 4.2 NAC3 1.76E+15 21 YB SH 2.00E-05 123 83 453 77.6 11.3 NAC3 1.76E+15 22 B E 1.28E-05 44 67 571 34.5 6.8 NAC3 1.76E+15 23 Y SH 1.20E-05 30 51 464 30.9 7.2 NAC3 1.76E+15 24 YB E 1.28E-05 90 36 307 130.3 26.1 NAC3 1.76E+15 25 YB E 1.60E-05 39 95 648 21.6 4.2 NAC3 1.76E+15 26 YB E 2.00E-05 26 47 256 29.1 7.2 NAC3 1.76E+15 27 YB SH 4.00E-05 129 75 205 89.9 13.4 NAC3 1.76E+15 28 B SR 1.20E-05 50 56 509 46.8 9.3 NAC3 1.76E+15 29 Y SH 1.20E-05 37 76 691 25.6 5.2 NAC5 1.74E+15 1 E B 2.00E-05 60 110 607 28.3 4.6 NAC5 1.74E+15 2 YB E 2.00E-05 125 93 513 69.6 9.8 NAC5 1.74E+15 3 B SH 4.00E-05 440 173 477 131.0 12.6 NAC5 1.74E+15 4 YB SH 1.20E-05 72 46 423 81.0 15.5 NAC5 1.74E+15 5 B SH 1.60E-05 68 70 483 50.4 8.7 NAC5 1.74E+15 6 YB SH 2.00E-05 87 98 541 46.0 7.0 NAC5 1.74E+15 7 YB SH 4.00E-05 197 271 748 37.7 3.8 NAC5 1.74E+15 8 YB SH 4.00E-05 120 247 681 25.2 2.9
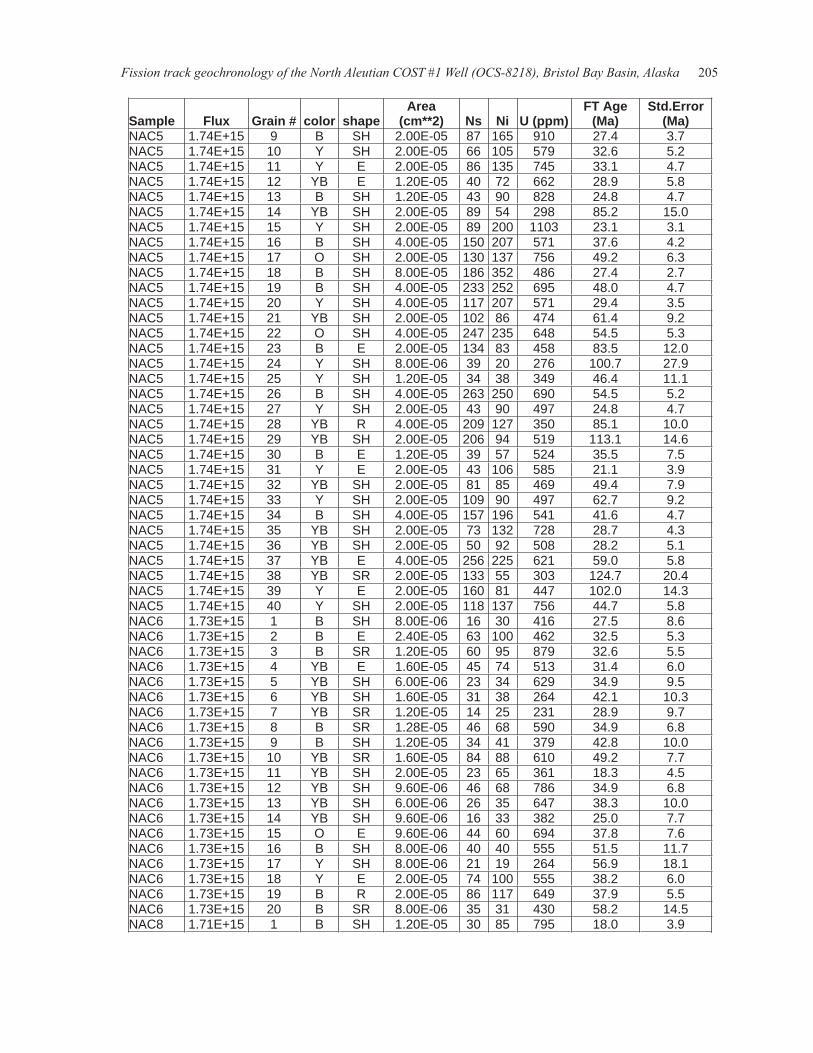
Fission track geochronology of the North Aleutian COST #1 Well (OCS-8218), Bristol Bay Basin, Alaska 205
Sample Flux Grain # color shapeArea
(cm**2) Ns Ni U (ppm) FT Age
(Ma)Std.Error
(Ma)NAC5 1.74E+15 9 B SH 2.00E-05 87 165 910 27.4 3.7 NAC5 1.74E+15 10 Y SH 2.00E-05 66 105 579 32.6 5.2 NAC5 1.74E+15 11 Y E 2.00E-05 86 135 745 33.1 4.7 NAC5 1.74E+15 12 YB E 1.20E-05 40 72 662 28.9 5.8 NAC5 1.74E+15 13 B SH 1.20E-05 43 90 828 24.8 4.7 NAC5 1.74E+15 14 YB SH 2.00E-05 89 54 298 85.2 15.0 NAC5 1.74E+15 15 Y SH 2.00E-05 89 200 1103 23.1 3.1 NAC5 1.74E+15 16 B SH 4.00E-05 150 207 571 37.6 4.2 NAC5 1.74E+15 17 O SH 2.00E-05 130 137 756 49.2 6.3 NAC5 1.74E+15 18 B SH 8.00E-05 186 352 486 27.4 2.7 NAC5 1.74E+15 19 B SH 4.00E-05 233 252 695 48.0 4.7 NAC5 1.74E+15 20 Y SH 4.00E-05 117 207 571 29.4 3.5 NAC5 1.74E+15 21 YB SH 2.00E-05 102 86 474 61.4 9.2 NAC5 1.74E+15 22 O SH 4.00E-05 247 235 648 54.5 5.3 NAC5 1.74E+15 23 B E 2.00E-05 134 83 458 83.5 12.0 NAC5 1.74E+15 24 Y SH 8.00E-06 39 20 276 100.7 27.9 NAC5 1.74E+15 25 Y SH 1.20E-05 34 38 349 46.4 11.1 NAC5 1.74E+15 26 B SH 4.00E-05 263 250 690 54.5 5.2 NAC5 1.74E+15 27 Y SH 2.00E-05 43 90 497 24.8 4.7 NAC5 1.74E+15 28 YB R 4.00E-05 209 127 350 85.1 10.0 NAC5 1.74E+15 29 YB SH 2.00E-05 206 94 519 113.1 14.6 NAC5 1.74E+15 30 B E 1.20E-05 39 57 524 35.5 7.5 NAC5 1.74E+15 31 Y E 2.00E-05 43 106 585 21.1 3.9 NAC5 1.74E+15 32 YB SH 2.00E-05 81 85 469 49.4 7.9 NAC5 1.74E+15 33 Y SH 2.00E-05 109 90 497 62.7 9.2 NAC5 1.74E+15 34 B SH 4.00E-05 157 196 541 41.6 4.7 NAC5 1.74E+15 35 YB SH 2.00E-05 73 132 728 28.7 4.3 NAC5 1.74E+15 36 YB SH 2.00E-05 50 92 508 28.2 5.1 NAC5 1.74E+15 37 YB E 4.00E-05 256 225 621 59.0 5.8 NAC5 1.74E+15 38 YB SR 2.00E-05 133 55 303 124.7 20.4 NAC5 1.74E+15 39 Y E 2.00E-05 160 81 447 102.0 14.3 NAC5 1.74E+15 40 Y SH 2.00E-05 118 137 756 44.7 5.8 NAC6 1.73E+15 1 B SH 8.00E-06 16 30 416 27.5 8.6 NAC6 1.73E+15 2 B E 2.40E-05 63 100 462 32.5 5.3 NAC6 1.73E+15 3 B SR 1.20E-05 60 95 879 32.6 5.5 NAC6 1.73E+15 4 YB E 1.60E-05 45 74 513 31.4 6.0 NAC6 1.73E+15 5 YB SH 6.00E-06 23 34 629 34.9 9.5 NAC6 1.73E+15 6 YB SH 1.60E-05 31 38 264 42.1 10.3 NAC6 1.73E+15 7 YB SR 1.20E-05 14 25 231 28.9 9.7 NAC6 1.73E+15 8 B SR 1.28E-05 46 68 590 34.9 6.8 NAC6 1.73E+15 9 B SH 1.20E-05 34 41 379 42.8 10.0 NAC6 1.73E+15 10 YB SR 1.60E-05 84 88 610 49.2 7.7 NAC6 1.73E+15 11 YB SH 2.00E-05 23 65 361 18.3 4.5 NAC6 1.73E+15 12 YB SH 9.60E-06 46 68 786 34.9 6.8 NAC6 1.73E+15 13 YB SH 6.00E-06 26 35 647 38.3 10.0 NAC6 1.73E+15 14 YB SH 9.60E-06 16 33 382 25.0 7.7 NAC6 1.73E+15 15 O E 9.60E-06 44 60 694 37.8 7.6 NAC6 1.73E+15 16 B SH 8.00E-06 40 40 555 51.5 11.7 NAC6 1.73E+15 17 Y SH 8.00E-06 21 19 264 56.9 18.1 NAC6 1.73E+15 18 Y E 2.00E-05 74 100 555 38.2 6.0 NAC6 1.73E+15 19 B R 2.00E-05 86 117 649 37.9 5.5 NAC6 1.73E+15 20 B SR 8.00E-06 35 31 430 58.2 14.5 NAC8 1.71E+15 1 B SH 1.20E-05 30 85 795 18.0 3.9
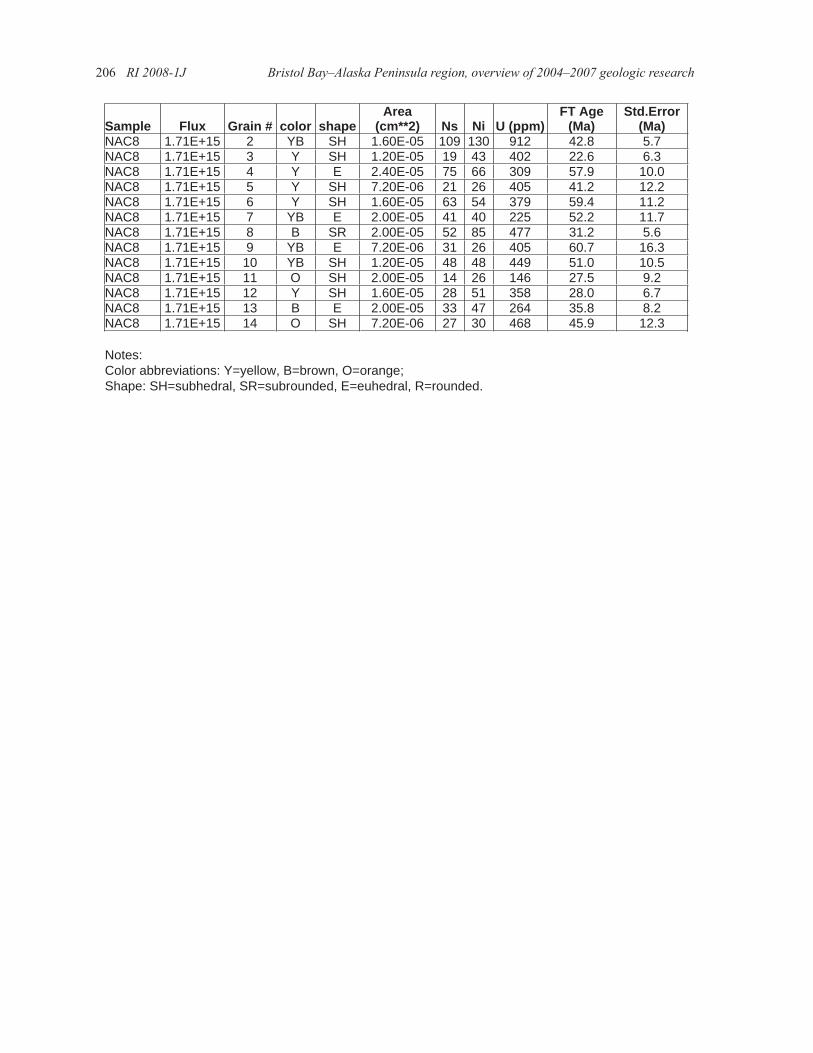
206 RI 2008-1J Bristol Bay–Alaska Peninsula region, overview of 2004–2007 geologic research
Sample Flux Grain # color shapeArea
(cm**2) Ns Ni U (ppm) FT Age
(Ma)Std.Error
(Ma)NAC8 1.71E+15 2 YB SH 1.60E-05 109 130 912 42.8 5.7 NAC8 1.71E+15 3 Y SH 1.20E-05 19 43 402 22.6 6.3 NAC8 1.71E+15 4 Y E 2.40E-05 75 66 309 57.9 10.0 NAC8 1.71E+15 5 Y SH 7.20E-06 21 26 405 41.2 12.2 NAC8 1.71E+15 6 Y SH 1.60E-05 63 54 379 59.4 11.2 NAC8 1.71E+15 7 YB E 2.00E-05 41 40 225 52.2 11.7 NAC8 1.71E+15 8 B SR 2.00E-05 52 85 477 31.2 5.6 NAC8 1.71E+15 9 YB E 7.20E-06 31 26 405 60.7 16.3 NAC8 1.71E+15 10 YB SH 1.20E-05 48 48 449 51.0 10.5 NAC8 1.71E+15 11 O SH 2.00E-05 14 26 146 27.5 9.2 NAC8 1.71E+15 12 Y SH 1.60E-05 28 51 358 28.0 6.7 NAC8 1.71E+15 13 B E 2.00E-05 33 47 264 35.8 8.2 NAC8 1.71E+15 14 O SH 7.20E-06 27 30 468 45.9 12.3
Notes:Color abbreviations: Y=yellow, B=brown, O=orange; Shape: SH=subhedral, SR=subrounded, E=euhedral, R=rounded.