FISHY STORY - ipbl.edu.my · PDF fileJacqueline Martin: Fishy story, ms 29-41. Map, Network...
13
Jacqueline Martin: Fishy story, ms 29-41. FISHY STORY By Jacqueline Martin Sekolah Menengah Kebangsaan Sri Aman, 95000 Sri Aman. Abstract This study was inspired by a desire to experiment and explore new technique and strategy in teaching English for Science and Technology (EST) subject. In particular, this paper presents the findings of an action research conducted on the use of a visual representation of ideas in order to help Science stream students to understand reading texts. The graphic organiser described and illustrated with examples I named WH Fish diagram. Based on the data collected, the introduction of the diagram produced positive results in terms of students’ understanding of the reading text and their ability to present orally the completed diagram. INTRODUCTION As most teachers know, effective reading skills are a critical key to academic success. Yet, many students experience difficulty in mastering this skill and in understanding reading texts given. Engaging students in active reading practices can help them become more involved in their reading, thus aiding comprehension and retention. One way to help the students comprehend the reading texts is to incorporate graphic organizers. Graphic organizers come in many varieties and have been widely researched for their effectiveness in improving learning outcomes for various students and have been applied in teaching and learning of subjects such as Science, Social Studies, languages and Mathematics. Graphic organizers, such as mapping, cause and effect, note taking, comparing and contrasting tables, organizing problems and solutions, and relating information to main ideas or themes can be beneficial to many subject areas. The benefits could go beyond those known to occur in reading comprehension (Bulgren, Schumaker & Deshler, 1988; Herl, O'Neil, Chung, & Schacter, 1999; Willerman & Mac Harg, 1991). Graphic organizers are visual and graphic displays that depict the relationship between facts, terms, and or ideas within a learning task. Graphic organizers are also sometimes referred to as knowledge maps, concept maps, story maps, cognitive organizers, advance organizers, or concept diagrams. Graphic organizers come in many different forms, each one is best suited towards organizing a particular type of information and has its different uses. Among the examples of the different types of graphic organizers are Descriptive or Thematic Jurnal Penyelidikan Tindakan Tahun 2006, Jilid 1/ Kerjasama IPBL dengan PPG Sri Aman dan PPDK Serian, JPN Sarawak di bawah KPKIPBL 29
Transcript of FISHY STORY - ipbl.edu.my · PDF fileJacqueline Martin: Fishy story, ms 29-41. Map, Network...

Jacqueline Martin: Fishy story, ms 29-41.
FISHY STORYBy
Jacqueline MartinSekolah Menengah Kebangsaan Sri Aman,
95000 Sri Aman.
Abstract
This study was inspired by a desire to experiment and explore new technique and strategy in teaching English for Science and Technology (EST) subject. In particular, this paper presents the findings of an action research conducted on the use of a visual representation of ideas in order to help Science stream students to understand reading texts. The graphic organiser described and illustrated with examples I named WH Fish diagram. Based on the data collected, the introduction of the diagram produced positive results in terms of students’ understanding of the reading text and their ability to present orally the completed diagram.
INTRODUCTION
As most teachers know, effective reading skills are a critical key to academic success. Yet, many students experience difficulty in mastering this skill and in understanding reading texts given. Engaging students in active reading practices can help them become more involved in their reading, thus aiding comprehension and retention.
One way to help the students comprehend the reading texts is to incorporate graphic organizers. Graphic organizers come in many varieties and have been widely researched for their effectiveness in improving learning outcomes for various students and have been applied in teaching and learning of subjects such as Science, Social Studies, languages and Mathematics. Graphic organizers, such as mapping, cause and effect, note taking, comparing and contrasting tables, organizing problems and solutions, and relating information to main ideas or themes can be beneficial to many subject areas. The benefits could go beyond those known to occur in reading comprehension (Bulgren, Schumaker & Deshler, 1988; Herl, O'Neil, Chung, & Schacter, 1999; Willerman & Mac Harg, 1991).
Graphic organizers are visual and graphic displays that depict the relationship between facts, terms, and or ideas within a learning task. Graphic organizers are also sometimes referred to as knowledge maps, concept maps, story maps, cognitive organizers, advance organizers, or concept diagrams.
Graphic organizers come in many different forms, each one is best suited towards organizing a particular type of information and has its different uses. Among the examples of the different types of graphic organizers are Descriptive or Thematic
Jurnal Penyelidikan Tindakan Tahun 2006, Jilid 1/ Kerjasama IPBL denganPPG Sri Aman dan PPDK Serian, JPN Sarawak di bawah KPKIPBL
29

Jacqueline Martin: Fishy story, ms 29-41.
Map, Network Tree, Spider Map, Problem and Solution Map, Compare-Contrast Matrix and Series of Events Chain.
Teaching students to use graphic organizers could help students to comprehend better reading materials. The visual tools help the students to understand and organize information. Based on various researches done on the effectiveness of graphic organizers in teaching or reading comprehension, there are evidences that suggested that using graphical organizers for comprehension tool could help students more concretely visualize abstract and vague concepts, and produced some positive learning outcome. According to the studies, graphic organizers would be more effective in improving reading comprehension if they are used in a post-reading instead of in a pre-reading activity. In their extensive and comprehensive review, Moore and Readence (1984) reported that the point of usage is a crucial factor in determining the improvement in learning outcome. When graphic organizers were used as a pre-reading activity, the effect was small. In contrast, when graphic organizers were used as a follow up to reading, there was an improvement in learning outcome.
MY CONCERN
This research was inspired by my desire to experiment and introduce another tool to improve my own practice and to help my students to comprehend English for Science and Technology (EST) reading texts. EST is a new Sijil Pelajaran Malaysia (SPM) subject introduced in the year 2003 by the Malaysian Education Ministry. It is an English test based on science and technology and offered to all Science stream students as an elective subject. So, why EST was introduced? EST aims to provide learners with the language basis to access and understand materials on science and technology in English. As EST covers a range of field from general science, physics, chemistry, biology, mathematics, environmental education and various technologies, it focuses on preparing students with essential skills needed to understand and solve problems which promote higher order thinking skills. The EST syllabus gives emphasis on content accessibility, giving priority to the ability to read and comprehend science and technical materials in English. Therefore, EST plays a role in helping students to express ideas and concepts in English.
EST test consists of two papers, Paper 1 and 2. Paper 1 is divided into three parts - A, B and C whereas Paper 2 consists of 30 multiple choice questions. In Paper 1, 25 questions are asked based on short reading texts and 5 questions are posed in rational cloze paragraph. Part A and B of Paper 2 require students to transfer information from reading texts to graphic organizers which are usually in flow chart and table formats. Part C requires the students to write a report based on points given.
Based on my experience in teaching the subject for more than one and a half years, I found that most students including the good ones have difficulties in understanding reading texts. They always got ‘lost’ and confused by the technical and scientific terminologies and end up reading the texts over and over without the ability to identify the main points or ideas. Based on literature review, graphic organizers are said to be able to assist teachers in accessing what students understand from their reading. This is most helpful in assisting teachers to plan and carry out their lessons
Jurnal Penyelidikan Tindakan Tahun 2006, Jilid 1/ Kerjasama IPBL denganPPG Sri Aman dan PPDK Serian, JPN Sarawak di bawah KPKIPBL
30

Jacqueline Martin: Fishy story, ms 29-41.
to meet the students' needs more effectively. I came out with the idea to introduce a tool in a form of graphic organizer to help my students to read and understand reading texts in EST.
OBJECTIVES OF THE STUDY
The objectives of this study are to improve my own practice in teaching EST subject by introducing a WH Fish diagram, as well as to help my students read and understand reading comprehension texts in EST.
MY QUESTION
In what ways does the WH Fish diagram help my students comprehend EST reading texts?
LIMITATIONS
This research is only limited to 27 students of 5A class. This class is a pure science class in my school.
METHODOLOGY OF THE STUDY
There are four methods in collecting data in this study, namely observation, journal writing, students’ work and interviews with the students concerned.
Observation: Observations were done during an EST lesson prior to the introduction of the diagram. It was carried out in the class while students drawing and complete their diagrams after reading a text and during presentation using the diagrams. These were done in two ways - my own direct observations and observation through photos which were taken during and after the introduction of WH Fish diagram.
Journal writing: Journal writing was done to record the details of the development of my research from the beginning until the end of this research.
Students’ work: There is this saying: “A picture speaks a thousand words”. Therefore, I also included a few sample of students’ work produced in EST lesson as data for this action research. They are useful data too for the planning of my next cycle in action research.
Interview: A few students were selected randomly for short interviews prior to and after the introduction of the WH Fish diagram. The following are pre-implementation and post-implementation questions posed to the students concerned.
Pre-Implementation Questions: Do you like the text reading comprehension activity?Have you ever heard of Fishbone diagram?Do you want to learn about a tool that can be used to help you to understand your reading text?
Jurnal Penyelidikan Tindakan Tahun 2006, Jilid 1/ Kerjasama IPBL denganPPG Sri Aman dan PPDK Serian, JPN Sarawak di bawah KPKIPBL
31

Jacqueline Martin: Fishy story, ms 29-41.
Post-Implementation Questions:Do you like the WH Fish diagram activity?Do you learn more or less through this activity?Will you use this diagram in your reading comprehension activity?
WHAT IS WH FISH DIAGRAM AND WHY?
I did some library research and internet search on various types of graphic organizers. I chose to adapt Fishbone diagram and used it in my EST reading comprehension lessons. Initially, I wanted to adapt the original version of the diagram but at the end, I had to make some modifications to the diagram in terms of components required to complete the diagram. Thus, I introduced the WH Fish diagram, which is a modified version of the Fishbone diagram, to my students in EST class as another approach in helping them to comprehend EST reading texts.
The Fishbone diagram was invented by Dr. Kaoru Ishikawa, a Japanese quality control statistician and it is also referred to as the Ishikawa diagram. The fishbone diagram is originally an analysis tool that provides a systematic way of looking at effects and the causes that create or contribute to those effects. Because of the function of the fishbone diagram, it may be referred to as a cause-and-effect diagram. The design of the diagram looks much like the skeleton of a fish. Therefore, it is often referred to as the fishbone diagram. It is also known as cause and effect diagram or root cause analysis as it lists all possible causes of a result in such a way as to allow a user to graphically show these possible causes. From this diagram, the user can define the most likely causes of a result.
However, I modified the Fishbone diagram to adapt to the needs of my students in comprehending EST reading texts. The reading text materials in EST are mostly more than cause and effect type. They consist of materials that required answers to what, who, where, when, why and how questions. Therefore, I think the WH Fish diagram is very relevant. It has a feature that requires students to complete the diagram by answering the questions labelled and this helps the students to understand their reading text better. The following Diagram 1 is an example of the WH Fish diagram used in my research.
Diagram 1: A WH Fish diagram sample
Jurnal Penyelidikan Tindakan Tahun 2006, Jilid 1/ Kerjasama IPBL denganPPG Sri Aman dan PPDK Serian, JPN Sarawak di bawah KPKIPBL
32
(Where)
(What)
Jacqueline Martin: Fishy story, ms 29-41.
This diagram could also be adapted and used in reading text activity in other subjects, such as, Malay language, Economics and Science. Another reason for the usage of this diagram was that it was something new and different to almost all my 5A students. I thought it was high time for me to not only to make the EST lessons more interesting and enjoyable but at the same time, make the students understand and learn about the topic discussed in the reading texts. Further more, EST classes for both Form Four and Form Five students in my school are conducted outside the normal school session, which is from 12.55 p.m. till 1.30 p.m. for a single period lesson and 12.55 p.m. till 2.10 p.m. for a double period lesson. Thus, it is a common sight to find a few ‘missing’ faces and restless students in these classes.
I adapted the diagram to suit my objective in this research, that is, to use it as a tool to help my students in understanding reading text materials. As such, it is used as a graphic organizer that aids the students in picking out particular information from an article or chapter to answer the questions of who, what, when, where, why and how.
I was with hope that the process of creating the diagram would help the students focus on the topic. As the diagram required the students to review what they already know in order to organize that knowledge, it would also help the students to monitor their comprehension of the topic. Besides that, the diagram would also help in pointing out the areas where the students should investigate further (especially for the part of the diagram which is difficult to fill the answers or information). The diagram would be considered helpful if the students managed to complete the diagram with correct answers and present the diagram orally.
HOW IS THE WH FISH DIAGRAM CONSTRUCTED?
Basic steps in constructing the WH Fish diagram are as stated below.
1. Draw the fishbone diagram.2. List the problem(s)/issue(s) to be studied or being discussed on the "head of the
fish". 3. Label each of the main ‘bone’ of the ‘fish’ with the questions who, what, when,
where, why and how; while the smaller bones are to be labelled with the details of the answer(s) of each question.
4. While reading an article, students are to fill-up the appropriate answers for the questions.
FINDINGS
I started my observation on 3rd of July 2006. It was Monday and I had a double period EST lesson with 5A. As EST lessons were conducted outside the normal school session, I was not surprised with a few ‘missing’ faces and also seeing restless students during those lessons. It would be a normal sight. But on that particular day, the class attendance was full. However, more than half of the twenty nine students showed no interest in participating in the activities that I had planned for them. Some of them gave me blank stares, some were trying real hard to keep their eyes wide open and a few boys at the back of the class had their heads on their desks, ready to doze off.
Jurnal Penyelidikan Tindakan Tahun 2006, Jilid 1/ Kerjasama IPBL denganPPG Sri Aman dan PPDK Serian, JPN Sarawak di bawah KPKIPBL
33
Jacqueline Martin: Fishy story, ms 29-41.
Prior to the introduction of the diagram, I interviewed the students after the lesson for that day that was on the 5th of July 2006. It was conducted informally in relation to what the students thought of the reading comprehension activity in EST and their knowledge on any graphic organizers, particularly on the Fishbone diagram. Some of the students’ responses to the questions posed are shown in Table 1.
Table 1: Pre-implementation students’ responses
Questions ResponsesDo you like the text reading comprehension activity?
• “No.”• “Not really. I hardly understand what I’ve read.”• “Yes. But they the texts are very hard to
understand.”• “I like it but I always get confused.”• “No, it’s boring. We always do the same thing.”
Have you ever heard of Fishbone diagram?
• “No.”• “Something to do with fish, is it?”• “Nope. This is my first time.”• “Yes. But never use it before.”• “I’ve heard about it but not really sure what it is.”
Do you want to learn about a tool that can be used to help you to understand your reading text?
• “Yes.”• “Of course.”• “I do. When can we do that?”• “Definitely. “• “Yes. That would be fun.”
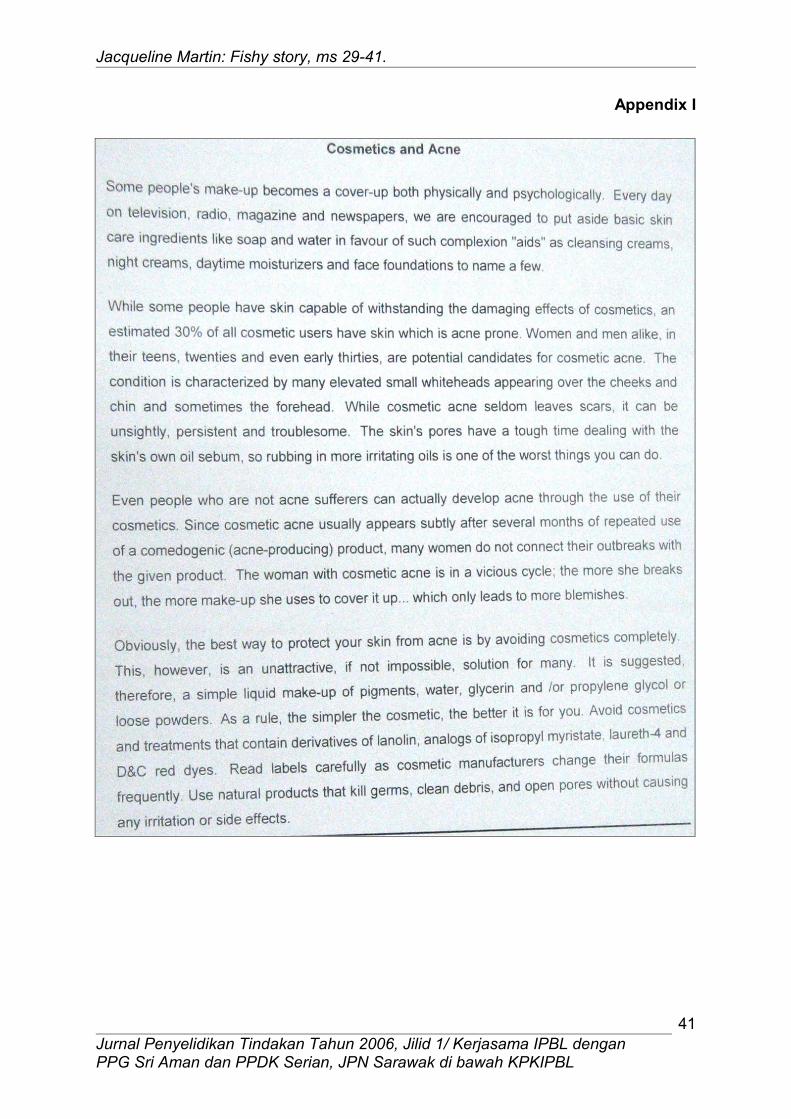
I first introduced the diagram to my students on 10th of July. I entered 5A, full of enthusiasm. I was excited too as I was eager to carry out the WH Fish diagram activity that I had planned for them. Firstly, I briefly explained to my students on the purpose of the diagram and how it is to be constructed. The students were shown an example of a completed diagram too. Then, I distributed the reading text (as shown in Appendix I) for that day and handouts of an incomplete WH Fish diagram. The students were given five minutes to read the text silently before they continued with their groups’ discussion. The students showed good team spirit and involved actively in the discussion based on the reading text and in completing the diagrams. Chart 1 is a sample of my lesson plan for that day.
Class:5A (EST) Time: 1255 – 1405 (70 minutes)Theme/Topic Chemistry/Health – Cosmetics and AcneObjective(s) of the lesson
By the end of this lesson, students will be able to: read and understand a reading text on cosmetics and acne complete a WH Fish diagram with correct information on the
textActivities Pre-Activity:
1. Brainstorm on topic.
While-Activity:1. Introduction of ‘fishbone’ diagram.
L1
2
DIP
IF
SS
S
PSCxCxMI
Jurnal Penyelidikan Tindakan Tahun 2006, Jilid 1/ Kerjasama IPBL denganPPG Sri Aman dan PPDK Serian, JPN Sarawak di bawah KPKIPBL
34

Jacqueline Martin: Fishy story, ms 29-41.
2. Teacher distributes reading text and diagram handouts.
3. Students to read a text silently.4. In groups of 4, students are to discuss
and complete the diagrams given.5. Discussion of answers.
Post-Activity:1. Summarization of students’ work2. Discussion on moral values.
3 IPIF
L
L/S
Moral Values Care for skin’s health, moderationReflection
Note: L= Level; D= Domain; S= Skills (S=Speaking; L=Listening); PS= Pedagogical Skills
Chart 1: Sample of my lesson plan (10th July 2006)
On 12th July, the students were asked to do group work. In their respective groups, they constructed WH Fish diagram on manila cards provided for their presentation session. They divided the tasks equally to ensure every group member have the opportunity to contribute something during the activity. The class environment was carefree as the students were free to move around within their groups and carried out oral discussions and eventually came out with completed diagrams. While the students were doing their work, I went around the class and took a few photos of the students’ works.
At first, I planned to ask the students to present their diagram at the end of the lesson but time did not permit because the students took more time to prepare their diagrams and we only have a single period lesson on that day. Somehow, I had to postpone the presentation session to the next lesson on 17th July. The reasons why I wanted them to present were to evaluate whether they really understand the reading text and whether they are able to present their findings which were the answers to the WH questions in the diagram. If they were able to do that, I would consider this action research a success.
On 17th July, the students presented their WH Fish diagrams. There were six groups altogether and two representatives of each group presented their respective group work. I reminded them that everyone would take turn to present in the next activities. Some students looked very confident to speak in front of their classmates but some were also having butterflies in their stomachs. Overall, they managed to present and show their diagrams to the whole class as shown in Photographs 1 till 6. All their answers for the WH questions were correct and very much similar. To further check on their understanding of the text read, I asked a few questions to the group presenting their respective work.
Jurnal Penyelidikan Tindakan Tahun 2006, Jilid 1/ Kerjasama IPBL denganPPG Sri Aman dan PPDK Serian, JPN Sarawak di bawah KPKIPBL
35

Jacqueline Martin: Fishy story, ms 29-41.
Group 1 Group 2
Group 3 Group 4
Group 5 Group 6Photographs 1-6: WH Fish diagrams constructed by the students in Group 1-6
After the presentation, I asked the students how they like the WH Fish diagram activity and whether they felt they learned more or less this way compared to the normal practices and will they use it in future reading comprehension activity. Table 2 contain some of their responses.
Questions Responses
Jurnal Penyelidikan Tindakan Tahun 2006, Jilid 1/ Kerjasama IPBL denganPPG Sri Aman dan PPDK Serian, JPN Sarawak di bawah KPKIPBL
36

Jacqueline Martin: Fishy story, ms 29-41.
Did you like the WH Fish diagram activity?
• “Yes.”• “Definitely.”• “Yes. It was interesting.”• “It was different but I liked it.”• “I liked it very much especially the presentation
part.”Did you learn more or less through this activity?
• “More.”• “I learned more.”• “Of course I learned more.”• “Yes, I learned more. Why our teacher didn’t
introduce this diagram earlier?”• “I learned more. The reading text was easier to
understand this way.”Will you use this diagram in your reading comprehension activity?
• “Yes.”• “Of course, it’s fun.”• “I will. It’s so easy to use.”• “Definitely, I will. “• “Yes. I can apply it in other subjects too, right?”
DISCUSSION
I was taken back by the students’ response during my informal interview before the introduction of the diagram. Although this class is considered the best Form Five class this year, majority of the students were having problems in comprehending reading text. Somehow, despite their lack of knowledge in graphic organizers, they agreed to learn more about them and try them out to help solve their comprehension difficulty in EST.
When I introduced the WH Fish diagram, I noticed encouraging responses as the students listened attentively and involved actively in the reading text activities planned for that day. At the end of the lesson, all groups managed to complete the diagrams that I had distributed with correct answers. That was one of the evaluation measures to indicate whether I achieved my objective or the other way around. However, I still need to find out more before I could conclude my findings. As such, I decided to get the students to present their diagrams during the next lesson.
Using the WH Fish diagram learned in the previous lesson and referring to the sample of the diagram given previously, the students constructed their group diagrams on manila cards provided. One thing I love about doing action research is encountering unexpected outcomes. The answers for all questions on the diagrams were not much different from the other but the version of WH Fish diagram produced by each group was interesting. They were different from the sample that I have used previously in my introductory lesson.
Based on the photographs of the students’ diagrams, I would say that I have made a lot of assumptions and interpretations. I did expect that there were possibilities that the students would modify the sample given but not that much. I think one of the reasons why the students came up with diagrams with different shapes and
Jurnal Penyelidikan Tindakan Tahun 2006, Jilid 1/ Kerjasama IPBL denganPPG Sri Aman dan PPDK Serian, JPN Sarawak di bawah KPKIPBL
37

Jacqueline Martin: Fishy story, ms 29-41.
appearances was because I did not strictly instruct them to follow exactly the sample of the diagram given to them. They only used it as a reference. They also said that my sample was too boring and dull. Utilizing their own creativity, they constructed their groups’ own version of the diagrams. Maybe, I have given them too much freedom in terms of using their creativity and time.
From the findings, I could conclude a few things:
(1) The students enjoyed the reading text activity using WH Fish diagram.(2) Besides the diagram, the students also learned about other things such as
team work, using creativity and presentation.(3) Students learn more if given the opportunity.(4) Students need to be taught different kinds of learning tools to help them in
their learning process.(5) Teachers should constantly vary their practices to cater for their students’
needs and most of all, to keep the students interested in the lessons.
REFLECTION
Personally, I would say that the hardest task in my action research project was actually deciding on what I was going to work on in my teaching practice. A few issues came to my mind. I considered questioning techniques, presentation skills, classroom management and more. Finally, I settled on reading comprehension skill, a skill that my students so much lacked.
If the students do not understand the text given by their teacher, then learning will not take place. So I set out to improve my teaching technique and later hope that I would improve my students’ reading comprehension skill by introducing the WH Fish diagram and evaluating students’ feedback and responses through questioning, observation, their group work (the diagrams) as well as their presentations.
This action research was a wonderful experience to me. My students’ cooperation and involvement were impressive throughout the research period. Maybe they were as excited as I was in learning and using the new diagram and at the end of the day, we got to see the outcomes – a variety of WH Fish diagram! The presentation part was the climax as all groups were eager to present using the diagrams.
The most thrilling moment for me was to witness how the students managed to transfer the ideas from the reading text into the WH Fish diagram accurately. I could see that the students presented their respective diagrams confidently when compared to the normal presentation activities that they had all this while. I realized I have made a difference by introducing them the diagram.
Another thing that intrigued me more was the students actually presented something beyond my expectation when I first came up with the idea to introduce the diagram. They actually modified the sample of the diagram given to them. Despite the belief that I have achieved my objectives, I started to ponder what could be the reasons for this result - another action research topic or this, maybe? But then again, I could not agree more with the saying “pictures are worth a thousand words” because they can
Jurnal Penyelidikan Tindakan Tahun 2006, Jilid 1/ Kerjasama IPBL denganPPG Sri Aman dan PPDK Serian, JPN Sarawak di bawah KPKIPBL
38

Jacqueline Martin: Fishy story, ms 29-41.
provoke more powerful associations that enhance critical thinking and memory than words alone.
CONCLUSION
Effective teachers are those who adapt their teaching styles and methods to cater for the students’ learning styles. Teaching with materials that adapt to more than one learning style reaches a greater number of students than teaching with a single method such as the lecture, which reaches only those with auditory preferences. As teachers, the students are our clients. Therefore, it is our duty to provide a variety of educational experiences so that they can relate to what they are learning and apply the lessons to their lives later.
BIBLIOGRAPHY
Akbar Ibrahim. (2004). Penyelidikan kualitatif: Satu pengenalan ringkas. Kuching, Sarawak: PROFES.
Arhar, J.M., Holly, M.L. & Kasten, W.C. (2001). Action research for teachers: Traveling the yellow brick road. Upper Saddle, New Jersey: Prentice-Hall, Inc.
Bahagian Pendidikan Guru. (2001). Garis panduan kursus penyelidikan tindakan untuk Maktab/ Institut Perguruan Malaysia. Kuala Lumpur: Kementerian Pendidikan Malaysia.
Bulgren, J., Schumaker, J. B., & Deschler, D. D. (1988). Effectiveness of a concept teaching routine in enhancing the performance of LD students in secondary-level mainstream classes. Learning Disability Quarterly, 11(1), 3-17.
Chuah Kim Hwa. (2006). Data dalam penyelidikan tindakan dan teknik pengumpulan data kualitatif penyelidikan tindakan. Materials for Intermediate Stage Action Research Workshop/ Course (Phase 1) Year 2006 under the program Kursus Pendek Kelolaan Institut, Institut Perguruan Batu Lintang, 28-29 March 2006 at MP Batu Lintang, Kuching, Sarawak.
Chuah Kim Hwa. (2006). Analisis data kualitatif dalam penyelidikan tindakan. Materials for Intermediate Stage Action Research Workshop/ Course (Phase 2) Year 2006 under the program Kursus Pendek Kelolaan Institut, Institut Perguruan Batu Lintang, 22-23 June 2006 at PKG Serian, Sarawak.
Creswell, J. W. (2005). Educational research: Planning, conducting, and evaluating quantitative and qualitative research. Upper Saddle River, New Jersey: Pearson Education, Inc.
Hismanoglu, M. Language learning strategies in foreign language learning and teaching. The Internet TESL Journal, Vol. VI, No. 8. Retrieved 17th April 2006 from http://iteslj.org/Articles/Hismanoglu-Strategies.html
Idol, L., & Croll, V. J. (1987). Story-mapping training as a means of improving reading comprehension. Learning Disability Quarterly, 10(3), 214-229.
Jurnal Penyelidikan Tindakan Tahun 2006, Jilid 1/ Kerjasama IPBL denganPPG Sri Aman dan PPDK Serian, JPN Sarawak di bawah KPKIPBL
39

Jacqueline Martin: Fishy story, ms 29-41.
Kemmis, S., & McTaggart, R. (1988). The Action Research Planner. Geelong: Deakin University.
Marshall, C. & Rossman, G.B. (1999). Designing qualitative research. (3rd ed.) Thousand Oaks, California: Sage Publications.
Mary Wong Siew Lian. (2006). Writing a research paper. Materials for Intermediate Stage Action Research Workshop/ Course (Phase 2) Year 2006 under the program Kursus Pendek Kelolaan Institut, Institut Perguruan Batu Lintang, 22-23 June 2006 at PKG Serian, Sarawak.
Merkley, D.M. & Jefferies, D. (2001). Guidelines for implementing a graphic organizer. The Reading Teacher, 54(4), 350-357.
Mills, G. E. (2003). Action research: A guide for the teacher researcher. Upper Saddle River, New Jersey: Merrill/Prentice Hall.
Moore, D. W., & Readence, J. E. (1984). A quantitative and qualitative review of graphic organizer research. Journal of Educational Research, 78(1), 11-17.
PALM. (1988-1990). Supporting teacher development through action research: A PALM resource for advisory teacher. Norwich: University of East Anglia.
Strangman, N., Hall, T., & Meyer, A. (2003). Graphic organizers with UDL. Wakefield, MA: National Centre on Accessing the General Curriculum. Retrieved 17th April 2006 from http://www.cast.org/publications/ncac/ncac_goudl.html
Stringer, E. (1996). Action research: A handbook for practitioners. Thousand Oaks, CA: Sage.
Sweet, , A. P., & Snow, C.E. (Eds.). (2003). Rethinking reading comprehension. New York: Guilford.
Toh Wah Seng. (2005). Penyelidikan tindakan: Perkembangan profesionalisme ke arah pengamalan reflektif dan penambahbaikan sekolah. In Prosiding Penyelidikan Tindakan tahun 2005, 3-4 Oktober 2005, pp. 1-7. Kuching, Sarawak: Maktab Perguruan Batu Lintang
Willerman, M., & Mac Harg, R. A. (1991). The concept map as an advance organizer. Journal of Research in Science Teaching, 28(8), 705-712.
Jurnal Penyelidikan Tindakan Tahun 2006, Jilid 1/ Kerjasama IPBL denganPPG Sri Aman dan PPDK Serian, JPN Sarawak di bawah KPKIPBL
40
Jacqueline Martin: Fishy story, ms 29-41.
Appendix I
Jurnal Penyelidikan Tindakan Tahun 2006, Jilid 1/ Kerjasama IPBL denganPPG Sri Aman dan PPDK Serian, JPN Sarawak di bawah KPKIPBL
41