
Fishery selection and its relevance to stock assessment and fishery management.
FISHERY ASSESSMENT REPORT
TASMANIAN ROCK LOBSTER FISHERY
2011/12
Klaas Hartmann, Caleb Gardner and David Hobday
May 2013
Institute for Marine and Antarctic Studies, University of Tasmania, PO Box 49,
Hobart TAS 7001
Enquires should be directed to:
Assoc Prof Caleb Gardner
Program Leader Fisheries
Institute for Marine and Antarctic Studies
University of Tasmania
Private Bag 49, Hobart, Tasmania 7001, Australia
Ph. (03) 6227 7277,
Fax (03) 6227 8035
The authors do not warrant that the information in this document is free from errors or
omissions. The authors do not accept any form of liability, be it contractual, tortious,
or otherwise, for the contents of this document or for any consequences arising from
its use or any reliance placed upon it. The information, opinions and advice contained
in this document may not relate, or be relevant, to a reader‟s particular circumstance.
Opinions expressed by the authors are the individual opinions expressed by those per-
sons and are not necessarily those of the Institute for Marine and Antarctic Studies
(IMAS) or the University of Tasmania (UTas).
The Institute for Marine and Antarctic Studies, University of Tasmania 2013.
Copyright protects this publication. Except for purposes permitted by the
Copyright Act, reproduction by whatever means is prohibited without the prior
written permission of the Institute for Marine and Antarctic Studies.
Rock Lobster Fishery Assessment: 2011/12
IMAS Fishery Assessment Report Page i
Executive Summary
Current Stock Status
Biological Sustainability
Biological sustainability is measured through egg production and recruitment.
Egg production declined over the last year but, at an estimated 40% of virgin
production, is still at very high levels and thus well above the limit reference
point of 25%. However, the level of egg production may be unrelated to future
stock stability because of the imprecise relationship between egg production and
future recruitment and the likely reliance on egg production from other States.
The average weights of lobsters in northern areas (4 and 5) and south and south
west areas (1, 8 and 7) are declining, signalling an improvement in the balance
between recruitment to the fishery and catch removed by harvesting. Average
weight has stabilised in all other areas except 6.
In most areas the number of new pre-recruits (sub legal lobsters larger than
60mm) has been below the decadal average for several years except area 7, indi-
cating poor recruitment since 2007.
Puerulus settlement off eastern Tasmania improved during 2011 to average and
was above average levels, which is a positive sign for future recruits to the fish-
ery.
Economic benefit
Economic benefit is affected by changes in the legal sized portion of the stock
only. The daily catch per vessel increased for the first year since 2007/08 and re-
sulted in a decrease in vessel days. Daily revenue per vessel declined slightly.
The 2011/12 commercial catch was 1,104 tonnes and was constrained by the
TACC at a level lower than any of the previous 60 years of the fishery.
Effort during 2011/12 fell to 1.35 million potlifts, equivalent to the levels prior
to the stock decline in 2006.
The State-wide catch rate (CPUE) was 0.79 kg/potlift, which is the lowest on
record (since 1947) but was stable and had not declined from the previous year.
Catch rates increased in southern areas (1, 8, 9 and 11) by 10-20%, were stable
in area 7, and declined in remaining areas. The broad pattern here is of stock
improvement in the south but decline in the north so that there was no overall
statewide change.
Both the catch rate and stock abundance (exploitable biomass) for the 2011/12
quota year were at or below the limit reference in three of the areas (2, 4 and 5)
and abundance was below the reference in area 10. This was an improvement
from the previous year when six areas were below the limit reference for catch
rate and abundance.
The capacity for the Tasmanian southern rock lobster fishery to support the an-
nual harvest is a function of both growth of the legal sized stock and also re-
cruitment of new lobsters into the stock. Decline in productivity from both of
Rock Lobster Fishery Assessment: 2011/12
IMAS Fishery Assessment Report Page ii
these processes has resulted in a decline of the legal-sized stock, which in turn
has led to TACC reductions. An interim target for stock rebuilding of 1.2 kg /
potlift by 2019 is in place which is on the path towards maximum economic
yield. Trends in the stock in this year were consistent with rebuilding to that
target.
Ecosystem effects of fishing
There were no notable trends in by-catch or by-product data.
There were no reported protected species interactions.
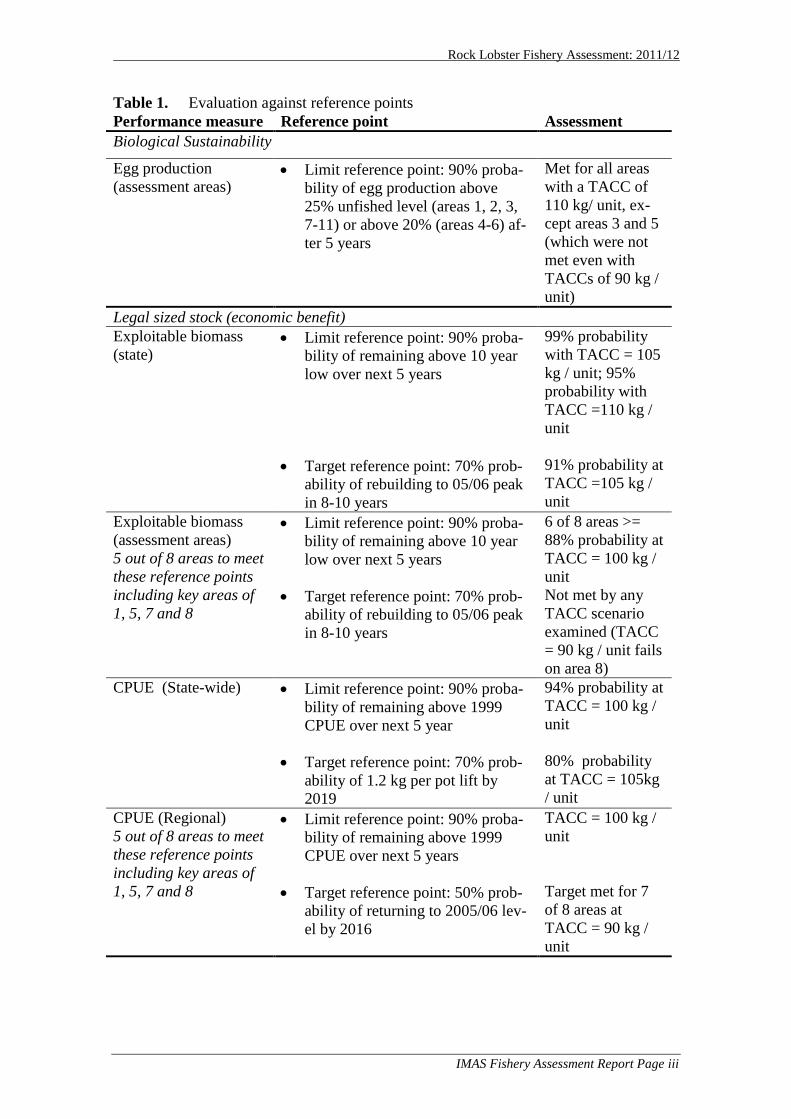
Evaluation of Future Harvest Strategies The harvest strategy evaluation indicated that TACCs of 105 kg / unit (equivalent to a
TACC of 1103 t) or less have acceptable probability of meeting most target and limit
reference points (Table 1).
These analyses included some important assumptions which were:
(i) future recruitment will broadly reflect that observed from 1998-2007 (includ-
ing periods of both high and low recruitment) noting that undersize length
frequency data contributes information on future recruitment in projections;
(ii) no expansion of catch beyond changes in the TACC (i.e. recreational and ille-
gal catch was assumed to be constant);
(iii) no loss of productivity through expansion of no-take MPAs;
(iv) no loss of productivity through expansion of urchin barrens;
(v) no loss of productivity through increase in natural mortality (e.g. through in-
crease in octopus mortalities); and
(vi) all other management rules were constant (in particular, they don‟t include
gains in stock productivity from the commercial scale translocations opera-
tions that commenced in 2012 – this equated to stock rebuilding roughly
equivalent to what would occur with a reduction in the TACC of 5 kg / quota
unit).
These assumptions exist because of the inability to predict future values of factors
such as coverage of MPAs and urchin barrens or change in catch of other sectors.
This uncertainty is appropriately included in the decision making process where the
probability of meeting reference points in the future is required to be either 70% or
90%, depending on the reference point. This conservative approach provides pro-
tection against declines in productivity that could occur through processes such as
expansion of urchin barrens, increase in natural mortality or decline in recruitment.
Rock Lobster Fishery Assessment: 2011/12
IMAS Fishery Assessment Report Page iii
Table 1. Evaluation against reference points
Performance measure Reference point Assessment
Biological Sustainability
Egg production
(assessment areas) Limit reference point: 90% proba-
bility of egg production above
25% unfished level (areas 1, 2, 3,
7-11) or above 20% (areas 4-6) af-
ter 5 years
Met for all areas
with a TACC of
110 kg/ unit, ex-
cept areas 3 and 5
(which were not
met even with
TACCs of 90 kg /
unit)
Legal sized stock (economic benefit)
Exploitable biomass
(state) Limit reference point: 90% proba-
bility of remaining above 10 year
low over next 5 years
99% probability
with TACC = 105
kg / unit; 95%
probability with
TACC =110 kg /
unit
Target reference point: 70% prob-
ability of rebuilding to 05/06 peak
in 8-10 years
91% probability at
TACC =105 kg /
unit
Exploitable biomass
(assessment areas)
5 out of 8 areas to meet
these reference points
including key areas of
1, 5, 7 and 8
Limit reference point: 90% proba-
bility of remaining above 10 year
low over next 5 years
6 of 8 areas >=
88% probability at
TACC = 100 kg /
unit
Target reference point: 70% prob-
ability of rebuilding to 05/06 peak
in 8-10 years
Not met by any
TACC scenario
examined (TACC
= 90 kg / unit fails
on area 8)
CPUE (State-wide)
Limit reference point: 90% proba-
bility of remaining above 1999
CPUE over next 5 year
94% probability at
TACC = 100 kg /
unit
Target reference point: 70% prob-
ability of 1.2 kg per pot lift by
2019
80% probability
at TACC = 105kg
/ unit
CPUE (Regional)
5 out of 8 areas to meet
these reference points
including key areas of
1, 5, 7 and 8
Limit reference point: 90% proba-
bility of remaining above 1999
CPUE over next 5 years
TACC = 100 kg /
unit
Target reference point: 50% prob-
ability of returning to 2005/06 lev-
el by 2016
Target met for 7
of 8 areas at
TACC = 90 kg /
unit
Rock Lobster Fishery Assessment: 2011/12
IMAS Fishery Assessment Report Page iv
Table of Contents
1 Introduction .............................................................................................................. 5 1.1 The modern commercial fishery ........................................................................ 5
1.1 Performance measures ....................................................................................... 8 2 Recent developments .............................................................................................. 10
2.1 Management history of the fishery .................................................................. 10 3 Fishery assessment ................................................................................................. 11
3.1 Commercial catch and effort analysis .............................................................. 11
3.1.1 State-wide commercial catch and effort ................................................... 11 3.1.2 Active vessels ........................................................................................... 13 3.1.3 Regional commercial catch and effort ...................................................... 15 3.1.4 Mean weight ............................................................................................. 26 3.1.5 Non-quota commercial catch .................................................................... 26
3.1.6 Research quota .......................................................................................... 28 3.2 Recreational catch ............................................................................................ 29
3.3 Assessment model analysis .............................................................................. 30 3.3.1 Reference Points ....................................................................................... 30 3.3.2 Recruitment assumption ........................................................................... 31
3.4 Assessment model results ................................................................................ 32
3.4.1 Biomass .................................................................................................... 32 3.4.2 Egg production ......................................................................................... 36
3.4.3 Catch rate trends (CPUE) ......................................................................... 40 3.5 Recruitment ...................................................................................................... 42
3.5.1 Model estimated recruitment .................................................................... 42
3.5.2 Recruitment from puerulus settlement monitoring ................................... 43 4 Outcomes of translocation of lobsters .................................................................... 46
4.1 Ecosystem outcomes ........................................................................................ 46
5 Economic and market status ................................................................................... 48
6 Discussion ............................................................................................................... 50 7 Management advice ................................................................................................ 51 8 Ecosystem based management ............................................................................... 52
8.1 Protected species interactions .......................................................................... 52
8.1.1 Research sampling data ............................................................................ 52 8.1.2 Commercial logbook data ......................................................................... 52
8.2 By-catch ........................................................................................................... 52 8.3 By-product ....................................................................................................... 54 8.4 Urchin predation by rock lobsters .................................................................... 54
9 Bibliography ........................................................................................................... 56 10 Appendix 1: Historical overview ............................................................................ 58 11 Appendix 2: Management ...................................................................................... 60
12 Appendix 3: Summary of Rules ............................................................................. 61
Rock Lobster Fishery Assessment: 2011/12
IMAS Fishery Assessment Report Page 5
1 Introduction
1.1 The modern commercial fishery
The present commercial catch is taken from areas all around the State and involves the
annual harvest of around 1.2 million animals. In the 2011/12 season 235 licensed ves-
sels reported catches of rock lobster, a decrease of one from the previous year. In addi-
tion, there were 19,285 licensed recreational fishers during 2012 which was down from
19,530 the previous year. The recreational catch and regional distribution data used in
modelling for this assessment was taken in 2008/2009 when an estimated 107 tonnes
were caught (Lyle, 2010).
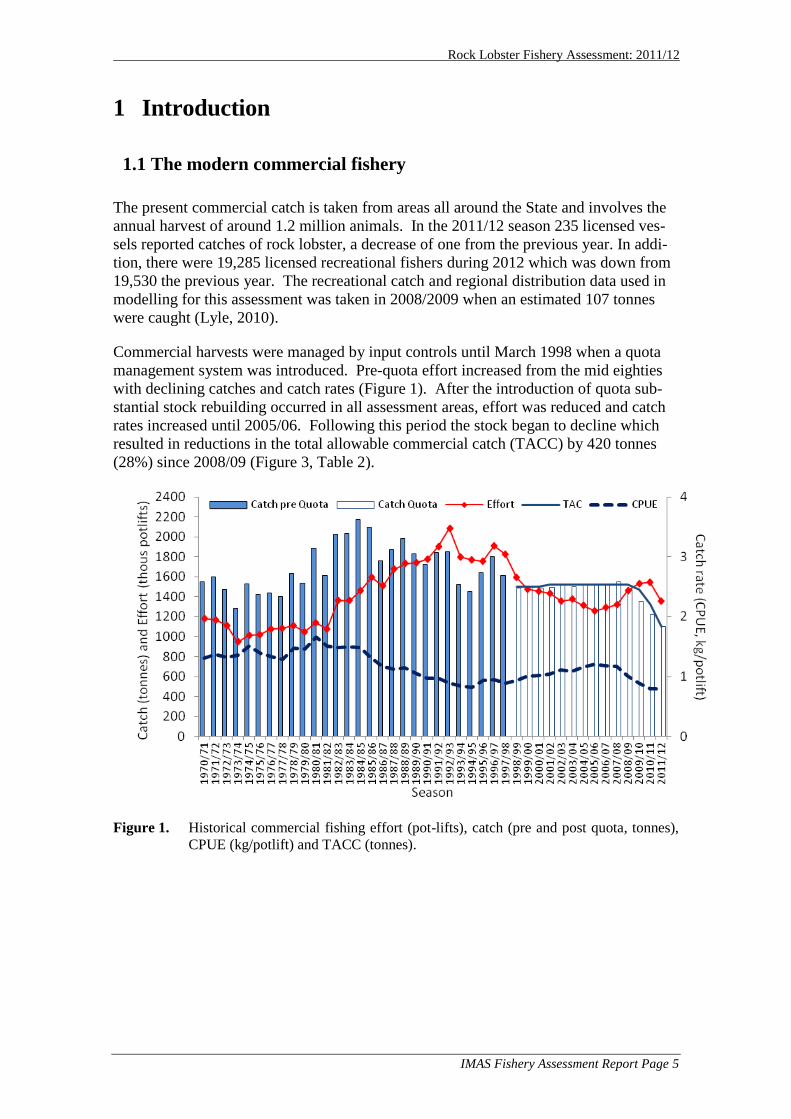
Commercial harvests were managed by input controls until March 1998 when a quota
management system was introduced. Pre-quota effort increased from the mid eighties
with declining catches and catch rates (Figure 1). After the introduction of quota sub-
stantial stock rebuilding occurred in all assessment areas, effort was reduced and catch
rates increased until 2005/06. Following this period the stock began to decline which
resulted in reductions in the total allowable commercial catch (TACC) by 420 tonnes
(28%) since 2008/09 (Figure 3, Table 2).
Figure 1. Historical commercial fishing effort (pot-lifts), catch (pre and post quota, tonnes),
CPUE (kg/potlift) and TACC (tonnes).

Rock Lobster Fishery Assessment: 2011/12
IMAS Fishery Assessment Report Page 6
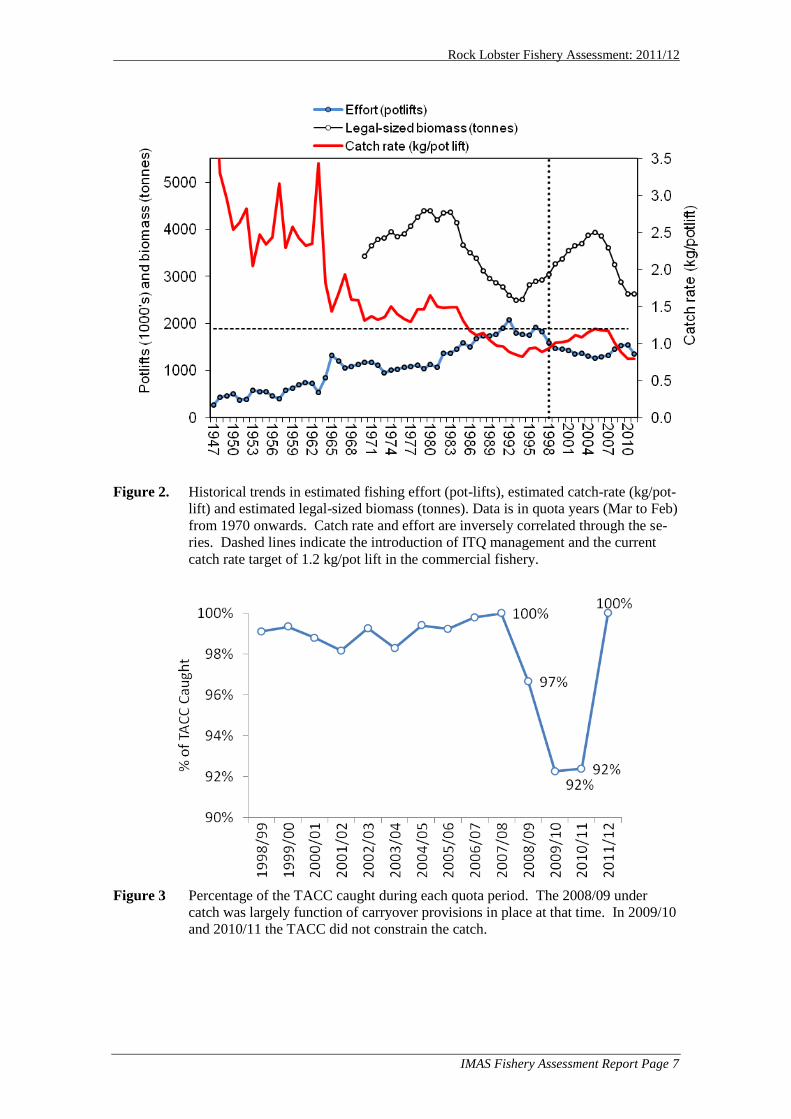
The post quota recovery can be seen in the historical trends in the fishery (Figure 1 and
Figure 2). The estimated total legal biomass showed a decline from 2006/07 to 2010/11
but showed no change in the past season. Trends in legal biomass and catch rates are
roughly similar although with some important differences. In the period of stock re-
building from 1995 to 2005, catch-rates recovered slower than biomass due to a chang-
ing fishery dynamics. For example, fishers increased their effort in locations and months
when catch rates are lower but price was higher. In recent years, catch rates have de-
clined faster than estimated biomass, possibly again due to fleet effects.
Prior to the 2008/09 quota period, the TACC constrained the catch with only 1-2% un-
caught. In 2008/09 the TACC was not taken but this was not a true “under-catch” be-
cause carry-over provisions were in place at that time which allowed fishers to catch
some of their allocated quota in the following year. Those provisions have now been
removed. During the 2009/10 and 2010/11 quota period the percentage of the TACC
caught declined to 92%, which was partially due to low catch rates but also influenced
by the dynamics of the quota lease market. Fishers can operate profitably at much low-
er catch rates than occurred in these years, as evidenced by the adjacent fishery in Vic-
toria where catch rates fell to around half of those here. In a quota-managed fishery the
fisher‟s decision to go to sea and catch quota is influenced by the market price for lease
quota. Thus the functioning of the quota lease market and the price demanded also con-
tributed to the under catch in the two years. The TACC was fully caught in the 2011/12
season (Figure 3).
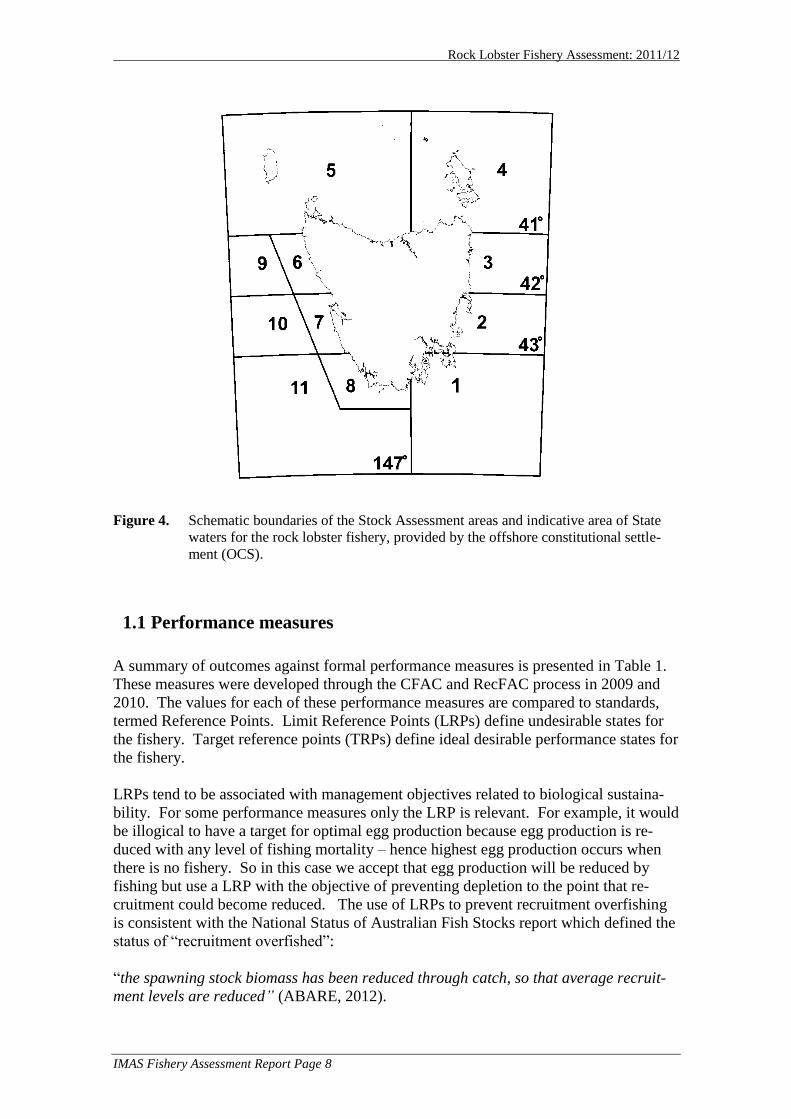
Both fishing effort and biological parameters vary dramatically from region to region
which presents major challenges for fishery assessment and management. An important
step towards meeting these challenges is the use of a spatially-explicit stock assessment
model that considers different assessment areas separately and informs harvest strate-
gies which incorporate regional differences. Recent changes to the assessment model
have enabled information to be presented separately for water shallower or deeper than
35 fathoms off the west coast. These areas have been assigned numbers of 9, 10 and 11
(Figure 4).
Rock Lobster Fishery Assessment: 2011/12
IMAS Fishery Assessment Report Page 7
Figure 2. Historical trends in estimated fishing effort (pot-lifts), estimated catch-rate (kg/pot-
lift) and estimated legal-sized biomass (tonnes). Data is in quota years (Mar to Feb)
from 1970 onwards. Catch rate and effort are inversely correlated through the se-
ries. Dashed lines indicate the introduction of ITQ management and the current
catch rate target of 1.2 kg/pot lift in the commercial fishery.
Figure 3 Percentage of the TACC caught during each quota period. The 2008/09 under
catch was largely function of carryover provisions in place at that time. In 2009/10
and 2010/11 the TACC did not constrain the catch.
Rock Lobster Fishery Assessment: 2011/12
IMAS Fishery Assessment Report Page 8
Figure 4. Schematic boundaries of the Stock Assessment areas and indicative area of State
waters for the rock lobster fishery, provided by the offshore constitutional settle-
ment (OCS).
1.1 Performance measures
A summary of outcomes against formal performance measures is presented in Table 1.
These measures were developed through the CFAC and RecFAC process in 2009 and
2010. The values for each of these performance measures are compared to standards,
termed Reference Points. Limit Reference Points (LRPs) define undesirable states for
the fishery. Target reference points (TRPs) define ideal desirable performance states for
the fishery.
LRPs tend to be associated with management objectives related to biological sustaina-
bility. For some performance measures only the LRP is relevant. For example, it would
be illogical to have a target for optimal egg production because egg production is re-
duced with any level of fishing mortality – hence highest egg production occurs when
there is no fishery. So in this case we accept that egg production will be reduced by
fishing but use a LRP with the objective of preventing depletion to the point that re-
cruitment could become reduced. The use of LRPs to prevent recruitment overfishing
is consistent with the National Status of Australian Fish Stocks report which defined the
status of “recruitment overfished”:
“the spawning stock biomass has been reduced through catch, so that average recruit-
ment levels are reduced” (ABARE, 2012).
Rock Lobster Fishery Assessment: 2011/12
IMAS Fishery Assessment Report Page 9
The use of LRPs to avoid recruitment overfishing is a very conservative measure. It
means that the average levels of juveniles recruiting to the fishery should be equivalent
to that which occurs in the unfished stock. This is possible with well-controlled fishery
harvesting because of surplus production of recruits.
The economic benefit from both recreational and commercial fisheries is related to the
abundance and catch of the legal sized stock. In this case LRPs are paired with Target
Reference Points (TRPs). Target reference points are logical for managing benefit from
fisheries because there is a trade-off between catch and stock abundance. This is true
for recreational fisheries where benefit is the success or enjoyment of fishing and also
for commercial fisheries the benefit is the financial earnings (technically, both these
benefits are forms of economic yield). High levels of catch provide high revenue but
reduce the legal sized biomass. Low catch rates are undesirable for both sectors because
they imply high cost of fishing in the commercial sector and a greater number of unsuc-
cessful fishing trips in the recreational sector. Hence there is a trade-off between catch
rates and catch, and the TRP attempts to optimise this balance.
Management action is intended to be more forceful in achieving LRPs than TRPs and
this intent is achieved through probabilities – that is, most LRPs are assigned a high
probability of 90% and TRPs a 70% probability.
There are no performance measures developed for ecosystem interactions in the Tasma-
nian lobster fishery at present, although data is collected and reported for protected spe-
cies interactions, by-catch and by-product.
Ecosystem data from unfished sites is available and the development of performance
measures was pursued in 2010, however, none could be developed. This was because (i)
changes in non-fished sites are mainly of target species rather than ecosystem changes;
(ii) the effect is confounded by closure to all fishing types, not just lobster fishing; and
(iii) no meaningful thresholds could be developed (for example, the purple sea urchin
Heliocidaris erythrogramma was more abundant outside reserves, presumably through
release from lobster predation, but it was unclear what level was of concern and could
be used as an LRP).
Rock Lobster Fishery Assessment: 2011/12
IMAS Fishery Assessment Report Page 10
2 Recent developments
2.1 Management history of the fishery
The implementation of the quota system in the commercial fishery in March 1998 re-
sulted in an increased focus on economic yield rather than simply trying to maximize
catch. Previous assessments have discussed the change in the dynamics of the fishing
fleet since quota was introduced and noted that there was some shift in effort towards
winter fishing and shallow water to maximise value (e.g. Frusher et al., 2003). Change
in the fleet distribution had the potential to bias the stock assessment as it could lead to
localized depletion in inshore waters while harvest rates in offshore stocks remain low
due to the lower price of deep water, pale lobsters. This issue has been addressed in re-
cent assessments by dividing west coast assessment areas into shallow (less than 35
fathoms) and deep components.
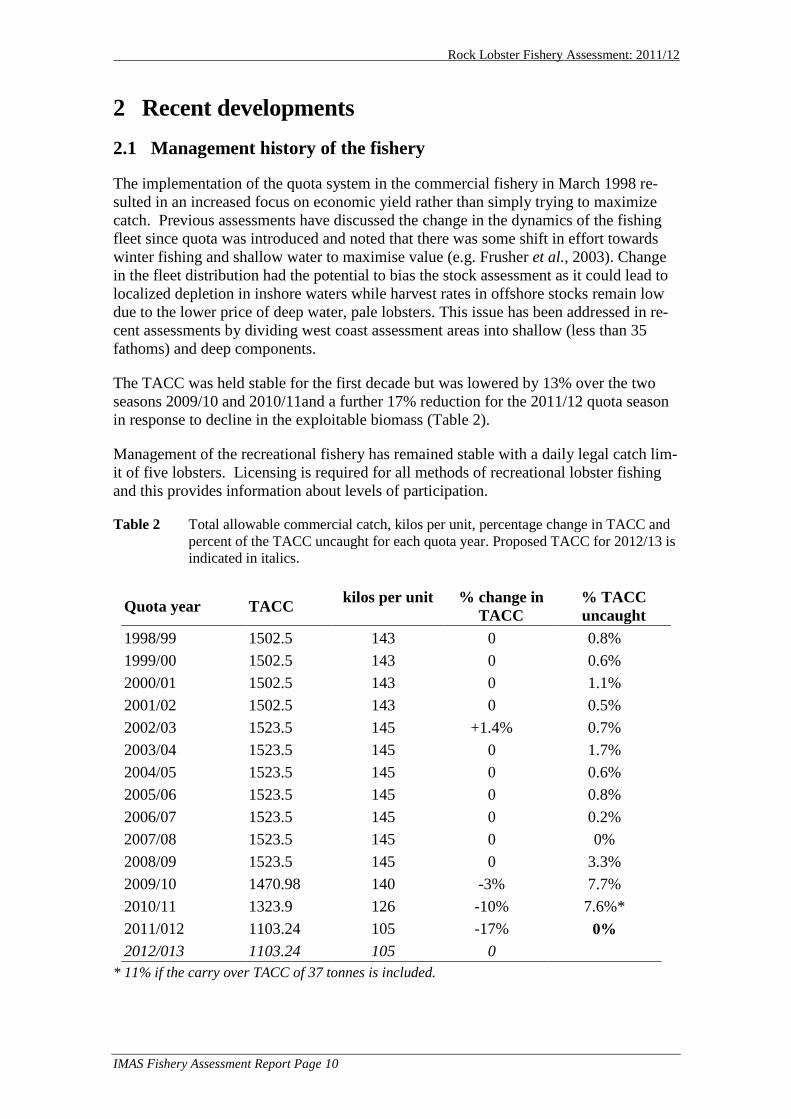
The TACC was held stable for the first decade but was lowered by 13% over the two
seasons 2009/10 and 2010/11and a further 17% reduction for the 2011/12 quota season
in response to decline in the exploitable biomass (Table 2).
Management of the recreational fishery has remained stable with a daily legal catch lim-
it of five lobsters. Licensing is required for all methods of recreational lobster fishing
and this provides information about levels of participation.
Table 2 Total allowable commercial catch, kilos per unit, percentage change in TACC and
percent of the TACC uncaught for each quota year. Proposed TACC for 2012/13 is
indicated in italics.
Quota year TACC kilos per unit % change in
TACC
% TACC
uncaught
1998/99 1502.5 143 0 0.8%
1999/00 1502.5 143 0 0.6%
2000/01 1502.5 143 0 1.1%
2001/02 1502.5 143 0 0.5%
2002/03 1523.5 145 +1.4% 0.7%
2003/04 1523.5 145 0 1.7%
2004/05 1523.5 145 0 0.6%
2005/06 1523.5 145 0 0.8%
2006/07 1523.5 145 0 0.2%
2007/08 1523.5 145 0 0%
2008/09 1523.5 145 0 3.3%
2009/10 1470.98 140 -3% 7.7%
2010/11 1323.9 126 -10% 7.6%*
2011/012 1103.24 105 -17% 0%
2012/013 1103.24 105 0
* 11% if the carry over TACC of 37 tonnes is included.
Rock Lobster Fishery Assessment: 2011/12
IMAS Fishery Assessment Report Page 11
3 Fishery assessment
3.1 Commercial catch and effort analysis
3.1.1 State-wide commercial catch and effort
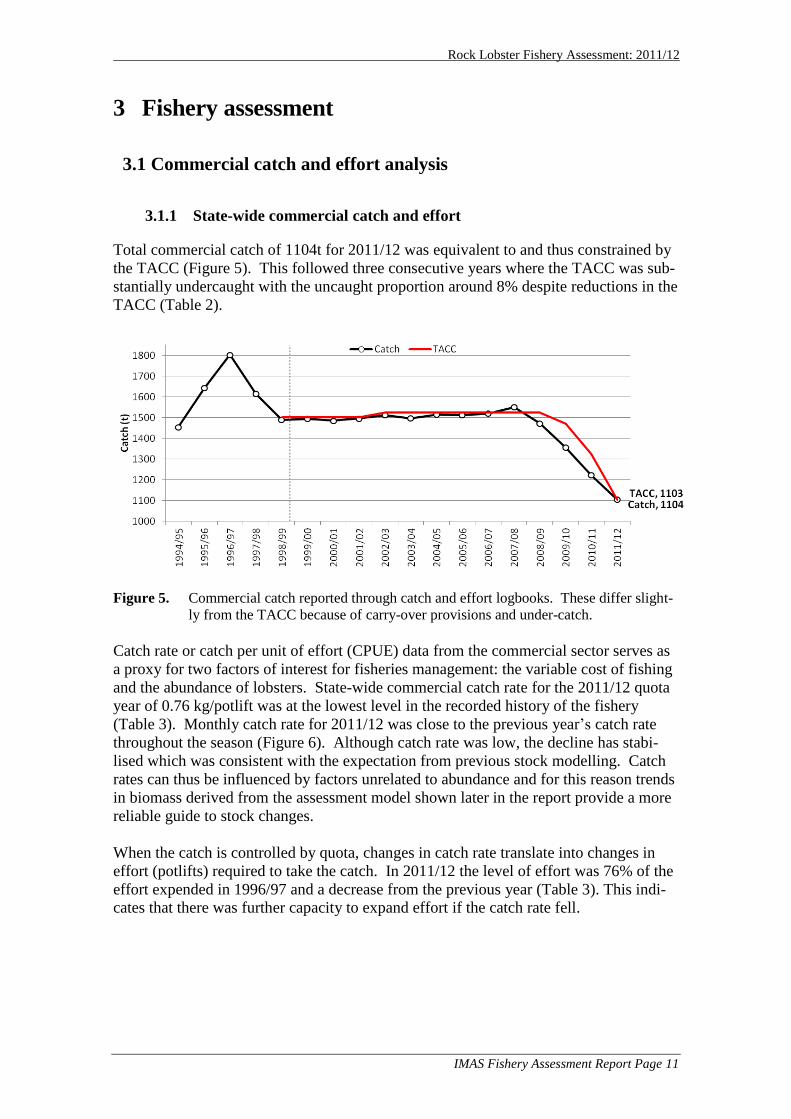
Total commercial catch of 1104t for 2011/12 was equivalent to and thus constrained by
the TACC (Figure 5). This followed three consecutive years where the TACC was sub-
stantially undercaught with the uncaught proportion around 8% despite reductions in the
TACC (Table 2).
Figure 5. Commercial catch reported through catch and effort logbooks. These differ slight-
ly from the TACC because of carry-over provisions and under-catch.
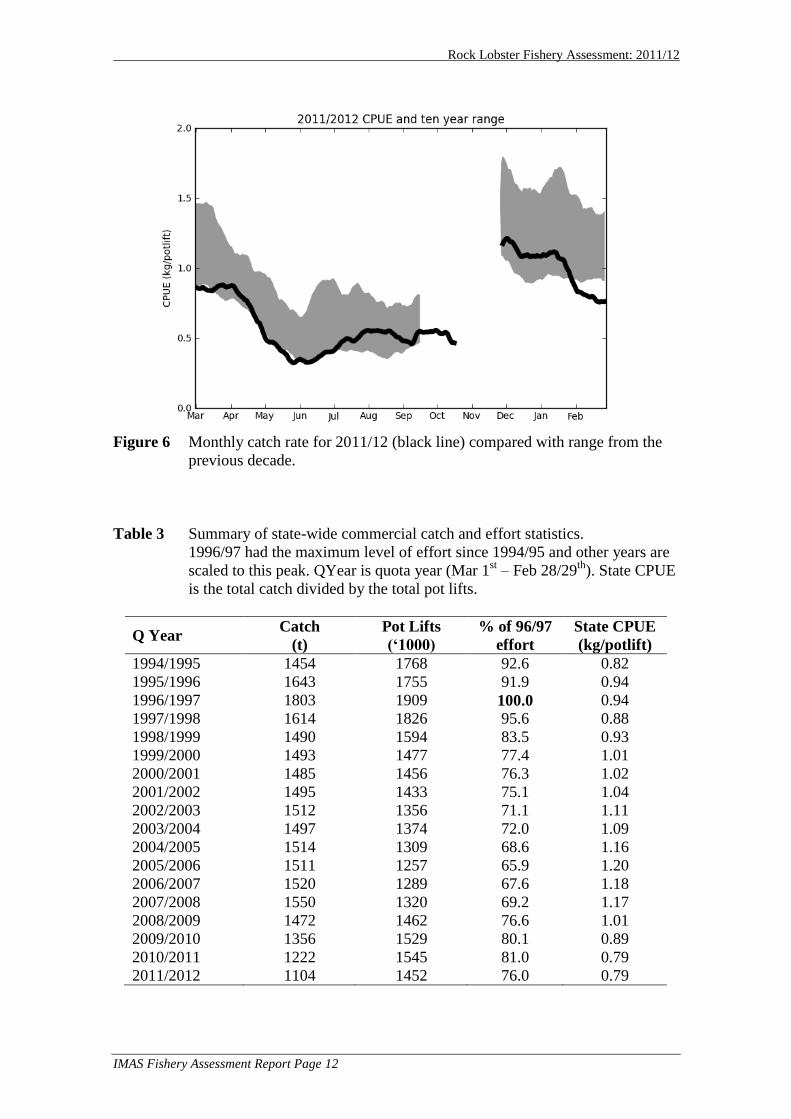
Catch rate or catch per unit of effort (CPUE) data from the commercial sector serves as
a proxy for two factors of interest for fisheries management: the variable cost of fishing
and the abundance of lobsters. State-wide commercial catch rate for the 2011/12 quota
year of 0.76 kg/potlift was at the lowest level in the recorded history of the fishery
(Table 3). Monthly catch rate for 2011/12 was close to the previous year‟s catch rate
throughout the season (Figure 6). Although catch rate was low, the decline has stabi-
lised which was consistent with the expectation from previous stock modelling. Catch
rates can thus be influenced by factors unrelated to abundance and for this reason trends
in biomass derived from the assessment model shown later in the report provide a more
reliable guide to stock changes.
When the catch is controlled by quota, changes in catch rate translate into changes in
effort (potlifts) required to take the catch. In 2011/12 the level of effort was 76% of the
effort expended in 1996/97 and a decrease from the previous year (Table 3). This indi-
cates that there was further capacity to expand effort if the catch rate fell.
Rock Lobster Fishery Assessment: 2011/12
IMAS Fishery Assessment Report Page 12
Figure 6 Monthly catch rate for 2011/12 (black line) compared with range from the
previous decade.
Table 3 Summary of state-wide commercial catch and effort statistics.
1996/97 had the maximum level of effort since 1994/95 and other years are
scaled to this peak. QYear is quota year (Mar 1st – Feb 28/29
th). State CPUE
is the total catch divided by the total pot lifts.
Q Year Catch
(t)
Pot Lifts
(‘1000)
% of 96/97
effort
State CPUE
(kg/potlift)
1994/1995 1454 1768 92.6 0.82
1995/1996 1643 1755 91.9 0.94
1996/1997 1803 1909 100.0 0.94
1997/1998 1614 1826 95.6 0.88
1998/1999 1490 1594 83.5 0.93
1999/2000 1493 1477 77.4 1.01
2000/2001 1485 1456 76.3 1.02
2001/2002 1495 1433 75.1 1.04
2002/2003 1512 1356 71.1 1.11
2003/2004 1497 1374 72.0 1.09
2004/2005 1514 1309 68.6 1.16
2005/2006 1511 1257 65.9 1.20
2006/2007 1520 1289 67.6 1.18
2007/2008 1550 1320 69.2 1.17
2008/2009 1472 1462 76.6 1.01
2009/2010 1356 1529 80.1 0.89
2010/2011 1222 1545 81.0 0.79
2011/2012 1104 1452 76.0 0.79
Rock Lobster Fishery Assessment: 2011/12
IMAS Fishery Assessment Report Page 13
3.1.2 Active vessels
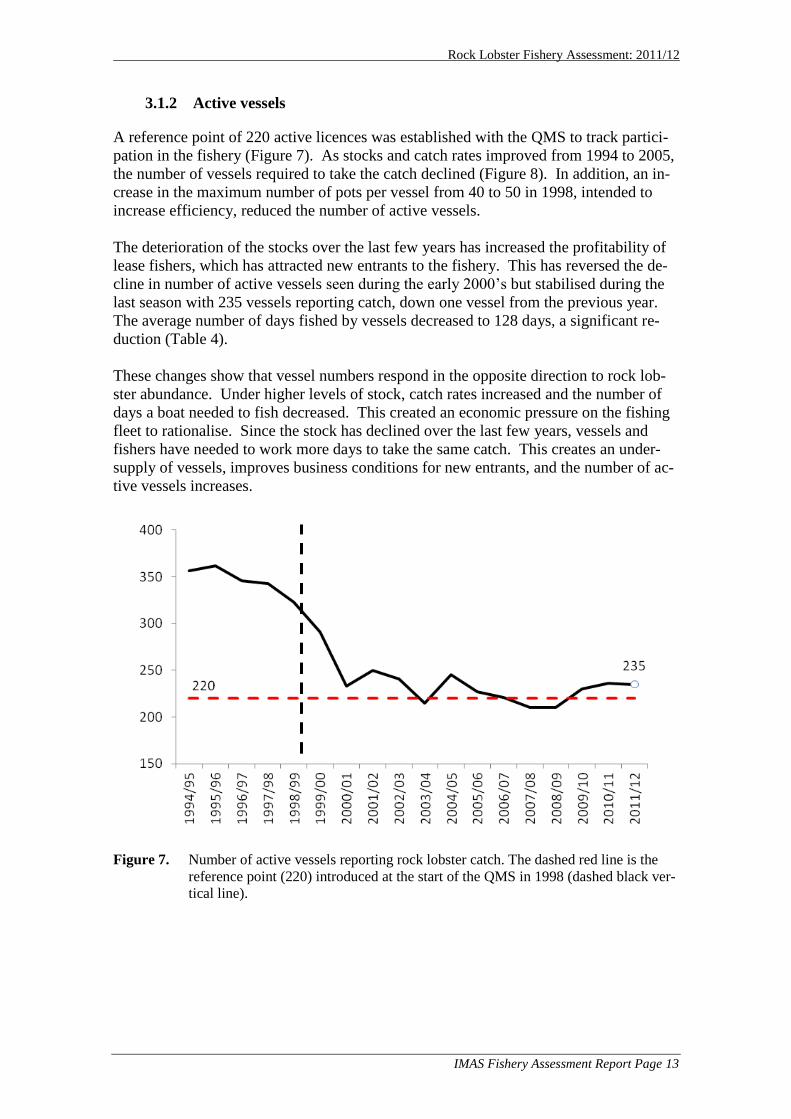
A reference point of 220 active licences was established with the QMS to track partici-
pation in the fishery (Figure 7). As stocks and catch rates improved from 1994 to 2005,
the number of vessels required to take the catch declined (Figure 8). In addition, an in-
crease in the maximum number of pots per vessel from 40 to 50 in 1998, intended to
increase efficiency, reduced the number of active vessels.
The deterioration of the stocks over the last few years has increased the profitability of
lease fishers, which has attracted new entrants to the fishery. This has reversed the de-
cline in number of active vessels seen during the early 2000‟s but stabilised during the
last season with 235 vessels reporting catch, down one vessel from the previous year.
The average number of days fished by vessels decreased to 128 days, a significant re-
duction (Table 4).
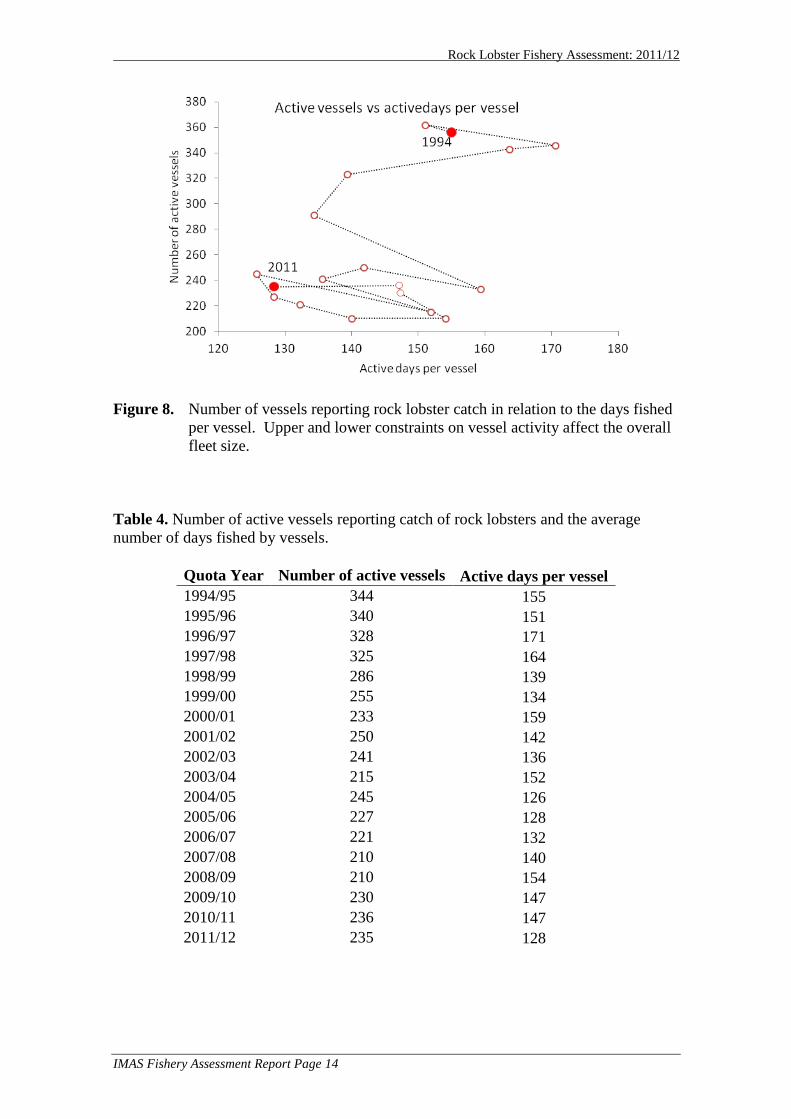
These changes show that vessel numbers respond in the opposite direction to rock lob-
ster abundance. Under higher levels of stock, catch rates increased and the number of
days a boat needed to fish decreased. This created an economic pressure on the fishing
fleet to rationalise. Since the stock has declined over the last few years, vessels and
fishers have needed to work more days to take the same catch. This creates an under-
supply of vessels, improves business conditions for new entrants, and the number of ac-
tive vessels increases.
Figure 7. Number of active vessels reporting rock lobster catch. The dashed red line is the
reference point (220) introduced at the start of the QMS in 1998 (dashed black ver-
tical line).
Rock Lobster Fishery Assessment: 2011/12
IMAS Fishery Assessment Report Page 14
Figure 8. Number of vessels reporting rock lobster catch in relation to the days fished
per vessel. Upper and lower constraints on vessel activity affect the overall
fleet size.
Table 4. Number of active vessels reporting catch of rock lobsters and the average
number of days fished by vessels.
Quota Year Number of active vessels Active days per vessel
1994/95 344 155
1995/96 340 151
1996/97 328 171
1997/98 325 164
1998/99 286 139
1999/00 255 134
2000/01 233 159
2001/02 250 142
2002/03 241 136
2003/04 215 152
2004/05 245 126
2005/06 227 128
2006/07 221 132
2007/08 210 140
2008/09 210 154
2009/10 230 147
2010/11 236 147
2011/12 235 128
Rock Lobster Fishery Assessment: 2011/12
IMAS Fishery Assessment Report Page 15
3.1.3 Regional commercial catch and effort
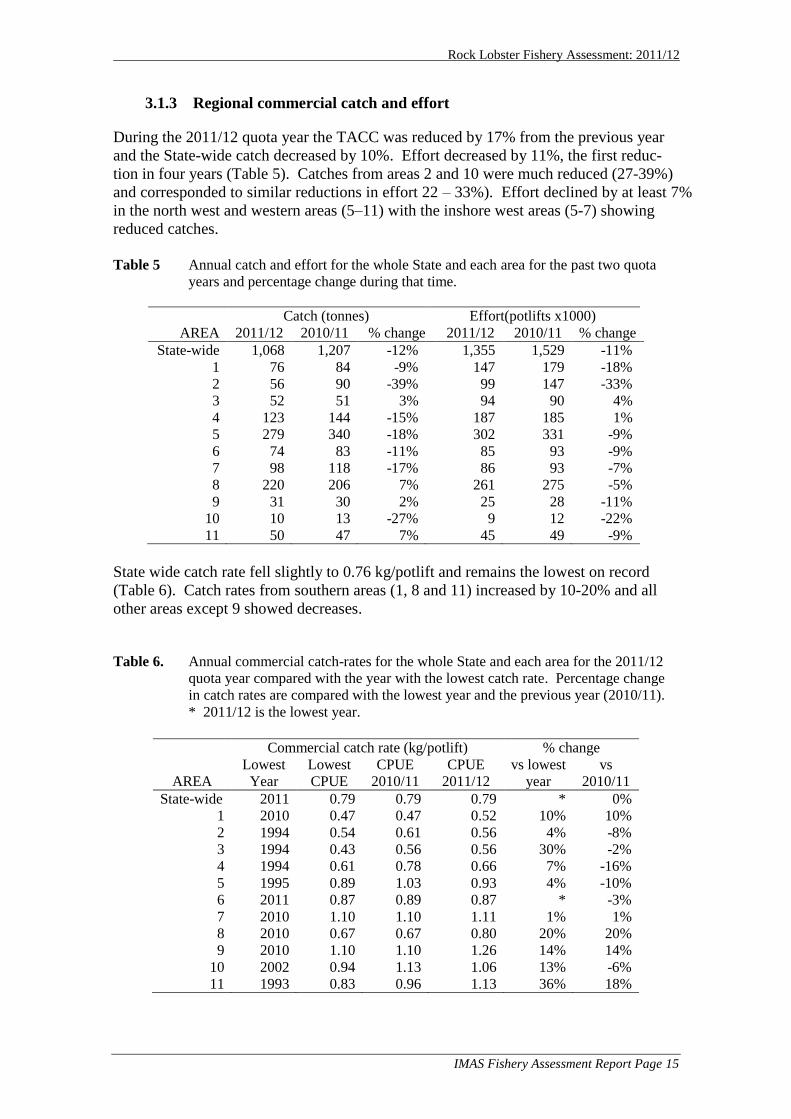
During the 2011/12 quota year the TACC was reduced by 17% from the previous year
and the State-wide catch decreased by 10%. Effort decreased by 11%, the first reduc-
tion in four years (Table 5). Catches from areas 2 and 10 were much reduced (27-39%)
and corresponded to similar reductions in effort 22 – 33%). Effort declined by at least 7%
in the north west and western areas (5–11) with the inshore west areas (5-7) showing
reduced catches.
Table 5 Annual catch and effort for the whole State and each area for the past two quota
years and percentage change during that time.
Catch (tonnes) Effort(potlifts x1000)
AREA 2011/12 2010/11 % change 2011/12 2010/11 % change
State-wide 1,068 1,207 -12% 1,355 1,529 -11%
1 76 84 -9% 147 179 -18%
2 56 90 -39% 99 147 -33%
3 52 51 3% 94 90 4%
4 123 144 -15% 187 185 1%
5 279 340 -18% 302 331 -9%
6 74 83 -11% 85 93 -9%
7 98 118 -17% 86 93 -7%
8 220 206 7% 261 275 -5%
9 31 30 2% 25 28 -11%
10 10 13 -27% 9 12 -22%
11 50 47 7% 45 49 -9%
State wide catch rate fell slightly to 0.76 kg/potlift and remains the lowest on record
(Table 6). Catch rates from southern areas (1, 8 and 11) increased by 10-20% and all
other areas except 9 showed decreases.
Table 6. Annual commercial catch-rates for the whole State and each area for the 2011/12
quota year compared with the year with the lowest catch rate. Percentage change
in catch rates are compared with the lowest year and the previous year (2010/11).
* 2011/12 is the lowest year.
Commercial catch rate (kg/potlift) % change
AREA
Lowest
Year
Lowest
CPUE
CPUE
2010/11
CPUE
2011/12
vs lowest
year
vs
2010/11
State-wide 2011 0.79 0.79 0.79 * 0%
1 2010 0.47 0.47 0.52 10% 10%
2 1994 0.54 0.61 0.56 4% -8%
3 1994 0.43 0.56 0.56 30% -2%
4 1994 0.61 0.78 0.66 7% -16%
5 1995 0.89 1.03 0.93 4% -10%
6 2011 0.87 0.89 0.87 * -3%
7 2010 1.10 1.10 1.11 1% 1%
8 2010 0.67 0.67 0.80 20% 20%
9 2010 1.10 1.10 1.26 14% 14%
10 2002 0.94 1.13 1.06 13% -6%
11 1993 0.83 0.96 1.13 36% 18%
Rock Lobster Fishery Assessment: 2011/12
IMAS Fishery Assessment Report Page 16
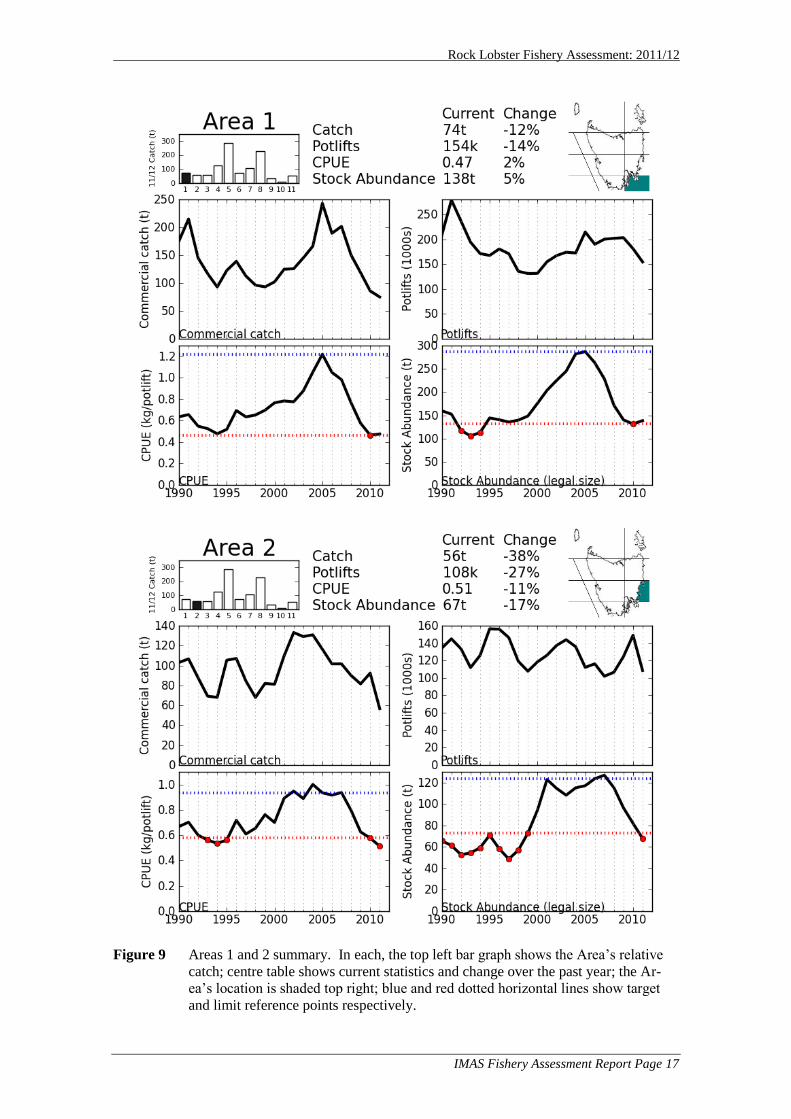
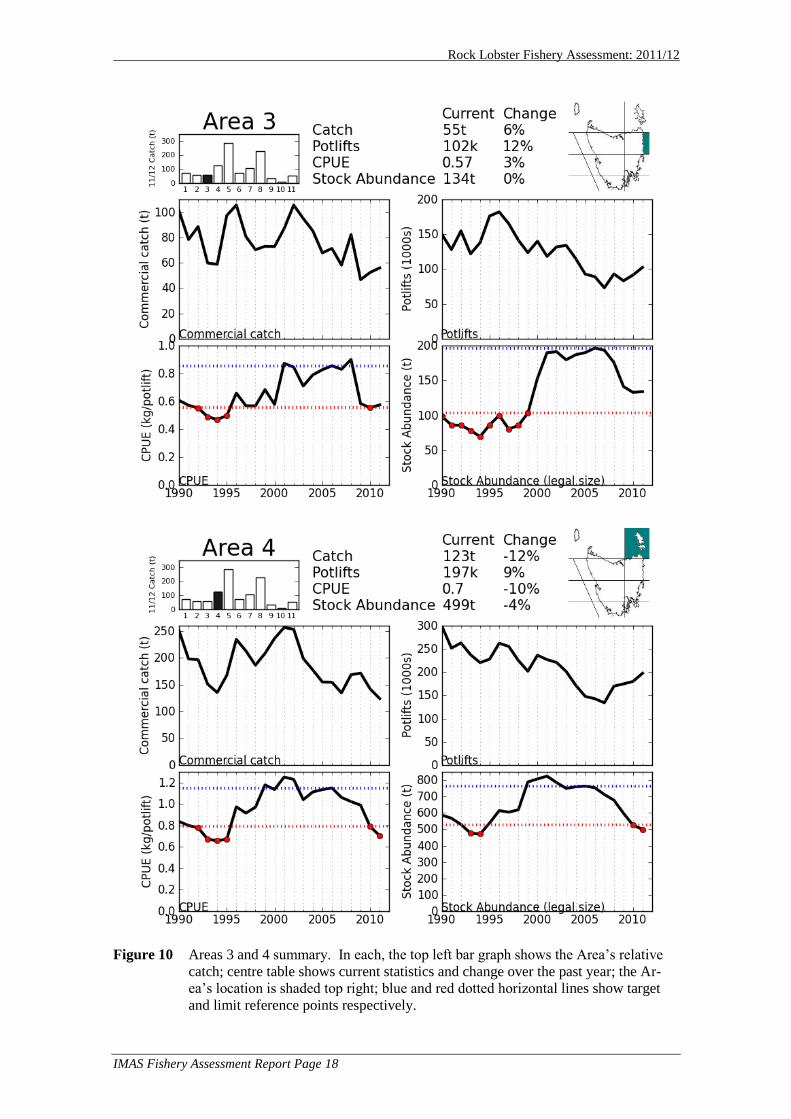
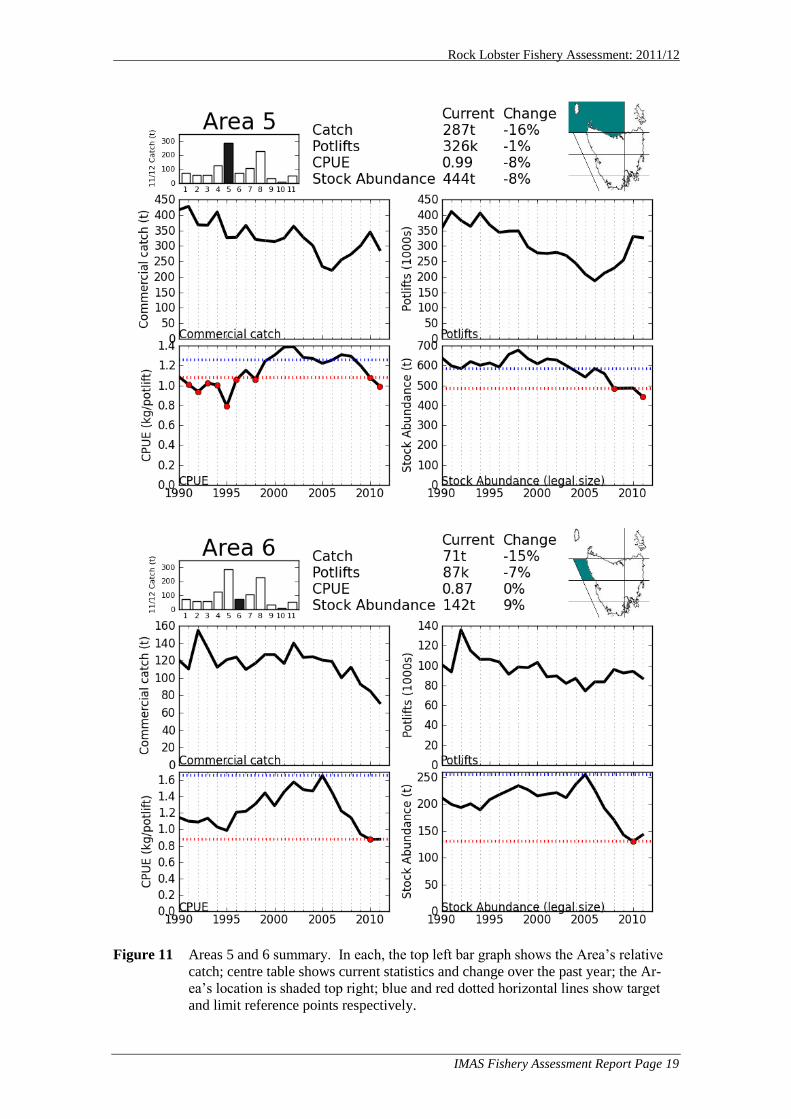
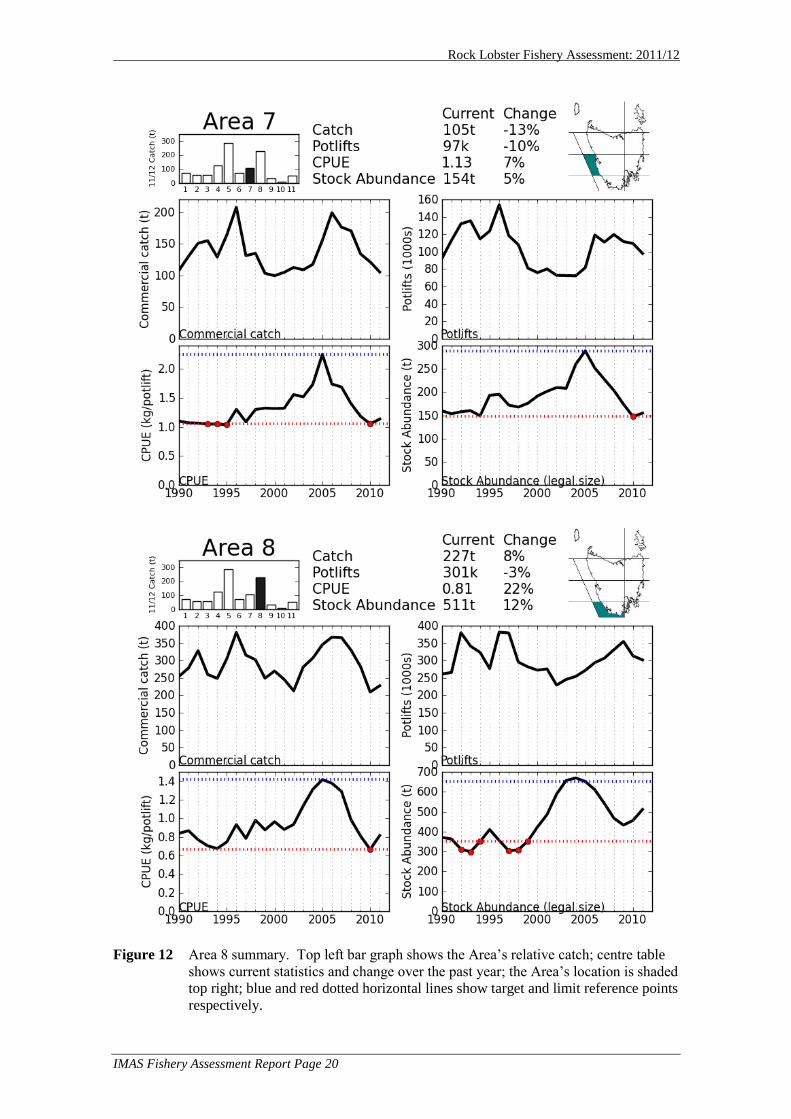
The following assessment overviews (Figure 9 - Figure 14) provide a snapshot of the key
performance indicators for the whole State and for each of the eleven assessment areas.
Graphs of commercial catch, potlifts, catch per unit effort (CPUE) and stock abundance
(legal size) are shown. The numbers at the top of each figure give the current value for
catch, potlifts, CPUE and legal size stock abundance, as well as the % change from the
previous year. The dotted lines on the CPUE and stock abundance graphs are the area
reference points. The lower red dotted line is the limit reference point and is the lowest
year since Quota (1998/99 – 2011/12). The upper dotted blue line is the target reference
point and is the most recent peak period of the fishery, for most areas this occurred
around 2005/6.
The most important observations were:
catch declined in seven of the eleven areas;
catch rate and abundance for the 2011/12 quota year were at or below the limit
reference in three of the areas (2, 4 and 5) and abundance was below the refer-
ence in area 10. This was an improvement from the previous year when six are-
as were below the limit reference for catch rate and abundance.
abundance decreased in areas 2, 4, 5, 10 and 11 by 3-17% and increased in areas
1, 6, 7 and 8 by 5-12%;
Areas 8, 9, 10 and 11 had large increases in catch rate (22-45%).
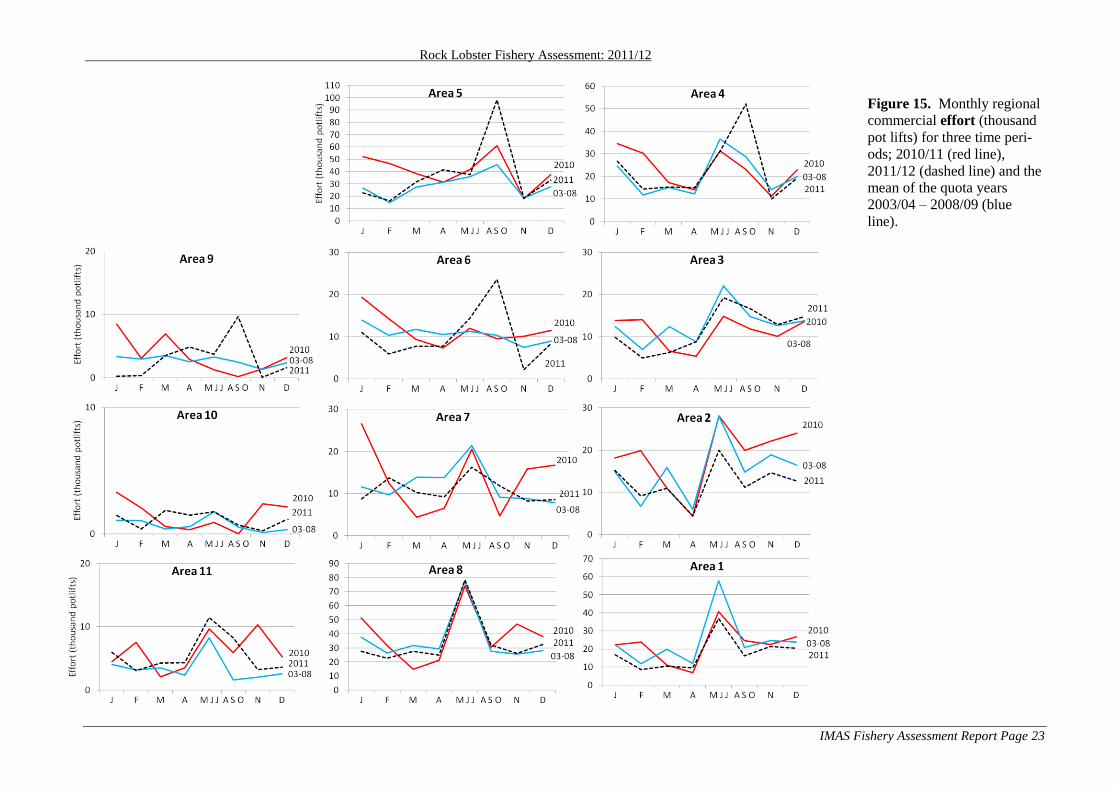
Large increases in monthly regional effort were seen in areas 4, 5, 6 and 9 between Au-
gust and October (Figure 15) while annual effort declined in the latter three. The de-
creases in effort from areas 1 and 2 occurred mainly between May and December. Sim-
ilar effort decreases in areas 7-11 were during November and December (Figure 15).
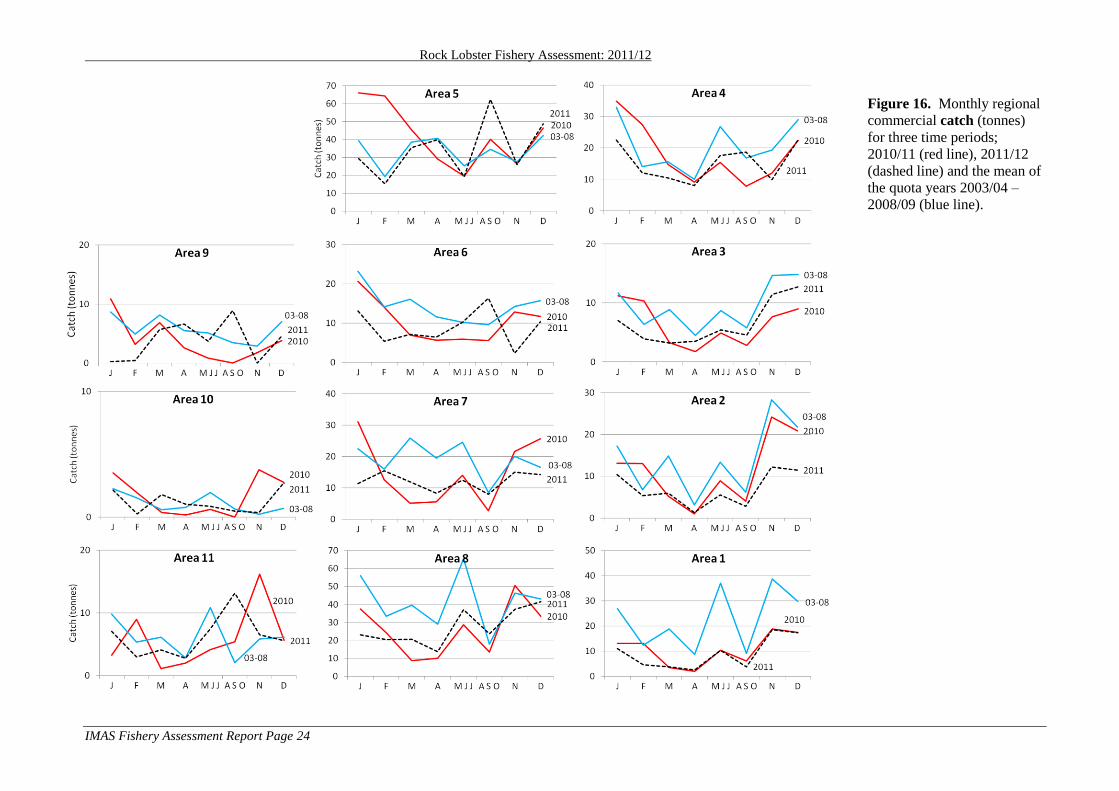
The August - October effort increases in areas 5, 6 and 9 resulted in higher catches
(Figure 16). East coast areas 1-3 catches were lower during January and February as
were all other inshore areas during January (Figure 16).
Rock Lobster Fishery Assessment: 2011/12
IMAS Fishery Assessment Report Page 17
Figure 9 Areas 1 and 2 summary. In each, the top left bar graph shows the Area‟s relative
catch; centre table shows current statistics and change over the past year; the Ar-
ea‟s location is shaded top right; blue and red dotted horizontal lines show target
and limit reference points respectively.
Rock Lobster Fishery Assessment: 2011/12
IMAS Fishery Assessment Report Page 18
Figure 10 Areas 3 and 4 summary. In each, the top left bar graph shows the Area‟s relative
catch; centre table shows current statistics and change over the past year; the Ar-
ea‟s location is shaded top right; blue and red dotted horizontal lines show target
and limit reference points respectively.
Rock Lobster Fishery Assessment: 2011/12
IMAS Fishery Assessment Report Page 19
Figure 11 Areas 5 and 6 summary. In each, the top left bar graph shows the Area‟s relative
catch; centre table shows current statistics and change over the past year; the Ar-
ea‟s location is shaded top right; blue and red dotted horizontal lines show target
and limit reference points respectively.
Rock Lobster Fishery Assessment: 2011/12
IMAS Fishery Assessment Report Page 20
Figure 12 Area 8 summary. Top left bar graph shows the Area‟s relative catch; centre table
shows current statistics and change over the past year; the Area‟s location is shaded
top right; blue and red dotted horizontal lines show target and limit reference points
respectively.

Rock Lobster Fishery Assessment: 2011/12
IMAS Fishery Assessment Report Page 21
Figure 13 Areas 9 and 10 summary. In each, the top left bar graph shows the Area‟s
relative catch; centre table shows current statistics and change over the past
year; the Area‟s location is shaded top right; blue and red dotted horizontal
lines show target and limit reference points respectively.
Rock Lobster Fishery Assessment: 2011/12
IMAS Fishery Assessment Report Page 22
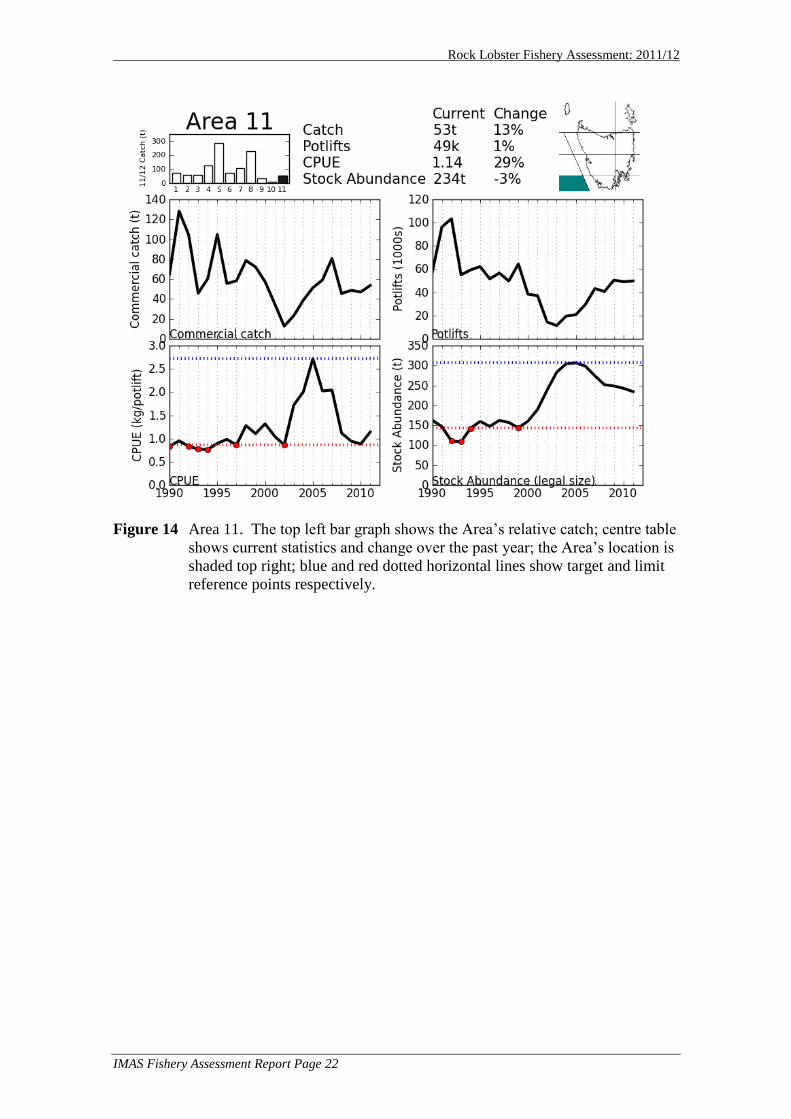
Figure 14 Area 11. The top left bar graph shows the Area‟s relative catch; centre table
shows current statistics and change over the past year; the Area‟s location is
shaded top right; blue and red dotted horizontal lines show target and limit
reference points respectively.
Rock Lobster Fishery Assessment: 2011/12
IMAS Fishery Assessment Report Page 23
Figure 15. Monthly regional
commercial effort (thousand
pot lifts) for three time peri-
ods; 2010/11 (red line),
2011/12 (dashed line) and the
mean of the quota years
2003/04 – 2008/09 (blue
line).
Rock Lobster Fishery Assessment: 2011/12
IMAS Fishery Assessment Report Page 24
Figure 16. Monthly regional
commercial catch (tonnes)
for three time periods;
2010/11 (red line), 2011/12
(dashed line) and the mean of
the quota years 2003/04 –
2008/09 (blue line).
Rock Lobster Fishery Assessment: 2011/12
IMAS Fishery Assessment Report Page 25
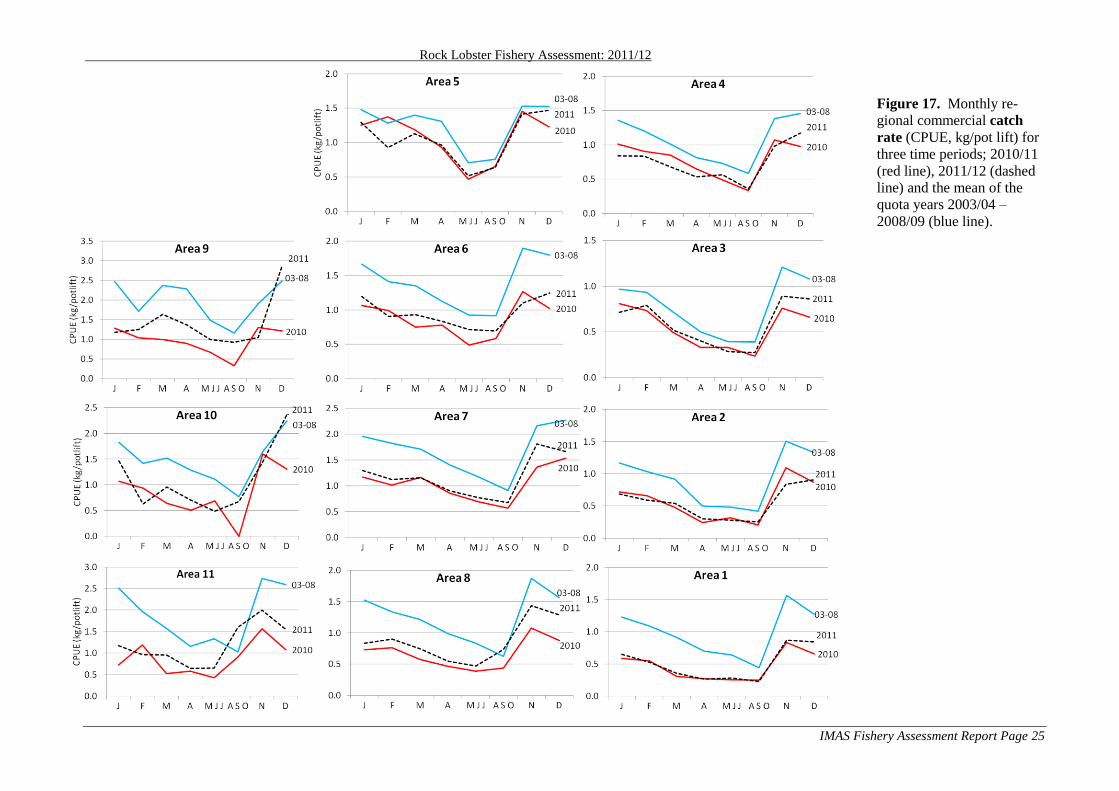
Figure 17. Monthly re-
gional commercial catch
rate (CPUE, kg/pot lift) for
three time periods; 2010/11
(red line), 2011/12 (dashed
line) and the mean of the
quota years 2003/04 –
2008/09 (blue line).
Rock Lobster Fishery Assessment: 2011/12
IMAS Fishery Assessment Report Page 26
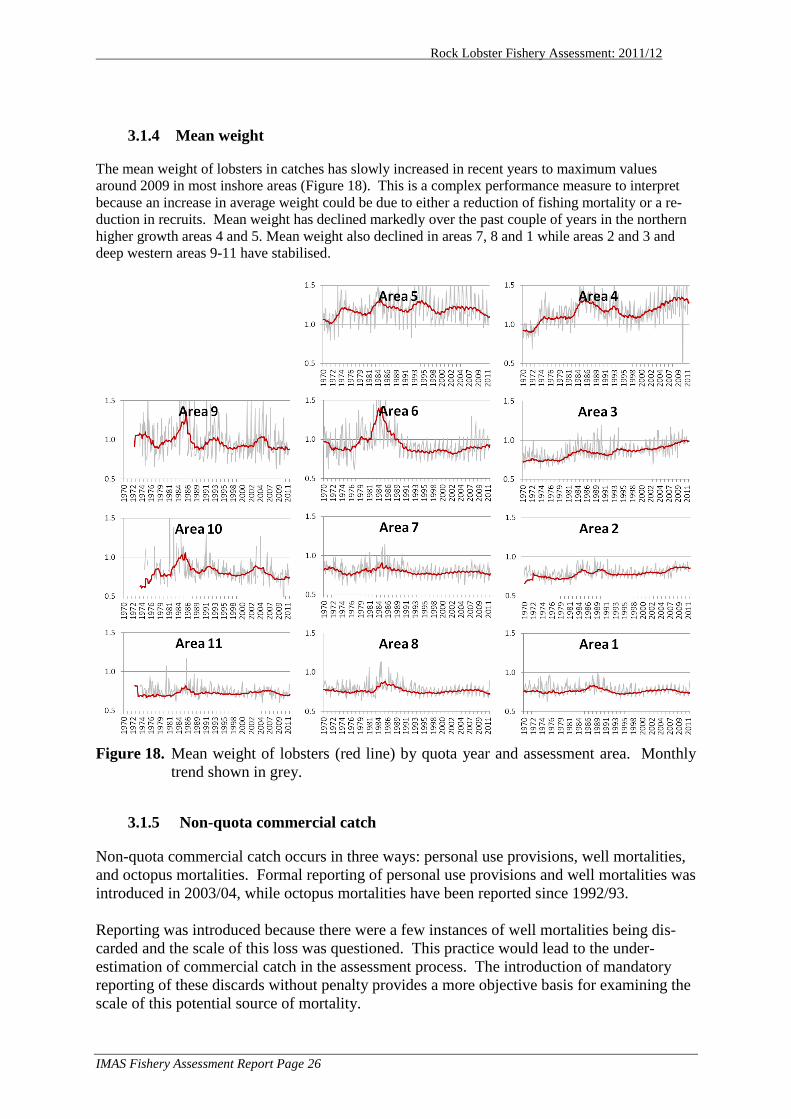
3.1.4 Mean weight
The mean weight of lobsters in catches has slowly increased in recent years to maximum values
around 2009 in most inshore areas (Figure 18). This is a complex performance measure to interpret
because an increase in average weight could be due to either a reduction of fishing mortality or a re-
duction in recruits. Mean weight has declined markedly over the past couple of years in the northern
higher growth areas 4 and 5. Mean weight also declined in areas 7, 8 and 1 while areas 2 and 3 and
deep western areas 9-11 have stabilised.
Figure 18. Mean weight of lobsters (red line) by quota year and assessment area. Monthly
trend shown in grey.
3.1.5 Non-quota commercial catch
Non-quota commercial catch occurs in three ways: personal use provisions, well mortalities,
and octopus mortalities. Formal reporting of personal use provisions and well mortalities was
introduced in 2003/04, while octopus mortalities have been reported since 1992/93.
Reporting was introduced because there were a few instances of well mortalities being dis-
carded and the scale of this loss was questioned. This practice would lead to the under-
estimation of commercial catch in the assessment process. The introduction of mandatory
reporting of these discards without penalty provides a more objective basis for examining the
scale of this potential source of mortality.
Rock Lobster Fishery Assessment: 2011/12
IMAS Fishery Assessment Report Page 27
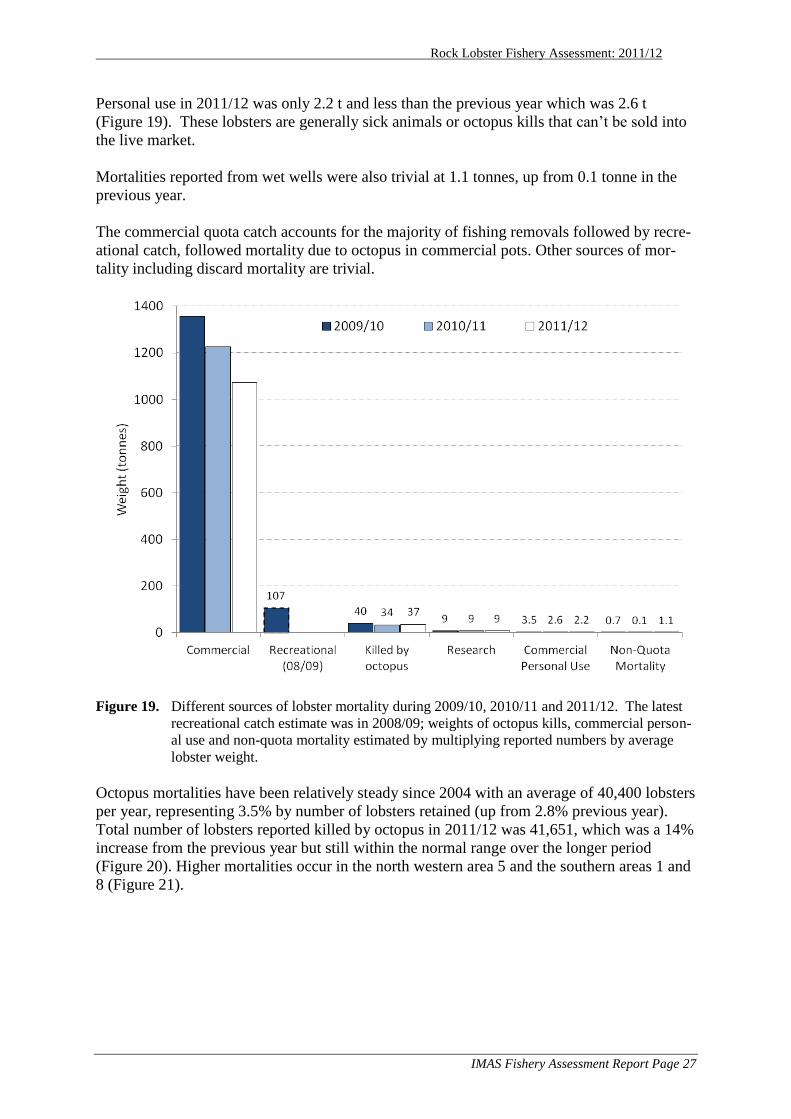
Personal use in 2011/12 was only 2.2 t and less than the previous year which was 2.6 t
(Figure 19). These lobsters are generally sick animals or octopus kills that can‟t be sold into
the live market.
Mortalities reported from wet wells were also trivial at 1.1 tonnes, up from 0.1 tonne in the
previous year.
The commercial quota catch accounts for the majority of fishing removals followed by recre-
ational catch, followed mortality due to octopus in commercial pots. Other sources of mor-
tality including discard mortality are trivial.
Figure 19. Different sources of lobster mortality during 2009/10, 2010/11 and 2011/12. The latest
recreational catch estimate was in 2008/09; weights of octopus kills, commercial person-
al use and non-quota mortality estimated by multiplying reported numbers by average
lobster weight.
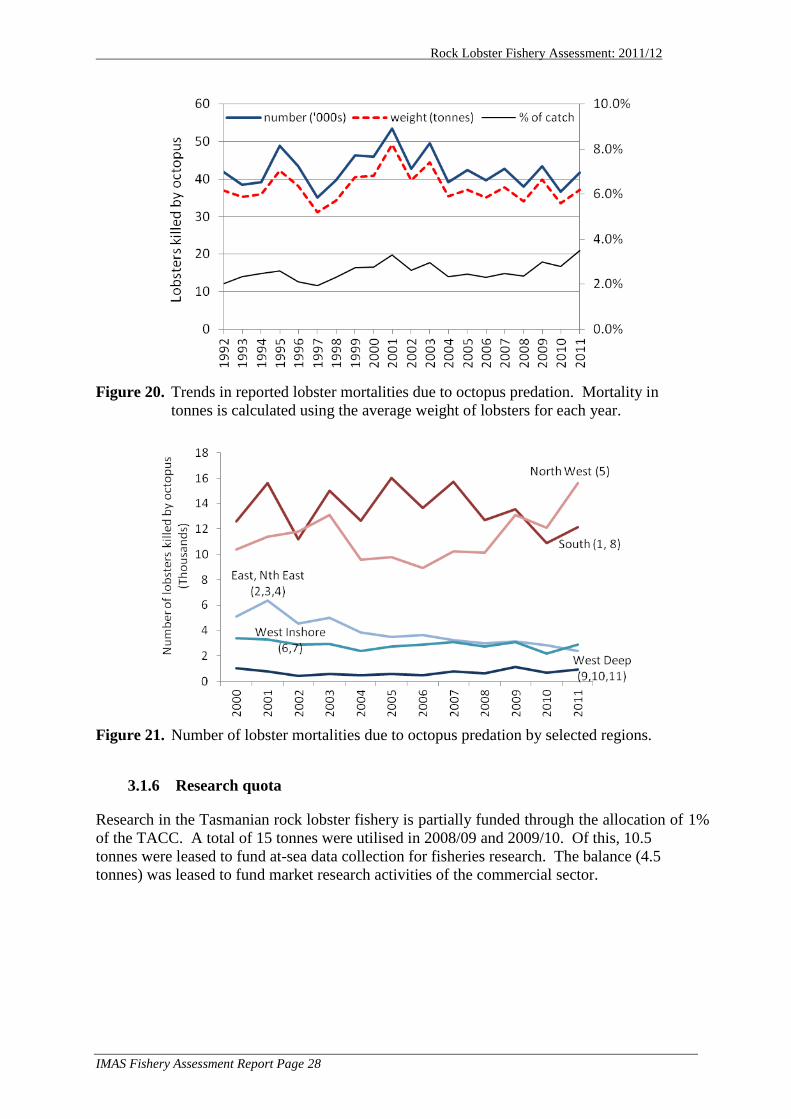
Octopus mortalities have been relatively steady since 2004 with an average of 40,400 lobsters
per year, representing 3.5% by number of lobsters retained (up from 2.8% previous year).
Total number of lobsters reported killed by octopus in 2011/12 was 41,651, which was a 14%
increase from the previous year but still within the normal range over the longer period
(Figure 20). Higher mortalities occur in the north western area 5 and the southern areas 1 and
8 (Figure 21).
Rock Lobster Fishery Assessment: 2011/12
IMAS Fishery Assessment Report Page 28
Figure 20. Trends in reported lobster mortalities due to octopus predation. Mortality in
tonnes is calculated using the average weight of lobsters for each year.
Figure 21. Number of lobster mortalities due to octopus predation by selected regions.
3.1.6 Research quota
Research in the Tasmanian rock lobster fishery is partially funded through the allocation of 1%
of the TACC. A total of 15 tonnes were utilised in 2008/09 and 2009/10. Of this, 10.5
tonnes were leased to fund at-sea data collection for fisheries research. The balance (4.5
tonnes) was leased to fund market research activities of the commercial sector.
Rock Lobster Fishery Assessment: 2011/12
IMAS Fishery Assessment Report Page 29
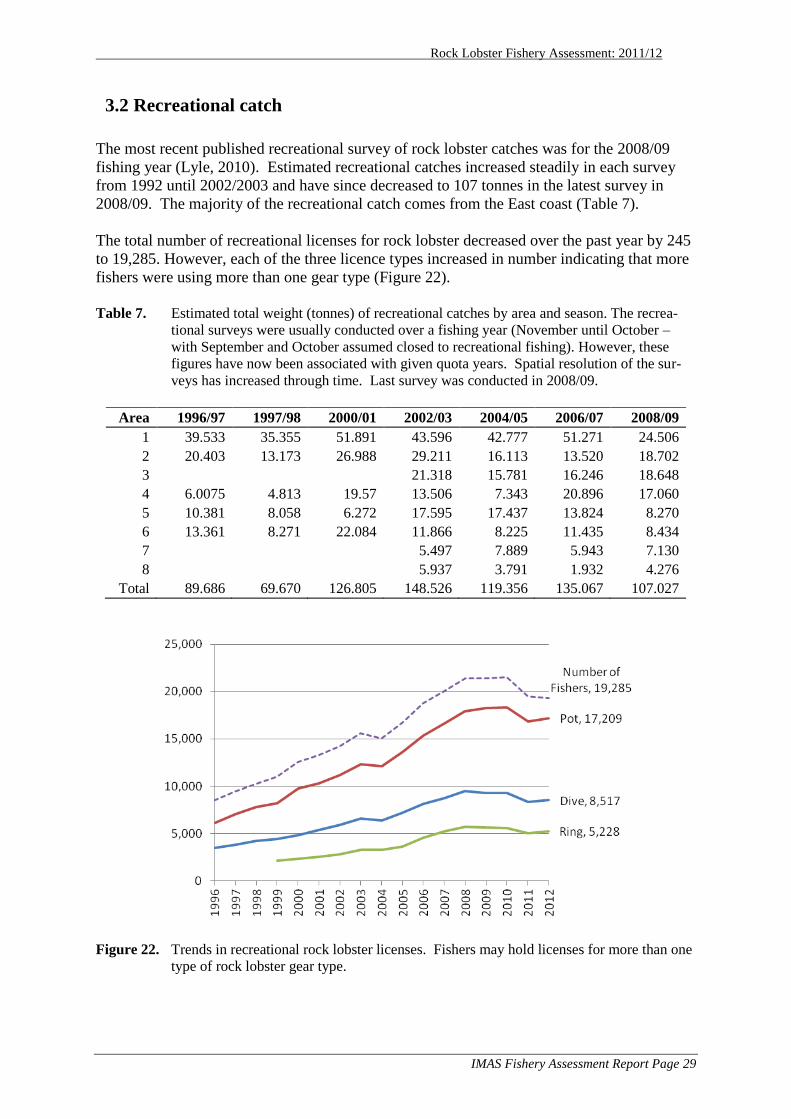
3.2 Recreational catch
The most recent published recreational survey of rock lobster catches was for the 2008/09
fishing year (Lyle, 2010). Estimated recreational catches increased steadily in each survey
from 1992 until 2002/2003 and have since decreased to 107 tonnes in the latest survey in
2008/09. The majority of the recreational catch comes from the East coast (Table 7).
The total number of recreational licenses for rock lobster decreased over the past year by 245
to 19,285. However, each of the three licence types increased in number indicating that more
fishers were using more than one gear type (Figure 22).
Table 7. Estimated total weight (tonnes) of recreational catches by area and season. The recrea-
tional surveys were usually conducted over a fishing year (November until October –
with September and October assumed closed to recreational fishing). However, these
figures have now been associated with given quota years. Spatial resolution of the sur-
veys has increased through time. Last survey was conducted in 2008/09.
Area 1996/97 1997/98 2000/01 2002/03 2004/05 2006/07 2008/09
1 39.533 35.355 51.891 43.596 42.777 51.271 24.506
2 20.403 13.173 26.988 29.211 16.113 13.520 18.702
3 21.318 15.781 16.246 18.648
4 6.0075 4.813 19.57 13.506 7.343 20.896 17.060
5 10.381 8.058 6.272 17.595 17.437 13.824 8.270
6 13.361 8.271 22.084 11.866 8.225 11.435 8.434
7 5.497 7.889 5.943 7.130
8 5.937 3.791 1.932 4.276
Total 89.686 69.670 126.805 148.526 119.356 135.067 107.027
Figure 22. Trends in recreational rock lobster licenses. Fishers may hold licenses for more than one
type of rock lobster gear type.
Rock Lobster Fishery Assessment: 2011/12
IMAS Fishery Assessment Report Page 30
3.3 Assessment model analysis
Risk assessments for the Tasmanian lobster fishery were conducted by projecting the dynam-
ics of the stock forward under various TACC scenarios and determining the possible conse-
quences. Economic information on cost and price data from 2011 is also included in these
projections including economic yield or the earnings from the fleet after costs have been paid.
This does not include lease payments in costs of fishing because these are a rent payment
which increase as the fishery becomes more profitable.
Detailed documentation on the modelling procedure and data inputs is available from IMAS.
Assumptions are listed in that documentation but critically include:
recreational and illegal catch do not increase as catch rates rise through stock rebuilding;
the commercial fleet continues to move between areas in response to catch rates in the
same manner as they have done since 1998;
the biology of lobsters (especially growth and mortality) is constant through time; and
critically, future recruitment will fall within the range of previous observed recruitment
levels for data fitted from 1984 to 2011, i.e. that the recent period of low recruitment was
a random event rather than a regime shift. Note that future recruitment is constrained to
some extent by the observed abundance of undersize lobsters recorded through observer
sampling and fisher research pot surveys.
Projections of the fishery are based upon a randomised recruitment series, taken from years
of average recruitment from 2000-2009 (see 3.3.2). If such projections are repeated many
times it becomes possible to address questions such as the proportion of legal biomass projec-
tions in five years that will be greater than the legal biomass in 2011/12, given a particular
TACC. If the result is 50% this suggests that the chance of the stock rebuilding is equal to the
chance of the stock declining.
The rock lobster stock assessment model used in previous years was updated with the new
catch and effort data from fishers‟ logbooks and the size/sex composition obtained from the
observer based sampling program. This produces the legal size stock abundance estimates.
Future TACC options from 100 kg to 110 kg were modelled for this assessment.
3.3.1 Reference Points
Reference points were chosen to enable a quantitative comparison between different TACC
options against limits and targets. They help to define stock outcomes under various harvest
strategies. Limit reference points are a defined point or „bottom line‟, which the stock should
be maintained above. Target reference points provide a goal to aim towards.
Stock levels were low in 1993/4 and it this year has been treated as an extreme low point,
which should be avoided in the future. The stock increased from this low point in response to
a combination of constraints in the catch and above average-recruitment of juveniles. The
stock decline since 2006 has been due to below average levels of recruitment and levels of
catch that have eroded the previous stock rebuilding gains. The Department considers it
would be a high risk management strategy not to set catch levels that have a very high proba-
bility (> 90%) of keeping State-wide stocks (and in most areas) above the 11 year low point
in 5 years (2016).
Rock Lobster Fishery Assessment: 2011/12
IMAS Fishery Assessment Report Page 31
The target chosen for this assessment is to build State-wide stocks back to the 2005/06 level
(the most recent peak stock abundance), in a reasonable time frame 8 – 10 years, with a >70%
probability. This target has been chosen on the basis that it is a point that most stakeholders
have in recent memory as being „good‟ in terms of the fishery. Modelling of the economic
yield of the fishery shows that this is a step towards maximising the economic yield of the
fishery although much higher levels of stock rebuilding should be targeted beyond that point.
Managing the stock to achieve more rapid stock rebuilding would require greater catch reduc-
tions for both sectors. Rapid change in catch leads to inefficient use of capital and adjustment
can lead to economic loss – for example, vessel capital becomes underutilised and resale val-
ue of vessels plummet if the change is rapid. Rebuilding over a longer timeframe comes at
the cost of lost years of profitability, greater risk of future exposure to periods of low re-
cruitment and reduced capacity for rock lobster stocks to help control the expansion of Cen-
trostephanus urchin barrens. In summary, the rate of stock rebuilding needs to be balanced to
produce best outcomes for the industry.
Escalating effort and lower catches have lead to significant declines in State-wide and re-
gional catch rates. The resulting increase in costs of fishing impacts on the overall profitabil-
ity of the catching sector as a whole and, therefore, the returns to the community associated
with having a profitable commercial sector.
Catch rate is used as a performance measure because it has both a close relationship with le-
gal size stock abundance and is a meaningful economic indicator for the commercial sector
because it is a direct factor in costs and thus profit. The catch rate limit reference point in the
assessment is defined as having a 90% probability of keeping the State-wide catch rate above
an 11 year low point within 5 years time (by 2016). The catch rate target is a 70% probability
of a State-wide catch rate of 1.2 kgs per potlift by 2019, and area catch rates equivalent to the
2005/6 period.
Tasmanian rock lobster egg production has no clear link to future recruitment but is an im-
portant management consideration because very low levels of egg production would be ex-
pected to affect recruitment at some point. For this reason only a limit reference point has
been chosen. That is, State-wide egg production limit is to have a 90% probability of being
above 25% of virgin egg production in 5 years. The limits for egg production in each Area
are the same except for the northern areas (4 and 5), which have an interim 20% limit. This
limit is seen as an interim target with intent of eventually moving towards a limit of 25% in
all areas.
3.3.2 Recruitment assumption
The model projects forward in time to determine the effect of proposed management strate-
gies on the fishery, which requires inclusion of values of possible future recruitment. The re-
lationship between egg production and recruitment is highly dependent on environmental var-
iables and poorly understood. Hence, the best indication of future recruitment is given by
historic recruitment estimates. The model also uses information from undersize sampling,
which gives some guidance on probable future recruitment.
The model estimates historic recruitment data using commercial catch data and length-
frequency data collected by observers and scientific sampling. An important consideration
Rock Lobster Fishery Assessment: 2011/12
IMAS Fishery Assessment Report Page 32
when projecting forwards is the range of years selected to represent historic recruitment.
Characteristically, recruitment to this fishery occurs in infrequent large pulses with low levels
of recruitment between these pulses.
If the recruitment process is not undergoing a fundamental change, using all years for which
reliable recruitment data is available is the preferred option as this will provide the best esti-
mate. Alternatively, if the recruitment process has fundamentally changed (for example due
to changing oceanic currents) it will be preferable to estimate recruitment from more recent
data. The potential pitfall with selecting only a short period of recent years is that a series of
years with poor recruitment may be interpreted as a change in the recruitment process when it
may simply be a „run of bad luck‟. In this case using more recent low recruitment estimates
may result in inappropriate management changes.
The model uses undersize size structure data to provide information about future recruitment
but there remains uncertainty about levels of future recruitment. To consider the future of the
fishery with different management actions, an historic average level of recruitment is chosen,
which is the 10-year period 2000-2009. If actual recruitment in the future is less than the av-
erage chosen, future stocks and catch rates will be lower than projected by the model. Con-
versely if future recruitment is better than the average chosen, future stocks and catch rates
will be higher than projected.
3.4 Assessment model results
3.4.1 Biomass
State-wide exploitable biomass rapidly declined since the high level reached in 2004 and
2005 and is now only 5% greater than the lowest level in 1993. It is the lowest since the in-
troduction of QMS (Table 8).
During 2011/12, estimated legal sized biomass increased in areas 1, 3, 6, 7, 8 and 9 with areas
2, 4, 5 and 10 at the lowest levels since 2000 (Table 8).
Rock Lobster Fishery Assessment: 2011/12
IMAS Fishery Assessment Report Page 33
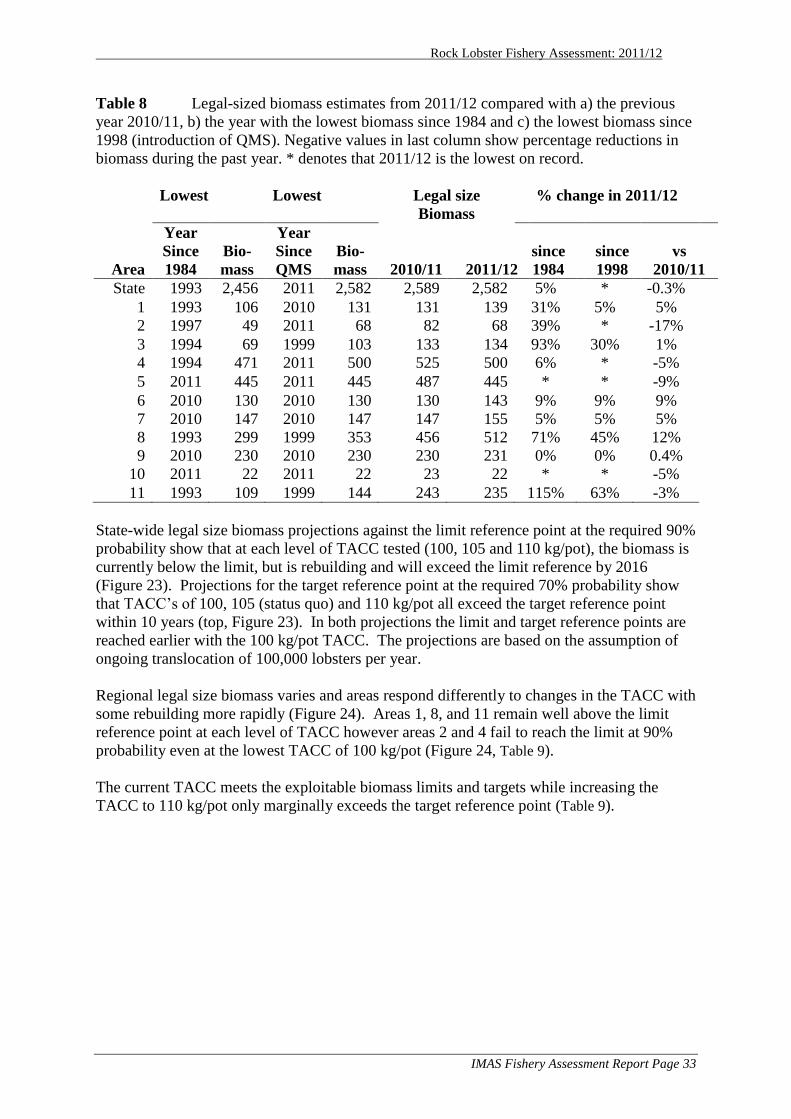
Table 8 Legal-sized biomass estimates from 2011/12 compared with a) the previous
year 2010/11, b) the year with the lowest biomass since 1984 and c) the lowest biomass since
1998 (introduction of QMS). Negative values in last column show percentage reductions in
biomass during the past year. * denotes that 2011/12 is the lowest on record.
Lowest Lowest Legal size
Biomass
% change in 2011/12
Area
Year
Since
1984
Bio-
mass
Year
Since
QMS
Bio-
mass 2010/11 2011/12
since
1984
since
1998
vs
2010/11
State 1993 2,456 2011 2,582 2,589 2,582 5% * -0.3%
1 1993 106 2010 131 131 139 31% 5% 5%
2 1997 49 2011 68 82 68 39% * -17%
3 1994 69 1999 103 133 134 93% 30% 1%
4 1994 471 2011 500 525 500 6% * -5%
5 2011 445 2011 445 487 445 * * -9%
6 2010 130 2010 130 130 143 9% 9% 9%
7 2010 147 2010 147 147 155 5% 5% 5%
8 1993 299 1999 353 456 512 71% 45% 12%
9 2010 230 2010 230 230 231 0% 0% 0.4%
10 2011 22 2011 22 23 22 * * -5%
11 1993 109 1999 144 243 235 115% 63% -3%
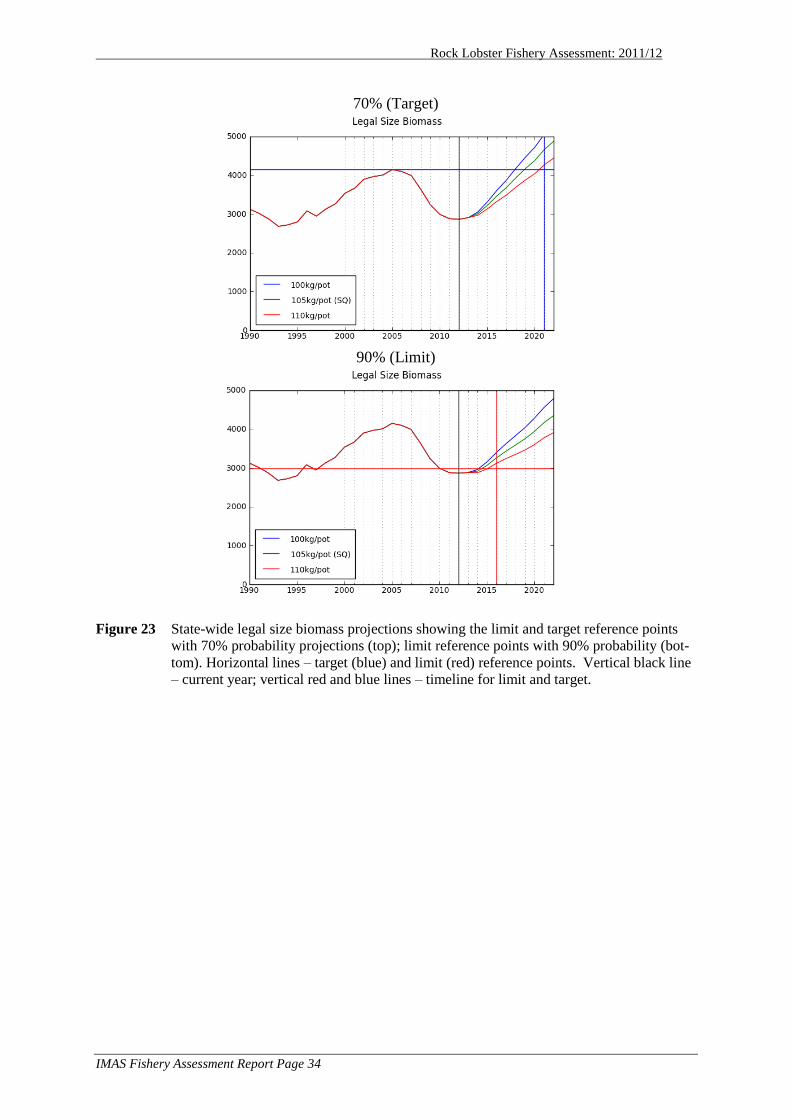
State-wide legal size biomass projections against the limit reference point at the required 90%
probability show that at each level of TACC tested (100, 105 and 110 kg/pot), the biomass is
currently below the limit, but is rebuilding and will exceed the limit reference by 2016
(Figure 23). Projections for the target reference point at the required 70% probability show
that TACC‟s of 100, 105 (status quo) and 110 kg/pot all exceed the target reference point
within 10 years (top, Figure 23). In both projections the limit and target reference points are
reached earlier with the 100 kg/pot TACC. The projections are based on the assumption of
ongoing translocation of 100,000 lobsters per year.
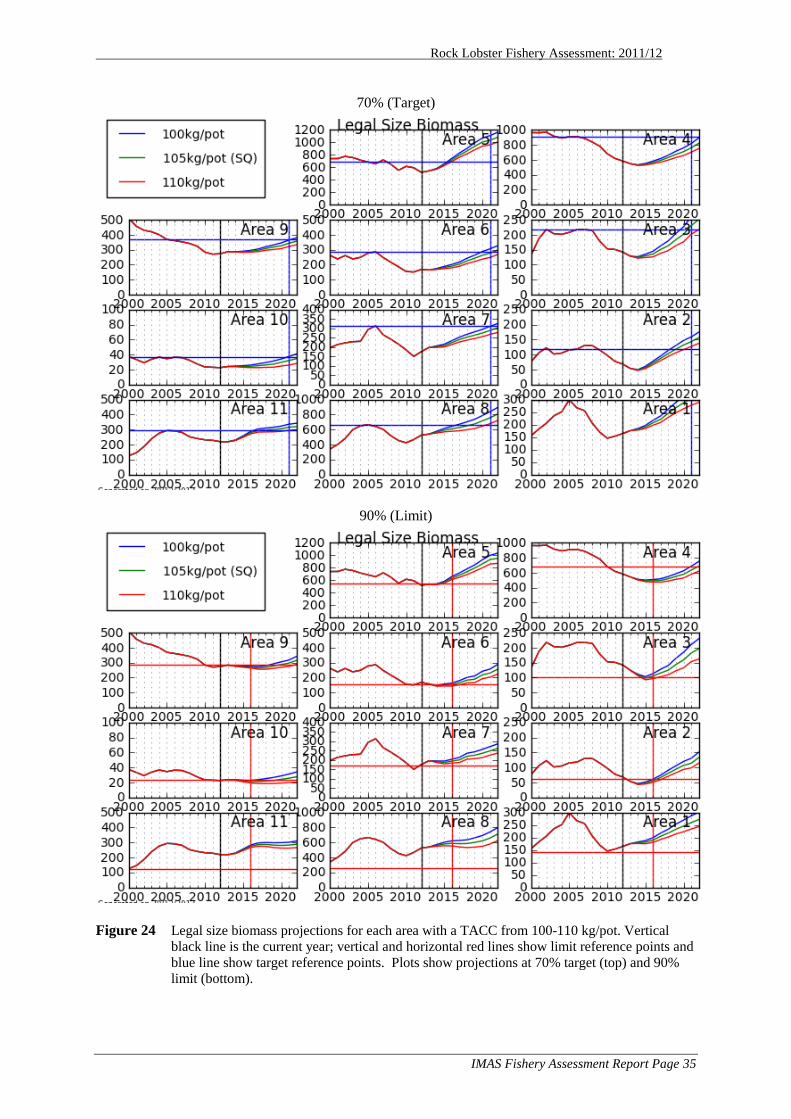
Regional legal size biomass varies and areas respond differently to changes in the TACC with
some rebuilding more rapidly (Figure 24). Areas 1, 8, and 11 remain well above the limit
reference point at each level of TACC however areas 2 and 4 fail to reach the limit at 90%
probability even at the lowest TACC of 100 kg/pot (Figure 24, Table 9).
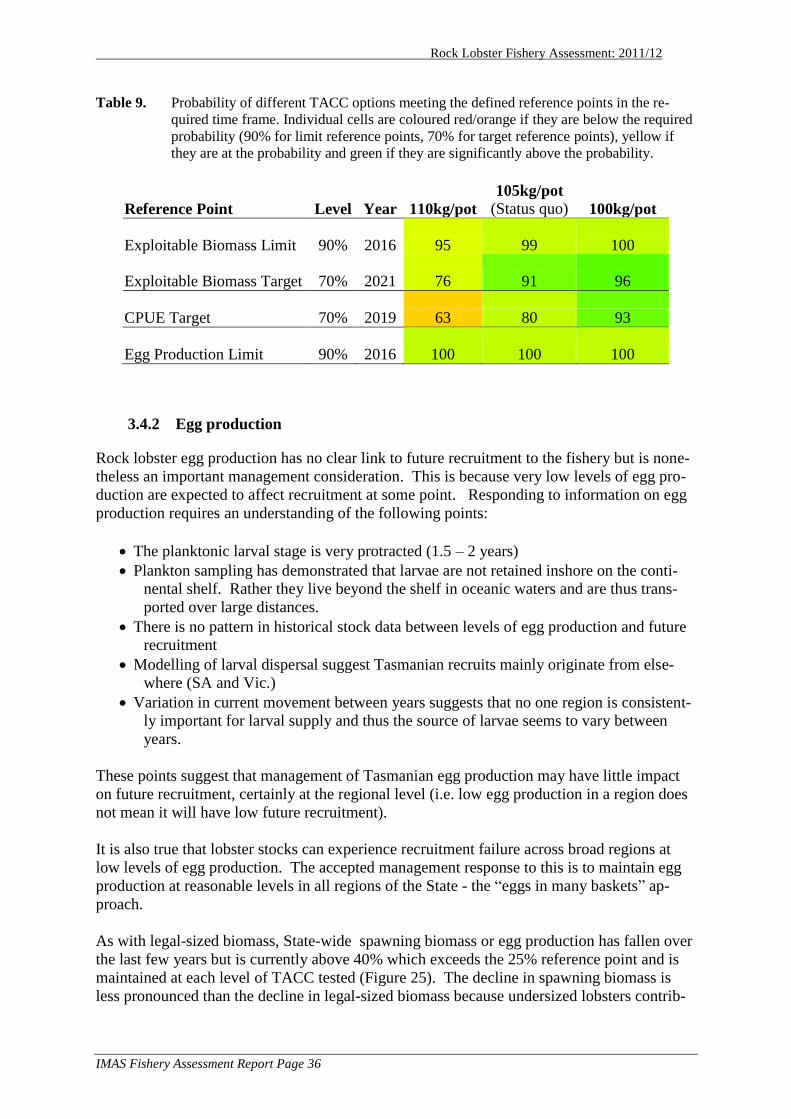
The current TACC meets the exploitable biomass limits and targets while increasing the
TACC to 110 kg/pot only marginally exceeds the target reference point (Table 9).
Rock Lobster Fishery Assessment: 2011/12
IMAS Fishery Assessment Report Page 34
70% (Target)
90% (Limit)
Figure 23 State-wide legal size biomass projections showing the limit and target reference points
with 70% probability projections (top); limit reference points with 90% probability (bot-
tom). Horizontal lines – target (blue) and limit (red) reference points. Vertical black line
– current year; vertical red and blue lines – timeline for limit and target.
Rock Lobster Fishery Assessment: 2011/12
IMAS Fishery Assessment Report Page 35
70% (Target)
90% (Limit)
Figure 24 Legal size biomass projections for each area with a TACC from 100-110 kg/pot. Vertical
black line is the current year; vertical and horizontal red lines show limit reference points and
blue line show target reference points. Plots show projections at 70% target (top) and 90%
limit (bottom).
Rock Lobster Fishery Assessment: 2011/12
IMAS Fishery Assessment Report Page 36
Table 9. Probability of different TACC options meeting the defined reference points in the re-
quired time frame. Individual cells are coloured red/orange if they are below the required
probability (90% for limit reference points, 70% for target reference points), yellow if
they are at the probability and green if they are significantly above the probability.
Reference Point Level Year 110kg/pot
105kg/pot
(Status quo) 100kg/pot
Exploitable Biomass Limit 90% 2016 95 99 100
Exploitable Biomass Target 70% 2021 76 91 96
CPUE Target 70% 2019 63 80 93
Egg Production Limit 90% 2016 100 100 100
3.4.2 Egg production
Rock lobster egg production has no clear link to future recruitment to the fishery but is none-
theless an important management consideration. This is because very low levels of egg pro-
duction are expected to affect recruitment at some point. Responding to information on egg
production requires an understanding of the following points:
The planktonic larval stage is very protracted (1.5 – 2 years)
Plankton sampling has demonstrated that larvae are not retained inshore on the conti-
nental shelf. Rather they live beyond the shelf in oceanic waters and are thus trans-
ported over large distances.
There is no pattern in historical stock data between levels of egg production and future
recruitment
Modelling of larval dispersal suggest Tasmanian recruits mainly originate from else-
where (SA and Vic.)
Variation in current movement between years suggests that no one region is consistent-
ly important for larval supply and thus the source of larvae seems to vary between
years.
These points suggest that management of Tasmanian egg production may have little impact
on future recruitment, certainly at the regional level (i.e. low egg production in a region does
not mean it will have low future recruitment).
It is also true that lobster stocks can experience recruitment failure across broad regions at
low levels of egg production. The accepted management response to this is to maintain egg
production at reasonable levels in all regions of the State - the “eggs in many baskets” ap-
proach.
As with legal-sized biomass, State-wide spawning biomass or egg production has fallen over
the last few years but is currently above 40% which exceeds the 25% reference point and is
maintained at each level of TACC tested (Figure 25). The decline in spawning biomass is
less pronounced than the decline in legal-sized biomass because undersized lobsters contrib-
Rock Lobster Fishery Assessment: 2011/12
IMAS Fishery Assessment Report Page 37
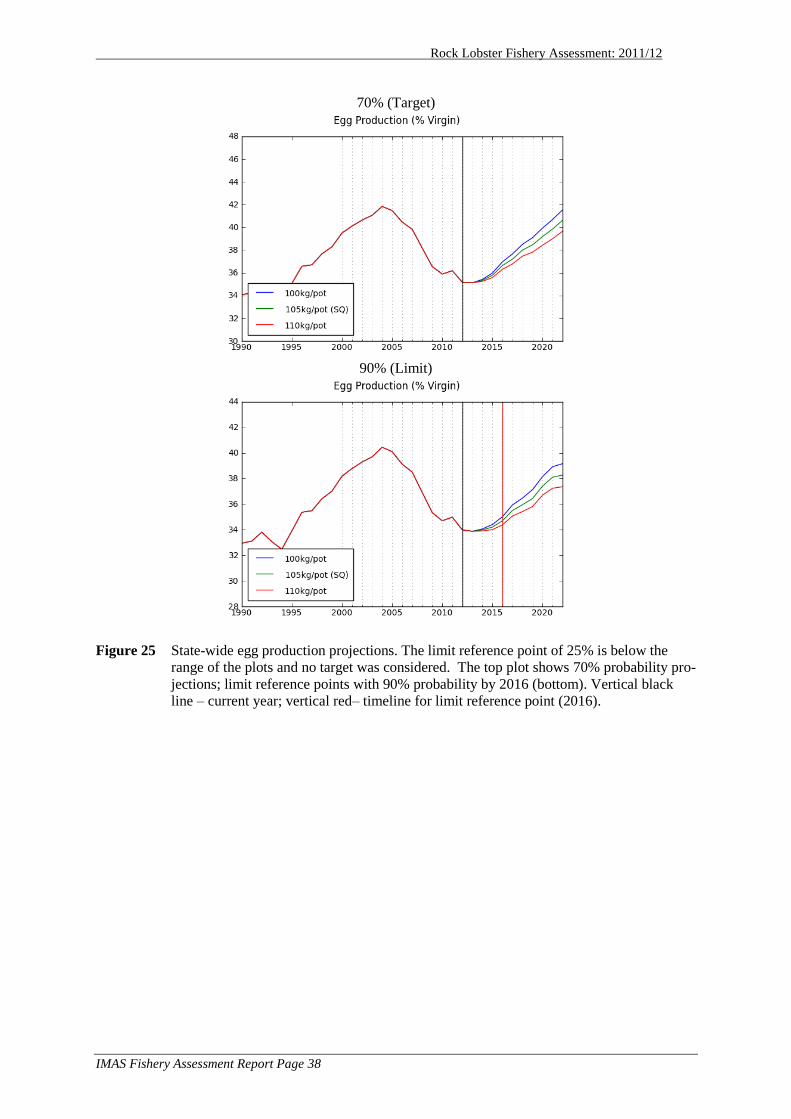
ute a considerable proportion of the total egg production. State-wide egg production is well
above the limit reference point projections at each of the TACCs (Figure 25). Each of the
TACC options met the State-wide egg production limit reference point (Table 9).
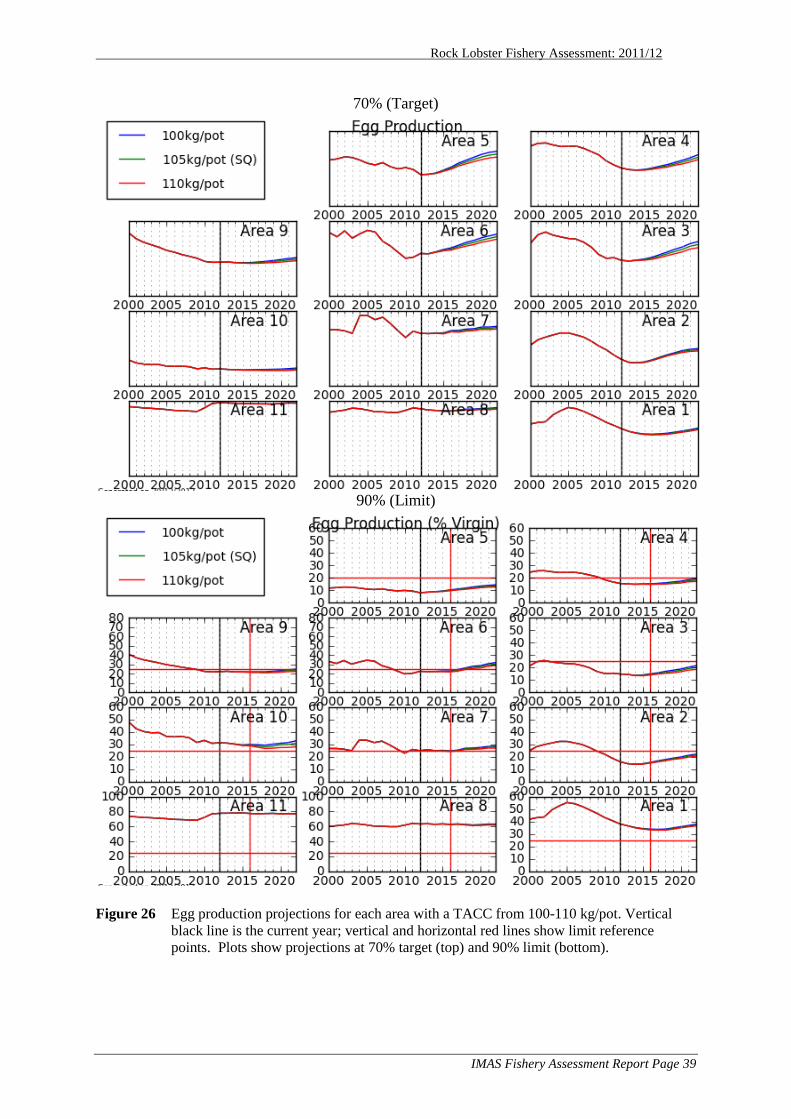
Spawning biomass in areas 2-5 is currently below the limit reference and does not reach the
limit by 2016; areas 6, 7, 9 and 10 are close to the reference and show small improvements
over time; areas 1, 8 and 11 well above the reference point (Figure 26). The south west areas
8 and 11 are near virgin spawning biomass due to the large number of mature females in that
area which are below the legal minimum length.
Note that targets for spawning stock biomass differ between northern areas. The ultimate
goal is for all areas to have production above 25% of the unfished state but this is unattaina-
ble with current size limits in areas 4, 5 and 6 so a target of 20% is used instead. Any target
is arbitrary as the level of spawning biomass required to maintain the fishery is unknown
without dropping to the level that crashes the fishery. The 25% target used in Tasmania is
different to that used in Victoria (20%) and South Australia (no formal limit).
Rock Lobster Fishery Assessment: 2011/12
IMAS Fishery Assessment Report Page 38
70% (Target)
90% (Limit)
Figure 25 State-wide egg production projections. The limit reference point of 25% is below the
range of the plots and no target was considered. The top plot shows 70% probability pro-
jections; limit reference points with 90% probability by 2016 (bottom). Vertical black
line – current year; vertical red– timeline for limit reference point (2016).
Rock Lobster Fishery Assessment: 2011/12
IMAS Fishery Assessment Report Page 39
70% (Target)
90% (Limit)
Figure 26 Egg production projections for each area with a TACC from 100-110 kg/pot. Vertical
black line is the current year; vertical and horizontal red lines show limit reference
points. Plots show projections at 70% target (top) and 90% limit (bottom).
Rock Lobster Fishery Assessment: 2011/12
IMAS Fishery Assessment Report Page 40
3.4.3 Catch rate trends (CPUE)
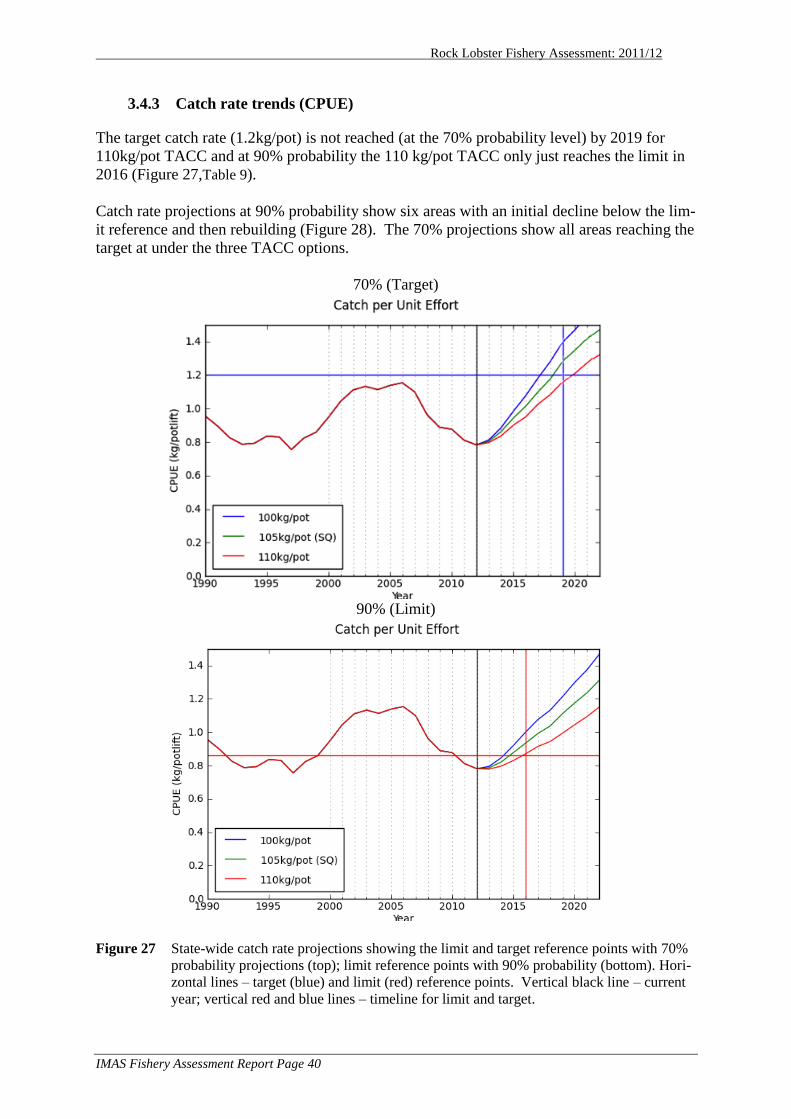
The target catch rate (1.2kg/pot) is not reached (at the 70% probability level) by 2019 for
110kg/pot TACC and at 90% probability the 110 kg/pot TACC only just reaches the limit in
2016 (Figure 27,Table 9).
Catch rate projections at 90% probability show six areas with an initial decline below the lim-
it reference and then rebuilding (Figure 28). The 70% projections show all areas reaching the
target at under the three TACC options.
70% (Target)
90% (Limit)
Figure 27 State-wide catch rate projections showing the limit and target reference points with 70%
probability projections (top); limit reference points with 90% probability (bottom). Hori-
zontal lines – target (blue) and limit (red) reference points. Vertical black line – current
year; vertical red and blue lines – timeline for limit and target.

Rock Lobster Fishery Assessment: 2011/12
IMAS Fishery Assessment Report Page 41
70% (Target)
90% (Limit)
Figure 28 State-wide catch rate projections for each area with a TACC from 100-110 kg/pot. Verti-
cal black line is the current year; vertical and horizontal red lines show limit reference
points and blue line show target reference points. Plots show projections at 70% target
(top) and 90% limit (bottom).
Rock Lobster Fishery Assessment: 2011/12
IMAS Fishery Assessment Report Page 42
3.5 Recruitment
Recruitment to the fishery is an important determinant of future production and is thus of
great interest to assessment and management of the fishery. Management regimes have
limited ability to influence recruitment but can control how the recruits are utilised. For
example, different choices in TAC and size limits can produce vastly different outcomes
with equivalent recruitment.
The increase in stock and improved catch rates which were seen from 1998 and lasting to
2006 has been attributed to the constraint of total catch under QMS management. It is
now apparent that extremely high levels of recruitment contributed to this growth, and that
the recent decline in the fishery was driven by a prolonged period of very low recruitment
from 2006. This low recruitment to the fishery was exceptional and had traits unlike any
downturn seen previously over the period of four decades from 1970 to 2010.
3.5.1 Model estimated recruitment
The stock assessment model estimates recruitment to its lowest size class (60 mm CL) us-
ing commercial catch and effort data plus onboard catch sampling of undersize lobsters.
This means that estimates of recruitment can only be determined once the animals affect
catch rates by growing into the minimum legal sizes (105 mm for females and 110 mm for
males) from the size of recruitment represented in the model (60 mm). For this reason the
recruitment levels in the most recent years appear to revert back to the average due to the
fact that it takes several years for new recruits to enter the legal sized fishery. Because
growth rates differ so much around the State each assessment area has a different time-lag
between recruits entering the modelled stock at 60 mm and the animals growing into legal
sizes. It takes the longest in Area 8 and the shortest time in areas 4 and 5. Note that the
model assumes that growth is constant through time – increases in growth would appear to
the model (and fishers) as a spike in recruitment.
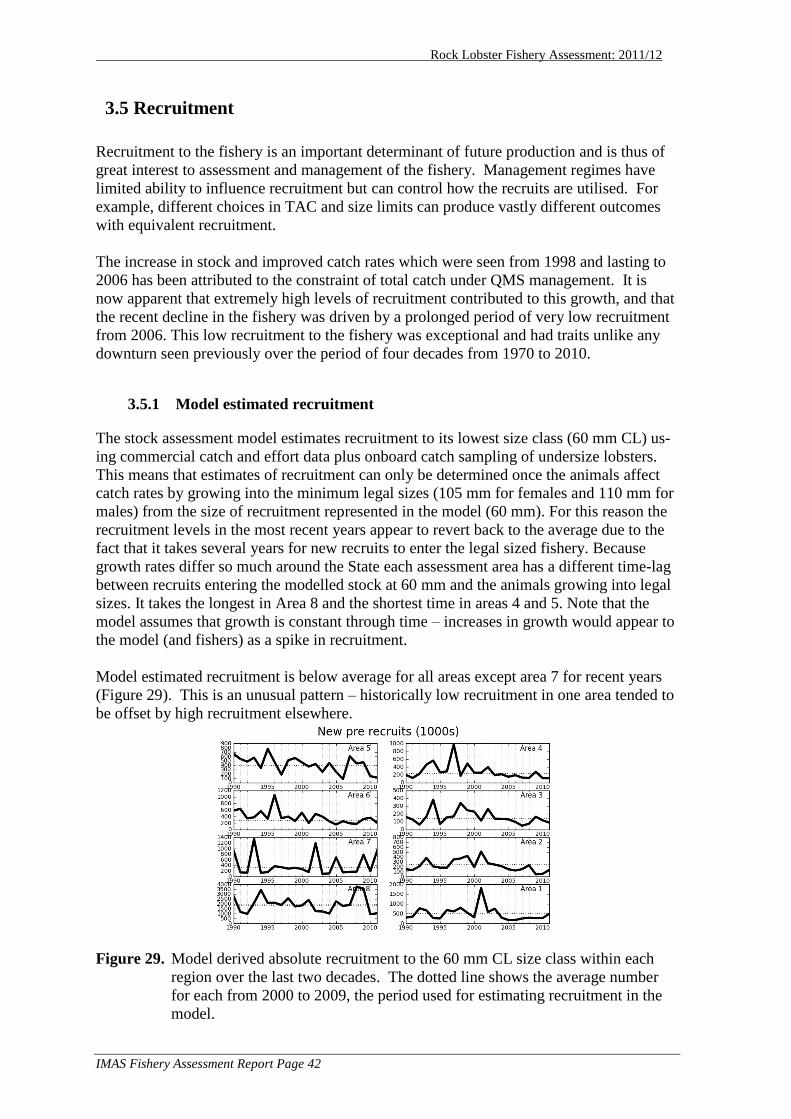
Model estimated recruitment is below average for all areas except area 7 for recent years
(Figure 29). This is an unusual pattern – historically low recruitment in one area tended to
be offset by high recruitment elsewhere.
Figure 29. Model derived absolute recruitment to the 60 mm CL size class within each
region over the last two decades. The dotted line shows the average number
for each from 2000 to 2009, the period used for estimating recruitment in the
model.
Rock Lobster Fishery Assessment: 2011/12
IMAS Fishery Assessment Report Page 43
3.5.2 Recruitment from puerulus settlement monitoring
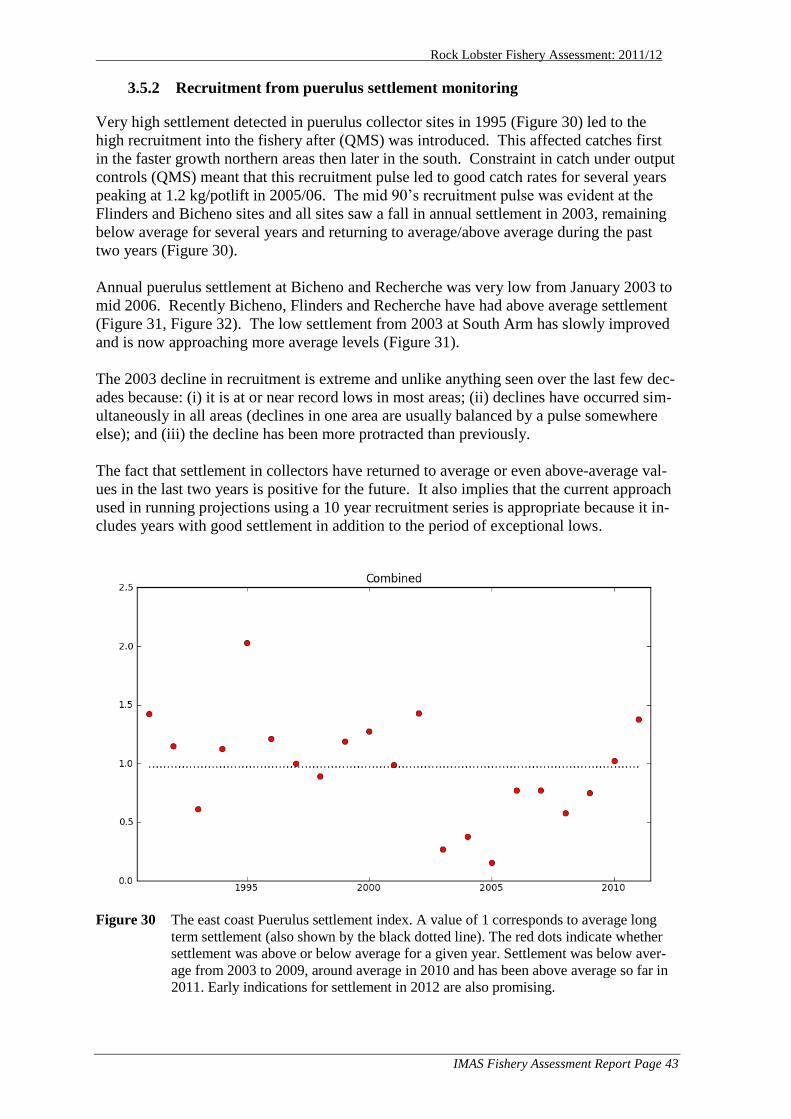
Very high settlement detected in puerulus collector sites in 1995 (Figure 30) led to the
high recruitment into the fishery after (QMS) was introduced. This affected catches first
in the faster growth northern areas then later in the south. Constraint in catch under output
controls (QMS) meant that this recruitment pulse led to good catch rates for several years
peaking at 1.2 kg/potlift in 2005/06. The mid 90‟s recruitment pulse was evident at the
Flinders and Bicheno sites and all sites saw a fall in annual settlement in 2003, remaining
below average for several years and returning to average/above average during the past
two years (Figure 30).
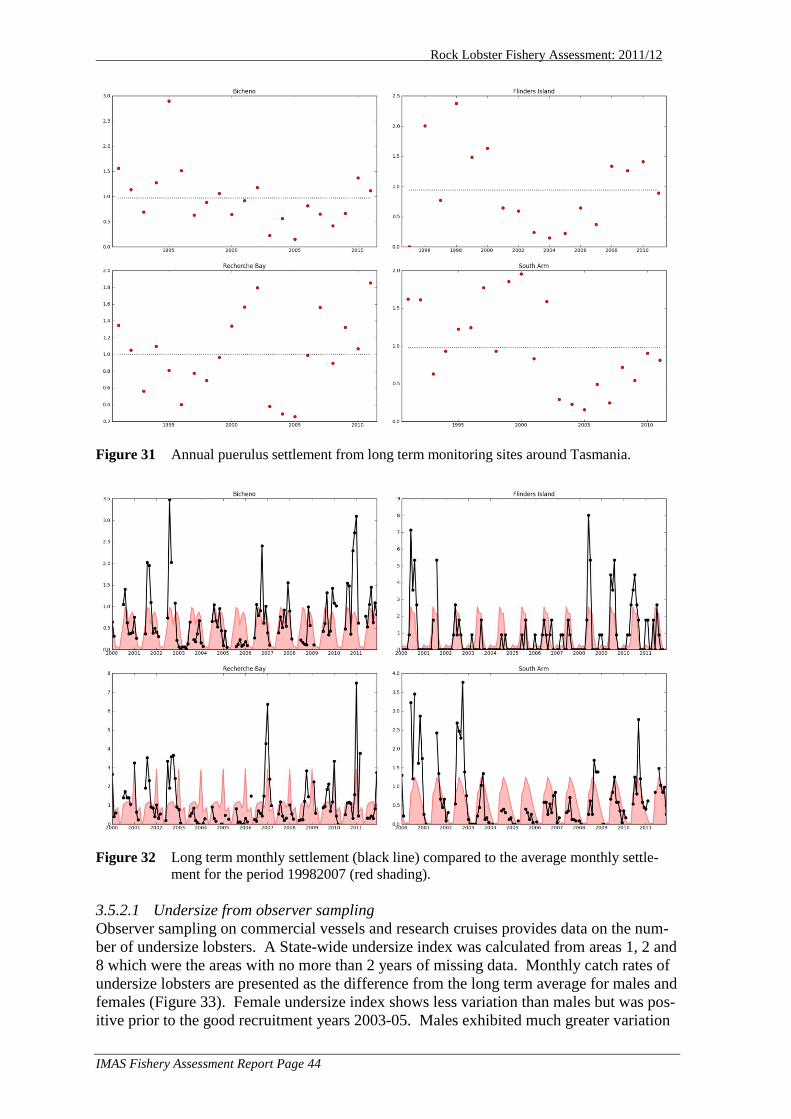
Annual puerulus settlement at Bicheno and Recherche was very low from January 2003 to
mid 2006. Recently Bicheno, Flinders and Recherche have had above average settlement
(Figure 31, Figure 32). The low settlement from 2003 at South Arm has slowly improved
and is now approaching more average levels (Figure 31).
The 2003 decline in recruitment is extreme and unlike anything seen over the last few dec-
ades because: (i) it is at or near record lows in most areas; (ii) declines have occurred sim-
ultaneously in all areas (declines in one area are usually balanced by a pulse somewhere
else); and (iii) the decline has been more protracted than previously.
The fact that settlement in collectors have returned to average or even above-average val-
ues in the last two years is positive for the future. It also implies that the current approach
used in running projections using a 10 year recruitment series is appropriate because it in-
cludes years with good settlement in addition to the period of exceptional lows.
Figure 30 The east coast Puerulus settlement index. A value of 1 corresponds to average long
term settlement (also shown by the black dotted line). The red dots indicate whether
settlement was above or below average for a given year. Settlement was below aver-
age from 2003 to 2009, around average in 2010 and has been above average so far in
2011. Early indications for settlement in 2012 are also promising.
Rock Lobster Fishery Assessment: 2011/12
IMAS Fishery Assessment Report Page 44
Figure 31 Annual puerulus settlement from long term monitoring sites around Tasmania.
Figure 32 Long term monthly settlement (black line) compared to the average monthly settle-
ment for the period 19982007 (red shading).
3.5.2.1 Undersize from observer sampling
Observer sampling on commercial vessels and research cruises provides data on the num-
ber of undersize lobsters. A State-wide undersize index was calculated from areas 1, 2 and
8 which were the areas with no more than 2 years of missing data. Monthly catch rates of
undersize lobsters are presented as the difference from the long term average for males and
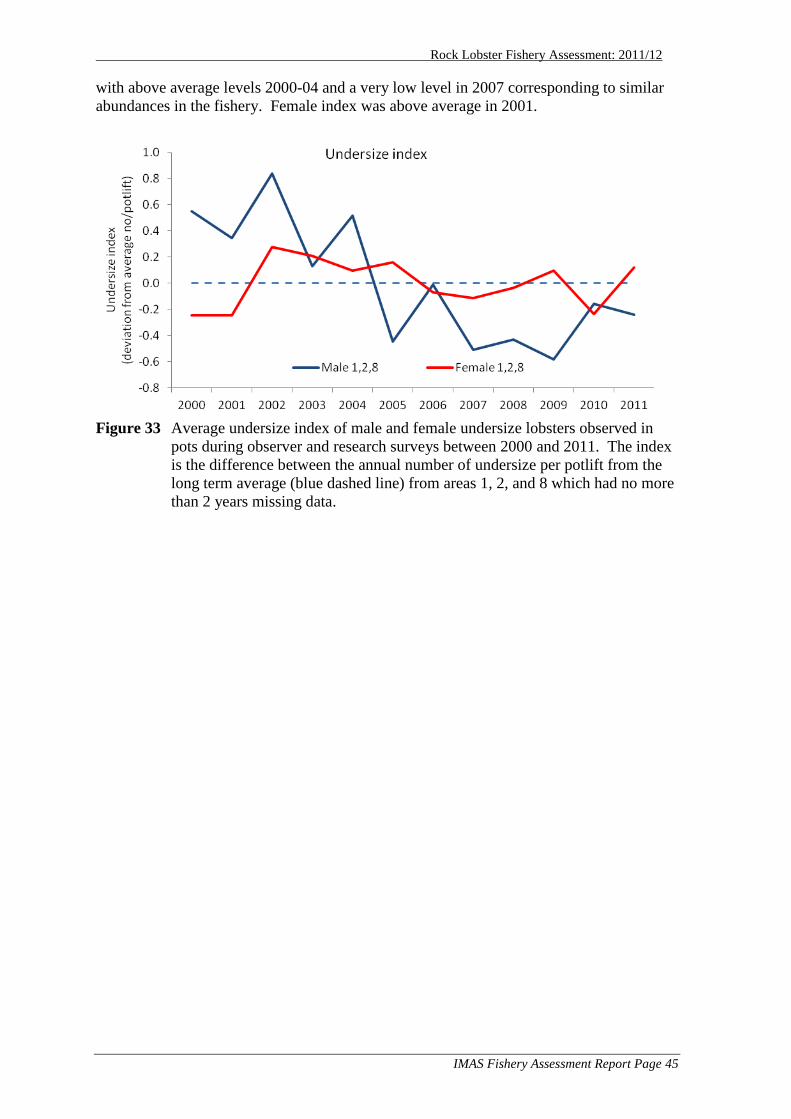
females (Figure 33). Female undersize index shows less variation than males but was pos-
itive prior to the good recruitment years 2003-05. Males exhibited much greater variation
Rock Lobster Fishery Assessment: 2011/12
IMAS Fishery Assessment Report Page 45
with above average levels 2000-04 and a very low level in 2007 corresponding to similar
abundances in the fishery. Female index was above average in 2001.
Figure 33 Average undersize index of male and female undersize lobsters observed in
pots during observer and research surveys between 2000 and 2011. The index
is the difference between the annual number of undersize per potlift from the
long term average (blue dashed line) from areas 1, 2, and 8 which had no more
than 2 years missing data.
Rock Lobster Fishery Assessment: 2011/12
IMAS Fishery Assessment Report Page 46
4 Outcomes of translocation of lobsters
Translocation involves catching lobsters in slow growth areas then shifting and releasing
them in high growth areas (these can vary by 20 fold). If catch is limited by quota, and the
stock of lobsters grows faster, then the total stock increases. The commercial industry vot-
ed to have their license fees increased in 2012 to fund translocation. This will create faster
and more substantial stock rebuilding than would have been achieved by the cut in quota
alone. The response to stock decline involves more than cutting commercial quota. The
translocation strategy will produce also substantial stock rebuilding, equivalent to a further
quota cut of between 5% and 10% depending on the measure of performance.
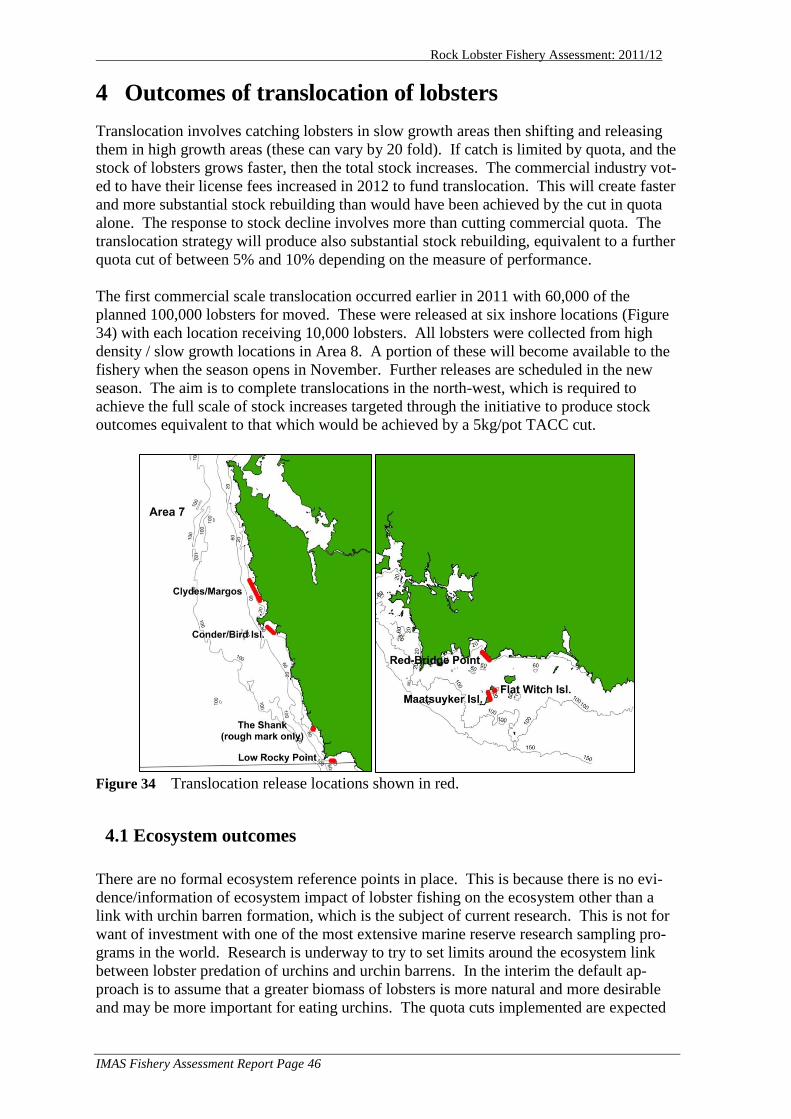
The first commercial scale translocation occurred earlier in 2011 with 60,000 of the
planned 100,000 lobsters for moved. These were released at six inshore locations (Figure
34) with each location receiving 10,000 lobsters. All lobsters were collected from high
density / slow growth locations in Area 8. A portion of these will become available to the
fishery when the season opens in November. Further releases are scheduled in the new
season. The aim is to complete translocations in the north-west, which is required to
achieve the full scale of stock increases targeted through the initiative to produce stock
outcomes equivalent to that which would be achieved by a 5kg/pot TACC cut.
Figure 34 Translocation release locations shown in red.
4.1 Ecosystem outcomes
There are no formal ecosystem reference points in place. This is because there is no evi-
dence/information of ecosystem impact of lobster fishing on the ecosystem other than a
link with urchin barren formation, which is the subject of current research. This is not for
want of investment with one of the most extensive marine reserve research sampling pro-
grams in the world. Research is underway to try to set limits around the ecosystem link
between lobster predation of urchins and urchin barrens. In the interim the default ap-
proach is to assume that a greater biomass of lobsters is more natural and more desirable
and may be more important for eating urchins. The quota cuts implemented are expected
Rock Lobster Fishery Assessment: 2011/12
IMAS Fishery Assessment Report Page 47
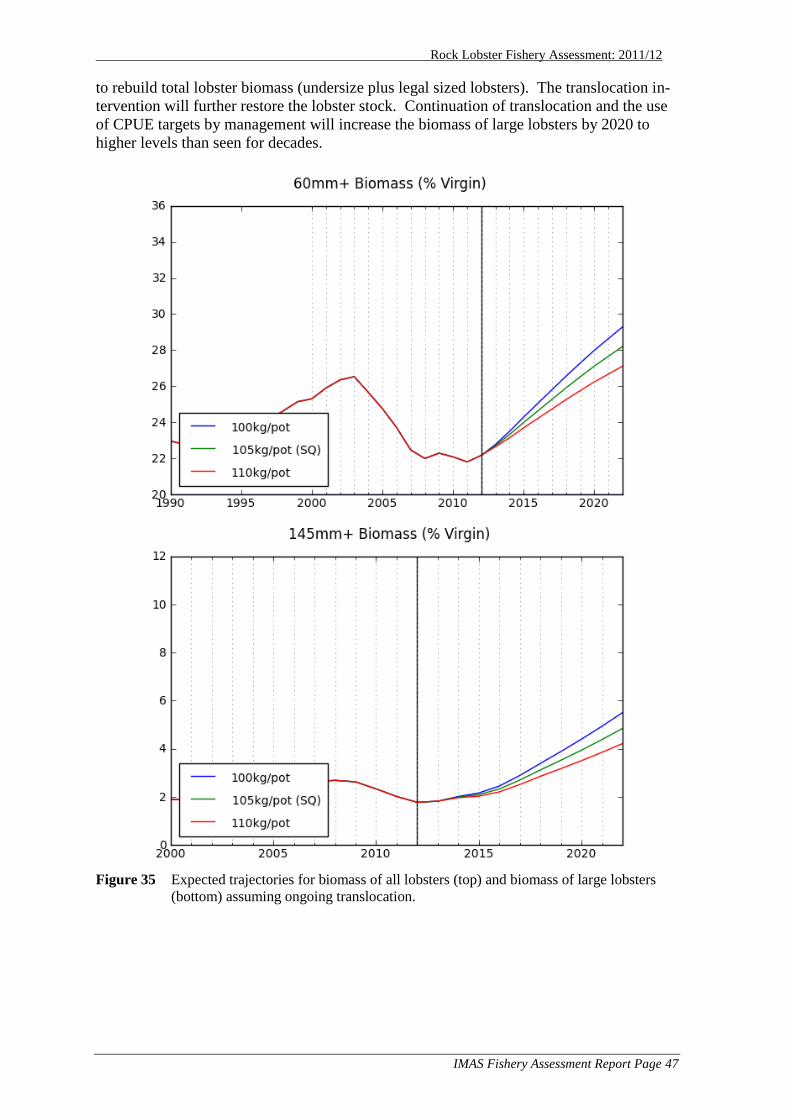
to rebuild total lobster biomass (undersize plus legal sized lobsters). The translocation in-
tervention will further restore the lobster stock. Continuation of translocation and the use
of CPUE targets by management will increase the biomass of large lobsters by 2020 to
higher levels than seen for decades.
Figure 35 Expected trajectories for biomass of all lobsters (top) and biomass of large lobsters
(bottom) assuming ongoing translocation.
Rock Lobster Fishery Assessment: 2011/12
IMAS Fishery Assessment Report Page 48
5 Economic and market status
The economic benefit from the Tasmanian commercial rock lobster fishery is well distrib-
uted around the State, with an estimated 1,350 jobs reliant on the fishery (EconSearch
2003). Lobsters are mainly sold into Asian markets although domestic sales account for a
greater proportion in recent years.
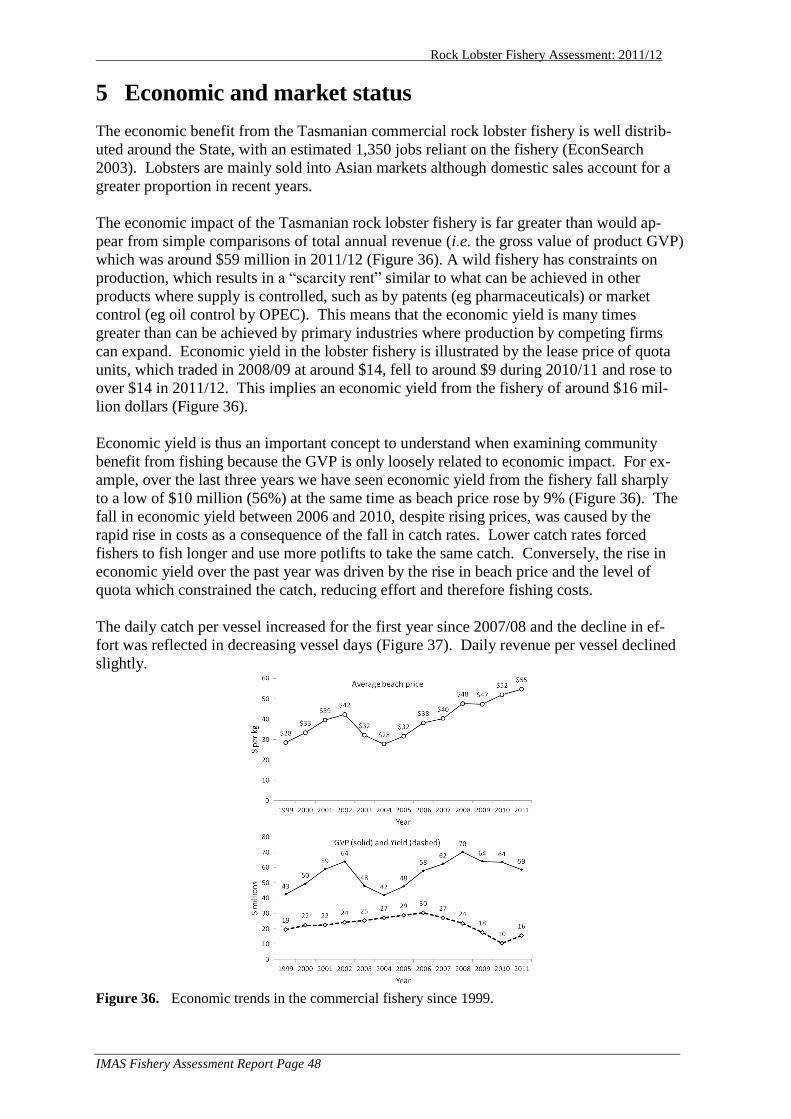
The economic impact of the Tasmanian rock lobster fishery is far greater than would ap-
pear from simple comparisons of total annual revenue (i.e. the gross value of product GVP)
which was around $59 million in 2011/12 (Figure 36). A wild fishery has constraints on
production, which results in a “scarcity rent” similar to what can be achieved in other
products where supply is controlled, such as by patents (eg pharmaceuticals) or market
control (eg oil control by OPEC). This means that the economic yield is many times
greater than can be achieved by primary industries where production by competing firms
can expand. Economic yield in the lobster fishery is illustrated by the lease price of quota
units, which traded in 2008/09 at around $14, fell to around $9 during 2010/11 and rose to
over $14 in 2011/12. This implies an economic yield from the fishery of around $16 mil-
lion dollars (Figure 36).
Economic yield is thus an important concept to understand when examining community
benefit from fishing because the GVP is only loosely related to economic impact. For ex-
ample, over the last three years we have seen economic yield from the fishery fall sharply
to a low of $10 million (56%) at the same time as beach price rose by 9% (Figure 36). The
fall in economic yield between 2006 and 2010, despite rising prices, was caused by the
rapid rise in costs as a consequence of the fall in catch rates. Lower catch rates forced
fishers to fish longer and use more potlifts to take the same catch. Conversely, the rise in
economic yield over the past year was driven by the rise in beach price and the level of
quota which constrained the catch, reducing effort and therefore fishing costs.
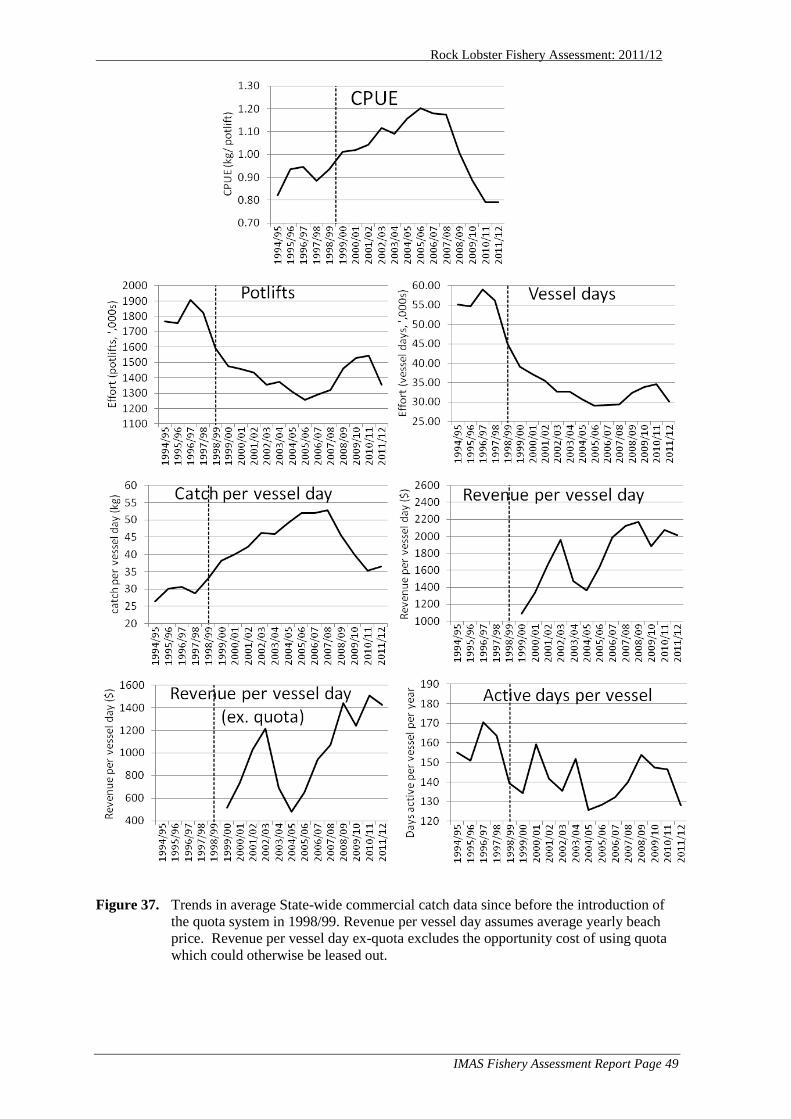
The daily catch per vessel increased for the first year since 2007/08 and the decline in ef-
fort was reflected in decreasing vessel days (Figure 37). Daily revenue per vessel declined
slightly.
Figure 36. Economic trends in the commercial fishery since 1999.
Rock Lobster Fishery Assessment: 2011/12
IMAS Fishery Assessment Report Page 49
Figure 37. Trends in average State-wide commercial catch data since before the introduction of
the quota system in 1998/99. Revenue per vessel day assumes average yearly beach
price. Revenue per vessel day ex-quota excludes the opportunity cost of using quota
which could otherwise be leased out.

Rock Lobster Fishery Assessment: 2011/12
IMAS Fishery Assessment Report Page 50
6 Discussion
The fishery continues to exhibit strong regional trends in the distribution of effort and
catch in response to changes in production around the State. Although the TACC limited
the State-wide catch in 2011/12 the stock remains at very low levels. There were large
regional changes with reduced catch rates on the east and north coasts (areas 2, 4 and 5)
and increased catch rate in the south west (area 8).
The increase in stock and catch rates from 1998 to 2006 has been attributed to the con-
straint of total catch under QMS management. It is now apparent that extremely high lev-
els of recruitment contributed to this growth, and that the recent decline in the fishery was
driven by a prolonged period of very low recruitment from 2006-2011. This low recruit-
ment to the fishery was exceptional and has traits unlike any downturn seen previously
over the period of four decades from 1970 to 2010.
Very high larval settlement detected in puerulus collector sites in 1995 led to high recruit-
ment into the fishery after (QMS) was introduced. This affected catches first in the faster
growth northern areas then later in the south. Constraint in catch under output controls
(QMS) meant that this recruitment pulse led to good catch rates for several years peaking
at 1.2 kg/potlift in 2005/06. Constraining the catch through this period not only spread the
benefits of a recruitment pulse but also generated extra stock through growth of legal sized
lobsters that were left uncaught between years.
The fact that the 2011/12 catch was constrained by the TACC is a positive sign for the re-
building of the stock. Catch rate has now stopped falling and appears to have stabilised.
Improvements in puerulus settlement during the past year to average / above average lev-
els also provide some optimism for future recruitment but if this eventuates it won‟t be
seen in the fishery for several years.
Projections of the stock under current management suggest that rebuilding will occur and
targets will be met. These projections assume that translocation will continue so lower
TACCs would be required if translocations were to cease.
Rock Lobster Fishery Assessment: 2011/12
IMAS Fishery Assessment Report Page 51
7 Management advice
This stock assessment indicates that decline in the stock has ceased and that stock rebuild-
ing is expected with the current TACC.
Performance measures developed by the FAC over 2009 and 2010 provided guidance on
stakeholder goals for the fishery. The performance of the fishery was assessed against the-
se targets in this assessment. This process indicated that the performance target and limits
would be achieved by the current TACC of 105kg/pot. Increasing the TACC to 110kg/pot
does not meet the catch rate target and only marginally exceeds the exploitable biomass
targets. Both of these targets relate to economic performance of the fishery. Reference
points relating to the stock sustainability are easily met by any of the management scenari-
os examined.
All the harvest strategies discussed above assume no change to existing management other
than variation in the TACC. Numerous changes to management are possible that would
increase economic and biological yield per recruit while also addressing the problem of
low egg production in some regions. The most significant opportunities are the ongoing
use of translocation and lowering the minimum size of harvest in the south west. Both of
these would increase the long term productivity of the stock and lead to stock rebuilding
when combined with a constraining TACC.
Rock Lobster Fishery Assessment: 2011/12
IMAS Fishery Assessment Report Page 52
8 Ecosystem based management
8.1 Protected species interactions
Protected species interaction data is collected through the commercial logbooks. Ob-
servers deployed on vessels to collect size structure data also collect protected species
interaction data throughout the year.
8.1.1 Research sampling data
Research sampling data on protected species interactions has traditionally recorded only
significant interactions where the protected species was harmed.
A total of seven harmful interactions with protected species have occurred in research
sampling from 1990 to the end of 2007, each involving the drowning of a cormorant.
This has occurred with a total of 69441 potlifts and thus represents an incidence of
around 0.000101 cormorant deaths per potlift in research pots. If similar rates were ex-
perienced by commercial and recreational fishers then the average annual number of
cormorant deaths in lobster pots would be around 140 (given estimated potlifts). How-
ever, this estimate presumably significantly overstates probable cormorant deaths as re-
search sampling is biased to shallow water. Two sygnathids (a pipefish and a seahorse)
have also been recorded as by-catch and both were released apparently unharmed.
8.1.2 Commercial logbook data
DPIPWE records protected species interactions through the catch and effort database.
Fishers are now required to record species and the nature of interaction in their logbooks
to provide greater detail than was available in previous years. However, there is still
confusion amongst fishers about what needs to be reported. The current data is unsuita-
ble for analysis to provide guidance on the extent of any interactions.
8.2 By-catch
By-catch information is collected though research trips and also with observers aboard
commercial vessels. These fishing trips are identical except that commercial fishers use
pots with open escape gaps whereas research close these gaps to increase the number of
undersize lobsters in catches. The top ten by-catch species for 2011/12 are shown in
Table 10 with the major component hermit crabs. Discard mortality of individuals captured
varies between species with very low or no mortality of crabs, draughtboard sharks,
conger eels and leatherjackets. Consequently the species of most impact for by-catch
monitoring are wrasse, octopus and leatherjackets, which are also reported under by-
product.
Total by-catch increased over the past year and this was due to an increase in the catch
of hermit crabs. All of the main species in the by-catch are within longer term ranges
(Figure 38).
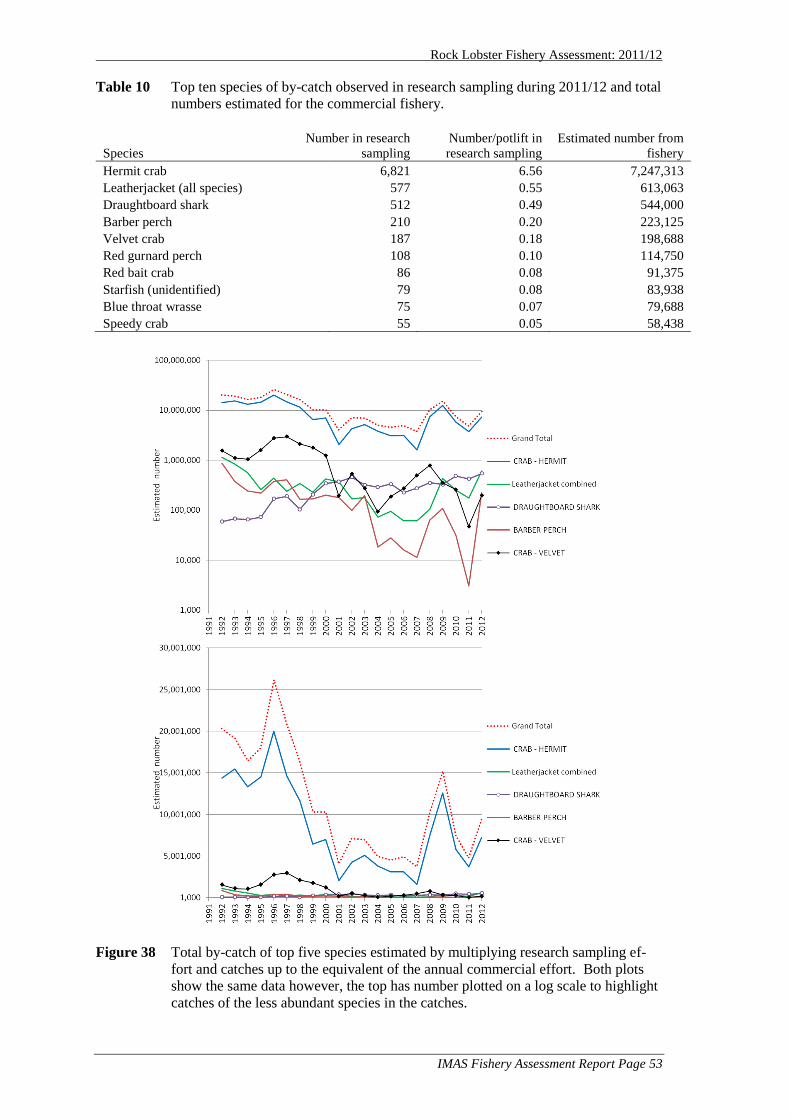
Rock Lobster Fishery Assessment: 2011/12
IMAS Fishery Assessment Report Page 53
Table 10 Top ten species of by-catch observed in research sampling during 2011/12 and total
numbers estimated for the commercial fishery.
Species
Number in research
sampling
Number/potlift in
research sampling
Estimated number from
fishery
Hermit crab 6,821 6.56 7,247,313
Leatherjacket (all species) 577 0.55 613,063
Draughtboard shark 512 0.49 544,000
Barber perch 210 0.20 223,125
Velvet crab 187 0.18 198,688
Red gurnard perch 108 0.10 114,750
Red bait crab 86 0.08 91,375
Starfish (unidentified) 79 0.08 83,938
Blue throat wrasse 75 0.07 79,688
Speedy crab 55 0.05 58,438
Figure 38 Total by-catch of top five species estimated by multiplying research sampling ef-
fort and catches up to the equivalent of the annual commercial effort. Both plots
show the same data however, the top has number plotted on a log scale to highlight
catches of the less abundant species in the catches.
Rock Lobster Fishery Assessment: 2011/12
IMAS Fishery Assessment Report Page 54
8.3 By-product
By-product has been reported within the lobster logbook since 2007/08, which improved
the rate of reporting. Retained product is also differentiated into bait and product for
sale. All reported by-product from lobster pots was of a trivial volume, the largest being
conger eel and octopus for bait and octopus for consumption (Table 11).
By-product is clearly under-reported by the fishery, especially for animals used as bait.
For example, research sampling indicates that around 10 t of wrasse are likely to be cap-
tured by fishers, yet less than one tonne is reported on average each year as by-product.
Likewise research sampling indicates that catches of Maori octopus are under-reported.
There is no apparent improvement in rate of reporting between years.
Table 11. By-product reported by the commercial fishery (tonnes). All species with catch
less than 100 kg in any one year have been excluded.
Bait Consumption
SPECIES 07/08 08/09 09/10 10/11 11/12 07/08 08/09 09/10 10/11 11/12
Barracuda 0.1 0.5 0 0.4 0.1 0 0 0.1 0 0
Bearded rock cod 2.1 2.3 2.2 2.3 2 0.2 0.1 0 0 0
Cleft fronted shore crab 0 0 0 0 0 0.3 0 0.1 0.1 0
Conger eel 1.8 2 1.8 2.3 1.6 0.6 0.6 0.3 0.7 0
Draughtboard shark 0.5 0.1 0 0 1.1 3.1 5.7 0.6 2.7 0.7
Giant crab 0 0 0 0 0 0.3 0.4 0.5 0.5 0.5
Gummy shark 0 0 0 0 0 0.1 0.2 0.1 0.1 0.1
Gurnard perch 0.5 0 0.2 0.1 0.2 0 0 0 0 0
Leatherjacket 0.9 0.7 0.7 0.8 0.7 0.4 0.4 0.1 0.3 0
Jack mackerel 0 0 0 0 0 0 0 0 0 0.4
Morwong 0.1 0 0 0 0 0 0 0 0.1 0
Octopus 0.7 0.6 0.6 1.3 1.4 5.3 5.2 6.7 4.5 6.3
Southern calamari 0 0 0 0 0.4 0 0 0 0 0
Striped trumpeter 0.1 0.2 0 0.2 0.1 0.4 0.9 0.6 0.7 0.5
Wrasse 0.9 0.5 0.7 0.6 0.4 0.2 0.6 0.4 0.2 0
Purple wrasse 0 0.1 0 0.1 0.6 0 0 0 0 0
8.4 Urchin predation by rock lobsters
Density of the long-spined sea urchin Centrostephanus rodgersii off eastern Tasmanian
waters has increased over the last few decades. At high density urchins overgraze sea-
weeds and sessile invertebrates, which reduces the ecological integrity and fisheries
productivity of parts of rocky reef in the 10-30 m depth band affected. Rock lobsters are
a predator of urchins and thus the maintenance of rock lobster populations appears to be
required to respond to the problem of expansion of urchin barrens.
A research project examining this problem and management responses to mitigate the
threat of barren expansion has been underway since 2008 with final reporting due in
2013. (2007/045 Rebuilding Ecosystem Resilience: Assessment of management options
to minimize formation of „barrens‟ habitat by the long-spined sea urchin (Centrostepha-
nus rodgersii) in Tasmania). That project is expected to provide guidance on manage-
ment options including targets for biomass of large lobsters that could be used as refer-
ence points to guide management decision making.
Rock Lobster Fishery Assessment: 2011/12
IMAS Fishery Assessment Report Page 55
In the interim, it should be noted that the existing harvest strategy has two important
components that provide responsiveness to expansion of barren formation. The first is
that recruitment is not assumed to be constant through time, rather, future projections of
the stock use recruitment estimates that are based on more recent data for each addition-
al assessment. This means that if productivity of the east coast declines because of bar-
ren formation, the assessment will adjust expectations of future productivity lower.
That is, the assessment does not continue to base estimates of future productivity on old
historical data prior to the problem of urchin barrens.
The second component of the harvest strategy that provides responsiveness to urchin
barrens is that decision-making is based on 70% and 90% probability levels for future
projections. This is an explicit response to the need to be cautious in setting catch limits
due to possible lost productivity from climate change, urchin barrens or other processes
that may reduce future production.
Rock Lobster Fishery Assessment: 2011/12
IMAS Fishery Assessment Report Page 56
9 Bibliography
Bruce, B, R, Griffin, D., Booth, J., Gardner, C, , Hobday, D., Linnane, A., 2007.
Oceanographic dispersal of southern rock lobster, Draft Final Report to FRDC
2002/007, CSIRO, Hobart.
Burnham, K.P. and D.R. Anderson (1989) Model Selection and Inference. A Practical
Information-Theoretic Approach. Springer-Verlag, New York.
Frusher, S. D. (1997a). Stock Assessment Report : Rock Lobster. Dept. Prim. Ind. Fish.
Internal Report No. 35, 79pp.
Frusher, S.D. (1997b,) Update to the July 1997 Rock Lobster Stock Assessment Report,
December 1997. Dept. Prim. Ind. Fish. Internal Report No. 37, 25pp.
Frusher, S. and C. Gardner (1999) Tasmanian Rock Lobster Fishery 2001/02. Fishery
Assessment Report Tasmanian Aquaculture and Fisheries Institute, University of Tas-
mania. 43 p.
Frusher, S., Gardner, C., Hirst, A., MacKinnon, C., and M. Haddon (2003) Tasmanian
Rock Lobster Fishery 2001/02. Fishery Assessment Report Tasmanian Aquaculture and
Fisheries Institute, University of Tasmania. 92 p.
Gardner, C. (1999) Tasmanian Rock Lobster Fishery 1998/99. Fishery Assessment Re-
port Tasmanian Aquaculture and Fisheries Institute, University of Tasmania. 58 p.
Gardner, C., Frusher, S., and L. Eaton (2001) Tasmanian Rock Lobster Fishery 1999/00.
Fishery Assessment Report Tasmanian Aquaculture and Fisheries Institute, University
of Tasmania. 90 p.
Gardner, C., Frusher, S., Eaton, L., Haddon, M. and C. MacKinnon (2002) Tasmanian
Rock Lobster Fishery 2000/01. Fishery Assessment Report Tasmanian Aquaculture and
Fisheries Institute, University of Tasmania. 117 p.
Gardner, C., Frusher, S., Barrett, N.S, Haddon, M. and C. Buxton (2006). Spatial varia-
tion in size at onset of maturity of female southern rock lobster Jasus edwardsii around
Tasmania, Australia. Scientia Marina 70(3): 423-430.
Gardner, C., MacKinnon, C., Haddon, M., and S. Frusher (2004) Tasmanian Rock Lob-
ster Fishery 2002/03. Fishery Assessment Report Tasmanian Aquaculture and Fisheries
Institute, University of Tasmania. 81 p.
Gardner, C., Hirst, A., and M. Haddon (2005) Tasmanian Rock Lobster Fishery
2003/04. Fishery Assessment Report Tasmanian Aquaculture and Fisheries Institute,
University of Tasmania. 79 p.
Haddon, M. and C. Gardner (2007) Tasmanian Rock Lobster Fishery 2005/06. Fishery
Assessment Report Tasmanian Aquaculture and Fisheries Institute, University of Tas-
mania. 63 p.
Rock Lobster Fishery Assessment: 2011/12
IMAS Fishery Assessment Report Page 57
Kimura, D.K. (1981) Standardized measures of relative abundance based on modelling
log(cpue), and their application to Pacific Ocean perch (Sebastes alutus). Journal du
Conseil Permanent International pour l'Exploration de la Mer 39: 211-218.
Lyle, J.M. and Tracey, S.R. (2010) Tasmanian recreational rock lobster and abalone fis-
heries 2008-09 fishing season. Tasmanian Aquaculture and Fisheries Institute Report,
60p.
Maunder, M.N. and A.E. Punt (2004) Standardizing catch and effort data : a review of
recent approaches. Fisheries Research. 70: 141-159.
Neter, J., Kutner, M.H., Nachtsheim, C.J., and W. Wasserman (1996) Applied Linear
Statistical Models. 4th
edition. Irwin Chicago. 1408 pp.
Punt, A.E. and R.B. Kennedy (1997) Population modelling of Tasmanian rock lobster,
Jasus edwardsii, resources. Marine and Freshwater Research 48: 967-980.
Semmens, J., Haddon, M., and C. Mackinnon (2006) Tasmanian Rock Lobster Fishery
2004/05. Fishery Assessment Report Tasmanian Aquaculture and Fisheries Institute,
University of Tasmania. 78 p.
Venables, W.N. and C.M. Dichmont (2004) GLMs, GAMs, and GLMMs: an overview
of theory for applications in fisheries research. Fisheries Research. 70: 319-337.
Winstanley R.H. (1973) Rock Lobster fishing in Tasmania, 1904-1972. Tasmanian
Fisheries Research 7, 1-29.
Rock Lobster Fishery Assessment: 2011/12
IMAS Fishery Assessment Report Page 58
10 Appendix 1: Historical overview
The following section is based largely on a synopsis of the history of the fishery com-
piled by Tony Harrison
(http://www.users.on.net/~ahvem/Fisheries/Tasmania/Tasmania.html).
Tasmania‟s rock lobster resource is distributed around the coast although fewer animals
are found along the central north coast bordering Bass Strait due to limited opportunity
for recruitment.
Aborigines fished lobsters around the State and a small indigenous harvest continues,
mainly in the northeast. The resource has been harvested commercially since European
settlement with fishing effort initially focused on the East Coast.
The commercial and recreational fisheries initially proceeded without records but the
need for management of the fishery was recognised nonetheless. The first Act for the
protection of Rock Lobster was passed by Parliament in 1885. This Act prohibited the
possession of soft-shelled “crayfish” and egg-carrying females and introduced a mini-
mum legal-size of 10 inches. This size limit is essentially equivalent to that used today
and remains one of the main management constraints.
Some commercial catch information was collected in the late 1880‟s with around 60,000
lobsters a year landed into Hobart. This remains around the average annual commercial
harvest from shallow waters in the SE of the State today (average of 39 tonnes in <10
fathoms for the period 2000-2003, Area 1; although it should be noted that now the rec-
reational catch could match the commercial harvest).
In 1888 fisheries matters were placed under the control and management of a single
Fisheries Board comprising 23 commissioners. Much of their time was spent debating
the merits of different gear types.
Hemispherical cane pots (based on pots used for taking clawed lobsters in Cornwall,
England) were used in Victoria while in Tasmania a baited hoop (“cray” ring) was the
traditional (and preferred) method of catching rock lobsters. The two methods led to two
quite different commercial fishing industries; one using larger, more robust boats that
could operate pots and the other using smaller boats sufficient for operation of “cray”
rings. These two fleets came into contact and conflict during periods around the moult
when lobsters were too soft for freight to Victoria. Pots were subsequently banned in
Tasmania in November 1902, later amended to latitudes south of 39 31 S in February
1904 and subsequently south of 4038S (i.e. north of St Marys) in July 1904. The Fish-
ing Board ratified this ban in November 1905.
In response to further pressure from northern commercial fishers, a Parliamentary en-
quiry conducted by Joseph Lyons considered that pots were not destructive and recom-
mended that pots be legalised. However, it wasn‟t until 1925 that pots were finally le-
galised as part of a new fisheries bill that placed responsibility for the management of
sea fisheries with a newly appointed Sea Fisheries Board. The centrepiece of this new
bill was the allocation of varying numbers of pots to commercial vessels depending on
their size. For example, a limit of 30 pots was adopted for larger vessels with propor-
tionately fewer pots allowed for smaller vessels. Inevitably, the use of pots led to dra-
Rock Lobster Fishery Assessment: 2011/12
IMAS Fishery Assessment Report Page 59
matic increases in commercial catch due to greater efficiency, halted fleetingly by re-
duced market demand during the depression years (1930s) and the Second World War.
Markets have adapted to change in technology throughout the development of the fish-
ery.
The adoption of diesel engines during the Second World War meant that more product
could be shipped to mainland Australia, which led to expanded markets. Soon after this,
the development of refrigeration enabled a rapid expansion into the American frozen tail
market. Most of the commercial catch is now transported live into Asia, the world‟s
premium market for lobsters. The increased value of lobsters that has resulted from the
development of these markets along with growing recognition of rock lobster as pre-
ferred seafood is considered to be a motivating factor for the steadily increasing recrea-
tional effort.
The annual commercial catch reached its historical maximum in 1984 at 2250 tonnes,
prior to falling to a recent historical low of 1440 tonnes in 1994, a reduction of 400
tonnes from the 1992 year.
Concerns about declining future catches led to a shift away from a commercial fishery
managed by input controls (i.e. number of pots and licences etc.) to one managed
through control of fishery outputs (or total catch limits). This resulted in the adoption of
an individual quota system in March 1998 for the commercial fishery.
Rock Lobster Fishery Assessment: 2011/12
IMAS Fishery Assessment Report Page 60
11 Appendix 2: Management
Management regulations were first introduced in 1885 and included a minimum legal
size, and a prohibition on taking soft shelled (recently moulted) lobsters or berried fe-
male lobsters. These input controls still play a role in management of the resource alt-
hough soft-shelled lobsters are now largely protected by a seasonal closure.
Since the inception of catch records in the 1880‟s, the reported annual catch steadily
increased in the commercial rock lobster fishery to a high in 1984 of over 2,250 tonnes.
During this period of growth in catches, concerns were expressed about overfishing in
the commercial fishery, which resulted in changes in regulations. The most important
changes were the legislation of design of pots in 1926, introduction of closed seasons to
limit the harvest of soft-shelled lobsters in 1947, the restriction of the number of licens-
es in 1966, and a ceiling on the number of pots in the fishery set at 10,993 in 1972.
From the record high catch of 1984, the reported annual catch declined to a low of 1,440
tonnes in 1994 reflecting a decline in the available biomass. In recognition of the de-
clining trend in biomass, an individual transferable quota (ITQ) management system
was introduced for the commercial fishery in March 1998 following an industry ballot
to decide whether to accept the system.
Management of the commercial fishery has remained relatively stable since the intro-
duction of quota. Quota was initially set at 1503 tonnes for the 1998/99 fishing season.
After three years of successive improvements in biomass, the quota was increased to
1523 tonnes for the 2001/02 fishing season. As catch is now constrained by quota, sea-
sonal controls in the fishery have been relaxed. Lengths of seasonal closures have var-
ied since their introduction in 1926 but complete closure of September and October was
in place from 1963 to 1998. In 1998, the first 2 weeks of September were opened, to
provide fishers with flexibility to take hard-shell lobsters that command a high price or
fish for the lower priced soft new-shell lobsters that have a higher catchability after their
moult. Timing of the September closure has changed regularly since 1998 with com-
plete access in 2000. There remained some concern about fishing in September due to
negative impacts on markets.
Management of the recreational fishery has proceeded in parallel with that for the com-
mercial fishery. A rock lobster license is required to take lobsters recreationally or to
deploy gear. Many regulations are shared by both sectors, such as size limits, closed
seasons, and pot specifications. Key differences included the ability of recreational
fishers to harvest lobsters by diving, a cap on the daily bag limit of 5 lobsters, and the
absence of an output control mechanism.
Rock Lobster Fishery Assessment: 2011/12
IMAS Fishery Assessment Report Page 61
12 Appendix 3: Summary of Rules
Table 12. Summary of rules for the Tasmanian Rock Lobster Fishery.
COMMERCIAL
Management zone one management zone for the State
Limited entry 314 licenses
Limited seasons Males: season open from mid November to end September. Fe-
males: season open from mid November to end April. (Actual
dates change slightly from year to year.)
Limits of pots on
vessels
minimum of 15 pots, maximum of 50 pots
Quota Total allowable catch of 1523 tonnes
Restrictions on pot
size
maximum size of 1250 mm x 1250 mm x 750 mm.
Escape gaps one escape gap at least 57 mm high and 400 mm wide and not
more than 150 mm from the inside lower edge of the pot, or two
escape gaps at least 57 mm high and 200 mm wide and not more
than 150 mm from the inside lower edge of the pot
Minimum size limits 105 mm CL for females, 110 mm CL for males
Berried females taking of berried females prohibited
RECREATIONAL
License require-
ments
rock lobster potting licence - 1 recreational pot per person,rock lobster diving licence, rock lobster ring license – 4 rings per person.
Daily limit 5 per recreational license holder
Limited seasons Males: season open from start November to end September. Fe-
males: season open from start November to end April. (Actual
dates change slightly from year to year.).
Restrictions on gear Pots as per commercial fishers, rings no more than 1 m in diame-
ter, capture by glove only when diving.
Escape gaps as per commercial fishers
Minimum size limits as per commercial fishers
Berried females as per commercial fishers
Sale or barter of lob-
sters
prohibited
Marking All recreational lobsters must be tail clipped within 5 minutes of
landing. No tail-clipped lobsters to be sold.