Fisheries Investment for Sustainable Harvest - This Is the...
41
Fisheries Investment for Sustainable Harvest Final Report June 2009 Cooperative Agreement: 617-A-00-05-00003-00 16 May 2005-16 November 2008 Department of Fisheries and Allied Aquacultures Auburn University, Alabama This publication was produced for review by the United States Agency for International Development (USAID) and prepared by Auburn University, Department of Fisheries and Allied Aquacultures. The author’s views ex- pressed in this publication do not necessarily reflect the views of the United States Agency for International Development or the United States Government. Auburn University is an equal opportunity educational institution/employer. www.ag.auburn.edu
Transcript of Fisheries Investment for Sustainable Harvest - This Is the...

Fisheries Investment for Sustainable HarvestFinal Report
June 2009
Cooperative Agreement: 617-A-00-05-00003-00
16 May 2005-16 November 2008
Department of Fisheries and Allied Aquacultures
Auburn University, Alabama
This publication was produced for review by the United States Agency for International Development (USAID) and prepared by Auburn University, Department of Fisheries and Allied Aquacultures. The author’s views ex-pressed in this publication do not necessarily reflect the views of the United States Agency for International Development or the United States Government.
Auburn University is an equal opportunity educational institution/employer.
www.ag.auburn.edu

GOU Government of Uganda
IFPRI International Food Policy ResearchInstitute
LVHD Low Volume High Density
MAAIF Ministry of Agriculture, Animal Industry and Fisheries
MAK (MUK) Makerere University, Kampala
MEMS Monitoring & Evaluation Management Services
MOU Memorandum of Understanding
NAADS National Agricultural Advisory Services
NaFIRRI National Fisheries Resources Research Institute
NARO National Agricultural ResearchOrganization
NEMA National Environment Management Authority
NGOs Non-Governmental Organizations
NORAD Norwegian Agency for Development Cooperation
PEAP Poverty Eradication Action Plan
PIR Project Intermediary Results
PMA Plan for Modernization of Agriculture
PMP Project Monitoring Plan
PRIME Productive Resource Investments forManaging the Environment
PSI Private Sector Investment (Programme under EVD)
RFP Request for Proposal
SAF Strategic Activities Fund
SCOPE Strengthening the Competitiveness of EnterpriseDevelopment
SO Strategic Objective
SO7 Strategic Objective Seven
STTA Short Term Technical Assistance
UIA Uganda Investment Authority
UMEMS Uganda Monitoring and Evaluation ManagementSystems
USAID United States Agency for International Development
USD United States dollars (denoted in text by $)
USh Uganda shillings
WRMD Water Resources ManagementDirectorate
APEP Agricultural Productivity Enhancement Program
ARDC-Kajjansi Aquaculture Research and Development Centre, Kajjansi
APS Annual Program Statement
AU Auburn University
BMP Best Management Practices
CDE Centre for the Development of Enterprise
CIRAD Centre de coopération internationale en recherche agronomique pour le développement
CoP Chief of Party
DANIDA Danish International Development Agency
DFR Department of Fisheries Resources
EVD Agency for International Business and Cooperation (Netherlands)
IEHA Initiative to End Hunger in Africa
FAO Food & Agricultural Organization
FIRRI Fisheries Resources Research Institute
FISH Fisheries Investment for Sustainable Harvest
FTI Fisheries Training Institute
Acronyms
Catfish fingerling ponds, protected from
predators. One small pond like these can
produce 10,000 to 15,000 fingerlings with
total value of 2 to 3 million Ush ($1,000 to
$1,500) every 2 months in static water. This is
only one of the production options avail-
able for catfish hatcheries.
Clarias gariepinus, (above) and Oreochromis
niloticus, (below), are the 2 main species pro-
duced by fish farmers who received services
from FISH. Both are endemic to Uganda and
are relatively easy to raise.
Overview 5
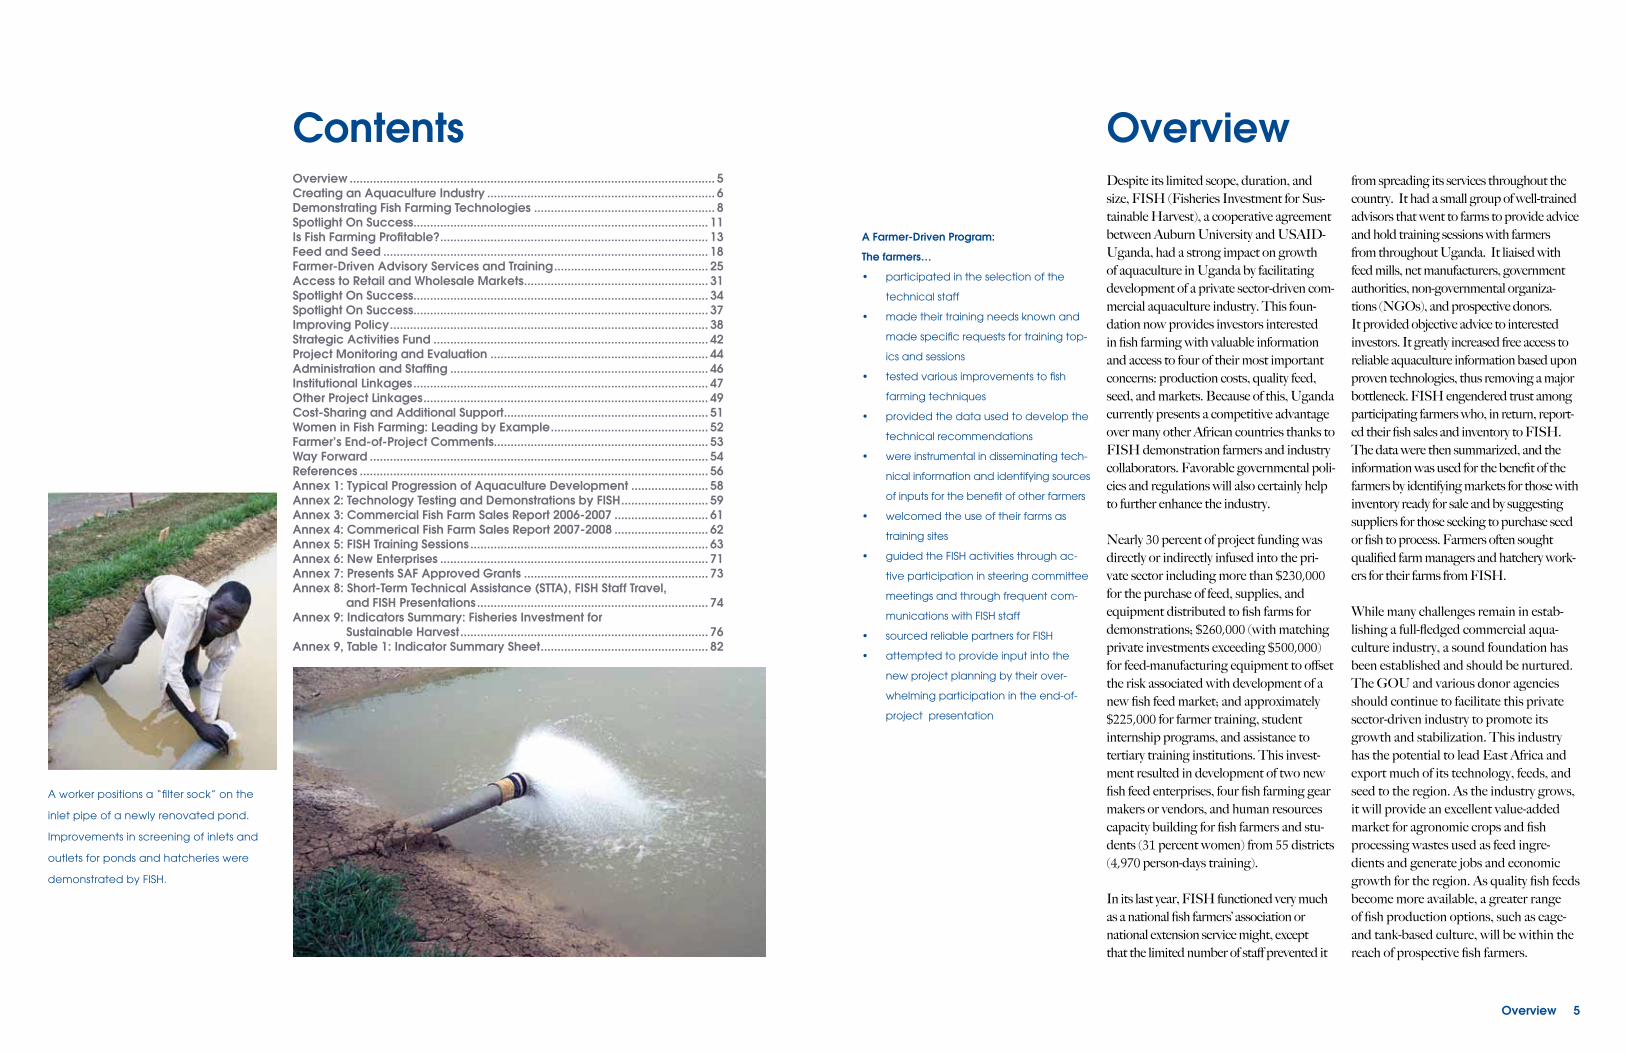
Despite its limited scope, duration, and size, FISH (Fisheries Investment for Sus-tainable Harvest), a cooperative agreement between Auburn University and USAID-Uganda, had a strong impact on growth of aquaculture in Uganda by facilitating development of a private sector-driven com-mercial aquaculture industry. This foun-dation now provides investors interested in fish farming with valuable information and access to four of their most important concerns: production costs, quality feed, seed, and markets. Because of this, Uganda currently presents a competitive advantage over many other African countries thanks to FISH demonstration farmers and industry collaborators. Favorable governmental poli-cies and regulations will also certainly help to further enhance the industry.
Nearly 30 percent of project funding was directly or indirectly infused into the pri-vate sector including more than $230,000 for the purchase of feed, supplies, and equipment distributed to fish farms for demonstrations; $260,000 (with matching private investments exceeding $500,000) for feed-manufacturing equipment to offset the risk associated with development of a new fish feed market; and approximately $225,000 for farmer training, student internship programs, and assistance to tertiary training institutions. This invest-ment resulted in development of two new fish feed enterprises, four fish farming gear makers or vendors, and human resources capacity building for fish farmers and stu-dents (31 percent women) from 55 districts (4,970 person-days training). In its last year, FISH functioned very much as a national fish farmers’ association or national extension service might, except that the limited number of staff prevented it
from spreading its services throughout the country. It had a small group of well-trained advisors that went to farms to provide advice and hold training sessions with farmers from throughout Uganda. It liaised with feed mills, net manufacturers, government authorities, non-governmental organiza-tions (NGOs), and prospective donors. It provided objective advice to interested investors. It greatly increased free access to reliable aquaculture information based upon proven technologies, thus removing a major bottleneck. FISH engendered trust among participating farmers who, in return, report-ed their fish sales and inventory to FISH. The data were then summarized, and the information was used for the benefit of the farmers by identifying markets for those with inventory ready for sale and by suggesting suppliers for those seeking to purchase seed or fish to process. Farmers often sought qualified farm managers and hatchery work-ers for their farms from FISH.
While many challenges remain in estab-lishing a full-fledged commercial aqua-culture industry, a sound foundation has been established and should be nurtured. The GOU and various donor agencies should continue to facilitate this private sector-driven industry to promote its growth and stabilization. This industry has the potential to lead East Africa and export much of its technology, feeds, and seed to the region. As the industry grows, it will provide an excellent value-added market for agronomic crops and fish processing wastes used as feed ingre-dients and generate jobs and economic growth for the region. As quality fish feeds become more available, a greater range of fish production options, such as cage- and tank-based culture, will be within the reach of prospective fish farmers.
OverviewOverview ............................................................................................................. 5Creating an Aquaculture Industry .................................................................... 6Demonstrating Fish Farming Technologies ...................................................... 8Spotlight On Success ........................................................................................ 11Is Fish Farming Profitable? ................................................................................ 13Feed and Seed ................................................................................................. 18Farmer-Driven Advisory Services and Training .............................................. 25Access to Retail and Wholesale Markets ....................................................... 31Spotlight On Success ........................................................................................ 34Spotlight On Success ........................................................................................ 37Improving Policy ............................................................................................... 38Strategic Activities Fund .................................................................................. 42Project Monitoring and Evaluation ................................................................. 44Administration and Staffing ............................................................................. 46Institutional Linkages ........................................................................................ 47Other Project Linkages ..................................................................................... 49Cost-Sharing and Additional Support ............................................................. 51Women in Fish Farming: Leading by Example ............................................... 52Farmer’s End-of-Project Comments................................................................ 53Way Forward ..................................................................................................... 54References ........................................................................................................ 56Annex 1: Typical Progression of Aquaculture Development ....................... 58Annex 2: Technology Testing and Demonstrations by FISH .......................... 59Annex 3: Commercial Fish Farm Sales Report 2006-2007 ............................ 61Annex 4: Commerical Fish Farm Sales Report 2007-2008 ............................ 62Annex 5: FISH Training Sessions ....................................................................... 63Annex 6: New Enterprises ................................................................................ 71Annex 7: Presents SAF Approved Grants ....................................................... 73Annex 8: Short-Term Technical Assistance (STTA), FISH Staff Travel, and FISH Presentations ..................................................................... 74Annex 9: Indicators Summary: Fisheries Investment for Sustainable Harvest .......................................................................... 76Annex 9, Table 1: Indicator Summary Sheet .................................................. 82
Contents
A Farmer-Driven Program:
The farmers…
• participated in the selection of the
technical staff
• made their training needs known and
made specific requests for training top-
ics and sessions
• tested various improvements to fish
farming techniques
• provided the data used to develop the
technical recommendations
• were instrumental in disseminating tech-
nical information and identifying sources
of inputs for the benefit of other farmers
• welcomed the use of their farms as
training sites
• guided the FISH activities through ac-
tive participation in steering committee
meetings and through frequent com-
munications with FISH staff
• sourced reliable partners for FISH
• attempted to provide input into the
new project planning by their over-
whelming participation in the end-of-
project presentation
A worker positions a “filter sock” on the
inlet pipe of a newly renovated pond.
Improvements in screening of inlets and
outlets for ponds and hatcheries were
demonstrated by FISH.

Creating an Aquaculture Industry 76 Creating an Aquaculture Industry
Results Framework for FISHCreating an aquaculture “industry” means that elements needed for aquaculture businesses are present. If the “industry” is created, then there will be more farmed fish (PIR1) and markets for the farm-raised fish will be developed (PIR2). Enabling government policies (PIR3) are also a necessary ingredient but were not in direct control of the project, so, they were initially set aside with a dashed line in the Results Framework diagram follow-ing the advice received from the earlier MEMS. However, FISH was able to make recommendations on improvements to policy that could make it more enabling for aquaculture development.
In order to increase production of farmed fish, improved technologies must be demonstrated (PIR1.1) and the as-sociated costs and profits documented. Therefore, the major activity of FISH was demonstration on a few farms to provide the examples of new technologies other farmers needed to see, document costs and profit margins, and form the basis for the recommendations made to commercial fish farmers.
Feed and seed or “fingerlings” (PIR1.2)must be available in adequate quantities and of good quality. Advisory services must be present to assist new investors and producers (PIR1.3). These advisors will assist the producers in identifying markets (PIR2).
There is an over-capacity of fish processors in Uganda, with most plants functioning at about 40 percent capacity. Between 2006 and 2008, several processing plants closed, citing lack of fish. Although the species farmed is different from the species
exported by processors, the equipment and skills present in the processing plants are, for the most part, the same. Therefore, pro-cessors and fish farmers should be linked (PIR2.1). The farmers should be aware of the size and quantities of fish required by processors and the processors should know which farmers have fish for sale.
Aquaculture-produced fish are usually delivered to the processing plants alive, so there must be some knowledge and understanding of live fish transport techniques on the part of the farmer and/or the processor (PIR2.2). Delivery of live fish to local markets allows more flexibility to the producers because their produce is less perishable than dead fish and they can negotiate better prices. In addition, finger-lings must be transported alive for farmers to succeed, so PIR2.2 is also linked to PIR1.2. FISH was aware that the sup-ply of farm-raised fish was very low and intermittent. Therefore, although market-ing is an important aspect in aquaculture development, the first step was to increase the production of farmed fish. Note that all of the indicators had to be addressed simultaneously; it was not possible to develop only one without the others.
Three years is insufficient to develop a full-fledged commercial aquaculture industry, given that fish farming was only a short step away from subsistence-level in 2005 (Annex 1). However, some examples of profitable fish farms could be attained and vast improvements on feed and seed quality and supply were possible. As fish supply became more predictable, market development could follow.
Creating anAquaculture Industry
Exp
and
ed
Sus
tain
ab
le
Eco
nom
ic O
pp
ortu
nitie
s fo
r Rur
al S
ec
tor G
row
th
Aq
uac
ultu
re In
dus
try
Cre
ate
d
PIR
3G
ove
rnm
ent
po
licie
s p
rovi
de
ena
blin
g
env
ironm
ent
for a
qua
cul
ture
PIR
2Im
pro
ved
ma
rke
ting
of f
arm
ed
fish
PIR
1In
cre
ase
d p
rod
uctio
n o
f fa
rme
d fi
sh
PIR
1.1
Imp
rove
d c
ag
e a
nd
po
nd a
qua
cul
ture
te
chn
olo
gie
s te
ste
d
and
de
mo
nstra
ted
PIR
1.2
Inc
rea
sed
qua
lity
and
qua
lity
of i
nput
s,
esp
ec
ially
fee
d a
nd
fish
see
d
PIR
2.1
Imp
rove
d li
nka
ge
with
p
roc
ess
ors
PIR
2.2
Imp
rove
d te
chn
ique
s a
nd e
qui
pm
ent
for l
ive
fis
h tra
nsp
ort
PIR
1.3
Stre
ngth
ed
aq
uac
ultu
re a
dvi
sory
se
rvic
es
FISH
Re
sults
Fra
me
wo
rk
Uganda Fishnet Manufacturers installed a
heater/stretcher to improve the setting of
knots in its netting. This was especially im-
portant for netting used in making cages.
If knots slip, the mesh can open and allow
fish to escape. FISH advised local busi-
nesses on needs of fish farmers.
Aerial photo of SoN Fish Farm Ltd. The
total pond number and surface area has
since doubled.

Early challenges in the demonstration
farmer program/selection
• The farmers’ beliefs that the only way
to make money from fish farming was if
a project pays for all the inputs
• Excessive and unnnessary expenditures
made in starting up small fish farms prior
to FISH led to losses and drained farmers’
cash reserves
• Farmers had been given the impression
by local advisors that fish farming was
an easy way to make money
• Many fish farmers were absentee own-
ers and sourced inexpensive managers,
many of whom were un-trainable
• Pond construction was, for almost all
farmers, poorly understood and poorly
undertaken by “experts”; at great cost
to the farmer
8 Demonstrating Fish Farming Technologies
For those who wish to start new fish farms or improve the farms they already have, examples of successful fish farms are very useful. Financing is also necessary. Some documented examples of different fish farming options are needed in order to generate enterprise budgets that banks can use as references.
Shortly after FISH began, a set of criteria was developed to select the demonstra-tion farmers. Competition to be selected was high and expectations among the farmers were even higher. Only one of the farms was making any money (a very small profit) and none of the farms had reliable production. In general, the belief was that fish farms could only make mon-ey if a “project” pays for everything. As FISH staff began farm visits to select the demonstration sites, they could see that farmers were investing large amounts of money in things that were poorly de-signed or just did not work. Therefore, the promise FISH could make was that the farmers would be shown how to “not waste any more money.” New technology specific for the farmer’s location and situa-tion would be suggested and the first trial items would be paid for by FISH. The new feed would be provided for the trials, but the farmer would be responsible for all labor, other feed being used on the farm, and all recordkeeping.
As the first demonstrations to show proper stocking density and feeding were planned, it became quite clear that the shallow ponds found throughout Uganda would never perform very well, no matter how good the feed. Therefore, pond renovation was necessary for almost all of the demonstration sites. Pond renovation and construction became a large part of the training program
and increased understanding of pond con-struction principles by hundreds of farmers is a major FISH achievement.
Although only five demonstration farms were to be selected, FISH staff decided to begin work with twelve farms, know-ing that some would drop out. In fact, three farms dropped out by the end of the first year but more farms asked to be included and wanted only assistance with fish transport and sampling. The farms were needed to run some trials on tilapia production because the data gathered up to then (2007) was insufficient for manage-ment recommendations.
Working closely with the demonstration farmers allowed FISH staff to better understand their management problems and to address the sectoral needs such as equipment and feed. One major problem stemmed from absentee owners. The most successful farms were those with actively-involved owner/operators. Ab-sentee owners who succeeded were in very close touch with their managers and, often after several trials with different manag-ers, found a person with whom they could work and have confidence. Management of staff remains a big constraint on some fish farms. Increasing the level of intensity of the farm and investing in expensive inputs are not advisable for farms with management problems.
By the middle of 2007, the demonstration farmers presented their own results and advice to new farmers at the first fish farm-ers’ symposium.
Demonstrating Fish Farming Technologies
The solution:
• Convince the farmers to renovate just
one pond and provide the trained
expertise to assist them
• Split the costs of the inputs with the
farmer: new feed to be tested would
be provided for one pond; fingerlings
were purchased by the farmer but
transport provided by FISH
• FISH loaned the gear for sampling and
provided some of the labor to assist in
monthly sampling
• Demonstration farmers were given first
pick on interns sponsored by FISH
• The internship program supplied a pool
of better-trained individuals in case the
farmer wanted to hire a new manager
• Farmers were required to keep records
and share them with FISH
• In return for FISH assistance, farmers had to
allow for one half-day per week for other
farmers (accompanied by FISH) to visit
All farms had their ponds rehabilitated to recommended standards. Three farms that received assistance dropped out, including:1. Nakasozzi Fish Farm, Wakiso–tilapia
grow-out and catfish grow-out,2. Nansana Fish Farm, Wakiso–tilapia
grow-out, and 3. Ssisa Fish Farm, Wakiso–did pond reno-
vations but dropped out before stocking.
A fourth farm, owned by Uganda Fish Pack-ers and located at their old landing site in Jinja, was used from 2005 through 2007 and then released from the trials after the manager was transferred and oversight was not possible. The farm provided some very valuable infor-mation on cage farming, catfish pond carrying capacity, tilapia grow-out, and tilapia nursery.
Table 1 lists the demonstration and trial farms at the end of the project.
A list of all technologies that have been demonstrated is listed in Annex 2, orga-nized by subject area.
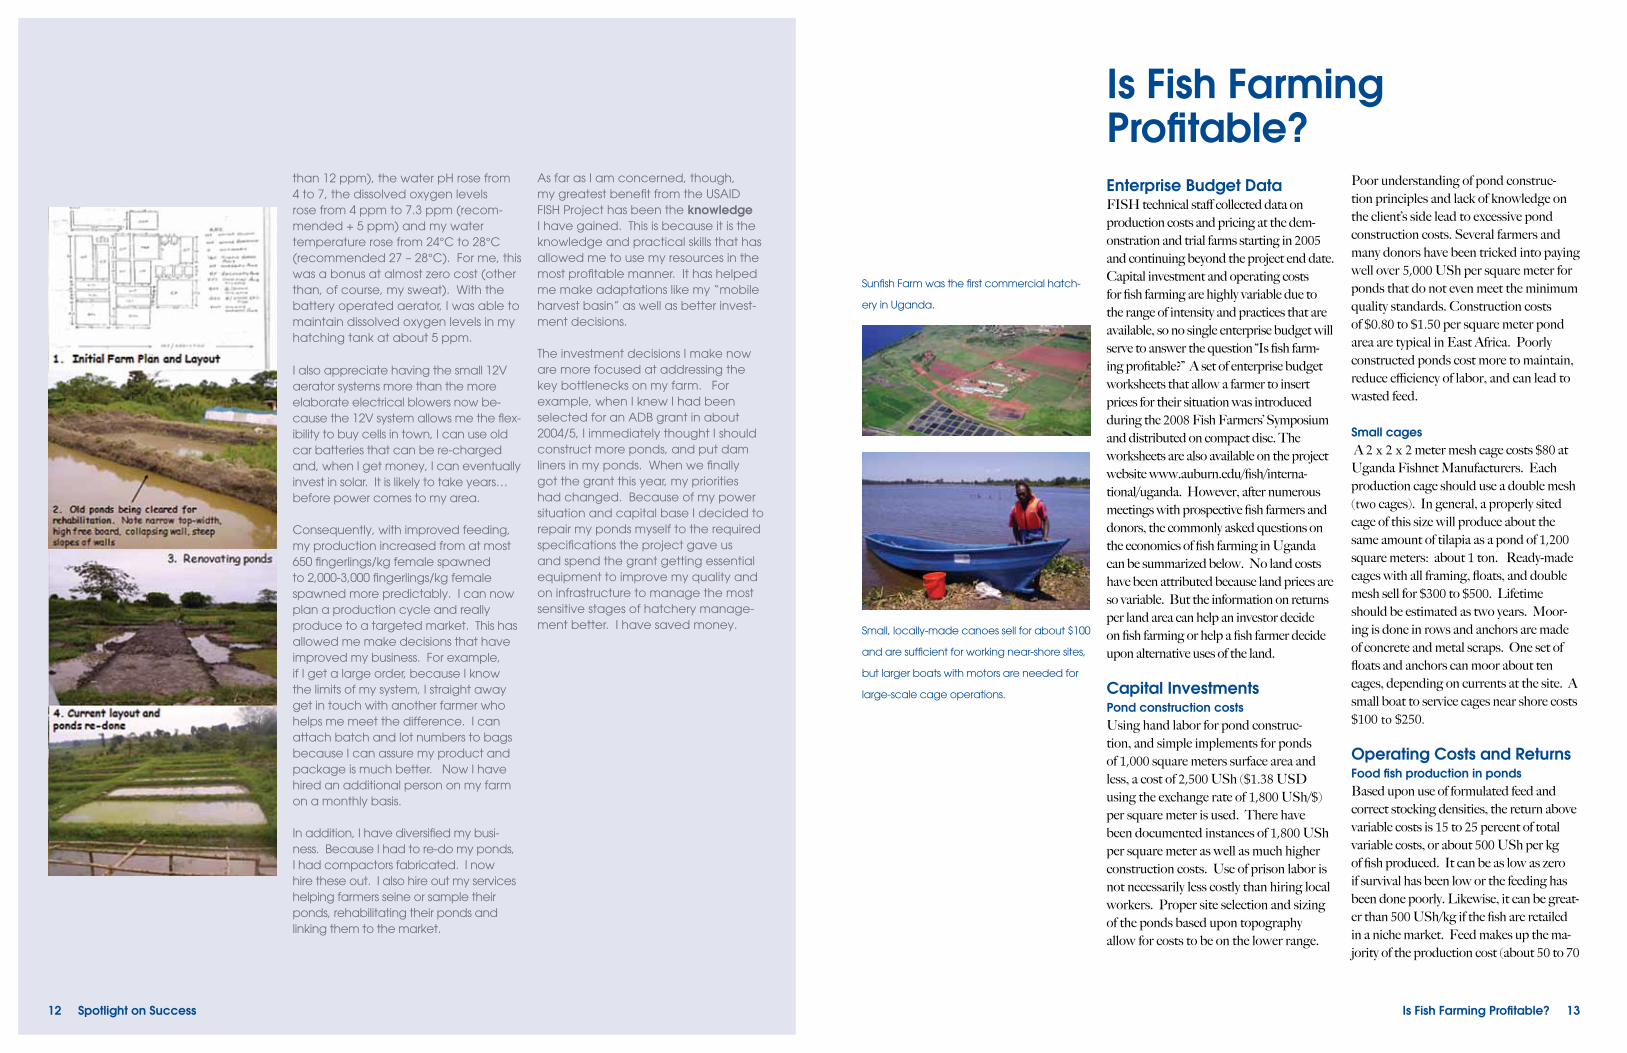
Most ponds in Uganda are merely dug, and
soil piled up to form levees. This works in the
short term but increases maintenance costs
over the long run and reduces the production
potential of the pond. FISH showed farmers
and interested contractors how to move less
soil shorter distances and compact the pond
levees in layers, thereby constructing a sturdy
pond at the same or less cost than the “tradi-
tional” ponds.
Demonstrating Fish Farming Technologies 9
10 Demonstrating Fish Farming Technologies
Table 1. Participating Demonstration and Trial Farmers
Demo/Trial Farm Technologies Demonstrated
1. Blessed Investments Ltd., Mityana, 2005*
• Water harnessing for aquaculture• Feed based tilapia and catfish pond grow-out• Cage culture in reservoirs
2. Edron Fish Farm, Wakiso, 2008* • All male tilapia pond grow-out, hand-sexed
3. Lubugumu Fish Farm, Mpigi, 2008* • All male tilapia pond grow-out, hand-sexed• Feed based catfish grow-out in ponds
4. Mpigi Fish Farm, Mpigi, 2005* • Tilapia nursery for SRT**• Catfish hatchery—small scale, semi-natural spawning, early rearing in
hapas and ponds, improved water exchange using DC submersible pumps in ponds and outdoor tanks, nursery ponds with woodenharvest basins
5. Naluvule Fish Farm, Wakiso, 2005* • Feed based catfish grow-out in ponds
6. Samarieza Fish Farm, Mukono 2005* • Feed based catfish grow-out in ponds
7. Umoja Fish Farm, Wakiso, 2005* (first demonstrations in March 2006)
• Catfish hatchery—in wooden tanks with liner, pond aeration, nursery ponds with harvest basins, water constrained hatchery, lined nursery ponds, har-vest basins, holding facilities for hatcheries, hatching jars, airlifts, hatchery aeration with DC-battery and solar and air blowers, water re-use to ponds, use of DC submersible pumps in zooplankton harvesting and improve water exchange through hapas, production management practices, aeration with tyre tube, water re-use with wooden tank, health management, and degassing; artemia hatching (small unit). Training center for farmers
• Tilapia nursery management for SRT
8. SunFish Farm Ltd, Wakiso, 2005* • Catfish hatchery, all in tanks; aeration, artemia hatchery, reduction of carbon dioxide by aeration, and use of hydrated lime
9. Namayenje Fish Farm, Mukono, 2005* • Cage culture in reservoirs• Water harvesting for aquaculture; Also has catfish hatchery–aeration,
degassing, nursery ponds with harvest basins• Tilapia pond grow-out–monosex; feed and fertilizer• Catfish pond grow-out; formulated feed and offals
10. Source of Nile Fish Farm, Mukono (began assistance in 2005 before farm constructed)
• Tilapia pond nursery management• Cage culture in lake—also demand feeders for sinking feed; is a tilapia
hatchery, selective breeding and SRT; harvest basins; happa-based fry treatment
11. Interfish, Wakiso, 2007* • Catfish hatchery—water re-use system, pumped water from lake; water management, raceways and grow-out tanks, nursery ponds; some catfish grow-out to food size in tanks
12. MUSO4 Fish Farm, Iganga, 2006* • Rural small-scale hatchery, no power, water harnessing, aeration with aquarium pumps, catfish pond nursery management from 3 days old
• Tilapia nursery for SRT• Tilapia hatchery for mixed sex–receding• Catfish grow-out in ponds; feed and offals
13. Mugoya Farm, Iganga, 2008* • Catfish grow-out in ponds, feed and offals• SRT tilapia grow-out in ponds, feed and fertilizer
14. Nabitende Fish Farm, Iganga, 2008* • Feed based catfish grow-out in ponds• SRT tilapia grow-out monosex, feed based
15. Karim’s Fish Farm, Iganga, 2008* • Catfish grow-out in ponds, offals
16. Emma Fish Farm, Pallisa, 2008* • SRT tilapia grow-out in ponds, feed and fertilizer• Feed based catfish grow-out in ponds
17. Kitangala Fish Farm, Wakiso, 2007* • Feed based catfish grow-out in ponds
* Year they began receiving technical backstopping from FISH
Spotlight On Success 11
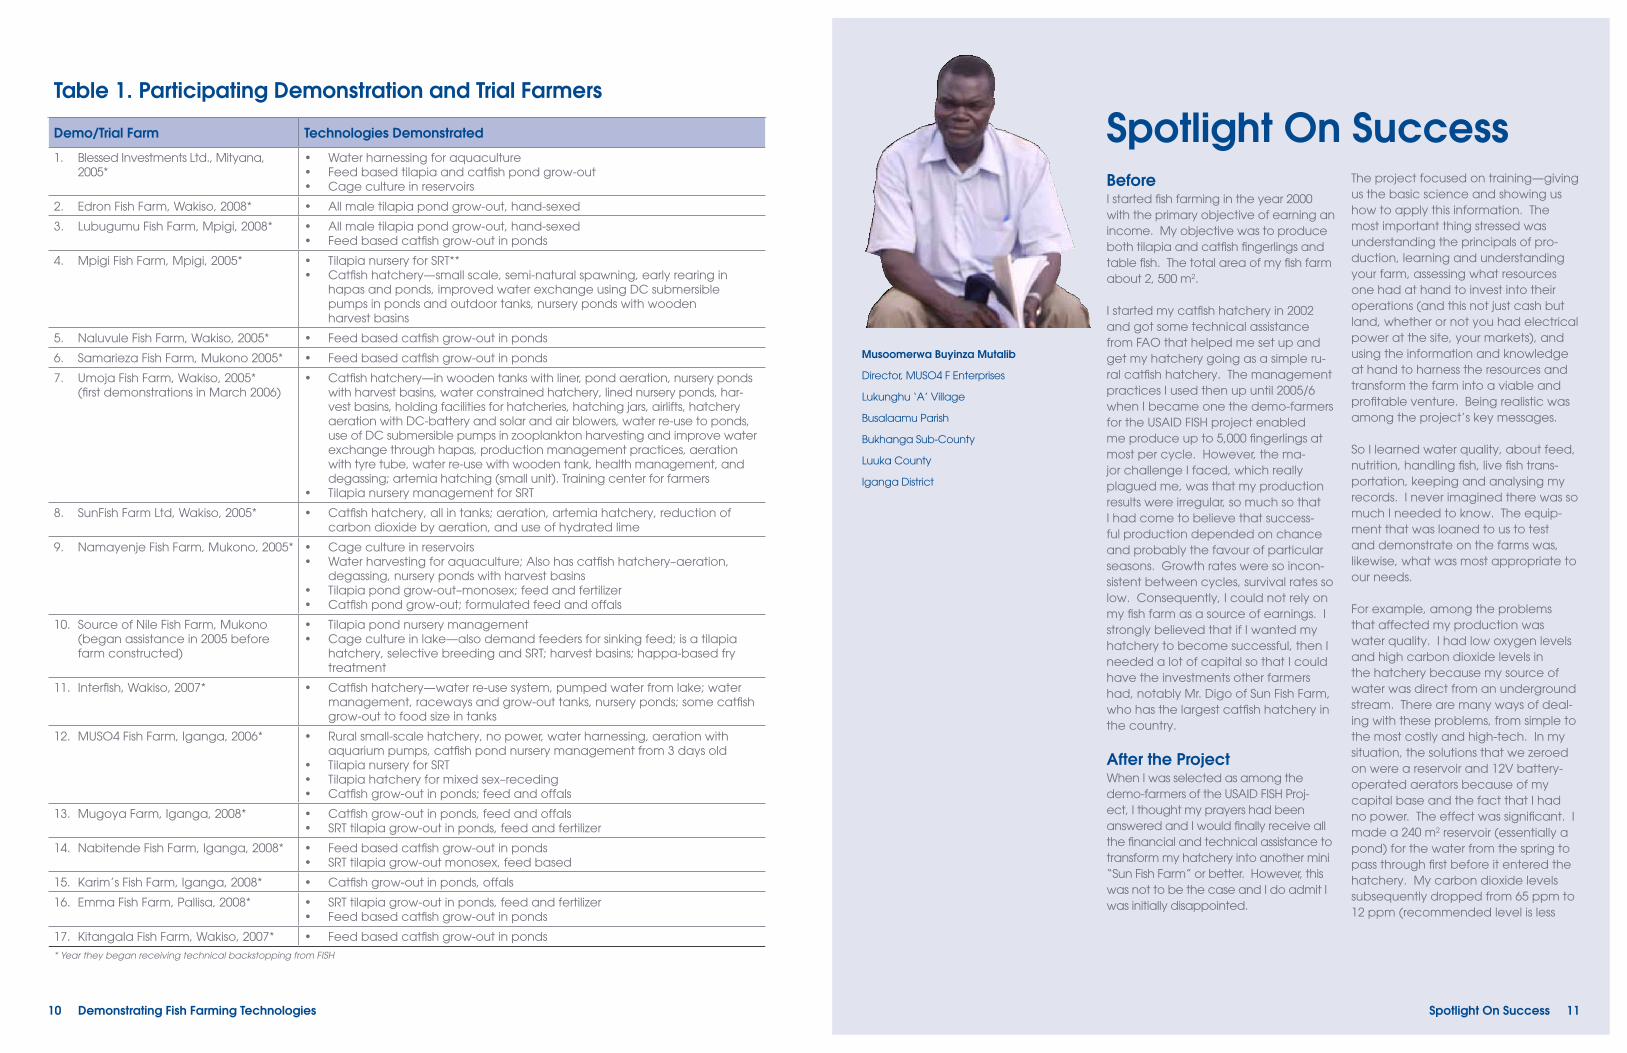
Musoomerwa Buyinza Mutalib
Director, MUSO4 F Enterprises
Lukunghu ‘A’ Village
Busalaamu Parish
Bukhanga Sub-County
Luuka County
Iganga District
BeforeI started fish farming in the year 2000 with the primary objective of earning an income. My objective was to produce both tilapia and catfish fingerlings and table fish. The total area of my fish farm about 2, 500 m2.
I started my catfish hatchery in 2002 and got some technical assistance from FAO that helped me set up and get my hatchery going as a simple ru-ral catfish hatchery. The management practices I used then up until 2005/6 when I became one the demo-farmers for the USAID FISH project enabled me produce up to 5,000 fingerlings at most per cycle. However, the ma-jor challenge I faced, which really plagued me, was that my production results were irregular, so much so that I had come to believe that success-ful production depended on chance and probably the favour of particular seasons. Growth rates were so incon-sistent between cycles, survival rates so low. Consequently, I could not rely on my fish farm as a source of earnings. I strongly believed that if I wanted my hatchery to become successful, then I needed a lot of capital so that I could have the investments other farmers had, notably Mr. Digo of Sun Fish Farm, who has the largest catfish hatchery in the country.
After the ProjectWhen I was selected as among the demo-farmers of the USAID FISH Proj-ect, I thought my prayers had been answered and I would finally receive all the financial and technical assistance to transform my hatchery into another mini “Sun Fish Farm” or better. However, this was not to be the case and I do admit I was initially disappointed.
The project focused on training—giving us the basic science and showing us how to apply this information. The most important thing stressed was understanding the principals of pro-duction, learning and understanding your farm, assessing what resources one had at hand to invest into their operations (and this not just cash but land, whether or not you had electrical power at the site, your markets), and using the information and knowledge at hand to harness the resources and transform the farm into a viable and profitable venture. Being realistic was among the project’s key messages.
So I learned water quality, about feed, nutrition, handling fish, live fish trans-portation, keeping and analysing my records. I never imagined there was so much I needed to know. The equip-ment that was loaned to us to test and demonstrate on the farms was, likewise, what was most appropriate to our needs.
For example, among the problems that affected my production was water quality. I had low oxygen levels and high carbon dioxide levels in the hatchery because my source of water was direct from an underground stream. There are many ways of deal-ing with these problems, from simple to the most costly and high-tech. In my situation, the solutions that we zeroed on were a reservoir and 12V battery-operated aerators because of my capital base and the fact that I had no power. The effect was significant. I made a 240 m2 reservoir (essentially a pond) for the water from the spring to pass through first before it entered the hatchery. My carbon dioxide levels subsequently dropped from 65 ppm to 12 ppm (recommended level is less
Spotlight On Success
12 Spotlight on Success
than 12 ppm), the water pH rose from 4 to 7, the dissolved oxygen levels rose from 4 ppm to 7.3 ppm (recom-mended + 5 ppm) and my water temperature rose from 24°C to 28°C (recommended 27 – 28°C). For me, this was a bonus at almost zero cost (other than, of course, my sweat). With the battery operated aerator, I was able to maintain dissolved oxygen levels in my hatching tank at about 5 ppm.
I also appreciate having the small 12V aerator systems more than the more elaborate electrical blowers now be-cause the 12V system allows me the flex-ibility to buy cells in town, I can use old car batteries that can be re-charged and, when I get money, I can eventually invest in solar. It is likely to take years…before power comes to my area.
Consequently, with improved feeding, my production increased from at most 650 fingerlings/kg female spawned to 2,000-3,000 fingerlings/kg female spawned more predictably. I can now plan a production cycle and really produce to a targeted market. This has allowed me make decisions that have improved my business. For example, if I get a large order, because I know the limits of my system, I straight away get in touch with another farmer who helps me meet the difference. I can attach batch and lot numbers to bags because I can assure my product and package is much better. Now I have hired an additional person on my farm on a monthly basis.
In addition, I have diversified my busi-ness. Because I had to re-do my ponds, I had compactors fabricated. I now hire these out. I also hire out my services helping farmers seine or sample their ponds, rehabilitating their ponds and linking them to the market.
As far as I am concerned, though, my greatest benefit from the USAID FISH Project has been the knowledge I have gained. This is because it is the knowledge and practical skills that has allowed me to use my resources in the most profitable manner. It has helped me make adaptations like my “mobile harvest basin” as well as better invest-ment decisions.
The investment decisions I make now are more focused at addressing the key bottlenecks on my farm. For example, when I knew I had been selected for an ADB grant in about 2004/5, I immediately thought I should construct more ponds, and put dam liners in my ponds. When we finally got the grant this year, my priorities had changed. Because of my power situation and capital base I decided to repair my ponds myself to the required specifications the project gave us and spend the grant getting essential equipment to improve my quality and on infrastructure to manage the most sensitive stages of hatchery manage-ment better. I have saved money.
Is Fish Farming Profitable? 13
Enterprise Budget Data FISH technical staff collected data on production costs and pricing at the dem-onstration and trial farms starting in 2005 and continuing beyond the project end date. Capital investment and operating costs for fish farming are highly variable due to the range of intensity and practices that are available, so no single enterprise budget will serve to answer the question “Is fish farm-ing profitable?” A set of enterprise budget worksheets that allow a farmer to insert prices for their situation was introduced during the 2008 Fish Farmers’ Symposium and distributed on compact disc. The worksheets are also available on the project website www.auburn.edu/fish/interna-tional/uganda. However, after numerous meetings with prospective fish farmers and donors, the commonly asked questions on the economics of fish farming in Uganda can be summarized below. No land costs have been attributed because land prices are so variable. But the information on returns per land area can help an investor decide on fish farming or help a fish farmer decide upon alternative uses of the land.
Capital InvestmentsPond construction costsUsing hand labor for pond construc-tion, and simple implements for ponds of 1,000 square meters surface area and less, a cost of 2,500 USh ($1.38 USD using the exchange rate of 1,800 USh/$) per square meter is used. There have been documented instances of 1,800 USh per square meter as well as much higher construction costs. Use of prison labor is not necessarily less costly than hiring local workers. Proper site selection and sizing of the ponds based upon topography allow for costs to be on the lower range.
Poor understanding of pond construc-tion principles and lack of knowledge on the client’s side lead to excessive pond construction costs. Several farmers and many donors have been tricked into paying well over 5,000 USh per square meter for ponds that do not even meet the minimum quality standards. Construction costs of $0.80 to $1.50 per square meter pond area are typical in East Africa. Poorly constructed ponds cost more to maintain, reduce efficiency of labor, and can lead to wasted feed.
Small cages A 2 x 2 x 2 meter mesh cage costs $80 at Uganda Fishnet Manufacturers. Each production cage should use a double mesh (two cages). In general, a properly sited cage of this size will produce about the same amount of tilapia as a pond of 1,200 square meters: about 1 ton. Ready-made cages with all framing, floats, and double mesh sell for $300 to $500. Lifetime should be estimated as two years. Moor-ing is done in rows and anchors are made of concrete and metal scraps. One set of floats and anchors can moor about ten cages, depending on currents at the site. A small boat to service cages near shore costs $100 to $250.
Operating Costs and ReturnsFood fish production in pondsBased upon use of formulated feed and correct stocking densities, the return above variable costs is 15 to 25 percent of total variable costs, or about 500 USh per kg of fish produced. It can be as low as zero if survival has been low or the feeding has been done poorly. Likewise, it can be great-er than 500 USh/kg if the fish are retailed in a niche market. Feed makes up the ma-jority of the production cost (about 50 to 70
Is Fish FarmingProfitable?
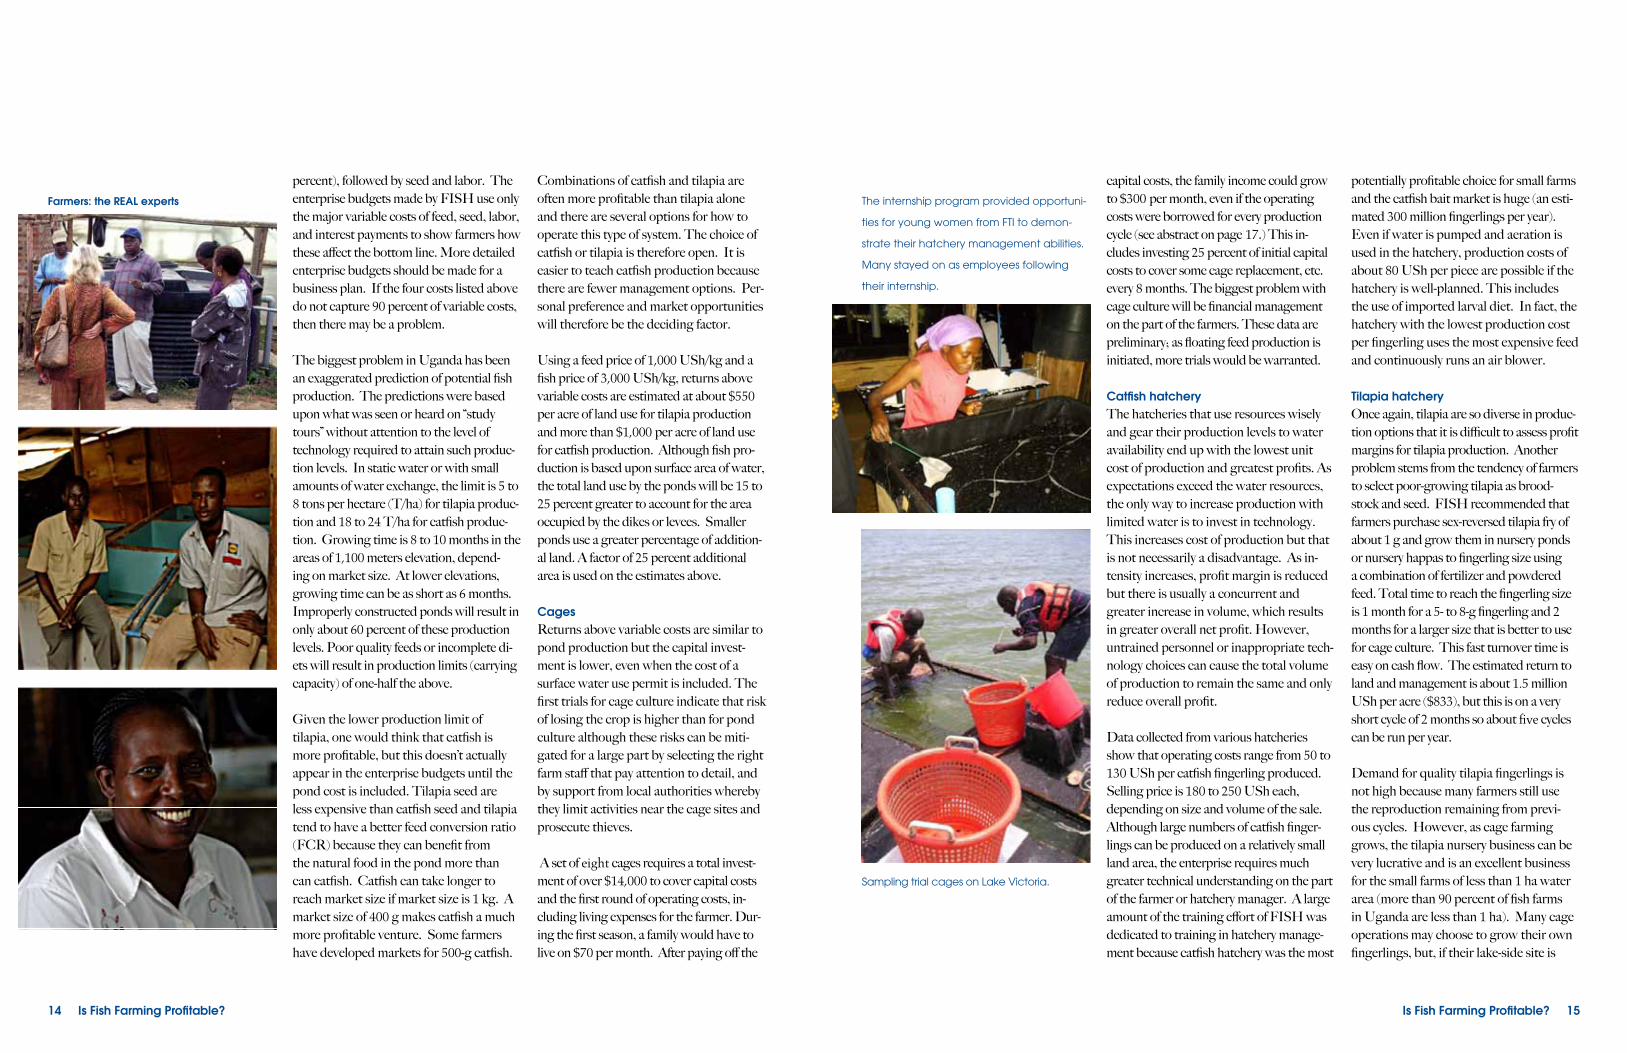
Small, locally-made canoes sell for about $100
and are sufficient for working near-shore sites,
but larger boats with motors are needed for
large-scale cage operations.
Sunfish Farm was the first commercial hatch-
ery in Uganda.
14 Is Fish Farming Profitable?
percent), followed by seed and labor. The enterprise budgets made by FISH use only the major variable costs of feed, seed, labor, and interest payments to show farmers how these affect the bottom line. More detailed enterprise budgets should be made for a business plan. If the four costs listed above do not capture 90 percent of variable costs, then there may be a problem.
The biggest problem in Uganda has been an exaggerated prediction of potential fish production. The predictions were based upon what was seen or heard on “study tours” without attention to the level of technology required to attain such produc-tion levels. In static water or with small amounts of water exchange, the limit is 5 to 8 tons per hectare (T/ha) for tilapia produc-tion and 18 to 24 T/ha for catfish produc-tion. Growing time is 8 to 10 months in the areas of 1,100 meters elevation, depend-ing on market size. At lower elevations, growing time can be as short as 6 months. Improperly constructed ponds will result in only about 60 percent of these production levels. Poor quality feeds or incomplete di-ets will result in production limits (carrying capacity) of one-half the above.
Given the lower production limit of tilapia, one would think that catfish is more profitable, but this doesn’t actually appear in the enterprise budgets until the pond cost is included. Tilapia seed are less expensive than catfish seed and tilapia tend to have a better feed conversion ratio (FCR) because they can benefit from the natural food in the pond more than can catfish. Catfish can take longer to reach market size if market size is 1 kg. A market size of 400 g makes catfish a much more profitable venture. Some farmers have developed markets for 500-g catfish.
Combinations of catfish and tilapia are often more profitable than tilapia alone and there are several options for how to operate this type of system. The choice of catfish or tilapia is therefore open. It is easier to teach catfish production because there are fewer management options. Per-sonal preference and market opportunities will therefore be the deciding factor.
Using a feed price of 1,000 USh/kg and a fish price of 3,000 USh/kg, returns above variable costs are estimated at about $550 per acre of land use for tilapia production and more than $1,000 per acre of land use for catfish production. Although fish pro-duction is based upon surface area of water, the total land use by the ponds will be 15 to 25 percent greater to account for the area occupied by the dikes or levees. Smaller ponds use a greater percentage of addition-al land. A factor of 25 percent additional area is used on the estimates above.
CagesReturns above variable costs are similar to pond production but the capital invest-ment is lower, even when the cost of a surface water use permit is included. The first trials for cage culture indicate that risk of losing the crop is higher than for pond culture although these risks can be miti-gated for a large part by selecting the right farm staff that pay attention to detail, and by support from local authorities whereby they limit activities near the cage sites and prosecute thieves.
A set of eight cages requires a total invest-ment of over $14,000 to cover capital costs and the first round of operating costs, in-cluding living expenses for the farmer. Dur-ing the first season, a family would have to live on $70 per month. After paying off the
Farmers: the REAL experts
Is Fish Farming Profitable? 15
capital costs, the family income could grow to $300 per month, even if the operating costs were borrowed for every production cycle (see abstract on page 17.) This in-cludes investing 25 percent of initial capital costs to cover some cage replacement, etc. every 8 months. The biggest problem with cage culture will be financial management on the part of the farmers. These data are preliminary; as floating feed production is initiated, more trials would be warranted.
Catfish hatcheryThe hatcheries that use resources wisely and gear their production levels to water availability end up with the lowest unit cost of production and greatest profits. As expectations exceed the water resources, the only way to increase production with limited water is to invest in technology.This increases cost of production but that is not necessarily a disadvantage. As in-tensity increases, profit margin is reduced but there is usually a concurrent and greater increase in volume, which results in greater overall net profit. However, untrained personnel or inappropriate tech-nology choices can cause the total volume of production to remain the same and only reduce overall profit.
Data collected from various hatcheries show that operating costs range from 50 to 130 USh per catfish fingerling produced. Selling price is 180 to 250 USh each, depending on size and volume of the sale. Although large numbers of catfish finger-lings can be produced on a relatively small land area, the enterprise requires much greater technical understanding on the part of the farmer or hatchery manager. A large amount of the training effort of FISH was dedicated to training in hatchery manage-ment because catfish hatchery was the most
potentially profitable choice for small farms and the catfish bait market is huge (an esti-mated 300 million fingerlings per year).Even if water is pumped and aeration is used in the hatchery, production costs of about 80 USh per piece are possible if the hatchery is well-planned. This includes the use of imported larval diet. In fact, the hatchery with the lowest production cost per fingerling uses the most expensive feed and continuously runs an air blower.
Tilapia hatcheryOnce again, tilapia are so diverse in produc-tion options that it is difficult to assess profit margins for tilapia production. Another problem stems from the tendency of farmers to select poor-growing tilapia as brood-stock and seed. FISH recommended that farmers purchase sex-reversed tilapia fry of about 1 g and grow them in nursery ponds or nursery happas to fingerling size using a combination of fertilizer and powdered feed. Total time to reach the fingerling size is 1 month for a 5- to 8-g fingerling and 2 months for a larger size that is better to use for cage culture. This fast turnover time is easy on cash flow. The estimated return to land and management is about 1.5 million USh per acre ($833), but this is on a very short cycle of 2 months so about five cycles can be run per year.
Demand for quality tilapia fingerlings is not high because many farmers still use the reproduction remaining from previ-ous cycles. However, as cage farming grows, the tilapia nursery business can be very lucrative and is an excellent business for the small farms of less than 1 ha water area (more than 90 percent of fish farms in Uganda are less than 1 ha). Many cage operations may choose to grow their own fingerlings, but, if their lake-side site is
Sampling trial cages on Lake Victoria.
The internship program provided opportuni-
ties for young women from FTI to demon-
strate their hatchery management abilities.
Many stayed on as employees following
their internship.
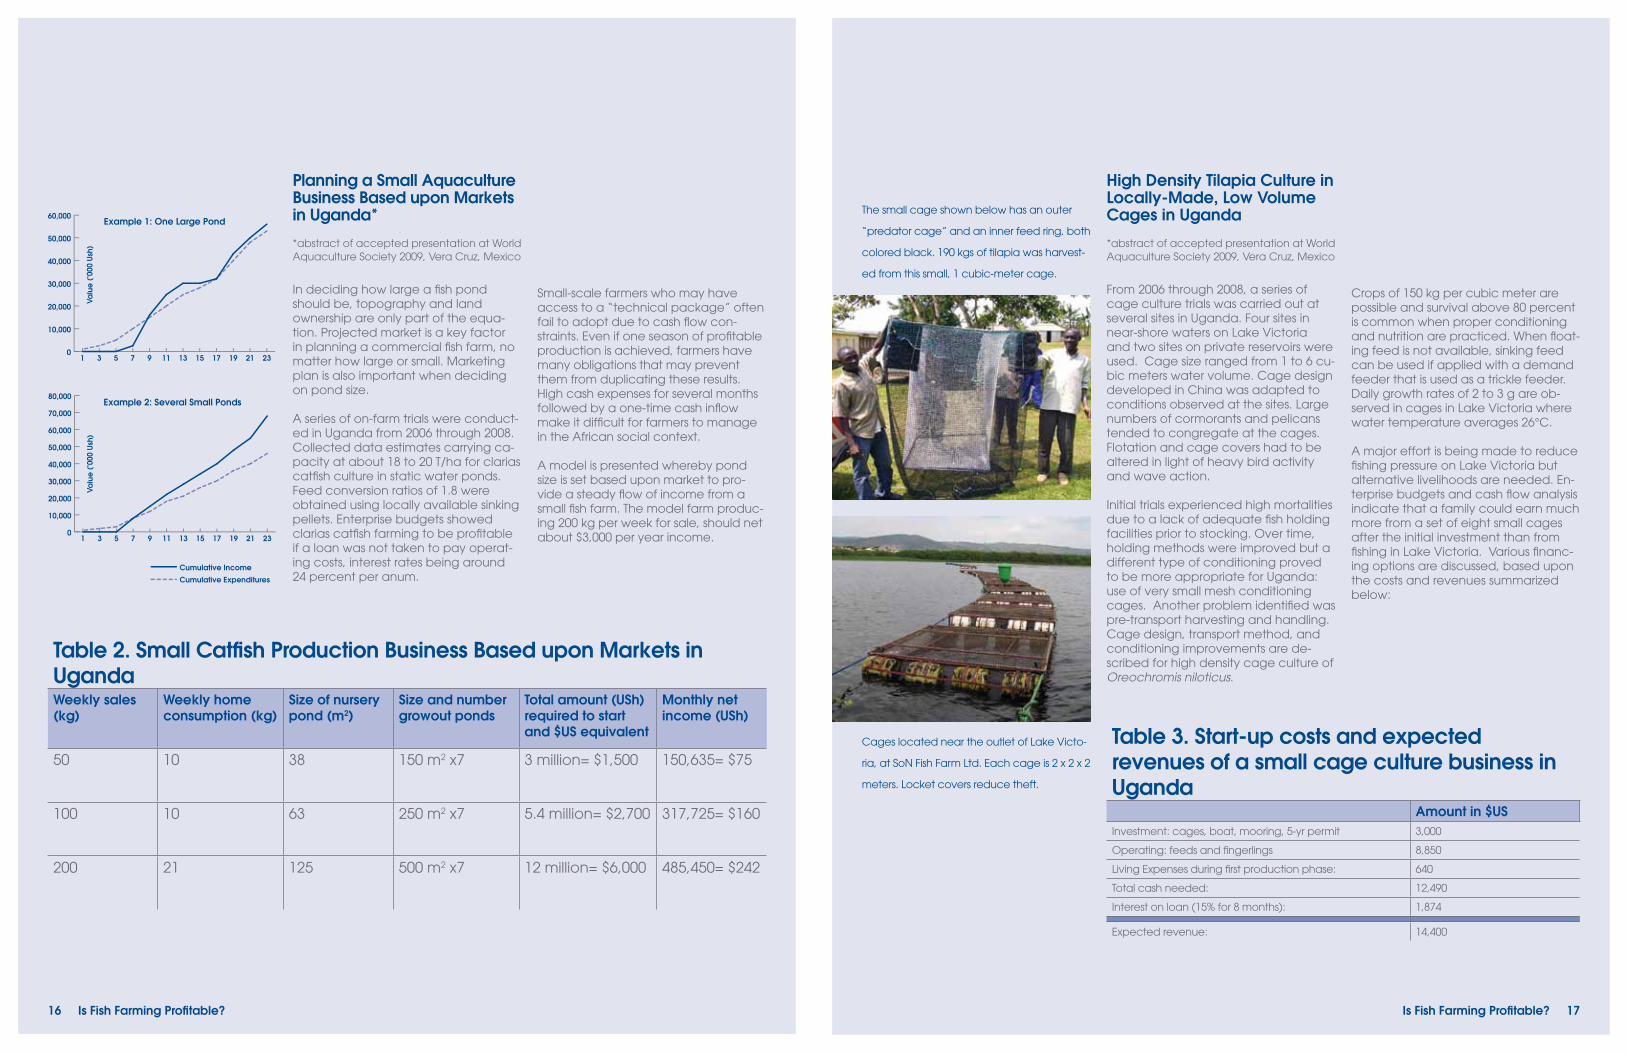
Planning a Small Aquaculture Business Based upon Markets in Uganda*
*abstract of accepted presentation at World Aquaculture Society 2009, Vera Cruz, Mexico
In deciding how large a fish pond should be, topography and land ownership are only part of the equa-tion. Projected market is a key factor in planning a commercial fish farm, no matter how large or small. Marketing plan is also important when deciding on pond size.
A series of on-farm trials were conduct-ed in Uganda from 2006 through 2008. Collected data estimates carrying ca-pacity at about 18 to 20 T/ha for clarias catfish culture in static water ponds. Feed conversion ratios of 1.8 were obtained using locally available sinking pellets. Enterprise budgets showed clarias catfish farming to be profitable if a loan was not taken to pay operat-ing costs, interest rates being around 24 percent per anum.
Small-scale farmers who may have access to a “technical package” often fail to adopt due to cash flow con-straints. Even if one season of profitable production is achieved, farmers have many obligations that may prevent them from duplicating these results. High cash expenses for several months followed by a one-time cash inflow make it difficult for farmers to manage in the African social context.
A model is presented whereby pond size is set based upon market to pro-vide a steady flow of income from a small fish farm. The model farm produc-ing 200 kg per week for sale, should net about $3,000 per year income.
Table 2. Small Catfish Production Business Based upon Markets in UgandaWeekly sales (kg)
Weekly home consumption (kg)
Size of nursery pond (m2)
Size and numbergrowout ponds
Total amount (USh) required to start and $US equivalent
Monthly net income (USh)
50 10 38 150 m2 x7 3 million= $1,500 150,635= $75
100 10 63 250 m2 x7 5.4 million= $2,700 317,725= $160
200 21 125 500 m2 x7 12 million= $6,000 485,450= $242
16 Is Fish Farming Profitable?
0
10,000
20,000
30,000
40,000
50,000
60,000Example 1: One Large Pond
Valu
e (
’000
Ush
)
2321191715131197531
0
10,000
20,000
30,000
40,000
50,000
60,000
70,000
80,000
Cumulative Income
Cumulative Expenditures
2321191715131197531
Example 2: Several Small Ponds
Valu
e (
’000
Ush
)
Cages located near the outlet of Lake Victo-
ria, at SoN Fish Farm Ltd. Each cage is 2 x 2 x 2
meters. Locket covers reduce theft.
The small cage shown below has an outer
“predator cage” and an inner feed ring, both
colored black. 190 kgs of tilapia was harvest-
ed from this small, 1 cubic-meter cage.
High Density Tilapia Culture in Locally-Made, Low Volume Cages in Uganda
*abstract of accepted presentation at World Aquaculture Society 2009, Vera Cruz, Mexico
From 2006 through 2008, a series of cage culture trials was carried out at several sites in Uganda. Four sites in near-shore waters on Lake Victoria and two sites on private reservoirs were used. Cage size ranged from 1 to 6 cu-bic meters water volume. Cage design developed in China was adapted to conditions observed at the sites. Large numbers of cormorants and pelicans tended to congregate at the cages. Flotation and cage covers had to be altered in light of heavy bird activity and wave action.
Initial trials experienced high mortalities due to a lack of adequate fish holding facilities prior to stocking. Over time, holding methods were improved but a different type of conditioning proved to be more appropriate for Uganda: use of very small mesh conditioning cages. Another problem identified was pre-transport harvesting and handling. Cage design, transport method, and conditioning improvements are de-scribed for high density cage culture of Oreochromis niloticus.
Crops of 150 kg per cubic meter are possible and survival above 80 percent is common when proper conditioning and nutrition are practiced. When float-ing feed is not available, sinking feed can be used if applied with a demand feeder that is used as a trickle feeder. Daily growth rates of 2 to 3 g are ob-served in cages in Lake Victoria where water temperature averages 26°C.
A major effort is being made to reduce fishing pressure on Lake Victoria but alternative livelihoods are needed. En-terprise budgets and cash flow analysis indicate that a family could earn much more from a set of eight small cages after the initial investment than from fishing in Lake Victoria. Various financ-ing options are discussed, based upon the costs and revenues summarized below:
Is Fish Farming Profitable? 17
Table 3. Start-up costs and expectedrevenues of a small cage culture business in Uganda
Amount in $USInvestment: cages, boat, mooring, 5-yr permit 3,000
Operating: feeds and fingerlings 8,850
Living Expenses during first production phase: 640
Total cash needed: 12,490
Interest on loan (15% for 8 months): 1,874
Expected revenue: 14,400

18 Feed and Seed
inappropriate, a nearby farmer could capi-talize on this opportunity.
FeedsFish feed production and training farmers how to use and evaluate feeds were a major activity of FISH. Farmers report that this is the most useful information obtained from FISH. Prior to FISH, “consultants” would go the farms, mix feeds in secret, and require the farmer to hire them for each batch of feed mixing. The feeds promoted by most advisors were based on maize bran with added dried mukene and some oilseed cake. Vitamin premixes specific for fish were not available in Uganda and, as a result, vitamin deficiencies were evident, especially in catfish fed home-made feeds. Farmers did not know how to tell if they were getting appropriate feed. Feeds made at such small scale on the farm usually cost almost double factory-made feed and were highly variable in quality because the farm workers did not have sufficient background to know how to change formula if a particular ingredient was in short supply. In 2005, two feed mills were producing pellets that were sold as fish feed but their formulations were based upon what they knew about poultry. Protein levels were inadequate and pellet integrity was poor.
Activities to address the feeds problem1. Fish feed specialist Dr. Allen Davis
visited Uganda annually to help train farmers and advisors on fish feed making, evaluation and management.
2. Early efforts brought together individu-als interested in selling, making, and using feed to examine the possibilities for a modern fish feed plant to begin in Uganda. The resulting proceedings have been a useful reference document for many fish farm investors and potential feed mill investors.
3. In March 2006, Ugachick Poultry Breeders Ltd., with FISH help in formulation, began making sinking pellets at two different protein levels. A vitamin premix was imported by FISH and provided to Ugachick for the first 6 tons of sinking feed. After that, Ugachick was able to source its own premix that included stabilized vitamin C.
4. FISH imported floating fish feed from the U.S. to use as a demonstra-tion and to compare with the locally-made sinking fish feed.
5. FISH staff began trials with farm-ers to test the imported floating and the locally-made sinking feeds and develope advisory brochures on how to best use the feeds. Feeding charts were made to indicate daily amounts to feed fish and then adjusted based upon results obtained on the farms. Three iterations of the charts were made. The most recent version was distributed in September 2008.
6. The majority of the Strategic Activi-ties Funds was devoted to improving the fish feed-making capacity of the country because of its importance to aquaculture development. This included an evaluation of three com-panies’ potential for manufacture of floating fish feed.
Nuvita (Jinja) attempted to make fish feed in 2007 and did so for a few months until the dies in their pellet mill were destroyed by equipment failures. Source of the Nile (SoN) Fish Farm began making its own feed in 2008. Some advice and equipment was provided by the FISH. However, as a member of the Commercial Aquaculture Producers of Africa, SoN farm will now begin receiving advice from a fish feeds
Feed and Seed
One problem in teaching fish farming is that
the crop is not always visible. Use of floating
fish feed allows farmers to see their animals
at feeding time and to know when the
fish have ceased feeding, thus preventing
wasted feed.
Uganda has the major ingredients for fish
feed manufacture although a source of
solvent-extracted soybean meal would make
fish feed and other animal feed production
much more competitive.FISH Successes
• Development of the first quality com-
mercial pelleted fish feeds manufac-
tured in Uganda and specifically formu-
lated for tilapia and clarias catfish using
mostly locally available ingredients
• Instrumental in introducing feed extru-
sion technology and its adoption by a
local fish feed mill providing opportunity
for rapid expansion of feed-based pro-
duction, particularly cage farming
• Increased access to imported special-
ized catfish larval diets for hatcheries
• Improvement in the quality of tilapia seed
through assistance to private selective
breeding programs; the improved seed is
now available and currently sold as fry to
out-growers around the country, grown
in nursery ponds to fingerlings, and sold to
production farmers
• Increase in the number of catfish
fingerlings produced and the number
of hatcheries, with the most successful
ones advised by FISH
Feed and Seed 19
specialist funded under CDE. Although SoN farm makes small amounts of feed, the farm was able to supply feed to other farmers after Ugachick had machinery problems and could not supply sufficient quality feed to meet demand. SoN farm has the ability to make small amounts of specialty feeds that are now being tested at catfish hatcheries. Tilapia farmers who switched to SoN feed (which sinks slowly) reported much better feeding response and growth rates compared to the faster-sinking Ugachick feed. FISH’s justification for assisting a second feed manufacturer was to have another alterna-tive source, which proved useful when the Ugachick mill was down for repairs.
The latest set of proximate analyses indicated that SoN feed was correct in its protein levels and that Ugachick’s levels were about 2 percent lower than its targeted 30 percent protein. The difference can be explained by the mukene (freshwater sardines) used in the feeds. SoN uses fresh mukene and therefore does not have problems with sand and gravel adultera-tions. Ugachick functions at a much higher throughput and cannot obtain fresh mukene in the amounts required by the factory; so, it has been forced to purchase dried mukene. Attempts at quality control have been made but mukene vendors are difficult to convince. The majority of the mukene in the formulation should eventually be replaced by soybean meal. Ugachick plans to source the first solvent extracted soybean meal made in Rwanda from a factory to be commissioned in 2009. Another possibility is protein concentrate from chicken hatchery wastes. Additional machinery would have to be installed at Ugachick to make a safe protein concentrate. The machinery has been identified but the company is not able
to make the $150,000 purchase at this time.
Recently, another fish feed has hit the market. The feed does not meet any of the quality standards. It is not pelleted and does not appear to be cooked, nor is it compounded. Proximate analysis shows protein at 20 percent (it is advertised as being >30 percent protein) and fiber to be very high. The fiber part of the feed floats whereas the higher protein portions sink. High fiber in fish feeds results in lower digestibility of protein. Fortunately, the farmers who have benefitted from FISH training are able to recognize that the feed is not the required quality. Farmers who were not trained by FISH may not be able to evaluate the feed adequately.
Following the feeds symposium held in 2006, Balton Uganda began importing small amounts of specialized feed required to wean catfish from live feed to manufac-tured feed. They import about 3 tons at a time and then repackage it into smaller bags. This allows farmers who do not need an entire bag of weaner diet to try small amounts of this rather expensive feed. A total of 18 tons has been imported by Balton Uganda since mid 2006. The feed supplier, RMC feeds of Israel, has requested FISH to suggest likely partners for a feed mill in Uganda. The catfish weaner diets have allowed hatcheries to increase their output considerably because the high quality feed does not pollute the water as much as the home-made diets did.
The fish feeds issue is by no means resolved. An extruder is currently being installed and will likely begin production in June 2009. Although the formula used in the currently produced sinking pellets can be transferred

20 Feed and Seed
over to the extruded floating pellets, a better formula has been proposed that uses ingre-dients that are more consistent in quality and will reduce wear and tear on the new equipment. FISH staff was instrumental in assisting Ugachick to access funding from the CDE for additional technical advisory help. CDE is providing a 35,000 Euro grant to Ugachick for technical assistance and training of its equipment operators.
Frequent equipment failures have limited feed production, which in turn has limited demand because some farmers ceased
purchasing feed when it became too difficult to source. Ugachick planned to produce 10 tons per week but was never able to do so. In addition, price of feed almost doubled in 2008. This was a worldwide phenomenon and all animal feed prices experienced a simi-lar or even greater increase. Fortunately for Ugandan fish farmers, fish prices increased as well. However, the sudden increase caught many farmers unaware and those who did not have steady fish sales could not source the cash to pay for the feed needed to finish growing their fish.
Both Ugachick and Nuvita had machine breakdowns because their staff did not know how to operate the machinery, because of unreliable power, and contami-nation of feed ingredients with stones and
nails that overwhelmed their screens and magnets. Access to unadulterated ingre-dients of consistent quality will continue to be a problem for feed manufacturers for many years, because the ingredients are sourced from thousands of small farmers and often consolidated by middlemen who have more concern for profit than for qual-ity. There are many stories of middlemen adding two shovel-fulls of sand to every bag of dried mukene just to increase the weight . Ugachick and some of the other feed manufacturers know that their best option is to source ingredients through
farmers’ groups that can exert some level of quality control over their members.
Sale of fish feed is likely to be an important indicator of commercial aquaculture pro-duction and will be a much easier indicator to measure than individual farm produc-tion records. However, to translate from feed sales to fish production, the feed con-version ratio (FCR) must be reliably esti-mated. The FCR is the total kilogram (kg) of feed used to produce one kg net gain in fish weight. Using 2 as a feed conver-sion ratio may work for Uganda because FISH staff found that many farmers obtain between 1.5 and 2.3 FCR. Farmers who obtain greater than 2.3 will likely not make much profit and will not be able to stay in business unless otherwise subsidized.
New USAID project and other donors can
help further the development of the fish feed
sector by:
• Helping Ugachick, SoN, and any other
interested feed maker to source maize
and soya products from farmers’
groups; this should also greatly benefit
the farmers
• Funding technical assistance to Ugach-
ick for quality assurance in feed manu-
facture and training of its vendors, so,
they will provide reliable advice to fish
farmers
• Direct purchase feed from reliable feed
makers for use in trials and demonstra-
tions, especially where cage culture is
concerned (as opposed to providing a
grant to farmers to source their own feed)
• Assist farmers to purchase and store
feed in large amounts, so, they can get
bulk discounts or make savings on trans-
port, especially in Northern Uganda
• Conduct spot checks on feed quality
and proximate analysis of feeds from all
fish feed manufacturers
• Assist interested companies in process-
ing their poultry offals and hatchery
wastes to make protein concentrates
instead of burying them, which is the
usual means of disposal
Table 4. Local Fish Feed Production (Metric-Tons) by Ugachick and Other ManufacturersYear Ugachick Other Total Tons
FY 2005 0.5 0.5
FY 2006 55.9 55.9
FY 2007 185.73 10.3 (Nuvita) 196.03
FY 2008 209.47 51.1 (mostly SoN) 260.57
Feed and Seed 21
Feed-based fish culture is not for every-body. Tilapia can grow on natural food present in a pond and catfish can as well, but to a much lesser extent. This natural food can be enhanced by adding fertilizer to the pond. Chemical fertilizers such as urea and diammonium phosphate as well as manures and agricultural byproducts
can be used to provide the nutrients that promote production of natural food in the pond. However, the levels of fish produc-tion possible from these inputs are consider-ably lower than for feed-based aquaculture. Once the value of the land and cost of pond construction is taken into account, the fertilizer-based production option
Water stability test for pellets: After 15 minutes,
the pellets on the left fell apart, whereas the
pellets on the right held their form.
Fish feed pellets of variable size are a result of
improper, or lack of, cutter placement on the
machines. Most of these pellets would not be
consumable by tilapia.
Extruded, floating feed generally results in a 25 percent improvement in feed conversion
ratio (FCR) because the feed is ground more finely and cooked, allowing for better digest-
ibility. However, in Uganda, extruded feed results in 40 percent or more improvement in FCR
because it is easier for the farmer to see how the fish are feeding and less feed is wasted.
Better utilization of feed leads to higher profits and increases the carrying capacity of ponds
because less waste enters the water.
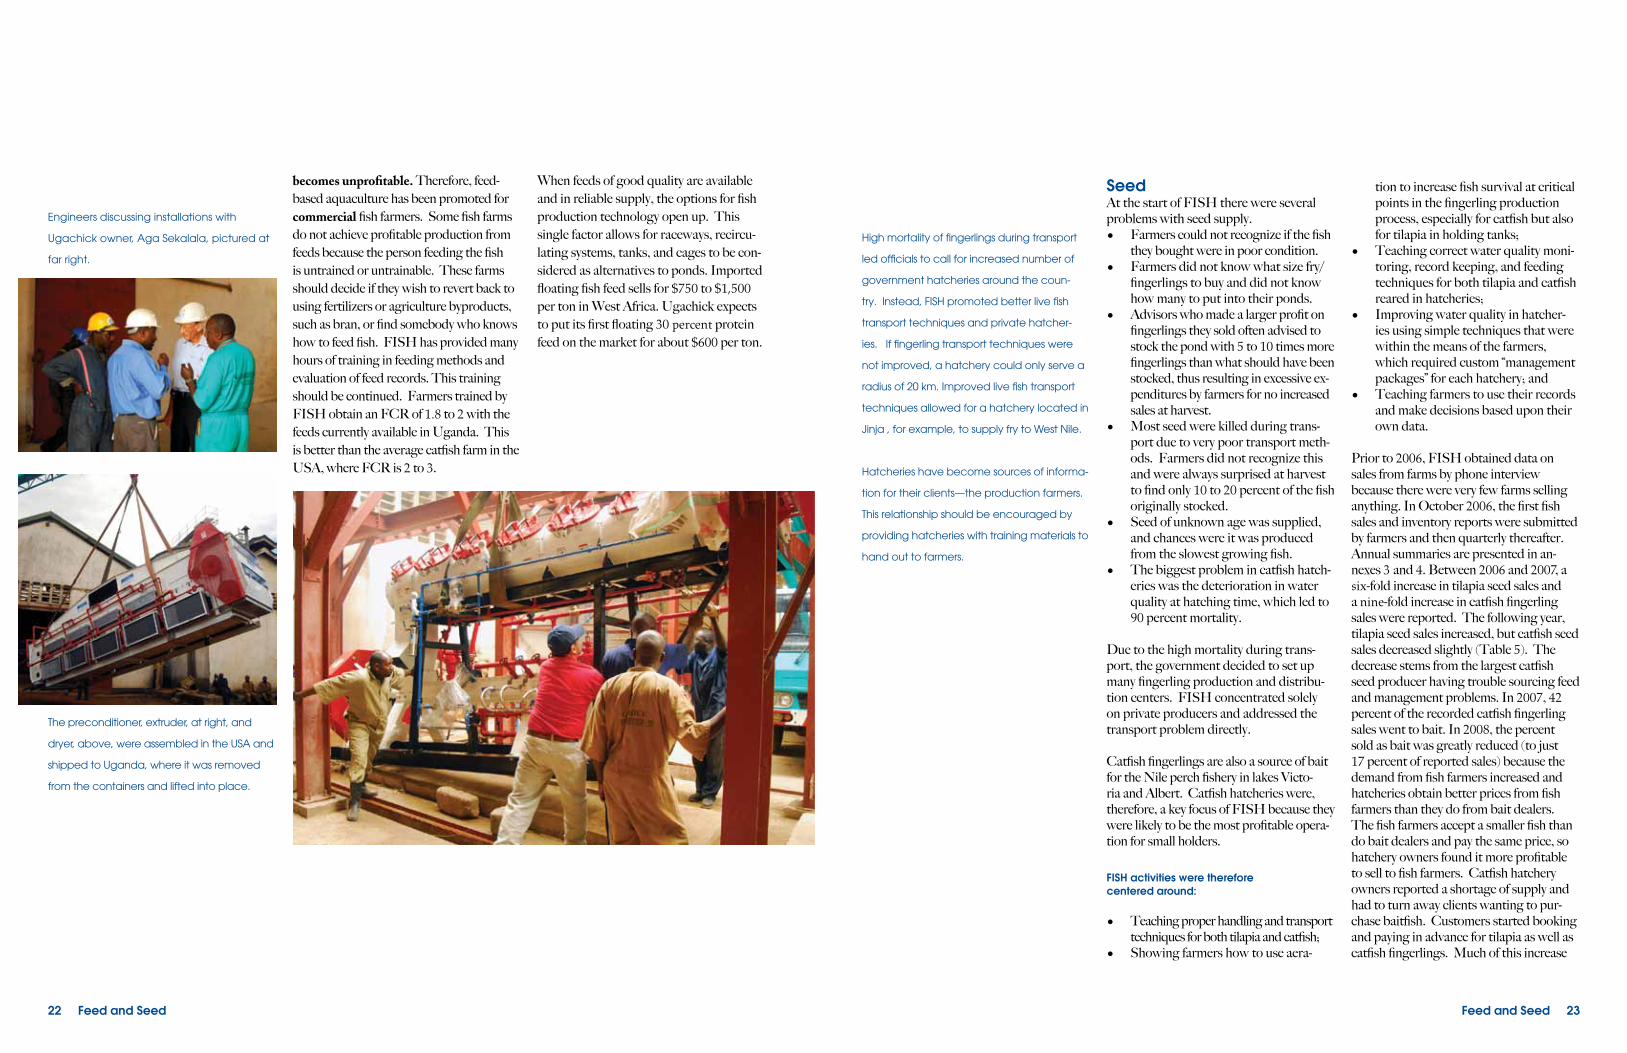
Engineers discussing installations with
Ugachick owner, Aga Sekalala, pictured at
far right.
The preconditioner, extruder, at right, and
dryer, above, were assembled in the USA and
shipped to Uganda, where it was removed
from the containers and lifted into place.
becomes unprofitable. Therefore, feed-based aquaculture has been promoted for commercial fish farmers. Some fish farms do not achieve profitable production from feeds because the person feeding the fish is untrained or untrainable. These farms should decide if they wish to revert back to using fertilizers or agriculture byproducts, such as bran, or find somebody who knows how to feed fish. FISH has provided many hours of training in feeding methods and evaluation of feed records. This training should be continued. Farmers trained by FISH obtain an FCR of 1.8 to 2 with the feeds currently available in Uganda. This is better than the average catfish farm in the USA, where FCR is 2 to 3.
When feeds of good quality are available and in reliable supply, the options for fish production technology open up. This single factor allows for raceways, recircu-lating systems, tanks, and cages to be con-sidered as alternatives to ponds. Imported floating fish feed sells for $750 to $1,500 per ton in West Africa. Ugachick expects to put its first floating 30 percent protein feed on the market for about $600 per ton.
22 Feed and Seed Feed and Seed 23
SeedAt the start of FISH there were several problems with seed supply.• Farmers could not recognize if the fish
they bought were in poor condition.• Farmers did not know what size fry/
fingerlings to buy and did not know how many to put into their ponds.
• Advisors who made a larger profit on fingerlings they sold often advised to stock the pond with 5 to 10 times more fingerlings than what should have been stocked, thus resulting in excessive ex-penditures by farmers for no increased sales at harvest.
• Most seed were killed during trans-port due to very poor transport meth-ods. Farmers did not recognize this and were always surprised at harvest to find only 10 to 20 percent of the fish originally stocked.
• Seed of unknown age was supplied, and chances were it was produced from the slowest growing fish.
• The biggest problem in catfish hatch-eries was the deterioration in water quality at hatching time, which led to 90 percent mortality.
Due to the high mortality during trans-port, the government decided to set up many fingerling production and distribu-tion centers. FISH concentrated solely on private producers and addressed the transport problem directly.
Catfish fingerlings are also a source of bait for the Nile perch fishery in lakes Victo-ria and Albert. Catfish hatcheries were, therefore, a key focus of FISH because they were likely to be the most profitable opera-tion for small holders.
FISH activities were therefore centered around:
• Teaching proper handling and transport techniques for both tilapia and catfish;
• Showing farmers how to use aera-
tion to increase fish survival at critical points in the fingerling production process, especially for catfish but also for tilapia in holding tanks;
• Teaching correct water quality moni-toring, record keeping, and feeding techniques for both tilapia and catfish reared in hatcheries;
• Improving water quality in hatcher-ies using simple techniques that were within the means of the farmers, which required custom “management packages” for each hatchery; and
• Teaching farmers to use their records and make decisions based upon their own data.
Prior to 2006, FISH obtained data on sales from farms by phone interview because there were very few farms selling anything. In October 2006, the first fish sales and inventory reports were submitted by farmers and then quarterly thereafter. Annual summaries are presented in an-nexes 3 and 4. Between 2006 and 2007, a six-fold increase in tilapia seed sales and a nine-fold increase in catfish fingerling sales were reported. The following year, tilapia seed sales increased, but catfish seed sales decreased slightly (Table 5). The decrease stems from the largest catfish seed producer having trouble sourcing feed and management problems. In 2007, 42 percent of the recorded catfish fingerling sales went to bait. In 2008, the percent sold as bait was greatly reduced (to just 17 percent of reported sales) because the demand from fish farmers increased and hatcheries obtain better prices from fish farmers than they do from bait dealers. The fish farmers accept a smaller fish than do bait dealers and pay the same price, so hatchery owners found it more profitable to sell to fish farmers. Catfish hatchery owners reported a shortage of supply and had to turn away clients wanting to pur-chase baitfish. Customers started booking and paying in advance for tilapia as well as catfish fingerlings. Much of this increase
High mortality of fingerlings during transport
led officials to call for increased number of
government hatcheries around the coun-
try. Instead, FISH promoted better live fish
transport techniques and private hatcher-
ies. If fingerling transport techniques were
not improved, a hatchery could only serve a
radius of 20 km. Improved live fish transport
techniques allowed for a hatchery located in
Jinja , for example, to supply fry to West Nile.
Hatcheries have become sources of informa-
tion for their clients—the production farmers.
This relationship should be encouraged by
providing hatcheries with training materials to
hand out to farmers.

24 Feed and Seed
in demand can be explained by the com-mencement of the African Development Bank-funded assistance to commercial fish farmers. Many fish farmers received grants to purchase inputs such as feed and seed for their farms.
Although Uganda has considerable capac-ity to produce seed of tilapia and catfish,
any sudden increase in demand will lead to momentary shortages as farmers gear up their production. This is not very differ-ent from any other agriculture commod-ity. Hatcheries will likely lack capital to suddenly increase seed production unless payment is made in advance.
Remaining Opportunities
• A model catfish hatchery still does not
exist in Uganda. A hatchery that uses
power and one that functions without
power should be constructed to func-
tion as models. Government hatcheries
should not be encouraged and cannot
function as models because they are
not set-up to operate profitably.
• Donor-funded programs are often the
promoters of unreasonably high stock-
ing densities and do not insist on high
quality fingerlings. This is often because
the advisors working for the donors are
taking an undeclarated commission on
the fingerling prices.
• Every fish farm does not need its own
hatchery. However, to assure quality
seed, fish farmers could get together
and share ownership in a hatchery for
their own needs.
• As cage culture increases, there will be
more need for large tilapia fingerlings.
The small farms that cannot make a prof-
it on food-size fish could be re-worked
to function as tilapia nurseries for a
particular locale. This would allow for the
spread of selectively bred fish in Uganda
and all-male tilapia fry produced by
one farm to other farms when the fry are
small enough to be transport in large
numbers. It also spreads the profit.
• After the feeds problem is resolved,
some work on selective breeding of
catfish would further help the catfish
farmers.
• A few hatcheries that produce millions
of selectively-bred fry for distribution to
hundreds of nursery outgrowers allows
for quality assurance as well as spread-
ing the benefits to a large segment of
the population.
Table 5. Sales of Fry and Fingerlings from Farms Reporting to FISH*
Tilapia Fry andFingerlings
Clarias Catfish Fry andFingerlings
Year Number farms reporting sales
Number sold Number farms reporting sales
Number sold
2006 4 38,000 3 181,393
2007 6 223,759 8 1,618,267
2008 10 747,616 9 973,556
* Numbers provided are sales only and do not account for anything used on the farm.
Frequent grading of catfish (every
7-14 days) is recommended to
reduce cannibalism. However, this
can be very stressful for the fish.
Many training programs were held
to teach hatchery staff proper fish
handling procedures.
Farmer-Driven Advisory Services and Training 25
Who are the Advisors?The variety of information sources used by fish farmers was examined in a study con-ducted by two NaFIRRI staff (Atukunda and Walakira 2008). FISH was a major
supplier of information, especially if one considers that the “fellow farmers” referred to in the report are FISH demonstra-tion farmers. This study was limited to Central and Eastern regions, where FISH was most active. Western and Northern regions would probably show similar types of information sources, but the percent of farmers using FISH as a source would likely be lower.
Train advisors or train farmers?In an effort to privatize the extension service, the NAADS had implemented a program whereby districts selected the services they need and NAADS contracted private extension agents to provide advisory services in a cost-sharing arrangement with the private producers. A few aquaculture advisors were contracted this way for a short time. Fisheries Officers based in the districts were expected to serve as extension
advisors but they were not under NAADS. They were not even under the Depart-ment of Fisheries Resources (DFR) but answered to their respective districts as per the new “decentralization” policy. Fisheries Officers lack direct experience in commer-cial-scale aquaculture and there was no mechanism whereby they could be trained and supervised to give appropriate com-mercial aquaculture advice. In addition, the job of a Fisheries Officers is to enforce the fishing regulations, which does not engen-der the trust required to conduct extension activities. Therefore, no direct attempt was made to exclusively train Fisheries Officer, but they were invited to trainings. In ad-dition, a small scholarship fund was set up under the Umoja training grant (Annex 7) to cover lodging fees for Fisheries Officers who wished to attend multiple-day train-ings. One fisheries officer from Koboko, (West Nile) benefitted from this.
Much of the advice on substandard con-struction methods, high stocking densities, poor fingerling transport methods and poor feed formulation originated with fisheries officers and some NARO offices. Farmers had lost confidence in government advisory services. However, private advisors were also difficult to control. To make matters worse, many government staff operated as “private” advisors, often during their normal working hours. In an effort to compete for the best-paying clients, personnel who are supposed to share information often hid it from their colleagues.
Another problem that arose was that investors did not do their homework when sourcing advisors and often believed the people who predicted the highest output for the least inputs. FISH therefore print-ed a list of criteria to use when selecting
Farmer-Driven AdvisoryServices and Training
Internet
Source of Information
International Trainings
Other Projects/Universities
FISH Project Staff
Posters
Brochures
Radio
Fellow Farmers
ARDC Kajjansi
Government/District Service Providers
Private Service Provider
2% 2% 11%
11%
11%
17%2%2%2%
36%
4%

Thanks to farmers cost-sharing to sup-
ply their own transport and the on-farm
locations of most trainings, more than 4,000
trainee-days was achieved for a total
expenditure of less than $20,000 USD, not
counting staff salaries.
26 Farmer-Driven Advisory Services and Training
an advisor or farm manager. These criteria were much appreciated by the farmers but less so by the advisors.
Farmers became very insistent to have their own training and were prepared to help in organizing training sessions. FISH implemented a policy whereby farmers or other training candidates arrived at the training sites by their own means and, arranged their own overnight accomoda-tions. FISH provided the mid-day meal during the training program and did not charge any training fees. Private advisors and Fisheries Officers were accorded similar treatment. The subject areas were largely determined by the farmers.
FISH was overwhelmed by requests for training from people who really wanted information and were prepared to use their time and some small amount of money to get it: farmers and students.
Due to the location of the demonstration farms and the main goals of FISH, most training was held in Wakiso, Mukono, or Iganga. However, interest in training was high all around the country. Farmers from far away had to pay too much for travel if only a 1-day session was going to be held.
Therefore, some 3- to 5-day programs were implemented. For this, lodging near the training site (fish farm) had to be avail-able. A grant was provided to Umoja farm to overcome this constraint. Two other farms, Interfish and SoN fish farms, are in the process of installing housing for pro-spective trainees and interns. FISH was never meant to cover the entire country, so an effort could not be made to expand its training arm.
Training Activities
A variety of training opportunities were offered, as described below.
1. All STTA’s (Annex 8) gave one to three seminars per visit, open to uni-versity, NaFIRRI, and other research-ers and students.
2. On-farm training sessions were provided in pond construction and renovation, feeding, fish handling, hatchery management, farm machine maintenance, harvesting techniques, fish transport, fish smoking, etc. All of these had some time for classroom instruction, but the majority of time was spent in the field. FISH used bulk cell phone texting services to send out reminders and announce the training sessions.
3. Workshops/consultative sessions usually began with some presenta-tions that imparted information and then encouraged discussions and decisions on problem solving. The proceedings were assembled and published for the fish feeds and the fish health consultative sessions and are available on the FISH website.
Table 6. Person-days of Training, 2006-2008
Year Number ofTraining Events
FemaleTrainee-days
MaleTrainee- days
Totalby Year
2006 51 374 915 1,289
2007 27 529 1,024 1,553
2008 42 637 1,491 2,128
Total 120 1,540 3,430 4,970
An estimated 1,200 different individuals attended these trainings. They came from 55 different districts; however, new districts were being created every year so this is probably an underestimate. Pre-intern training is counted as trainee-days but not the internship program itself. Attendance at the Fish Farm-ers Symposia is counted as training days. A full log of training is in Annex 5.
Farmer-Driven Advisory Services and Training 27
4. Fish farmers’ symposia and trade shows were held in 2007 and 2008. The first was for one day only and included presentations from all of the demonstra-tion farms. Attendance was free and open to all and attendees were on their own for lunch. Presenters were pro-vided a “working lunch.” A few tables were set up in the conference room to display products and services available to fish farmers, such as feed and cages. Total attendance was 215. The second symposium was held for two days and required a paid attendance. FISH co-sponsored the symposium with Walimi Fisheries Cooperative Society (WA-FICOS fish farmers’ group). A trade exhibition was held in a tent outside the conference room. Total number of paying attendees was 172. An esti-mated 100 more stopped in at the trade show and some sat in on a few sessions without registering.
5. An internship program was devel-oped in response to intense pressure and need on the part of the Fisheries Training Institute, FTI. In 2005-06, the drawbacks of the FTI curriculum and lack of field practice were ad-dressed by FISH. There were also several complaints by farmers that FTI students were “flooding the training programs.” So, an internship program was devised in which FTI students would be placed on farms after their diplomas were awarded. However, the students did not have the field expertise needed to be useful to the farms; so, they were given a 3-week intensive training by FISH staff. Twenty one students asked to attend the course; some were even graduates of Makerere University. After the first week, it became apparent
that the group was too large, so it was broken into three groups of seven. Each group attended the second two weeks in succession.
As the first group was finishing its second week of instruction on pond construction at SoN Fish Farm, five trainees decided to take a job offer from the farm. The best trainees who fin-ished the 3-week program and who did not have to return to FTI for their last year were taken on as project interns to work at assigned farms for one year. A contract was made between the intern and the farmer. Interns were required to remain at a particular farm for at least 6 months after which they could switch farms if they wished. Three interns who did not perform sufficiently were removed from the program.
The fact that FTI would graduate students who could not go directly to farms without a re-training program meant that FTI needed help as well. The internship program had some minor problems but was considered a success overall. Therefore, a second round of internships was proposed, but this time through an SAF grant to FTI. FISH was concerned that the FTI instructors would not be sufficiently qualified to oversee the interns; so, it included funds to al-low them to attend some intensive training sessions. In addition, some funds were provided for FTI to set up a teaching hatchery. Some of the interns had been attendees of the earlier intern training sessions held in 2006; so, they had more background than the first group.
FISH Successes
• Developed of trained fish farm workers
and managers through internship pro-
grams, mostly from the Fisheries Training
Institute and to some extent from other
universities.
• Increased in the number of experi-
enced and qualified advisors, most of
whom are actual fish farmers.
• Implemented a profitable hatcheries
and fish farms in Uganda as models for
interested investors. Simplified record
keeping allowed farmers to conduct
self-evaluations of farming practices
and make wise decisions based upon
projected returns on investments.
• Development and wide distribution
of aquaculture training handouts and
manuals based upon local conditions
and actual data from farms.
• Assisted in the approval by National
Drug Authority of the importation of
products used for sex reversal of tilapia,
making Uganda one of the few African
countries to have them approved.
• Assisted two fish farmers’ organizations
with 161 total members to provide ad-
visory services and fish harvesting and
marketing services.
• Initiated an annual fish farmers’ sympo-
sium and trade show and published the
presentations on CD and on a website.
• Provision of “one stop shopping” for
information on permitting, fish farm
equipment and supply sources, quali-
fied aquaculture personnel, and per-
tinent data on water and soil quality.
The Uganda Investment Authority and
the Department of Fisheries Resources
both planned to perform this service
but have yet to implement.
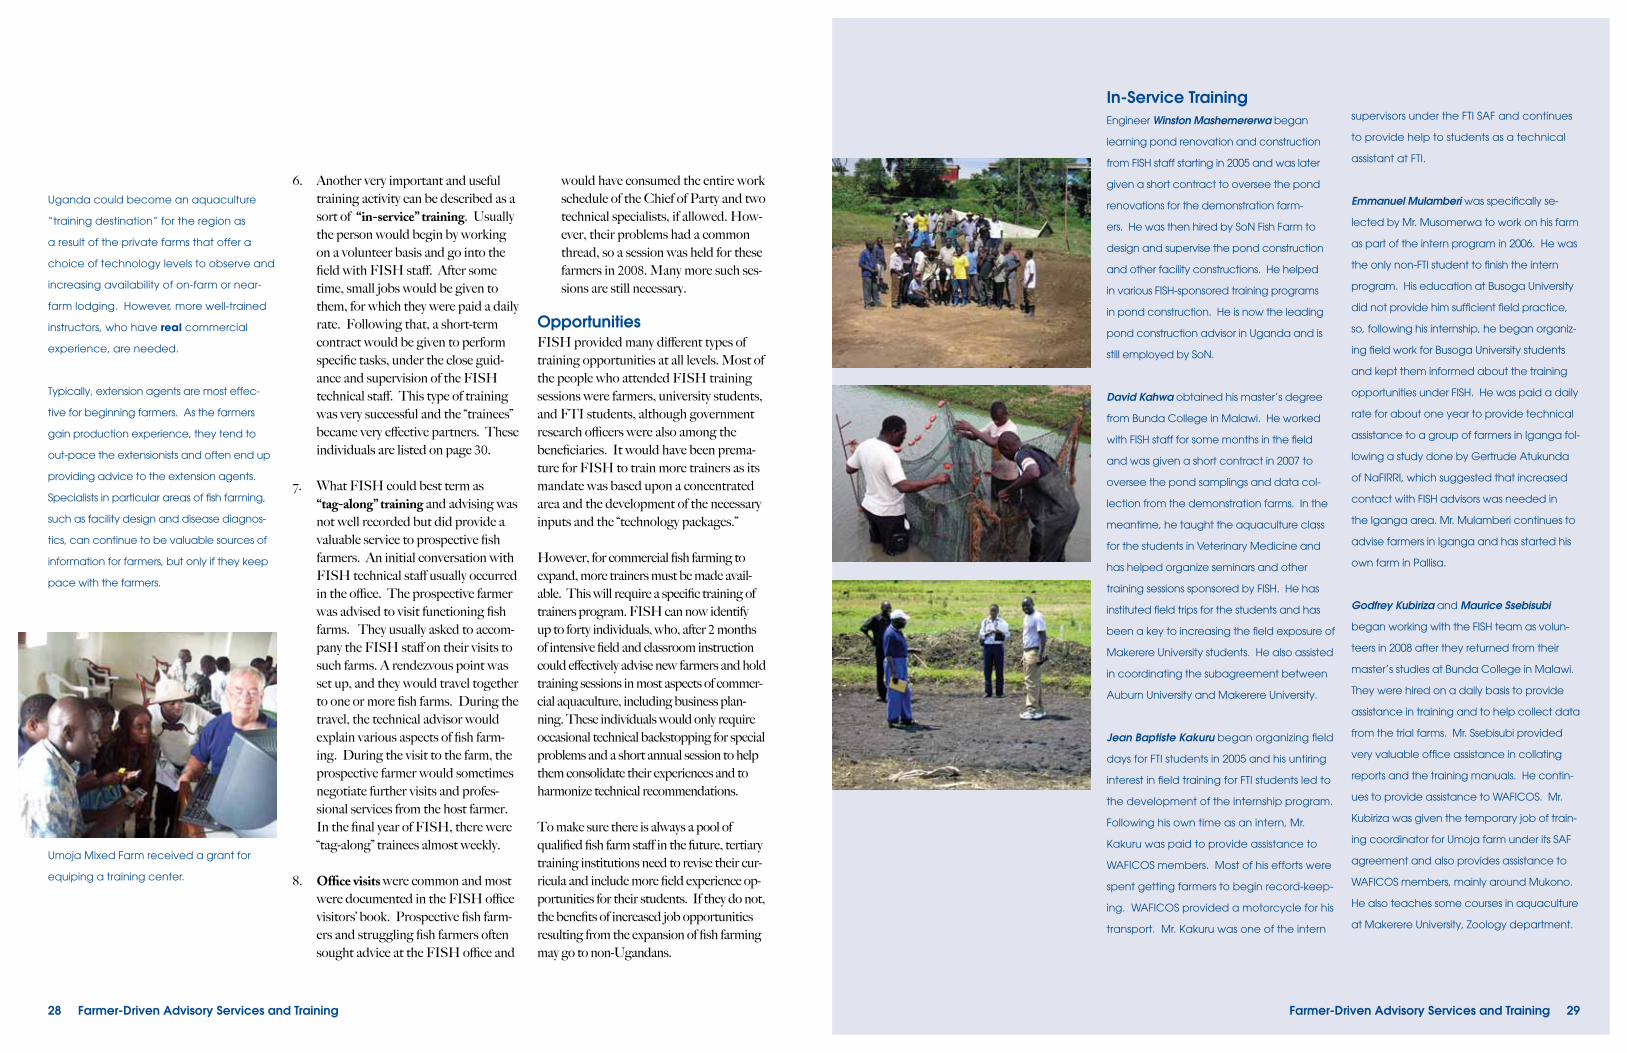
28 Farmer-Driven Advisory Services and Training
6. Another very important and useful training activity can be described as a sort of “in-service” training. Usually the person would begin by working on a volunteer basis and go into the field with FISH staff. After some time, small jobs would be given to them, for which they were paid a daily rate. Following that, a short-term contract would be given to perform specific tasks, under the close guid-ance and supervision of the FISH technical staff. This type of training was very successful and the “trainees” became very effective partners. These individuals are listed on page 30.
7. What FISH could best term as “tag-along” training and advising was not well recorded but did provide a valuable service to prospective fish farmers. An initial conversation with FISH technical staff usually occurred in the office. The prospective farmer was advised to visit functioning fish farms. They usually asked to accom-pany the FISH staff on their visits to such farms. A rendezvous point was set up, and they would travel together to one or more fish farms. During the travel, the technical advisor would explain various aspects of fish farm-ing. During the visit to the farm, the prospective farmer would sometimes negotiate further visits and profes-sional services from the host farmer. In the final year of FISH, there were “tag-along” trainees almost weekly.
8. Office visits were common and most were documented in the FISH office visitors’ book. Prospective fish farm-ers and struggling fish farmers often sought advice at the FISH office and
would have consumed the entire work schedule of the Chief of Party and two technical specialists, if allowed. How-ever, their problems had a common thread, so a session was held for these farmers in 2008. Many more such ses-sions are still necessary.
OpportunitiesFISH provided many different types of training opportunities at all levels. Most of the people who attended FISH training sessions were farmers, university students, and FTI students, although government research officers were also among the beneficiaries. It would have been prema-ture for FISH to train more trainers as its mandate was based upon a concentrated area and the development of the necessary inputs and the “technology packages.”
However, for commercial fish farming to expand, more trainers must be made avail-able. This will require a specific training of trainers program. FISH can now identify up to forty individuals, who, after 2 months of intensive field and classroom instruction could effectively advise new farmers and hold training sessions in most aspects of commer-cial aquaculture, including business plan-ning. These individuals would only require occasional technical backstopping for special problems and a short annual session to help them consolidate their experiences and to harmonize technical recommendations.
To make sure there is always a pool of qualified fish farm staff in the future, tertiary training institutions need to revise their cur-ricula and include more field experience op-portunities for their students. If they do not, the benefits of increased job opportunities resulting from the expansion of fish farming may go to non-Ugandans.
Uganda could become an aquaculture
“training destination” for the region as
a result of the private farms that offer a
choice of technology levels to observe and
increasing availability of on-farm or near-
farm lodging. However, more well-trained
instructors, who have real commercial
experience, are needed.
Typically, extension agents are most effec-
tive for beginning farmers. As the farmers
gain production experience, they tend to
out-pace the extensionists and often end up
providing advice to the extension agents.
Specialists in particular areas of fish farming,
such as facility design and disease diagnos-
tics, can continue to be valuable sources of
information for farmers, but only if they keep
pace with the farmers.
Umoja Mixed Farm received a grant for
equiping a training center.
Farmer-Driven Advisory Services and Training 29
In-Service TrainingEngineer Winston Mashemererwa began
learning pond renovation and construction
from FISH staff starting in 2005 and was later
given a short contract to oversee the pond
renovations for the demonstration farm-
ers. He was then hired by SoN Fish Farm to
design and supervise the pond construction
and other facility constructions. He helped
in various FISH-sponsored training programs
in pond construction. He is now the leading
pond construction advisor in Uganda and is
still employed by SoN.
David Kahwa obtained his master’s degree
from Bunda College in Malawi. He worked
with FISH staff for some months in the field
and was given a short contract in 2007 to
oversee the pond samplings and data col-
lection from the demonstration farms. In the
meantime, he taught the aquaculture class
for the students in Veterinary Medicine and
has helped organize seminars and other
training sessions sponsored by FISH. He has
instituted field trips for the students and has
been a key to increasing the field exposure of
Makerere University students. He also assisted
in coordinating the subagreement between
Auburn University and Makerere University.
Jean Baptiste Kakuru began organizing field
days for FTI students in 2005 and his untiring
interest in field training for FTI students led to
the development of the internship program.
Following his own time as an intern, Mr.
Kakuru was paid to provide assistance to
WAFICOS members. Most of his efforts were
spent getting farmers to begin record-keep-
ing. WAFICOS provided a motorcycle for his
transport. Mr. Kakuru was one of the intern
supervisors under the FTI SAF and continues
to provide help to students as a technical
assistant at FTI.
Emmanuel Mulamberi was specifically se-
lected by Mr. Musomerwa to work on his farm
as part of the intern program in 2006. He was
the only non-FTI student to finish the intern
program. His education at Busoga University
did not provide him sufficient field practice,
so, following his internship, he began organiz-
ing field work for Busoga University students
and kept them informed about the training
opportunities under FISH. He was paid a daily
rate for about one year to provide technical
assistance to a group of farmers in Iganga fol-
lowing a study done by Gertrude Atukunda
of NaFIRRI, which suggested that increased
contact with FISH advisors was needed in
the Iganga area. Mr. Mulamberi continues to
advise farmers in Iganga and has started his
own farm in Pallisa.
Godfrey Kubiriza and Maurice Ssebisubi
began working with the FISH team as volun-
teers in 2008 after they returned from their
master’s studies at Bunda College in Malawi.
They were hired on a daily basis to provide
assistance in training and to help collect data
from the trial farms. Mr. Ssebisubi provided
very valuable office assistance in collating
reports and the training manuals. He contin-
ues to provide assistance to WAFICOS. Mr.
Kubiriza was given the temporary job of train-
ing coordinator for Umoja farm under its SAF
agreement and also provides assistance to
WAFICOS members, mainly around Mukono.
He also teaches some courses in aquaculture
at Makerere University, Zoology department.

Farm Revenues Compared to Information SourceThe ultimate test of information sources is the impact they have on net revenues to the farmer. When Atuku-nda and Walakira made their survey of fish farmers’ information sources, they only looked at gross revenues (shown at left). However, other responses to inter-view questions showed a high degree of satisfaction with the information provided by FISH. Note also that a project could easily generate high gross revenues by providing all of the inputs needed by the farmers at no charge. FISH did not do this, which led to about a one-year delay in implementa-tion of the on-farm demonstrations.
The training and technical backstop-ping provided by FISH should be used to enhance the information provided by the fish farming advisory services. Farmers should be allowed to select their advisory service provider as they are the ultimate beneficiaries or losers. However, farmers often accept an advisor provided by a donor so they can receive free inputs. Therefore, free inputs such as the seed provided by NAADS have led to a distortion of the service provider selection process.
When the farmers are truly making a profit, they become much more demanding in quality information and other services. In this respect, fish farming is no different from other agri-culture businesses. As with any farmer newly “going commercial,” the first few profitable crop cycles will give farmers the confidence to play a greater role in their own advancement.
0
500000
1000000
1500000
2000000
2500000
Me
an
Va
lue
of t
ab
le s
ize
fish
so
ld (
USh
)
Source of information
0
5000000
10000000
15000000
20000000
25000000
Me
an
Va
lue
of fi
ng
erli
ng
s so
ld (
USh
)
Source of information
30 Farmer-Driven Advisory Services and Training
Hatcheries
Food Fish Producers
FISH Successes
• Increased access to fish markets for local
sales and for processing and export.
Three processors purchased catfish from
fish farmers and sold value-added prod-
ucts. Three processors have sourced
farmed tilapia, but supplies were intermit-
tent and in low volume due to a more
lucrative local market for farmers.
• Improved local access to the equipment
necessary for fish farming, such as fish
transport gear, water testing supplies,
and fish grading and harvesting gear.
While some must be imported, local im-
porters are present and the experienced
advisors are knowledgeable in its use
and maintenance.
• Development of the first locally
manufactured, easy-to-use seines for
harvesting ponds and nets for cage
production through cooperation with a
local net manufacturer.
• In 2005, farmers complained of lack
of market. In 2008, farmers were more
likely to cite lack of supply as they
gained marketing experience and be-
came more aware of market needs.
Access to Retail and Wholesale Markets 31
As FISH was starting up, farmers were very vocal about their problems selling fish, so the marketing studies planned for a later year were begun earlier. It quickly became apparent that the problem was lack of fish, not lack of markets. The er-ratic supply of farmed fish required that markets be developed frequently and these markets were short-lived; sometimes only one day. Farmers would grow small amounts of fish and expect the market to come to them when their fish were ready. They often thought they had 10 or 20 times more fish than what they actually had in their ponds. The few farmers who actually had large amounts of fish in their ponds could not harvest them in a timely fashion. Buyers would arrive on schedule and have to wait for the farmer to drain the pond and pick the fish up out of the mud.
When developing the indicators for mar-keting (listed in Annex 9), the sale of fish to processors was expected to show how large producers were able to sell in bulk. It was also expected to be much easier to collect production data from processors rather than trying to collect from indi-vidual farmers. However, the European Union (EU) has not approved importation of farmed fish from Uganda. The existing processors in Uganda were focused on export, and more than 90 percent of their product was Nile perch, which is not a good aquaculture candidate at this time.
For effective marketing, the supply should be consistent and timely. A buyer should be able to arrive at the farm and begin loading fish immediately. This means the fish have to be harvested and held alive prior to pickup. In some cases a farmer could harvest and hold on ice but they would then become at the mercy of the
buyer when negotiating price because the product would be perishable.
The first year, FISH merely helped pro-ducers identify markets on a case-by-case basis. One processor was buying catfish and one small-scale vendor (Fabulous Fresh Fish) began dealing in live tilapia and catfish around Kampala. These were sufficient to buy almost everything the farmers were producing because produc-tion was very limited. No farm had a pro-duction schedule that allowed for weekly or even monthly sales. After being misled about fish quantities on several occasions, buyers refused to pick up fish from the farm and began demanding delivery. The only trusted go-betweens were the FISH technical staff.
A remedy to the marketing dilemma was sought by addressing several fronts at once. These included:• Technology advances, that facilitated
havesting fish from the pond;• Information/communication services
(inventory reports) about supplies and markets;
• Directly assisting farmers in selling their fish for the first time by provid-ing transport to market; and
• Helping commercial farmers plan for the market before they construct facilities.
Several technology introductions have helped the farmers with their marketing. By far, one of the best aids has been the Commercial Fish Farm Seine (CFFS). Instead of having 20 people in the pond pulling a net that hardly stays on the pond bottom, the CFFS is designed and made for highly efficient capture of fish if the seine crew is trained. Two people can
Access to Retail andWholesale Markets
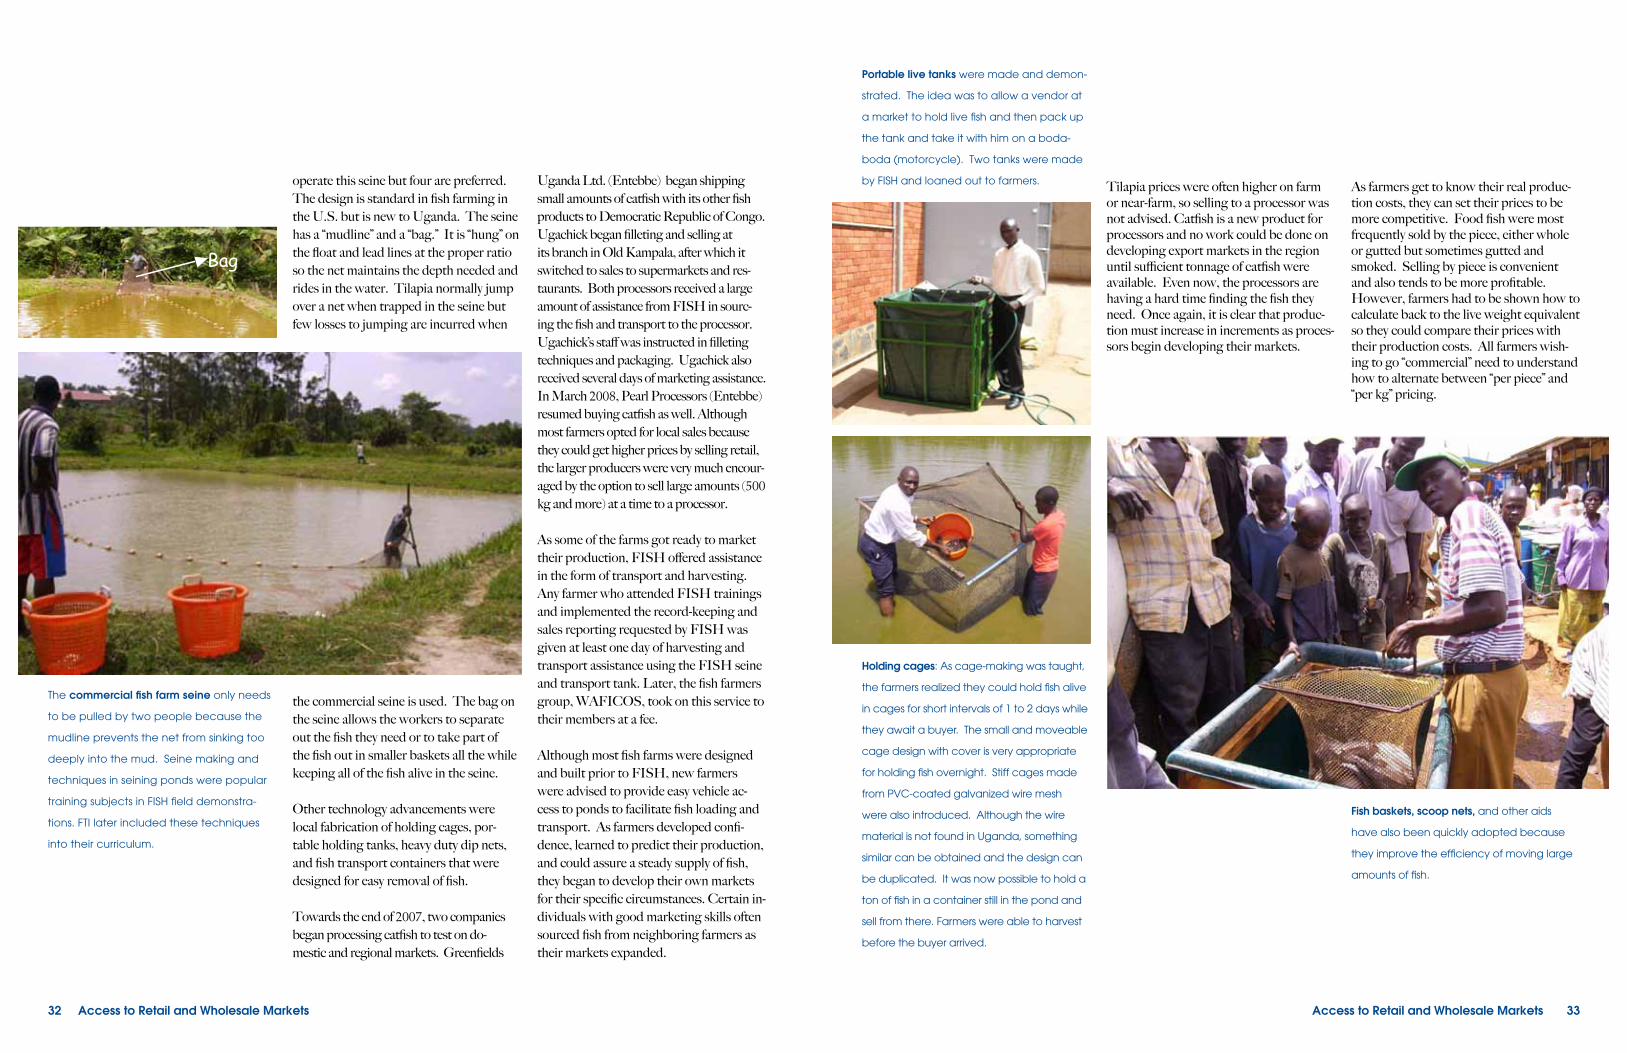
32 Access to Retail and Wholesale Markets Access to Retail and Wholesale Markets 33
operate this seine but four are preferred. The design is standard in fish farming in the U.S. but is new to Uganda. The seine has a “mudline” and a “bag.” It is “hung” on the float and lead lines at the proper ratio so the net maintains the depth needed and rides in the water. Tilapia normally jump over a net when trapped in the seine but few losses to jumping are incurred when
the commercial seine is used. The bag on the seine allows the workers to separate out the fish they need or to take part of the fish out in smaller baskets all the while keeping all of the fish alive in the seine.
Other technology advancements were local fabrication of holding cages, por-table holding tanks, heavy duty dip nets, and fish transport containers that were designed for easy removal of fish.
Towards the end of 2007, two companies began processing catfish to test on do-mestic and regional markets. Greenfields
Uganda Ltd. (Entebbe) began shipping small amounts of catfish with its other fish products to Democratic Republic of Congo. Ugachick began filleting and selling at its branch in Old Kampala, after which it switched to sales to supermarkets and res-taurants. Both processors received a large amount of assistance from FISH in sourc-ing the fish and transport to the processor. Ugachick’s staff was instructed in filleting techniques and packaging. Ugachick also received several days of marketing assistance. In March 2008, Pearl Processors (Entebbe) resumed buying catfish as well. Although most farmers opted for local sales because they could get higher prices by selling retail, the larger producers were very much encour-aged by the option to sell large amounts (500 kg and more) at a time to a processor.
As some of the farms got ready to market their production, FISH offered assistance in the form of transport and harvesting. Any farmer who attended FISH trainings and implemented the record-keeping and sales reporting requested by FISH was given at least one day of harvesting and transport assistance using the FISH seine and transport tank. Later, the fish farmers group, WAFICOS, took on this service to their members at a fee.
Although most fish farms were designed and built prior to FISH, new farmers were advised to provide easy vehicle ac-cess to ponds to facilitate fish loading and transport. As farmers developed confi-dence, learned to predict their production, and could assure a steady supply of fish, they began to develop their own markets for their specific circumstances. Certain in-dividuals with good marketing skills often sourced fish from neighboring farmers as their markets expanded.
Bag
The commercial fish farm seine only needs
to be pulled by two people because the
mudline prevents the net from sinking too
deeply into the mud. Seine making and
techniques in seining ponds were popular
training subjects in FISH field demonstra-
tions. FTI later included these techniques
into their curriculum.
Holding cages: As cage-making was taught,
the farmers realized they could hold fish alive
in cages for short intervals of 1 to 2 days while
they await a buyer. The small and moveable
cage design with cover is very appropriate
for holding fish overnight. Stiff cages made
from PVC-coated galvanized wire mesh
were also introduced. Although the wire
material is not found in Uganda, something
similar can be obtained and the design can
be duplicated. It was now possible to hold a
ton of fish in a container still in the pond and
sell from there. Farmers were able to harvest
before the buyer arrived.
Portable live tanks were made and demon-
strated. The idea was to allow a vendor at
a market to hold live fish and then pack up
the tank and take it with him on a boda-
boda (motorcycle). Two tanks were made
by FISH and loaned out to farmers.
Fish baskets, scoop nets, and other aids
have also been quickly adopted because
they improve the efficiency of moving large
amounts of fish.
Tilapia prices were often higher on farm or near-farm, so selling to a processor was not advised. Catfish is a new product for processors and no work could be done on developing export markets in the region until sufficient tonnage of catfish were available. Even now, the processors are having a hard time finding the fish they need. Once again, it is clear that produc-tion must increase in increments as proces-sors begin developing their markets.
As farmers get to know their real produc-tion costs, they can set their prices to be more competitive. Food fish were most frequently sold by the piece, either whole or gutted but sometimes gutted and smoked. Selling by piece is convenient and also tends to be more profitable. However, farmers had to be shown how to calculate back to the live weight equivalent so they could compare their prices with their production costs. All farmers wish-ing to go “commercial” need to understand how to alternate between “per piece” and “per kg” pricing.
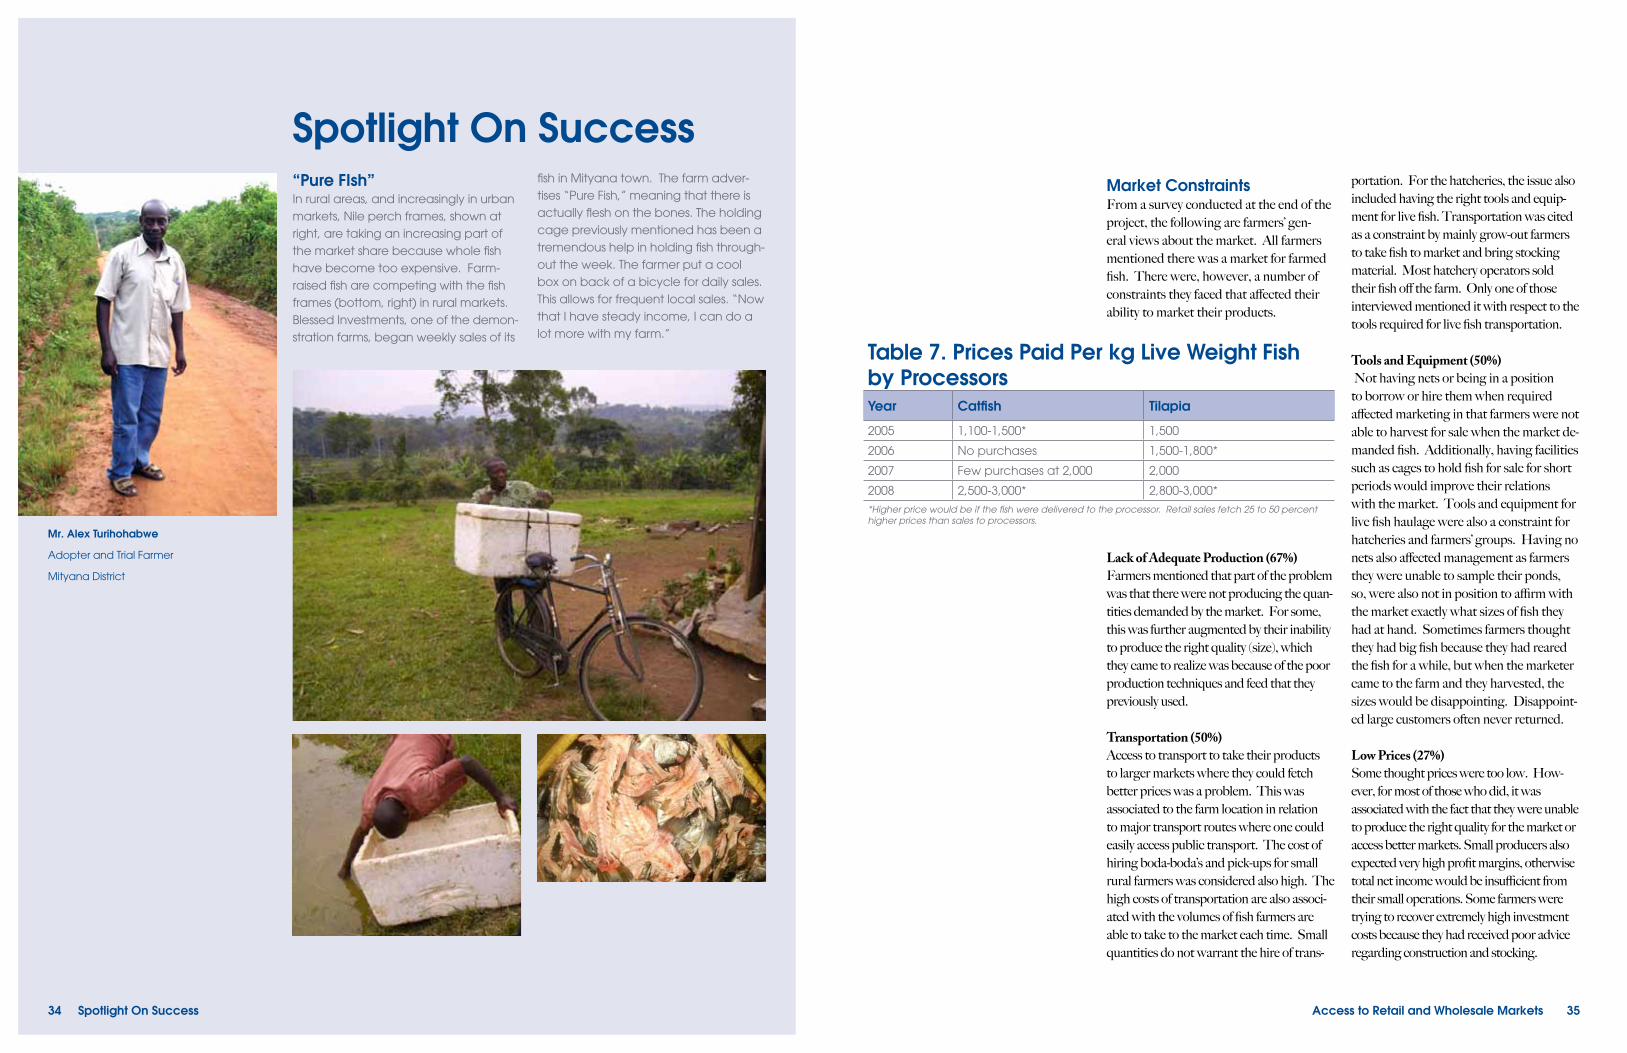
Mr. Alex Turihohabwe
Adopter and Trial Farmer
Mityana District
“Pure FIsh”In rural areas, and increasingly in urban markets, Nile perch frames, shown at right, are taking an increasing part of the market share because whole fish have become too expensive. Farm-raised fish are competing with the fish frames (bottom, right) in rural markets. Blessed Investments, one of the demon-stration farms, began weekly sales of its
fish in Mityana town. The farm adver-tises “Pure Fish,” meaning that there is actually flesh on the bones. The holding cage previously mentioned has been a tremendous help in holding fish through-out the week. The farmer put a cool box on back of a bicycle for daily sales. This allows for frequent local sales. “Now that I have steady income, I can do a lot more with my farm.”
Spotlight On Success
34 Spotlight On Success Access to Retail and Wholesale Markets 35
Market ConstraintsFrom a survey conducted at the end of the project, the following are farmers’ gen-eral views about the market. All farmers mentioned there was a market for farmed fish. There were, however, a number of constraints they faced that affected their ability to market their products.
Lack of Adequate Production (67%)Farmers mentioned that part of the problem was that there were not producing the quan-tities demanded by the market. For some, this was further augmented by their inability to produce the right quality (size), which they came to realize was because of the poor production techniques and feed that they previously used.
Transportation (50%) Access to transport to take their products to larger markets where they could fetch better prices was a problem. This was associated to the farm location in relation to major transport routes where one could easily access public transport. The cost of hiring boda-boda’s and pick-ups for small rural farmers was considered also high. The high costs of transportation are also associ-ated with the volumes of fish farmers are able to take to the market each time. Small quantities do not warrant the hire of trans-
portation. For the hatcheries, the issue also included having the right tools and equip-ment for live fish. Transportation was cited as a constraint by mainly grow-out farmers to take fish to market and bring stocking material. Most hatchery operators sold their fish off the farm. Only one of those interviewed mentioned it with respect to the tools required for live fish transportation.
Tools and Equipment (50%) Not having nets or being in a position to borrow or hire them when required affected marketing in that farmers were not able to harvest for sale when the market de-manded fish. Additionally, having facilities such as cages to hold fish for sale for short periods would improve their relations with the market. Tools and equipment for live fish haulage were also a constraint for hatcheries and farmers’ groups. Having no nets also affected management as farmers they were unable to sample their ponds, so, were also not in position to affirm with the market exactly what sizes of fish they had at hand. Sometimes farmers thought they had big fish because they had reared the fish for a while, but when the marketer came to the farm and they harvested, the sizes would be disappointing. Disappoint-ed large customers often never returned.
Low Prices (27%) Some thought prices were too low. How-ever, for most of those who did, it was associated with the fact that they were unable to produce the right quality for the market or access better markets. Small producers also expected very high profit margins, otherwise total net income would be insufficient from their small operations. Some farmers were trying to recover extremely high investment costs because they had received poor advice regarding construction and stocking.
Table 7. Prices Paid Per kg Live Weight Fish by ProcessorsYear Catfish Tilapia
2005 1,100-1,500* 1,500
2006 No purchases 1,500-1,800*
2007 Few purchases at 2,000 2,000
2008 2,500-3,000* 2,800-3,000*
*Higher price would be if the fish were delivered to the processor. Retail sales fetch 25 to 50 percent higher prices than sales to processors.

36 Access to Retail and Wholesale Markets
Table fish from farms was sold from the pond
bank (33 percent), at supermarkets (13 per-
cent), to processors (60 persent), at markets
in local trading centers (40 percent), to
restaurants (33 percent), and to bicycle ven-
diors (33 percent). Bicycle vending included
the farmers selling the fish themselves as well
as sales to fishmongers. Half of the people
whose sales were done by bicycle vending
were farmers doing it for themselves.
ChallengesPoor farm design, few ponds, and small farm size limit the ability to conduct weekly fish sales. A short description of how to make and manage a small farm for weekly sales and home consumption was outlined for the case of catfish. The user must indicate the weekly market amount and the pond size, and the total investment required will be given (see Procedings, Second Fish Farmers’ Symposium). As prices fluctu-ate, this table can be easily adjusted. The plan is useful for farmers who are in rural areas where the market can absorb small amounts of fish weekly.
For larger cities, a drop-off point and schedule can work for a group of fish farm-ers. This was attempted with WAFICOS. However, to cover transport costs, the sales should be above 200 kg per day. If the farmers’ group does not have sufficient means to provide fish daily, it can begin with a weekly sales day. Each farm would then be assigned its day to harvest and the fish will be transported to the group’s vending point. Fish cleaning facilities and a small chest freezer will help.
The processors have concluded that they may have to run their own production farms or work through a few reliable con-tract farmers. If that develops, it would set the stage for EU approval for farm-raised fish, although at this time, the absence of the EU market is not a major impediment to catfish marketing.
Quality of the flesh of catfish can be highly variable depending on the protein and fat content of the feed. Catfish fed on a low protein/high fat diet build up huge amounts of fat in the viscera and in the muscle. The problem becomes
critical when fish were fed on offals from poultry processors. The fish cannot even be smoked because it is too fatty. After witnessing the problem, FISH advised farmers to cease feeding the offals one month before marketing their catfish. During that month, the fish might lose a bit of weight but they live off the fat they have stored and the meat quality is much improved. A quality and flavor check would help a vendor decide before making plans to buy a particular load of fish. This technique is used in commercial catfish farming in the U.S. and elsewhere. Therefore, both processors and farmers could benefit from additional training in quality control before the fish arrives at the processor. FISH did not have sufficient time to address this issue.
Spotlight On Success 37
Mrs. Rhona Buwulwe
Adopter and Trial Farmer
Bira, Wakiso District
My husband and I started fish farming in January 2006. I have four ponds whose total surface area is about 900 m2. We also have poultry on our small farm. My husband and I decided to go into fish farming because we believed the demand for fish was high and we needed to supplement our in-come. We visited a number of farmers and felt encouraged.
After constructing the ponds, we got them stocked with tilapia fingerlings. The fish grew well for a while, but after some time the performance was not so promising. Among the issues we found challenging was getting the right feeds for the fish. Initially, we used poultry feed too. We got a good market for our fish, but, because our production was not good in the sense that we were failing to get a good proportion of the fish to marketable size within a specified time, we could not sustain or build up a market. After a while we started becoming discouraged. At this point in time we heard about the USAID FISH project and attended a number of the training sessions. We also visited a couple of farms with them while on their regular field work.
The information we obtained from the project really helped us transform our operations. The skills I have gained in pond construction, knowledge re-garding stocking rates vis-à-vis one’s carrying capacity, pond dynamics and managing pond fertility, fish handling, inventory control, feeding fish, feed conversion ratios inclusive of the record keeping, have given me the ability to manage my farm and achieve opti-mum yields from my farm. Being able to access fish feed has really made a difference too. The skills gained have been practical and take into consideration the constraints we face, such as overcoming the periods when
there are no fish feeds on the market. The fish in my 450 m2 pond are almost ready for sale. What really makes me happy is that ALL the fish are about the same size (at the last sampling, 380 g; market wants from 400 g fish). I filleted a sample, which gave me a good-sized fillet which means more money for me.
In addition to growing fish, I have learned more about marketing fish and adding value to fish products. The proj-ect trained me in smoking catfish and making fillets. Now I have an addi-tional business. I buy catfish from other farmers and sell fresh and frozen catfish fillets as well as whole and smoked cat-fish fillets. My business is doing well and growing. Since I started it in May 2008, I have processed more than 500 kg in six months, which for a small, literally new, business bringing a brand new product into the market I think is good.
I have been able to obtain and ap-ply all this knowledge because of the manner in which the project dissemi-nated the information. The staff actu-ally worked with the farmers and for the farmers right through the way, in-cluding finding markets and selling fish. Few trained professionals would do that with a farmer. Now I am a happy farmer and know that, even though this project has ended, my aquaculture businesses shall continue to grow. The project transformed me into a success-ful, small commercial fish farmer.
Spotlight On Success
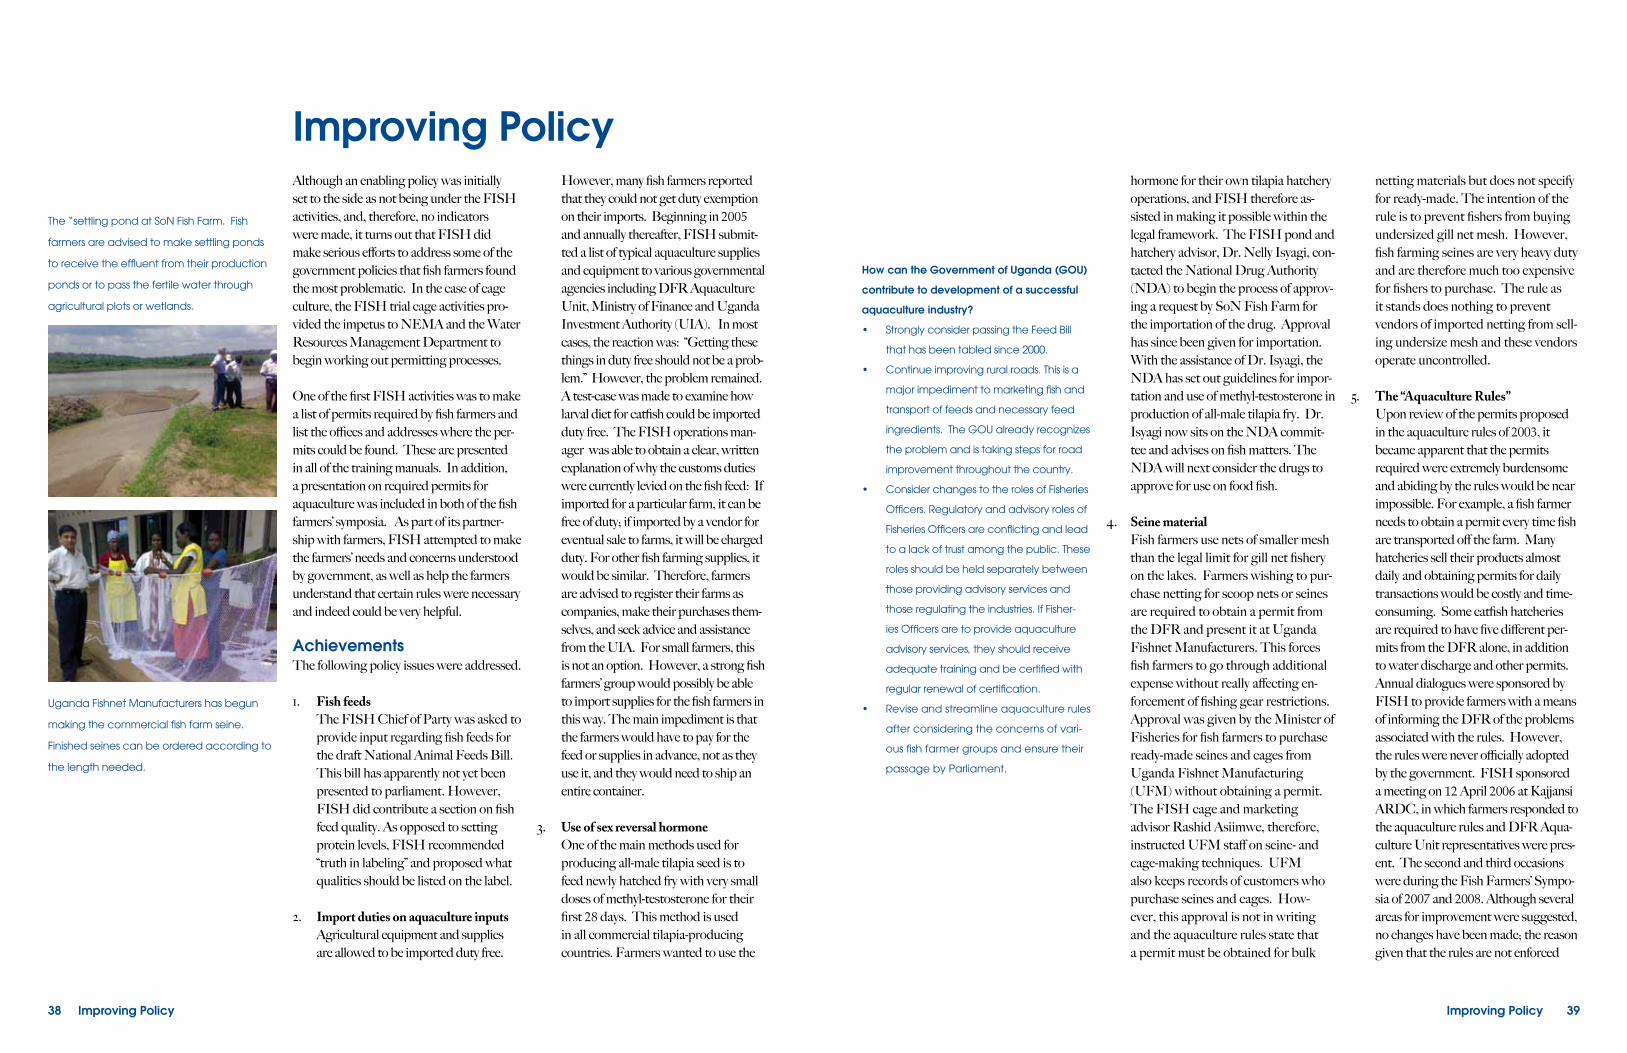
Uganda Fishnet Manufacturers has begun
making the commercial fish farm seine.
Finished seines can be ordered according to
the length needed.
The “settling pond at SoN Fish Farm. Fish
farmers are advised to make settling ponds
to receive the effluent from their production
ponds or to pass the fertile water through
agricultural plots or wetlands.
38 Improving Policy
Although an enabling policy was initially set to the side as not being under the FISH activities, and, therefore, no indicators were made, it turns out that FISH did make serious efforts to address some of the government policies that fish farmers found the most problematic. In the case of cage culture, the FISH trial cage activities pro-vided the impetus to NEMA and the Water Resources Management Department to begin working out permitting processes.
One of the first FISH activities was to make a list of permits required by fish farmers and list the offices and addresses where the per-mits could be found. These are presented in all of the training manuals. In addition, a presentation on required permits for aquaculture was included in both of the fish farmers’ symposia. As part of its partner-ship with farmers, FISH attempted to make the farmers’ needs and concerns understood by government, as well as help the farmers understand that certain rules were necessary and indeed could be very helpful.
AchievementsThe following policy issues were addressed.
1. Fish feedsThe FISH Chief of Party was asked to provide input regarding fish feeds for the draft National Animal Feeds Bill. This bill has apparently not yet been presented to parliament. However, FISH did contribute a section on fish feed quality. As opposed to setting protein levels, FISH recommended “truth in labeling” and proposed what qualities should be listed on the label.
2. Import duties on aquaculture inputs Agricultural equipment and supplies are allowed to be imported duty free.
However, many fish farmers reported that they could not get duty exemption on their imports. Beginning in 2005 and annually thereafter, FISH submit-ted a list of typical aquaculture supplies and equipment to various governmental agencies including DFR Aquaculture Unit, Ministry of Finance and Uganda Investment Authority (UIA). In most cases, the reaction was: “Getting these things in duty free should not be a prob-lem.” However, the problem remained. A test-case was made to examine how larval diet for catfish could be imported duty free. The FISH operations man-ager was able to obtain a clear, written explanation of why the customs duties were currently levied on the fish feed: If imported for a particular farm, it can be free of duty; if imported by a vendor for eventual sale to farms, it will be charged duty. For other fish farming supplies, it would be similar. Therefore, farmers are advised to register their farms as companies, make their purchases them-selves, and seek advice and assistance from the UIA. For small farmers, this is not an option. However, a strong fish farmers’ group would possibly be able to import supplies for the fish farmers in this way. The main impediment is that the farmers would have to pay for the feed or supplies in advance, not as they use it, and they would need to ship an entire container.
3. Use of sex reversal hormone One of the main methods used for producing all-male tilapia seed is to feed newly hatched fry with very small doses of methyl-testosterone for their first 28 days. This method is used in all commercial tilapia-producing countries. Farmers wanted to use the
Improving Policyhormone for their own tilapia hatchery operations, and FISH therefore as-sisted in making it possible within the legal framework. The FISH pond and hatchery advisor, Dr. Nelly Isyagi, con-tacted the National Drug Authority (NDA) to begin the process of approv-ing a request by SoN Fish Farm for the importation of the drug. Approval has since been given for importation. With the assistance of Dr. Isyagi, the NDA has set out guidelines for impor-tation and use of methyl-testosterone in production of all-male tilapia fry. Dr. Isyagi now sits on the NDA commit-tee and advises on fish matters. The NDA will next consider the drugs to approve for use on food fish.
4. Seine material Fish farmers use nets of smaller mesh than the legal limit for gill net fishery on the lakes. Farmers wishing to pur-chase netting for scoop nets or seines are required to obtain a permit from the DFR and present it at Uganda Fishnet Manufacturers. This forces fish farmers to go through additional expense without really affecting en-forcement of fishing gear restrictions. Approval was given by the Minister of Fisheries for fish farmers to purchase ready-made seines and cages from Uganda Fishnet Manufacturing (UFM) without obtaining a permit. The FISH cage and marketing advisor Rashid Asiimwe, therefore, instructed UFM staff on seine- and cage-making techniques. UFM also keeps records of customers who purchase seines and cages. How-ever, this approval is not in writing and the aquaculture rules state that a permit must be obtained for bulk
netting materials but does not specify for ready-made. The intention of the rule is to prevent fishers from buying undersized gill net mesh. However, fish farming seines are very heavy duty and are therefore much too expensive for fishers to purchase. The rule as it stands does nothing to prevent vendors of imported netting from sell-ing undersize mesh and these vendors operate uncontrolled.
5. The “Aquaculture Rules” Upon review of the permits proposed in the aquaculture rules of 2003, it became apparent that the permits required were extremely burdensome and abiding by the rules would be near impossible. For example, a fish farmer needs to obtain a permit every time fish are transported off the farm. Many hatcheries sell their products almost daily and obtaining permits for daily transactions would be costly and time-consuming. Some catfish hatcheries are required to have five different per-mits from the DFR alone, in addition to water discharge and other permits. Annual dialogues were sponsored by FISH to provide farmers with a means of informing the DFR of the problems associated with the rules. However, the rules were never officially adopted by the government. FISH sponsored a meeting on 12 April 2006 at Kajjansi ARDC, in which farmers responded to the aquaculture rules and DFR Aqua-culture Unit representatives were pres-ent. The second and third occasions were during the Fish Farmers’ Sympo-sia of 2007 and 2008. Although several areas for improvement were suggested, no changes have been made; the reason given that the rules are not enforced
How can the Government of Uganda (GOU)
contribute to development of a successful
aquaculture industry?
• Strongly consider passing the Feed Bill
that has been tabled since 2000.
• Continue improving rural roads. This is a
major impediment to marketing fish and
transport of feeds and necessary feed
ingredients. The GOU already recognizes
the problem and is taking steps for road
improvement throughout the country.
• Consider changes to the roles of Fisheries
Officers. Regulatory and advisory roles of
Fisheries Officers are conflicting and lead
to a lack of trust among the public. These
roles should be held separately between
those providing advisory services and
those regulating the industries. If Fisher-
ies Officers are to provide aquaculture
advisory services, they should receive
adequate training and be certified with
regular renewal of certification.
• Revise and streamline aquaculture rules
after considering the concerns of vari-
ous fish farmer groups and ensure their
passage by Parliament.
Improving Policy 39

anyway, so why worry? In comparison, the water permit rules are clear and possible to follow as well as providing some protection to the farmers.
6. Cage culture Cage culture was not illegal but there was some misunderstood information on the agreement of the Council of Ministers to allow cage fish farming in Lake Victoria. The stakeholders meet-ing held in October 2008 specifically addressed cage culture in Lake Victoria and publically announced that “respon-sible aquaculture should be practiced in Lake Victoria.” FISH, in collaboration with NaFIRRI, was able to obtain permits for its cage culture demonstra-tions from the DFR, from NEMA, and is still waiting for the permit from the Water Resources Department for its cage trials. Guidance was provided to a farmers’ group from Jinja and their permits have been provided, although they have yet to pay for the water per-mit. Because of the FISH cage trials, the issue of permits for cages has come to the surface and is being addressed by the appropriate authorities. The DFR, NEMA, and WRMD seem to have a good understanding of cage culture and are proceeding cautiously with permitting. The only item left is to address the issue of security that was brought up in the cage culture meeting with prospective investors in Entebbe on 19 March 2007.
Remaining OpportunitiesThe Animal Feeds Bill should be reviewed with regard to fish feeds. FISH was not able to obtain the final draft of the bill. If the portion on fish feeds is determined to be sufficient, then some effort must be made
to submit the Animal Feeds Bill, which has been on the table since 2000. This should protect people from unscrupulous feed makers. However, some effort must be made to identify the best proximate analysis labs for checking the feeds as government chemist labs has not proven reliable.
More effort must be made to help improve the Aquaculture Rules, so they serve the needs of the government without impos-ing impossible restrictions on farmers. The explanation that the rules will not be enforced is insufficient. Uganda needs some rules that allow fish farmers to sell all sizes of fish and to purchase the gear and feed they need at reasonable prices. Although quality assurance is important. and will be required for EU certification of aquaculture products, burdensome rules will quash aquaculture development.
The new Aquaculture Plan that is sched-uled to follow the Aquaculture Strategy needs to address the role of the Fishery Officers, and the role of NaFIRRI in the light of the numerous private service pro-viders and consultants that are in Uganda. Beginning fish farmers will only benefit from advisors that have actually practiced fish farming for profit. Successful fish farmers are the best judge of information sources and should be the source of any advisor certification program.
Another cage culture consultative work-shop should be held with DFR, NEMA, WRMD, UIA, all cage farmers, and interested investors to review progress in permitting processes and any needed actions. Security assurance and rights of cage owners should be discussed. Water quality monitoring and review of water quality data should also be addressed.
41 Improving Policy
How can the Government of Uganda (GOU)
contribute to development of a successful
aquaculture industry?
• Avoid conflicts of interest by enforcing
rules regarding consulting by govern-
ment employees.
• Work with farmers and farmer groups
to implement collection of statistics to
ensure accurate and timely information
that will be useful for planning.
• Maintain a strong environmental
protection agency (NEMA) to ensure
that best management practices are
followed by fish farms.
• Provide accurate and reliable informa-
tion regarding the economic viability of
fish farming to potential investors and
local farmers.
• Harmonize fish farming recommenda-
tions coming from ARDC Kajjansi and
other NARO offices.
• Streamline the procedures for duty-free
importation of aquaculture supplies.
• Cost-share with the private sector
on the selective breeding programs,
not by duplicating, but by funding a
collaborative research grant with a
memorandum of understanding (MOU)
that outlines responsibility of govern-
ment and the private farm.
• Any improvements on the land tenure
and property title system will also facili-
tate aquaculture investment.
Sampling cages with a cast net.
Strategic Activities Fund 42
The Strategic Activities Fund (SAF) was launched in 2006 but proposals had been submitted to FISH from June 2005. Most of the concepts and proposals were centered around the development of “demonstration farms” that would be entirely paid with USAID funds. None of these proposals identified adequate technical advisors be-cause there were none. It was clear to FISH that such farms would not demonstrate anything but total dependence on donors. More specifically, sectoral assistance in terms of training services, feed-making, and equipment supply were needed. From more than 60 concept submissions, a total of 11 proposals were invited. Some propos-als, although useful, were given low priority as long as the feed supply problem was not solved. After several failed attempts to secure outside funding for the extrusion equipment, a decision was made to put a large amount of the SAF funds into the par-tial purchase of extrusion equipment to be located at Ugachick Poultry Breeders, Ltd.
A total of seven proposals were approved by USAID; all of them in 2008. The SAF manager, Mr. James Sekatawa, guided the applicants to fulfill their obligations under the terms stated in the SAF opera-tion manual and to fill in their application forms. However, it took most of the appli-cants a rather long time to assemble all of the needed documents. The SAF grants were implemented and results prior to the end of project were promising but the real results will only come in 2009-10. Annex 6 gives a complete list of SAF grants and their status in November 2008.
FISH used more than the SAF allocation to assist the private sector. Equipment was purchased to demonstrate on fish farms, feed was imported, and other equip-
ment and feed were made in Uganda to be used on fish farms, all using the normal FISH operating funds.
Aeration devices and pond construction equipment were developed with the engi-neers at AEATREC (the NARO agricul-tural engineering station) and with FISH operating funds. Often, new products for the fish farming sector were commissioned by FISH, then purchased and loaned to fish farmers for trial and demonstration. In re-turn, the farmers collected performance data and economic data that allowed FISH to evaluate the items and help make improve-ments. In the meantime, farmers could make the decision to purchase more of the product. This is how the first feed made by Ugachick came to the market, and how several other enterprises got their start.
SoN Fish Farm began making feed in Feb-ruary 2008. The SAF helped the farm get more equipment to increase their output of fry and fingerling feeds. Feeds for young fish must contain higher amounts of protein than for older fish and they need to be of smaller particle size. For this reason, they are considered specialty feeds. The total demand is not very high and large compa-nies often do not wish to manufacture these feeds because it interrupts their production.
From February to July, SoN farm sold only 90 kgs of feed to other farmers, the first sale being to FISH to hand out as samples to other farmers. From August until 23 Octo-ber, feed sales increased to 2.5 tons. The feed from SoN farm helped many farmers during the time that Ugachick’s machin-ery was down. From February through July 2008, the number of sex-reversed tilapia (SRT) fry sold to other farmers was 94,500. After SAF assistance began, the
Strategic Activities Fund
A “critical mass” of commercial fish farms is
needed before investment in a fish feed mill
can be justified. However, a critical mass
cannot be obtained until quality fish feed is
available. FISH Strategic Activities Fund was
used to break this bottleneck.

43 Strategic Activities Fund
number of SRT fry sold jumped to 231,000 (August-October 2008). The fry were sold to fish farms throughout Uganda, which, in turn, grew them on to sell as fingerlings to other farmers, thus creating new nursery enterprises. SoN provided the reports on feed and seed sales and did show the anticipated results (verified by FISH) but purchased most of its equipment after November 2008.
WAFICOS (Walimi Fish Cooperative Society) was provided a grant for pond construction equipment and fish harvesting and transport gear to hire out to their mem-bers and for technical advisory services. Paid membership increased from 36 to 113 in just six months. Some of the larger pro-ducers, such as SoN Fish Farm, Interfish, and Sunfish Farms, have indicated they will join because the society now has the equipment that can be hired for pond con-struction, fish transport, and water quality analyses. This society may evolve into a national fish farmers’ society. However, WAFICOS still lacks the services of an experienced field advisor who can help train farmers, record production, and assist in programming marketing. The first advisor hired was not sufficiently experienced and ended up just using the WAFICOS office to gather his own consulting clients. His services were discontinued after one month. The society still depends considerably on services of former FISH staff, including the drivers for fish harvesting and transport services and the technical advisors.
FTI received funds to implement the internship program, improve the training levels of its aquaculture instructors, and to equip a teaching hatchery on its premises. The program began late and internships were only funded for four months. The
instructors did attend several training sessions and have greatly improved their experience and understanding. The train-ing notes from FISH have become an in-tegral part of the FTI training curriculum. They started with 18 interns assigned (12 males, 6 female; three farms did not follow through on their part of the agreement so the interns were re-assigned). Three interns were dismissed before finishing the program, leaving 16 to finish: 11 male, 4 female. The FTI teaching hatchery was delayed due to some problems with the contractors who built the tanks (not part of the SAF funding).
Umoja Fish Farm hosted several train-ing programs and maintains a good set of training aids such as a slide projector, white boards, etc. The farm’s owner has moved away to accompany her husband on assignment, but the farm continues to function under management of a former FISH-funded intern. Residential training for catfish hatchery is still available and the farm is being used as a training site.
As described in the section on feeds, a grant of $220,000 was provided to Ugachick Poultry Breeders, Ltd. for the purchase of equipment for making floating fish feed: a pre-conditioner unit, an extruder, and a dryer. The remaining equipment such as fine grinder, steam boiler, fines separator, and all shipping was paid by Ugachick. Ugachick also decided to purchase addi-tional equipment to improve the produc-tion of its poultry feeds, to roast soy for the inclusion in feeds and to improve its grain storage and drying capacity. Ugachick’s investment totals more than $1 million USD. A new fish feed plant would cost $5 to 10 million.
FISH used a large portion of its operating
funds in the field to provide training and
technical assistance, to make the initial
purchase of new technologies from abroad
and made in Uganda, and to import four
containers of floating fish feed for dem-
onstrations on farms. The SAF was used to
render further assistance to develop the
sectors of feed manufacture, seed supply,
information access and training services.
If FISH had been required to allocate SAF
funds in its first year, several mistakes would
have been made. However, in waiting 2
years, very little time remained to implement
the activities. Impact will be most apparent
in 2009 and 2010.
Project Monitoring and Evaluation 44
Gathering production data from farmers is often expensive and time-consuming. The fisheries officers working under MAAIF admit that they do not have the resources to gather data on pond productions so they rely on an estimate based on perceived total surface area of ponds and an assumed productive capacity that is ten times higher than what has been observed in the field. More than 50 percent of existing ponds are not stocked in some districts and should not be included in estimates. It is, therefore, extremely difficult and highly misleading for a project to use MAAIF fish farming statis-tics for any type of planning and evaluation. FISH had to set up its own reporting and, as such, its statistics cannot be compared with numbers sourced from MAAIF.
Currently, only verifiable data are reported and therefore many impacts of the project go unreported. For example, in order to document adoption of technology by farmers other than demonstration farmers, a huge number of farm visits are required throughout the country. A project techni-cal staff of three does not allow for such visits. The FISH team received reports that the training notes have been spread throughout the country but could not actually document the spread.
At the end of 2006, the fish farm sales and inventory report forms were developed using the US Department of Agricul-ture catfish sales and inventory report forms from the southeastern U.S. as a model. These reports allowed FISH to track many of the indicators. In order to encourage farmers to provide the reports, FISH tried to make it easy for them and allowed call-ins (on FISH phone time), provided assistance to advisors on filling in the reports, and finally only allowed
reporting farmers into the more selective training sessions. Following the model of USDA, FISH also provided the summary report to the farmers who had sales and gave them an annual summary for their own farm. One farmer noted a manage-ment problem on his farm based upon the reports and was able to make changes before his losses became very large. The FISH team regularly accessed the sales and inventory reports to identify suppli-ers when buyers would call. A total of 58 farms supplied reports although some did so on an annual, instead of the requested quarterly, basis; others preferred monthly. The 2007 and 2008 annual summaries of sales for reporting farmers are presented in annexes 2 and 3, respectively.
One of the best indicators, however, and the easiest to track is the sale of fish feed. In one year, the production and sale of fish feed has quadrupled.
Annex 8 presents a discussion of the indi-cators used in the performance manage-ment plan of FISH and the targets. A table summarizing the annual performance follows. Some adjustments were made to the indicators and more could have been made to make the FISH indicators more compatible with the definitions of the SO
7
annual performance indicators and the Ini-tiative to End Hunger in Africa (IEHA) reports. Specifically, the IEHA format can be better adapted to fish farming, without reducing its applicability to crops and other animal products. It was only after review with the very helpful Uganda Monitoring and Evaluation Service (UM-EMS) office in August 2008 that fewer and better indicators were suggested, but this was too late.
Project Monitoringand Evaluation
Three instructors from FTI received special
training before they began supervising the
second set of interns through the grant re-
ceived under the SAF.
A worker at Uganda Fishnet manufacturers
repairs flaws in a piece of seine netting be-
fore it is sold. This factory, located in Kampala,
is the only functioning fish net factory in East-
ern Africa. It employs more than 200 workers,
most of whom are women.
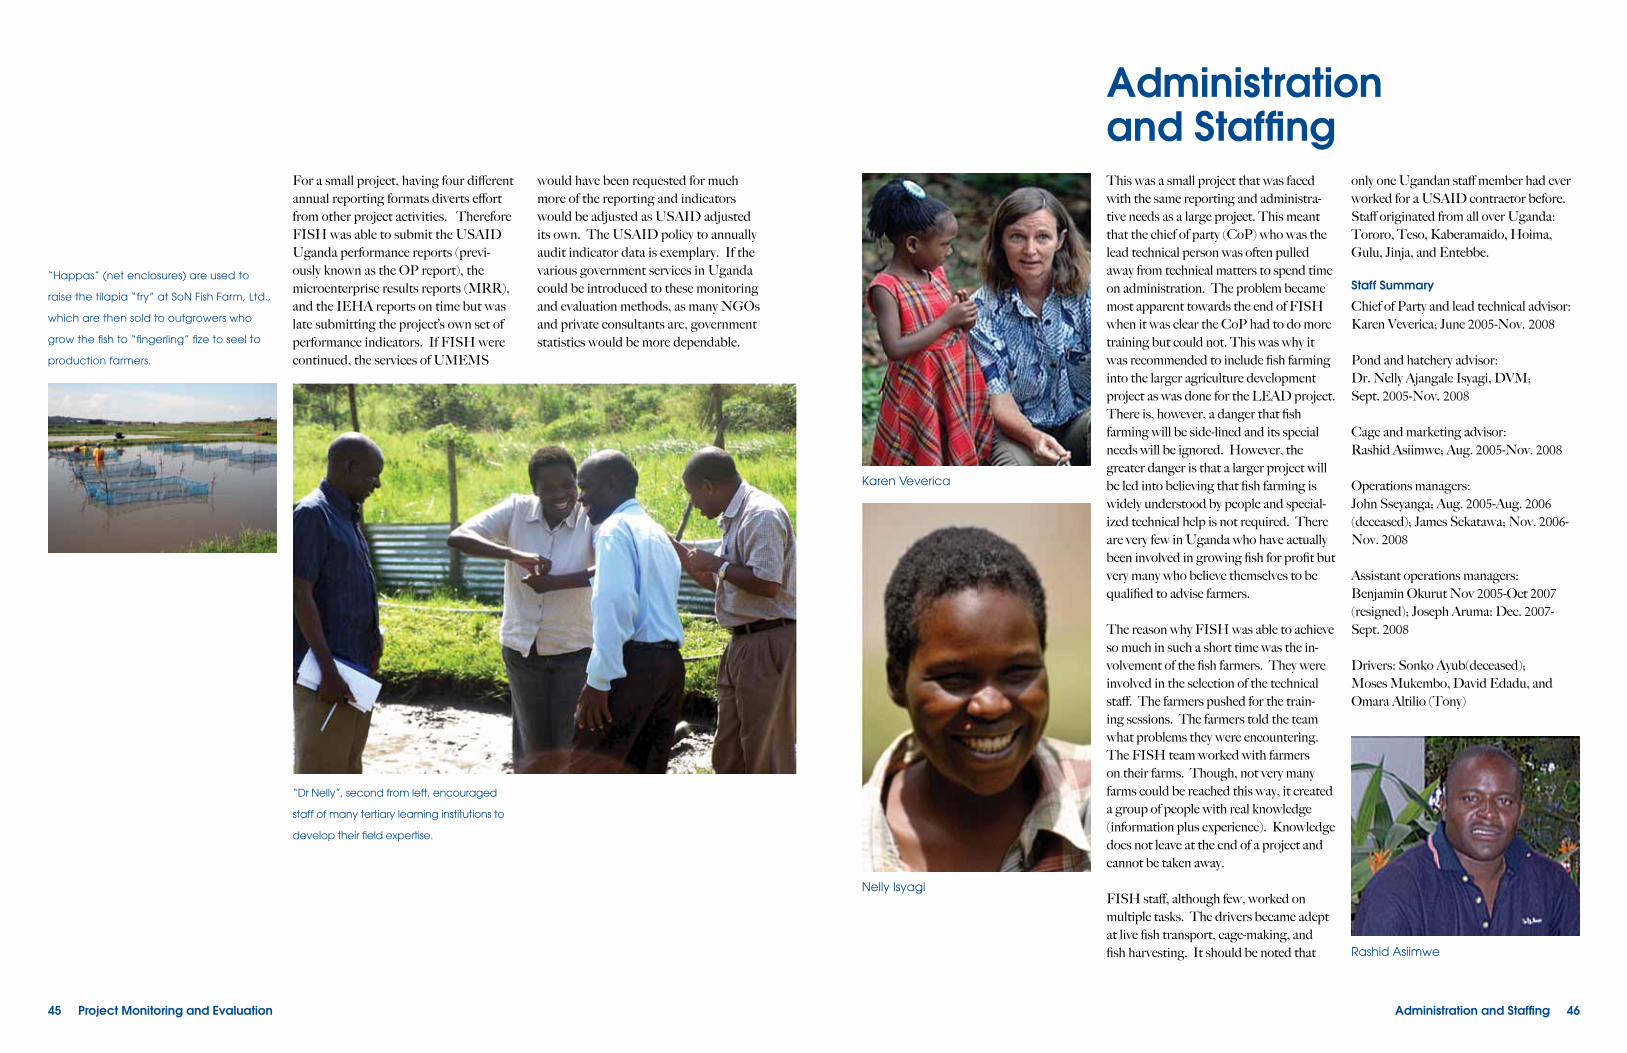
45 Project Monitoring and Evaluation
For a small project, having four different annual reporting formats diverts effort from other project activities. Therefore FISH was able to submit the USAID Uganda performance reports (previ-ously known as the OP report), the microenterprise results reports (MRR), and the IEHA reports on time but was late submitting the project’s own set of performance indicators. If FISH were continued, the services of UMEMS
would have been requested for much more of the reporting and indicators would be adjusted as USAID adjusted its own. The USAID policy to annually audit indicator data is exemplary. If the various government services in Uganda could be introduced to these monitoring and evaluation methods, as many NGOs and private consultants are, government statistics would be more dependable.
“Dr Nelly”, second from left, encouraged
staff of many tertiary learning institutions to
develop their field expertise.
“Happas” (net enclosures) are used to
raise the tilapia “fry” at SoN Fish Farm, Ltd.,
which are then sold to outgrowers who
grow the fish to “fingerling” fize to seel to
production farmers.
Administration and Staffing 46
This was a small project that was faced with the same reporting and administra-tive needs as a large project. This meant that the chief of party (CoP) who was the lead technical person was often pulled away from technical matters to spend time on administration. The problem became most apparent towards the end of FISH when it was clear the CoP had to do more training but could not. This was why it was recommended to include fish farming into the larger agriculture development project as was done for the LEAD project. There is, however, a danger that fish farming will be side-lined and its special needs will be ignored. However, the greater danger is that a larger project will be led into believing that fish farming is widely understood by people and special-ized technical help is not required. There are very few in Uganda who have actually been involved in growing fish for profit but very many who believe themselves to be qualified to advise farmers.
The reason why FISH was able to achieve so much in such a short time was the in-volvement of the fish farmers. They were involved in the selection of the technical staff. The farmers pushed for the train-ing sessions. The farmers told the team what problems they were encountering. The FISH team worked with farmers on their farms. Though, not very many farms could be reached this way, it created a group of people with real knowledge (information plus experience). Knowledge does not leave at the end of a project and cannot be taken away.
FISH staff, although few, worked on multiple tasks. The drivers became adept at live fish transport, cage-making, and fish harvesting. It should be noted that
only one Ugandan staff member had ever worked for a USAID contractor before. Staff originated from all over Uganda: Tororo, Teso, Kaberamaido, Hoima, Gulu, Jinja, and Entebbe.
Staff Summary
Chief of Party and lead technical advisor: Karen Veverica; June 2005-Nov. 2008
Pond and hatchery advisor:Dr. Nelly Ajangale Isyagi, DVM;Sept. 2005-Nov. 2008
Cage and marketing advisor:Rashid Asiimwe; Aug. 2005-Nov. 2008
Operations managers:John Sseyanga; Aug. 2005-Aug. 2006 (deceased); James Sekatawa; Nov. 2006-Nov. 2008
Assistant operations managers:Benjamin Okurut Nov 2005-Oct 2007 (resigned); Joseph Aruma: Dec. 2007-Sept. 2008
Drivers: Sonko Ayub(deceased);Moses Mukembo, David Edadu, and Omara Altilio (Tony)
Administrationand Staffing
Nelly Isyagi
Karen Veverica
Rashid Asiimwe
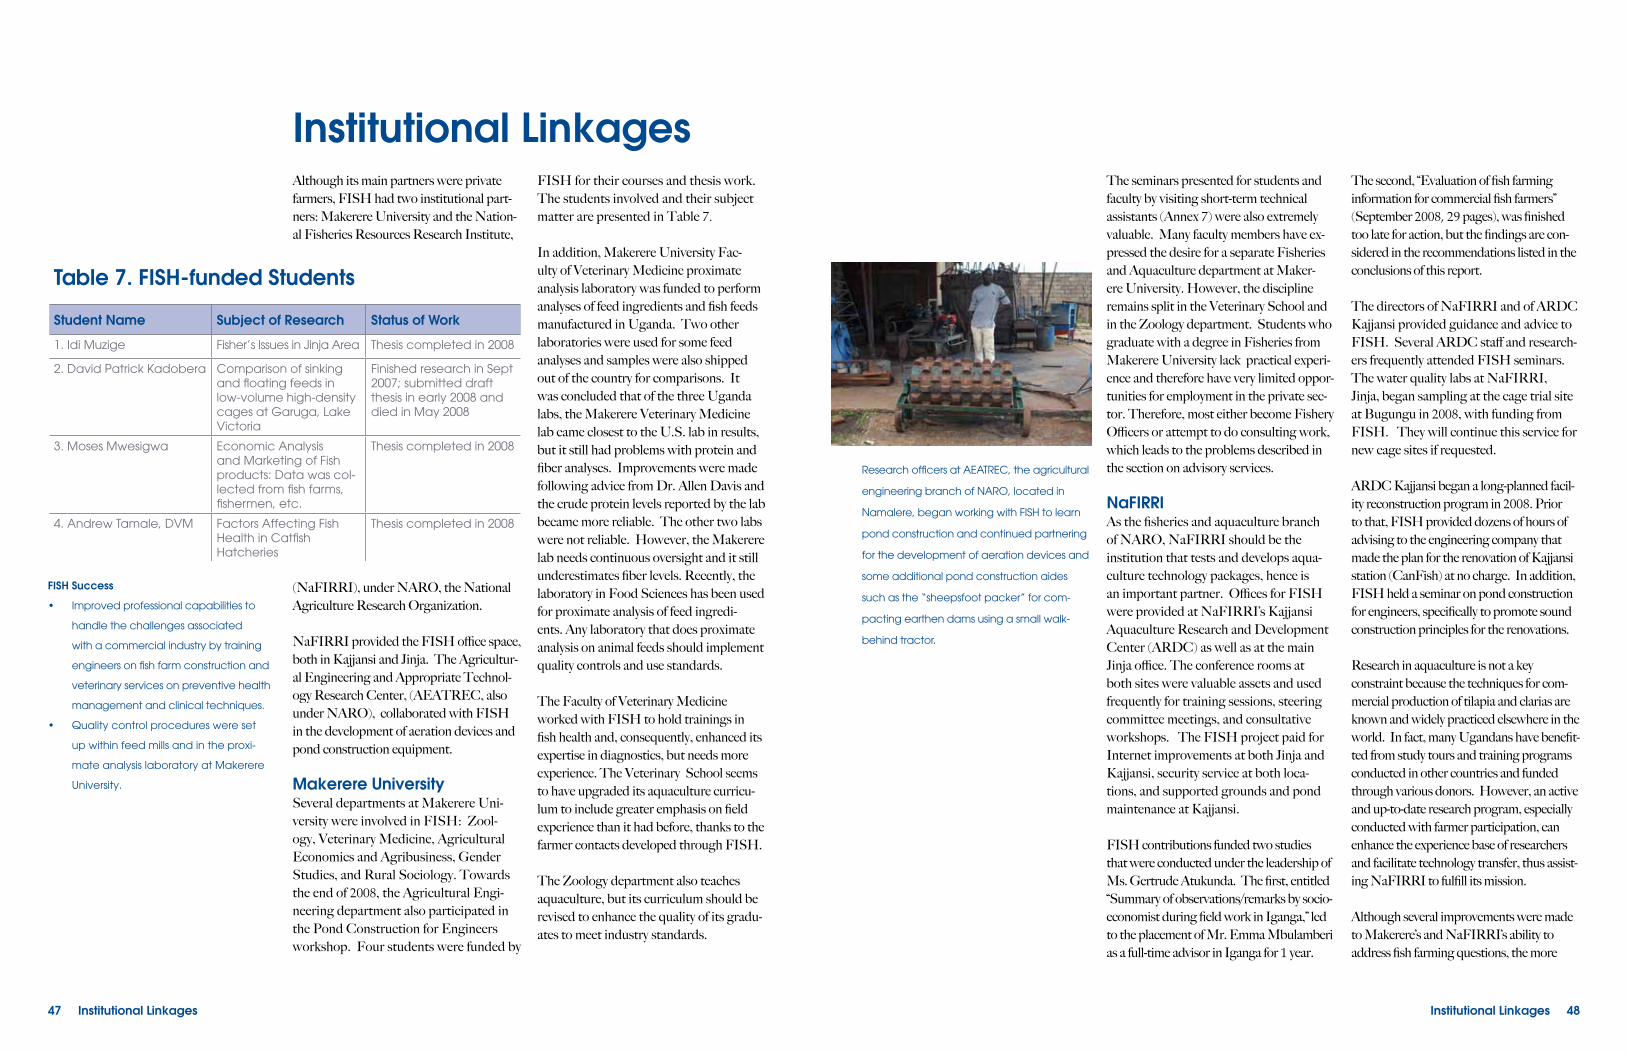
FISH Success
• Improved professional capabilities to
handle the challenges associated
with a commercial industry by training
engineers on fish farm construction and
veterinary services on preventive health
management and clinical techniques.
• Quality control procedures were set
up within feed mills and in the proxi-
mate analysis laboratory at Makerere
University.
47 Institutional Linkages
Although its main partners were private farmers, FISH had two institutional part-ners: Makerere University and the Nation-al Fisheries Resources Research Institute,
(NaFIRRI), under NARO, the National Agriculture Research Organization.
NaFIRRI provided the FISH office space, both in Kajjansi and Jinja. The Agricultur-al Engineering and Appropriate Technol-ogy Research Center, (AEATREC, also under NARO), collaborated with FISH in the development of aeration devices and pond construction equipment.
Makerere UniversitySeveral departments at Makerere Uni-versity were involved in FISH: Zool-ogy, Veterinary Medicine, Agricultural Economics and Agribusiness, Gender Studies, and Rural Sociology. Towards the end of 2008, the Agricultural Engi-neering department also participated in the Pond Construction for Engineers workshop. Four students were funded by
FISH for their courses and thesis work. The students involved and their subject matter are presented in Table 7.
In addition, Makerere University Fac-ulty of Veterinary Medicine proximate analysis laboratory was funded to perform analyses of feed ingredients and fish feeds manufactured in Uganda. Two other laboratories were used for some feed analyses and samples were also shipped out of the country for comparisons. It was concluded that of the three Uganda labs, the Makerere Veterinary Medicine lab came closest to the U.S. lab in results, but it still had problems with protein and fiber analyses. Improvements were made following advice from Dr. Allen Davis and the crude protein levels reported by the lab became more reliable. The other two labs were not reliable. However, the Makerere lab needs continuous oversight and it still underestimates fiber levels. Recently, the laboratory in Food Sciences has been used for proximate analysis of feed ingredi-ents. Any laboratory that does proximate analysis on animal feeds should implement quality controls and use standards.
The Faculty of Veterinary Medicine worked with FISH to hold trainings in fish health and, consequently, enhanced its expertise in diagnostics, but needs more experience. The Veterinary School seems to have upgraded its aquaculture curricu-lum to include greater emphasis on field experience than it had before, thanks to the farmer contacts developed through FISH.
The Zoology department also teaches aquaculture, but its curriculum should be revised to enhance the quality of its gradu-ates to meet industry standards.
Institutional Linkages
Table 7. FISH-funded Students
Student Name Subject of Research Status of Work
1. Idi Muzige Fisher’s Issues in Jinja Area Thesis completed in 2008
2. David Patrick Kadobera Comparison of sinking and floating feeds in low-volume high-density cages at Garuga, Lake Victoria
Finished research in Sept 2007; submitted draft thesis in early 2008 and died in May 2008
3. Moses Mwesigwa Economic Analysis and Marketing of Fish products: Data was col-lected from fish farms, fishermen, etc.
Thesis completed in 2008
4. Andrew Tamale, DVM Factors Affecting Fish Health in CatfishHatcheries
Thesis completed in 2008
Research officers at AEATREC, the agricultural
engineering branch of NARO, located in
Namalere, began working with FISH to learn
pond construction and continued partnering
for the development of aeration devices and
some additional pond construction aides
such as the “sheepsfoot packer” for com-
pacting earthen dams using a small walk-
behind tractor.
Institutional Linkages 48
The seminars presented for students and faculty by visiting short-term technical assistants (Annex 7) were also extremely valuable. Many faculty members have ex-pressed the desire for a separate Fisheries and Aquaculture department at Maker-ere University. However, the discipline remains split in the Veterinary School and in the Zoology department. Students who graduate with a degree in Fisheries from Makerere University lack practical experi-ence and therefore have very limited oppor-tunities for employment in the private sec-tor. Therefore, most either become Fishery Officers or attempt to do consulting work, which leads to the problems described in the section on advisory services.
NaFIRRIAs the fisheries and aquaculture branch of NARO, NaFIRRI should be the institution that tests and develops aqua-culture technology packages, hence is an important partner. Offices for FISH were provided at NaFIRRI’s Kajjansi Aquaculture Research and Development Center (ARDC) as well as at the main Jinja office. The conference rooms at both sites were valuable assets and used frequently for training sessions, steering committee meetings, and consultative workshops. The FISH project paid for Internet improvements at both Jinja and Kajjansi, security service at both loca-tions, and supported grounds and pond maintenance at Kajjansi.
FISH contributions funded two studies that were conducted under the leadership of Ms. Gertrude Atukunda. The first, entitled “Summary of observations/remarks by socio-economist during field work in Iganga,” led to the placement of Mr. Emma Mbulamberi as a full-time advisor in Iganga for 1 year.
The second, “Evaluation of fish farming information for commercial fish farmers” (September 2008, 29 pages), was finished too late for action, but the findings are con-sidered in the recommendations listed in the conclusions of this report.
The directors of NaFIRRI and of ARDC Kajjansi provided guidance and advice to FISH. Several ARDC staff and research-ers frequently attended FISH seminars. The water quality labs at NaFIRRI, Jinja, began sampling at the cage trial site at Bugungu in 2008, with funding from FISH. They will continue this service for new cage sites if requested.
ARDC Kajjansi began a long-planned facil-ity reconstruction program in 2008. Prior to that, FISH provided dozens of hours of advising to the engineering company that made the plan for the renovation of Kajjansi station (CanFish) at no charge. In addition, FISH held a seminar on pond construction for engineers, specifically to promote sound construction principles for the renovations.
Research in aquaculture is not a key constraint because the techniques for com-mercial production of tilapia and clarias are known and widely practiced elsewhere in the world. In fact, many Ugandans have benefit-ted from study tours and training programs conducted in other countries and funded through various donors. However, an active and up-to-date research program, especially conducted with farmer participation, can enhance the experience base of researchers and facilitate technology transfer, thus assist-ing NaFIRRI to fulfill its mission.
Although several improvements were made to Makerere’s and NaFIRRI’s ability to address fish farming questions, the more
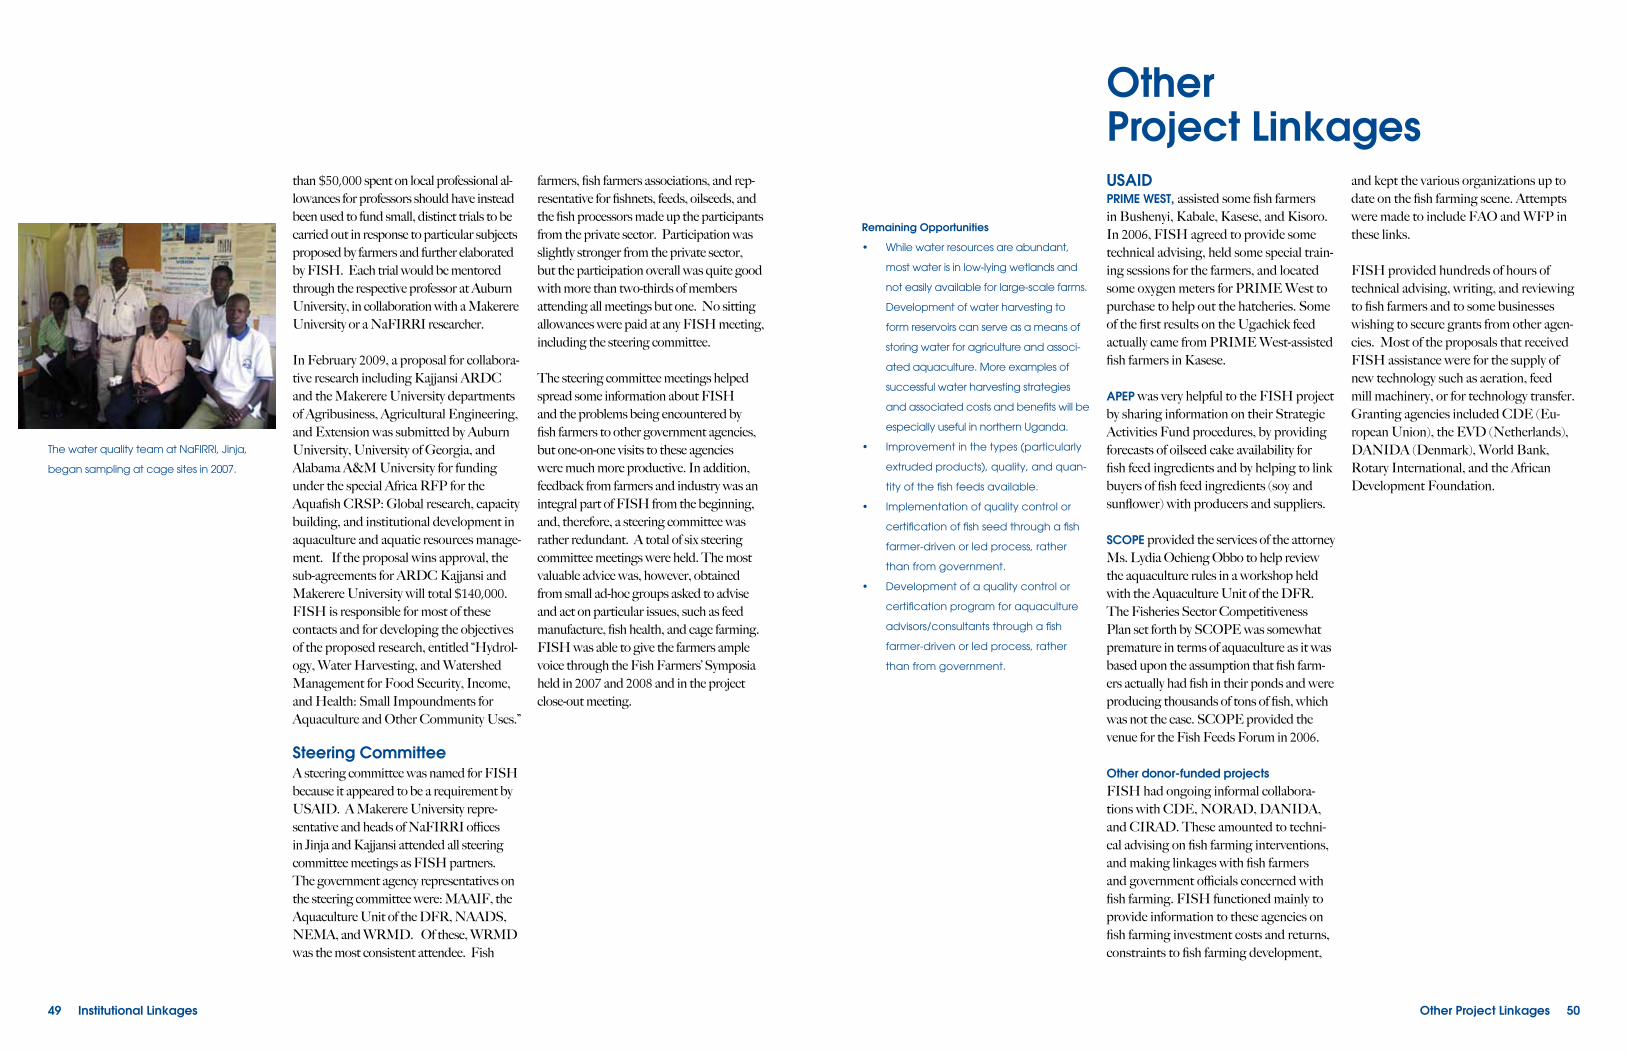
Other Project Linkages 50
USAIDPRIME WEST, assisted some fish farmers in Bushenyi, Kabale, Kasese, and Kisoro. In 2006, FISH agreed to provide some technical advising, held some special train-ing sessions for the farmers, and located some oxygen meters for PRIME West to purchase to help out the hatcheries. Some of the first results on the Ugachick feed actually came from PRIME West-assisted fish farmers in Kasese.
APEP was very helpful to the FISH project by sharing information on their Strategic Activities Fund procedures, by providing forecasts of oilseed cake availability for fish feed ingredients and by helping to link buyers of fish feed ingredients (soy and sunflower) with producers and suppliers.
SCOPE provided the services of the attorney Ms. Lydia Ochieng Obbo to help review the aquaculture rules in a workshop held with the Aquaculture Unit of the DFR. The Fisheries Sector Competitiveness Plan set forth by SCOPE was somewhat premature in terms of aquaculture as it was based upon the assumption that fish farm-ers actually had fish in their ponds and were producing thousands of tons of fish, which was not the case. SCOPE provided the venue for the Fish Feeds Forum in 2006.
Other donor-funded projectsFISH had ongoing informal collabora-tions with CDE, NORAD, DANIDA, and CIRAD. These amounted to techni-cal advising on fish farming interventions, and making linkages with fish farmers and government officials concerned with fish farming. FISH functioned mainly to provide information to these agencies on fish farming investment costs and returns, constraints to fish farming development,
and kept the various organizations up to date on the fish farming scene. Attempts were made to include FAO and WFP in these links.
FISH provided hundreds of hours of technical advising, writing, and reviewing to fish farmers and to some businesses wishing to secure grants from other agen-cies. Most of the proposals that received FISH assistance were for the supply of new technology such as aeration, feed mill machinery, or for technology transfer. Granting agencies included CDE (Eu-ropean Union), the EVD (Netherlands), DANIDA (Denmark), World Bank, Rotary International, and the African Development Foundation.
OtherProject Linkages
Remaining Opportunities
• While water resources are abundant,
most water is in low-lying wetlands and
not easily available for large-scale farms.
Development of water harvesting to
form reservoirs can serve as a means of
storing water for agriculture and associ-
ated aquaculture. More examples of
successful water harvesting strategies
and associated costs and benefits will be
especially useful in northern Uganda.
• Improvement in the types (particularly
extruded products), quality, and quan-
tity of the fish feeds available.
• Implementation of quality control or
certification of fish seed through a fish
farmer-driven or led process, rather
than from government.
• Development of a quality control or
certification program for aquaculture
advisors/consultants through a fish
farmer-driven or led process, rather
than from government.
49 Institutional Linkages
than $50,000 spent on local professional al-lowances for professors should have instead been used to fund small, distinct trials to be carried out in response to particular subjects proposed by farmers and further elaborated by FISH. Each trial would be mentored through the respective professor at Auburn University, in collaboration with a Makerere University or a NaFIRRI researcher.
In February 2009, a proposal for collabora-tive research including Kajjansi ARDC and the Makerere University departments of Agribusiness, Agricultural Engineering, and Extension was submitted by Auburn University, University of Georgia, and Alabama A&M University for funding under the special Africa RFP for the Aquafish CRSP: Global research, capacity building, and institutional development in aquaculture and aquatic resources manage-ment. If the proposal wins approval, the sub-agreements for ARDC Kajjansi and Makerere University will total $140,000. FISH is responsible for most of these contacts and for developing the objectives of the proposed research, entitled “Hydrol-ogy, Water Harvesting, and Watershed Management for Food Security, Income, and Health: Small Impoundments for Aquaculture and Other Community Uses.”
Steering CommitteeA steering committee was named for FISH because it appeared to be a requirement by USAID. A Makerere University repre-sentative and heads of NaFIRRI offices in Jinja and Kajjansi attended all steering committee meetings as FISH partners. The government agency representatives on the steering committee were: MAAIF, the Aquaculture Unit of the DFR, NAADS, NEMA, and WRMD. Of these, WRMD was the most consistent attendee. Fish
farmers, fish farmers associations, and rep-resentative for fishnets, feeds, oilseeds, and the fish processors made up the participants from the private sector. Participation was slightly stronger from the private sector, but the participation overall was quite good with more than two-thirds of members attending all meetings but one. No sitting allowances were paid at any FISH meeting, including the steering committee.
The steering committee meetings helped spread some information about FISH and the problems being encountered by fish farmers to other government agencies, but one-on-one visits to these agencies were much more productive. In addition, feedback from farmers and industry was an integral part of FISH from the beginning, and, therefore, a steering committee was rather redundant. A total of six steering committee meetings were held. The most valuable advice was, however, obtained from small ad-hoc groups asked to advise and act on particular issues, such as feed manufacture, fish health, and cage farming. FISH was able to give the farmers ample voice through the Fish Farmers’ Symposia held in 2007 and 2008 and in the project close-out meeting.
The water quality team at NaFIRRI, Jinja,
began sampling at cage sites in 2007.
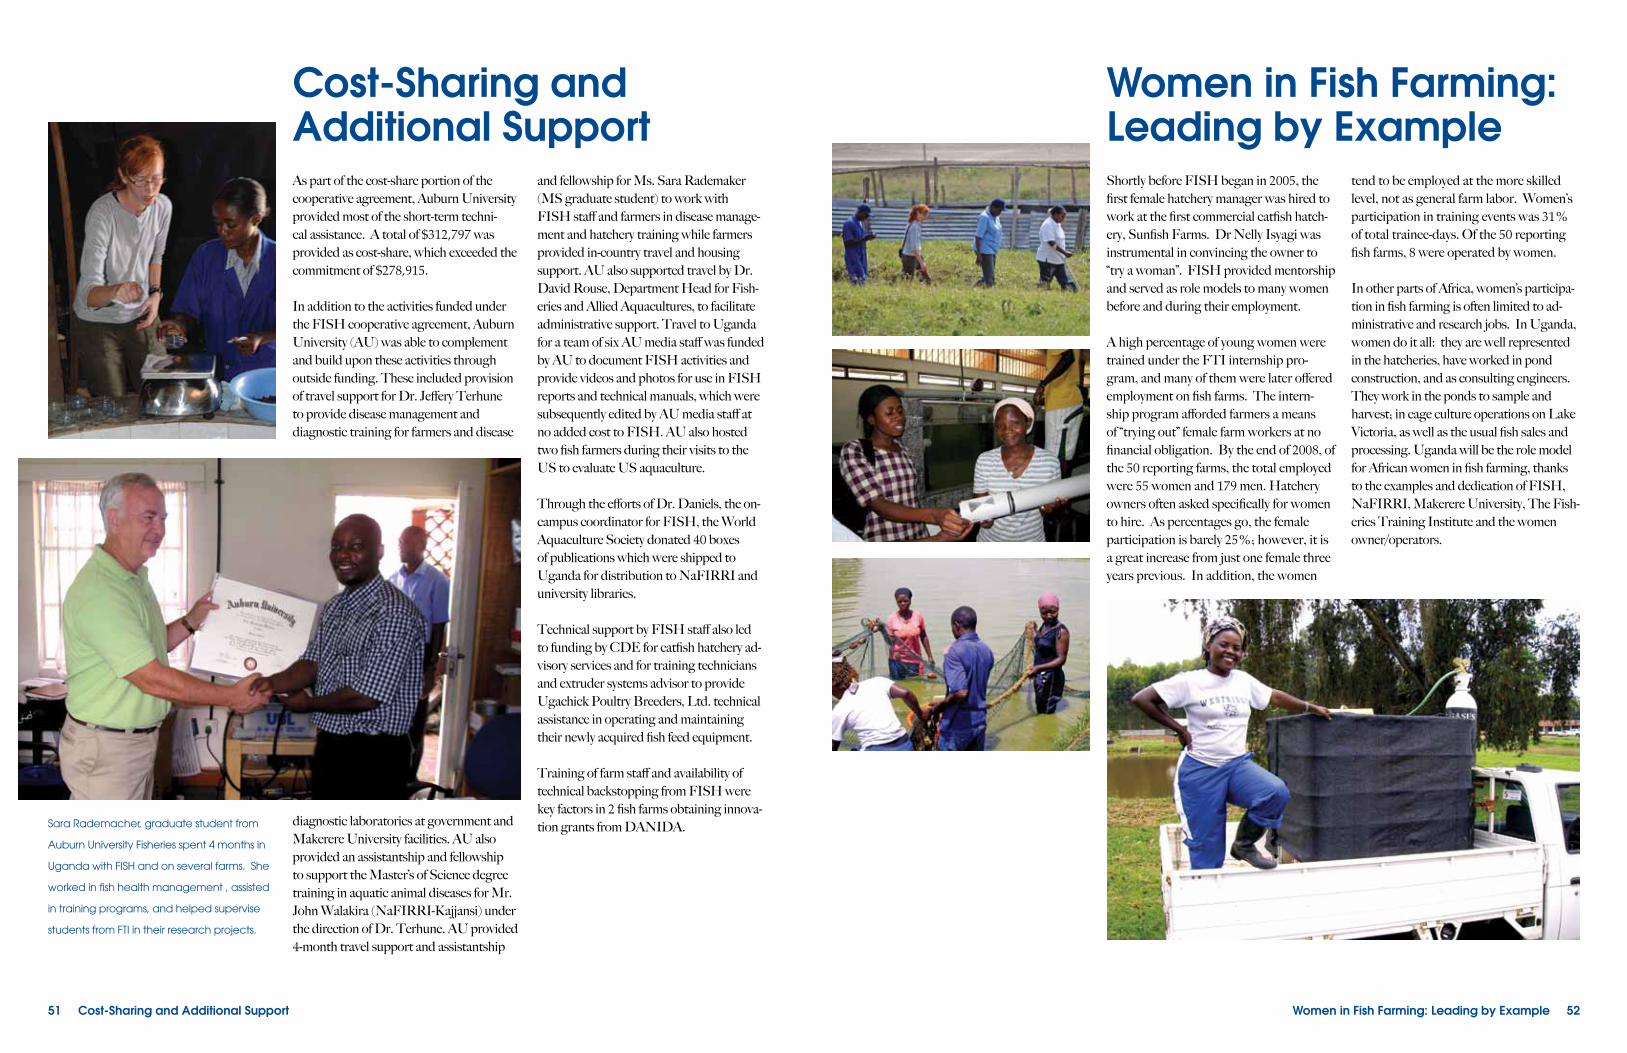
51 Cost-Sharing and Additional Support Women in Fish Farming: Leading by Example 52
Sara Rademacher, graduate student from
Auburn University Fisheries spent 4 months in
Uganda with FISH and on several farms. She
worked in fish health management , assisted
in training programs, and helped supervise
students from FTI in their research projects.
As part of the cost-share portion of the cooperative agreement, Auburn University provided most of the short-term techni-cal assistance. A total of $312,797 was provided as cost-share, which exceeded the commitment of $278,915.
In addition to the activities funded under the FISH cooperative agreement, Auburn University (AU) was able to complement and build upon these activities through outside funding. These included provision of travel support for Dr. Jeffery Terhune to provide disease management and diagnostic training for farmers and disease
diagnostic laboratories at government and Makerere University facilities. AU also provided an assistantship and fellowship to support the Master’s of Science degree training in aquatic animal diseases for Mr. John Walakira (NaFIRRI-Kajjansi) under the direction of Dr. Terhune. AU provided 4-month travel support and assistantship
and fellowship for Ms. Sara Rademaker (MS graduate student) to work with FISH staff and farmers in disease manage-ment and hatchery training while farmers provided in-country travel and housing support. AU also supported travel by Dr. David Rouse, Department Head for Fish-eries and Allied Aquacultures, to facilitate administrative support. Travel to Uganda for a team of six AU media staff was funded by AU to document FISH activities and provide videos and photos for use in FISH reports and technical manuals, which were subsequently edited by AU media staff at no added cost to FISH. AU also hosted two fish farmers during their visits to the US to evaluate US aquaculture.
Through the efforts of Dr. Daniels, the on-campus coordinator for FISH, the World Aquaculture Society donated 40 boxes of publications which were shipped to Uganda for distribution to NaFIRRI and university libraries.
Technical support by FISH staff also led to funding by CDE for catfish hatchery ad-visory services and for training technicians and extruder systems advisor to provide Ugachick Poultry Breeders, Ltd. technical assistance in operating and maintaining their newly acquired fish feed equipment.
Training of farm staff and availability of technical backstopping from FISH were key factors in 2 fish farms obtaining innova-tion grants from DANIDA.
Cost-Sharing andAdditional Support
Shortly before FISH began in 2005, the first female hatchery manager was hired to work at the first commercial catfish hatch-ery, Sunfish Farms. Dr Nelly Isyagi was instrumental in convincing the owner to “try a woman”. FISH provided mentorship and served as role models to many women before and during their employment.
A high percentage of young women were trained under the FTI internship pro-gram, and many of them were later offered employment on fish farms. The intern-ship program afforded farmers a means of “trying out” female farm workers at no financial obligation. By the end of 2008, of the 50 reporting farms, the total employed were 55 women and 179 men. Hatchery owners often asked specifically for women to hire. As percentages go, the female participation is barely 25%; however, it is a great increase from just one female three years previous. In addition, the women
tend to be employed at the more skilled level, not as general farm labor. Women’s participation in training events was 31% of total trainee-days. Of the 50 reporting fish farms, 8 were operated by women.
In other parts of Africa, women’s participa-tion in fish farming is often limited to ad-ministrative and research jobs. In Uganda, women do it all: they are well represented in the hatcheries, have worked in pond construction, and as consulting engineers. They work in the ponds to sample and harvest; in cage culture operations on Lake Victoria, as well as the usual fish sales and processing. Uganda will be the role model for African women in fish farming, thanks to the examples and dedication of FISH, NaFIRRI, Makerere University, The Fish-eries Training Institute and the women owner/operators.
Women in Fish Farming: Leading by Example

Commercial is less a matter of size and more
a matter of management. If Uganda wishes
to maintain a large proportion of its popula-
tion in rural employment, then farms will al-
ways be relatively small and profits will never
be great. As farm size diminishes, farming
practices will need to be optimized in order
to provide the farmer with sufficient income.
Umoja farm changed from pond-based
food-fish production to catfish hatchery due
to its water limitations. The farm uses only a
small percentage of its original pond area
and has begun to turn a profit.
Fish farming in Uganda suffers from the same constraints as would any other com-mercial agriculture development. Poor infrastructure, land tenure problems, lack of inputs, marketing problems and lack of effective extension services are a common thread throughout the agriculture sector. These are problems that require a long-term and multi-faceted solution. USAID has endeavored to spend more than 15 years assisting agriculture development in Uganda. However, it has only recently included fish farming into the mix.
Watershed management as well as expanded and improved water harvesting methods are even more important for Uganda’s food security. Fish farming is often a means of generating interest in water harvesting and can add value to water reservoirs.
Fisheries Investment for Sustainable Harvest, in only 3.5 years, was able to set the ground work for commercial fish farming in Uganda and has positioned Uganda in the forefront of aquaculture in the region. FISH was able to move a small group of farmers from near-subsistence to commercial level, and some larger farms from money-losing to profit-making. Several new enterprises in pond construction services, fingerling suppliers, fish processing/marketing and gear manufacture have developed. Now, it is possible to spread the effects to a much wider audience, which is exactly what the farmers have requested.
Large-scale farms will develop as fish feeds be-come more available. Large farms can employ large numbers of workers and mid-level crew supervisors. They will likely source much of their expertise from outside Uganda, but if the university curricula are improved, Ugan-dans would be able to fill many of the manage-
ment posts on large fish farms. Interested investors from Norway, Israel, Costa Rica and South Africa have already sought advice from FISH on fish farming possibilities.
Smaller-scale farms (there are over 15,000 fish ponds in Uganda) can also be com-mercially viable and a means of income generation for thousands of families. Based upon the aquaculture systems de-veloped and tested by FISH, two econom-ic models for small commercial fish farms, (8 cages of 6m3 each, or 8 ponds of 500m2 each) have been developed that could provide family monthly income of $75 to $250. However, these model systems must be implemented and evaluated in more districts to substantiate their sustainability and profitability and to fully develop a core commercial sector in Uganda.
This expansion will require a group of well-trained advisors to identify farmers, assist them in setting up model fish farms-ponds or cages, and help them to carry out their first production cycle. In addition, access to quality feed, fingerlings and finances needs to be in place. The fingerlings are available. The feed needs some addi-tional technical backstopping in the form of STTA for 4 trips of 2 weeks each over two years, and some locally-available technical advising and farmer training. The financial services are best provided as part of a larger agricultural lending service and need to be organized in a way that is self-sustaining. Access to finance for a well-planned and well-advised fish farm will be very beneficial to the development of commercial aquacul-ture. However, merely paying farmers to grow fish in the absence of sound technical advice will negate the progress FISH has made.
Way Forward
Way Forward 5453 Farmer’s End-of-Project Comments
From July through September 2008, FISH staff asked the farmers who attended train-ing frequently what they have gotten out of the project and what they would recom-mend for future interventions. The major benefits to farmers from FISH were:• Farmers feel they are more independent,• Fish farm operations are more
profitable and expanding in a “clever” manner,
• The farmers have more critical think-ing and analysis of situations, and
• The farmers feel they are more dy-namic and innovative.
In short, one can say the farmers have gained confidence and income.
The key technical areas where farmers feel FISH had a positive impact on their production and returns are:• Pond construction that is much better
and less expensive;• Stocking units based on carrying ca-
pacity which saves on fingerling costs;• Live fish transportation and recom-
mended sizes at stocking, resulting in increased survival rates to harvest for grow-out farmers;
• Availability of commercial feeds;• Feeding techniques–notably feeding
by response and using the feed charts; • Water quality management tech-
niques and recommendations;• Live fish handling, which resulted in
reduced mortality whenever units are sampled or harvested (both for grow-out and hatchery);
• Record keeping, analysis, and evaluation; and
• Recommendations even helped those farmers who could not afford feed improve their production and returns with the resources they had at hand.
Things that farmers felt that FISH should have also done:• Have a wider coverage so that more
farmers could have benefited from its services; and
• Had a component that provided inputs (notably feed, seed, nets for sampling) be it at a cost.
The above critiques are excellent indica-tions of the direction for follow-on activities.
As information sources for fish farmers become more varied they will be less controlled. Users of information need to be trained in how to evaluate the infor-mation they are receiving. The only way to combat the untested and incorrect information that now floods the market is to increase the number of well-informed and experienced advisers. This will provide farmers and funding agencies with a choice. A certification program will help them make that choice but only if the certifying agency is independent of government agencies. Farmers groups are better suited to certifying advisers, as they are the end-users of the advice.
Farmers’ End-of-Project Comments
How can USAID or other donors
contribute to development of a successful
aquaculture industry?
• Develop a collaborative, coordinated
strategic plan among donors to imple-
ment a focused aquaculture develop-
ment program.
• Continue sectoral assistance for feed
mills, fish gear manufacturers, and
aquaculture suppliers, mostly in terms of
technical advising.
• Expand private sector advisory services
for new farmers to other areas of the
country by training more advisors and
promoting demonstration farms in the
North, West, and East.
• Assist farmers in setting up marketing
schemes through which they can group
their produce for coordinated sales.
• Assist farmer groups in accessing equip-
ment, qualified advisors, quality feed,
and quality seed at favorable prices.
• Help small commercial fish farms
develop by providing loan guarantees,
but only if services of a certified advisor
can be assured.
• Increase utilization of private sector con-
sultants to avoid conflicts of interest as-
sociated with government employees.
• Encourage development of an aqua-
culture curriculum and a Fisheries de-
partment within newer universities, such
as Gulu University or Busoga University,
to produce highly qualified graduates
with proven hands-on experience.

References 56
Atukunda, G., and J.K. Walakira. 2008. Evaluation of fish farming information for commercial fish farmers. NaFIRRI report. 29pp. To be available on FISH website as well as NaFIRRI.
Atukunda, G. 2007. Summary of observa-tions/remarks by socioeconomist during field work in Iganga September 2007. NaFIRRI report. 7pp.
Atukunda, G. and Mwesigwa, M.R. 2006. Am economic assessment of commercial fish farming in Central Uganda. IFPRI report
Molnar, Veverica, Atukunda, and Ka-bonesa. 2005. Fisheries Investment for Sustainable Harvest: Results framework, performance management plan and indica-tor reference sheets. First printed in 2005; last revision in 2008. Available through UMEMS, 43 pages
Walekwha, P.N. 2005. Estimating de-mand for African Catfish as bait for Nile Perch fishery on Lake Victoria. Report of baseline survey submitted to Uganda Fish Farmers Association (UFFA) Department of Agricultural Economics & Agribusiness, Makerere University, Kampala, 38p.
USAID FISH has received international attention at aquaculture society meetings without using project funds. These include the following citations.
Veverica, K., Nelly Isyagi, Justus Rutaisire, Owori Wadunde, and William Daniels. 2006. “FISH: Jump-starting an aquaculture industry in Uganda.” World Aquaculture Society’s Book of Abstracts AQUA 2006, Florence, Italy, May 9-13, 2006, p. 989.
Daniels, W. H., and K. L. Veverica. 2008. Challenges to developing a commercial aquaculture industry in Africa: Lessons from Uganda. World Aquaculture Society’s Book of Abstracts Aquaculture 2008,Busan, Korea, May 19-23, 2008. p. 294.
Daniels, W. H., and K. L. Veverica. 2008. FISH: A project to stimulate development of a commercial aquaculture industry in Uganda-Can it be used as a model for Af-rica? African Fishes and Fisheries Diversity and Utilization, 4th International Confer-ence of the Pan African Fish and Fisher-ies Association (PAFFA), Addis Ababa, Ethiopia, September 22-26, 2008. p. 170.
Veverica, K. L., and Nelly A. Isyagi. 2009. Women in Aquaculture Development. World Aquaculture Society’s Book of Abstracts Aquaculture 2009, Vera Cruz, Mexico, Sept. 25-30, 2009.
Veverica, K. L., N. Isyagi, W. Daniels, and R. Asiimwe. 2009. Planning a small aqua-culture business based upon rural markets in Uganda. World Aquaculture Society’s Book of Abstracts Aquaculture 2009, Vera Cruz, Mexico, Sept. 25-30, 2009.
ReferencesWhile only 2 well-trained advisors are currently available, there are many good candidates who, after a short, intensive training, could become qualified advisors and trainers. The training will serve to harmonize the advisors’ message and must include:• Proper farm design and pond and cage
construction/renovation;• Farm planning and management,
particularly (feed management, stock-ing, harvesting, record-keeping, and personnel management)
• Business planning, including cash flow analysis
Provided the feed and finance sectors are adequately backstopped, the success of such an endeavor will be determined by
the choice of advisors and the quality of their training. The cost will be minimal, relative to what has been spent already in agriculture. The benefit is not only to fish farmers, but to agriculture producers who provide the feed ingredients and to regional consumers who are facing diminishing sup-plies of fish.
A highly competitive and sustaining fish farming industry that includes large, medium and small farms, all of them profit-able, will require a further investment of a relatively small amount of money- about $500,000 per year, spread over about ten years. Alternatively, a total of about $10 mil-lion over 3 years could also yield very good results but would be less likely to result in sustaining small farms.
55 Way Forward
The tradeshow at the Second Fish Farmers’
Symposium, May 2008.
Filling the locally-made demand feeder on
the cages at SoN Fish Farm, Ltd.Harvesting the first set of cage culture trials
at Uganda Fish Packers’ former landing site,
Lake Victoria, Jinja. Densities of 180 kg/m3
were obtained.
All-male tilapia exhibit more uniform growth
than mixed-sex tilapia, especially in the later
stages of production. Initial demonstratiions
used hand-sexed juveniles.

57 References
Veverica, K.L., R. Asiimwe, N. Isyagi, and W. Daniels. 2009. High density tilapia culture in locally-made low volume cages in Uganda. World Aquaculture Society’s Book of Abstracts Aquaculture 2009, Vera Cruz, Mexico, Sept. 25-30, 2009.
Selected FISH documents available on Auburn’s website:www.ag.auburn.edu/fish/international/uganda
FISH Annual Report 2006
FISH Annual Report, 2007
Proceedings of the First Fish Farmers’ Symposium 26 April 2007. Includes 19 full presentations.
Fish Farmers’ Symposium and Trade Show, May 6-7, 2008, held at UMA Conference Hall, Lugogo, Kampala. Includes 18 full presentations including enterprise budget worksheets.
Proceedings of the Fish Feeds Forum, 19 January 2006 (7 presentations)
Proceedings of the Consultative Work-shop on Aspects of Fish Health Manage-ment, 13 April 2006
Fish pond construction for Commercial Aquaculture: Definitions and standards
What is carrying capacity? And why is it important?
Feeding Fish in Commercial Ponds using Complete Diets
Trip report of Dr. Boyd, October 2007.Discusses cage culture in Lake Victoria with regard to potential nutrient loading. Presents site selection evaluation criteria and best management practices for cage culture.
The Uganda Commercial Fish Farmers’ Inputs and Services Suppliers Guide, April 2009, 80 pages; gives information on 40 private firms and six government institutions that provide services to the fish farming sector.
Coming soon….Manual for the Commercial Pond Produc-tion of the African Catfish, 200 pages; provides a complete set of recommended practices for profitable production of cat-fish; based upon data collected during the demonstration farm trials. In review, due to be out at end of July 2009.
Manual for the Commercial Production of Nile Tilapia in Ponds, 200 pages; provides a complete set of recommended practices for profitable production of tilapia; based upon data collected during the demonstra-tion farm trials. In first revisions, due to be out at end of August 2009.
Manual for the Commercial Production of Nile Tilapia in Low volume-High Density Cages, estimated 100 pages; in draft. Final revisions and printing scheduled for end of September 2009.
The Uganda Commercial Fish Farmers’ Inputs and Services Suppliers Guide April 2009
The Uganda Commercial Fish Farmers’
Inputs and Services Suppliers Guide April 2009
The “Buyers Guide”, indicates where to
purchase inputs and supplies needed for fish
farming is the first of its kind in Africa.
Ann
ex
1: T
ypic
al P
rog
ress
ion
of A
qua
cul
ture
De
velo
pm
ent
De
veo
pm
ent
C
rite
riaSu
bst
anc
e L
eve
lEm
erg
ing
Fis
h Fa
rme
r Le
vel
Sta
rt U
p C
om
me
rcia
l Fi
sh F
arm
ers
De
velo
pin
g C
om
me
rcia
l Fis
h Fa
rme
rsA
qua
cul
ture
Ind
ustry
1. Q
ua
lity
Fish
Fa
rm D
esig
n &
C
on
stru
ctio
n
No
ne
No
ne
Lim
ited
ba
sed
up
on
visi
ts
to o
the
r fa
rms/
fac
ilitie
s w
ith in
co
mp
lete
or p
oo
r d
esig
ns
De
velo
pm
en
t o
f c
ore
gro
up
of
co
mm
erc
ially
via
ble
pro
du
ce
rs
an
d p
oo
r co
pyc
ats
; De
sign
by
ac
ad
em
ia o
r go
vern
me
nt
sup
po
rt
Esta
blis
hm
en
t o
f sp
ec
ializ
ed
se
rvic
es
by
priv
ate
se
c-
tor-
Eng
ine
erin
g, d
esig
n a
nd
co
nst
ruc
tion
se
rvic
es
2. Q
ua
lity
& Q
ua
n-
titie
s o
f Fe
ed
sC
om
po
st o
r su
pp
lem
en
-ta
l fe
ed
s (A
g/h
ou
seh
old
w
ast
es)
Sup
ple
me
nta
l or o
n-f
arm
fe
ed
pro
-d
uc
tion
Lim
ited
ac
ce
ss,
in-
co
mp
lete
on
-fa
rm
pro
du
ce
d s
inki
ng
fe
ed
s
De
velo
pm
en
t o
f n
utr
itio
na
lly
co
mp
lete
pe
llete
d f
ee
ds
with
in
cre
ase
d a
cc
ess
, bu
t lim
ited
u
nd
ers
tan
din
g o
f fe
ed
ap
plic
atio
n
an
d it
s e
co
no
mic
s
Extr
ud
ed
an
d p
elle
ted
fee
ds
wid
ely
ava
ilab
le w
ith
qu
alit
y c
on
tro
l me
asu
res
in p
lac
e; F
ee
d c
ost
s d
e-
cre
ase
or r
em
ain
th
e s
am
e (
bu
t q
ua
lity
inc
rea
ses)
as
ma
rke
t e
xpa
nd
s a
nd
co
mp
etit
ion
inc
rea
ses.
3. Q
ua
lity
& Q
ua
n-
titie
s o
f Fi
sh S
ee
d
fro
m H
atc
he
ries
Irre
gu
lar,
limite
d a
vaila
bil-
ity;
Usu
ally
na
tura
l po
nd
p
rod
uc
tion
or g
ove
rn-
me
nt
sup
plie
d
Go
vern
me
nt
sup
plie
s se
ed
; Lim
ited
h
atc
he
ry d
esig
n; L
imite
d a
rtifi
cia
l sp
aw
nin
g t
ec
hn
iqu
es
Imp
rove
d H
atc
he
ry D
e-
sign
with
Ae
ratio
n; U
se
of
Art
ific
ial S
pa
wn
ing
Te
ch
niq
ue
s
Inc
rea
sed
use
of
art
ific
ial s
pa
wn
-in
g w
ith g
rea
ter p
rod
uc
tion
inte
n-
sity
thro
ug
h im
pro
ved
ae
ratio
n/
wa
ter q
ua
lity
ma
na
ge
me
nt
Varie
ty o
f sp
aw
nin
g t
ec
hn
iqu
es
ava
ilab
le a
nd
imp
le-
me
nta
tion
of q
ua
lity
co
ntr
ol m
an
ag
em
en
t p
lan
s; F
in-
ge
rlin
g p
rod
uc
ers
be
co
me
sp
ec
ializ
ed
an
d fo
od
fish
p
rod
uc
ers
pu
rch
ase
fin
ge
rlin
gs
fro
m h
atc
he
ries.
4. R
ec
ord
Ke
ep
-in
g (
Inve
nto
ry &
Bu
dg
ets
)
No
ne
No
ne
or l
ittle
; mo
stly
in jo
urn
al f
orm
at.
Aw
are
ne
ss a
nd
Sta
rte
dG
rea
ter n
ee
d a
s in
ten
sity
an
d
req
uire
d in
pu
ts in
cre
ase
. R
ec
ord
s u
sed
to
ma
ke m
an
ag
em
en
t d
ec
i-sio
ns.
Busin
ess
pla
ns
imp
lem
en
ted
an
d u
sed
by
ba
nks
for
loa
n q
ualifi
ca
tion
. Fa
rm re
co
rds
ass
ure
tra
ce
ab
ility
of
pro
duc
e o
n-f
arm
an
d a
re u
sed
to m
ake
ma
na
ge
-m
en
t de
cisi
on
s
5. W
ate
r Qu
al-
ity M
on
itorin
g &
M
an
ag
em
en
t
No
ne
No
ne
; Lim
ited
flu
shin
g fo
r co
ntr
ol
Aw
are
ne
ss b
ut
no
e
qu
ipm
en
tW
ate
r Qu
alit
y M
on
itorin
g &
M
an
ag
em
en
t in
cre
ase
s re
qu
irin
g
inc
rea
sed
ac
ce
ss t
o e
qu
ipm
en
t
Wid
esp
rea
d u
se o
f w
ate
r qu
alit
y m
on
itorin
g f
or
inte
nsiv
e f
arm
ma
na
ge
me
nt
an
d e
nvi
ron
me
nta
l/m
ark
etin
g re
qu
irem
en
ts.
6. U
nd
ers
tan
din
g
of
Ho
ldin
g &
Tra
ns-
po
rt L
ive
Fish
No
ne
No
ne
to
po
or
Aw
are
ne
ss b
ut
no
e
qu
ipm
en
tIn
cre
ase
d n
ee
d f
or h
old
ing
an
d
tra
nsp
ort
ing
fin
ge
rlin
gs
an
d f
oo
d-
fish
; In
tro
du
ctio
n o
f sp
ec
ializ
ed
m
eth
od
s a
nd
eq
uip
me
nt
Spe
cia
lize
d p
riva
te-s
ec
tor s
erv
ice
s fo
r ha
rve
stin
g,
tra
nsp
ort
ing
an
d li
ve h
old
ing
fo
r ma
rke
ts
7. F
ish F
arm
Pro
-d
uc
tion
Ma
na
ge
-m
en
t P
lan
s
No
ne
No
ne
to
Lim
ited
Aw
are
ne
ssLi
mite
d n
um
be
rs o
f te
ch
nic
al
pa
cka
ge
s a
vaila
ble
fo
r fa
rme
rs f
or
field
imp
lem
en
tatio
n a
nd
te
stin
g
Wid
esp
rea
d u
se o
f fie
ld-p
rove
n t
ec
hn
ica
l pa
cke
ts
with
de
velo
pm
en
t o
f a
dd
itio
na
l sys
tem
s/sp
ec
ies
by
ac
ad
em
ia/g
ove
rnm
en
t
8. F
ish H
ea
lth M
an
-a
ge
me
nt
No
ne
; dise
ase
ou
tbre
aks
lim
ited
or n
ot
rec
og
niz
ed
No
ne
; dise
ase
ou
tbre
aks
lim
ited
or n
ot
rec
og
niz
ed
Aw
are
ne
ss d
ue
to
in-
cre
ase
d o
utb
rea
ks, b
ut
limite
d p
lan
nin
g
Lim
ited
de
velo
pm
en
t o
f su
pp
ort
se
rvic
es
an
d li
mite
d u
nd
ers
tan
din
g
of
ma
na
ge
me
nt
rela
tion
ship
to
d
isea
se o
cc
urr
en
ce
Wid
esp
rea
d u
se a
nd
priv
ate
an
d p
ub
lic s
erv
ice
pro
-vi
de
rs a
vaila
ble
fo
r on
-fa
rm m
an
ag
em
en
t a
dvi
sing
p
lus
de
velo
pe
d d
isea
se d
iag
no
stic
se
rvic
es
9. Q
ua
lity
Tra
inin
g
in A
qu
ac
ultu
reN
on
eLi
mite
d tr
ain
ing
by
NG
Os
an
d lo
ca
l g
ove
rnm
en
tLi
mite
d G
ove
rnm
en
t &
A
ca
de
mic
De
live
ryTr
ain
ing
em
ph
asis
pro
vid
ed
in
ha
nd
s-o
n, c
om
me
rcia
l-sc
ale
pro
-d
uc
tion
by
NG
O/a
ca
de
mia
Leve
l of
tra
inin
g in
cre
ase
s to
str
en
gth
en
te
ch
nic
al
kno
wle
dg
e a
nd
pro
vid
ed
by
ac
ad
em
ia a
nd
on
-fa
rm e
xpe
rien
ce
10. A
vaila
bili
ty o
f Tr
ain
ed
Fa
rm S
taff
No
ne
No
ne
Ve
ry li
mite
d; m
ost
ly
the
ore
tica
l tra
inin
gIn
cre
asin
g in
nu
mb
er a
nd
qu
alit
y b
ut
still
lim
ited
Wid
ely
ava
ilab
le w
ith p
rac
tica
l kn
ow
led
ge
& h
igh
ly
co
mp
etit
ive
(i.e
., h
igh
er p
ay)
11. Q
ua
lity
Ad
vi-
sory
Se
rvic
es
No
ne
Lim
ited
Ext
en
sion
Se
rvic
es
by
Go
vern
-m
en
tLi
mite
d E
xte
nsio
n
Serv
ice
s (i.
e,.
NA
AD
S),
bu
t n
o c
ert
ific
atio
n o
f q
ua
lific
atio
ns
Qu
alit
y in
cre
asin
g b
ut
still
mo
stly
fa
rm b
ase
d s
up
po
rt (
farm
er t
o
farm
er t
ran
sfe
r)
Ne
two
rk o
f Se
rvic
e P
rovi
de
rs w
ith c
ert
ific
atio
n a
nd
a
nn
ua
l re
vie
w c
ou
rse
an
d re
-ce
rtifi
ca
tion
pro
gra
ms.
12. E
qu
ipm
en
t &
Su
pp
liers
/ Te
ch
Su
pp
ort
Ca
pa
city
No
ne
No
ne
Self-
serv
ed
by
farm
ers
or
NG
O-d
rive
nV
ery
fe
w w
ith s
om
e f
arm
er
co
op
era
tive
s fo
rmin
g t
o f
ac
ilita
te
pu
rch
asin
g
Ne
two
rk o
f Su
pp
liers
with
te
ch
nic
al b
ac
k-st
op
pin
g
13. A
Q R
eg
ula
tion
s &
La
ws
No
ne
or L
imite
dN
on
e o
r Lim
ited
De
velo
pin
g b
ut
oft
en
c
on
flic
ting
Un
de
rsto
od
ne
ed
to
de
velo
p a
nd
h
arm
on
ize
Ne
ed
to
fa
cili
tate
ind
ust
ry d
eve
lop
me
nt
bu
t se
t re
aso
na
ble
lim
its
14. M
ark
ets
Mo
stly
ho
use
ho
ld c
on
-su
mp
tion
Mo
stly
ho
use
ho
ld u
se a
nd
po
nd
ba
nk
sale
sLo
ca
l sa
les
Loc
al s
ale
s (r
eta
il) w
ith e
xpa
nd
ing
w
ho
lesa
le m
ark
et
Ra
ng
e in
reta
il a
nd
wh
ole
sale
ma
rke
ts w
ith re
gio
na
l d
istrib
uto
rs a
nd
exp
ort
ers
2005
Pro
jec
t Re
al S
tarti
ng P
oin
tU
SAID
Ass
ume
d S
tarti
ng P
oin
tSe
pte
mb
er 2
007
Situ
atio
nEn
d o
f Pro
jec
t 200
8
Annex 1 58

Annex 2 60
pH, temperature, ammonia, hardness, alkalinity)
• Improved sampling procedures to assess inventory
• Holding, grading, handling facili-ties and procedures
• Records for traceability and evaluation of performance
• Use of belt feeders for applying hydrated lime to adjust pH and for feeding clarias fry
• Fish health management plans• Use of air lifts for elevating water• Simple emergency air supply
system using innertubes• Sex reversal of tilapia in hapas
(with improved water circulation)
5. Production Planning• Base stocking rates on desired
size and carrying capacity of pond/cage; carrying capacities and maximum feeding rates veri-fied in the field
• Staged production to use pond space efficiently
• Improved timing in stocking of
predator fish to more effectively eliminate reproduction
• Hand sexing of “stunted fish” that results in all-male tilapia that grow to large size
6. Harvesting• New design commercial fish
farm seine with mudline, sink-ers, and bag; improved efficiency and reduced labor requirement, improved fish health at harvest
• Use of “dead men,” meaning the stakes that hold up the net and cages/hapas for working fish in the pond
• Fish baskets and basins
7. TransportAn assortment of fish transport op-tions, including: • Oxygen-filled plastic bags for fry
and fingerling • Small- and medium-sized trans-
port tanks using compressed oxygen and diffusers; tanks for fish transport must allow for easy loading and off-loading of fish
• Micropore diffusers for increased efficiency of oxygen exchange rates
• Aeration manifolds for multiple small transport containers
In development: flexible fish transport tank with cover.
8. Marketing/Processing• Multi-tiered chokkor smoker
(improves efficiency of fruitwood use, safer for health of workers, and results in a better product)
• Live fish marketing to increase bargaining power of farmers
• Portable live fish holding tank• Static live fish holding systems
with recirculation• Weekly fish drop-off point for
farmers’ group members
59 Annex 2
(Note: further adoption of technologies is foreseen but will require more than a year to disseminate to interested farmers. Only a few advisory service providers are aware of these technologies. However, several farmers are practicing them now and the results from these demonstration farmers have helped to evaluate the technologies.)
1. Pond Construction• Compacted, properly sloped
levees and optimum water depths• Rational use of freeboard and
improved efficiency in labor used to construct ponds
• Anti-seep collars on pipes and prop-er anchoring of PVC drainpipes
• Levee compacting tool (for farm-ers who cannot hire a compactor)
• Harvest basins with water inlets for fingerling ponds (facilitates handling and prevents erosion when filling pond)
• Filter socks for screening; conical screens for drains (increase the “total open space”)
In development: sheepsfoot packer and tip-ping trailer for walk-behind tractor to facili-tate construction of larger ponds (>2,000 m2). Completed in 2009 after project end and is included in the buyer’s guide.
2. Cages• Culturing African catfish in
cages: appropriate design to minimize feed loss
• Cages fixed on a raft• Self-suspended cages (fixed to an
anchored long line)• Feeding enclosures specific
design choices for floating and for sinking feeds
• Predator-proof covers• Rearing fry to fingerling in cages
• Catfish fingerling holding cages for fishers and bait dealers
• Conditioning cage that is in-serted into grow-out cage
• Demand feeders for applying slow-sinking feed
In development: truncated pyramid design (only if floating feed available locally) for use in rough waters of the open Lake Victoria. Insufficient time to build the cage and run trials.
3. Formulated Feeds• Traceability and storage proce-
dures for formulated fish feeds• Use of stabilized vitamin C in
all diets• Ugachick and Nuvita sinking
pellets• Larval weaner diets imported
by Balton Uganda from RMC Israel
• Use of feeding charts coupled with trained observations to determine proper daily feeding amounts
• Use of feed records and calcula-tions of FCR to evaluate different feed options
In development: floating fish feed made in Uganda. Expected to be achieved in July 2009.
4. Hatchery Technology• Solar-powered and small
battery powered aeration• Blowers and efficient diffusers• Moveable tanks (wood/liner and
plastic), allow for greater flexibil-ity in hatchery design
• Degassing towers where appropriate
• Water quality monitoring (dis-solved oxygen, carbon dioxide,
Annex 2: Technology Testingand Demonstrations by FISH
A small, portable cage, with drawstring cover
was made in response to a request from a fish
processor, Greenfields, Ltd, to allow fishers on
Lake Kyoga to hold their catches alive while
waiting for the ice truck to arrive. The fishers
have since adapted the design to suit their
needs and are using small cages to hold bait
and to hold their catch.
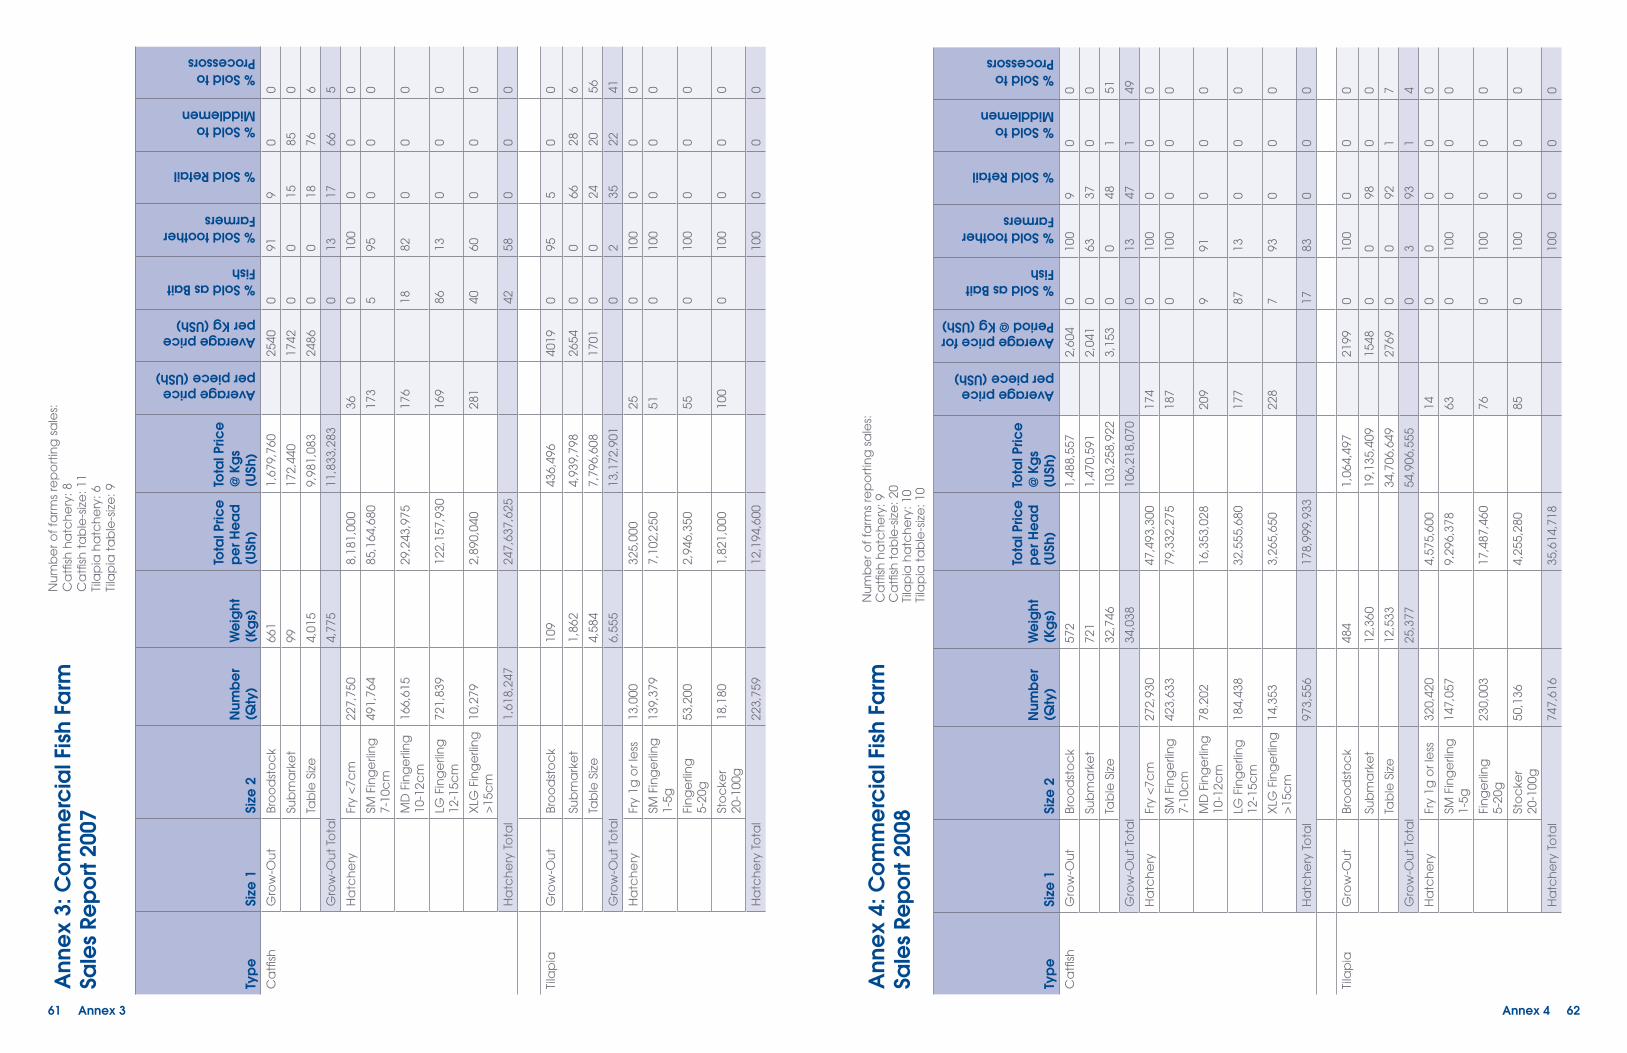
Ann
ex
4: C
om
me
rcia
l Fis
h Fa
rmSa
les
Rep
ort
2008
Typ
eSi
ze 1
Size
2N
umb
er
(Qty
)W
eig
ht(K
gs)
Tota
l Pric
e
pe
r He
ad
(USh
)
Tota
l Pric
e@
Kg
s(U
Sh)
Average priceper piece (USh)
Average price for Period @ Kg (USh)
% Sold as Bait Fish
% Sold toother Farmers
% Sold Retail
% Sold to Middlemen
% Sold toProcessors
Ca
tfish
Gro
w-O
ut
Bro
od
sto
ck
572
1,48
8,55
72,
604
010
09
00
Sub
ma
rke
t72
11,
470,
591
2,04
10
6337
00
Tab
le S
ize
32,7
4610
3,25
8,92
23,
153
00
481
51
Gro
w-O
ut
Tota
l34
,038
106,
218,
070
013
471
49
Ha
tch
ery
Fry
<7c
m27
2,93
047
,493
,300
174
010
00
00
SM F
ing
erli
ng
7-
10c
m42
3,63
379
,332
,275
187
010
00
00
MD
Fin
ge
rlin
g
10-1
2cm
78.2
0216
,353
,028
209
991
00
0
LG F
ing
erli
ng
12
-15c
m18
4,43
832
,555
,680
177
8713
00
0
XLG
Fin
ge
rlin
g
>15
cm
14,3
533,
265,
650
228
793
00
0
Ha
tch
ery
To
tal
973,
556
178,
999,
933
1783
00
0
Tila
pia
Gro
w-O
ut
Bro
od
sto
ck
484
1,06
4,49
721
990
100
00
0
Sub
ma
rke
t12
,360
19,1
35,4
0915
480
098
00
Tab
le S
ize
12,5
3334
,706
,649
2769
00
921
7
Gro
w-O
ut
Tota
l25
,377
54,9
06,5
550
393
14
Ha
tch
ery
Fry
1g o
r le
ss32
0,42
04,
575,
600
140
00
00
SM F
ing
erli
ng
1-5g
147,
057
9,29
6,37
863
010
00
00
Fin
ge
rlin
g
5-20
g23
0,00
317
,487
,460
760
100
00
0
Sto
cke
r20
-100
g50
,136
4,25
5,28
085
010
00
00
Ha
tch
ery
To
tal
747,
616
35,6
14,7
1810
00
00
Nu
mb
er o
f fa
rms
rep
ort
ing
sa
les:
Ca
tfish
ha
tch
ery
: 9C
atfi
sh t
ab
le-s
ize
: 20
Tila
pia
ha
tch
ery
: 10
Tila
pia
ta
ble
-siz
e: 1
0
Annex 4 62
Ann
ex
3: C
om
me
rcia
l Fis
h Fa
rmSa
les
Rep
ort
2007
Typ
eSi
ze 1
Size
2N
umb
er
(Qty
)W
eig
ht(K
gs)
Tota
l Pric
e
pe
r He
ad
(USh
)
Tota
l Pric
e@
Kg
s(U
Sh)
Average priceper piece (USh)
Average price per Kg (USh)
% Sold as Bait Fish
% Sold toother Farmers
% Sold Retail
% Sold to Middlemen
% Sold toProcessors
Ca
tfish
Gro
w-O
ut
Bro
od
sto
ck
661
1,67
9,76
025
400
919
00
Sub
ma
rke
t99
172,
440
1742
00
1585
0
Tab
le S
ize
4,01
59,
981,
083
2486
00
1876
6
Gro
w-O
ut
Tota
l4,
775
11,8
33,2
830
1317
665
Ha
tch
ery
Fry
<7c
m22
7,75
08,
181,
000
360
100
00
0
SM F
ing
erli
ng
7-
10c
m49
1,76
485
,164
,680
173
595
00
0
MD
Fin
ge
rlin
g
10-1
2cm
166,
615
29,2
43,9
7517
618
820
00
LG F
ing
erli
ng
12
-15c
m72
1,83
912
2,15
7,93
016
986
130
00
XLG
Fin
ge
rlin
g
>15
cm
10,2
792,
890,
040
281
4060
00
0
Ha
tch
ery
To
tal
1,61
8,24
724
7,63
7,62
542
580
00
Tila
pia
Gro
w-O
ut
Bro
od
sto
ck
109
436,
496
4019
095
50
0
Sub
ma
rke
t1,
862
4,93
9,79
826
540
066
286
Tab
le S
ize
4,58
47,
796,
608
1701
00
2420
56
Gro
w-O
ut
Tota
l6,
555
13,1
72,9
010
235
2241
Ha
tch
ery
Fry
1g o
r le
ss13
,000
325,
000
250
100
00
0
SM F
ing
erli
ng
1-5g
139,
379
7,10
2,25
051
010
00
00
Fin
ge
rlin
g
5-20
g53
,200
2,94
6,35
055
010
00
00
Sto
cke
r20
-100
g18
,180
1,82
1,00
010
00
100
00
0
Ha
tch
ery
To
tal
223,
759
12,1
94,6
0010
00
00
Nu
mb
er o
f fa
rms
rep
ort
ing
sa
les:
Ca
tfish
ha
tch
ery
: 8C
atfi
sh t
ab
le-s
ize
: 11
Tila
pia
ha
tch
ery
: 6Ti
lap
ia t
ab
le-s
ize
: 9
61 Annex 3

Da
teTr
ain
ing
Titl
eD
esc
riptio
nLo
ca
tion
of T
rain
ing
Num
be
r Tra
ine
dD
ays
Reso
urc
e P
ers
ons
Pers
on
Da
ysM
ale
Fem
ale
Tota
l
Ma
r. 14
,06
Intr
od
uc
tory
Co
mm
erc
ial
Fish
Ha
tch
ery
D
em
on
stra
tion
Offi
cia
l op
en
ing
of
tra
inin
g d
em
on
stra
tion
s to
fa
rme
rs/
sta
keh
old
ers
. D
em
on
stra
tion
of
tec
hn
olo
gie
s se
t u
p b
y p
roje
ct
on
th
e s
pe
cifi
c f
arm
to
imp
rove
pro
du
ctiv
ity a
nd
re
turn
s to
Sta
keh
old
ers
an
d a
ge
nc
ies
(go
vern
me
nt
an
d
do
no
rs)
pro
vid
ing
su
pp
ort
to
th
e s
ec
tor.
Um
oja
Fa
rm18
321
1M
s. R
ug
un
da
, N. I
sya
gi
21
Ma
r. 24
,06
Po
nd
De
sign
& C
on
stru
c-
tion
de
mo
. Plu
s Fe
ed
ing
&
Po
nd
Re
co
rds
Ha
nd
s o
n D
em
on
stra
tion
on
sta
nd
ard
req
uire
me
nts
fo
r c
om
me
rcia
l po
nd
de
sign
an
d c
on
stru
ctio
n; f
ee
din
g c
om
-m
erc
ial p
elle
ts a
nd
rec
ord
ke
ep
ing
fo
r en
terp
rise
bu
dg
et-
ing
. Ta
rge
t G
rou
p -
Fish
fa
rme
rs
UFP
Jin
ja3
36
1R
. Asii
mw
e, K
. Ve
veric
a,
Sujit
h6
Ma
r. 31
,06
Po
nd
Co
nst
ruc
tion
De
mo
nst
ratio
nH
an
ds
on
De
mo
nst
ratio
n o
n s
tan
da
rd re
qu
irem
en
ts f
or
co
mm
erc
ial p
on
d s
itin
g, d
esig
n a
nd
co
nst
ruc
tion
. Ta
rge
t G
rou
p -
Fish
fa
rme
rs a
nd
se
rvic
e p
rovi
de
rs
Mp
igi F
ish F
arm
261
272
Eng
. Ma
sh, P
. Oki
sop
i54
10-A
pr-
06Fi
sh H
ea
lth &
Aq
ua
cu
lture
Ove
rvie
w a
nd
aw
are
ne
ss o
f sig
nifi
ca
nc
e fi
sh d
isea
se d
i-a
gn
ost
ics
an
d m
an
ag
em
en
t in
co
mm
erc
ial a
qu
ac
ultu
re.
Targ
et
Gro
up
- L
ec
ture
rs a
nd
Stu
de
nts
fro
m V
et
Fa
cu
lty
an
d D
ep
art
me
nt
of
Zoo
log
y -
Fish
erie
s a
nd
Aq
ua
cu
lture
, Fi
she
ry O
ffic
ers
.
Fac
ulty
of
Ve
t. M
ed
i-c
ine
2513
381
Dr.
J. T
erh
un
e38
13-A
pr-
06Fi
sh H
ea
lth (
Co
nsu
ltativ
e
Wo
rksh
op
)O
verv
iew
an
d a
wa
ren
ess
of
sign
ific
an
ce
fish
dise
ase
dia
g-
no
stic
s, s
urv
iella
nc
e a
nd
an
d c
on
tro
l at
a N
atio
na
l le
vel i
f c
om
me
rcia
l aq
ua
cu
lture
is t
o b
e v
iab
le a
nd
su
sta
ina
ble
(p
rod
uc
t a
ssu
ran
ce
fo
r ma
rke
t a
cc
ess
ibili
ty).
T
arg
et
Gro
up
- P
olic
y m
ake
rs, R
ese
arc
he
rs, l
ec
ture
rs f
rom
rel-
eva
nt
tert
iary
inst
itutio
ns,
rele
van
t g
ove
rnm
en
t a
ge
nc
ies.
AR
DC
Ka
jjan
si20
424
1D
r. J.
Te
rhu
ne
, Dr.
N. I
sya
gi,
Ms.
F. K
ibo
ne
ka, M
r. P.
Ako
l24
14-A
pr-
06Fi
sh H
ea
lth M
an
ag
em
en
t fo
r Fish
Fa
rme
rsH
an
ds
on
de
mo
nst
ratio
n o
n id
en
tific
atio
n o
f sy
mp
ton
s,
ap
pro
pria
te re
spo
nse
to
co
nd
itio
ns
an
d t
he
ir m
an
ag
-m
en
t, a
dm
inist
ratio
n o
f tr
ea
tme
nt.
Ta
rge
t G
rou
p -
De
mo
-fa
rme
rs a
nd
th
eir
ma
na
ge
rs, fi
sh h
atc
he
ry p
rod
uc
ers
, fis
he
ry o
ffic
ers
an
d s
tud
en
ts
AR
DC
Ka
jjan
si19
524
1D
r. J.
Te
rhu
ne
, Dr.
N. I
sya
gi,
J. W
ala
kira
24
25-A
pr-
06H
arv
est
ing
, ha
nd
ling
&
Ho
ldin
g o
f fis
h, s
exi
ng
til
ap
ia
Ha
nd
s o
n d
em
on
stra
tion
on
ha
rve
stin
g, h
an
dlin
g, h
old
ing
a
nd
se
xin
g la
rge
nu
mb
ers
of
fish
with
min
imu
m lo
ss.
Targ
et
Gro
up
- fi
sh h
atc
he
ry o
pe
rato
rs (
bo
th d
em
o a
nd
oth
er
farm
ers
), s
tud
en
ts a
nd
se
rvic
e p
rovi
de
rs
AR
DC
Ka
jjan
si9
211
1K
. Ve
veric
a, R
. Asii
mw
e
an
d S
. Oru
kan
11
26-A
pr-
06H
arv
est
ing
, ha
nd
ling
&
Ho
ldin
g o
f fis
h, s
exi
ng
til
ap
ia
Ha
nd
s o
n d
em
on
stra
tion
on
ha
rve
stin
g, h
an
dlin
g, h
old
ing
a
nd
se
xin
g la
rge
nu
mb
ers
of
fish
with
min
imu
m lo
ss.
Targ
et
Gro
up
- fi
sh h
atc
he
ry o
pe
rato
rs (
bo
th d
em
o a
nd
oth
er
farm
ers
), s
tud
en
ts a
nd
se
rvic
e p
rovi
de
rs
AR
DC
Ka
jjan
si8
614
1K
. Ve
veric
a, R
. Asii
mw
e
an
d S
. Oru
kan
14
27-A
pr-
06H
arv
est
ing
, ha
nd
ling
&
Ho
ldin
g o
f fis
h, s
exi
ng
til
ap
ia
Ha
nd
s o
n d
em
on
stra
tion
on
ha
rve
stin
g, h
an
dlin
g, h
old
ing
a
nd
se
xin
g la
rge
nu
mb
ers
of
fish
with
min
imu
m lo
ss.
Targ
et
Gro
up
- fi
sh h
atc
he
ry o
pe
rato
rs (
bo
th d
em
o a
nd
oth
er
farm
ers
), s
tud
en
ts a
nd
se
rvic
e p
rovi
de
rs
AR
DC
Ka
jjan
si19
625
1K
. Ve
veric
a, R
. Asii
mw
e
an
d S
. Oru
kan
25
27-A
pr-
06C
linic
al e
xam
ina
tion
of
fish
Ha
nd
s o
n t
rain
ing
on
clin
ica
l exa
min
atio
n o
f fis
h,
sam
ple
c
olle
ctio
n a
nd
tra
nsp
ort
atio
n, d
iag
no
sis o
f d
isea
ses.
Ta
rge
t G
rou
p -
te
ch
nic
ian
s fr
om
an
ima
l dise
ase
dia
gn
osis
la
bo
rato
ries
AR
DC
Ka
jjan
si9
312
1 D
r. N
. Isy
ag
i, J
. Wa
laki
ra12
2-M
ay-
06Fi
sh h
arv
est
ing
, ha
nd
ling
, tr
an
spo
rtH
an
ds
on
de
mo
nst
ratio
n o
n h
arv
est
ing
, ha
nd
ling
, ho
ldin
g
an
d t
ran
spo
rtin
g fi
sh li
ve.
Targ
et
Gro
up
- fi
sh f
arm
ers
an
d
stu
de
nts
AR
DC
Ka
jjan
si4
812
1K
. Ve
veric
a, S
am
Oru
kan
12
Annex 5 64
Ann
ex
5: F
ISH
Tra
inin
g S
ess
ions
Oc
tob
er 2
005-
Sep
tem
be
r 200
8D
ate
Tra
inin
g T
itle
De
scrip
tion
Loc
atio
n o
f Tra
inin
gN
umb
er T
rain
ed
Da
ysRe
sour
ce
Pe
rso
nsPe
rso
n D
ays
Ma
leFe
ma
leTo
tal
Oc
t 20
05P
on
d C
on
stru
ctio
n
Tra
in f
arm
ers
an
d s
erv
ice
pro
vid
ers
on
pro
pe
r co
nst
ruc
tion
o
f p
on
ds.
Ie
. Sta
nd
ard
s a
nd
de
finiti
on
s, L
ayo
ut,
co
mp
ac
-tio
n, c
alc
ula
ting
slo
pe
s, p
reve
nta
ge
of
lea
kag
es
- c
ore
tr
en
ch
ing
, co
stin
gs
Siss
a In
terg
rate
d F
ish
Farm
162
183
N. I
sya
gi,
K. V
eve
rica
54
Oc
t 20
05P
on
d C
on
stru
ctio
nP
rac
tica
ls fo
r FTI
stu
de
nts
wh
o a
t th
e t
ime
we
re h
avi
ng
le
ctu
res
on
po
nd
co
nst
ruc
tion
. St
an
da
rds
an
d D
efin
itio
ns,
La
you
t, c
om
pa
ctio
n, c
alc
ula
ting
slo
pe
s, p
reve
nta
ge
of
lea
kag
es
- c
ore
tre
nc
hin
g, e
valu
atio
n o
f p
on
ds
Siss
a In
terg
rate
d F
ish
Farm
4010
502
N. I
sya
gi,
K. V
eve
rica
100
6-D
ec
-05
Live
fee
ds
for c
laria
s h
atc
he
ries
Targ
et
Gro
up
- F
arm
ers
. P
rod
uc
tion
of
Cla
do
ce
ran
s.,
pro
du
ctio
n p
lan
nin
g f
or h
atc
he
ries
AR
DC
Ka
jjan
si15
318
1N
. Isy
ag
i, O
. Wa
du
nd
e, R
. A
siim
we
18
7-D
ec
-05
Live
fee
ds
for c
laria
sh
atc
he
ries
(sh
ort
ve
rsio
n)
Targ
et
Gro
up
- F
arm
ers
. P
rod
uc
tion
of
Cla
do
ce
ran
s.,
pro
du
ctio
n p
lan
nin
g f
or h
atc
he
ries
AR
DC
Ka
jjan
si6
17
1N
. Isy
ag
i, O
. Wa
du
nd
e, R
. A
siim
we
7
Jan
. 6, 0
6Fa
rm P
lan
nin
g &
Mg
t. f
or
De
mo
Fa
rme
rsTa
rge
t G
rou
p -
Se
lec
ted
de
mo
nst
ratio
n fa
rme
rs, t
he
ir fa
rm
ma
na
ge
rs a
nd
Stu
de
nts
on
Att
ac
hm
en
t a
t A
RD
C-K
ajja
nsi.
Fa
rm p
lan
nin
g a
nd
ma
na
ge
me
nt
for c
om
me
rcia
l aq
ua
-c
ultu
re
Ka
jjan
si C
on
fere
nc
e
roo
m12
315
1N
. Isy
ag
i15
Jan
. 13,
06
Re
co
rd K
ee
pin
g a
nd
Ba
sics
of
Aq
ua
cu
lture
Targ
et
Gro
up
- S
ele
cte
d d
em
on
stra
tion
farm
ers
, th
eir
farm
m
an
ag
ers
an
d S
tud
en
ts o
n A
tta
ch
me
nt
at
AR
DC
-Ka
jjan
si.
Farm
pla
nn
ing
an
d m
an
ag
em
en
t fo
r co
mm
erc
ial a
qu
a-
cu
lture
Ka
jjan
si C
on
fere
nc
e
roo
m12
820
1N
. Isy
ag
i20
Jan
. 14,
06
Wa
ter Q
ua
lity
ba
sics
an
d
Co
mm
erc
ial P
on
d M
an
-a
ge
me
nt
for fi
sh f
arm
ers
Targ
et
Gro
up
- S
ele
cte
d d
em
on
stra
tion
farm
ers
, th
eir
farm
m
an
ag
ers
an
d S
tud
en
ts o
n A
tta
ch
me
nt
at
AR
DC
-Ka
jjan
si.
Farm
pla
nn
ing
an
d m
an
ag
em
en
t fo
r co
mm
erc
ial a
qu
a-
cu
lture
Ka
jjan
si C
on
fere
nc
e
roo
m15
520
1D
r Alle
n D
avi
s, K
. Ve
veric
a,
N. I
sya
gi
20
Jan
. 19,
06
Fish
Fe
ed
Fo
rum
-co
nsu
ltativ
e w
ork
sho
pTo
cre
ate
aw
are
ne
ss o
n u
rge
nt
de
ma
nd
an
d b
usin
ess
o
pp
ort
un
ity f
or c
om
me
rcia
l fish
fe
ed
in U
ga
nd
a, p
rice
s p
rod
uc
ers
ca
n s
up
po
rt, p
rog
ress
in t
he
are
a, r
eq
uire
me
nts
to
su
pp
ort
co
mm
erc
ial fi
sh f
ee
d p
rod
uc
tion
.Ta
rge
t G
rou
p
- P
olic
y M
ake
rs, A
nim
al F
ee
d P
roc
ess
ors
, In
tern
atio
na
l C
om
me
rcia
l Fish
Fe
ed
Pro
du
ce
rs, D
on
ors
to
th
e A
gric
ul-
tura
l Se
cto
r, Fe
ed
Inp
ut
sup
plie
rs, B
an
kers
SCO
PE
Boa
rdro
om
305
351
Dr.
Da
vis,
K. V
erv
eric
a, N
. Is
yag
i, M
r. Bb
osa
an
d M
r. Tu
gu
misi
rize
35
Jan
. 20,
06
Fish
Fe
ed
s a
nd
fe
ed
ing
Ta
rge
t Gro
up -
Sta
ff A
RDC
Ka
jjan
si, a
nd
stu
de
nts
. Ba
sics
of
fish
nut
ritio
n, h
ow
to fe
ed
fish
, an
d h
ow
the
diff
ere
nt t
ype
s o
f fis
h fe
ed
are
ma
de
.
Ka
jjan
si C
on
fere
nc
e
roo
m17
522
1D
r D
avi
s 22
Jan
. 26,
06
Po
nd
Ma
na
ge
me
nt
for
Co
mm
erc
ial fi
sh f
arm
s &
Se
inin
g, P
on
d C
on
stru
ctio
n
Targ
et
Gro
up
- D
em
on
stra
tion
Fa
rme
rs a
nd
th
eir
ma
na
g-
ers
. D
em
on
stra
tion
on
pro
pe
r me
tho
ds
of
ha
rve
stin
ga
nd
h
an
dlin
g la
rge
qu
an
titie
s o
f fis
h f
rom
co
mm
erc
ial g
row
-o
ut
po
nd
s. S
tan
da
rds
an
d s
pe
cifi
ca
tion
s fo
r de
mo
nst
ra-
tion
po
nd
s -
ha
tch
ery
an
d g
row
-ou
t.
Ka
jjan
si &
Siis
a In
ter-
gra
ted
Fish
Fa
rm21
324
1D
r. Sc
hm
itto
u, K
. Ve
veric
a,
N. I
sya
gi
24
Feb
. 01,
06C
ag
e C
ultu
re S
em
ina
r/c
on
sulta
tive
wo
rksh
op
Cre
ate
aw
are
ne
ss o
n p
rod
uc
tion
, so
cio
-ec
on
om
ic a
nd
e
nvi
ron
me
nta
l iss
ue
s a
sso
cia
ted
ca
ge
cu
lture
an
d t
he
o
pp
ort
un
ity c
ag
e c
ultu
re o
ffe
rs t
o t
he
fish
ery
se
cto
r in
th
e
co
un
try.
Ta
rge
t G
rou
p -
Po
licy
Ma
kers
, Re
sea
rch
ers
, Re
l-e
van
t G
ove
rnm
en
t A
ge
nc
ies,
Le
ctu
res
Re
leva
nt
Tra
inin
g
Inst
itutio
ns
an
d N
GO
’s
Ka
jjan
si C
on
fere
nc
e
roo
m26
430
1D
r. Sc
hm
itto
u,
K. V
eve
rica
, R
. Asii
mw
e30
63 Annex 5
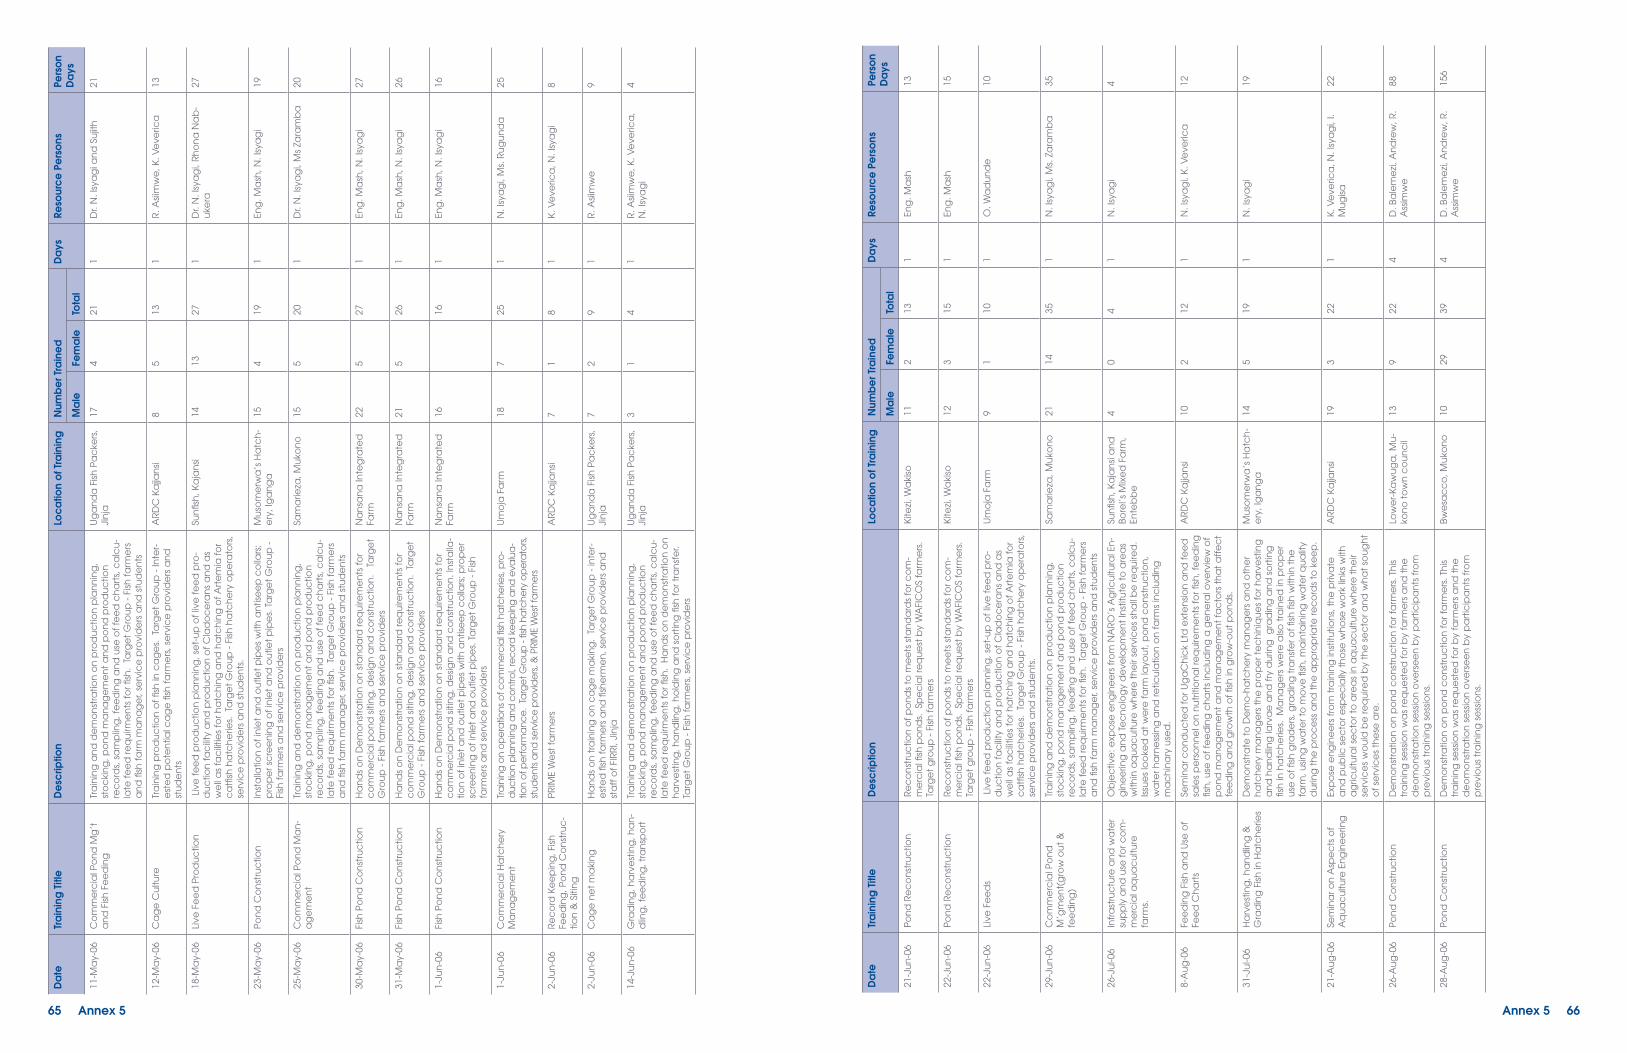
Da
teTr
ain
ing
Titl
eD
esc
riptio
nLo
ca
tion
of T
rain
ing
Num
be
r Tra
ine
dD
ays
Reso
urc
e P
ers
ons
Pers
on
Da
ysM
ale
Fem
ale
Tota
l
21-J
un
-06
Po
nd
Re
co
nst
ruc
tion
Re
co
nst
ruc
tion
of
po
nd
s to
me
ets
sta
nd
ard
s fo
r co
m-
me
rcia
l fish
po
nd
s. S
pe
cia
l re
qu
est
by
WA
FIC
OS
farm
ers
. Ta
rge
t g
rou
p -
Fish
fa
rme
rs
Kite
zi, W
aki
so11
213
1En
g. M
ash
13
22-J
un
-06
Po
nd
Re
co
nst
ruc
tion
Re
co
nst
ruc
tion
of
po
nd
s to
me
ets
sta
nd
ard
s fo
r co
m-
me
rcia
l fish
po
nd
s. S
pe
cia
l re
qu
est
by
WA
FIC
OS
farm
ers
. Ta
rge
t g
rou
p -
Fish
fa
rme
rs
Kite
zi, W
aki
so12
315
1En
g. M
ash
15
22-J
un
-06
Live
Fe
ed
s L
ive
fe
ed
pro
du
ctio
n p
lan
nin
g, s
et-
up
of
live
fe
ed
pro
-d
uc
tion
fa
cili
ty a
nd
pro
du
ctio
n o
f C
lad
oc
era
ns
an
d a
s w
ell
as
fac
ilitie
s fo
r ha
tch
ing
an
d h
atc
hin
g o
f A
rte
mia
fo
r c
atfi
sh h
atc
he
ries.
Ta
rge
t G
rou
p -
Fish
ha
tch
ery
op
era
tors
, se
rvic
e p
rovi
de
rs a
nd
stu
de
nts
.
Um
oja
Fa
rm9
110
1O
. Wa
du
nd
e10
29-J
un
-06
Co
mm
erc
ial P
on
d
M’g
me
nt(
gro
w o
ut
&
fee
din
g)
Tra
inin
g a
nd
de
mo
nst
ratio
n o
n p
rod
uc
tion
pla
nn
ing
, st
oc
kin
g, p
on
d m
an
ag
em
en
t a
nd
po
nd
pro
du
ctio
n
rec
ord
s, s
am
plin
g, f
ee
din
g a
nd
use
of
fee
d c
ha
rts,
ca
lcu
-la
te f
ee
d re
qu
irme
nts
fo
r fish
. Ta
rge
t G
rou
p -
Fish
fa
rme
rs
an
d fi
sh f
arm
ma
na
ge
r, se
rvic
e p
rovi
de
rs a
nd
stu
de
nts
Sam
arie
za, M
uko
no
2114
351
N. I
sya
gi,
Ms.
Za
ram
ba
35
26-J
ul-0
6In
fra
stru
ctu
re a
nd
wa
ter
sup
ply
an
d u
se f
or c
om
-m
erc
ial a
qu
ac
ultu
re
farm
s.
Ob
jec
tive
: exp
ose
en
gin
ee
rs f
rom
NA
RO
’s A
gric
ultu
ral E
n-
gin
ee
ring
an
d T
ec
no
log
y d
eve
lop
me
nt
Inst
itute
to
are
as
with
in a
qu
ac
ultu
re w
he
re t
he
ir se
rvic
es
sha
ll b
e re
qu
ired
. Is
sue
s lo
oke
d a
t w
ere
fa
rm la
you
t, p
on
d c
on
stru
ctio
n,
wa
ter h
arn
ess
ing
an
d re
ticu
latio
n o
n f
arm
s in
clu
din
g
ma
ch
ina
ry u
sed
.
Sun
fish
, Ka
jan
si a
nd
Bo
rel’s
Mix
ed
Fa
rm,
Ente
bb
e
40
41
N. I
sya
gi
4
8-A
ug
-06
Fee
din
g F
ish a
nd
Use
of
Fee
d C
ha
rts
Sem
ina
r co
nd
uc
ted
fo
r Ug
aC
hic
k Lt
d e
xte
nsio
n a
nd
fe
ed
sa
les
pe
rso
nn
el o
n n
utr
itio
na
l re
qu
irem
en
ts f
or fi
sh, f
ee
din
g
fish
, use
of
fee
din
g c
ha
rts
inc
lud
ing
a g
en
era
l ove
rvie
w o
f p
on
d m
an
ag
em
en
t a
nd
ma
na
ge
me
nt
fac
tors
th
at
aff
ec
t fe
ed
ing
an
d g
row
th o
f fis
h in
gro
w-o
ut
po
nd
s.
AR
DC
Ka
jjan
si10
212
1N
. Isy
ag
i, K
. Ve
veric
a12
31-J
ul-0
6H
arv
est
ing
, ha
nd
ling
&
Gra
din
g F
ish in
Ha
tch
erie
sD
em
on
stra
te t
o D
em
o-h
atc
he
ry m
an
ag
ers
an
d o
the
r h
atc
he
ry m
an
ag
ers
th
e p
rop
er t
ec
hin
iqu
es
for h
arv
est
ing
a
nd
ha
nd
ling
larv
ae
an
d f
ry d
urin
g g
rad
ing
an
d s
ort
ing
fis
h in
ha
tch
erie
s. M
an
ag
ers
we
re a
lso t
rain
ed
in p
rop
er
use
of
fish
gra
de
rs, g
rad
ing
tra
nsf
er o
f fis
h fi
sh w
ithin
th
e
farm
, usin
g w
ate
r to
mo
ve fi
sh, m
ain
tain
ing
wa
ter q
ua
lity
du
ring
th
e p
roc
ess
an
d t
he
ap
pro
pria
te re
co
rds
to k
ee
p.
Mu
som
erw
a’s
Ha
tch
-e
ry, I
ga
ng
a14
519
1N
. Isy
ag
i19
21-A
ug
-06
Sem
ina
r on
Asp
ec
ts o
f A
qu
ac
ultu
re E
ng
ine
erin
gEx
po
se e
ng
ine
ers
fro
m t
rain
ing
inst
itutio
ns,
th
e p
riva
te
an
d p
ub
lic s
ec
tor e
spe
cia
lly t
ho
se w
ho
se w
ork
lin
ks w
ith
ag
ricu
ltura
l se
cto
r to
are
as
in a
qu
ac
ultu
re w
he
re t
he
ir se
rvic
es
wo
uld
be
req
uire
d b
y th
e s
ec
tor a
nd
wh
at
sou
gh
t o
f se
rvic
es
the
se a
re.
AR
DC
Ka
jjan
si19
322
1K
. Ve
veric
a, N
. Isy
ag
i, I.
Mu
gisa
22
26-A
ug
-06
Po
nd
Co
nst
ruc
tion
De
mo
nst
ratio
n o
n p
on
d c
on
stru
ctio
n f
or f
arm
ers
. Th
is tr
ain
ing
se
ssio
n w
as
req
ue
ste
d f
or b
y fa
rme
rs a
nd
th
e
de
om
on
stra
tion
se
ssio
n o
vers
ee
n b
y p
art
icip
an
ts f
rom
p
revi
ou
s tr
ain
ing
se
ssio
ns.
Low
er-
Ka
wu
ga
, Mu
-ko
no
to
wn
co
un
cil
139
224
D. B
ale
me
zi, A
nd
rew
, R.
Ass
imw
e88
28-A
ug
-06
Po
nd
Co
nst
ruc
tion
De
mo
nst
ratio
n o
n p
on
d c
on
stru
ctio
n f
or f
arm
ers
. Th
is tr
ain
ing
se
ssio
n w
as
req
ue
ste
d f
or b
y fa
rme
rs a
nd
th
e
de
om
on
stra
tion
se
ssio
n o
vers
ee
n b
y p
art
icip
an
ts f
rom
p
revi
ou
s tr
ain
ing
se
ssio
ns.
Bwe
sac
co
, Mu
kon
o10
2939
4D
. Ba
lem
ezi
, An
dre
w, R
. A
ssim
we
156
Annex 5 66
Da
teTr
ain
ing
Titl
eD
esc
riptio
nLo
ca
tion
of T
rain
ing
Num
be
r Tra
ine
dD
ays
Reso
urc
e P
ers
ons
Pers
on
Da
ysM
ale
Fem
ale
Tota
l
11-M
ay-
06C
om
me
rcia
l Po
nd
Mg
’t
an
d F
ish F
ee
din
gTr
ain
ing
an
d d
em
on
stra
tion
on
pro
du
ctio
n p
lan
nin
g,
sto
cki
ng
, po
nd
ma
na
ge
me
nt
an
d p
on
d p
rod
uc
tion
re
co
rds,
sa
mp
ling
, fe
ed
ing
an
d u
se o
f fe
ed
ch
art
s, c
alc
u-
late
fe
ed
req
uirm
en
ts f
or fi
sh.
Targ
et
Gro
up
- F
ish f
arm
ers
a
nd
fish
fa
rm m
an
ag
er,
serv
ice
pro
vid
ers
an
d s
tud
en
ts
Ug
an
da
Fish
Pa
cke
rs,
Jin
ja17
421
1D
r. N
. Isy
ag
i an
d S
ujit
h21
12-M
ay-
06C
ag
e C
ultu
reTr
ain
ing
pro
du
ctio
n o
f fis
h in
ca
ge
s. T
arg
et
Gro
up
- In
ter-
est
ed
po
ten
tial c
ag
e fi
sh f
arm
ers
, se
rvic
e p
rovi
de
rs a
nd
st
ud
en
ts
AR
DC
Ka
jjan
si8
513
1R
. Asii
mw
e, K
. Ve
veric
a
13
18-M
ay-
06Li
ve F
ee
d P
rod
uc
tion
Liv
e f
ee
d p
rod
uc
tion
pla
nn
ing
, se
t-u
p o
f liv
e f
ee
d p
ro-
du
ctio
n f
ac
ility
an
d p
rod
uc
tion
of
Cla
do
ce
ran
s a
nd
as
we
ll a
s fa
cili
ties
for h
atc
hin
g a
nd
ha
tch
ing
of
Art
em
ia f
or
ca
tfish
ha
tch
erie
s. T
arg
et
Gro
up
- F
ish h
atc
he
ry o
pe
rato
rs,
serv
ice
pro
vid
ers
an
d s
tud
en
ts.
Sun
fish
, Ka
jan
si14
1327
1D
r. N
. Isy
ag
i, R
ho
na
Na
b-
uke
ra27
23-M
ay-
06P
on
d C
on
stru
ctio
nIn
sta
llatio
n o
f in
let
an
d o
utle
t p
ipe
s w
ith a
ntis
ee
p c
olla
rs;
pro
pe
r sc
ree
nin
g o
f in
let
an
d o
utle
t p
ipe
s. T
arg
et
Gro
up
-
Fish
fa
rme
rs a
nd
se
rvic
e p
rovi
de
rs
Mu
som
erw
a’s
Ha
tch
-e
ry, I
ga
ng
a15
419
1En
g. M
ash
, N. I
sya
gi
19
25-M
ay-
06C
om
me
rcia
l Po
nd
Ma
n-
ag
em
en
tTr
ain
ing
an
d d
em
on
stra
tion
on
pro
du
ctio
n p
lan
nin
g,
sto
cki
ng
, po
nd
ma
na
ge
me
nt
an
d p
on
d p
rod
uc
tion
re
co
rds,
sa
mp
ling
, fe
ed
ing
an
d u
se o
f fe
ed
ch
art
s, c
alc
u-
late
fe
ed
req
uirm
en
ts f
or fi
sh.
Targ
et
Gro
up
- F
ish f
arm
ers
a
nd
fish
fa
rm m
an
ag
er,
serv
ice
pro
vid
ers
an
d s
tud
en
ts
Sam
arie
za, M
uko
no
155
201
Dr.
N. I
sya
gi,
Ms
Zara
mb
a20
30-M
ay-
06Fi
sh P
on
d C
on
stru
ctio
nH
an
ds
on
De
mo
nst
ratio
n o
n s
tan
da
rd re
qu
irem
en
ts f
or
co
mm
erc
ial p
on
d s
itin
g, d
esig
n a
nd
co
nst
ruc
tion
. T
arg
et
Gro
up
- F
ish f
arm
ers
an
d s
erv
ice
pro
vid
ers
Na
nsa
na
Inte
gra
ted
Fa
rm22
527
1En
g. M
ash
, N. I
sya
gi
27
31-M
ay-
06Fi
sh P
on
d C
on
stru
ctio
nH
an
ds
on
De
mo
nst
ratio
n o
n s
tan
da
rd re
qu
irem
en
ts f
or
co
mm
erc
ial p
on
d s
itin
g, d
esig
n a
nd
co
nst
ruc
tion
. Ta
rge
t G
rou
p -
Fish
fa
rme
rs a
nd
se
rvic
e p
rovi
de
rs
Na
nsa
na
Inte
gra
ted
Fa
rm21
526
1En
g. M
ash
, N. I
sya
gi
26
1-Ju
n-0
6Fi
sh P
on
d C
on
stru
ctio
nH
an
ds
on
De
mo
nst
ratio
n o
n s
tan
da
rd re
qu
irem
en
ts f
or
co
mm
erc
ial p
on
d s
itin
g, d
esig
n a
nd
co
nst
ruc
tion
. In
sta
lla-
tion
of
inle
t a
nd
ou
tlet
pip
es
with
an
tise
ep
co
llars
; pro
pe
r sc
ree
nin
g o
f in
let
an
d o
utle
t p
ipe
s. T
arg
et
Gro
up
- F
ish
farm
ers
an
d s
erv
ice
pro
vid
ers
Na
nsa
na
Inte
gra
ted
Fa
rm16
161
Eng
. Ma
sh, N
. Isy
ag
i16
1-Ju
n-0
6C
om
me
rcia
l Ha
tch
ery
M
an
ag
em
en
tTr
ain
ing
on
op
era
tion
s o
f co
mm
erc
ial fi
sh h
atc
he
ries,
pro
-d
uctio
n p
lan
nin
g a
nd
co
ntr
ol,
rec
ord
ke
ep
ing
an
d e
valu
a-
tion
of p
erf
orm
an
ce
. Ta
rge
t Gro
up -
fish
ha
tch
ery
op
era
tors
, st
ude
nts
an
d s
erv
ice
pro
vid
ers
, & P
RIM
E W
est
farm
ers
Um
oja
Fa
rm18
725
1N
. Isy
ag
i, M
s. R
ug
un
da
25
2-Ju
n-0
6R
ec
ord
Ke
ep
ing
, Fish
Fe
ed
ing
, Po
nd
Co
nst
ruc
-tio
n &
Siti
ng
PR
IME
We
st f
arm
ers
AR
DC
Ka
jjan
si7
18
1K
. Ve
veric
a, N
. Isy
ag
i8
2-Ju
n-0
6C
ag
e n
et
ma
kin
gH
an
ds
on
tra
inin
g o
n c
ag
e m
aki
ng
. Ta
rge
t G
rou
p -
inte
r-e
ste
d fi
sh f
arm
ers
an
d fi
she
rme
n, s
erv
ice
pro
vid
ers
an
d
sta
ff o
f FI
RR
I, Ji
nja
Ug
an
da
Fish
Pa
cke
rs,
Jin
ja7
29
1R
. Asii
mw
e9
14-J
un
-06
Gra
din
g, h
arv
est
ing
, ha
n-
dlin
g, f
ee
din
g, t
ran
spo
rtTr
ain
ing
an
d d
em
on
stra
tion
on
pro
du
ctio
n p
lan
nin
g,
sto
cki
ng
, po
nd
ma
na
ge
me
nt
an
d p
on
d p
rod
uc
tion
re
co
rds,
sa
mp
ling
, fe
ed
ing
an
d u
se o
f fe
ed
ch
art
s, c
alc
u-
late
fe
ed
req
uirm
en
ts f
or fi
sh.
Ha
nd
s o
n d
em
on
stra
tion
on
h
arv
est
ing
, ha
nd
ling
, ho
ldin
g a
nd
so
rtin
g fi
sh f
or t
ran
sfe
r. Ta
rge
t G
rou
p -
Fish
fa
rme
rs, s
erv
ice
pro
vid
ers
Ug
an
da
Fish
Pa
cke
rs,
Jin
ja3
14
1R
. Asii
mw
e, K
. Ve
veric
a,
N. I
sya
gi
4
65 Annex 5

Da
teTr
ain
ing
Titl
eD
esc
riptio
nLo
ca
tion
of T
rain
ing
Num
be
r Tra
ine
dD
ays
Reso
urc
e P
ers
ons
Pers
on
Da
ysM
ale
Fem
ale
Tota
l
23-M
ay-
07Fi
sh H
ea
lth M
an
ag
em
en
t &
Pla
n D
eve
lop
me
nt
Fie
ld a
nd
lab
wo
rk c
on
du
cte
d a
t SO
N F
arm
, fo
r sta
ff a
nd
vi
sitin
g s
tud
en
ts.
SON
Fish
Fa
rm5
510
1Te
rhu
ne
, Isy
ag
i, W
alk
ira10
29-M
ay-
07Se
min
ar o
n F
ish H
ea
lthP
rovi
de
up
da
tes
to fi
sih h
ea
lth s
pe
cia
laist
s o
n fi
sh h
ea
lth
ac
tiviti
es
ca
rrie
d o
ut
for t
he
ye
ar.\
; pre
sen
tatio
n o
f A
. Ta
ma
le’s
rese
arc
h p
rop
osa
l
NA
FIR
RI,
Ka
jjan
si 7
411
1Te
rhu
ne
11
14-J
un
-07
Fish
Sm
oki
ng
usin
g a
ch
or-
kor s
mo
ker
Tra
inin
g d
on
e b
y re
qu
est
fo
r fa
rme
rs w
ho
wa
nte
d t
o b
eg
in
smo
kin
g c
atfi
sh f
or l
oc
al r
eta
il sa
les
NA
FIR
RI,
Ka
jjan
si 4
04
1A
siim
we
4
20-J
un
-07
Eng
ine
erin
g A
spe
cts
of
fish
H
atc
he
ries
Pa
ram
ete
rs f
or d
esig
nin
g c
atfi
sh h
atc
he
ries
he
ld f
or A
ET-
RIC
an
d le
ctu
rers
an
d p
riva
te s
ec
tor s
up
plie
rsN
elly
’s H
om
e5
38
1Is
yag
i, M
ille
r8
23-J
ul-0
7C
ho
rko
r sm
oke
r co
nst
ruc
-tio
nC
on
stru
ctio
n o
f a
ch
ork
or s
mo
ker w
ith m
ulti
ple
tie
rsK
ase
ng
e F
ish F
arm
42
61
Asii
mw
e, M
ille
r6
28-A
ug
-07
Fish
Gra
din
g &
Fe
ed
ing
He
ld f
or s
tud
en
t in
tern
s fr
om
Ma
kere
re U
niv
ers
ity a
t K
aj-
jan
si st
atio
nN
AFI
RR
I, K
ajja
nsi
40
41
Asii
mw
e4
9-A
ug
-07
Fish
Fa
rme
rs C
on
sulta
tive
M
ee
ting
Disc
uss
issu
es
raise
d b
y d
em
on
stra
tion
fa
rme
rs a
nd
wh
at
farm
ers
exp
ec
t o
ut
of
the
pro
jec
t.A
RD
C K
ajja
nsi
92
111
Mill
er
11
24-S
ep
-07
Inte
rpre
tatio
n a
nd
use
of
Fee
d R
ec
ord
sFo
r fish
fa
rme
rs a
nd
inte
rns:
an
aly
is a
nd
inte
rpre
tatio
n o
f p
on
d a
nd
fe
ed
rec
ord
s; t
rou
ble
sh
oo
ting
an
d m
ea
ns
of
imp
rovi
ng
FC
R
Ka
sen
ge
Fish
Fa
rm18
826
1Is
yag
i26
1-O
ct-
07Ti
lap
ia P
rod
uc
tion
te
st
Pa
cka
ge
fo
r tria
l fa
rme
rsTr
ain
se
lec
ted
fa
rme
rs o
n p
rop
ose
d t
ilap
ia p
rod
uc
tion
p
ac
kag
e a
nd
disc
uss
MO
Uw
ith t
he
m.
Ka
jjan
si4
15
1Is
yag
i5
1-O
ct-
07Se
inin
g a
nd
fish
ha
nd
ling
Pra
ctic
al f
or s
tud
en
ts in
fish
ha
rve
stin
g a
nd
se
inin
gFT
I, En
teb
be
19
101
Asii
mw
e,K
aku
ru10
19-O
ct-
07En
viro
nm
en
tal m
an
ag
e-
me
nt
in c
ag
e c
ultu
re
Sem
ina
r co
nd
uc
ted
fo
r sta
ff o
f N
aFI
RR
I, W
RM
D, a
nd
oth
ers
in
en
viro
nm
en
tlal a
spe
cts
to
ta
ke in
to c
on
side
ratio
n f
or
ca
ge
cu
lture
op
era
tion
s w
ith s
pe
cia
l re
fere
nc
e t
o L
ake
V
icto
ria.
Na
FIR
RI
2512
371
Dr.
Boyd
37
22-O
ct-
07W
ate
r an
d S
oil
qu
alit
y c
on
side
ratio
ns
for a
qu
a-
cu
lture
To h
igh
ligh
t im
po
rta
nc
e o
f c
on
side
ring
wa
ter a
nd
so
il q
ua
lity
in a
qu
ac
ultu
re t
o f
arm
ers
an
dg
ove
rnm
en
t a
uth
orit
ies
An
de
rita
Ho
tel,
Ente
bb
e25
1136
1D
r. Bo
yd36
23-O
ct-
07W
ate
r qu
alit
y fo
r im
pro
ved
a
qu
ac
ultu
reP
ub
lic le
ctu
re o
n w
ate
r qu
alit
y iss
ue
s o
n a
qu
ac
ultu
re a
nd
BM
P f
or c
ag
e c
ultu
re f
or f
arm
ers
, stu
de
nts
an
d le
ctu
rers
Ma
kere
re U
niv
ers
ity66
2490
1D
r. Bo
yd90
27-O
ct-
07P
on
d s
ein
ing
, ha
nd
ling
, a
nd
tra
nsf
er o
f fis
h
Pra
ctic
al o
n p
on
d s
ein
ing
,ha
nd
ling
, tra
nsf
er o
f fis
h a
nd
re
co
rd k
ee
pin
g f
or B
ac
he
lor o
f V
et
me
dic
ine
Ma
kere
re
Un
ive
rsity
stu
de
nts
Na
luvu
le f
arm
278
351
Ka
hw
a &
Isya
gi
35
8-N
ov-
07G
en
era
l po
nd
ma
na
ge
-m
en
t a
nd
rec
ord
ke
ep
ing
Va
lida
ting
ou
r te
ch
no
log
y p
ac
kag
es
with
Iga
ng
a F
arm
ers
Mu
som
erw
a’s
Ha
tch
-e
ry, I
ga
ng
a17
320
1Is
yag
i20
13-N
ov-
07Fi
sh h
an
dlin
g &
po
nd
re
co
rds
Tra
inin
g S
tud
en
ts o
n h
an
ds
tec
hn
iqu
es
in h
an
dlin
g fi
sh a
nd
re
co
rds;
Dra
win
g, S
plit
ing
an
d S
toc
kin
g p
on
ds
1,2,
&3
Na
mu
yen
je F
ish F
arm
4
04
1Is
yag
i, K
aku
ru
4
17-2
0 N
ov
Po
nd
s re
pa
ir Eq
uip
pin
g p
art
icip
an
ts w
ith k
no
wle
dg
e o
f re
pa
irin
g p
on
ds
Edro
n F
ish F
arm
-Bu
lob
a-W
aki
so1
67
3Is
yag
i, K
aku
ru
21
29-N
ov-
07Ti
lap
ia H
atc
he
ry t
ec
h-
niq
ue
sD
em
on
stra
te t
o f
arm
ers
th
e t
ilap
ia h
atc
he
ry m
an
ag
e-
me
nt
skill
s u
sing
po
nd
s a
nd
ha
pa
sSO
N F
ish F
arm
219
301
Dr.
Ph
elp
s30
30-N
ov-
07Ti
lap
ia H
atc
he
ry t
ec
h-
niq
ue
sH
ow
to
se
x til
ap
ia t
o a
sse
ss t
he
effi
ca
cy
of
sex
reve
rsa
l; tr
ou
ble
sh
oo
ting
on
ha
tch
erie
s fo
r tila
pia
SON
Fish
Fa
rm19
221
1D
r. P
he
lps
21
Annex 5 68
Da
teTr
ain
ing
Titl
eD
esc
riptio
nLo
ca
tion
of T
rain
ing
Num
be
r Tra
ine
dD
ays
Reso
urc
e P
ers
ons
Pers
on
Da
ysM
ale
Fem
ale
Tota
l
23 &
24
No
v-06
Sein
e M
aki
ng
M
ou
ntin
g o
f se
ine
ma
teria
l to
flo
at
an
d le
ad
lin
es
at
pro
pe
r ha
ng
ing
ratio
; in
sta
llatio
n o
f a
ba
g; m
ud
line
an
d
sein
ing
te
ch
niq
ue
s
AR
DC
Ka
jjan
si52
1466
2V
eve
rica
, Asii
mw
e13
2
30th
-No
v/
1st
De
c-0
6Se
inin
g, H
an
dlin
g, H
arv
est
-in
gSe
inin
g t
ec
hn
iqu
es,
fish
ha
nd
ling
an
d t
ran
sfe
r , u
se o
f h
arv
est
ba
sin; p
on
d re
co
rds
S.O
.N24
630
2V
eve
rica
60
7-D
ec
-06
Fish
Nu
triti
on
& F
ee
d M
an
-a
ge
me
nt
Prin
cip
les
of
fish
nu
triti
on
; qu
alit
ies
of
fish
fe
ed
; fish
fe
ed
ing
te
ch
niq
ue
s.FI
RR
I, Ji
nja
429
511
Dr.
Da
vis
51
14-D
ec
-06
Fish
Fe
ed
Ma
kers
Me
etin
g,
co
nsu
ltativ
e w
ork
sho
pP
rese
nta
tion
on
eq
uip
em
tn a
nd
ma
nu
fac
ture
req
uire
-m
en
ts f
or p
pro
du
ctio
n o
f flo
atin
g f
ee
d. R
ec
en
t d
eve
lop
-m
en
ts in
ext
rud
ed
fe
ed
mill
inve
stm
en
t. S
um
ma
rize
to
tal
fee
d d
em
an
d n
ext
ye
ar.
USA
ID A
PEP
Bo
ard
-ro
om
83
111
Dr.
Da
vis,
Ve
veric
a11
12-D
ec
-06
Fish
Nu
triti
on
& F
ee
din
gP
rinc
iple
s o
f fis
h n
utr
itio
n; q
ua
litie
s o
f fis
h f
ee
d; fi
sh f
ee
din
g
tec
hn
iqu
es.
AR
DC
Ka
jjan
si24
1943
1D
r. D
avi
s43
10-J
an
-07
Oxy
ge
n &
Tra
nsp
ort
Tra
in-
ing
Safe
ty a
nd
use
of
co
mp
ress
ed
oxy
ge
n in
fish
tra
nsp
ort
. H
ow
to
use
oxy
ge
n re
gu
lato
rs a
nd
flo
w m
ete
rs. C
orr
ec
t h
an
dlin
g b
efo
re a
nd
aft
er t
ran
spo
rt.
Ga
rug
a, E
nte
bb
e (
IIL
fish
fa
rm)
2514
391
Ve
veric
a39
22-F
eb
-07
Fish
Fe
ed
ing
& C
arr
yin
g
Ca
pa
city
To e
xpla
in c
arr
yin
g c
ap
ac
ity a
nd
sh
ow
wh
y it
is th
e b
asis
fo
r sto
cki
ng
de
nsit
y a
nd
fe
ed
ing
rec
om
me
nd
atio
ns.
Ho
w
to g
et
the
mo
st o
ut
of
you
r fe
ed
. Fie
ld d
em
on
stra
tion
on
fe
ed
ing
te
ch
niq
ue
s.
Na
firri,
Jin
ja a
nd
SO
N
farm
207
271
Ve
veric
a, I
sya
gi
27
7-M
ar-
07Fi
sh F
ee
din
g &
Ca
rryi
ng
C
ap
ac
ityTo
exp
lain
ca
rryi
ng
ca
pa
city
an
d s
ho
w w
hy
it is
the
ba
sis
for s
toc
kin
g d
en
sity
an
d f
ee
din
g re
co
mm
en
da
tion
s. H
ow
to
ge
t th
e m
ost
ou
t o
f yo
ur f
ee
d. F
ield
de
mo
nst
ratio
n o
n
fee
din
g t
ec
hn
iqu
es.
NA
FIR
RI,
Ka
jjan
si a
nd
K
ase
ng
e F
ish F
arm
, Ss
eg
uku
3115
461
Isya
gi
46
13-M
ar-
07C
ag
e C
ultu
reH
ow
ca
ge
cu
lture
is p
rac
tice
d in
oth
er c
ou
ntr
ies.
Th
e b
a-
sis f
or c
ag
e d
esig
n a
nd
ma
na
ge
me
nt.
Re
sults
fro
m c
ag
e
cu
lture
tria
ls in
Ug
an
da
.
NA
FIR
RI,
Jin
ja, a
nd
U
ga
nd
a F
ish P
ac
kers
c
ag
e s
ite
359
441
Sch
mitt
ou
, Ve
veric
a,
Asii
mw
e44
19-M
ar-
07C
ag
e C
ultu
re s
em
ina
r an
d
co
nsu
ltativ
e w
ork
sho
pBa
sis f
or c
ag
e d
esig
n a
nd
ma
na
ge
me
nt.
Re
sults
fro
m
ca
ge
cu
lture
tria
ls in
Ug
an
da
; Disc
uss
ion
s w
ith g
ove
rn-
me
nt
au
tho
ritie
s o
n n
ee
ds
of
inve
sto
rs re
ga
rdin
g p
olic
y o
n
ca
ge
cu
lture
.
Fish
erie
s Tr
ain
ing
In
stitu
te, E
nte
bb
e10
313
1Sc
hm
itto
u, V
eve
rica
13
23-M
ar-
07P
on
d R
eh
ab
ilita
tion
Sess
ion
he
ld a
t p
on
d s
ide
wh
ere
ren
ova
tion
s w
ere
ab
ou
t to
ta
ke p
lac
e. S
taki
ng
ou
t d
ike
lim
its, h
ow
to
disp
lac
e s
oil
eff
ec
tive
ly, p
on
d d
esig
n c
rite
ria
Ble
sse
d In
vest
me
nts
Fi
sh F
arm
31
41
Isya
gi
4
13th
/14t
h
Ap
ril,
10th
/17t
h
Ma
y 07
Ca
ge
an
d s
ein
e m
aki
ng
He
ld e
xclu
sive
ly f
or e
mp
loye
es
of
Ug
an
da
Fish
ne
t M
an
u-
fac
ture
rs a
t th
eir
fac
tory
. Tr
ain
ed
a t
ea
m o
f w
ork
ers
to
m
ake
ca
ge
s a
nd
co
mm
erc
ial fi
sh f
arm
se
ine
s so
th
e U
FM
ca
n s
ell
the
rea
dy-
ma
de
pro
du
cts
.
UFM
pre
mise
s, K
am
-p
ala
16
74
Asii
mw
e, V
eve
rica
28
26-A
pr-
07Fi
sh F
arm
ers
Sym
po
sium
Pre
sen
tatio
ns
fro
m g
ove
rnm
en
t a
ge
nc
ies
an
d s
up
plie
rs o
n
pe
rmits
req
uire
d &
so
urc
es
of
inp
uts
. Pre
sen
tatio
ns
fro
m
de
mo
nst
ratio
n f
arm
ers
on
less
on
s le
arn
ed
an
d c
urr
en
t p
rod
uc
tion
resu
lts. M
an
y q
ue
stio
ns
fro
m a
ud
ien
ce
.
UM
A C
on
fere
nc
e
Ce
ntr
e16
550
215
1C
om
miss
ion
er f
or F
ishe
ries
FI
SH t
ea
m21
5
4-M
ay-
07O
verv
iew
of
Nig
eria
n
Aq
ua
cu
lture
FISH
sta
ff t
oo
k a
dva
nta
ge
of
a v
isit
by
Jim
Mill
er w
ho
wa
s vi
sitin
g f
rom
Su
da
n t
o h
ave
him
giv
e a
pre
sen
tatio
n o
n
aq
ua
cu
lture
in N
ige
ria w
he
re h
e w
ork
ed
th
ru F
AO
.
NA
FIR
RI,
Ka
jjan
si 19
827
1M
ille
r27
19-M
ay-
07Fi
eld
te
ch
niq
ue
s fo
r fish
h
ea
lth m
an
ag
em
en
tSh
ow
in a
rea
l ha
tch
ery
: sa
mp
le c
olle
ctio
n ,
visu
al s
ign
s o
f d
isea
se, r
evi
ew
of
rec
ord
s to
asc
ert
ain
ca
usa
tive
fa
cto
rsU
mo
ja F
arm
316
371
Terh
un
e, I
sya
gi
37
67 Annex 5

Da
teTr
ain
ing
Titl
eD
esc
riptio
nLo
ca
tion
of T
rain
ing
Num
be
r Tra
ine
dD
ays
Reso
urc
e P
ers
ons
Pers
on
Da
ysM
ale
Fem
ale
Tota
l
15-M
ay-
08Sa
mp
ling
Fish
Eva
lua
te t
he
fe
ed
co
vers
ion
ratio
(FC
R)
an
d g
ive
rec
om
-m
en
da
tion
fo
r th
e n
ec
ess
ary
ad
just
me
nts
Kita
ng
ala
Ga
rde
n
an
d F
ish p
on
ds
84
121
Mu
lam
be
ri Em
ma
12
16-M
ay-
08C
ag
e C
ultu
reD
iscu
ssio
n a
bo
ut
wh
at
ca
ge
cu
lture
is h
ow
it c
an
be
ne
fit
fish
ers
. G
ere
ng
e la
nd
ing
site
72
91
Ra
shid
Asii
mw
e9
22-M
ay-
08U
se o
f w
ate
r te
st k
itD
em
on
tra
tion
of
use
of
wa
ter t
est
ing
eq
uip
me
nts
U
mo
ja F
ish F
arm
65
111
K. V
eve
rica
11
9-13
Ju
ne
- 08
Pro
du
ctio
n a
nd
Bu
sine
ss
Pla
nn
ing
fo
r Ha
tch
ery
Pro
vid
e h
atc
he
ry o
wn
ers
with
pra
ctic
al s
kills
on
ha
tch
ery
m
an
an
ge
nt
an
d o
n p
rod
uc
tion
an
d P
lan
nin
g.
Um
oja
Fish
Fa
rm18
1230
5D
r. Is
yag
i/ D
r. P
he
lps
150
4/Ju
l/08
Intr
od
uc
tion
to
Fish
Fa
rm-
ing
To g
ive
ba
sic c
on
ce
pts
reg
ard
ing
fish
fa
rmin
g a
nd
en
-c
ou
rag
ing
inte
nd
ing
fish
fa
rme
rs .
Mb
ara
ra32
4476
1P.
Sse
bin
yan
si Be
n K
idd
u76
5/Ju
l/08
Co
mm
erc
ial M
an
ag
e-
me
nt
an
d F
ish F
ee
din
gTr
ain
Gro
w-o
ut
Farm
ers
in M
ba
rara
wh
o h
ave
so
urc
ed
se
ed
fro
m M
PIG
I Fish
Fa
rmM
ba
rara
2728
551
P. S
seb
inya
nsi
Ben
Kid
du
55
9/Ju
l/08
Fish
Po
nd
Co
nst
ruc
tion
a
nd
Re
pa
irR
efr
esh
tra
ine
rs in
Fish
Co
nst
ruc
tion
Te
ch
niq
ue
s a
nd
re
late
d k
ey
issu
es.
Kite
zi F
ish f
arm
(S
sem
pe
bw
a’s
)11
516
1D
r. Is
yag
i an
d P
. Sse
bin
-ya
nsi
16
8/A
ug
/08
Pe
gg
ing
ou
t N
ew
Po
nd
sTr
ain
stu
de
nts
fro
m F
TI, E
ng
ine
ers
wh
o h
ave
be
en
alre
ad
y tr
ain
ed
on
po
nd
reh
ab
ilita
tion
on
ho
w t
o s
take
ou
t a
ne
w
po
nd
.
AR
DC
- K
ajja
nsi
137
201
Ve
veric
a a
nd
Isya
gi
20
28/A
ug
/08
Fish
Po
nd
Co
nst
ruc
tion
fo
r En
gin
ee
rsTr
ain
En
gin
ne
rs o
n d
esig
n c
rete
ria a
nd
co
nst
ruc
tion
re-
qu
irem
en
ts a
nd
op
tion
s fo
r Le
eve
an
d R
ese
rvio
r Po
nd
sA
RD
C-
Ka
jjan
si23
427
1V
eve
rica
an
d Is
yag
i27
5/Se
p/0
8Fi
sh F
arm
Ma
ch
ine
ry
Equ
ip F
arm
ers
with
ski
lls o
n h
ow
to
use
diff
ere
nt
typ
es
of
Aq
ua
cu
lture
ma
ch
ine
ries
an
d h
ow
to
ma
inta
in t
he
m. H
ow
to
ca
lcu
late
en
erg
y re
qu
irme
nts
.
Um
oja
Fish
Fa
rm28
735
1V
eve
rica
an
d Is
yag
i35
6/Se
p/0
8Se
min
ar f
or N
ew
an
d
Stru
gg
ling
Fa
rme
rsEq
uip
inte
nd
ing
an
d s
tru
gg
ling
fa
rme
rs w
ith t
he
ba
sic
info
rma
tion
on
Fish
Fa
rmin
g a
nd
ha
nd
s- o
n s
kills
on
fish
fa
rmin
g m
an
ag
me
t a
nd
bu
sine
ss p
lan
nin
g.
Ug
an
da
Ma
na
ge
-m
en
t In
stitu
te,
Ka
mp
ala
608
681
Ve
veric
a a
nd
Isya
gi
68
Tota
l pe
rso
n-d
ays
:49
70
Annex 5 70
Da
teTr
ain
ing
Titl
eD
esc
riptio
nLo
ca
tion
of T
rain
ing
Num
be
r Tra
ine
dD
ays
Reso
urc
e P
ers
ons
Pers
on
Da
ysM
ale
Fem
ale
Tota
l
4-D
ec
-07
Ca
tfish
Ha
tch
ery
Ma
n-
ag
em
en
t 2
De
mo
nst
ratio
n o
n h
an
dlin
g b
roo
dst
oc
k d
urin
g
eg
g f
atil
isatio
n,d
iseff
ec
ting
eg
gs
with
KM
nO
4, in
-c
ub
atio
n f
ac
ilitie
s,e
stim
atin
g t
he
eg
g a
mo
un
t a
nd
q
ua
lity,
bro
od
sto
ck
spa
wn
ing
an
d m
ilt c
olle
ctio
n.
Um
oja
Fa
rm31
940
1D
r. P
he
lps
40
6-D
ec
-07
Ca
tfish
Ha
tch
ery
Ma
n-
ag
em
en
t 4
Equ
ip f
arm
ers
with
ha
nd
s-o
n s
kills
on
th
e fi
rst
fee
din
g
on
sp
aw
ne
d fi
sh, l
arv
a re
arin
g, d
ec
ystin
g a
nd
ha
tch
-in
g a
rte
mia
s w
ell
as
qu
alit
y c
ysts
.te
ch
niq
ue
s o
ff fi
sh
tra
nsf
er a
nd
ha
tch
ery
sip
ho
nin
g,s
toc
kin
g la
rva
fish
, fish
tr
ea
tme
nt,
nu
sery
ma
na
ge
me
nt,
fish
fe
ed
ing
an
d re
co
rd
kee
pin
g.
Um
oja
Fa
rm31
738
1D
r. P
he
lps
38
7-D
ec
-07
Ca
tfish
Ha
tch
ery
Ma
n-
ag
em
en
t 5
Ha
nd
s-o
n s
kills
on
Pre
pa
ratio
n,s
toc
kin
ga
nd
ma
na
ge
-m
en
t o
f n
urs
ery
po
nd
s;h
an
dlin
g fi
ng
erli
ng
s;tr
an
sfe
r of
live
fis
h w
ithin
an
d w
itho
ut
ha
tch
ery
po
nd
s; u
se o
f K
Mn
04 f
or
tre
atm
en
t in
po
nd
s.
Um
oja
Fa
rm22
1032
1D
r. P
he
lps
32
8-D
ec
-07
Ca
tfish
Ha
tch
ery
Ma
n-
ag
em
en
t 6
To d
em
on
stra
te p
rac
tica
l ski
lls o
n g
rad
ing
3 d
iffe
ren
t siz
es
of
ca
tfish
fin
ge
rlin
gs
an
d t
ran
spo
rt m
eth
od
s fo
r lo
ng
d
ista
nc
e.
Um
oja
Fa
rm11
314
1D
r. P
he
lps
14
17-2
0 D
ec
Po
nd
ren
ova
tion
Pra
ctic
al o
n p
on
d re
no
vatio
n,h
arv
est
ing
ba
sin &
inst
alla
-tio
n f
or F
TI g
rad
ua
tes
Ma
tovu
’s f
arm
-Mp
igi
30
34
Dr.
Isya
gi
12
7-12
-Ja
n-
08P
on
d C
on
stru
ctio
nD
em
on
stra
te t
o s
tud
en
ts h
ow
to
co
nst
ruc
t fis
h p
on
ds
(9.8
M X
13M
) u
nd
er s
up
erv
isio
n, m
ea
sure
of
slop
es,
leve
e
dim
en
sion
s a
nd
lea
rnin
g c
orr
ec
t c
om
pa
ctio
n o
f th
e
leve
es.
Fish
erie
s Tr
ain
ing
In
stitu
te(F
TI),
En
teb
be
146
206
Ka
kuru
JB
120
8-11
-Ja
n-
08A
pp
lied
wa
ter Q
ua
lity
Wa
ter s
am
plin
g, p
rop
er u
se, h
an
dlin
g a
nd
sto
rag
e o
f w
ate
r qu
alit
y e
qu
ipm
en
t, im
po
rta
nt
pa
ram
ete
rs, a
na
lysis
a
nd
inte
rpre
tatio
n o
f th
e re
sults
th
ere
of.
Um
oja
Fa
rm,W
aki
so33
841
4D
r. Is
yag
i; D
r Le
on
ard
164
18/J
an
/08
Ma
na
ge
me
nt
of
Re
cir-
cu
latin
g W
ate
r sys
tem
-C
atfi
sh H
atc
he
ry
De
mo
nst
rate
to
ca
tfish
op
era
tors
, stu
de
nts
, Tra
ine
rs a
nd
in
ten
din
g f
arm
ers
th
e b
asic
co
nc
ep
ts o
f m
an
ag
ing
wa
ter
re-u
se s
yste
m f
or c
atfi
sh p
rod
uc
tion
.
Inte
rfish
, En
teb
be
23
528
1D
r. Is
yag
i28
31/J
an
/08
Sto
cki
ng
An
d P
on
d m
an
-a
ge
me
nt
Tra
inin
g T
rials
an
d o
the
r Fa
rme
rs a
bo
ut
Sto
cki
ng
, ba
sic
po
nd
Ma
na
ge
me
nt
an
d R
ec
ord
ke
ep
ing
.M
uSO
4 En
terp
rise
s,
Iga
ng
a20
525
1D
r. Is
yag
i25
20/M
ar/
08Fe
ed
ing
Fish
an
d P
on
d
Fert
iliza
tion
Fee
din
g t
ec
hn
iqu
es,
Fe
ed
Co
nve
rsio
n R
atio
s (F
CR
s), P
on
d
Fert
iliza
tion
vis-
a-v
is to
sta
tic w
ate
r ma
na
ge
me
nt.
Mu
SO4
Ente
rpris
es,
Ig
an
ga
113
141
Dr.
Isya
gi
14
26/M
ar/
08Fi
sh S
mo
kin
g u
sing
a
ch
oke
r sm
oke
rD
em
on
stra
ting
to
fa
rme
rs h
ow
to
cle
an
an
d s
mo
ke fi
sh
usin
g “
ch
ork
or”
sm
oke
rN
aFI
RR
I-Ka
jjan
si5
16
1R
. Asii
mw
e6
22 -
25
Ap
r 08
Fish
He
alth
Ma
na
ge
me
nt
De
mo
nst
rate
use
an
d s
et
up
of
ha
tch
ing
jar,
pre
pa
re n
urs
-e
ry p
on
ds,
an
d P
ricip
les
of
he
alth
ma
na
ge
me
nt
Um
oja
Fish
Fa
rm33
942
4D
r. Is
yag
i16
8
28-A
pr-
08Fi
sh F
ee
d M
an
ufa
ctu
reLe
ctu
re o
n re
qu
irem
en
ts f
or fi
sh f
ee
d m
an
ufa
ctu
reK
ajja
nsi
AR
DC
33
61
Dr.
Alle
n D
avi
s6
28-A
pr-
08O
ut
Gro
we
rs F
ish F
arm
ing
Ha
nd
s-o
n s
kills
on
ou
tgro
win
g t
ec
hn
iqu
es
Mp
igi F
ish F
arm
92
111
Dr.
Isya
gi /
C. D
uc
arm
e11
29-A
pr-
08R
ese
arc
h M
eth
od
s fo
r p
rod
uc
tion
an
d f
ee
d
eva
lua
tion
Ou
tlin
e s
tan
da
rd m
eth
od
s u
sed
in p
on
ds
an
d h
ap
pa
an
d
lab
ora
tory
-ba
sed
aq
ua
cu
lture
rese
arc
h.
Ka
jjan
si A
RD
C28
836
1D
r. A
llen
Da
vis
36
6-7M
ay
082n
d F
ish F
arm
ers
Sym
po
-siu
m a
nd
Tra
de
Sh
ow
Pre
sen
tatio
ns
fro
m g
ove
rnm
en
t a
ge
nc
ies
an
d s
up
plie
rs
on
pe
rmits
req
uire
d &
so
urc
es
of
inp
uts
. Pre
sen
tatio
ns
on
e
nte
rpris
e b
ud
ge
ts a
nd
fa
rm p
lan
nin
g; c
urr
en
t p
rod
uc
tion
re
sults
. Ma
ny
qu
est
ion
s fr
om
au
die
nc
e.
UM
A C
on
fere
nc
e
Ce
ntr
e15
022
172
2e
ntir
e F
ISH
te
am
, go
vern
-m
en
t re
ps,
rese
arc
he
rs,
farm
ers
344
69 Annex 5
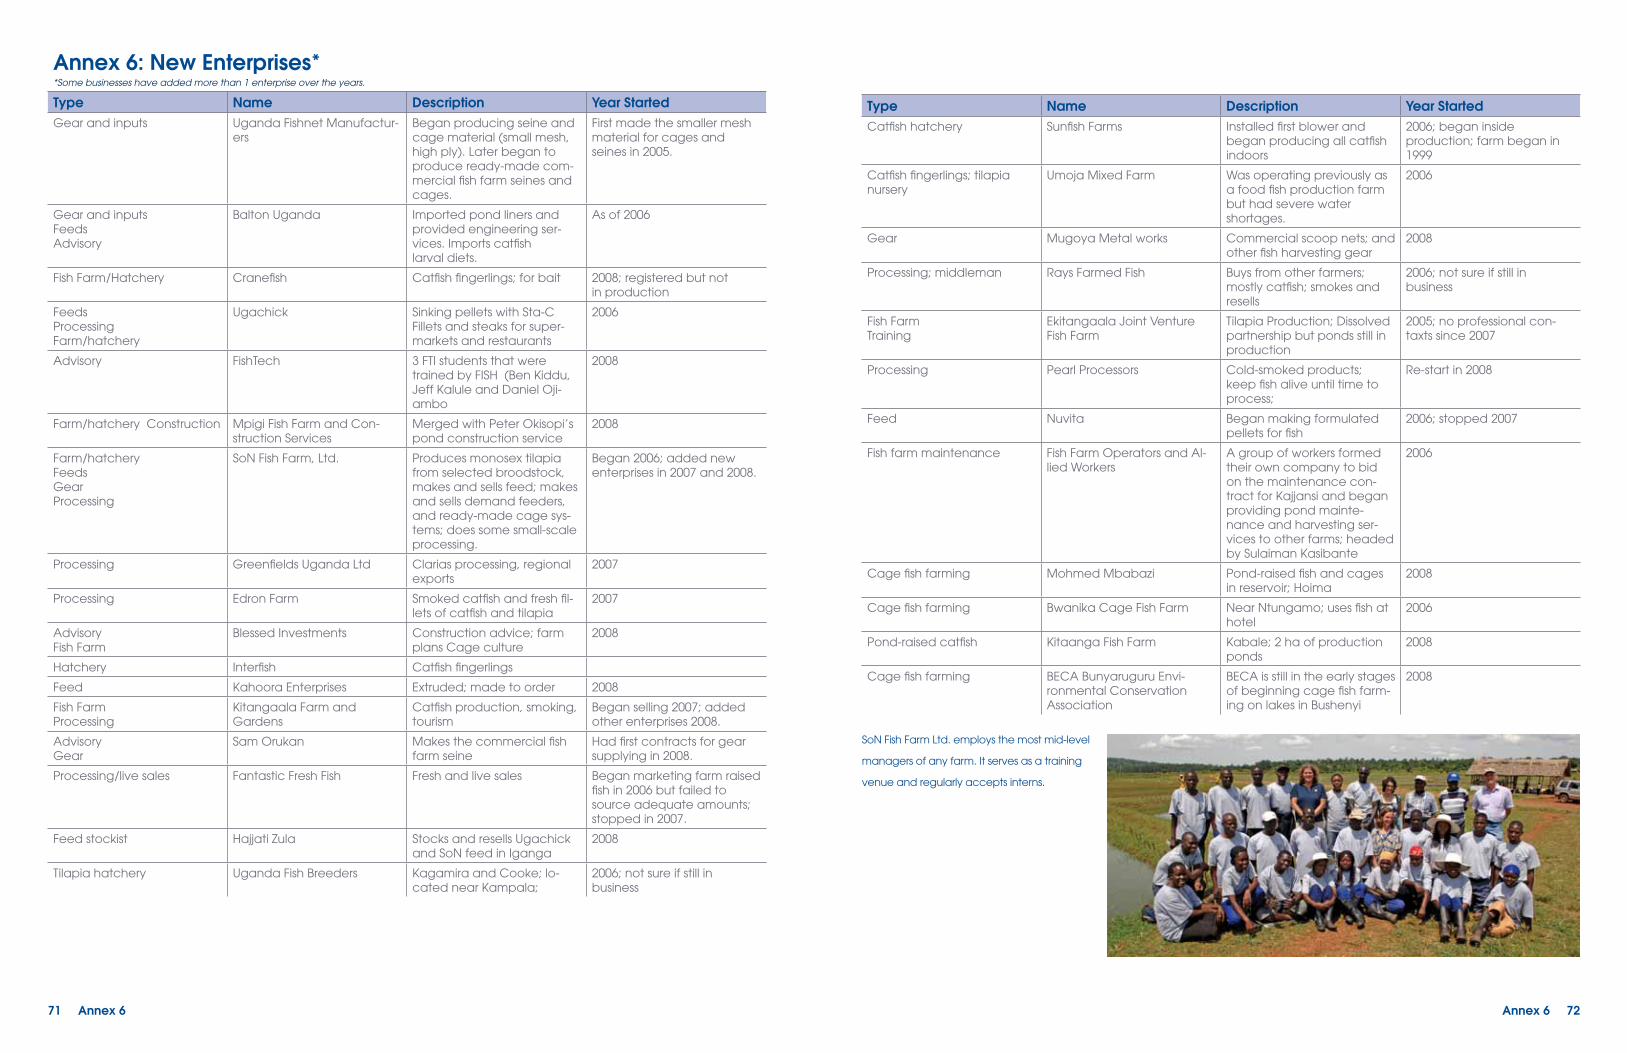
Type Name Description Year StartedCatfish hatchery Sunfish Farms Installed first blower and
began producing all catfish indoors
2006; began insideproduction; farm began in 1999
Catfish fingerlings; tilapia nursery
Umoja Mixed Farm Was operating previously as a food fish production farm but had severe watershortages.
2006
Gear Mugoya Metal works Commercial scoop nets; and other fish harvesting gear
2008
Processing; middleman Rays Farmed Fish Buys from other farmers; mostly catfish; smokes and resells
2006; not sure if still inbusiness
Fish FarmTraining
Ekitangaala Joint Venture Fish Farm
Tilapia Production; Dissolved partnership but ponds still in production
2005; no professional con-taxts since 2007
Processing Pearl Processors Cold-smoked products; keep fish alive until time to process;
Re-start in 2008
Feed Nuvita Began making formulated pellets for fish
2006; stopped 2007
Fish farm maintenance Fish Farm Operators and Al-lied Workers
A group of workers formed their own company to bid on the maintenance con-tract for Kajjansi and began providing pond mainte-nance and harvesting ser-vices to other farms; headed by Sulaiman Kasibante
2006
Cage fish farming Mohmed Mbabazi Pond-raised fish and cages in reservoir; Hoima
2008
Cage fish farming Bwanika Cage Fish Farm Near Ntungamo; uses fish at hotel
2006
Pond-raised catfish Kitaanga Fish Farm Kabale; 2 ha of production ponds
2008
Cage fish farming BECA Bunyaruguru Envi-ronmental Conservation Association
BECA is still in the early stages of beginning cage fish farm-ing on lakes in Bushenyi
2008
Annex 6 72
SoN Fish Farm Ltd. employs the most mid-level
managers of any farm. It serves as a training
venue and regularly accepts interns.
Annex 6: New Enterprises**Some businesses have added more than 1 enterprise over the years.
Type Name Description Year StartedGear and inputs Uganda Fishnet Manufactur-
ersBegan producing seine and cage material (small mesh, high ply). Later began to produce ready-made com-mercial fish farm seines and cages.
First made the smaller mesh material for cages and seines in 2005.
Gear and inputsFeedsAdvisory
Balton Uganda Imported pond liners and provided engineering ser-vices. Imports catfishlarval diets.
As of 2006
Fish Farm/Hatchery Cranefish Catfish fingerlings; for bait 2008; registered but notin production
FeedsProcessingFarm/hatchery
Ugachick Sinking pellets with Sta-CFillets and steaks for super-markets and restaurants
2006
Advisory FishTech 3 FTI students that were trained by FISH (Ben Kiddu, Jeff Kalule and Daniel Oji-ambo
2008
Farm/hatchery Construction Mpigi Fish Farm and Con-struction Services
Merged with Peter Okisopi’s pond construction service
2008
Farm/hatcheryFeedsGearProcessing
SoN Fish Farm, Ltd. Produces monosex tilapia from selected broodstock, makes and sells feed; makes and sells demand feeders, and ready-made cage sys-tems; does some small-scale processing.
Began 2006; added new enterprises in 2007 and 2008.
Processing Greenfields Uganda Ltd Clarias processing, regional exports
2007
Processing Edron Farm Smoked catfish and fresh fil-lets of catfish and tilapia
2007
AdvisoryFish Farm
Blessed Investments Construction advice; farm plans Cage culture
2008
Hatchery Interfish Catfish fingerlings
Feed Kahoora Enterprises Extruded; made to order 2008
Fish FarmProcessing
Kitangaala Farm and Gardens
Catfish production, smoking, tourism
Began selling 2007; added other enterprises 2008.
AdvisoryGear
Sam Orukan Makes the commercial fish farm seine
Had first contracts for gear supplying in 2008.
Processing/live sales Fantastic Fresh Fish Fresh and live sales Began marketing farm raised fish in 2006 but failed to source adequate amounts; stopped in 2007.
Feed stockist Hajjati Zula Stocks and resells Ugachick and SoN feed in Iganga
2008
Tilapia hatchery Uganda Fish Breeders Kagamira and Cooke; lo-cated near Kampala;
2006; not sure if still inbusiness
71 Annex 6
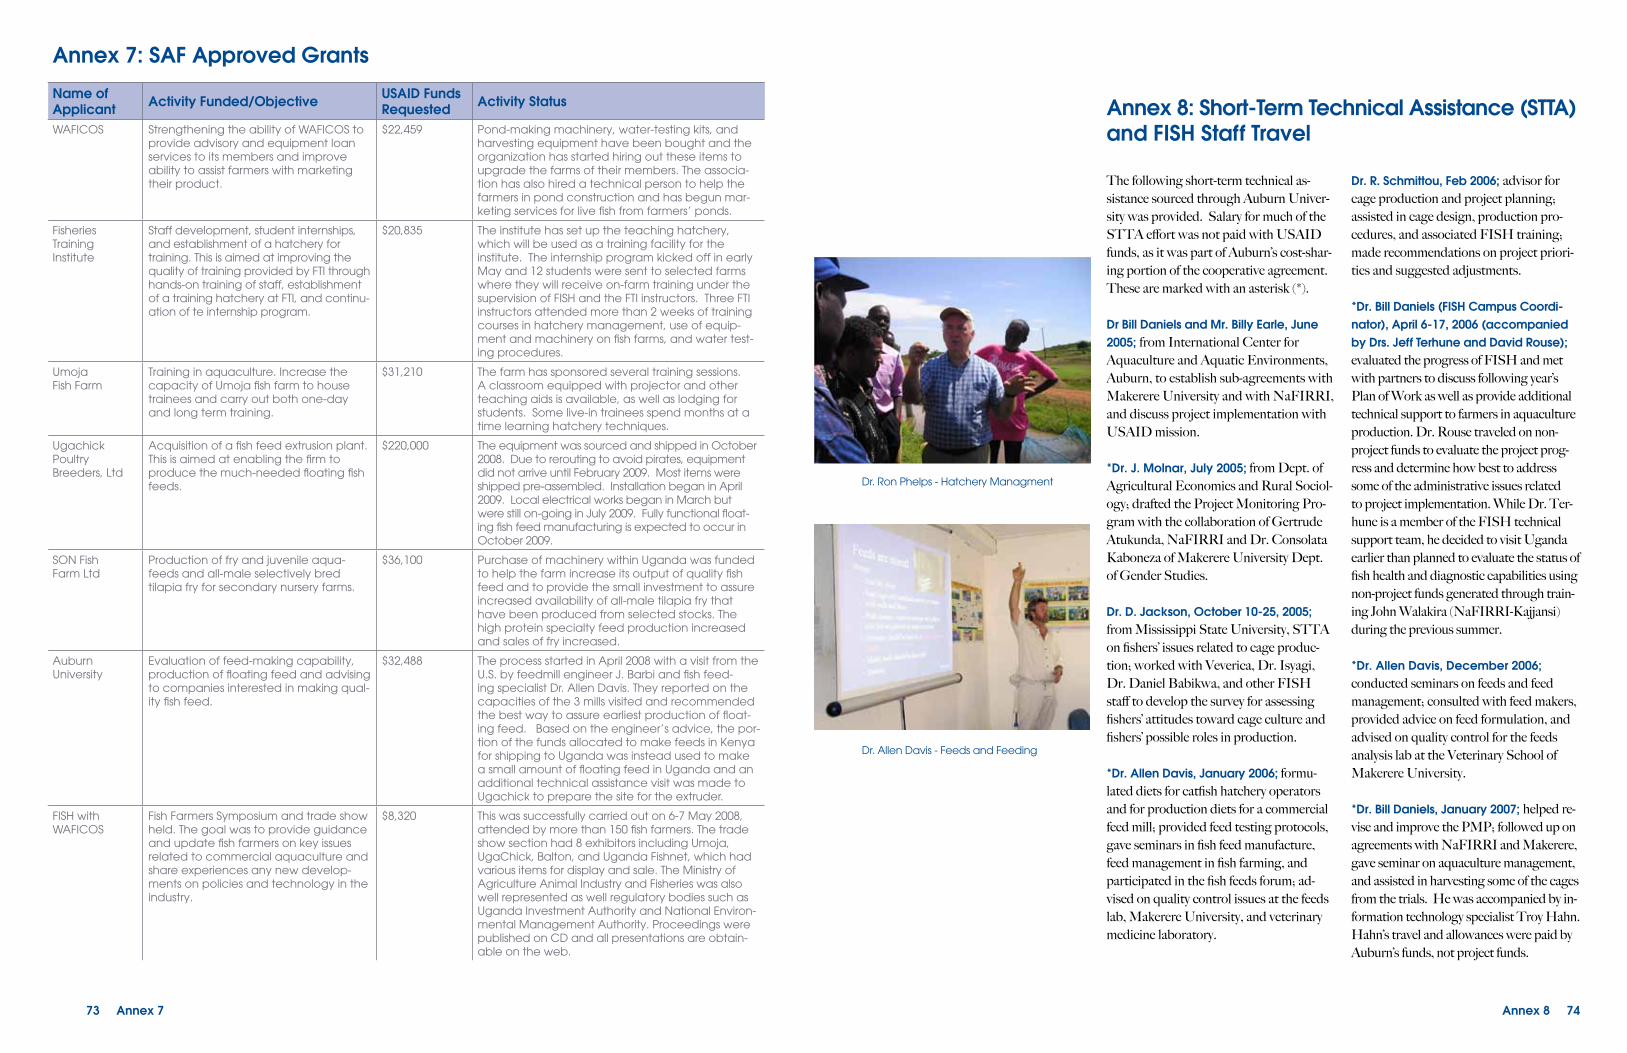
The following short-term technical as-sistance sourced through Auburn Univer-sity was provided. Salary for much of the STTA effort was not paid with USAID funds, as it was part of Auburn’s cost-shar-ing portion of the cooperative agreement. These are marked with an asterisk (*).
Dr Bill Daniels and Mr. Billy Earle, June 2005; from International Center for Aquaculture and Aquatic Environments, Auburn, to establish sub-agreements with Makerere University and with NaFIRRI, and discuss project implementation with USAID mission.
*Dr. J. Molnar, July 2005; from Dept. of Agricultural Economics and Rural Sociol-ogy; drafted the Project Monitoring Pro-gram with the collaboration of Gertrude Atukunda, NaFIRRI and Dr. Consolata Kaboneza of Makerere University Dept. of Gender Studies.
Dr. D. Jackson, October 10-25, 2005; from Mississippi State University, STTA on fishers’ issues related to cage produc-tion; worked with Veverica, Dr. Isyagi, Dr. Daniel Babikwa, and other FISH staff to develop the survey for assessing fishers’ attitudes toward cage culture and fishers’ possible roles in production.
*Dr. Allen Davis, January 2006; formu-lated diets for catfish hatchery operators and for production diets for a commercial feed mill; provided feed testing protocols, gave seminars in fish feed manufacture, feed management in fish farming, and participated in the fish feeds forum; ad-vised on quality control issues at the feeds lab, Makerere University, and veterinary medicine laboratory.
Dr. R. Schmittou, Feb 2006; advisor for cage production and project planning; assisted in cage design, production pro-cedures, and associated FISH training; made recommendations on project priori-ties and suggested adjustments.
*Dr. Bill Daniels (FISH Campus Coordi-nator), April 6-17, 2006 (accompanied by Drs. Jeff Terhune and David Rouse); evaluated the progress of FISH and met with partners to discuss following year’s Plan of Work as well as provide additional technical support to farmers in aquaculture production. Dr. Rouse traveled on non-project funds to evaluate the project prog-ress and determine how best to address some of the administrative issues related to project implementation. While Dr. Ter-hune is a member of the FISH technical support team, he decided to visit Uganda earlier than planned to evaluate the status of fish health and diagnostic capabilities using non-project funds generated through train-ing John Walakira (NaFIRRI-Kajjansi) during the previous summer.
*Dr. Allen Davis, December 2006; conducted seminars on feeds and feed management; consulted with feed makers, provided advice on feed formulation, and advised on quality control for the feeds analysis lab at the Veterinary School of Makerere University.
*Dr. Bill Daniels, January 2007; helped re-vise and improve the PMP; followed up on agreements with NaFIRRI and Makerere, gave seminar on aquaculture management, and assisted in harvesting some of the cages from the trials. He was accompanied by in-formation technology specialist Troy Hahn. Hahn’s travel and allowances were paid by Auburn’s funds, not project funds.
Annex 8: Short-Term Technical Assistance (STTA)and FISH Staff Travel
Annex 8 74
Dr. Ron Phelps - Hatchery Managment
Dr. Allen Davis - Feeds and Feeding
Annex 7: SAF Approved Grants
Name ofApplicant Activity Funded/Objective USAID Funds
Requested Activity Status
WAFICOS Strengthening the ability of WAFICOS to provide advisory and equipment loan services to its members and improve ability to assist farmers with marketing their product.
$22,459 Pond-making machinery, water-testing kits, and harvesting equipment have been bought and the organization has started hiring out these items to upgrade the farms of their members. The associa-tion has also hired a technical person to help the farmers in pond construction and has begun mar-keting services for live fish from farmers’ ponds.
Fisheries Training Institute
Staff development, student internships, and establishment of a hatchery for training. This is aimed at improving the quality of training provided by FTI through hands-on training of staff, establishment of a training hatchery at FTI, and continu-ation of te internship program.
$20,835 The institute has set up the teaching hatchery, which will be used as a training facility for the institute. The internship program kicked off in early May and 12 students were sent to selected farms where they will receive on-farm training under the supervision of FISH and the FTI instructors. Three FTI instructors attended more than 2 weeks of training courses in hatchery management, use of equip-ment and machinery on fish farms, and water test-ing procedures.
UmojaFish Farm
Training in aquaculture. Increase the capacity of Umoja fish farm to house trainees and carry out both one-day and long term training.
$31,210 The farm has sponsored several training sessions. A classroom equipped with projector and other teaching aids is available, as well as lodging for students. Some live-in trainees spend months at a time learning hatchery techniques.
Ugachick PoultryBreeders, Ltd
Acquisition of a fish feed extrusion plant. This is aimed at enabling the firm to produce the much-needed floating fish feeds.
$220,000 The equipment was sourced and shipped in October 2008. Due to rerouting to avoid pirates, equipment did not arrive until February 2009. Most items were shipped pre-assembled. Installation began in April 2009. Local electrical works began in March but were still on-going in July 2009. Fully functional float-ing fish feed manufacturing is expected to occur in October 2009.
SON FishFarm Ltd
Production of fry and juvenile aqua-feeds and all-male selectively bred tilapia fry for secondary nursery farms.
$36,100 Purchase of machinery within Uganda was funded to help the farm increase its output of quality fish feed and to provide the small investment to assure increased availability of all-male tilapia fry that have been produced from selected stocks. The high protein specialty feed production increased and sales of fry increased.
AuburnUniversity
Evaluation of feed-making capability, production of floating feed and advising to companies interested in making qual-ity fish feed.
$32,488 The process started in April 2008 with a visit from the U.S. by feedmill engineer J. Barbi and fish feed-ing specialist Dr. Allen Davis. They reported on the capacities of the 3 mills visited and recommended the best way to assure earliest production of float-ing feed. Based on the engineer’s advice, the por-tion of the funds allocated to make feeds in Kenya for shipping to Uganda was instead used to make a small amount of floating feed in Uganda and an additional technical assistance visit was made to Ugachick to prepare the site for the extruder.
FISH withWAFICOS
Fish Farmers Symposium and trade show held. The goal was to provide guidance and update fish farmers on key issues related to commercial aquaculture and share experiences any new develop-ments on policies and technology in the industry.
$8,320 This was successfully carried out on 6-7 May 2008, attended by more than 150 fish farmers. The trade show section had 8 exhibitors including Umoja, UgaChick, Balton, and Uganda Fishnet, which had various items for display and sale. The Ministry of Agriculture Animal Industry and Fisheries was also well represented as well regulatory bodies such as Uganda Investment Authority and National Environ-mental Management Authority. Proceedings were published on CD and all presentations are obtain-able on the web.
73 Annex 7
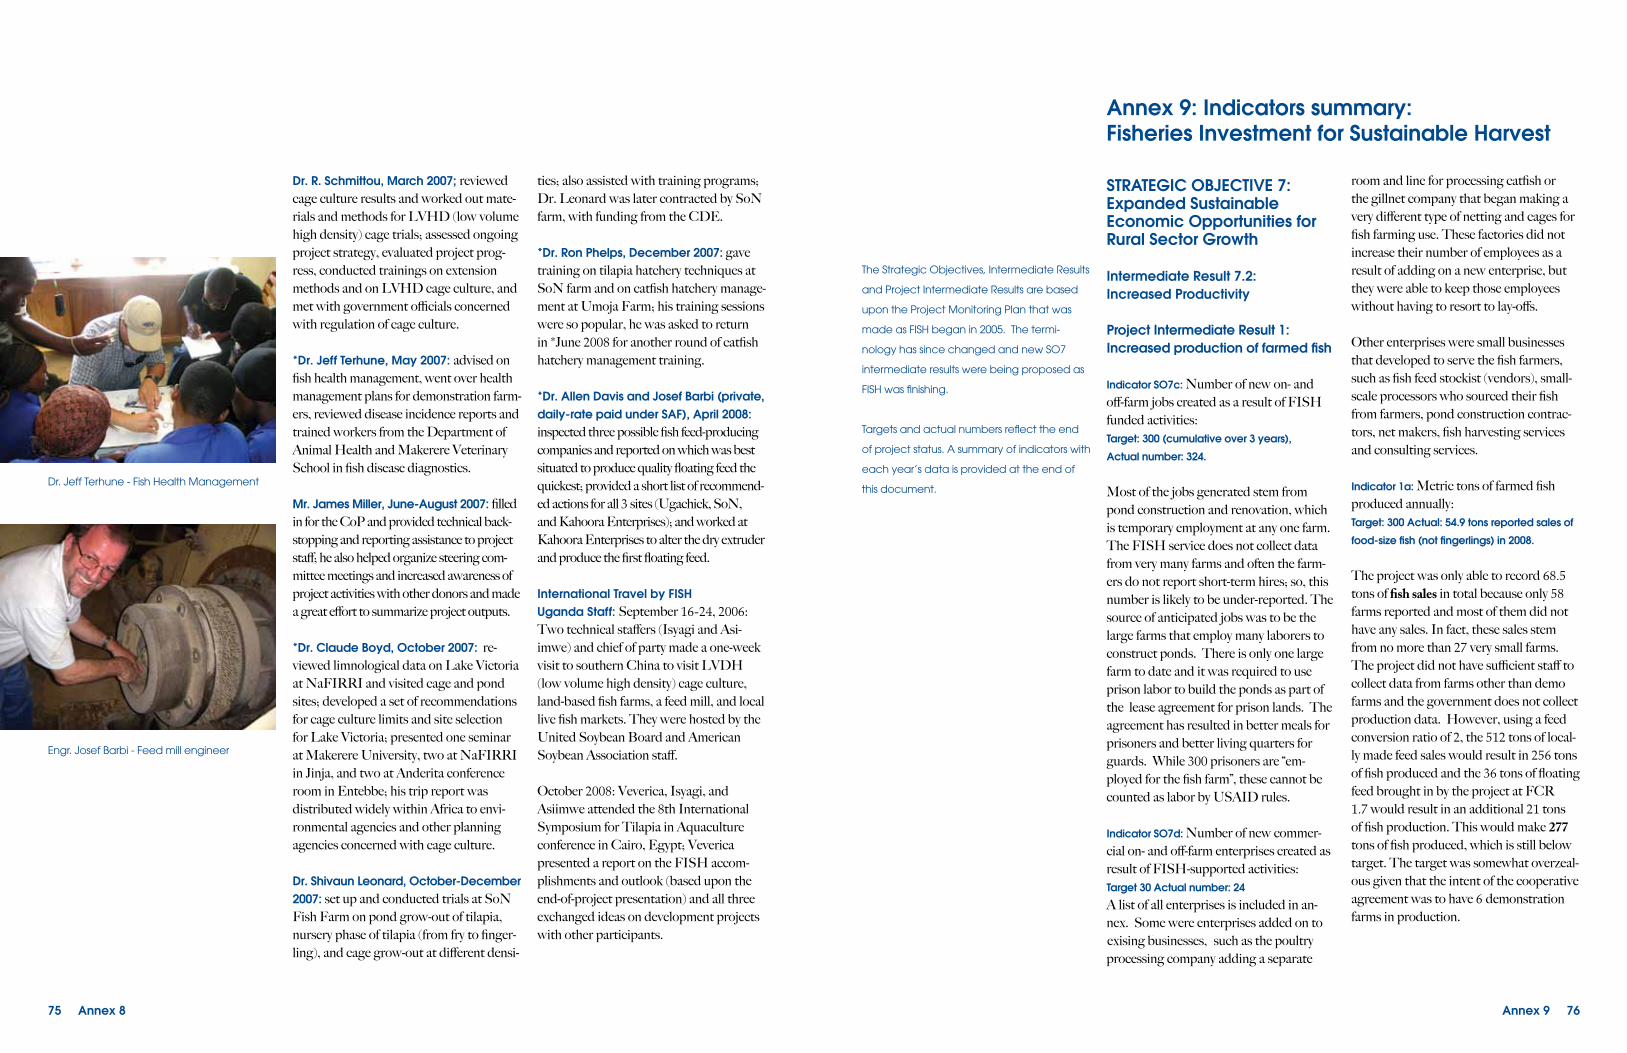
The Strategic Objectives, Intermediate Results
and Project Intermediate Results are based
upon the Project Monitoring Plan that was
made as FISH began in 2005. The termi-
nology has since changed and new SO7
intermediate results were being proposed as
FISH was finishing.
Targets and actual numbers reflect the end
of project status. A summary of indicators with
each year’s data is provided at the end of
this document.
Annex 9: Indicators summary:Fisheries Investment for Sustainable Harvest
Annex 9 76
STRATEGIC OBJECTIVE 7: Expanded Sustainable Economic Opportunities for Rural Sector Growth
Intermediate Result 7.2:Increased Productivity
Project Intermediate Result 1:Increased production of farmed fish
Indicator SO7c: Number of new on- and off-farm jobs created as a result of FISH funded activities:Target: 300 (cumulative over 3 years),
Actual number: 324.
Most of the jobs generated stem from pond construction and renovation, which is temporary employment at any one farm. The FISH service does not collect data from very many farms and often the farm-ers do not report short-term hires; so, this number is likely to be under-reported. The source of anticipated jobs was to be the large farms that employ many laborers to construct ponds. There is only one large farm to date and it was required to use prison labor to build the ponds as part of the lease agreement for prison lands. The agreement has resulted in better meals for prisoners and better living quarters for guards. While 300 prisoners are “em-ployed for the fish farm”, these cannot be counted as labor by USAID rules.
Indicator SO7d: Number of new commer-cial on- and off-farm enterprises created as result of FISH-supported activities: Target 30 Actual number: 24
A list of all enterprises is included in an-nex. Some were enterprises added on to existing businesses, such as the poultry processing company adding a separate
room and line for processing catfish or the gillnet company that began making a very different type of netting and cages for fish farming use. These factories did not increase their number of employees as a result of adding on a new enterprise, but they were able to keep those employees without having to resort to lay-offs.
Other enterprises were small businesses that developed to serve the fish farmers, such as fish feed stockist (vendors), small-scale processors who sourced their fish from farmers, pond construction contrac-tors, net makers, fish harvesting services and consulting services.
Indicator 1a: Metric tons of farmed fish produced annually: Target: 300 Actual: 54.9 tons reported sales of
food-size fish (not fingerlings) in 2008.
The project was only able to record 68.5 tons of fish sales in total because only 58 farms reported and most of them did not have any sales. In fact, these sales stem from no more than 27 very small farms. The project did not have sufficient staff to collect data from farms other than demo farms and the government does not collect production data. However, using a feed conversion ratio of 2, the 512 tons of local-ly made feed sales would result in 256 tons of fish produced and the 36 tons of floating feed brought in by the project at FCR 1.7 would result in an additional 21 tons of fish production. This would make 277
tons of fish produced, which is still below target. The target was somewhat overzeal-ous given that the intent of the cooperative agreement was to have 6 demonstration farms in production.
exising businesses,
Dr. R. Schmittou, March 2007; reviewed cage culture results and worked out mate-rials and methods for LVHD (low volume high density) cage trials; assessed ongoing project strategy, evaluated project prog-ress, conducted trainings on extension methods and on LVHD cage culture, and met with government officials concerned with regulation of cage culture.
*Dr. Jeff Terhune, May 2007: advised on fish health management, went over health management plans for demonstration farm-ers, reviewed disease incidence reports and trained workers from the Department of Animal Health and Makerere Veterinary School in fish disease diagnostics.
Mr. James Miller, June-August 2007: filled in for the CoP and provided technical back-stopping and reporting assistance to project staff; he also helped organize steering com-mittee meetings and increased awareness of project activities with other donors and made a great effort to summarize project outputs.
*Dr. Claude Boyd, October 2007: re-viewed limnological data on Lake Victoria at NaFIRRI and visited cage and pond sites; developed a set of recommendations for cage culture limits and site selection for Lake Victoria; presented one seminar at Makerere University, two at NaFIRRI in Jinja, and two at Anderita conference room in Entebbe; his trip report was distributed widely within Africa to envi-ronmental agencies and other planning agencies concerned with cage culture.
Dr. Shivaun Leonard, October-December 2007: set up and conducted trials at SoN Fish Farm on pond grow-out of tilapia, nursery phase of tilapia (from fry to finger-ling), and cage grow-out at different densi-
ties; also assisted with training programs; Dr. Leonard was later contracted by SoN farm, with funding from the CDE.
*Dr. Ron Phelps, December 2007: gave training on tilapia hatchery techniques at SoN farm and on catfish hatchery manage-ment at Umoja Farm; his training sessions were so popular, he was asked to return in *June 2008 for another round of catfish hatchery management training.
*Dr. Allen Davis and Josef Barbi (private, daily-rate paid under SAF), April 2008: inspected three possible fish feed-producing companies and reported on which was best situated to produce quality floating feed the quickest; provided a short list of recommend-ed actions for all 3 sites (Ugachick, SoN, and Kahoora Enterprises); and worked at Kahoora Enterprises to alter the dry extruder and produce the first floating feed.
International Travel by FISHUganda Staff: September 16-24, 2006: Two technical staffers (Isyagi and Asi-imwe) and chief of party made a one-week visit to southern China to visit LVDH (low volume high density) cage culture, land-based fish farms, a feed mill, and local live fish markets. They were hosted by the United Soybean Board and American Soybean Association staff.
October 2008: Veverica, Isyagi, and Asiimwe attended the 8th International Symposium for Tilapia in Aquaculture conference in Cairo, Egypt; Veverica presented a report on the FISH accom-plishments and outlook (based upon the end-of-project presentation) and all three exchanged ideas on development projects with other participants.
75 Annex 8
Engr. Josef Barbi - Feed mill engineer
Dr. Jeff Terhune - Fish Health Management

4. Clarias fingerling production using vari-
ous levels of intensity, 6 farms: Sunfish Farm, Umoja Fish Farm, Mpigi Fish Farm, MuSO
4 Fish Farm, Namuy-
enje farm, Interfish. 5. Production of tilapia in low volume-
high density cages: SoN Fish Farm, Namuyenje Fish Farm, Blessed Investments, Interfish (Garuga) and Uganda Fish Packers. The latter 2 have ceased these trials.
6. Tilapia nursery: Purchase fry from a dealer and then grow out in fertilized ponds with small amounts of feed for re-sale as fingerlings or use in cages. Namuyenge Farm, Umoja Fish Farm, Mpigi Farm, MuSO
4 farm,
7. Holding tanks and transport facilities: Tank culture of catfish was demon-strated using partial water exchange at Interfish, at Garuga. Density of 70 kg/m3 was attained and then fish stopped growing. All reporting hatcheries now use graders and fish holding systems prior to transport.
8. Catfish production in cages was tested on 2 occasions at Uganda Fish Pack-ers cage site. The site was stopped and no other catfish cage demonstra-tions are available so this is not con-sidered in the total of new production systems in demonstration. However, some recommendations were gener-ated from these trials.
Indicator 1.1b: Number of farms demon-strating model systems: Target: 20 Actual: 27
This is the number of farms that reported sales in 2008. 17 farms were used as data sources for the development of manage-ment recommendations. Three others have been dropped.
Indicator 1.1.c: Number of producers using improved production technologies: Target: 40 (revised from 20 listed in earlier ver-
sion of PMP) Actual: 58
The number is the total number of “report-ing farms” who submitted the sales and in-ventory reports. All of these farmers have received training from the FISH Service. The types of improved technology that are being tracked are:• Improved pond construction (almost
all 58 farms)• 20 use formulated feeds and associ-
ated record-keeping. Some, on their own accord, have elected to use other feeds based upon availability and economics.
• 27 have a production plan that includes a management strategy and business plan.
• All have some type of pond records (and associated pond inventory report).
• 7 use aeration in the early growth phases. All are hatcheries.
• Water quality measures are made and WQ records are kept at the hatcheries.
• Health management plans have been implemented at all of the 19 hatcheries.
Other farmers who visited the demonstra-tion farms have begun adopting these technologies as well. However, docu-menting the adoption requires additional manpower, which the project did not have. Therefore, only known adopters are recorded, as evidenced by their submission of sales and inventory reports.
Annex 9 78
Indicator 1b: Number of farms producing ≥5000 kg/ha/yr: Target: 20 Actual: 27
Farmers who follow the FISH project’s production recommendations are obtaining 12,000 to 20,000 kg/ha/yr for catfish produc-tion and 5,000 to 9,000 kg/ha/yr for tilapia production. However, the profit margin is of greater importance as profit is more likely to result in continued performance.
Indicator 1c: Increase in total water surface area used for commercial fish farming: Target: 60 ha (changed from 20 in earlier
PMP) Actual: 84.5: 38.7 ha of increased pond
surface and an equivalent of 45.9 ha of natu-
ral waters used for cages.
The increase in total water surface area was mainly due to cages being placed in Lake Victoria. Every 5 cubic meters of cage volume is estimated to require 1 ha of water, based upon maximum allow-able feed for best management practices of cage culture. The project was NOT encouraging the construction of new ponds because there is a lack of qualified advisors in pond construction and plan-ning. However, there is a considerable increase in pond renovation activity. The increases have come from existing farms that were previously subsistence and who have “gone commercial”, plus some new construction, especially at SON farm near Jinja where the farm continues to slowly expand. The 58 “reporting farms” consti-tute a total of 65.3 ha of pond surface area. Of 58 “reporting farms”, only 8 have more than 1 hectare of water area. None have more than 5 ha water area. 30 hectares is the minimum water area normally thought of as large or “commercial” farms.
Intermediate Result 7.2.2: Access by Producers to Improved Produc-tion Technologies and Practices Increased
Project Intermediate Result 1.1: Im-proved cage and pond aquacul-ture technologies demonstrated.
Indicator 1.1a: Number of tilapia and clar-ias production systems demonstrated: Target 6 Actual: 7
The following production systems have been demonstrated and provided results that are used to generate management recommendations:1. Pond production of clarias using formu-
lated feed: at Uganda Fish Packers, Samarieza Farm, and Naluvule Farm provided the initial data for the en-terprise budgets and catfish manual. Other farms are doing various trials; in total 11 farms.
2. Pond production of tilapia using formulat-
ed feeds: In total 7 farms contributed data to develop the tilapia grow-out recommendations. Beginning in 2006 they were: Uganda Fish Packers, Namuyenje Fish Farm and Nansana Fish Farm. Nansana Farm dropped out before much data was collected. SoN fish farm, Edron Farm and Lubugumu farm began later in 2007 and have contributed the bulk of the tilapia production data.
3. Tilapia fry/fingerling production using
happas in ponds: SoN fish Farm is pro-ducing all-male tilapia fry; Mpigi fish farm also produces mixed sex fry and does nursery growout of the monosex fry from SoN farm to produce a larger fingerling for sale; all in happas.
77 Annex 9

Indicator 1.3b: Number of farmers receiving advice at FISH office visits at Kajjansi or Jinja: Target: 250 Actual: 310
The target was initially high for the first year (150) and then decreased as the demonstrations took over this obligation. These were often new or prospective farm-ers and there will be one or two training days dedicated to this client group. The visits to the booth for the Jinja agriculture show in 2006 were counted as office visits during the first year if the farmers actually received advice and handouts from the FISH Service. Documented visits to the FISH office in Kajjansi by farmers aver-aged about 50 per year. These visits often took well over two hours and were often followed by “tag-along” training sessions described in the training section.
Visits to the FISH office by demonstra-tion farmers were not recorded as they were often frequent. In the third year, the information given by FISH staff to dem-onstration farmers was often less than the information given from the demonstration farmers to the FISH staff.
Intermediate Result 7.3.3: Market Access Increased
Project Intermediate Result 2: Im-proved marketing of farmed fish
TargetsIndicator 2.a: was deleted because it was not useful. The original intention was to track fish farmers’ confidence in the vari-ous markets for their product. However, due to lack of farmed fish, it became clear that farmer confidence in markets was a minor constraint and that the project should put its efforts into helping farmers
produce something before the marketing effort took off.
The fish farm sales reports track the buy-ers of the farm-raised fish. For example, in FY 2007, the majority of catfish were sold to middlemen. In FY 2008, catfish sales were split between processors and retail. Tilapia sales were split between retail, middlemen and processors. The trend is going towards direct retailing where profit margins are highest.
Project Intermediate Result 2.1: Improved linkages with processors
Indicator 2.1a Increase in amount of farmed fish used by commercial processors: Target: 70 tons Actual: 30.4 tons
The data were obtained from sales reports. Total fish production remained low and erratic due to the small size of farms and, consequently, low production. Processors typically give lower price than direct retail would give; so, farmers were advised to sell whatever they could retail. This indicator was originally made to track any “excess production” beyond local consumption.
A better indicator would be the number of processors that have sourced farm-raised fish. Four processors out of the 11 remain-ing in business have sourced fish from farms assisted by FISH. Note that the processors in Uganda rely almost exclu-sively on Nile perch for their export mar-kets and Nile perch is not a good aquacul-ture candidate. Many of the processors do work with tilapia for local, regional and some regional markets. However, Uganda is not approved for export of farm-raised fish products to the EU.
Annex 9 80
Project Intermediate Result 1.2: Increased quality and quantity of inputs especially feed and fish seed
FeedsIndicator 1.2.a: Annual production of feed meeting quality standards: Revision of PMP target: Annual produc-tion of quality feedDisaggregated by feed type: Sinking pellets: Target: 200 tons: Actual: 260 tons
Floating pellets: test pellets only (less than
1 ton) Actual: 700 kg.
Powdered starter diets: no target was set. About 1.2 tons of starter diet was produced by SoN fish farm; mostly for its own use but small amounts were sold. Balton Uganda imported a total of 18 tons of larval diet, which has greatly improved access to quality feeds for the smaller and new catfish hatcheries.
SeedIndicator 1.2.b: Number of hatcheries producing fingerlings meeting quality standards: Target: 20 Actual: 19 There are 12 tilapia producers and 14 catfish producers who reported sales. But some of the hatcheries produce both tilapia and catfish. Total is 19 different hatcheries.
Indicator 1.2.c: Number of standard-meet-ing fingerlings produced: Target: 2 million
over the project life. This number would include baitfish. Actual: 3.77million; 1 million was tilapia and
2.77million catfish sales were documented.
The numbers reported are “sales” as op-posed to production. Any production for on-farm use would not be included in the totals. However, if one farm sells a “fry” to another who in turn grows it on to a fin-gerling for sale, each product is included, as they both generate income.
Intermediate Result 7.4.2: Agricultural Training becomes more demand driven and private-sector oriented
Project Intermediate Result 1.3: Strengthened aquaculture advisory services
Targets: Indicator 1.3a: Number of aquaculture practitioners trained in improved produc-tion technologies: Target: 100 this number represents new at-tendees. Actual: 1,200 different individuals for
a total of 4,970 trainee-days.
In 2006, the total number of different indi-viduals attending training was 400. The total was 562 in 2007 and >1,200 in all three years combined. Every registration sheet is transcribed into the FISH ser-vice’s training database. Sorting is done by phone number and name and dupli-cates are deleted. The database can also be used to determine the number and type of trainings each person attended. Many people write their names in differently, so phone number is also used to verify if a person is the same individual. When in doubt, a name is counted as double.
Initially, it was assumed that the “aquaculture practitioners” would be advisors or Fisheries Officers and the total number of individu-als would be low. Although some of these attended trainings, most of the trainees were farmers and students who later became advi-sors. However, USAID has requested total trainee-days, disaggregated by gender in its OP and IEHA reporting formats so trainee-days are listed in the indicator sheet.
79 Annex 9
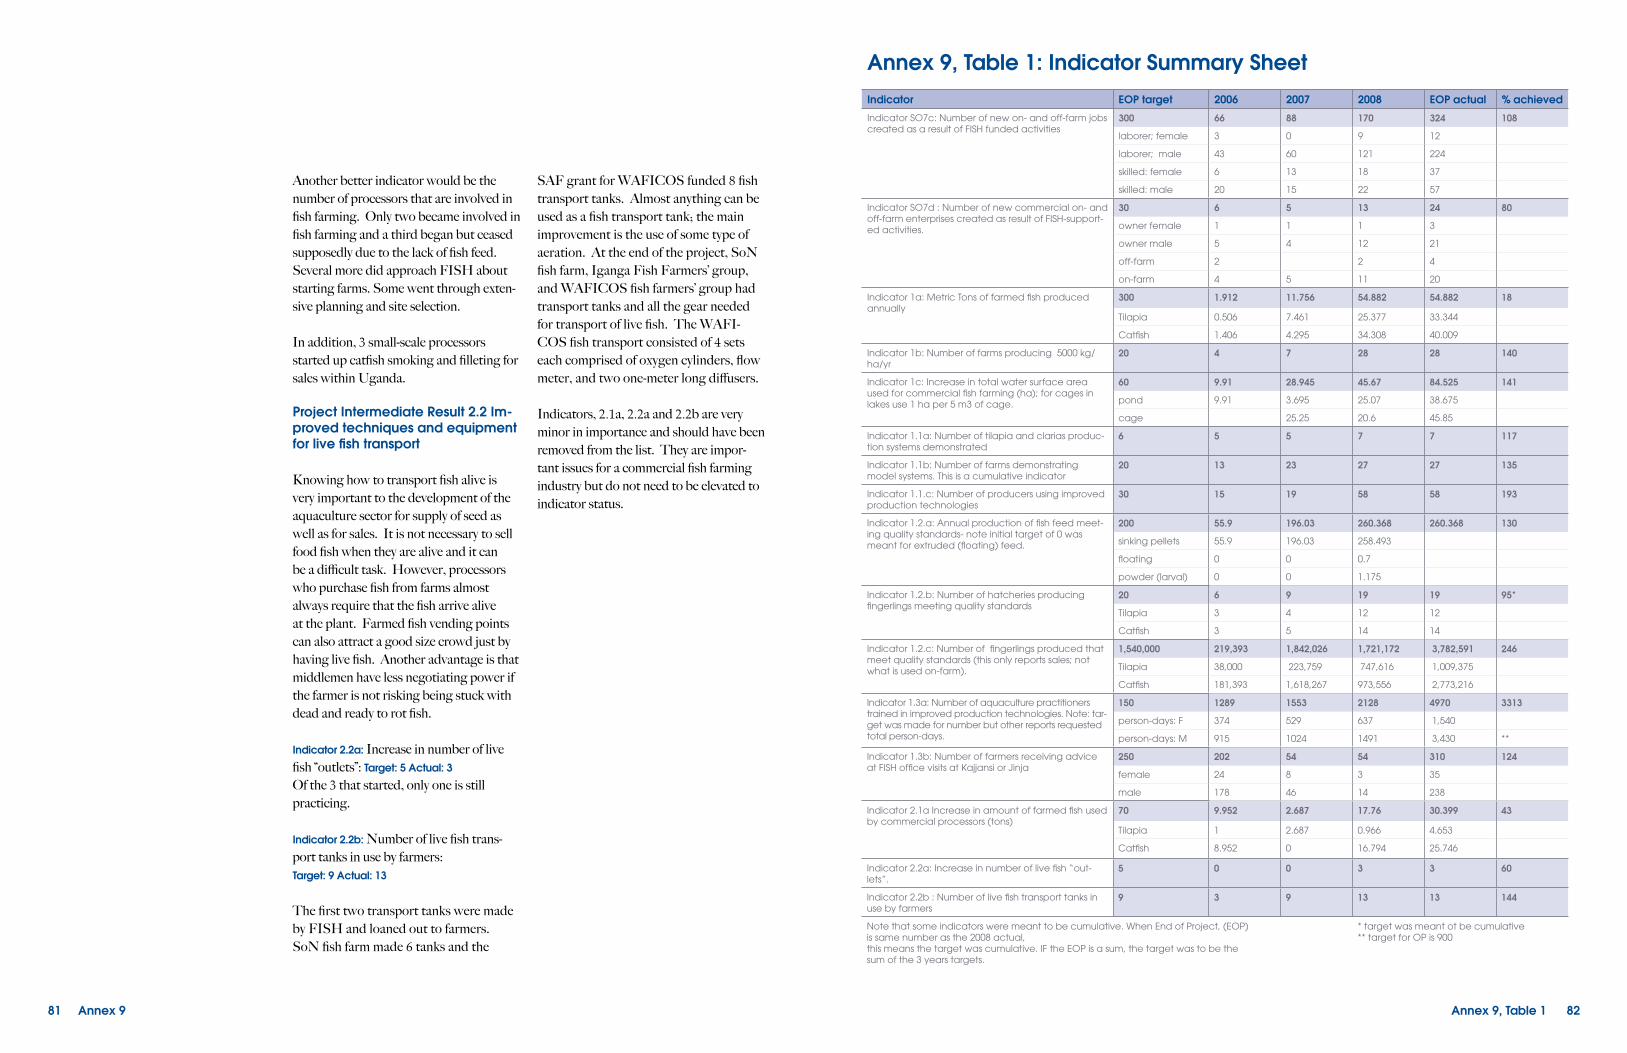
Annex 9, Table 1: Indicator Summary Sheet Indicator EOP target 2006 2007 2008 EOP actual % achieved
Indicator SO7c: Number of new on- and off-farm jobs created as a result of FISH funded activities
300 66 88 170 324 108
laborer; female 3 0 9 12
laborer; male 43 60 121 224
skilled: female 6 13 18 37
skilled: male 20 15 22 57
Indicator SO7d : Number of new commercial on- and off-farm enterprises created as result of FISH-support-ed activities.
30 6 5 13 24 80
owner female 1 1 1 3
owner male 5 4 12 21
off-farm 2 2 4
on-farm 4 5 11 20
Indicator 1a: Metric Tons of farmed fish produced annually
300 1.912 11.756 54.882 54.882 18
Tilapia 0.506 7.461 25.377 33.344
Catfish 1.406 4.295 34.308 40.009
Indicator 1b: Number of farms producing 5000 kg/ha/yr
20 4 7 28 28 140
Indicator 1c: Increase in total water surface area used for commercial fish farming (ha); for cages in lakes use 1 ha per 5 m3 of cage.
60 9.91 28.945 45.67 84.525 141
pond 9.91 3.695 25.07 38.675
cage 25.25 20.6 45.85
Indicator 1.1a: Number of tilapia and clarias produc-tion systems demonstrated
6 5 5 7 7 117
Indicator 1.1b: Number of farms demonstrating model systems. This is a cumulative indicator
20 13 23 27 27 135
Indicator 1.1.c: Number of producers using improved production technologies
30 15 19 58 58 193
Indicator 1.2.a: Annual production of fish feed meet-ing quality standards- note initial target of 0 was meant for extruded (floating) feed.
200 55.9 196.03 260.368 260.368 130
sinking pellets 55.9 196.03 258.493
floating 0 0 0.7
powder (larval) 0 0 1.175
Indicator 1.2.b: Number of hatcheries producing fingerlings meeting quality standards
20 6 9 19 19 95*
Tilapia 3 4 12 12
Catfish 3 5 14 14
Indicator 1.2.c: Number of fingerlings produced that meet quality standards (this only reports sales; not what is used on-farm).
1,540,000 219,393 1,842,026 1,721,172 3,782,591 246
Tilapia 38,000 223,759 747,616 1,009,375
Catfish 181,393 1,618,267 973,556 2,773,216
Indicator 1.3a: Number of aquaculture practitioners trained in improved production technologies. Note: tar-get was made for number but other reports requested total person-days.
150 1289 1553 2128 4970 3313
person-days: F 374 529 637 1,540
person-days: M 915 1024 1491 3,430 **
Indicator 1.3b: Number of farmers receiving advice at FISH office visits at Kajjansi or Jinja
250 202 54 54 310 124
female 24 8 3 35
male 178 46 14 238
Indicator 2.1a Increase in amount of farmed fish used by commercial processors (tons)
70 9.952 2.687 17.76 30.399 43
Tilapia 1 2.687 0.966 4.653
Catfish 8.952 0 16.794 25.746
Indicator 2.2a: Increase in number of live fish “out-lets”.
5 0 0 3 3 60
Indicator 2.2b : Number of live fish transport tanks in use by farmers
9 3 9 13 13 144
Note that some indicators were meant to be cumulative. When End of Project, (EOP)is same number as the 2008 actual,this means the target was cumulative. IF the EOP is a sum, the target was to be thesum of the 3 years targets.
* target was meant ot be cumulative** target for OP is 900
Annex 9, Table 1 82
Another better indicator would be the number of processors that are involved in fish farming. Only two became involved in fish farming and a third began but ceased supposedly due to the lack of fish feed. Several more did approach FISH about starting farms. Some went through exten-sive planning and site selection.
In addition, 3 small-scale processors started up catfish smoking and filleting for sales within Uganda.
Project Intermediate Result 2.2 Im-proved techniques and equipment for live fish transport
Knowing how to transport fish alive is very important to the development of the aquaculture sector for supply of seed as well as for sales. It is not necessary to sell food fish when they are alive and it can be a difficult task. However, processors who purchase fish from farms almost always require that the fish arrive alive at the plant. Farmed fish vending points can also attract a good size crowd just by having live fish. Another advantage is that middlemen have less negotiating power if the farmer is not risking being stuck with dead and ready to rot fish.
Indicator 2.2a: Increase in number of live fish “outlets”: Target: 5 Actual: 3
Of the 3 that started, only one is still practicing.
Indicator 2.2b: Number of live fish trans-port tanks in use by farmers:Target: 9 Actual: 13
The first two transport tanks were made by FISH and loaned out to farmers. SoN fish farm made 6 tanks and the
SAF grant for WAFICOS funded 8 fish transport tanks. Almost anything can be used as a fish transport tank; the main improvement is the use of some type of aeration. At the end of the project, SoN fish farm, Iganga Fish Farmers’ group, and WAFICOS fish farmers’ group had transport tanks and all the gear needed for transport of live fish. The WAFI-COS fish transport consisted of 4 sets each comprised of oxygen cylinders, flow meter, and two one-meter long diffusers.
Indicators, 2.1a, 2.2a and 2.2b are very minor in importance and should have been removed from the list. They are impor-tant issues for a commercial fish farming industry but do not need to be elevated to indicator status.
81 Annex 9