Fish in the Pak Panang Bay and River in Relation to the ...
12
Kasetsart J. (Nat. Sci.) 43 : 120 - 131 (2009) Fish in the Pak Panang Bay and River in Relation to the Anti-Salt Dam Operation, Part I: Assemblage Patterns of the Marine and Brackish Water Fish Tuantong Jutagate 1 *, Amonsak Sawusdee 2 , Thanitha Thapanand Chaidee 3 , Sutheera Thongkhoa 2 and Piyapong Chotipuntu 4 ABSTRACT Spatio-temporal patterns of marine and brackish water fish assemblages gradated from the upstream of the anti-salt dam “Uthokawiphatprasid” dam to the Pak Panang Bay, southern of Thailand. The samples were collected between March 2006 to June 2007at six sampling sites (three sites each from above and below the dam). A total of 70 fish species belonging to 68 genera and 44 families were sampled. To analyze patterns of fish assemblages, an artificial neural network (ANN) in the form of a self-organizing map (SOM) was applied. The sample-combinations (sluice gate regime (opening or closing), sampling stations and months of sampling) were classified into four clusters related to the spatial location and sluice gate regimes. Six assemblage patterns were further explained by the probability of occurrences and ranges of salinity levels. The largest group was opportunistic marine fish (21 species) followed by true brackish water fish (17 species). Others comprised of steno- and eury-haline fish as well as the anadromy. The likely impacts of each guild due to the dam regulations and further studies for conserving these fish were also discussed. Key words: estuary, clustering, artificial neural network, self-organizing map, fish guild 1 Faculty of Agriculture, Ubon Ratchathnai University, Warin Chamrab, Ubon Ratchathani 34190, Thailand. 2 School of Engineering and Resources, Walailak University, Tha Sala, Nakhon Si Thammarat 80160, Thailand. 3 Faculty of Fisheries, Kasetsart University, Bangkok 10900, Thailand. 4 School of Agricultural Technology, Walailak University, Tha Sala, Nakhon Si Thammarat 80160, Thailand. * Corresponding author, e-mail: [email protected] INTRODUCTION More than 70% of river systems in tropical areas are regulated (Revenga and Kura, 2003). Water management and infrastructure development are the main driving forces on the modification of rivers worldwide (Welcomme et al., 2006). The inevitable consequent impacts on the “goods and services” of the river from such modifications, especially to fish, are experienced and reported elsewhere and the most serious cases have occurred when the morphology, hydrology and functioning of a river were changed by damming the mainstream per se (Marmulla, 2001). Along the river course, the greatest species richness is situated at the interface between the freshwater and marine domains, in the hypopotamon zone (Blaber, 2002), which is comprised of marine-, freshwater- and estuarine- origin fish species. Therefore, once the lower course of the river is fragmented, not only the fish from a single origin will be affected, but from all
Transcript of Fish in the Pak Panang Bay and River in Relation to the ...
Kasetsart J. (Nat. Sci.) 43 : 120 - 131 (2009)
Fish in the Pak Panang Bay and River in Relation to the Anti-SaltDam Operation, Part I: Assemblage Patterns of the Marine
and Brackish Water Fish
Tuantong Jutagate1*, Amonsak Sawusdee2, Thanitha Thapanand Chaidee3,Sutheera Thongkhoa2 and Piyapong Chotipuntu4
ABSTRACT
Spatio-temporal patterns of marine and brackish water fish assemblages gradated from the
upstream of the anti-salt dam “Uthokawiphatprasid” dam to the Pak Panang Bay, southern of Thailand.
The samples were collected between March 2006 to June 2007at six sampling sites (three sites each
from above and below the dam). A total of 70 fish species belonging to 68 genera and 44 families were
sampled. To analyze patterns of fish assemblages, an artificial neural network (ANN) in the form of a
self-organizing map (SOM) was applied. The sample-combinations (sluice gate regime (opening or
closing), sampling stations and months of sampling) were classified into four clusters related to the
spatial location and sluice gate regimes. Six assemblage patterns were further explained by the probability
of occurrences and ranges of salinity levels. The largest group was opportunistic marine fish (21 species)
followed by true brackish water fish (17 species). Others comprised of steno- and eury-haline fish as
well as the anadromy. The likely impacts of each guild due to the dam regulations and further studies for
conserving these fish were also discussed.
Key words: estuary, clustering, artificial neural network, self-organizing map, fish guild
1 Faculty of Agriculture, Ubon Ratchathnai University, Warin Chamrab, Ubon Ratchathani 34190, Thailand.2 School of Engineering and Resources, Walailak University, Tha Sala, Nakhon Si Thammarat 80160, Thailand.3 Faculty of Fisheries, Kasetsart University, Bangkok 10900, Thailand.4 School of Agricultural Technology, Walailak University, Tha Sala, Nakhon Si Thammarat 80160, Thailand.
* Corresponding author, e-mail: [email protected]
INTRODUCTION
More than 70% of river systems in
tropical areas are regulated (Revenga and Kura,
2003). Water management and infrastructure
development are the main driving forces on the
modification of rivers worldwide (Welcomme et
al., 2006). The inevitable consequent impacts on
the “goods and services” of the river from such
modifications, especially to fish, are experienced
and reported elsewhere and the most serious cases
have occurred when the morphology, hydrology
and functioning of a river were changed by
damming the mainstream per se (Marmulla, 2001).
Along the river course, the greatest species
richness is situated at the interface between the
freshwater and marine domains, in the
hypopotamon zone (Blaber, 2002), which is
comprised of marine-, freshwater- and estuarine-
origin fish species. Therefore, once the lower
course of the river is fragmented, not only the fish
from a single origin will be affected, but from all

of the three categories. Among these fish, the
diadromous and amphidromous species are the
groups that should be taken care of, since they need
to migrate up and down between the estuarine and
river portions to complete their life cycles.
The Pak Panang River Basin (Figure 1)
is a fertile basin on the southern east coast of
Thailand. The Pak Panang River runs to the sea at
Pak Panang Bay in the Gulf of Thailand. In the
past couple of decades, an increase in urbanization,
deforestation and the needs of household
consumption and agricultural activities
incorporated with the characteristic of the low
gradient of the lower course of the river have
resulted in the longer periods of intrusion of
seawater for greater lengths of water into the Pak
Panang River, from about 50 to 100 km and from
3 to 9 months (Coastal Resources Institute, 1991).
In addition, the water in the downstream area of
the river is slightly acidic, because of peat areas
along the river banks (Prabnarong and Kaewrat,
2006). Therefore, in 1995, the plan to construct
the Uthokawiphatprasid (meaning “effectively
divide fresh- and marine- waters”) Watergate was
developed and operations commenced in 1999.
The water gates per se are located 6 km upstream
of the delta (Figure 1), with a size of 9 × 20 m2.
There are 10 sluice gates, whose major purposes
are to prevent intrusion of the saline water into
the inner area along the river and to maintain a
freshwater supply for irrigation (Prabnarong and
Kaewrat, 2006). After construction, sluice gate
operation has been irregular, depending on the
water level upstream. Consequently, the possibility
of marine and brackish water species moving
upstream from the lower river portion varied
according to their tolerance to changes in
environmental factors, especially salinity. This
paper, therefore, presents the guild classification
of the marine and brackish water fish in the Pak
Panang area using self- organizing maps according
to their assemblages from the bay area to the upper
area of the river and discussion of the likely effects
on each guild due to the Uthokawiphatprasid
watergate management.
MATERIALS AND METHODS
Sampling stations and sampling protocolsSix sampling stations were selected with
three stations in each component (the estuarine and
the river) (Figure 1). The stations were mapped
using a Garmin-GPSmap 76CSx. Sampling was
conducted monthly during the spring-tide period.
Fish sampling, in the estuarine/marine component,
was conducted using push net dragging in the
sampling area for around 30 min. Meanwhile, a
beach net was used as well as various mesh sizes
of gillnets to cover the water column, being left
overnight before harvest for the freshwater
stations. Fish samples were packed in ice and
brought to Walailak University 50 km from the
watergates. Fish were then taxonomically
classified to the species level, or as far as possible
(Nelson, 1976; Froese and Pauly, 2007). All the
fish were weighed and the number in each species
counted. Salinity at the sampling stations was
obtained from a portable YSI 63-50FT. Field
sampling was conducted from March 2006 to June
2007.
Data processingThe self-organizing map (SOM) of
Kohonen (Kohonen, 1982) belongs to the artificial
neural network (ANN) class of techniques and is
one of the best-known neural networks with
unsupervised learning rules (Penczak et al., 2004).
This method has been increasingly used by
ecologists and successful results in aquatic ecology
using this model have been well documented (Lek
et al., 2005). The detail of the sequential SOM
algorithm process can be retrieved from Kohonen
(1995) and Lek and Guégan (1999). In this study,
a species abundance dataset was arranged as a
matrix of 96 rows (6 sites sampled for 16 months)
and 70 columns (fish species, consisting of 44
Kasetsart J. (Nat. Sci.) 43(5) 121

122 Kasetsart J. (Nat. Sci.) 43(5)
brackish water species and 26 marine species as
shown in Table 1). Each of the 96 samples of the
dataset can be considered as a vector of 70
dimensions and the samples were presented in the
form of a combination among sluice gate regimes
(opening or closing: Table 2), sampling stations
and months of sampling (e.g. O3Jan07 or
C4Sep07). Species abundance was used in the
study, since the sampling was carried out using
various types of fishing gear and tried to cover all
fish species, which avoided the bias of species
abundance in calculations that could occur by
using a single type of gear (Hugueny et al., 1996).
Then, the species data set was patterned by training
the SOM.
The architecture of the SOM consisted
of two layers of neurons (or nodes): i) the input
layer that was composed of 70 neurons connected
to each vector of the dataset and ii) the two-
dimensional output layer composed of 56 neurons
(a rectangular grid with 8 by 7 neurons laid out
on a hexagonal lattice). The 56-neuron grid was
chosen because this configuration presented
minimum values of both quantization (final
quantization error = 0.008) and topographic errors
(final topographic error = 0.010), which are used
to assess classification quality (Park et al., 2003).
In the learning process, the data were subjected to
the learning network. Then, the weights were
trained for a given dataset of the assemblage data
matrix and the SOM weights were modified to
minimize the distance between the weight and
input vectors (Gevrey et al., 2004). When an input
vector x (densities of species) is sent through the
network, each neuron k of the output layer
computes the summed distance between the weight
vector w and the input vector x (Park et al., 2005).
In this study, the analysis was carried out using
the MATLAB software version 7 with the ANN-
SOM routine developed by S. Lek (Universite′Paul Sabatier (Toulouse III), France. The Kruskal-
Wallis Chi-squared test and Mann-Whitney test
were used to analyze the statistical differences in
each studied parameter. Calculations and graphics
were conducted using Program R (R Development
Core Team, 2008)
Figure 1 Location of study area and map of sampling stations.

Kasetsart J. (Nat. Sci.) 43(5) 123Ta
ble
1Sp
ecie
s co
mpo
sitio
n, o
ccur
renc
e (�
= p
rese
nce
and
o =
abs
ence
), n
umbe
r and
wei
ght o
f fis
h co
llect
ed in
the
Pak
Pana
ng R
iver
Bay
from
Mar
ch
2006
to J
une
2007
. (O
rigi
n: E
S =
est
uari
ne a
nd M
A =
mar
ine)
.Fa
mily
Scie
ntif
ic n
ame
Abb
rev.
Ori
gin
Eco
nom
icO
ccur
renc
eN
umbe
rW
eigh
t of
indi
vidu
alim
port
ance
III
III
IVV
VI
± sd
(g)
Am
bass
idae
Am
bass
is g
ymno
ceph
alus
AM
GE
SN
��
��
�o
1194
82.
51±
0.57
Par
amba
ssis
sia
men
sis
PASi
ES
No
��
oo
o12
50.
96±
0.63
Apl
oact
inid
aeA
cant
hosp
hex
leur
ynni
sA
CL
ES
No
o�
oo
o10
1.80
±1.
62A
riid
aeA
rius
cae
latu
sA
RC
ES
Y�
�o
oo
o56
79.3
9±
11.1
9H
emip
imel
odus
bic
olor
HE
BE
SY
�o
��
oo
1277
.83±
6.27
Ost
eoge
neio
sus
mil
itar
isO
SME
SY
��
��
�o
7153
.87±
8.04
Ath
erin
idae
Ath
erin
omor
us d
uode
cim
alis
AT
DE
SN
�o
oo
oo
64.
78±
1.13
Hyp
oath
erin
a va
lenc
ienn
esi
HY
VM
AN
��
�o
oo
2366
1.84
±0.
39B
agri
dae
Mys
tus
guli
oM
YG
ES
Y�
��
��
o30
363
.21±
25.6
8B
elon
idae
Tylo
suru
s cr
ocod
ylus
TY
CE
SN
��
�o
oo
7063
.50±
31.1
1B
regm
acer
otid
aeB
regm
acer
os m
ccle
land
iB
RM
MA
Yo
�o
oo
o10
9.42
±0.
66C
aran
gida
eC
aran
goid
es p
raeu
stus
CA
PM
AY
��
�o
oo
6633
.41±
23.2
1P
aras
trom
ateu
s ni
ger
PAN
MA
Y�
�o
oo
o8
82.4
9±
15.0
3C
lupe
idae
Ano
dont
osto
ma
chac
unda
AN
CE
SY
��
��
oo
2662
55.2
4±
35.0
3C
oili
a m
acro
gnat
hus
CO
MM
AN
��
�o
oo
738
7.09
±1.
67E
scua
losa
thor
acat
aE
NT
ES
Y�
��
oo
o15
704
1.66
±0.
78H
ilsa
kel
eeH
IKE
SY
��
��
oo
3247
48.7
4±
11.2
8Sa
rdin
ella
gib
bosa
SAG
MA
Y�
��
oo
o40
235
.99±
6.57
Cyn
oglo
ssid
aeC
ynog
loss
us a
rel
CY
Ar
ES
Y�
��
oo
o10
659.
58±
2.47
Das
yatid
aeH
iman
tura
imbr
icat
aH
IIE
SY
o�
�o
oo
525
6.31
±28
.25
Ele
otri
dae
But
is b
utis
BU
BE
SN
��
�o
oo
481
3.19
±0.
93E
ngra
ulid
aeE
ncra
sich
olin
a de
visi
EN
DM
AY
��
��
oo
1948
80.
97±
0.57
Enc
rasi
chol
ina
hete
rolo
baE
NH
MA
N�
��
oo
o18
721.
79±
0.31
Stol
epho
rus
dubi
osus
STD
ES
Y�
��
�o
o25
473.
82±
1.17
Thr
yssa
ham
ilto
nii
TH
HE
SN
��
�o
oo
833
0.97
±0.
34G
erre
idae
Ger
res
abbr
evia
tus
GE
AE
SY
��
��
oo
5613
.11±
4.65
Gob
iidae
Ace
ntro
gobi
us c
anin
usA
CC
ES
Y�
o�
oo
o10
6.53
±3.
71A
ulop
arei
a ch
loro
stig
mat
oide
sA
UC
ES
Yo
o�
oo
o3
10.3
3±
3.95
Glo
ssog
obiu
s gi
uris
GL
GE
SN
��
�o
oo
1582
3.02
±1.
24P
apil
logo
bius
rei
chei
PAR
ES
N�
��
�o
o27
92.
50±
1.62
Par
apoc
rypt
es s
erpe
rast
erPA
SeE
SY
��
�o
oo
147
9.75
±3.
22P
seud
apoc
rypt
es l
ance
olat
usPS
LM
AN
��
�o
oo
503
5.46
±1.
65Ta
enio
ides
cir
ratu
sTA
CE
SY
�o
�o
oo
25.
75±
2.03
Tryp
auch
en v
agin
aT
RV
ES
Y�
��
oo
o11
439.
81±
3.25
Hae
mul
idae
Pom
adas
ys k
aaka
nPO
KE
SY
oo
��
�o
51,
461.
68±
125.
76

124 Kasetsart J. (Nat. Sci.) 43(5)
Hem
irha
mph
idae
Hyp
orha
mph
us d
ussu
mie
riH
YD
MA
Y�
��
oo
o39
4.62
±1.
21H
oloc
entr
idae
Sarg
ocen
tron
sp.
SAS
MA
No
�o
oo
o2
0.70
±0.
14L
eiog
nath
idae
Lei
ogna
thus
spp
.L
EB
ES
N�
��
��
o15
241
1.35
±0.
79Se
cute
r in
sidi
ator
SEI
MA
N�
��
oo
o20
706
0.64
±0.
12L
utja
nida
eL
utja
nus
russ
elli
LU
RM
AY
��
�o
oo
574
.64±
15.2
3M
egal
opid
aeM
egal
ops
cypr
inoi
des
ME
CE
SY
oo
��
�o
429
6.78
±65
.32
Mug
ilida
eL
iza
olig
olep
isL
IOE
SY
��
�o
oo
181
10.9
9±
5.24
Liz
a su
bvir
idis
LIS
ES
Y�
��
oo
o13
5019
.96±
10.0
4Va
lam
ugil
cun
nesi
usV
AC
MA
Yo
��
oo
o3
46.3
7±
19.0
2M
urae
neso
cida
eM
urae
neso
x ci
nere
usM
UC
MA
Y�
��
oo
o31
61.9
5±
10.0
4O
phic
hthi
dae
Pis
odon
opis
bor
oPI
BE
SY
��
�o
oo
4441
.57±
24.6
3Pl
atyc
epha
lidae
Gra
mm
opli
tes
scar
ber
GR
SM
AN
��
�o
oo
655
2.22
±0.
56Pl
atyc
epha
lidae
Pla
tyce
phal
us in
dicu
sPL
IE
SY
��
�o
oo
922.
46±
0.56
Plot
osid
aeP
loto
sus
cani
usPL
CE
SY
��
�o
oo
4940
.69±
17.7
2Po
lyne
mid
aeE
leut
hero
nem
a te
trad
acty
lum
ELT
MA
Y�
��
oo
o15
85.
99±
1.85
Scat
opha
gida
eSc
atop
hagu
s ar
gus
SCA
ES
Y�
��
�o
o14
8115
.04±
12.0
2Sc
iaen
idae
Pan
na p
erar
mat
usPA
PM
AY
��
�o
oo
5339
1.18
±0.
32Sc
ombr
idae
Ras
trel
lige
r br
achy
som
aR
AB
MA
Y�
�o
oo
o4
45.0
0±
9.14
Scom
bero
mor
us c
omm
erso
nSC
CE
SY
�o
oo
oo
251
.57±
7.29
Scor
paen
idae
Vesp
icul
a tr
achi
noid
esV
ET
ES
N�
��
oo
o25
41.
02±
0.47
Siga
nida
eSi
ganu
s ca
nali
cula
tus
SIC
ES
Y�
��
oo
o64
301.
04±
0.65
Silla
gini
dae
Sill
ago
siha
ma
SIS
MA
Y�
��
oo
o12
46.
34±
2.21
Spar
idae
Aca
ntho
pagr
us b
erda
AC
BM
AY
��
�o
oo
2010
.33±
4.42
Sphy
raen
idae
Sphy
raen
a je
llo
SPJ
MA
Y�
��
oo
o16
71.0
6±
7.01
Stro
mat
eida
eP
ampu
s ar
gent
eus
PAA
MA
Y�
�o
oo
o8
55.1
1±
12.1
2Sy
nbra
nchi
dae
Mac
rotr
ema
cali
gans
MA
CE
SY
��
�o
oo
343.
37±
1.05
Oph
iste
rnon
ben
gale
nse
OPB
ES
Y�
o�
oo
o3
58.4
3±
13.6
7Sy
ngna
thid
aeH
ippi
chth
ys p
enic
illu
sH
IPE
SN
o�
oo
oo
110.
75±
0.24
Tera
poni
dae
The
rapo
n ja
bua
TH
JE
SN
��
�o
oo
3138
.59±
12.4
1Te
trao
dont
idae
Lag
ocep
halu
s sp
adic
eus
LA
SM
AN
��
�o
oo
161.
26±
0.46
Taki
fugu
obl
ongu
sTA
OE
SN
oo
�o
oo
718
.19±
6.75
Tetr
aodo
n ni
grov
irid
isT
EN
ES
N�
��
�o
o14
59.
43±
4.51
Toxo
tidae
Toxo
tes
chat
areu
sT
OC
ES
Yo
oo
��
�10
74.4
7±
20.0
9T
riac
anth
idae
Tria
cant
hus
biac
ulea
tus
TR
BM
AN
o�
�o
oo
64.
96±
1.05
Tri
chiu
rida
eTr
ichi
urus
lept
urus
TR
LM
AY
��
�o
oo
731.
98±
0.65
Tabl
e 1
(Con
t.) S
peci
es c
ompo
sitio
n, o
ccur
renc
e (�
= p
rese
nce
and
o =
abs
ence
), n
umbe
r an
d w
eigh
t of
fish
col
lect
ed in
the
Pak
Pana
ng R
iver
– B
ay
in M
arch
200
6 to
Jun
e 20
07. (
Ori
gin:
ES
= e
stua
rine
and
MA
= m
arin
e).
Fam
ilySc
ient
ific
nam
eA
bbre
v.O
rigi
nE
cono
mic
Occ
urre
nce
Num
ber
Wei
ght o
f in
divi
dual
impo
rtan
ceI
IIII
IIV
VV
I±
sd (
g)

Kasetsart J. (Nat. Sci.) 43(5) 125
Table 2 Operation details of the Uthokvibhajaprasid water gates during the study period.
Month Duration of opening Opening period Discharged volume
(days) (hours) (106 m3)
Mar-06 7 76 22.9
Apr-06 18 177 84.3
May-06 0 0 0
Jun-06 6 117 36
Jul-06 0 0 0
Aug-06 0 0 0
Sep-06 0 0 0
Oct-06 24 217 176.2
Nov-06 26 341 453.2
Dec-06 9 112 104.1
Jan-07 22 208 163.5
Feb-07 0 0 0
Mar-07 0 0 0
Apr-07 0 0 0
May-07 18 217 236.1
Jun-07 0 0 0
RESULTS
The composition of the ichthyofauna
(species, genera, families) collected during this
study is shown (Table 1). A total of 70 fish species
belonging to 68 genera and 44 families were
captured from the various samples. The most
diverse families were brackish water fish species:
Gobiidae (8 species) followed by Clupeidade (5
species) and Engraulidae and Tetraodontidae (4
species each) (Table 1). Among the 70 fish species
collected, 14 species appeared at least with 50%
of occurrence (i.e. found both in the estuarine and
river component) such as Ambassis
gymnocephalus, Osteogeneiosus militaris,
Leiognathus spp., Scatophagus argus and
Encrasicholina devisi. Three species (Aulopareia
chlorostigmatoides, Sargocentron sp. and
Scomberomorus commerson) were caught only
once and they were excluded from the guild
classification.
The hierarchical cluster analysis applied
to the output matrix extracted from the SOM,
classified the sample periods and stations into four
clusters (Figure 2). Cluster I included most of the
combinations of the river area. Three combinations
of the estuarine area, during the opening phase in
the river mouth area (i.e. station 3), were included
in this cluster viz., O3Oct06, O3Nov06 and
O3Jan07. Cluster II was mixed between stations
3 and 4 during the opening scheme. Cluster IVwas exclusively the stations further down to the
sea during the closing phase of the sluice gates.
The remaining combinations of fish assemblages
in the estuarine were in Cluster III. The Kruskal-
Wallis test showed highly significant differences
in species richness between clusters (p < 0.001,
Figure 3). Cluster I displayed the lowest species
richness and was significantly different from the
other clusters (Mann-Whitney test, p < 0.01).
There was no statistical difference in species
richness among the remaining clusters (Mann-
Whitney test, p > 0.05). The outliners in Cluster Iand the wide range of Cluster II indicated the
occurrence of the marine and brackish water fish
in the river component.

126 Kasetsart J. (Nat. Sci.) 43(5)
Figure 2 (a) Self-organizing map with the four colors corresponding to the clusters (b) Hierarchical
clustering of the SOM nodes with the Ward-linkage method (c) Classification of combinations
through the learning process of the self-organizing map.
Figure 3 Boxplot comparing fish species richness (SR) in the four clusters defined by the self-organizing
map.

Kasetsart J. (Nat. Sci.) 43(5) 127
The samples were classified by the SOM
into 56 output nodes according to their species
composition, so that each node included samples
with similar species. In each SOM map, the dark
areas represent a high probability of occurrence
in each neuron, whereas light indicates a low
occurrence (Park et al., 2005). A clear gradient
distribution on the SOM map classified six patterns
of assemblage, shown in Figure 4. It can be seen
that most of the assemblages belonged to Clusters
II to IV. In the estuary, fish guilds were
distinguished by their responses to salinity
(Welcomme et al., 2006). Therefore, according to
the map patterns and range of salinity of the
combinations in each assemblage (Figure 5), the
marine and brackish water fish could be classified
into six assemblages. In Assemblage A, there were
three species that were abundant in the lower saline
area and likely to be stenohaline species, which
could enter the freshwater portion. Assemblage
Ab, with seven species, represented the small-to-
medium fish that preferred low salinity, but
euryhaline. Assemblage B, with 17 species, was
the, so-called, “true brackish water species”, which
were permanent residents of the estuary system
with euryhaline characteristics. Assemblage Bc,
with 6 species, was the brackish water fish, which
preferred higher salinity conditions. Assemblage
C, with 21 species, was the opportunistic marine
fish, which sometimes entered the estuary for
feeding and breeding purposes. Lastly, assemblage
Ca, which should be the most focused group, was
comprised of the marine species showing the
possibility of occasionally entering the freshwater
component. There were 10 species involved in this
assemblage.
Figure 4 Boxplot comparing fish salinity in the six assemblages.

128 Kasetsart J. (Nat. Sci.) 43(5)
DISCUSSION
In this study, the numbers of marine and
brackish water fish species found was lower than
reported by Sirimontraporn et al. (1997) and the
diversity of these fish was less in the river portion
compared with a previous study (Sritakon et al.,
2003). This difference could be related to the
sampling procedure and the types of habitats
investigated (Koné et al., 2003) or the effects of
the watergate regulation per se. The most diverse
of gobies in the delta area was a usual phenomenon
in the tropics, such as the 37 species in the Vietnam
Delta (Vidthayanon, 2008). The occurrence of the
many adult pelagic fishes such as Sphyraena jello
and Rastrelliger brachysoma in the estuarine
component was likely for feeding purposes
(Blaber, 2002; Hajisamae et al., 2003).
Figure 5 Distribution patterns of fish species in each assemblage defined by the hierarchical clustering
applied to the self-organizing map (SOM) units. Dark areas represent high probability of
occurrence; light areas indicate lower probability.
Assemblage Ca: Anodontostoma chacunda, Liza oligolepis, Valamugil cunnesius,
Pomadasys kaakan, Megalop cyprinoids, Arius caelatus, Macrotrema caligans,
Secuter insidiator , Stolephorus dubiosus and Hemipimelodus bicolor
Assemblage C: Pampus argenteus, Eleutheronema tetradactylum, Bregmaceros
mcclellandi, Parastomateus niger, Sardinella gibbosa, Muraenesox cinereus,
Hypoatherina valenciennei, Trichiurus lepturus, Sphyraena jello, Rastrelliger
brachysoma, Terapon jarbua, Acanthopagrus berda, Encrasicholina devisi, Panna
perarmatus, Pseudapocryple larceolotus, Triacanthus biaculeatus, Hyporhamphus
dussumieri, Carangoides praeustus, Lagocephalus spadiceus, Grammoplites
scarber and Papilogobius reichei
Assemblage Bc: Scatophagus argus, Escualosa thoracata, Coilia macrognathus,Plotosus canius, Himantura imbricata and Tylosurus crocodilus
Assemblage B: Hilsa kelee, Gerres abbreviatus, Ambassis gymnocephalus,Encrasicholina devisi, Cynoglossus arel, Glossogobius guiaris, Leiognathus spp., Mystus gulio, Liza subviridis, Lutjanus russelli, Sillago sihama, Gerres abbreviatus,Osteogeneiosus militaris, Pisodonophis boro, Atherinomorus duodecimalis,Taenioides cirratus, Ophisternon bengalensa, Hippichthys penicilus, and Thryssa
hamiltonii
Assemblage Ab: Vespicula trachinoides, Trypauchen vagina, Tetraodon nigroviridis,Takifugu oblongus, Butis butis, Platycephalus indicus, Parambassis siamensis andSiganus canaliculatus
Assemblage A: Acentrogobius caninus, Acanthosphex leurynnis and Parapocryptes
serperaster
Kasetsart J. (Nat. Sci.) 43(5) 129
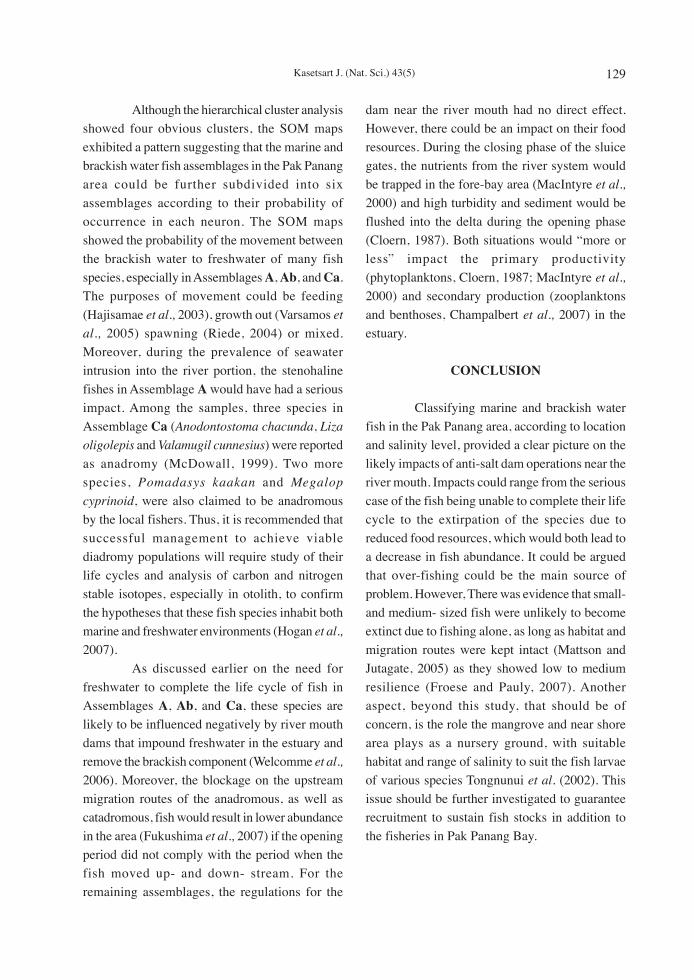
Although the hierarchical cluster analysis
showed four obvious clusters, the SOM maps
exhibited a pattern suggesting that the marine and
brackish water fish assemblages in the Pak Panang
area could be further subdivided into six
assemblages according to their probability of
occurrence in each neuron. The SOM maps
showed the probability of the movement between
the brackish water to freshwater of many fish
species, especially in Assemblages A, Ab, and Ca.
The purposes of movement could be feeding
(Hajisamae et al., 2003), growth out (Varsamos et
al., 2005) spawning (Riede, 2004) or mixed.
Moreover, during the prevalence of seawater
intrusion into the river portion, the stenohaline
fishes in Assemblage A would have had a serious
impact. Among the samples, three species in
Assemblage Ca (Anodontostoma chacunda, Liza
oligolepis and Valamugil cunnesius) were reported
as anadromy (McDowall, 1999). Two more
species, Pomadasys kaakan and Megalop
cyprinoid, were also claimed to be anadromous
by the local fishers. Thus, it is recommended that
successful management to achieve viable
diadromy populations will require study of their
life cycles and analysis of carbon and nitrogen
stable isotopes, especially in otolith, to confirm
the hypotheses that these fish species inhabit both
marine and freshwater environments (Hogan et al.,
2007).
As discussed earlier on the need for
freshwater to complete the life cycle of fish in
Assemblages A, Ab, and Ca, these species are
likely to be influenced negatively by river mouth
dams that impound freshwater in the estuary and
remove the brackish component (Welcomme et al.,
2006). Moreover, the blockage on the upstream
migration routes of the anadromous, as well as
catadromous, fish would result in lower abundance
in the area (Fukushima et al., 2007) if the opening
period did not comply with the period when the
fish moved up- and down- stream. For the
remaining assemblages, the regulations for the
dam near the river mouth had no direct effect.
However, there could be an impact on their food
resources. During the closing phase of the sluice
gates, the nutrients from the river system would
be trapped in the fore-bay area (MacIntyre et al.,
2000) and high turbidity and sediment would be
flushed into the delta during the opening phase
(Cloern, 1987). Both situations would “more or
less” impact the primary productivity
(phytoplanktons, Cloern, 1987; MacIntyre et al.,
2000) and secondary production (zooplanktons
and benthoses, Champalbert et al., 2007) in the
estuary.
CONCLUSION
Classifying marine and brackish water
fish in the Pak Panang area, according to location
and salinity level, provided a clear picture on the
likely impacts of anti-salt dam operations near the
river mouth. Impacts could range from the serious
case of the fish being unable to complete their life
cycle to the extirpation of the species due to
reduced food resources, which would both lead to
a decrease in fish abundance. It could be argued
that over-fishing could be the main source of
problem. However, There was evidence that small-
and medium- sized fish were unlikely to become
extinct due to fishing alone, as long as habitat and
migration routes were kept intact (Mattson and
Jutagate, 2005) as they showed low to medium
resilience (Froese and Pauly, 2007). Another
aspect, beyond this study, that should be of
concern, is the role the mangrove and near shore
area plays as a nursery ground, with suitable
habitat and range of salinity to suit the fish larvae
of various species Tongnunui et al. (2002). This
issue should be further investigated to guarantee
recruitment to sustain fish stocks in addition to
the fisheries in Pak Panang Bay.

130 Kasetsart J. (Nat. Sci.) 43(5)
ACKNOWLEDGEMENT
This research article was supported by
the Thailand Research Fund (Grant: TRF RDG
4940011 Community Structure of Fishery
Resources and Salinity Distribution in Pak Panang
River Basin: A Case Study on the Effects of
Uthokvibhajaprasid Operation) for the field data
collection. The analysis was conducted under the
Franco-Thai Academic Collaboration (Grant: PHC
16598RJ Conservation of Freshwater Ecosystems
to Sustain Fish Biodiversity, a Food Resource for
the Near Future, led by Prof. Sovan Lek). The
authors are very grateful for assistance of local
fishers during the field work and also thank Prof.
Saowapa Angsupanich (Prince of Songkla
University), Dr Kan Janphromma (Walailak
University), Dr Padermsak Jaruyabhand
(Chulalongkorn University) and Dr Srilaporn
Buasai (TRF) for their constructive comments to
improve the research work.
LITERATURE CITED
Blaber, S.J.M. 2002. ‘‘Fish in hot waters’’: the
challenges facing fish and fisheries research
in tropical estuaries. Journal of Fish Biology61 (Supplement A): 1-20.
Champalbert, G., M. Pagano, P. Sene and D.
Corbin. 2007. Relationships between meso-
and macro-zooplankton communities and
hydrology in the Senegal River Estuary.
Estuarine Coastal Shelf Sci. 74: 381-394.
Cloern, J.E. 1987. Turbidity as a control on
phytoplankton biomass and productivity in
estuaries. Continental Shelf Research 7:
1367-1381
Coastal Resources Institute. 1991. CoastalManagement in Pak Phanang: HistoricalPerspective of Natural Issues. Hatyai:Coastal Resources Institute, Prince of
Songkla University.
Froese, R. and D. Pauly. 2007. FishBase, WorldWide Web electronic publication. URL
http://www.fishbase.org
Fukushima, M., S. Kameya, M. Kaneko, K. Nakao
and E.A. Steel. 2007. Modelling the effects
of dams on freshwater fish distributions in
Hokkaido, Japan. Freshwater Biology 1-13.
Gevrey, M., F. Rimet, Y.S. Park, J.L.Giraudel, L.
Ector and S. Lek. 2004. Water quality
assessment using diatom assemblages and
advanced modelling techniques. FreshwaterBiology 49: 208-220.
Hajisamae, S., L.M. Chou and S. Ibrahim. 2003.
Feeding habits and trophic organization of the
fish community in shallow waters of an
impacted tropical habitat. Estuarine CoastalShelf Sci. 58: 89-98.
Hogan, Z., I.G. Baird, R. Radtke and M.J. Vander
Zanden. 2007. Long distance migration and
marine habitation in the tropical Asian catfish,
Pangasius krempfi. Journal of Fish Biology71: 818-832
Hugueny, B., S. Camara, B. Samoura and M.
Magassouba. 1996. Applying an index of
biotic integrity based on fish assemblage in
West African river. Hydrobiologia 331: 71-
78.
Kohonen, T. 1982. Self-organized formation of
topologically correct feature maps. Biol.Cybern. 63: 201-208.
Kohonen, T. 1995. Self-Organizing Maps.Springer Series in Information Sciences, 2nd
edition. Springer, Berlin.
Koné, T., G.G. Teugels, V. N’Douba, E.P.
Kouamelan and G. Gooré Bi. 2003. Fish
assemblages in relation to environmental
gradients along a small West African coastal
basin, the San Pedro River, Ivory Coast.
African Journal of Aquatic Science 28: 163-
168.
Lek, S. and J.F. Guégan. 1999. Artificial neural
networks as a tool in ecological modelling,
an introduction. Ecol. Modell. 120: 65-73.

Kasetsart J. (Nat. Sci.) 43(5) 131
Lek, S., M. Scardi, P.F.M. Verdonschot, J.P. Descy
and Y.S. Park. 2005. Modelling CommunityStructure in Freshwater Ecosystems.Springer, Berlin.
MacIntyre, H., T. Kana and R. Geider. 2000. The
effect of water motion on short term rates of
photosynthesis by marine phytoplankton.
Trends in Plant Science 5: 12-17.
Marmulla, G. 2001. Dams, fish and fisheries:
opportunities, challenges and conflict
resolution. FAO Fisheries Technical Paper
419.
Mattson, N.S. and T. Jutagate. 2006. IntegratedBasin Flow Management Specialist ReportIBFM7-10: Fisheries Water UtilizationProgram / Environment Program. Mekong
River Commission, Vientiane, Lao PDR. 65
pp.
McDowall, R.M. 1999. Different kinds of
diadromy: different kinds of conservation
problems. ICES Journal of Marine Science56: 410-413
Nelson, J.S. 1976. Fishes of the World. The
University of Alberta, Edmonton
Park Y.S., R. Cereghino, A. Compin and S. Lek.
2003. Applications of artificial neural
networks for patterning and predicting aquatic
insect species richness in running waters.
Ecol. Model. 160: 265-280.
Park, Y.S., J. Chang, S. Lek, W. Cao and S. Brosse.
2003. Conservation strategies for endemic fish
species threatened by the Three George Dam.
Conserv. Biol. 17: 1748-1758.
Penczak, T., S. Lek, F.Godinho and A.A.
Agostinho. 2004. Patterns of fish assemblages
in tropical streamlets using SOM algorithm
and conventional statistical methods.
Ecohydrology and Hydrobiology 4: 139-
146.
Prabnarong, P. and J. Kaewrat. 2006. The
Uthokawiphatprasit watergate: A man-made
change in Pak Phanang river basin. WalailakJ. Sci. & Tech. 3(2): 131-143.
R Development Core Team. 2008. R: A Languageand Environment for StatisticalComputing. R Foundation for StatisticalComputing, Vienna. URL http://www.R-
project.org
Riede, K. 2004. Global register of migratoryspecies-from global to regional scales.Federal Agency for Nature Conservation,
Bonn.
Revenga, C. and Y. Kura. 2003. Status and trends
of biodiversity of inland water ecosystems.
secretariat of the convention on biological
diversity, Montreal Technical Series 11.
Sritakon, T., C. Ratanachai and A. Assava-Aree.
2003. Species diversity and fishery production
in Pak Panang River on 2002. National
Institute of Coastal Aquaculture, TechnicalPaper 1/2003, Songkla. (In Thai)
Tongnunui, P., K. Ikejima, T. Yamane, M.
Horinouchi, T. Medej, M. Sano, H. Kurokura
and T. Taniuchi. 2002. Fish fauna of the Sikao
creek mangrove estuary, Trang, Thailand.
Fisheries Science 68: 10-17.
Varsamos, S., C. Nebel and G. Charmantier. 2005.
Ontogeny of osmoregulation in
postembryonic fish: A review. Comp.Biochemi. Physiol. 141: 401– 429
Vidthayanon, C. 2008. Field Guide to Fishes ofthe Mekong Delta. Mekong River
Commission, Vientiane.
Welcomme, R.L., K.O. Winemiller and I.G. Cowx.
2006. Fish environmental guilds as a tool for
assessment of ecological condition of rivers.
River Research and Applications 22: 377-
396.