
FISD-06
120
Fundamentals of Yield Curves & The Term Structure of Interest Rates 1
-
Upload
kanchan-sharma -
Category
Documents
-
view
216 -
download
0
Transcript of FISD-06

8/11/2019 FISD-06
http://slidepdf.com/reader/full/fisd-06 1/120
Fundamentals of Yield Curves&
The Term Structure of Interest Rates
1

8/11/2019 FISD-06
http://slidepdf.com/reader/full/fisd-06 2/120
At any point in time an investor will haveaccess to a wide variety of bonds.
These will differ with respect to
Their yields, and Their times to maturity
2

8/11/2019 FISD-06
http://slidepdf.com/reader/full/fisd-06 3/120
Investors and traders will be interested inthe relationship between the time tomaturity, and YTM
for bonds belonging to a given risk class. A plot of yield versus time to maturity is
termed as the
Yield Curve
3

8/11/2019 FISD-06
http://slidepdf.com/reader/full/fisd-06 4/120
The Yield Curve
Is an important indicator of the state of the bondmarket
And provides valuable information
4

8/11/2019 FISD-06
http://slidepdf.com/reader/full/fisd-06 5/120
While constructing the yield curve it isimportant to ensure that The bonds belong to the same risk class
And have a comparable degree of liquidityFor instance We may construct a curve for government
securities
Or for AAA rated corporate bonds But we cannot mix the data for the two categories
5

8/11/2019 FISD-06
http://slidepdf.com/reader/full/fisd-06 6/120
The primary yield curve in the domesticcapital market is
The Government or Treasury Bond Yield Curve
This is because Such instruments are free of default risk
6

8/11/2019 FISD-06
http://slidepdf.com/reader/full/fisd-06 7/120
The Yield Curve
Is an indication of where the bond market istrading currently
It also has implications for what the marketthinks will happen in the future
7

8/11/2019 FISD-06
http://slidepdf.com/reader/full/fisd-06 8/120
The curve sets the yield for all debt marketinstruments
It fixes the price of money over the maturity
structure Thus issuers of debt in the market use the
yield curve to price debt securities.
8

8/11/2019 FISD-06
http://slidepdf.com/reader/full/fisd-06 9/120
The yields of government bonds set thebenchmark for yields on other debtsecurities.
For instance if the 5 year T-bond is trading at ayield of 5% All other bonds irrespective of the issuer will be
trading at yields in excess of 5%
The excess over the yield on a comparable T-bond is
called the Spread.
9

8/11/2019 FISD-06
http://slidepdf.com/reader/full/fisd-06 10/120
The yield curve acts as an indicator of futureyield levels.
It assumes certain shapes in response toexpectations of future interest rates.
Analysts study the current shape in order todetermine the direction of future interest rates.
10

8/11/2019 FISD-06
http://slidepdf.com/reader/full/fisd-06 11/120
The curve is analyzed by
Bond traders
Fund managers
Central bankers Corporate finance personnel
11

8/11/2019 FISD-06
http://slidepdf.com/reader/full/fisd-06 12/120
Central bankers and government Treasurydepartments analyze the curve for theinformation it provides
Regarding forward rates Future interest levels This information is used to set rates for the economy
as a whole
12

8/11/2019 FISD-06
http://slidepdf.com/reader/full/fisd-06 13/120
Portfolio managers use the curve to assessrelative values of investments across thematurity spectrum.
The curve indicates the returns that are availableat different points of time.
Consequently it helps determine which bonds arecheap or costly.
13

8/11/2019 FISD-06
http://slidepdf.com/reader/full/fisd-06 14/120

8/11/2019 FISD-06
http://slidepdf.com/reader/full/fisd-06 15/120
The YTM is the value of y that satisfies thefollowing equation.
15

8/11/2019 FISD-06
http://slidepdf.com/reader/full/fisd-06 16/120
The YTM is a solution to a non-linearequation.
We generally require a financial
calculator or a computer to calculate it.However it is fairly simple to compute the
YTM in the case of a coupon paying bondwith exactly two periods to maturity.
In such a case it is simply a solution to aquadratic equation.
16

8/11/2019 FISD-06
http://slidepdf.com/reader/full/fisd-06 17/120
The YTM is also easy to compute in the caseof zero coupon bonds.
Consider a ZCB with a face value of $1,000,
maturing after 5 years. The current price is $500.
The YTM is the solution to
17

8/11/2019 FISD-06
http://slidepdf.com/reader/full/fisd-06 18/120
The spot rate for a time period, is the YTM ofa zero coupon bond maturing at the end ofthe period.
Assume that a six month zero coupon bondwith a face value of $1,000 is selling for$961.54.
18

8/11/2019 FISD-06
http://slidepdf.com/reader/full/fisd-06 19/120
If we consider six months to be one period,then the one period spot rate is given by:
961.54 = 1,000 ⇒ s1 = 0.04 ≡ 4% for 6
---------(1 + s1)
Months or 8% per annum.
19

8/11/2019 FISD-06
http://slidepdf.com/reader/full/fisd-06 20/120
If a one year bond is at $873.44, then thetwo period spot rate is given by:
873.44 = 1,000 ⇒ s2 = .07 ≡ 7.00%
______(1 + s2)
2
For 6 months or 14% per annum
20

8/11/2019 FISD-06
http://slidepdf.com/reader/full/fisd-06 21/120
A Plain Vanilla bond is a series of cash flowsarising at six monthly intervals.
Each cash flow can be perceived as a ZCB
maturing at that point in time. Thus a Plain Vanilla bond is essentially a
portfolio of zero coupon bonds.
21

8/11/2019 FISD-06
http://slidepdf.com/reader/full/fisd-06 22/120
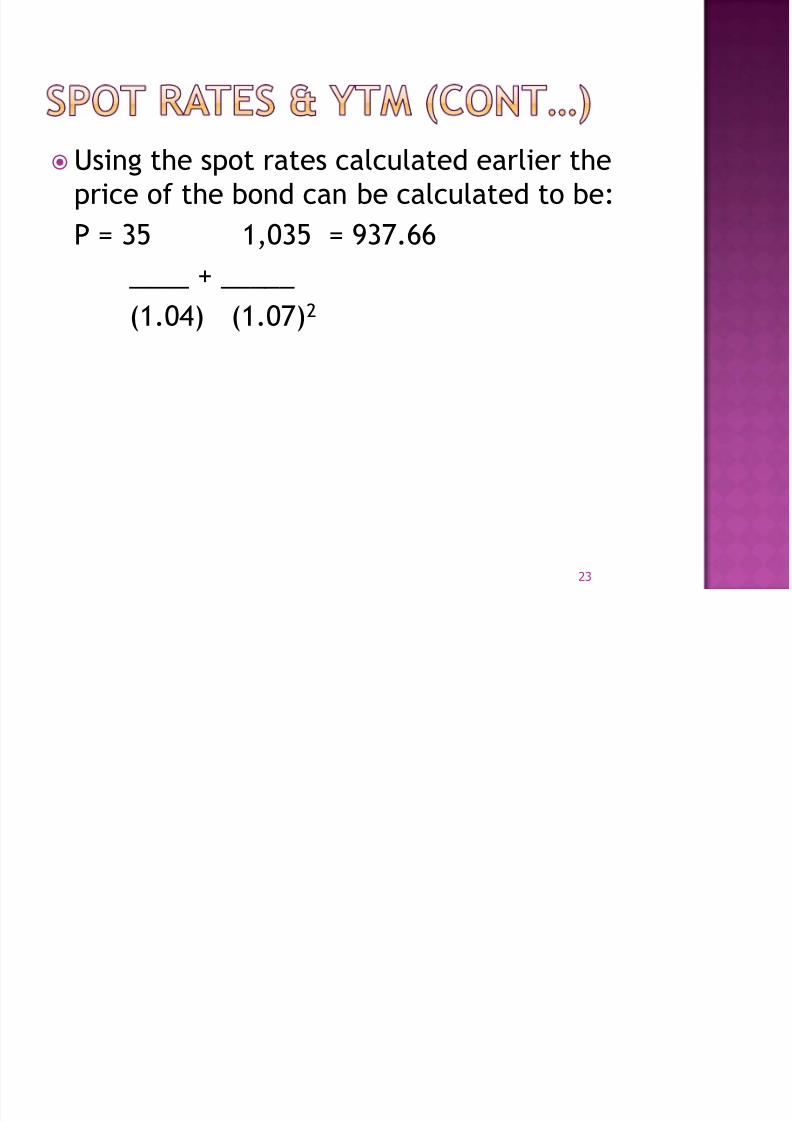
The correct way to price a Plain Vanilla bondis by discounting each cash flow
At the spot rate applicable for that period.
Take a bond with a face value of $1,000 andone year to maturity
The coupon is 7% per annum, paid on a semi-annual basis.
22
8/11/2019 FISD-06
http://slidepdf.com/reader/full/fisd-06 23/120
Using the spot rates calculated earlier theprice of the bond can be calculated to be:
P = 35 1,035 = 937.66
____ + _____(1.04) (1.07)2
23

8/11/2019 FISD-06
http://slidepdf.com/reader/full/fisd-06 24/120
What is the YTM of this bond?
It is obviously the solution to:
937.66 = 35 + 1,035
______ ______(1+ y/2) (1 + y/2)2
⇒ y/2 = 0.069454 ≡ 6.9454%
24

8/11/2019 FISD-06
http://slidepdf.com/reader/full/fisd-06 25/120
The YTM is therefore a complex average ofthe spot rates. This per se need not pose any problems. The problem is that the YTM is a function of the
coupon rate. In other words, if we compare two bonds with the
same time to maturity, but with different coupons, theYTMs for the two will differ.
25

8/11/2019 FISD-06
http://slidepdf.com/reader/full/fisd-06 26/120
Despite the fact that both have been pricedusing the appropriate spot rates.
This is known as the Coupon Effect.
Consider a bond with a face value of $1,000and one year to maturity, but with a couponof 12% per annum.
26

8/11/2019 FISD-06
http://slidepdf.com/reader/full/fisd-06 27/120
Its price can be calculated to be:
P = 60 + 1,060 = 983.54
____ ______
(1.04) (1.07)2
The YTM is obviously given by:
983.54 = 60 + 1,060 ⇒ y/2 = 0.069092
____ _____
(1+y/2) (1+y/2)2 ≡ y/2 = 6.9092%
27

8/11/2019 FISD-06
http://slidepdf.com/reader/full/fisd-06 28/120
Thus the YTM, which is a complex average ofspot rates, varies with the coupon rate
When comparisons are sought to be made amongbonds with an identical maturity.
What is the reason why the 7% coupon bondhas a higher YTM than the 12% bond?
28

8/11/2019 FISD-06
http://slidepdf.com/reader/full/fisd-06 29/120
Take the 7% bond first.
It has a price of 937.66.
The present value of the first cash flow is
35 ____ = 33.65
(1.04)
Thus 33.65 = 0.0359 ≡ 3.59% of the value
_____ of the bond is tied up in one
937.66 period money.
29

8/11/2019 FISD-06
http://slidepdf.com/reader/full/fisd-06 30/120
The balance 96.41% is obviously tied up intwo period money.
In the second case the price is 983.54 while
the present value of the first cash flow is 60 _____ = 57.69, which is 5.87%
(1.04) of the value of the bond.
30

8/11/2019 FISD-06
http://slidepdf.com/reader/full/fisd-06 31/120
The one period spot rate is 4% while the twoperiod spot rate is 7%.
Thus one period money is cheaper than two
period money. The second bond has a greater percentage of
its value tied up in one period money
So it is obvious that its yield to maturity will be
lower.
31

8/11/2019 FISD-06
http://slidepdf.com/reader/full/fisd-06 32/120
What is a Yield Curve?
It is a graph depicting the YTM, along the Y-axis, versus time to maturity along the X-
axis. It is imperative that the bonds being
compared belong to the same credit riskclass.
32

8/11/2019 FISD-06
http://slidepdf.com/reader/full/fisd-06 33/120
The expression `Term Structure ofInterest Rates’ refers to the relationshipbetween spot rates of interest and thecorresponding Time to Maturity
Once again the data should be applicableto bonds of the same risk class.
The term structure is also referred to asthe Zero Coupon Yield Curve.
33

8/11/2019 FISD-06
http://slidepdf.com/reader/full/fisd-06 34/120

8/11/2019 FISD-06
http://slidepdf.com/reader/full/fisd-06 35/120
Time to
Maturity
Price Coupon
1 Year 1,000 6%
2 Years 975 8%
3 Years 950 9%
4 Years 925 10%
35
Assume that we have the following data.

8/11/2019 FISD-06
http://slidepdf.com/reader/full/fisd-06 36/120
The one year bond is selling at par.
So the one year spot rate must be 6%, whichis the coupon rate on this bond.
The two year spot rate can be determined asfollows:
80 + 1080
975 = ____ ______ ⇒ s2 = 9.57%
(1.06) (1+s2)2
36

8/11/2019 FISD-06
http://slidepdf.com/reader/full/fisd-06 37/120
Similarly the three year spot rate is given by:
90 90 1090
950 = ____ + ______ + ____
(1.06) (1.0957) (1+s3)3
⇒ s3=11.32%
37

8/11/2019 FISD-06
http://slidepdf.com/reader/full/fisd-06 38/120
Using the same logic:
100 + 100 + 100 + 1100
925 = _____ ______ ______ ________
(1.06) (1.0957) (1.1132) (1+s4)4
⇒ s4 = 12.99%
38

8/11/2019 FISD-06
http://slidepdf.com/reader/full/fisd-06 39/120
A typical problem is that bonds may not existfor certain maturities
Else, even if a bond were to exist it may not betraded actively.
And in the absence of active trading, theobserved prices would be suspect.
39

8/11/2019 FISD-06
http://slidepdf.com/reader/full/fisd-06 40/120
Second a combination of par, premium anddiscount bonds are likely to be used
This exposes us to the coupon effect
And the liquidity effect.
40

8/11/2019 FISD-06
http://slidepdf.com/reader/full/fisd-06 41/120
The Liquidity Effect: For a given maturity on-the-run securities tend
to be more liquid than off-the-run securities.
T-Bill maturing on 16 May 19XX was trading at6.31%, whereas an 8.125% T-Note maturing on15 May 19XX was trading at 6.37%.
41

8/11/2019 FISD-06
http://slidepdf.com/reader/full/fisd-06 42/120
Off-the-run securities are less liquid since most of them are in the hands of investors who
intend to hold until maturity.
The demand for on-the-run securities will be
relatively higher And the yields will be lower, although both securities
are virtually identical.
42

8/11/2019 FISD-06
http://slidepdf.com/reader/full/fisd-06 43/120
Some of the earlier Treasury issues arecallable in nature.
It is not correct to compare bonds with
embedded options, with Plain Vanilla bonds
43

8/11/2019 FISD-06
http://slidepdf.com/reader/full/fisd-06 44/120
One problem with bootstrapping is that wetypically have data for bonds with differentcoupons.
At times we may have data for bonds, all ofwhich have the same coupon.
The resulting yield curve is called the CouponYield Curve.
44

8/11/2019 FISD-06
http://slidepdf.com/reader/full/fisd-06 45/120
It is an estimate obtained by using data forbonds with different coupons, but all oftrading at par.
In this case, the coupon for each bond will beequal to its YTM.
45

8/11/2019 FISD-06
http://slidepdf.com/reader/full/fisd-06 46/120
Time toMaturity
Price in Dollars Coupon
1 Year 1,000 6%
2 Years 1,000 8%
3 Years 1,000 9%
4 Years 1,000 10%
46

8/11/2019 FISD-06
http://slidepdf.com/reader/full/fisd-06 47/120
The one year spot rate is 6%.
The 2 year spot rate can be determined asfollows.
80 10801000 = _____ + ______
(1.06) (1+s2)2
⇒ S2 = 8.08%
47

8/11/2019 FISD-06
http://slidepdf.com/reader/full/fisd-06 48/120
The 3 year rate can be calculated as 9.16%and the 4 year rate as 10.30%.
The par bond yield curve is often used byprimary market analysts. Since new bonds are always issued at par, such a
curve can be used to estimate the coupon
To be offered on a new bond whose issue is beingcontemplated.
48

8/11/2019 FISD-06
http://slidepdf.com/reader/full/fisd-06 49/120
Without data on par bonds, the par bondyield curve can still be derived.
Assume that we have the following vector of
spot rates.
49

8/11/2019 FISD-06
http://slidepdf.com/reader/full/fisd-06 50/120
Time to Maturity Spot Rate
1 Year 6%
2 Years 9.57%
3 Years 11.32%
4 Years 12.99%
50

8/11/2019 FISD-06
http://slidepdf.com/reader/full/fisd-06 51/120
The yield for a one year par bond is obviously6%.
The yield or coupon for a two year par bondmay be calculated as:
C + 1000+C1,000 = _____ ________
(1.06) (1.0957)2
⇒ C = 94.0441 ⇒ c = 9.4044%
51

8/11/2019 FISD-06
http://slidepdf.com/reader/full/fisd-06 52/120
Similarly:
C + C + 1000+C
1000 = _____ _____ ________
(1.06) (1.0957)2 (1.1132)3
⇒ C = 109.9837⇒ c= 10.9984%
52

8/11/2019 FISD-06
http://slidepdf.com/reader/full/fisd-06 53/120
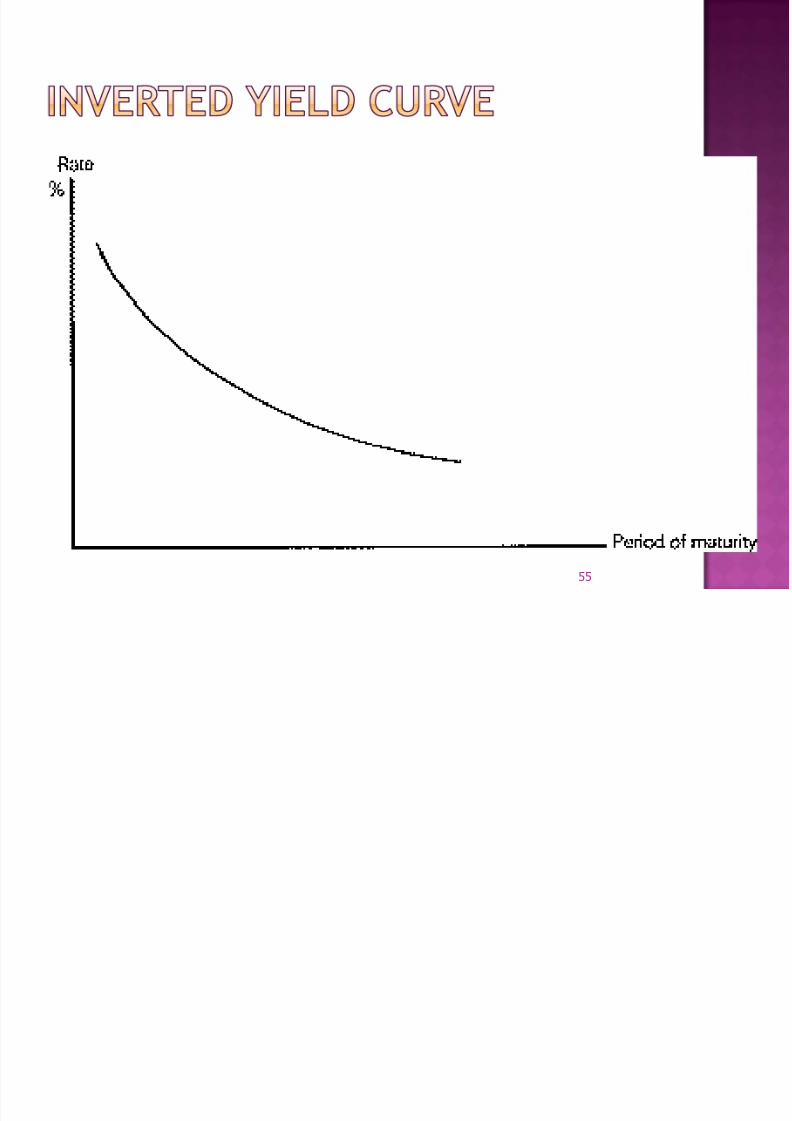
Having derived the spot rates, we can plotthem versus the time to maturity.
The graph may be upward sloping, orinverted, or else may be humped.
53

8/11/2019 FISD-06
http://slidepdf.com/reader/full/fisd-06 54/120
54
8/11/2019 FISD-06
http://slidepdf.com/reader/full/fisd-06 55/120

8/11/2019 FISD-06
http://slidepdf.com/reader/full/fisd-06 56/120
56

8/11/2019 FISD-06
http://slidepdf.com/reader/full/fisd-06 57/120
Let 1f1 be the one period forward rate oneperiod from now.
It is the rate for a forward contract madetoday, at time 0
To extend a one period loan next period, that is,at time 1.
57

8/11/2019 FISD-06
http://slidepdf.com/reader/full/fisd-06 58/120
Consider an investor who wishes to making aloan for two periods.
He will be indifferent between making a 2-period loan at the 2-period spot rate
And a 1-period loan at the 1-period spot ratewith a forward contract to rollover theproceeds for one period at 1f1.
58

8/11/2019 FISD-06
http://slidepdf.com/reader/full/fisd-06 59/120
Thus the no-arbitrage condition requiresthat:
(1+s2)2 = (1+s1)(1+1f1)
1f1 is known as the one period impliedforward rate.
In general, if we have an m period spotrate and an n period spot rate, where
m>n, then (1+sm)m = (1+sn)n(1+nfm-n)m-n
59

8/11/2019 FISD-06
http://slidepdf.com/reader/full/fisd-06 60/120
Assume that the five year spot rate is 10%and that the four year spot rate is 9%.
The one year forward rate four years from
now is given by:1 + 4f1 = (1.10)5 = 1.1409⇒ 4f1 = 14.09%
________
(1.09)
4
60

8/11/2019 FISD-06
http://slidepdf.com/reader/full/fisd-06 61/120
The first theory that we shall look at iscalled the Expectations Hypothesis.
As per this theory, forward rates arenothing but unbiased expectations of
future spot rates.Thus nfm-n = E0[nsm-n] In other words the (m-n) period forward
rate, n periods from now is the current
expectation Of the (m-n) period spot rate that is expectedto prevail n periods from now.
61

8/11/2019 FISD-06
http://slidepdf.com/reader/full/fisd-06 62/120
The Expectations hypothesis can explain anyshape of the yield curve.
An expectation that future short term rateswill be above current levels would lead to anupward sloping yield curve.
62

8/11/2019 FISD-06
http://slidepdf.com/reader/full/fisd-06 63/120
Assume that s1 = 5.50%; E[1s1] = 6%;E[2s1] =7.5%, and that E[3s1] = 8.5%
S2 = [(1.055)(1.06)]1/2 – 1 = 5.75%
S3 = [(1.055)(1.06)(1.075)]1/3 – 1 = 6.33%
S4 = [(1.055)(1.06)(1.075)(1.085)]1/4
= 6.87%
63

8/11/2019 FISD-06
http://slidepdf.com/reader/full/fisd-06 64/120
If the theory is true, then the yield curve isan important forecasting tool
Since it is an indicator of the direction of futureshort term interest rates.
According to the theory investors care onlyabout expected returns and not about risk.
It says that the term structure is based on
investors’ and issuers’ expectations aboutfuture short-term rates
64

8/11/2019 FISD-06
http://slidepdf.com/reader/full/fisd-06 65/120
Participants choose maturities to maximizeoutcomes over a known time horizon
Investors seek to maximize their expected rate ofreturn
Issuers seek to minimize their expected cost ofborrowed funds
The slope of the yield curve tells us whatbuyers and sellers in general are expecting
about future market rates
65

8/11/2019 FISD-06
http://slidepdf.com/reader/full/fisd-06 66/120
Take the two period case. An investor can buy a two year bond yielding a
rate of s2.
Or he can buy a one year bond yielding s1 and
then roll over into another one period bond atmaturity.
According to the expectations hypothesis he willbe indifferent if the expected returns from thetwo strategies are equal.
66

8/11/2019 FISD-06
http://slidepdf.com/reader/full/fisd-06 67/120

8/11/2019 FISD-06
http://slidepdf.com/reader/full/fisd-06 68/120
How can expectations of rising interestrates lead to an upward sloping yieldcurve?
If rates are expected to rise theninvestors in long term bonds will indeedbe perturbed.
Rising interest rates imply falling bond
prices, and long term bonds are morevulnerable to changing interest rates
68

8/11/2019 FISD-06
http://slidepdf.com/reader/full/fisd-06 69/120

8/11/2019 FISD-06
http://slidepdf.com/reader/full/fisd-06 70/120
The expectations theory has two criticalassumptions
Investors and issuers are risk neutral
They can buy or sell bonds at any point on the
yield curve
Agents move freely along the term structureby buying or issuing at whatever maturitythey choose
70

8/11/2019 FISD-06
http://slidepdf.com/reader/full/fisd-06 71/120
Investors can ride the yield curve if itmaximizes their expected yield
Issuers will roll over short-term IOUs tofinance their capital expenditure if itminimizes their expected cost of funds
71

8/11/2019 FISD-06
http://slidepdf.com/reader/full/fisd-06 72/120
This theory states that relative amountsof long term and short term bonds willnot affect the shape of the yield curve
Unless investor’s expectations of the futurewere to be affected.
For instance the central banks conductopen market operations on a regular basis
by buying and selling Treasury securities.
72

8/11/2019 FISD-06
http://slidepdf.com/reader/full/fisd-06 73/120
As per the expectations hypothesis thecentral banks cannot influence the shape ofthe yield curve
By buying securities of one maturity and selling
another.
Because investors regard all securities,irrespective of maturity as perfectsubstitutes.
73

8/11/2019 FISD-06
http://slidepdf.com/reader/full/fisd-06 74/120

8/11/2019 FISD-06
http://slidepdf.com/reader/full/fisd-06 75/120
Or else he can buy a two period bond andsell it after one period.
The rate of return is uncertain since theterminal price will be uncertain.
Take the case of a zero coupon bond with aface value of $1,000.
75

8/11/2019 FISD-06
http://slidepdf.com/reader/full/fisd-06 76/120
Its current price is:
1000
____________
(1+s1)(1+1f1)The expected price after a period is:
E[ 1000] 1000
______ ≥ _________ (1+1s1) [1 + E(1s1)]
76

8/11/2019 FISD-06
http://slidepdf.com/reader/full/fisd-06 77/120
The rate of return from the two periodbond over the first year is:E[ 1000] 1000 1000 1000
______ - __________ ________ - __________
(1 + 1s1) (1+s1)(1+1f1) [1+E(1s1)] (1+s1)(1+1f1)
______________________ ≥______________________
1000 1000
________ ___________
(1+s1)(1+1f1) (1+s1)(1+1f1)
77

8/11/2019 FISD-06
http://slidepdf.com/reader/full/fisd-06 78/120
≥ (1+s1)(1+1f1)
__________ - 11 + E(1s1)
A sufficient condition for this to be greaterthan s1 is 1f1 > E(1s1)
78

8/11/2019 FISD-06
http://slidepdf.com/reader/full/fisd-06 79/120
Thus an investor with a 1-period horizonwill hold a 2-period bond only if itsexpected return is greater Which implies that the forward rate must be
greater than the expected spot rate.
Thus the forward rate will embody a riskor liquidity premium.
The forward rate will exceed theexpected future spot rate by the liquidity
premium.
79

8/11/2019 FISD-06
http://slidepdf.com/reader/full/fisd-06 80/120
We know that:
(1+s2)(1+s2) = (1+s1)(1+1f1)
According to the liquidity preference
theory:(1+s1)(1+1f1) > (1+s1)[1+E(1s1)]
Therefore:
(1+s2)(1+s2) > (1+s1)[1+E(1s1)]
80

8/11/2019 FISD-06
http://slidepdf.com/reader/full/fisd-06 81/120
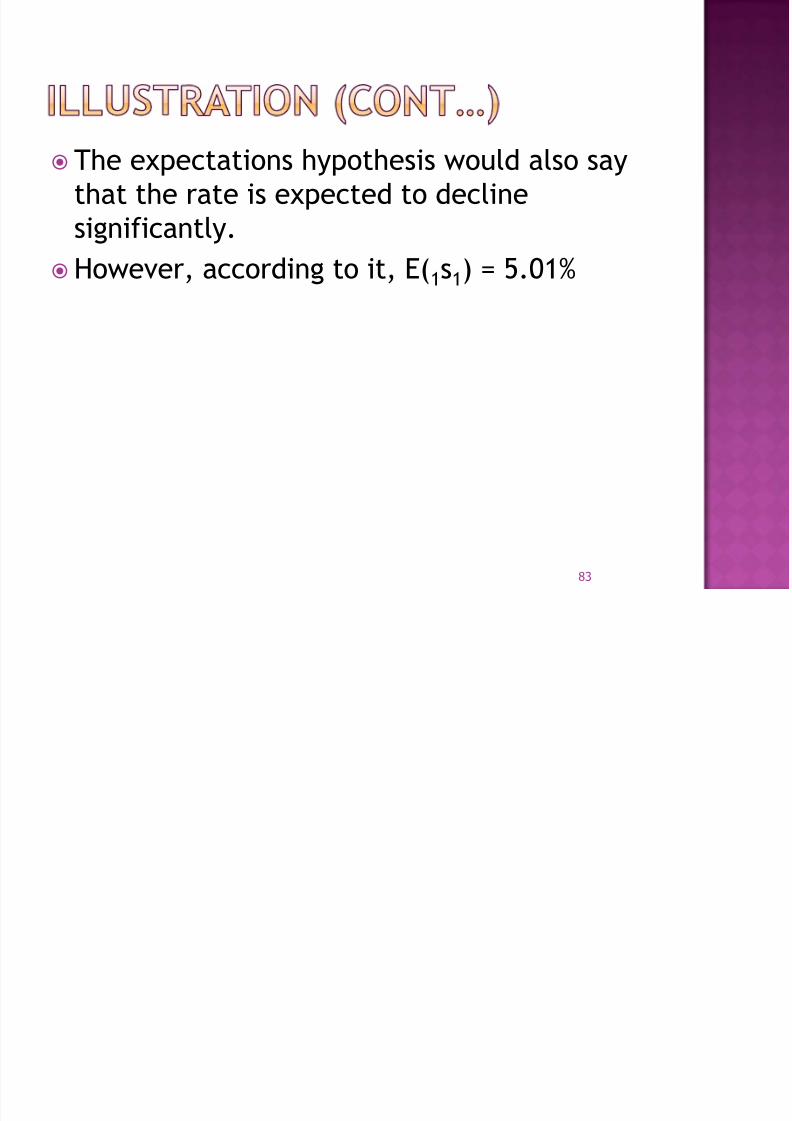
Consider a downward sloping term structure,that is, s1 > s2.
The inequality will hold only if E(1s1) issubstantially smaller than s1.
Thus a downward sloping curve will beobserved only if the market expects spotrates to decline significantly.
81

8/11/2019 FISD-06
http://slidepdf.com/reader/full/fisd-06 82/120
Assume that s1 = 7% and that s2 = 6%.The term structure is obviously downward
sloping.
1f1 = (1.06)(1.06) ______________ - 1 = 5.01%
(1.07) If we assume that the liquidity premium is .41%,
then E(1
s1
) = 4.60%, which implies that the spotrate is expected to decline significantly.
82
8/11/2019 FISD-06
http://slidepdf.com/reader/full/fisd-06 83/120
The expectations hypothesis would also saythat the rate is expected to declinesignificantly.
However, according to it, E(1s1) = 5.01%
83

8/11/2019 FISD-06
http://slidepdf.com/reader/full/fisd-06 84/120
What about a flat term structure? If s1 = s2, then according to the liquidity
premium hypothesis, E(1s1) < s1.
Thus as per this hypothesis a flat termstructure implies that spot rates are likelyto decline.
In contrast a flat term structure wouldimply no change in the one period spotrate, if the expectations hypothesis wereto be valid.
84

8/11/2019 FISD-06
http://slidepdf.com/reader/full/fisd-06 85/120
If s1 = s2 = 7% and the liquidity premium is.41%, the theory would imply that E(1s1) =6.59%.
In contrast according to the expectationshypothesis E(1s1) = 7%.
85

8/11/2019 FISD-06
http://slidepdf.com/reader/full/fisd-06 86/120

8/11/2019 FISD-06
http://slidepdf.com/reader/full/fisd-06 87/120
Assume that s1 = 7% and s2 = 7.1%. Let the liquidity premium be .41%.
If so, 1f1 = 7.2% ⇒ E(1s1) = 6.79%
However if s2 = 7.3%, then 1f1 = 7.6% ⇒ E(1s1)= 7.19%.
In both cases the expectations hypothesiswould predict a rise in the spot rate.
87

8/11/2019 FISD-06
http://slidepdf.com/reader/full/fisd-06 88/120
The theory states that participants careabout both risk and return
Risk averse investors require extracompensation for long maturity bondsrelative to short maturity bonds Long term bonds are more vulnerable to rate
changes
Thus there is a premium paid for shorter term
bonds Thus the forward rate is greater than the
expected future spot rate
88

8/11/2019 FISD-06
http://slidepdf.com/reader/full/fisd-06 89/120
The market segmentation or the hedgingpressure hypothesis argues that securitiesare not perfect substitutes for each other.
Different investor groups have their ownmaturity preferences.
A group will not stray from its desiredmaturity range unless it is induced to do
so by higher yields or other favourableterms.
89

8/11/2019 FISD-06
http://slidepdf.com/reader/full/fisd-06 90/120
It argues that banks, pension funds, andmutual funds, often act like riskminimizers
Rather than profit maximizers as assumedby the expectations hypothesis.
They prefer to hedge against the risk offluctuations in prices and yields by
Balancing the maturity structures of theirassets with that of their liabilities.
90

8/11/2019 FISD-06
http://slidepdf.com/reader/full/fisd-06 91/120
For instance pension funds have stable andpredictable long term liabilities. Thus they prefer long term assets.
Banks have relatively short term liabilities
And hence tend to prefer short term assets. Thus financial markets are not one large pool
of loanable funds.
91

8/11/2019 FISD-06
http://slidepdf.com/reader/full/fisd-06 92/120
This theory goes to the other extreme ascompared to the expectations hypothesis
Investors and issuers are so risk averse that theybuy and sell only for maturities that match their
time horizon For instance a CFO who has a planned outflow in
three months will invest only in a 3-month moneymarket security
Potential pensioners will invest only in long-termbonds
92

8/11/2019 FISD-06
http://slidepdf.com/reader/full/fisd-06 93/120
The theory states that risk aversion is abarrier to entry from other market segments
No matter how attractive interest rates may bealong other points on the yield curve
Thus the observed yield curve is a collectionof equilibrium rates in each segment
Based on the demand for and the supply ofmoney in that segment
Thus the implied forward rate is unrelated tothe expected future rates
93

8/11/2019 FISD-06
http://slidepdf.com/reader/full/fisd-06 94/120
Thus the debt market is essentially anumber of sub markets.
Demand and supply dynamics in each
group is the prime reason for the leveland structure of interest rates within thatmaturity range.
However rates prevailing in a range are
relatively unaffected by rates prevailingelsewhere.
94

8/11/2019 FISD-06
http://slidepdf.com/reader/full/fisd-06 95/120
If submarkets are isolated thenpolicymakers can alter the shape of thecurve by influencing supply-demand inone or more segments.
If a positively sloped yield curve were to bedesired, the central bank can flood the marketwith long term bonds.
It could simultaneously purchase short termbonds.
95

8/11/2019 FISD-06
http://slidepdf.com/reader/full/fisd-06 96/120
This theory attempts to unify all the earliertheories.
Investors have a preferred habitat along thematurity scale that matches
their risk preferences
Tax exposure
Liquidity needs
Regulatory requirement
And planned holding periods.
96

8/11/2019 FISD-06
http://slidepdf.com/reader/full/fisd-06 97/120

8/11/2019 FISD-06
http://slidepdf.com/reader/full/fisd-06 98/120
The yield curve is generally upward slopingand levels off at long maturities The liquidity preference theory would state that
investors require a higher rate of return fromlong-term bonds for bearing greater risk
The segmented market theory would state thatdemand for long term funds is strong relativeshort-term funds and that supply of short termfunds is strong relative to long-term funds
Borrowers like to lock in rates for expectedperiods
Lenders prefer the flexibility of short-terminvestments
98

8/11/2019 FISD-06
http://slidepdf.com/reader/full/fisd-06 99/120
In practice short-term yields are morevolatile than long-term yields
Thus the term structure of volatility isdownward sloping
The expectations theory will argue that long-term rates are an average of expected futureshort-term rates
And averages are less volatile
The liquidity preference theory will come to thesame conclusion
99

8/11/2019 FISD-06
http://slidepdf.com/reader/full/fisd-06 100/120
The segmented market theory would say thatthere is more shifting in the demand andsupply of short-term funds
And that there is greater stability in the
market for long-term funds In practice we tend to observe this Investors park funds in the money market while
doing asset reallocation
Long-maturity bonds attract buy and holdinvestors Life insurance companies
Pension Funds
100

8/11/2019 FISD-06
http://slidepdf.com/reader/full/fisd-06 101/120
Short-term and long-term yields usuallychange in the same direction although notalways in a parallel fashion
Sometimes the curve may steepen or flatten
But most shifts in the curve are more or lessparallel
101

8/11/2019 FISD-06
http://slidepdf.com/reader/full/fisd-06 102/120
This may be explained as followsConsider the factors that raise or lower
expected future rates
Expected inflation
Business cycles
Monetary policy
Trade balances
Foreign exchange rates
Tax rates
Fiscal policy
102

8/11/2019 FISD-06
http://slidepdf.com/reader/full/fisd-06 103/120
We would expect all these factors toinfluence short-term and long-term rates in asimilar fashion
All the proposed theories are consistent with this
103

8/11/2019 FISD-06
http://slidepdf.com/reader/full/fisd-06 104/120
If the absence of risk long-term rates wouldreflect the average of short-term rateexpectations over the maturity of the former
If the horizons of investors and borrowers were
evenly distributed across maturities then thiswould be true
104

8/11/2019 FISD-06
http://slidepdf.com/reader/full/fisd-06 105/120
However what if most investors have a short-term horizon
They will need an inducement to hold long-termbonds
Because when they sell at the end of theirinvestment horizons they will be exposed tomarket risk
In this case long-term yields will be higher
than the geometric average of expectedshort-term rates
This is what the liquidity preference theorypredicts
105
8/11/2019 FISD-06
http://slidepdf.com/reader/full/fisd-06 106/120
But what if most traders have a long-termhorizon They would need an inducement to hold short-
term bonds
For they face reinvestment risk If so long-term rates will be lower than the
geometric average of expected short-term rates
So whether long-term rates are lower orhigher than the geometric average of
expected short-term rates Would depend on how investors are distributed
across maturities
106

8/11/2019 FISD-06
http://slidepdf.com/reader/full/fisd-06 107/120
Assume there is a concentration of traders atthe short-end of the spectrum
If so long-term rates must be higher than theaverage of expected short-term rates
The term risk in this context means thatexpectations may not always be realized
The more volatile rates are
The greater the possibility of change from theexpected value
As well as the magnitude of change
107

8/11/2019 FISD-06
http://slidepdf.com/reader/full/fisd-06 108/120
8/11/2019 FISD-06
http://slidepdf.com/reader/full/fisd-06 109/120
Speculators on short-term yield changes facegreater risk from long-maturity instruments
Dealers too hold bonds for short periods
Hence they too face greater risk from long-term
securities
As compensation they demand higher yields
Thus such market participants impart a biastowards short-term securities
This explains why on an average the yield curveis usually upward sloping
109

8/11/2019 FISD-06
http://slidepdf.com/reader/full/fisd-06 110/120

8/11/2019 FISD-06
http://slidepdf.com/reader/full/fisd-06 111/120
It is a parametric approach for derivingthe zero-coupon yield curve.According to this model, the m period
spot rate is given by:
s(m,β) = β0 + β1 x [1 – e-m/τ
] + ________m/τ
β2 x 1 – e-m/τ
[________ – e-m/τ] m/τ
111

8/11/2019 FISD-06
http://slidepdf.com/reader/full/fisd-06 112/120
The parameters β0, β1, β2 and τ have tobe empirically estimated.
Advantages of the method:
It can handle a wide variety of termstructure shapes that are observed in themarket.
It avoids the need for interpolation to
determine the spot rates betweendiscrete points in time
112

8/11/2019 FISD-06
http://slidepdf.com/reader/full/fisd-06 113/120
Spot rates can be derived at any point intime and not just at discrete points
The parameters can be interpreted asfollows.
β0 must be positive and is the asymptoticinstantaneous forward rate.
It is a function of the term to maturity.
113
8/11/2019 FISD-06
http://slidepdf.com/reader/full/fisd-06 114/120
β1 measures the deviation from theasymptote.
It measures the speed with which the curvetends towards its long term value.
If it is positive, the curve will have anegative slope and vice-versa.
114

8/11/2019 FISD-06
http://slidepdf.com/reader/full/fisd-06 115/120
τ must be positive and is the position of thehump or the u-shape on the curve.
β2 measures the magnitude and direction ofthe hump.
If it is positive there will be a hump.
Else there will be a u-shape.
115

8/11/2019 FISD-06
http://slidepdf.com/reader/full/fisd-06 116/120
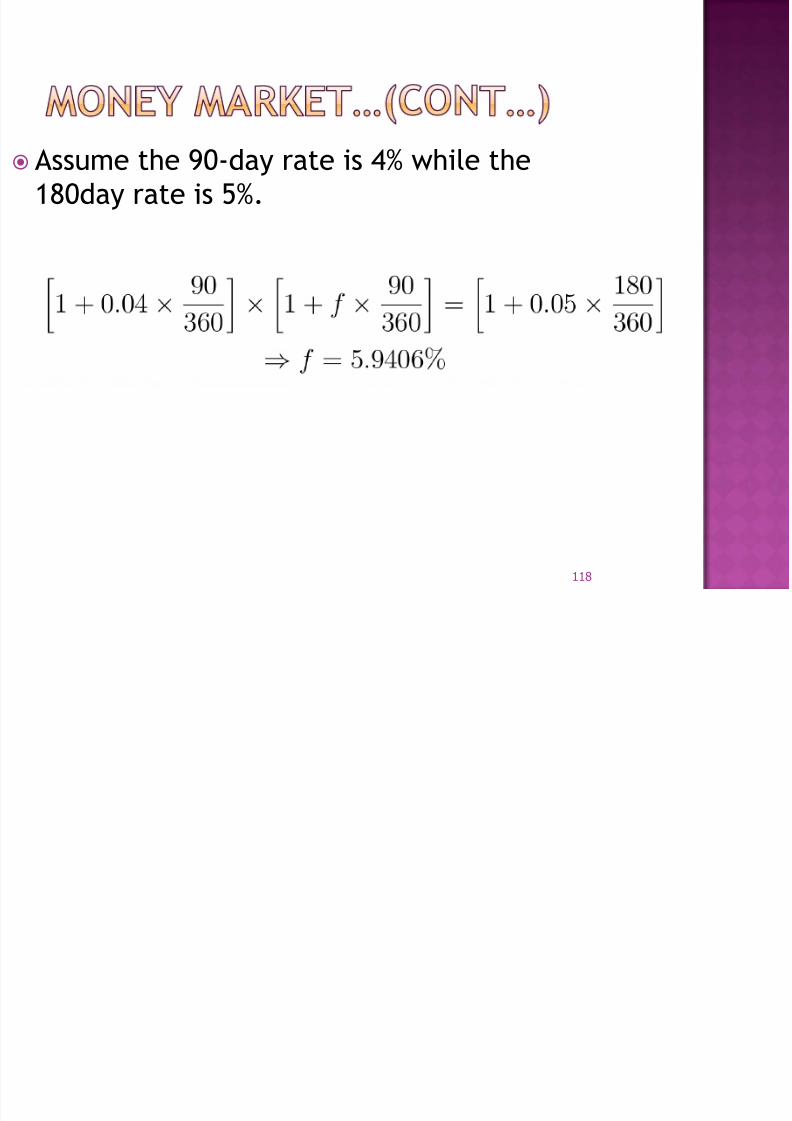
The method of computation of forward ratesfor money market products depends onwhether the market uses an add-on rateapproach or a discount rate approach
Consider CDs which typically use an add-onapproach
Assume the rate for an A-days CD is rA andthat for a B days CD is rB, where B > A
Assume that the year has 360 days
116

8/11/2019 FISD-06
http://slidepdf.com/reader/full/fisd-06 117/120
8/11/2019 FISD-06
http://slidepdf.com/reader/full/fisd-06 118/120

8/11/2019 FISD-06
http://slidepdf.com/reader/full/fisd-06 119/120
Now consider a discount instrument such ascommercial paper
The quoted rate is rA for paper with A days tomaturity and rB for paper with B days to
maturity where B > A.
119

8/11/2019 FISD-06
http://slidepdf.com/reader/full/fisd-06 120/120


