Fiscal Year Ended March 31, 2021 Presentation for Investors
40
Copyright © Nagoya Railroad Co., Ltd. Fiscal Year Ended March 31, 2021 Presentation for Investors Nagoya Railroad Co., Ltd. Securities Code: 9048 May 27, 2021
Transcript of Fiscal Year Ended March 31, 2021 Presentation for Investors

Copyright © Nagoya Railroad Co., Ltd.
Fiscal Year Ended
March 31, 2021
Presentation for Investors
Nagoya Railroad Co., Ltd.
Securities Code: 9048
May 27, 2021

Current Situation, Management
Issues, and Measures to Address
Management Issues01
01Copyright © Nagoya Railroad Co., Ltd.

-10.2
-4.7
5.0
-6.4
-16.3
47.3
-200
-100
0
100
200
300
400
500
1st
quarter
2nd
quarter
3rd
quarter
4th
quarter
FY2020
results
FY2019
results
Group Business Performance
-7.6-4.7
3.5
-19.9
-28.7
28.8
△ 400
△ 300
△ 200
△ 100
0
100
200
300
400
1st
quarter
2nd
quarter
3rd
quarter
4th
quarter
FY2020
results
FY2019
results
02
■Group Business Performance
■ Group Business Performance Highlights
[Operating income]
【Net profit]
Operating income:【Recorded losses】Loss due to the COVID-19 pandemic.
(Secured surplus) Transport, Real Estate, Aviation Services,Others
(Recorded losses) Traffic, Leisure and Services, Distribution
Net profit:【Recorded losses 】The loss worsened significantly due mainly to the recording ofimpairment loss on fixed assets in addition to an operating loss.
(billions of yen)■ Quarter Trends
Operating revenues 481.6Billions
of
yen- 141.2 - 22.7 % + 4.6
Billions
of
yen
Operating income - 16.3Billions
of
yen- 63.7 - % + 3.6
Billions
of
yen
Ordinary income - 8.1Billions
of
yen- 57.4 - % + 4.8
Billions
of
yen
- 28.7Billions
of
yen- 57.6 - % - 1.2
Billions
of
yen
ResultsChange from
forecast
(from Feb.)
Profit attributable to
owners of the parent
Year-on-year
change
Copyright © Nagoya Railroad Co., Ltd.

Total number of
passengers (FY2020)
221.2 millions of people
Year-on-year
comparisons -17.6%
0
2,000
4,000
6,000
8,000
10,000
0
1,000
2,000
3,000
4,000
Apr. May Jun. Jul. Aug. Sept. Oct. Nov. Dec. Jan. Feb. Mar.
FY2019 FY2020 the number of COVID-19 cases of Aichi* Figures on graphs are year-on-year changes.
Figures in parentheses are percent changescompared to the same month two years ago.
03
-35.8
-21.5 -21.2-31.7-25.3
-15.7 -22.4
-27.7
-26.3
-20.4 +1.6
-43.0
The Company’s Passengers
■ Railroad Passengers Trends
[Non-Commuters]
[Total]
State of emergency
Apr.10 - May.25
State of emergency
(Aichi original)Aug.6 - Aug.24
State of emergency
Jan.14- Feb.28
(Unit: Millions of people)
(Unit: People)Excluding the effects of a surge in
consumption before a tax hike,
passengers were down
-22.8% in Sept. and -25.7% in Oct..
⮚ Total number of passengers (FY2020)
296.23 millions of people
Year-on-year comparisons -24.8%
Total number of
passengers (FY2020)
75.03 millions of people
Year-on-year
comparisons -40.3%
+45.2
(Reference)Implementation status of remote working
<Area>Implementation
rate
The Tokyo
metropolitan area38.5%
Kansai area 22.1%
Aichi・Gifu 20.0%
<Industry type>Implementation
rate
Information and
communication industry55.7%
Financial business,
Insurance business30.2%
Manufacturing
industry27.2%
Source: Created by the Company based on PERSOL RESEARCH AND CONSULTING Co., Ltd.’s fourth emergency survey related to the impact of pandemic countermeasures on teleworking (Nov.18–23, 2020)
Tokyo metropolitan area・・・Tokyo, Kanagawa, Saitama, Chiba
Kansai area・・・Osaka, Kyoto, Hyogo
[Commuters]
(-24.9)
(-17.2)
Apr.2021
Copyright © Nagoya Railroad Co., Ltd.

Management Issues
Management Issues Based on the Current Situation and Changes in
the Business Environment
04
① Structural reforms in our Traffic business
② Promoting real estate development in line with the gradual migration of populations
from urban centers to the suburbs and the concomitant changes in lifestyles
③ Reinforcing earnings power, particularly that of businesses expected to grow going forward
④ Promoting digital transformation (DX)
Business Environment Current Situation After the COVID-19 Situation
Remote working,
Online classes・ConferencesExpanding
Likely to stay somewhat common,
except for online classes
Migration of populationsGradual spread from urban centers
to suburbsContinuation
Inbound demand Evaporation Prolonged recovery period
Domestic leisure demandSome effects on the Go To
Campaign are uncertain
A recovery of Tourism demand
in the center in micro-tourism
Real Estate・Transport・Aviation Services etc.
Relatively stable Continuous growth
Digitalization Acceleration of progress Become established
Copyright © Nagoya Railroad Co., Ltd.
2019年度 2020年度 2021年度
収益
費用
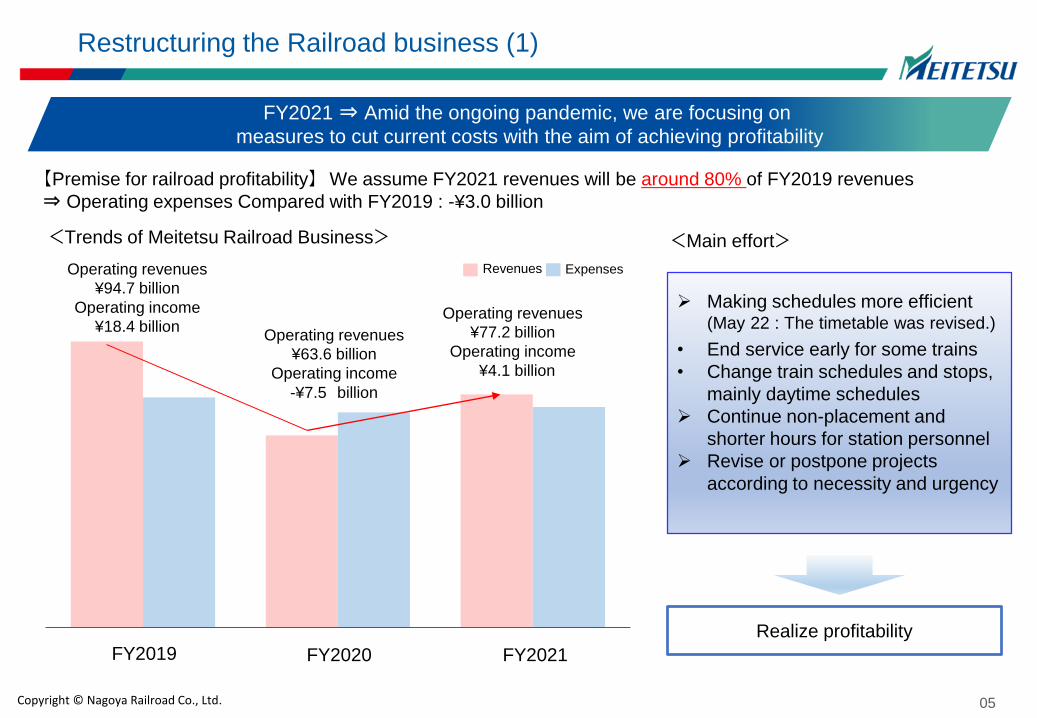
Restructuring the Railroad business (1)
05
FY2021⇒ Amid the ongoing pandemic, we are focusing on
measures to cut current costs with the aim of achieving profitability
【Premise for railroad profitability】 We assume FY2021 revenues will be around 80% of FY2019 revenues
⇒ Operating expenses Compared with FY2019 : -¥3.0 billion
<Main effort>
Making schedules more efficient(May 22 : The timetable was revised.)
• End service early for some trains
• Change train schedules and stops,
mainly daytime schedules
Continue non-placement and
shorter hours for station personnel
Revise or postpone projects
according to necessity and urgency
Realize profitability
Operating revenues
¥94.7 billion
Operating income
¥18.4 billionOperating revenues
¥77.2 billion
Operating income
¥4.1 billion
Operating revenues
¥63.6 billion
Operating income
-¥7.5 billion
Copyright © Nagoya Railroad Co., Ltd.
<Trends of Meitetsu Railroad Business>
Revenues Expenses
FY2019 FY2020 FY2021

Restructuring the Railroad business (2)
06
FY2022 and beyond ⇒We are focusing on structural business reforms
to realize long-term stable management even with lower revenues after the pandemic
【Premise for railroad profitability】 We assume revenues will gradually recover, reaching around 90% of FY2019 levels in FY 2023
営業利益100億円台に回復
営業収益 947億営業利益 184億
FY2019 FY2020 FY2021 FY2022 FY2023
Revenues
Expenses
Reducing labor and making costs more appropriate
in line with demand
⮚ Making schedules more efficient to meet demand
⮚ Shifting more toward one-person train operations
⮚ Making station operations more efficient
⮚ Making facility maintenance more efficient mainly by using
new technology
⮚ Building a train line operation system in line with future
demand etc.
Enhancing our earnings power
Considering fares and pricing structures in line with demand
Further strengthening peripheral businesses, which
includes using the space inside stations more effectively
Drumming up tourism by strengthening alliances with
communities etc.
Step 1: FY2023 operating income to ¥10.0 billion
Step 2: Aim for a recovery in operating income to ¥15.0 billion
Note: We will assess the post-pandemic situation and determine
the necessity of further measures.
pre-
PandemicDuring the
Pandemic
After the
Pandemic
<Main effort>
Copyright © Nagoya Railroad Co., Ltd.
<Trends of Meitetsu Railroad Business>

⮚ Reducing the number of buses
⮚ Integrating and closing sales offices
⮚ More appropriate staffing
⇒We reduced personnel by around 20%
compared with FY2019, especially in the
travel department, by soliciting voluntary
retirements and limiting hiring.
Restructuring the travel and bus tour businesses
⮚ Integrating and closing branches
⮚ Achieving more appropriate staffing levels
⇒While maintaining our nationwide
network, we streamlined and consolidated
around 25% of our network compared with
FY2019 in part by merging nearby branches.
⇒We reduced personnel by around 15%
compared with FY2019 by soliciting
voluntary retirements, limiting hiring, and
using temporary staff across the Group.
【Bus tour business】
⇒ We plan to reduce the number of
buses by around 20% compared with
FY2019.
⇒ We will consolidate and close around
30% of branches compared with FY2019,
especially those of the travel department.
【Travel business】
07
Reduced fixed costs by around 20% Reduced fixed costs by around 10%
<Main effort> <Main effort>
Copyright © Nagoya Railroad Co., Ltd.
Selecting and focusing on business fields and building efficient management through business downsizing
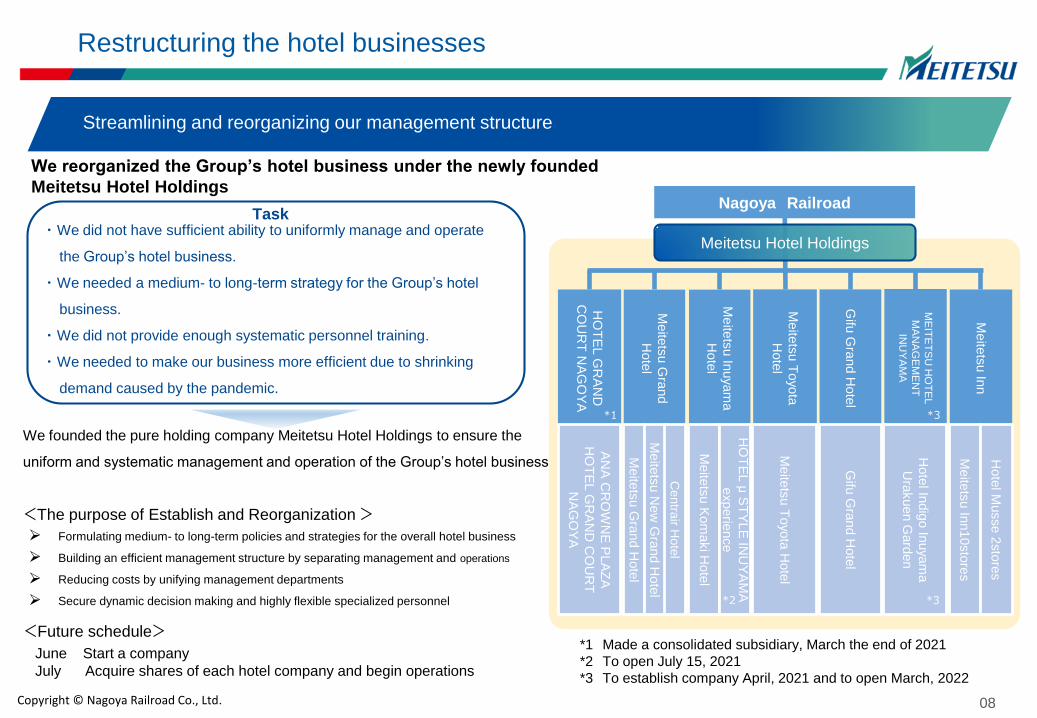
Streamlining and reorganizing our management structure
Restructuring the hotel businesses
⮚ Formulating medium- to long-term policies and strategies for the overall hotel business
⮚ Building an efficient management structure by separating management and operations
⮚ Reducing costs by unifying management departments
⮚ Secure dynamic decision making and highly flexible specialized personnel
<The purpose of Establish and Reorganization >
<Future schedule>
June Start a company
July Acquire shares of each hotel company and begin operations
*1 Made a consolidated subsidiary, March the end of 2021
*2 To open July 15, 2021
*3 To establish company April, 2021 and to open March, 2022
We founded the pure holding company Meitetsu Hotel Holdings to ensure the
uniform and systematic management and operation of the Group’s hotel business.
Task・ We did not have sufficient ability to uniformly manage and operate
the Group’s hotel business.
・ We needed a medium- to long-term strategy for the Group’s hotel
business.
・ We did not provide enough systematic personnel training.
・ We needed to make our business more efficient due to shrinking
demand caused by the pandemic.
08
ME
ITE
TS
U H
OT
EL
MA
NA
GE
ME
NT
INU
YA
MA
Meite
tsu
Inn
Nagoya Railroad
HO
TE
L G
RA
ND
CO
UR
T N
AG
OY
A
Meite
tsu
Gra
nd
Hote
l
Gifu
Gra
nd H
ote
l
Meite
tsu
Inuyam
a
Hote
l
Meite
tsu
Toyo
ta
Hote
l
Hote
l Indig
o In
uyam
a
Ura
kuen
Gard
en
Meite
tsu
Inn10sto
res
AN
A C
RO
WN
E P
LA
ZA
HO
TE
L G
RA
ND
CO
UR
T
NA
GO
YA
Meite
tsu
Gra
nd H
ote
l
Gifu
Gra
nd H
ote
l
Meite
tsu
Kom
aki H
ote
l
Meite
tsu
Toyo
ta H
ote
l
Meite
tsu
New
Gra
nd H
ote
l
Centra
irH
ote
l
HO
TE
L μ
ST
YLE
INU
YA
MA
experie
nce
Hote
l Musse
2sto
res
*1
*2
*3
*3
Meitetsu Hotel Holdings
We reorganized the Group’s hotel business under the newly founded
Meitetsu Hotel Holdings
Copyright © Nagoya Railroad Co., Ltd.

μPLAT Jingū-maeArtist rendering
Location
Sambonmatsu-cho, Atsuta-ku,
Nagoya,Aichi Prefecture
(Direct connection to Jingū-mae
Station on the Nagoya Line)
BuildingCommercial wing:Steel frame,
4stories above ground
Uses Stores, restaurants, services
Opens July 2021 (planned)
Key stations and areas around stations
(Commercial facilities)Key stations and areas around stations
(Condominiums for lease)
We will stably expand development businesses
in city centers and expanding services rooted in lives in areas
09
⮚ City centers:Anticipating growth in central Nagoya,
we are participating in projects to develop offices and
condominiums around Nagoya Station.
⮚ Key stations along train lines:Redevelopment plans
aligned with municipalities along train lines
⮚ Areas around stations:Commercial facilities, Construction
of Condominiums for lease, Considering expanding satellite
offices and establishing single-room work booths
Expanding services rooted in lives in areas
⮚ We are working hard to revitalize areas along our
train lines by offering station-centric dining,
shopping, and mobility services.
Artist rendering
μX MEIEKI
※Note: Trademark pending
Meitetsu Gifu Station
We will consider multi-purpose development,
such as mixed commercial facilities and
residences, appropriate for an gateway to the city
by effectively aligning with properties around the
station.
Kiyozumi-cho area
Meitetsu Gifu Station
Nagazumi-cho
area
Kanda-machi area
meLiV Kariya
Artist rendering
City center Key stations and areas around stations (Redevelopment plan)
Expanding development businesses in city centers, key stations along train lines, and areas around stations
Development businesses in city centers, key stations along train lines, and areas around stations
LocationWakamatsu 1-94, Kariya, Aichi
Prefecture
Building Total floor area:2,665㎡
Uses Residential complex
Completion March 2022 (planned)
LocationMeieki 4-chome, Nakamura-ku,
Nagoya
BuildingSteel frame, 12 stories above ground,
1 basement
Total floor area: Approx. 2,300㎡
Uses Stores, offices
Opens September 2021 (planned)
Copyright © Nagoya Railroad Co., Ltd.

Drumming up tourism in Inuyama
10
具体的な取組み(名鉄グループと自治体・地域が連携)
Drumming up tourism by strengthening alliances with communities
We are looking to capture micro-tourism and domestic travel demand. Seizing the opportunity presented by the
opening of two new hotels, we are working with local municipalities and communities to create attractive tourist spots
and instill a welcoming atmosphere with the aim of turning Inuyama from a daytrip destination to an overnight one.
Specific efforts
Promotions using various media
Sales of travel products, including
special bonuses for hotel guests
Alliance with the Inuyama
campaign
Considering event measures
Hotel Indigo Inuyama
Urakuen GardenHOTEL μSTYLE
INUYAMA experience
Artist rendering
High class hotels
(lifestyle and boutique hotels)Regional experience hotels
In cooperation with the
InterContinental Hotels Group(IHG®),
we opened the first Hotel Indigo
brand location in the Chubu region.
A hotel embedded in the community
that offers guests the opportunity to
experience and deeply immerse
themselves in local history and
culture while having fun with friends
and family.
【 Scheduled opening time 】July 15, 2021
【 Scheduled opening time 】March 2022
<Inuyama’s tourism resources>
Inuyama
Festival
Kiso River
cormorant fishingNational treasure
Inuyama Castle
Copyright © Nagoya Railroad Co., Ltd.
Artist rendering

Real Estate, Transport,
and Aviation Services
remained relatively stable
even amid the pandemic.交通
Further strengthening the Real Estate business
⮚ Fostering desire for urban renewal with the aim of
enhancing the long-term value of the overall area (in
collaboration with municipalities and other partners)
⮚ Managing the development and operations of various
types of real estate (retail, office, residence, hotel,
distribution, data center, etc.)
⮚ Building organizational systems that have unified Group-
wide functions, from planning through operation
Further strengthening competitive businesses( Transport )
Strengthening our earnings power by upgrading large-
scale distribution centers
Further strengthening competitive businesses( Aviation )
⮚ Strengthening the medical airlift business
⮚ Creating services spanning the offshore wind power business,
from initial surveys to maintenance and operation
Traffic
Real Estate
Transport
<Past>
<Future>
Revising the profit structure by reinforcing earnings power in fields where
growth is expected (1)
<Current>
Aviation
To revise our profit structure,
over half of which comprises
the Traffic business, we will
reinforce the earnings power
of our non-railroad
businesses
11
Further strengthening competitive businesses, including Real Estate, Transport and Aviation business
Copyright © Nagoya Railroad Co., Ltd.

Generating profit in new fields using the Group’s management resources
① New expansion of the bakery business
Concluded an exclusive master franchise contract for Japan with
Gontran Cherrier International Limited
July 10, 2021 : Planning to open a directly managed base store
in Aoyama, Tokyo
2022 : Planning to open two more directly managed stores
in the Kanto region
2023 onward : Planning to expand franchises, especially
in Kanto, Nagoya, and Kansai
Developing new brands for the takeaway industry, especially dim sum,
congee, and Chinese food, by leveraging the expertise of Chinese
restaurant MEITETSU-SAIKAN(opened in 1969 in the city of Gotemba)
② New expansion of the restaurant business
July 10, 2021 : Planning to open the first directly managed store
in Shibuya
2022 : Planning to open two more directly managed stores
in the Kanto region
2023 onward : Planning to expand further, especially in Kanto, Nagoya,
and Kansai
日日包 - nichi nichi pao -
イメージパース
Store concept : Gontran House.
With the appearance of a maisonette with
two floors connected by a staircase, this
new type of shop is based on Gontran
Cherrier’s worldview while incorporating
traditional Japanese items that impart a
taste of Japan’s renowned hospitality.
Gontran Cherrier Store in Aoyama, Tokyo
Exterior (artist’s concept)
Interior (artist’s concept)
Example dishes (artist’s concept)
Brand concept: Like gyoza and dim sum
dishes, which can incorporate a wide
variety of ingredients, this store captures
the essence of various countries and was
designed for Japanese customers. The
food shop was opened in collaboration with
MEITETSU-SAIKAN and offers healthy
lifestyles centered around Taiwanese and
Chinese cuisine.Artist rendering
12
2-12-1 Dogenzaka,
Shibuya-ku, Tokyo
Shibuya Tokyu Food Show
10:00-21:00
(normal business hours)
Location
Business
type
A takeaway shop with a
sit-down area (7 seats)
5-51-8 Jingumae, Shibuya-ku, Tokyo
La Porte Aoyama 1st floor 2nd floor
1st floor : Bakery (Terrace with 14 seats)
1st floor : Takeaway corner(French crepe, Waffle, Soft serve ice cream)
2nd floor : Cafe (34 seats)
Opening hours 7:30-21:00 (planned)
Business
type
Location
Opening hours
Copyright © Nagoya Railroad Co., Ltd.
Revising the profit structure by reinforcing earnings power in fields where
growth is expected (2)

Offering added value to customers and
enhancing our marketing strategies
⮚ Nagoya Railroad:Promoting regional MaaS
(Meitetsu MaaS)
:Enhancing station services, such as by installing
new devices for cashless transactions and to
increase functionality
⮚ Meitetsu Group:Building and utilizing the Meitetsu
Group data integrated base
⇒Regional MaaS app
Rolling out the new Meitetsu Touch app
(tentative name) (next page)
Group transformation through DX promotion
Making operations more efficient/Reducing labor
⮚ Nagoya Railroad:Making facility maintenance
more efficient mainly by using new technology
⇒ Infrastructure security and inspections using drones
Promoting operating process reforms
⮚ Taxi:Considering making business more efficient
in part by integrating Group companies’ dispatch
systems and centers
⮚ Hotel・Bus・Taxi others:Installing industry-specific
integrated systems
13
Promoting DX (1)
By promoting DX, we aim to reform our business model with the aim of providing new services to
customers and to reform our business environment with the aim of reducing costs and achieving more
sophisticated operations.
Copyright © Nagoya Railroad Co., Ltd.

Promoting regional MaaS (Meitetsu MaaS)
14
<The Meitetsu Group’s Concept for Regional MaaS>
Aiming to realize seamless, stress-free mobility by connecting regional transit, lifestyle, and sightseeing
services for customers who routinely access the Meitetsu Group’s train lines and neighboring areas, especially
in the prefectures of Aichi and Gifu.
Promoting DX (2)
Copyright © Nagoya Railroad Co., Ltd.
Regional MaaS app ‘the new Meitetsu Touch (tentative name) ’
- More convenient and easier to use -
Railroad
Transporting passengers to retail
stores and facilities, visiting
tourist facilities, etc.
Provide seamless, stress-free mobility
Alliances with various
regional partners
Alliances with other regional MaaS
Examples of alliances
Universities and other
academic institutions
Promoting tourist visits
and excursions
Demand-based
transportation alliances
inter-site search, digital ticket,
real-time information,
Improved UI/UX, etc.TaxiBusWalking
Starting
pointDestination
Search, reserve,
pay (digital ticket)
【Phase 1】
Providing a regional
MaaS platform
【Phase 2】Services rooted in lives
& Strengthening alliances
with sightseeing facilities
Alliances
・Collaboration
Services rooted in lives in areas along our train lines・Alliances with sightseeing facilities
Local governmentsRegional companies and
organizations(traffic・services)Start-ups
Alliances with
sightseeing facilities
Alliances with
stores and restaurants
Alliances with
commercial facilities

The Meitetsu Group’s Medium-term
Management Plan 「Turn-Over 2023」Numerical Targets
02
15Copyright © Nagoya Railroad Co., Ltd.

(Billions of yen)
21.5 -17.8 3.5 11.0 14.0
5.3 2.3 4.1 4.5 5.1
14.3 10.6 7.3 7.5 11.0
0.6 -13.0 -2.4 0.1 1.1
0.3 -2.1 -1.1 -0.8 -0.5
2.6 1.9 0.2 1.0 1.8
2.8 1.7 1.1 2.0 2.6
-0.2 -0.0 0.3 -0.3 -0.1
47.3 -16.3 13.0 25.0 35.0
FY2019
results
FY2020
results
FY2021
forecast
FY2022
Plan
FY2023
Plan
Traffic
Transport
Real Estate
Leisure and Services
Distribution
Aviation Services
Others
Adjustment
Total
➢ Operating income Plan by Segment
Numerical Targets
【Business environment assumptions for the period of the medium-term management plan】
◎Railroad revenues
We assume that, compared to FY2019, profit in FY2021 will be around 80% and gradually recover to around 90% by FY2023.
◎Demand from overseas visitors We assume that, compared to FY2019, demand will be around 20% in FY2021 before recovering to around 40% in FY2022 and around 60% in FY2023.
➢ Dividend PolicyMaintain stable dividends while comprehensively considering business performance and operating environment
16Copyright © Nagoya Railroad Co., Ltd.
Reference indexes: FY2023
ROE (net income ∕ shareholders’ equity) Around 6%ROA (operating income ∕ total assets) Around 3%Net interest-bearing debt* ∕ EBITDA ratio Around 6 timesEquity ratio Around 25% over the medium to long term
Note: Net interest-bearing debt= interest-bearing debt − cash, deposits, and short-term investment securities

(Billions of yen)
3.0 8.0 4.9
12.6 7.0 -5.6
37.9 43.0 5.0
2.8 0.8 -2.0
0.7 0.2 -0.5
4.1 0.6 -3.5
0.6 0.4 -0.2
62.0 60.0 -2.0
Others 15.4 21.0 5.5
Total 178.9 190.0 11.0
Distribution 3.5 2.0 -1.5
Avation Services 13.7 17.0 3.2
Real Estate 46.9 55.0 8.0
Leisure and Services 6.4 3.0 -3.4
Traffic 60.6 66.0 5.3
Transport 32.0 26.0 -6.0
BUILD UP
2020
(FY2018-FY2020)
Turn-Over
2023
(FY2021-FY2023)
ChangeOf which
strategic
invesrments
Of which
strategic
invesrments
Of which
strategic
invesrments
➢ Investment Figures by Segment
• Structural reform of the
traffic business
• Acquisition and
development of real estate
• Upgrading large-scale
distribution centers
• DX-related
etc.
Breakdown of Strategic
Investments
Investment Plans
180.0Operational cash flows(FY2021-FY2023)
We will move ahead with strategic investments that contribute to structural business reforms
and the construction of a foundation for growth after first investing to ensure safety and
compliance while maintaining a policy of staying within the scope of operational cash flows.
Copyright © Nagoya Railroad Co., Ltd. 17

FY2020 Financial Results03
18Copyright © Nagoya Railroad Co., Ltd.
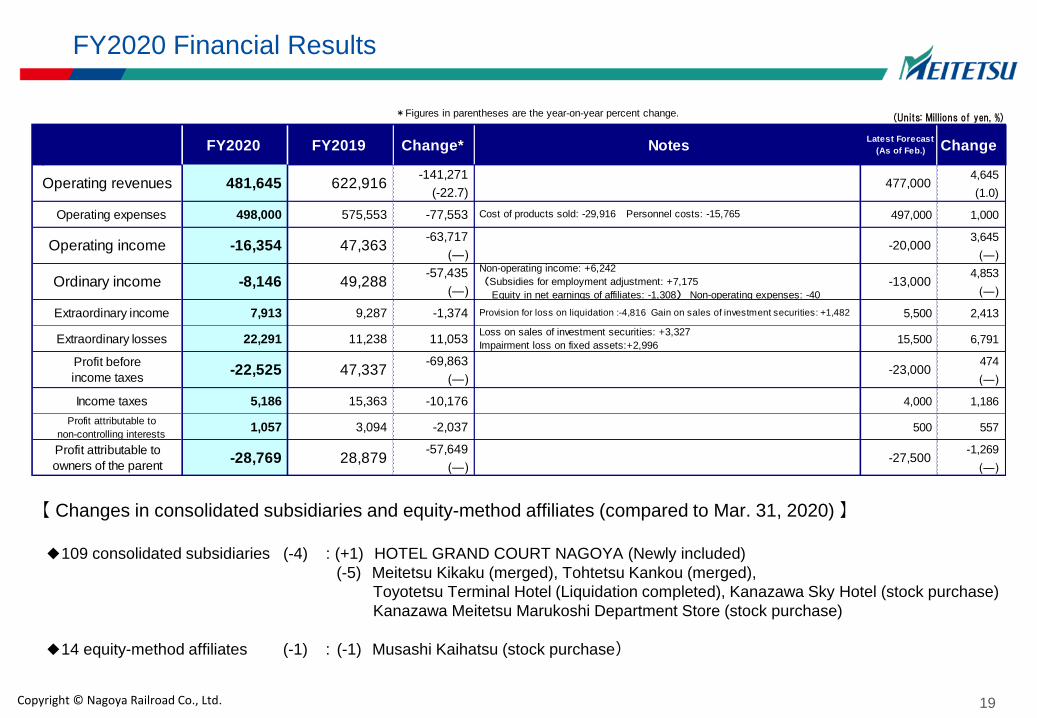
*Figures in parentheses are the year-on-year percent change. (Units: Millions of yen, %)
FY2020 FY2019 Change* Change
-141,271 4,645
(-22.7) (1.0)
Operating expenses 498,000 575,553 -77,553 497,000 1,000
-63,717 3,645
(―) (―)
-57,435 4,853
(―) (―)
Extraordinary income 7,913 9,287 -1,374 Provision for loss on liquidation :-4,816 Gain on sales of investment securities: +1,482 5,500 2,413
Extraordinary losses 22,291 11,238 11,053 15,500 6,791
-69,863 474
(―) (―)
Income taxes 5,186 15,363 -10,176 4,000 1,186
Profit attributable to
non-controlling interests1,057 3,094 -2,037 500 557
-57,649 -1,269
(―) (―)
Profit before
income taxes-22,525
Profit attributable to
owners of the parent
481,645
Ordinary income -8,146
Operating revenues
-28,769
Operating income -16,354 47,363
Cost of products sold: -29,916 Personnel costs: -15,765
47,337
622,916
-20,000
477,000
28,879
-23,000
-13,000
-27,500
Loss on sales of investment securities: +3,327
Impairment loss on fixed assets:+2,996
49,288
Latest Forecast
(As of Feb.)Notes
Non-operating income: +6,242
(Subsidies for employment adjustment: +7,175
Equity in net earnings of affiliates: -1,308) Non-operating expenses: -40
FY2020 Financial Results
【 Changes in consolidated subsidiaries and equity-method affiliates (compared to Mar. 31, 2020) 】
◆109 consolidated subsidiaries (-4) : (+1) HOTEL GRAND COURT NAGOYA (Newly included)
◆会社109社 (-5) Meitetsu Kikaku (merged), Tohtetsu Kankou (merged),
Toyotetsu Terminal Hotel (Liquidation completed), Kanazawa Sky Hotel (stock purchase)
Kanazawa Meitetsu Marukoshi Department Store (stock purchase)
◆14 equity-method affiliates (-1) : (-1) Musashi Kaihatsu (stock purchase)
19Copyright © Nagoya Railroad Co., Ltd.

Financial Results Highlights
Year-on-year:Lower revenues・Record losses
Operating Revenues:-¥141.2billion
(Unit: Billions of yen)
Operating Income: −¥63.7 billion
Real Estate : -15.4(Real Estate Condo Sales:-9.1: Units sold 1,014→754Real Estate Rental:-5.6(Lower parking revenues -2.9))
-
Traffic :-58.5(Railroad:-31.5(Passengers-24.8%:Commuters-17.6% Non-commuters-40.3%)Bus:-16.7 Taxi:-10.3)
-
Net Profit: −¥57.6 billion
Ordinary Income:−¥57.4 billion
An operating loss, despite improvement in non-operating income due to subsidies for employment adjustment.(Improved non-operating income +6.2)
A net loss due to the ordinary loss as well as worsened extraordinary income due in part todecrease of reversal of provision for loss on liquidation and increase of impairment loss on fixes assets.(Worsened extraordinary income-12.4)
Distribution : -29.2(Department Stores:-18.7 Other goods sold:-10.7)-
Leisure and Services :-30.1(Hotel:-11.8 Travel:-10.1 Tourist Facilities:-8.3)-
Traffic : -39.4(Railroad:-26.3 Bus:-8.8 Taxi:-4.1)-
Leisure and Services : -13.6(Travel:-6.1 Hotel:-5.3 Tourist Facilities:-2.1)-
Real Estate : -3.6(Real Estate Rental:-3.0 Real Estate Condo Sales:-0.6)-
Operating expenses:-¥77.5billion
Cost of products sold -29.9(Distribution :-22.0 Real Estate :-7.8)-
Personnel costs -15.7(Traffic :-9.4 Leisure and Services :-4.1)-
Compared with forecast (from February):Higher revenues・lower net profit
Operating Income: +¥3.6 billion
Net Profit: −¥1.2 billion
Ordinary Income:+¥4.8 billion
Higher operating income and improve non-operating income. +1.2
Extraordinary loss worsened due mainly to an increase in impairment loss on fixes assets. -4.3
Aviation Services +1.2 Truck +0.6+
Operating Revenues:+¥4.6billion Truck +1.3 Aviation Services +0.8+
(Unit: Billions of yen)
20Copyright © Nagoya Railroad Co., Ltd.
( Revenues decreased in all segments due to the COVID-19 pandemic. Profit decreased in all segments, a loss in the Traffic, Leisure and services, Distribution.)
(Revenues were higher due in part to higher revenues from the truck business.Operating and ordinary losses saw account balances improve. Net loss worsened due to an increase in extraordinary loss.)

Operating Results by Segment
All segments Decreased<Year-on-year comparisons>
All segments Decreased
Real Estate, Transport, Aviation Services, Others Secured surplusTraffic, Leisure and Services, Distribution Recorded losses
【 Operating Revenues 】
【 Operating Income 】
21
(Units: Millions of yen, %)(単位:百万円、%)
Operating revenues FY2020 FY2019 Change Percent Change
Traffic 104,995 163,544 -58,549 -35.8
Transport 128,901 138,220 -9,318 -6.7
Real Estate 85,402 100,869 -15,466 -15.3
Leisure and Services 20,007 50,137 -30,130 -60.1
Distribution 111,272 140,538 -29,265 -20.8
Aviation Services 22,983 27,251 -4,268 -15.7
Others 45,862 52,123 -6,261 -12.0
Adjustment -37,779 -49,769 11,990 ―
Total 481,645 622,916 -141,271 -22.7
Operating income FY2020 FY2019 Change Percent Change
Traffic -17,866 21,577 -39,443 ―
Transport 2,350 5,342 -2,992 -56.0
Real Estate 10,667 14,309 -3,641 -25.5
Leisure and Services -13,008 611 -13,620 ―
Distribution -2,185 330 -2,515 ―
Aviation Services 1,959 2,616 -657 -25.1
Others 1,752 2,854 -1,101 -38.6
Adjustment -24 -279 254 ―
Total -16,354 47,363 -63,717 ―
Copyright © Nagoya Railroad Co., Ltd.

(Units: Millions of yen, %)
FY2020 FY2019
26,907 49,845 -46.0
Work commuters 27,709 32,947 -15.9
School commuters 4,913 7,249 -32.2
32,622 40,196 -18.8
59,530 90,042 -33.9Note: Non-commuter traveler revenues include fares for first-class cars.
Traveler Revenues
Non-commuters
Percent
Change
Commuters
Total
(Units: Millions of yen, %)
FY2020 FY2019 ChangePercent
ChangeFY2020 FY2019 Change
Percent
Change
Railroad 64,935 96,496 -31,560 -32.7 -7,978 18,413 -26,391 ―
Bus 26,593 43,336 -16,742 -38.6 -6,350 2,527 -8,877 ―
Taxi 15,804 26,154 -10,349 -39.6 -3,716 478 -4,195 ―
Adjustment -2,339 -2,441 102 ― 178 157 20 ―
Traffic Total 104,995 163,544 -58,549 -35.8 -17,866 21,577 -39,443 ―
Operating revenues Operating income
Traffic Business
◆ Breakdown of Traffic Business ◆
<Nagoya Railroad, Transportation Results>
22
(Units: Millions of yen, %)
FY2020 FY2019 ChangePercent
ChangeNotes
Operating
revenues104,995 163,544 -58,549 -35.8
Lower revenues in all businesses due to
efforts to stay home caused by the COVID-
19 pandemic
Operating
income-17,866 21,577 -39,443 ― Loss due to lower revenues
Copyright © Nagoya Railroad Co., Ltd.
(Units: Millions of yen, %) (Units: Thousands of people, %)
FY2020 FY2019
75,035 125,622 -40.3
Work commuters 144,692 167,113 -13.4
School commuters 76,508 101,417 -24.6
221,200 268,530 -17.6
296,235 394,152 -24.8
PassengersPercent
Change
Non-commuters
Commuters
Total

(Units: Millions of yen, %)
FY2020 FY2019 ChangePercent
ChangeFY2020 FY2019 Change
Percent
Change
Truck 149,776 158,125 -8,349 -5.3 3,591 4,762 -1,170 -24.6
Maritime Transport 12,655 16,342 -3,686 -22.6 -1,307 525 -1,832 ―
Adjustment -33,530 -36,248 2,717 ― 66 55 11 ―
Transport Total 128,901 138,220 -9,318 -6.7 2,350 5,342 -2,992 -56.0
Operating revenues Operating income
(Units: Millions of yen, %)
FY2020 FY2019 ChangePercent
ChangeNotes
Operating
revenues128,901 138,220 -9,318 -6.7
Lower revenues in all sub-segments due in
part to decrease in cargo handling volumes
caused by the COVID-19 pandemic
Operating
income2,350 5,342 -2,992 -56.0
Lower income in the Truck Business and a
loss in the Maritime Transport Business
due to lower revenues
Transport Business
◆ Breakdown of Transport Business ◆
23Copyright © Nagoya Railroad Co., Ltd.

Real Estate Business
◆ Breakdown of Real Estate Business ◆
<Number of Meitetsu Real Estate Condo Sales> <Number of Parking Spaces and Lots Owned
by Meitetsu Kyosho Group>
24Copyright © Nagoya Railroad Co., Ltd.
(Units: Millions of yen, %)
FY2020 FY2019 ChangePercent
Change FY2020 FY2019 ChangePercent
Change
Real EstateRental 43,246 48,940 -5,694 -11.6 5,775 8,822 -3,046 -34.5
Real EstateCondo Sales 35,422 44,606 -9,184 -20.6 2,293 2,956 -662 -22.4
Real EstateManagement 14,551 15,181 -630 -4.2 393 582 -188 -32.4
Adjustment -7,816 -7,859 42 ― 2,204 1,947 256 ―
Real Estate Total 85,402 100,869 -15,466 -15.3 10,667 14,309 -3,641 -25.5
Operating revenues Operating income
(Units: Units sold, %)
FY2020 FY2019Percent
Change
754 1,014 -25.6
158 243 -35.0
468 591 -20.8
128 180 -28.9
Number of condos sold (total)
Nagoya
Tokyo
Osaka
(Units: %)
FY2020 FY2019Percent
Change
Owned Spaces 84,651 81,357 4.0
Owned Lots 4,059 4,079 -0.5
(Units: Millions of yen, %)
FY2020 FY2019 ChangePercent
ChangeNotes
Operating
revenues85,402 100,869 -15,466 -15.3
Lower revenues in all businesses due in
part to lower number of condos sold and
due in part to decreased parking space
revernue in the Rental
Operating
income10,667 14,309 -3,641 -25.5 Lower income due to lower revenues

(Units: Millions of yen, %)
FY2020 FY2019 ChangePercent
ChangeFY2020 FY2019 Change
Percent
Change
Hotel 5,912 17,727 -11,815 -66.6 -4,738 570 -5,309 ―
Tourist Facilities 10,821 19,162 -8,341 -43.5 -2,013 99 -2,113 ―
Travel 3,732 13,907 -10,174 -73.2 -6,258 -75 -6,183 ―
Adjustment -459 -659 200 ― 2 16 -13 ―
Leisure and
Services Total20,007 50,137 -30,130 -60.1 -13,008 611 -13,620 ―
Operating revenues Operating income
(Units: Millions of yen, %)
FY2020 FY2019 ChangePercent
ChangeNotes
Operating
revenues20,007 50,137 -30,130 -60.1
Lower revenues in all sub-segments due to
the decrease in tourism demand caused
by the COVID-19 pandemic
Operating
income-13,008 611 -13,620 ―
The Hotel and Tourist Facilities businesses
recorded losses, and the Travel Business
recorded wider losses, due to decreases in
revenues
Leisure and Services Business
◆ Breakdown of Leisure and Services Business ◆
< Occupancy Rates and Lodging Prices at Main Group Hotels within Nagoya City>
(1)Occupancy rate (2) Lodging price
25Copyright © Nagoya Railroad Co., Ltd.

Distribution Business
◆ Breakdown of Distribution Business ◆
26Copyright © Nagoya Railroad Co., Ltd.
(Units: Millions of yen, %)
FY2020 FY2019 ChangePercent
ChangeNotes
Operating
revenues111,272 140,538 -29,265 -20.8
Lower revenues in all sub-segments due to
efforts to stay at home and temporary
department store closures caused by the
COVID-19 pandemic
Operating
income-2,185 330 -2,515 ―
The Department Stores Business recorded
wider losses, and the Other goods sold
recorded losses, due to decreases in
revenues
(Units: Millions of yen, %)
FY2020 FY2019 ChangePercent
ChangeFY2020 FY2019 Change
Percent
Change
Department Stores 43,048 61,832 -18,783 -30.4 -2,389 -568 -1,820 ―
Other goods sold 69,199 79,957 -10,758 -13.5 204 750 -545 -72.8
Adjustment -975 -1,252 276 ― 0 149 -148 ―
Distribution Total 111,272 140,538 -29,265 -20.8 -2,185 330 -2,515 ―
Operating revenues Operating income

(Units: Millions of yen, %)
FY2020 FY2019 ChangePercent
ChangeFY2020 FY2019 Change
Percent
Change
Aviation Services 23,334 27,650 -4,315 -15.6 1,952 2,609 -657 -25.2
Adjustment -351 -398 47 ― 7 7 -0 ―
Aviation Services Total 22,983 27,251 -4,268 -15.7 1,959 2,616 -657 -25.1
Operating revenues Operating income
Aviation Services Business
◆ Breakdown of Aviation Services Business ◆
27Copyright © Nagoya Railroad Co., Ltd.
(Units: Millions of yen, %)
FY2020 FY2019 ChangePercent
ChangeNotes
Operating
revenues22,983 27,251 -4,268 -15.7
Lower revenues due to decreased orders
received in the In-Flight Catering Business
caused by the COVID-19 pandemic
Operating
income1,959 2,616 -657 -25.1 Lower income due to lower revenues

Others
◆ Breakdown of Others ◆
28Copyright © Nagoya Railroad Co., Ltd.
(Units: Millions of yen, %)
FY2020 FY2019 ChangePercent
ChangeNotes
Operating
revenues45,862 52,123 -6,261 -12.0
Lower revenues due to decreased orders
received caused by the COVID-19
pandemic
Operating
income1,752 2,854 -1,101 -38.6 Lower income due to lower revenues
(Units: Millions of yen, %)
FY2020 FY2019 ChangePercent
ChangeFY2020 FY2019 Change
Percent
Change
Equipment
Maintenance 25,807 30,973 -5,165 -16.7 1,041 2,003 -962 -48.0
Others 20,674 22,030 -1,356 -6.2 702 838 -136 -16.3
Adjustment -619 -879 260 ― 8 12 -3 ―
Others Total 45,862 52,123 -6,261 -12.0 1,752 2,854 -1,101 -38.6
Operating revenues Operating income

(Units: Millions of yen)
FY2020 FY2019 Change Notes
12,626 6,384 6,242
Interest income 25 25 -0
Dividend income 1,259 1,889 -629Equity in net earnings of affiliates 1,253 2,562 -1,308
Others 10,089 1,907 8,181 (FY2020)Subsidies for employment adjustment, etc.
4,418 4,459 -40
Interest expenses 3,231 3,245 -13Provision for loss on liquidation 122 553 -430
Others 1,064 660 403
8,207 1,925 6,282
7,913 9,287 -1,374Gain on contributions for
construction 4,378 2,018 2,360 (FY2020)Building train stations on bridges, etc.
Gain on sales of investment
securities 2,520 1,038 1,482 (FY2020)Listed shares
Reversal of provision for loss on
liquidation ― 4,816 -4,816(FY2019)Provision to demolish buildings for the redevelopment of
the area surrounding Meitetsu Nagoya Station
Others 1,014 1,415 -400
22,291 11,238 11,053Impairment loss on f ixed assets 9,334 6,338 2,996 (FY2020)Hotel, Tourist facilities
Loss on reduction of property and equipment 3,941 1,770 2,171 (FY2020)Building train stations on bridges, etc.
Loss on sales of investment securities: 3,327 ― 3,327 (FY2020)Shares of affiliate companies, etc.
Provision for loss on liquidation 1,758 276 1,482 (FY2020) Provision to demolish the Jingū-mae Station West Building
Others 3,928 2,853 1,075 (FY2020)Extraordinary loss due to closing and other
-14,378 -1,950 -12,427
Extraordinary losses
Total extraordinary income
Non-operating income
Non-operating expenses
Total non-operating income
Extraordinary income
Non-Operating Income and Extraordinary Income
29Copyright © Nagoya Railroad Co., Ltd.

(Units: Millions of yen)
Notes
215,097 189,143 25,954 Increase in cash and deposits due to financing
976,033 975,836 197
Property and equipment 831,429 831,771 -342
Intangible assets 9,222 10,002 -779
Investments and other assets 135,382 134,062 1,319Higher investment securities due to a fall in the fair value of
owned shares
1,191,131 1,164,979 26,151
281,782 262,787 18,994 Higher current portion of bonds payable
501,836 463,790 38,046 Higher bonds payable
783,619 726,577 57,041
407,512 438,401 -30,889Stockholders' equity -34,550
Profit attributable to owners of the parent -28,769
Allocation of retained earnings -4,917
1,191,131 1,164,979 26,151
484,169 423,376 60,792 Reference: Net interest-bearing debt 430,149 (vs. March 31, 2020 +39,475)
Change
Current assets
FY2020 FY2019
Total assets
Non-current assets
Total liabilities and net assets
Consolidated interest-bearing debt
Current liabilities
Non-current
liabilities
Total liabilities
Total net assets
Consolidated Balance Sheets
30Copyright © Nagoya Railroad Co., Ltd.

(Units: Millions of yen)(単位:百万円)
Operating income -17,866 21,577 -39,443 Operating income -2,185 330 -2,515
Depreciation and
amortization18,351 18,577 -226
Depreciation and
amortization1,185 2,384 -1,199
EBITDA(①) 485 40,155 -39,669 EBITDA(①) -999 2,715 -3,715
Capital
investment(②)16,869 24,706 -7,837
Capital
investment(②)786 2,239 -1,453
Deduction (①-②) -16,384 15,448 -31,832 Deduction (①-②) -1,786 475 -2,261
Operating income 2,350 5,342 -2,992 Operating income 1,959 2,616 -657
Depreciation and
amortization6,985 6,873 112
Depreciation and
amortization2,279 2,689 -409
EBITDA(①) 9,335 12,215 -2,879 EBITDA(①) 4,239 5,306 -1,066
Capital
investment(②)8,788 10,566 -1,778
Capital
investment(②)4,920 5,827 -906
Deduction (①-②) 547 1,649 -1,101 Deduction (①-②) -681 -521 -159
Operating income 10,667 14,309 -3,641 Operating income 1,752 2,854 -1,101
Depreciation and
amortization6,013 6,483 -470
Depreciation and
amortization3,710 3,547 163
EBITDA(①) 16,680 20,793 -4,112 EBITDA(①) 5,463 6,401 -938
Capital
investment(②)11,037 19,897 -8,860
Capital
investment(②)3,911 6,499 -2,587
Deduction (①-②) 5,643 895 4,748 Deduction (①-②) 1,551 -97 1,649
Operating income -13,008 611 -13,620 Operating income -16,354 47,363 -63,717
Depreciation and
amortization1,233 1,120 113
Depreciation and
amortization39,351 41,239 -1,887
EBITDA(①) -11,775 1,731 -13,506 EBIRDA(①) 22,996 88,602 -65,605
Capital
investment(②)1,623 3,548 -1,925
Capital
investment(②)47,937 73,286 -25,348
Deduction (①-②) -13,398 -1,817 -11,581 Deduction (①-②) -24,940 15,316 -40,256
Note: EBITDA = Operating income + Depreciation and amortization FY2020 Main Capital Investments
Traffic Business ・・・New railroad car construction and
railroad elevation construction
Transport Business ・・・Acquisition of truck vehicles
Real Estate Business ・・・Development and acquisition of rental
propertiesand Hotel constraction
FY2020 FY2019
Real Estate Others
Total (after
consolidated
adjustment)
Leisure and
Services
Change
Traffic Distribution
TransportAviation
Services
FY2020 FY2019 Change
EBITDA and Capital Investment
9500・9100 series train
31Copyright © Nagoya Railroad Co., Ltd.

FY2021 Operating Results Forecast04
32Copyright © Nagoya Railroad Co., Ltd.

Operating Revenues(Compares with FY2019)
Traffic Railroad ・ Bus ・ Taxi…Around 80%
Transport Truck ・ Maritime Transport…Around 90%
Real Estate Real Estate Rental…Around 90%, Real Estate Condo Sales…Around 80%,
Real Estate Management…On par with FY2019
Leisure and
Services
Hotel…Around 70%, Tourist Facilities…Around 90%, Travel…Around 50 to 60%
Distribution Department Stores…Around 80%, Other goods sold…Around 80 to 90%
Aviation
Services
Around 80% (In-Flight Catering Business accounts for around 20% to 30%)
Others Around 90%
Premise conditions of Operating Results Forecast
The FY2021 forecast assumes that the number of COVID-19 cases will gradually decline into March 2022.
33Copyright © Nagoya Railroad Co., Ltd.

(Units: Millions of yen)
FY2020
results
FY2019
results
530,000 481,645 48,355 10.0 622,916 -92,916 -14.9
13,000 -16,354 29,354 ― 47,363 -34,363 -72.6
Non-operating income 7,000 12,626 -5,626 6,384 616
Non-operating expenses 4,000 4,418 -418 4,459 -459
16,000 -8,146 24,146 ― 49,288 -33,288 -67.5
Extraordinary income 23,000 7,913 15,087 9,287 13,713
Extraordinary losses 22,000 22,291 -291 11,238 10,762
11,000 -28,769 39,769 ― 28,879 -17,879 -61.9
52,500 22,996 29,504 128.3 88,602 -36,102 -40.7
65,700 47,937 17,763 37.1 73,286 -7,586 -10.4
39,500 39,351 149 0.4 41,239 -1,739 -4.2
450,000 430,149 19,851 4.6 390,673 59,327 15.2
ChangePercentChange
Net interest-bearing debt
Depreciation and
amortization
E B I T D A
Operating income
Operating revenues
Ordinary income
Profit attributable to
owners of the parent
Capital investment
FY2021
forecastChange
Percent
Change
FY2021 Consolidated Operating Results Forecast
The FY2021 forecast assumes that the number of COVID-19 cases will gradually decline into March 2022. Regarding operating revenues,
although we anticipate a decline in the Distribution business, overall operating revenues is expected to increase due mainly to a recovery
in the Leisure and Services business and the Transport business. Operating income is expected to return to the black due to higher
revenues. Reflecting this, ordinary income is also expected to return to the black. We forecast an improvement in extraordinary loss and
net income to return to the black.
※From FY2021, we apply “Accounting Standards Related to Profit Recognition” (Corporate Accounting Standard No. 29).
The figures for the consolidated business forecasts presented above are figures after applying said accounting standards.
The effect of this change on overall consolidated results is minimal.34Copyright © Nagoya Railroad Co., Ltd.

Operating Results Forecast Highlights①(Year-on-year)
Year-on-year:Higher revenues and profit
Operating Revenues+¥48.3 billion
(Unit: Billions of yen)
Operating Income+¥29.3 billion
Real Estate +2.0(Real Estate Rental:+3.5(Higher parking space revenues +2.0)The effects of the new profit recognition standards-1.8)
+
Traffic +27.8(Railroad +14.0 Bus +7.5 Taxi +5.5 The effects of the new profit recognition standards+0.8)+
Net Profit+¥39.7 billion
Ordinary Income+¥24.1 billion
Although we expect non-operating income to worsen due in part to a decrease in subsidies for employment adjustment, account balances should improve because of operating income returning to the black. (Worsen non-operating income-5.2)
Extraordinary loss is expected to improve due mainly to a decrease in impairment loss on fixes assets as it returns to normal and ordinary income returning to the black. (Improve extraordinary income+15.3)
Distribution +1.0(Department Stores +0.6 Other goods sold +0.4)+
Leisure and Services +58.2(Hotel +9.0 Tourist Facilities +5.5 Travel +4.5The effects of the new profit recognition standards+39.2)
+
Distribution -44.8(Department Stores -2.0(Assignment of Kanazawa Meitetsu Marukoshi Department Store -9.2)Other goods sold +5.5 The effects of the new profit recognition standards-48.4)
-
Traffic +21.3(Railroad +12.0 Bus +6.0 Taxi +3.0)+
Leisure and Services +10.6(Travel +5.6 Hotel +3.0 Tourist Facilities +1.8)+
Transport +1.7(Maritime Transport +1.5 Truck +0.2)+
Real Estate -3.3(Real Estate Condo Sales -2.7)-
Transport +4.6(Maritime Transport +2.4 Truck +2.2)+(The effects of the new profit recognition standards -0.9billion)
35
(Recovery centered on Leisure and Service and Traffic, overall sales increased. We expect each category of income will return to the black due to higher revenues.)
Copyright © Nagoya Railroad Co., Ltd.

Operating Results Forecast Highlights②(Compared with FY2019)
Compared with FY2019:Lower revenues and lower profit
Operating Revenues-¥92.9billion
(Unit: Billions of yen)
Operating Income-¥34.3billion
Real Estate -13.3(Real Estate Condo Sales -9.0 Real Estate Rental -2.0The effects of the new profit recognition standards -1.8)
-
Traffic -30.7(Railroad -17.5 Bus - 9.0 Taxi -5.0 The effects of the new profit recognition standards+0.8)-
Net Profit-¥17.8billion
Ordinary Income-¥33.2billion Although non-operating income is expected to improve, it will decrease due to a decrease in operating income.
(Improve non-operating income +1.0)
Extraordinary income is expected to improve, but ordinary income will decrease.( Improve extraordinary income +2.9)
Leisure and Services +28.1(Travel -5.6 Tourist Facilities -2.7 Hotel -2.7The effects of the new profit recognition standards+39.2)
+
Distribution -74.1(Department Stores -20.0(Assignment of Kanazawa Meitetsu Marukoshi Department Store -12.0)Other goods sold -5.7 The effects of the new profit recognition standards-48.4)
-
Traffic -18.0(Railroad -14.3 Bus -2.7 Taxi -1.0)-
Leisure and Services -3.0(Hotel -2.2 Travel -0.5 Tourist Facilities -0.2)-
Aviation Services -2.4(Lower income due to lower revenues)-
Real Estate -7.0(Real Estate Rental -3.5 Real Estate Condo Sales -3.1)-
Transport -4.6(Truck -3.4 Maritime Transport -1.2)-
(The effects of the new profit recognition standards -¥0.9billion)
36Copyright © Nagoya Railroad Co., Ltd.
(After excluding the effects of the new profit recognition standards, revenues are expected to fall across all businesses. Each category of income is expected to decrease due to the decrease in revenues. )

(Units: Millions of yen, %)
Operating revenuesFY2021
forecast
FY2021
forecast*
FY2020
resultsChange
Percent
Change
Percent
Change*
FY2019
resultsChange
Percent
Change
Percent
Change*
Traffic 132,800 132,000 104,995 27,805 26.5 25.7 163,544 -30,744 -18.8 -19.3
Transport 133,600 133,600 128,901 4,699 3.6 3.6 138,220 -4,620 -3.3 -3.3
Real Estate 87,500 89,300 85,402 2,098 2.5 4.6 100,869 -13,369 -13.3 -11.5
Leisure and Services 78,300 39,100 20,007 58,293 291.4 95.4 50,137 28,163 56.2 -22.0
Distribution 66,400 114,800 111,272 -44,872 -40.3 3.2 140,538 -74,138 -52.8 -18.3
Aviation Services 22,800 22,800 22,983 -183 -0.8 -0.8 27,251 -4,451 -16.3 -16.3
Others 46,800 46,800 45,862 938 2.0 2.0 52,123 -5,323 -10.2 -10.2
Adjustment -38,200 -47,500 -37,779 -421 ― ― -49,769 11,569 ― ―
Total 530,000 530,900 481,645 48,355 10.0 10.2 622,916 -92,916 -14.9 -14.8
Operating incomeFY2021
forecast
FY2021
forecast*
FY2020
resultsChange
Percent
Change
Percent
Change*
FY2019
resultsChange
Percent
Change
Percent
Change*
Traffic 3,500 -17,866 21,366 ― 21,577 -18,077 -83.8
Transport 4,100 2,350 1,750 74.4 5,342 -1,242 -23.3
Real Estate 7,300 10,667 -3,367 -31.6 14,309 -7,009 -49.0
Leisure and Services -2,400 -13,008 10,608 ― 611 -3,011 ―
Distribution -1,100 -2,185 1,085 ― 330 -1,430 ―
Aviation Services 200 1,959 -1,759 -89.8 2,616 -2,416 -92.4
Others 1,100 1,752 -652 -37.2 2,854 -1,754 -61.5
Adjustment 300 -24 324 ― -279 579 ―
Total 13,000 -16,354 29,354 ― 47,363 -34,363 -72.6
Note: *Exclusion the effects of the new profit recognition standards.
FY2021 Operating Results Forecast by Segment
37Copyright © Nagoya Railroad Co., Ltd.

FY2021 EBITDA and Capital Investment Forecast
38Copyright © Nagoya Railroad Co., Ltd.
(Units: Millions of yen)
Operating income 3,500 -17,866 21,366 21,577 -18,077 Operating income -1,100 -2,185 1,085 330 -1,430
Depreciation and
amortization 18,200 18,351 -151 18,577 -377Depreciation and
amortization 1,100 1,185 -85 2,384 -1,284
EBITDA(①) 21,700 485 21,215 40,155 -18,455 EBITDA(①) 0 -999 999 2,715 -2,715
Capital
investment(②) 20,000 16,869 3,131 24,706 -4,706Capital
investment(②) 1,300 786 514 2,239 -939
Deduction (①-②) 1,700 -16,384 18,084 15,448 -13,748 Deduction (①-②) -1,300 -1,786 486 475 -1,775
Operating income 4,100 2,350 1,750 5,342 -1,242 Operating income 200 1,959 -1,759 2,616 -2,416
Depreciation and
amortization 7,400 6,985 415 6,873 527Depreciation and
amortization 2,700 2,279 421 2,689 11
EBITDA(①) 11,500 9,335 2,165 12,215 -715 EBITDA(①) 2,900 4,239 -1,339 5,306 -2,406
Capital
investment(②) 8,000 8,788 -788 10,566 -2,566Capital
investment(②) 5,900 4,920 980 5,827 73
Deduction (①-②) 3,500 547 2,953 1,649 1,851 Deduction (①-②) -3,000 -681 -2,319 -521 -2,479
Operating income 7,300 10,667 -3,367 14,309 -7,009 Operating income 1,100 1,752 -652 2,854 -1,754
Depreciation and
amortization 5,800 6,013 -213 6,483 -683Depreciation and
amortization 3,800 3,710 90 3,547 253
EBITDA(①) 13,100 16,680 -3,580 20,793 -7,693 EBITDA(①) 4,900 5,463 -563 6,401 -1,501
Capital
investment(②) 22,000 11,037 10,963 19,897 2,103Capital
investment(②) 7,300 3,911 3,389 6,499 801
Deduction (①-②) -8,900 5,643 -14,543 895 -9,795 Deduction (①-②) -2,400 1,551 -3,951 -97 -2,303
Operating income -2,400 -13,008 10,608 611 -3,011 Operating income 13,000 -16,354 29,354 47,363 -34,363
Depreciation and
amortization 1,000 1,233 -233 1,120 -120Depreciation and
amortization 39,500 39,351 149 41,239 -1,739
EBITDA(①) -1,400 -11,775 10,375 1,731 -3,131 EBITDA(①) 52,500 22,996 29,504 88,602 -36,102
Capital
investment(②) 1,200 1,623 -423 3,548 -2,348Capital
investment(②) 65,700 47,937 17,763 73,286 -7,586
Deduction (①-②) -2,600 -13,398 10,798 -1,817 -783 Deduction (①-②) -13,200 -24,940 11,740 15,316 -28,516
Note: EBITDA = Operating income + Depreciation and amortization
FY2019
resultsChangeChange
Traffic Distribution
FY2021
forecast
Real Estate Others
Leisure and
Services
Total (after
consolidated
adjustment)
FY2020
results
TransportAviation
Services
FY2021
forecast
FY2020
resultsChange
FY2019
resultsChange

Copyright © Nagoya Railroad Co., Ltd.
In addition to factual past events, this document includes future projections, which contain risks and uncertainty.
Please be advised that actual outcomes may vary based on a variety of factors.


![Consolidated Financial Results for the Fiscal Year Ended ...Note: Comprehensive income Fiscal year ended March 31, 2019: ¥1,761 million [24.3%] Fiscal year ended March 31, 2018: ¥1,417](https://static.fdocuments.net/doc/165x107/5fe4d06806b4775830253106/consolidated-financial-results-for-the-fiscal-year-ended-note-comprehensive.jpg)