Fiscal Year 2018 Congressional Budget Justification … THIS REPORT . The Congressional Budget...
131
U.S. SECURITIES AND EXCHANGE COMMISSION FISCAL YEAR 2018 Congressional Budget Justifcation Annual Performance Plan Annual Performance Report FISC AL YEAR 2016
Transcript of Fiscal Year 2018 Congressional Budget Justification … THIS REPORT . The Congressional Budget...
U . S . S E C U R I T I E S A N D E XC H A N G E C O M M I S S I O N
F I SCAL Y EAR 2 0 1 8
Congressional Budget Justification
Annual Performance Plan
Annual Performance Report F I SC A L Y EAR 2 0 1 6
Contents
Agency and Mission Information.................................................................................................................................1
Executive Summary.............................................................................................................................................................. 3
Mission, Vision, Values, and Goals..............................................................................................................................5
History and Purpose ............................................................................................................................................................. 7
Organizational Structure and Resources ..............................................................................................................8
FY 2018 Budget Request Tables ...............................................................................................................................11
Full-Time Equivalents (FTE) and Positions by Program...........................................................................13
Obligations by Object Class..........................................................................................................................................14
Strategic Goal and Program..........................................................................................................................................15
Summary of Changes ........................................................................................................................................................16
FY 2018 Appropriations Language.......................................................................................................................... 17
FY 2016 Annual Performance Report (APR) and FY 2018 Annual Performance Plan (APP)............................................................................................................ 19
A Reader’s Guide to SEC Performance Information ...................................................................................21
FY 2016 APR and FY 2018 APP Summary...........................................................................................................21
Performance Summary by Strategic Goal and Strategic Objective ...............................................22
Strategic Goal 1: Establish and Maintain an Effective Regulatory Environment...........22
Strategic Goal 2: Foster and Enforce Compliance with Federal Securities Laws................................................................................................. 29
Strategic Goal 3: Facilitate Access to the Information Investors Need to Make Informed Investment Decisions ...............................................................40
Strategic Goal 4: Enhance the Commission’s Performance through Effective Alignment and Management of Human, Information, and Financial Capital.......................................................................... 45
FY 2018 Budget Request by Program...................................................................................................................53
Other Information...............................................................................................................................................................97
Risks, Internal Controls, and Management Challenges..........................................................................99
Cross-Agency Collaboration .....................................................................................................................................103
Evidence Building............................................................................................................................................................. 106
Hyperlinks to Other Information and Resources ......................................................................................107
Appendices......................................................................................................................................................................... 109
Appendix A: SEC Divisions and Offices .............................................................................................................. 111
Appendix B: Verification and Validation of Performance Data..........................................................114
Appendix C: SEC’s Responses to Government Accountability Office Reports....................115
ABOUT THIS REPORT The Congressional Budget Justification (CBJ) is the annual presentation to Congress that justifies the U.S. Securities and Exchange Commission’s (SEC) budget request. This report also includes the Annual Performance Plan (APP) for fiscal year (FY) 2018 and the Annual Performance Report (APR) for FY 2016, focusing on the agency’s strategic goals and performance results. This report provides information that satisfies requirements contained in the following laws and regulations listed below.• GPRA Modernization Act of 2010• Office of Management and Budget Circular A-11, Preparation, Submission,
and Execution of the Budget• Government Management Reform Act of 1994• Reports Consolidation Act of 2000• Office of Management and Budget Circular A-136, Financial Reporting Requirements
An electronic version of this document and its components is available at www.sec.gov/about/offices/ofm/ofm-documents.htm. To comment on the SEC’s FY 2018 CBJ and APP and FY 2016 APR, email [email protected].
Agency and Mission Information
Executive Summary ............................................................................................................................................................3
Mission, Vision, Values, and Goals..........................................................................................................................5
History and Purpose ...........................................................................................................................................................7
Organizational Structure and Resources ..........................................................................................................8

AGENCY AND MISSION INFORMATION | 3
Executive Summary
The U.S. Securities and Exchange Commission (SEC) is pleased to submit its budget request for fiscal year (FY) 2018. The SEC is requesting $1.602 billion in support of 4,543 positions and 4,542 full-time equivalents (FTE) for FY 2018. This requested budget level is essentially flat compared to the FY 2017 level and contemplates continued access to the Commission’s Reserve Fund to fund long-term capital investments in information technology.
The SEC remains steadfastly devoted to our core mission—protecting investors, maintaining fair and orderly markets, and facilitating capital formation—which is the foundation of everything we do. With the exceptional work and commitment of our dedicated staff, the SEC will continue striving to maintain and expand an environment conducive to capital formation while ensuring investor protection.
As markets have evolved—including as a result of innovation, technology, and globalization—the SEC’s responsibilities have continued to grow and become more complex. Currently, the SEC is charged with overseeing over 26,000 market participants, which includes approximately 12,000 investment advisers, approximately 10,000 mutual funds and exchange traded funds, over 4,000 broker-dealers, over 650 mutual advisors, and 400 transfer agents. The agency also oversees 21 national securities exchanges, 10 credit rating agencies, and seven active registered clearing agencies, as well as the Public Company Accounting Oversight Board (PCAOB), Financial Industry Regulatory Authority (FINRA), Municipal Securities Rulemaking Board (MSRB), the Securities
Investor Protection Corporation (SIPC), and the Financial Accounting Standards Board (FASB). In addition, the SEC is responsible for selectively reviewing the disclosures and financial statements of over 8,800 reporting companies. Of the top 100 public companies in the world, 77 fall under the SEC’s reporting requirements.
The FY 2018 request will seek to solidify and maintain progress in key areas, including:
• Using leading technologies to support our economic and risk analysis functions and permit the SEC to better keep pace with the entities and markets we regulate;
• Promoting firms’ access to the capital markets to generate economic growth while maintaining investor protection;
• Maintaining our enforcement program’s investigative and litigation capabilities to swiftly and effectively pursue wrongdoing, especially retail fraud; and
• Continuing a risk-based focus on examinations of investment advisers and other key entities who interact with retail and institutional investors.
We believe this budget provides sufficient funding to continue meeting our important mission, even in the midst of difficult fiscal realities. Within this overall level, the agency will reallocate funds in order to accommodate some necessary cost increases by identifying offsetting savings. As part of this effort, the SEC will maintain an agency-wide hiring freeze with very limited exceptions for critical positions. We will also accelerate and expand our ongoing efforts to find efficiencies throughout our operations.
The SEC has made progress in modernizing its technology systems, with the benefits of streamlining operations, increasing our use of data analytics, and increasing the effectiveness of its programs. The agency aims to continue this progress with the help of the SEC’s Reserve Fund, which has been critically important in our efforts to keep pace with the rapid technology advancements occurring in our regulatory areas as well as meeting the challenges of cybersecurity. Key information technology (IT) initiatives include those listed below.
• Expanding data analytic tools to integrate and analyze the large and ever-increasing volumes of financial data we receive, enabling us to detect fraud or suspicious behavior earlier and allocate resources more effectively.
• Increasing investments in information security to address, as a top priority, the ability to monitor and avoid advanced persistent threats, and to improve risk management and monitoring.
• Redesigning the Electronic Data Gathering,
Analysis, and Retrieval (EDGAR) system, an ongoing, multi-year effort to simplify the financial reporting process, promote automation, reduce filer burdens, and provide improved access to better data.
• Improving examinations through risk assessment
and surveillance tools that will help identify high-risk areas for further examination.
• Enhancing the systems supporting enforcement
investigations and litigation to more efficiently handle the substantial volume of materials produced during investigations and litigation.
• Investing further in business process automation
and improvement to enhance the efficiency and effectiveness of the agency in serving the public.
In addition to our request of $1.602 billion, the SEC is requesting funds necessary for the buildout of a new headquarters building, should such a new building be the winning alternative in a competitive procurement process to be conducted by the General Services Administration (GSA). GSA estimates those costs would equal approximately $245 million. According to GSA’s current schedule, a new lease will be awarded in FY 2018. None of these funds would be used for the operations of the SEC, and the proposed appropriations language provides a mechanism whereby any unused portion of these funds would be refunded to fee payers.
It is important to note that the SEC’s funding is deficit-neutral, which means that any amount appropriated to the agency will be offset by transaction fees and therefore will not impact the deficit or the funding available for other agencies.
4 | FY 2018 CONGRESSIONAL BUDGET JUSTIFICATION
Mission, Vision, Values, and Goals
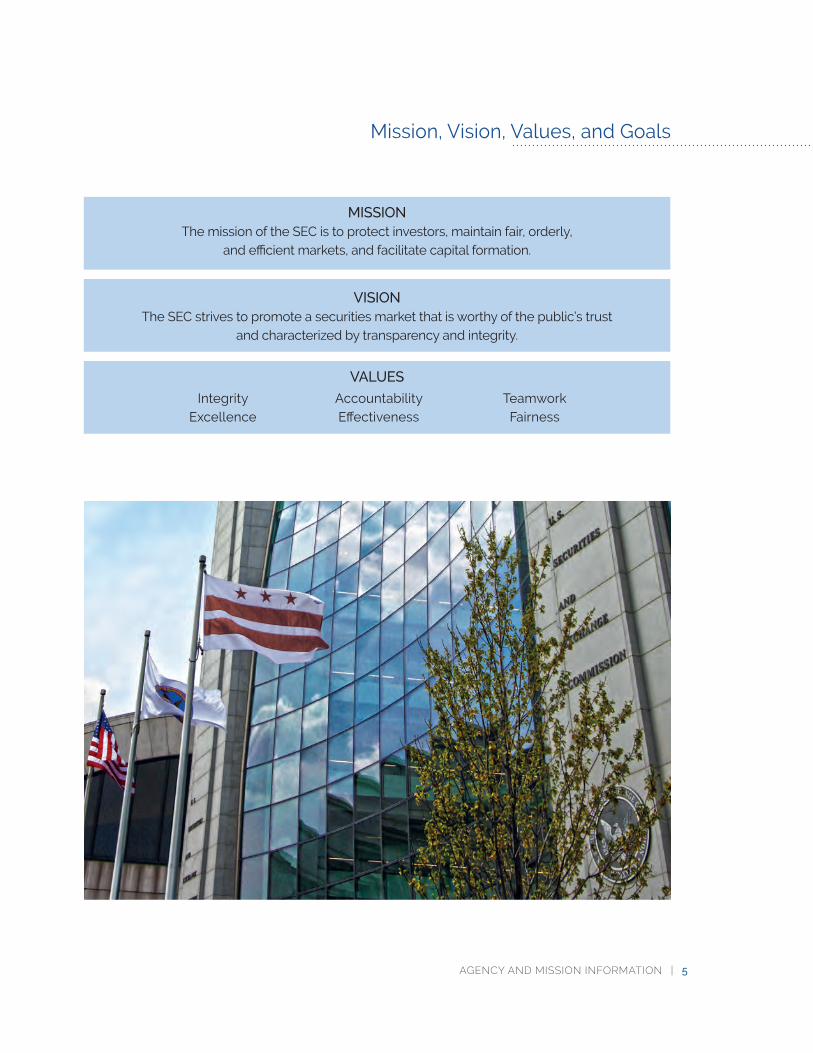
MISSION The mission of the SEC is to protect investors, maintain fair, orderly,
and efficient markets, and facilitate capital formation.
VISION The SEC strives to promote a securities market that is worthy of the public’s trust
and characterized by transparency and integrity.
VALUES
Integrity Accountability Teamwork
Excellence Effectiveness Fairness
AGENCY AND MISSION INFORMATION | 5
6 | FY 2018 CONGRESSIONAL BUDGET JUSTIFICATION
Strategic Goals and Objectives of the FY 2014–2018 Strategic Plan Strategic Goal 1: Establish and maintain an effective regulatory environment
Strategic Objective 1.1: The SEC establishes and maintains a regulatory environment that promotes high-quality disclosure, financial reporting, and governance, and that prevents abusive practices by registrants, financial intermediaries, and other market participants.
Strategic Objective 1.2: The SEC promotes capital markets that operate in a fair, efficient, transparent, and competitive manner, fostering capital formation and useful innovation.
Strategic Objective 1.3: The SEC adopts and administers regulations and rules that are informed by robust economic analysis and public comment and that enable market participants to understand clearly their obligations under the securities laws.
Strategic Objective 1.4: The SEC engages with a multitude of stakeholders to inform and enhance regulatory activities domestically and internationally.
Strategic Goal 2: Foster and enforce compliance with the federal securities laws
Strategic Objective 2.1: The SEC fosters compliance with the federal securities laws.
Strategic Objective 2.2: The SEC promptly detects and deters violations of the federal securities laws.
Strategic Objective 2.3: The SEC prosecutes violations of federal securities laws and holds violators accountable through appropriate sanctions and remedies.
Strategic Goal 3: Facilitate access to the information investors need to make informed investment decisions
Strategic Objective 3.1: The SEC works to ensure that investors have access to high-quality disclosure materials that facilitate informed investment decision-making.
Strategic Objective 3.2: The SEC works to understand investor needs and educate investors so they are better prepared to make informed investment decisions.
Strategic Goal 4: Enhance the Commission’s performance through effective alignment and management of human, information, and financial capital
Strategic Objective 4.1: The SEC promotes a results-oriented work environment that attracts, engages, and retains a technically proficient and diverse workforce, including leaders who provide motivation and strategic direction.
Strategic Objective 4.2: The SEC encourages a collaborative environment across divisions and offices and leverages technology and data to fulfill its mission more effectively and efficiently.
Strategic Objective 4.3: The SEC maximizes the use of agency resources by continually improving agency operations and bolstering internal controls.
AGENCY AND MISSION INFORMATION | 7
History and Purpose
During the peak of the Great Depression, Congress passed the Securities Act of 19331 (Securities Act) and the Securities Exchange Act of 19342
(Exchange Act), which established the SEC.
These laws were designed to regulate the financial markets and restore investor confidence in U.S. capital markets by providing investors and the markets with reliable information and clear rules to ensure honest dealings. The main purpose of these laws was to ensure the following:
• Companies that publicly offer securities for investment dollars are publically transparent about their businesses, the securities they are selling, and the risks involved with investing; and
• People who sell and trade securities—brokers, dealers, and exchanges—treat investors fairly and honestly, putting investors’ interests first.
The SEC is responsible for overseeing the nation’s securities markets and certain primary participants such as broker-dealers, investment companies, investment advisers, clearing agencies, transfer agents, credit rating agencies, and securities exchanges, as well as organizations such as the Financial Industry Regulatory Authority (FINRA), Municipal Securities Rulemaking Board (MSRB), and Public Company Accounting Oversight Board (PCAOB). Under the Dodd-Frank Wall Street Reform and Consumer Protection Act of 20103 (Dodd-Frank Act), the agency’s jurisdiction expanded to include certain participants in the derivatives markets, private fund advisers, and municipal advisors.
The SEC consists of five presidentially-appointed Commissioners—one of whom is designated as the Chairman of the Commission—with staggered five-year terms. Former President Franklin Delano Roosevelt appointed Joseph P. Kennedy as the first Chairman of the SEC.
By law, no more than three of the Commissioners may belong to the same political party. The Commission convenes regularly at meetings that are open to the public and the news media unless the discussion pertains to a confidential subject, such as whether or not to begin an enforcement investigation.
Each year, the SEC brings hundreds of civil enforcement actions against individuals and companies for violating securities laws. The SEC also has long focused on preventing and deterring retail fraud. Examples of infractions are insider trading, accounting fraud, and providing false or misleading information about securities and/or the issuing companies. One of the major sources of information that the SEC relies on to bring enforcement action are the investors themselves, which is yet another reason why educated and informed investors are critical to the functioning of efficient markets.
To help investors stay informed, the SEC offers the public a wealth of educational information on its website at Investor.gov, as well as through an online database of disclosure documents that public companies and other market participants are required to file with the SEC. These can be found at: www.sec.gov/edgar/searchedgar/ companysearch.html.
1 More information about the Securities Act of 1933 can be found at www.sec.gov/about/laws/sa33.pdf 2 More information about the Securities Exchange Act of 1934 can be found at www.sec.gov/about/laws/sea34.pdf 3 More information about the Dodd-Frank Wall Street Reform and Consumer Protection Act of 2010 can be found at
www.sec.gov/about/laws/wallstreetreform-cpa.pdf
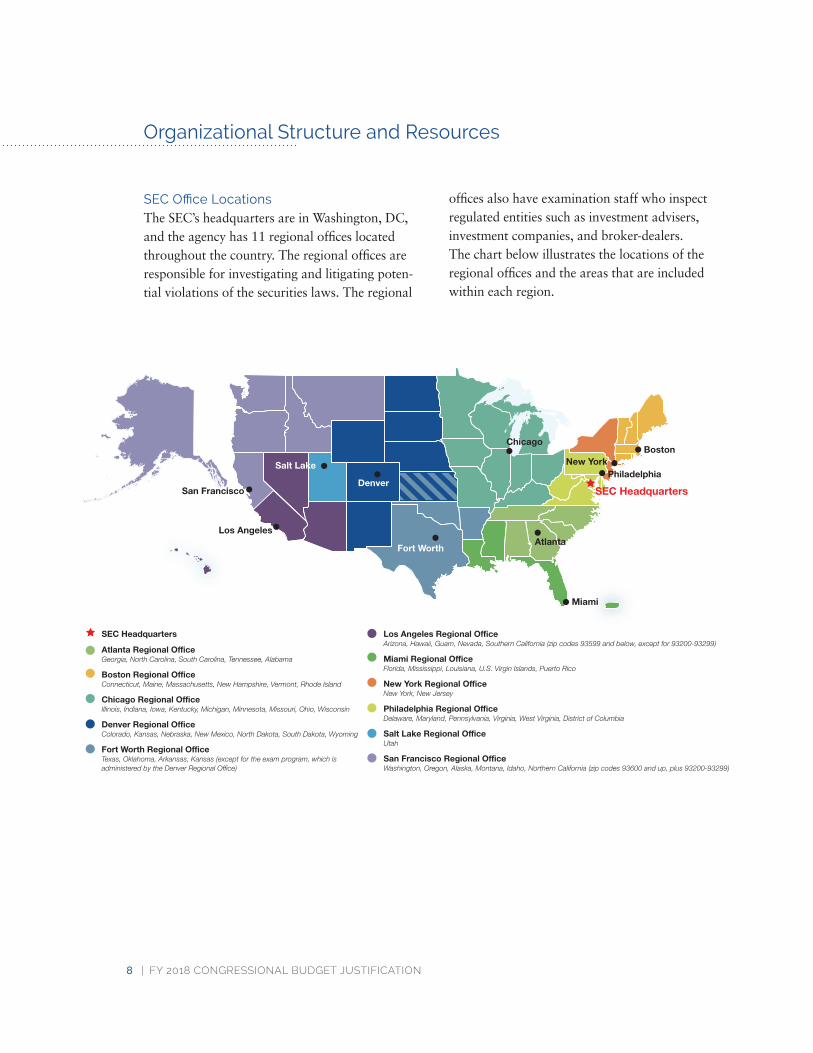
SEC Headquarters and Regional Office Locations
Organizational Structure and Resources
SEC Office Locations The SEC’s headquarters are in Washington, DC, and the agency has 11 regional offices located throughout the country. The regional offices are responsible for investigating and litigating potential violations of the securities laws. The regional
offices also have examination staff who inspect regulated entities such as investment advisers, investment companies, and broker-dealers. The chart below illustrates the locations of the regional offices and the areas that are included within each region.
SEC Headquarters
Atlanta Regional Office
Los Angeles Regional OfficeArizona, Hawaii, Guam, Nevada, Southern California (zip codes 93599 and below, except for 93200-93299)
Fort Worth
Chicago
Denver
Salt Lake Philadelphia
Los Angeles
San Francisco
Miami
Atlanta
New York Boston
SEC Headquarters
Georgia, North Carolina, South Carolina, Tennessee, Alabama
Boston Regional OfficeConnecticut, Maine, Massachusetts, New Hampshire, Vermont, Rhode Island
Chicago Regional OfficeIllinois, Indiana, Iowa, Kentucky, Michigan, Minnesota, Missouri, Ohio, Wisconsin
Denver Regional OfficeColorado, Kansas, Nebraska, New Mexico, North Dakota, South Dakota, Wyoming
Fort Worth Regional OfficeTexas, Oklahoma, Arkansas, Kansas (except for the exam program, which is administered by the Denver Regional Office)
Miami Regional OfficeFlorida, Mississippi, Louisiana, U.S. Virgin Islands, Puerto Rico
New York Regional OfficeNew York, New Jersey
Philadelphia Regional OfficeDelaware, Maryland, Pennsylvania, Virginia, West Virginia, District of Columbia
Salt Lake Regional OfficeUtah
San Francisco Regional OfficeWashington, Oregon, Alaska, Montana, Idaho, Northern California (zip codes 93600 and up, plus 93200-93299)
8 | FY 2018 CONGRESSIONAL BUDGET JUSTIFICATION
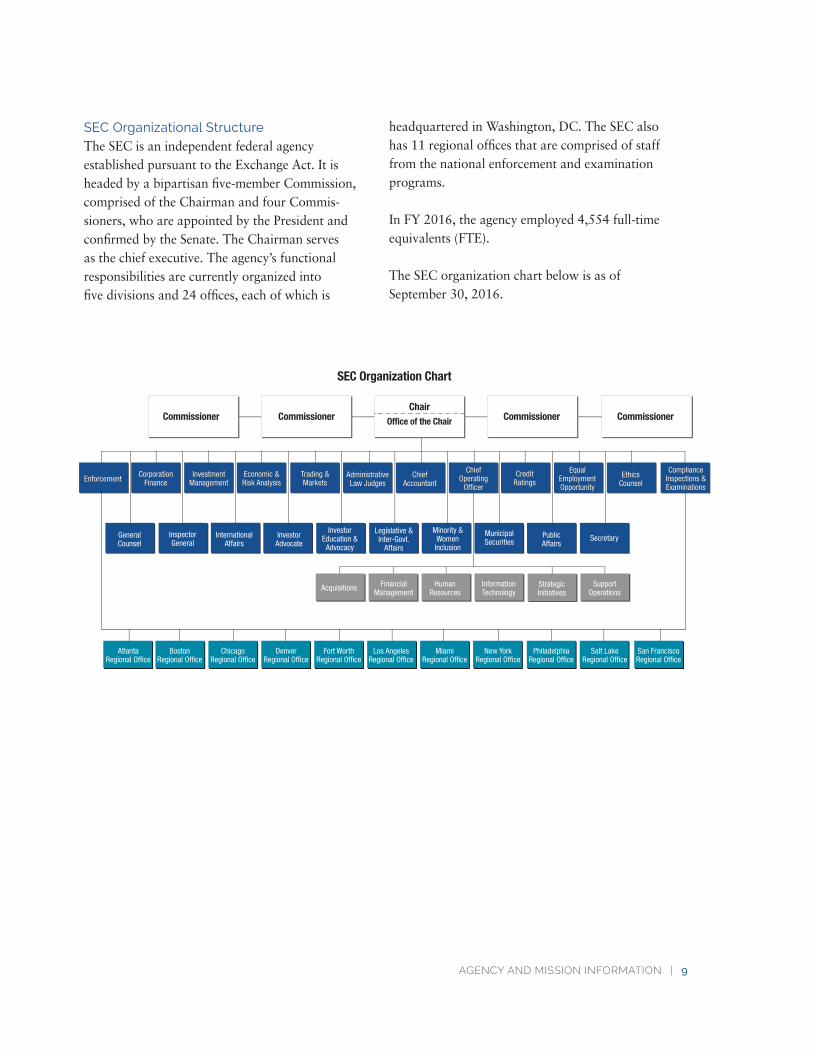
SEC Organizational Structure The SEC is an independent federal agency established pursuant to the Exchange Act. It is headed by a bipartisan five-member Commission, comprised of the Chairman and four Commissioners, who are appointed by the President and confirmed by the Senate. The Chairman serves as the chief executive. The agency’s functional responsibilities are currently organized into five divisions and 24 offices, each of which is
headquartered in Washington, DC. The SEC also has 11 regional offices that are comprised of staff from the national enforcement and examination programs.
In FY 2016, the agency employed 4,554 full-time equivalents (FTE).
The SEC organization chart below is as of September 30, 2016.
SEC Organization Chart
Commissioner Commissioner Chair
Office of the Chair Commissioner Commissioner
Trading &Markets
Trading & MarketsEnforcementEnforcement
Acquisitions Financial Management
Human Resources
Information Technology
Support Operations
CorporationFinance
Corporation Finance
InvestmentManagementInvestment
Management Economic &Risk AnalysisEconomic & Risk Analysis
AdministrativeLaw Judges
Administrative Law Judges
ChiefAccountant
Chief Accountant
CreditRatingsCredit
Ratings
ChiefOperating
Officer
Chief Operating
Officer
EqualEmploymentOpportunity
Equal Employment Opportunity
EthicsCounselEthics
Counsel
ComplianceInspections &Examinations
Compliance Inspections & Examinations
Strategic Initiatives
General Counsel
Inspector General
International Affairs
Investor Advocate
Investor Education & Advocacy
Legislative & Inter-Govt.
Affairs
Minority & Women
Inclusion
Municipal Securities
Public Affairs
Secretary
Atlanta Regional Office
Boston Regional Office
Chicago Regional Office
Denver Regional Office
Fort Worth Regional Office
Los Angeles Regional Office
Miami Regional Office
New York Regional Office
Philadelphia Regional Office
Salt Lake Regional Office
San Francisco Regional Office
AGENCY AND MISSION INFORMATION | 9
FY 2018 Budget Request Tables
Full-Time Equivalents (FTE) and Positions by Program ....................................................................13
Obligations by Object Class .......................................................................................................................................14
Strategic Goal and Program...................................................................................................................................... 15
Summary of Changes.....................................................................................................................................................16

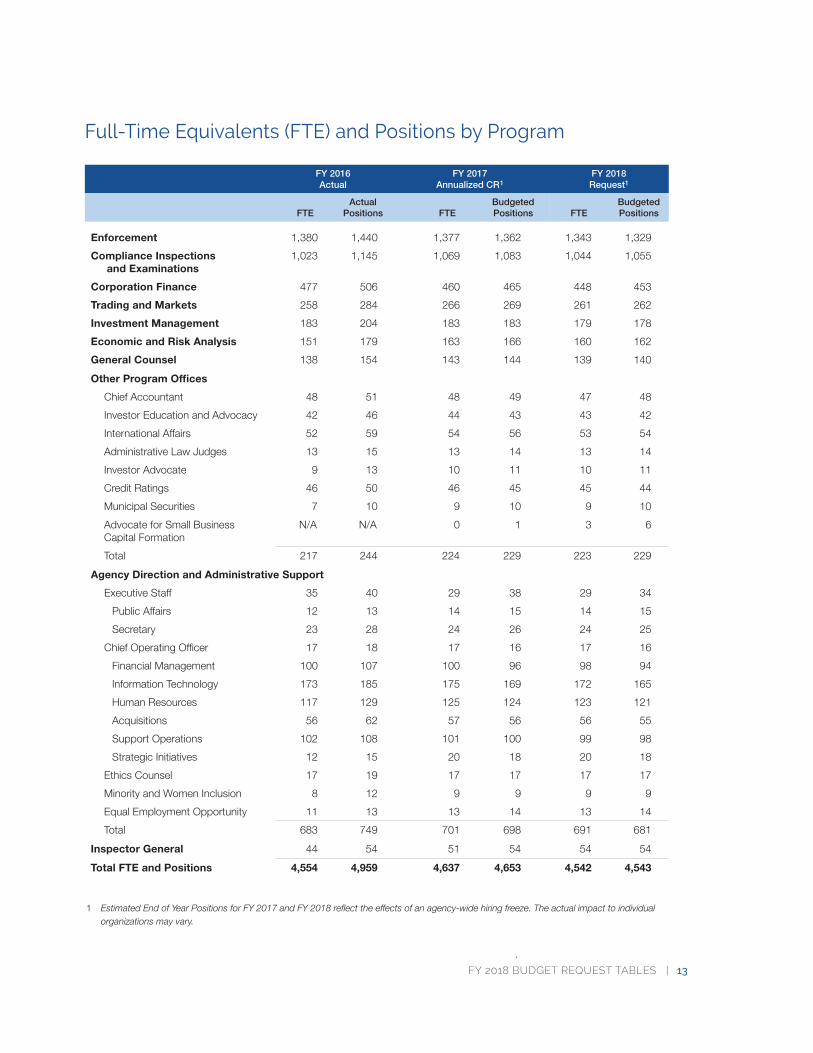
Full-Time Equivalents (FTE) and Positions by Program
FY 2016Actual
FY 2017Annualized CR1
FY 2018Request1
FTEActual
Positions FTEBudgeted Positions FTE
Budgeted Positions
Enforcement 1,380 1,440 1,377 1,362 1,343 1,329
Compliance Inspections and Examinations
1,023 1,145 1,069 1,083 1,044 1,055
Corporation Finance 477 506 460 465 448 453
Trading and Markets 258 284 266 269 261 262
Investment Management 183 204 183 183 179 178
Economic and Risk Analysis 151 179 163 166 160 162
General Counsel 138 154 143 144 139 140
Other Program Offices
Chief Accountant 48 51 48 49 47 48
Investor Education and Advocacy 42 46 44 43 43 42
International Affairs 52 59 54 56 53 54
Administrative Law Judges 13 15 13 14 13 14
Investor Advocate 9 13 10 11 10 11
Credit Ratings 46 50 46 45 45 44
Municipal Securities 7 10 9 10 9 10
Advocate for Small Business Capital Formation
N/A N/A 0 1 3 6
Total 217 244 224 229 223 229
Agency Direction and Administrative Support
Executive Staff 35 40 29 38 29 34
Public Affairs 12 13 14 15 14 15
Secretary 23 28 24 26 24 25
Chief Operating Officer 17 18 17 16 17 16
Financial Management 100 107 100 96 98 94
Information Technology 173 185 175 169 172 165
Human Resources 117 129 125 124 123 121
Acquisitions 56 62 57 56 56 55
Support Operations 102 108 101 100 99 98
Strategic Initiatives 12 15 20 18 20 18
Ethics Counsel 17 19 17 17 17 17
Minority and Women Inclusion 8 12 9 9 9 9
Equal Employment Opportunity 11 13 13 14 13 14
Total 683 749 701 698 691 681
Inspector General 44 54 51 54 54 54
Total FTE and Positions 4,554 4,959 4,637 4,653 4,542 4,543
1 EstimatedEndofYearPositionsforFY2017andFY2018reflecttheeffectsofanagency-widehiringfreeze.Theactualimpacttoindividualorganizationsmayvary.
.
FY 2018 BUDGET REQUEST TABLES | 13
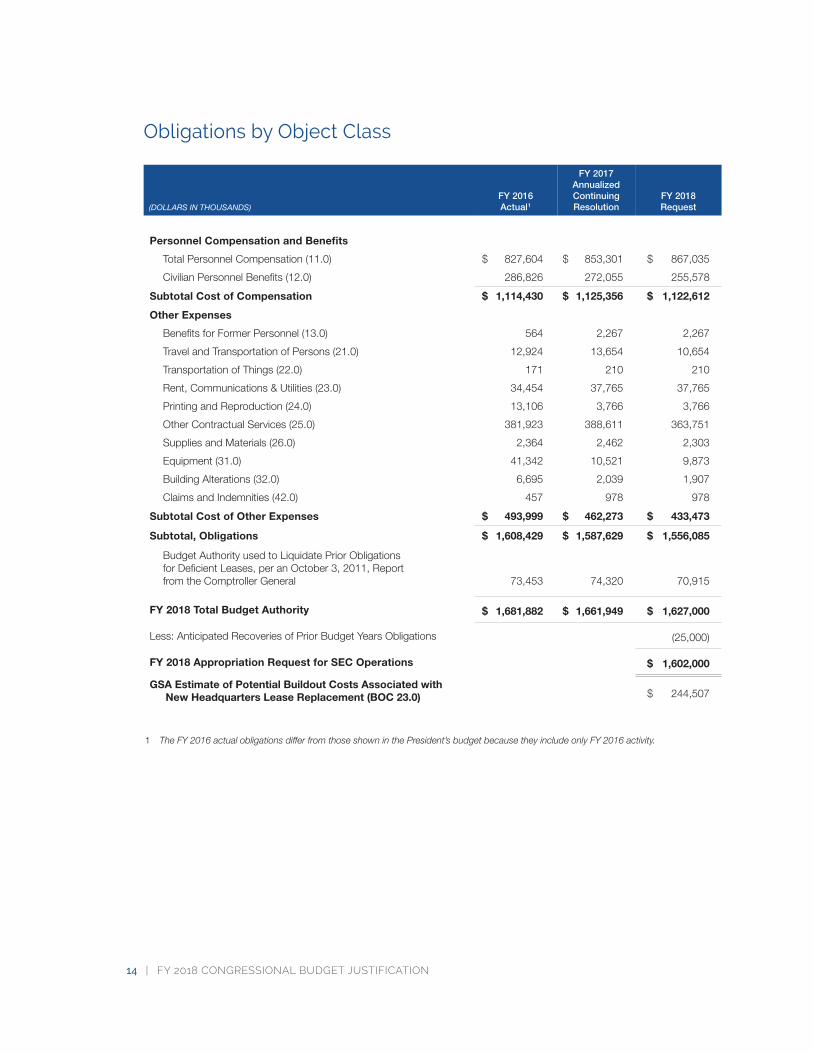
Obligations by Object Class
(DOLLARS IN THOUSANDS) FY 2016 Actual1
FY 2017 Annualized Continuing Resolution
FY 2018 Request
Personnel Compensation and Benefits
Total Personnel Compensation (11.0) $ 827,604 $ 853,301 $ 867,035
Civilian Personnel Benefits (12.0) 286,826 272,055 255,578
Subtotal Cost of Compensation $ 1,114,430 $ 1,125,356 $ 1,122,612
Other Expenses
Benefits for Former Personnel (13.0) 564 2,267 2,267
Travel and Transportation of Persons (21.0) 12,924 13,654 10,654
Transportation of Things (22.0) 171 210 210
Rent, Communications & Utilities (23.0) 34,454 37,765 37,765
Printing and Reproduction (24.0) 13,106 3,766 3,766
Other Contractual Services (25.0) 381,923 388,611 363,751
Supplies and Materials (26.0) 2,364 2,462 2,303
Equipment (31.0) 41,342 10,521 9,873
Building Alterations (32.0) 6,695 2,039 1,907
Claims and Indemnities (42.0) 457 978 978
Subtotal Cost of Other Expenses $ 493,999 $ 462,273 $ 433,473
Subtotal, Obligations $ 1,608,429 $ 1,587,629 $ 1,556,085
Budget Authority used to Liquidate Prior Obligations for Deficient Leases, per an October 3, 2011, Report from the Comptroller General 73,453 74,320 70,915
FY 2018 Total Budget Authority $ 1,681,882 $ 1,661,949 $ 1,627,000
Less: Anticipated Recoveries of Prior Budget Years Obligations (25,000)
FY 2018 Appropriation Request for SEC Operations $ 1,602,000
GSA Estimate of Potential Buildout Costs Associated with $ 244,507New Headquarters Lease Replacement (BOC 23.0)
1 The FY 2016 actual obligations differ from those shown in the President’s budget because they include only FY 2016 activity.
14 | FY 2018 CONGRESSIONAL BUDGET JUSTIFICATION
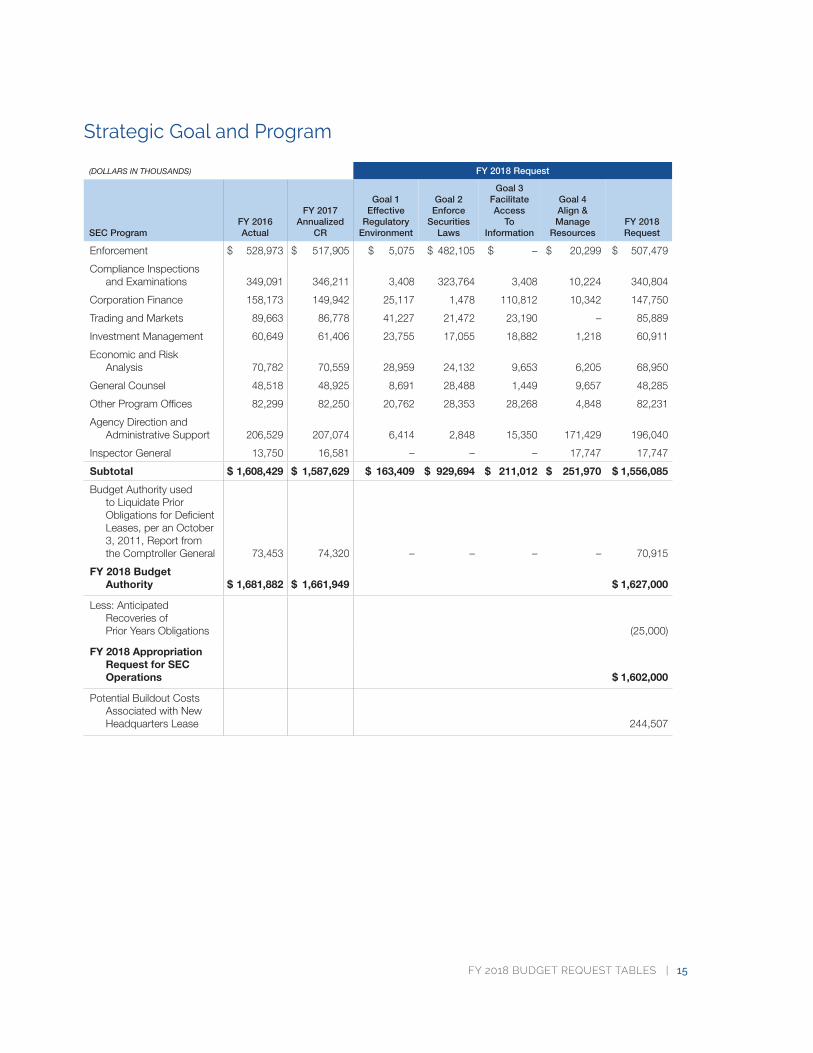
Strategic Goal and Program
(DOLLARS IN THOUSANDS) FY 2018 Request
SEC Program
Enforcement
Compliance Inspections and Examinations
Corporation Finance
Trading and Markets
Investment Management
Economic and Risk Analysis
General Counsel
Other Program Offices
Agency Direction and Administrative Support
Inspector General
FY 2016 Actual
$ 528,973
349,091
158,173
89,663
60,649
70,782
48,518
82,299
206,529
13,750
FY 2017 Annualized
CR
$ 517,905
346,211
149,942
86,778
61,406
70,559
48,925
82,250
207,074
16,581
Goal 1 Effective
Regulatory Environment
$ 5,075
3,408
25,117
41,227
23,755
28,959
8,691
20,762
6,414
–
Goal 2 Enforce
Securities Laws
$ 482,105
323,764
1,478
21,472
17,055
24,132
28,488
28,353
2,848
–
Goal 3 Facilitate Access
To Information
Goal 4 Align & Manage
Resources
$ – $ 20,299
3,408 10,224
110,812 10,342
23,190 –
18,882 1,218
9,653 6,205
1,449 9,657
28,268 4,848
15,350 171,429
– 17,747
FY 2018 Request
$ 507,479
340,804
147,750
85,889
60,911
68,950
48,285
82,231
196,040
17,747
Subtotal $ 1,608,429 $ 1,587,629 $ 163,409 $ 929,694 $ 211,012 $ 251,970 $ 1,556,085
Budget Authority used to Liquidate Prior Obligations for Deficient Leases, per an October 3, 2011, Report from the Comptroller General
FY 2018 Budget
73,453 74,320 – – – – 70,915
Authority $ 1,681,882 $ 1,661,949 $ 1,627,000
Less: Anticipated Recoveries of Prior Years Obligations
FY 2018 Appropriation Request for SEC
(25,000)
Operations $ 1,602,000
Potential Buildout Costs Associated with New Headquarters Lease 244,507
FY 2018 BUDGET REQUEST TABLES | 15
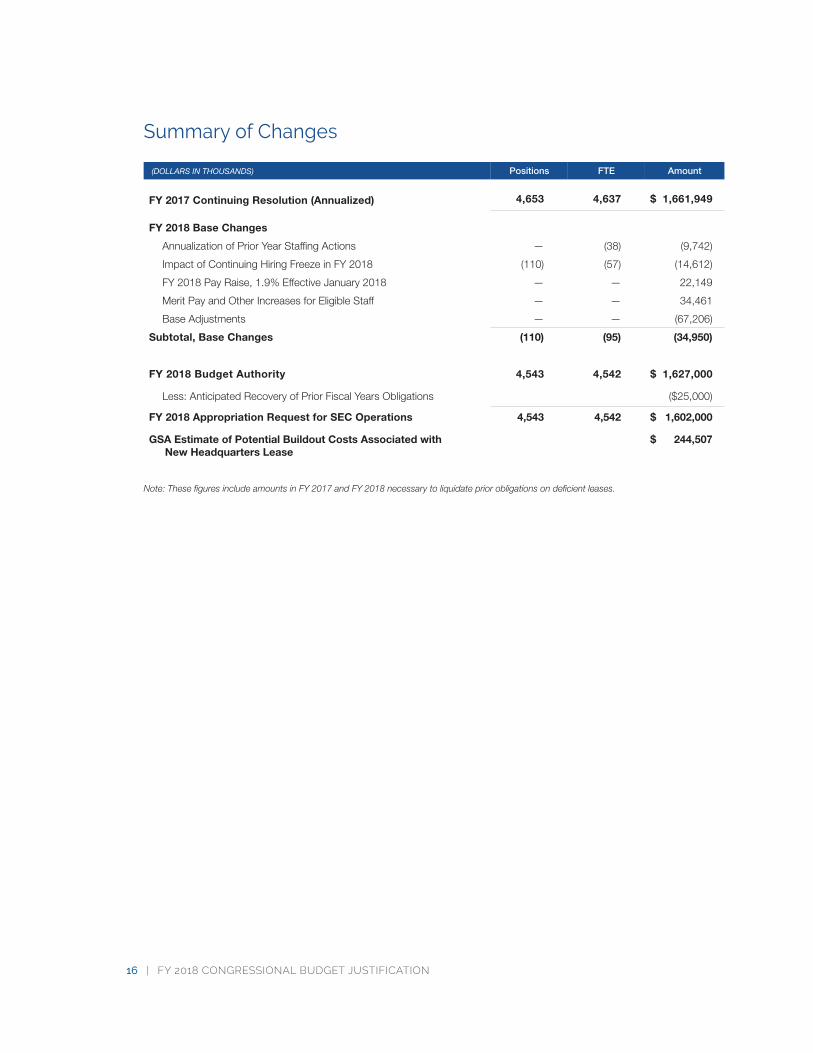
Summary of Changes
(DOLLARS IN THOUSANDS) Positions FTE Amount
FY 2017 Continuing Resolution (Annualized) 4,653 4,637 $ 1,661,949
FY 2018 Base Changes
Annualization of Prior Year Staffing Actions — (38) (9,742)
Impact of Continuing Hiring Freeze in FY 2018 (110) (57) (14,612)
FY 2018 Pay Raise, 1.9% Effective January 2018 — — 22,149
Merit Pay and Other Increases for Eligible Staff — — 34,461
Base Adjustments — — (67,206)
Subtotal, Base Changes (110) (95) (34,950)
FY 2018 Budget Authority 4,543 4,542 $ 1,627,000
Less: Anticipated Recovery of Prior Fiscal Years Obligations ($25,000)
FY 2018 Appropriation Request for SEC Operations 4,543 4,542 $ 1,602,000
GSA Estimate of Potential Buildout Costs Associated with $ 244,507 New Headquarters Lease
Note: These figures include amounts in FY 2017 and FY 2018 necessary to liquidate prior obligations on deficient leases.
16 | FY 2018 CONGRESSIONAL BUDGET JUSTIFICATION
APPROPRIATIONS LANGUAGE | 17
FY 2018 Appropriations Language
For necessary expenses for the Securities and Exchange Commission, including services as authorized by 5 U.S.C. 3109, the rental of space (to include multiple year leases) in the District of Columbia and elsewhere, and not to exceed $3,500 for official reception and representation expenses, $1,602,000,000, to remain available until expended; of which not less than $14,748,358 shall be for the Office of Inspector General; of which not to exceed $75,000 shall be available for a permanent secretariat for the International Organization of Securities Commissions; and of which not to exceed $100,000 shall be available for expenses for consultations and meetings hosted by the Commission with foreign governmental and other regulatory officials, members of their delegations and staffs to exchange views concerning securities matters, such expenses to include necessary logistic and administrative expenses and the expenses of Commission staff and foreign invitees in attendance including: (1) incidental expenses such as meals; (2) travel and transportation; and (3) related lodging or subsistence.
In addition to the foregoing appropriation, for costs associated with relocation under a replacement lease for the Commission’s headquarters facilities, not to exceed $244,507,052, to remain available until expended.
For purposes of calculating the fee rate under section 31(j) of the Securities Exchange Act of 1934 (15 U.S.C. 78ee(j)) for fiscal year 2018, all amounts appropriated under this heading shall
be deemed to be the regular appropriation to the Commission for fiscal year 2018.
Provided, That fees and charges authorized by section 31 of the Securities Exchange Act of 1934 (15 U.S.C. 78ee) shall be credited to this account as offsetting collections: Provided further, That not to exceed $1,602,000,000 of such offsetting collections shall be available until expended for necessary expenses of this account and not to exceed $244,507,052 of such offsetting collections shall be available until expended for costs under this heading associated with relocation under a replacement lease for the Commission’s headquarters facilities: Provided further, That the total amount appropriated under this heading from the general fund for fiscal year 2018 shall be reduced as such offsetting fees are received so as to result in a final total fiscal year 2018 appropriation from the general fund estimated at not more than $0: Provided further, That if any amount of the appropriation for costs associated with relocation under a replacement lease for the Commission’s headquarters facilities is subsequently de-obligated by the Commission, such amount that was derived from the general fund shall be returned to the general fund, and such amounts that were derived from fees or assessments collected for such purpose shall be paid to each national securities exchange and national securities association, respectively, in proportion to any fees or assessments paid by such national securities exchange or national securities association under section 31 of the Securities Exchange Act of 1934 (15 U.S.C. 78ee) in fiscal year 2018.
FY 2016 ANNUAL PERFORMANCE REPORT AND FY 2018 ANNUAL PERFORMANCE PLAN | 19
FY 2016 Annual Performance Report (APR) and FY 2018 Annual Performance Plan (APP)
A Reader’s Guide to the SEC’s Performance Information ................................................................21
FY 2016 APR and FY 2018 APP Summary ......................................................................................................21
Performance Summary by Strategic Goal and Strategic Objective ......................................22
Strategic Goal 1: Establish and Maintain an Effective
Regulatory Environment ....................................................................................22
Strategic Goal 2: Foster and Enforce Compliance with the
Federal Securities Laws .....................................................................................29
Strategic Goal 3: Facilitate Access to the Information
Investors Need to Make Informed
Investment Decisions .......................................................................................... 40
Strategic Goal 4: Enhance the Commission’s Performance
through Effective Alignment and
Management of Human, Information, and
Financial Capital ........................................................................................................45

FY 2016 ANNUAL PERFORMANCE REPORT AND FY 2018 ANNUAL PERFORMANCE PLAN | 21
A Reader’s Guide to SEC Performance Information
The following chapters comprise the agency’s FY 2016 APR and FY 2018 APP, which explain how the SEC uses resources to achieve each of its four strategic goals. These strategic goals, strategic objectives, and performance goals and indicators were developed as part of the Strategic Plan process for FY 2014–2018.
The following is a brief description of each of the major components of the performance section.
Strategic Goal Summary: Each strategic goal section opens by reviewing the purpose of the goal, followed by information identifying the resources allocated toward achieving the goal.
Strategic Objective: This section provides a description of the SEC’s strategic objectives that gauge the agency’s performance within each strategic goal.
Performance Goals and Indicators: Each strategic goal section includes a presentation of performance goals and performance indicators by objective, comparing planned and actual perfor-mance levels for FY 2016. Four years of historical data is provided for performance goals and performance indicators where available.
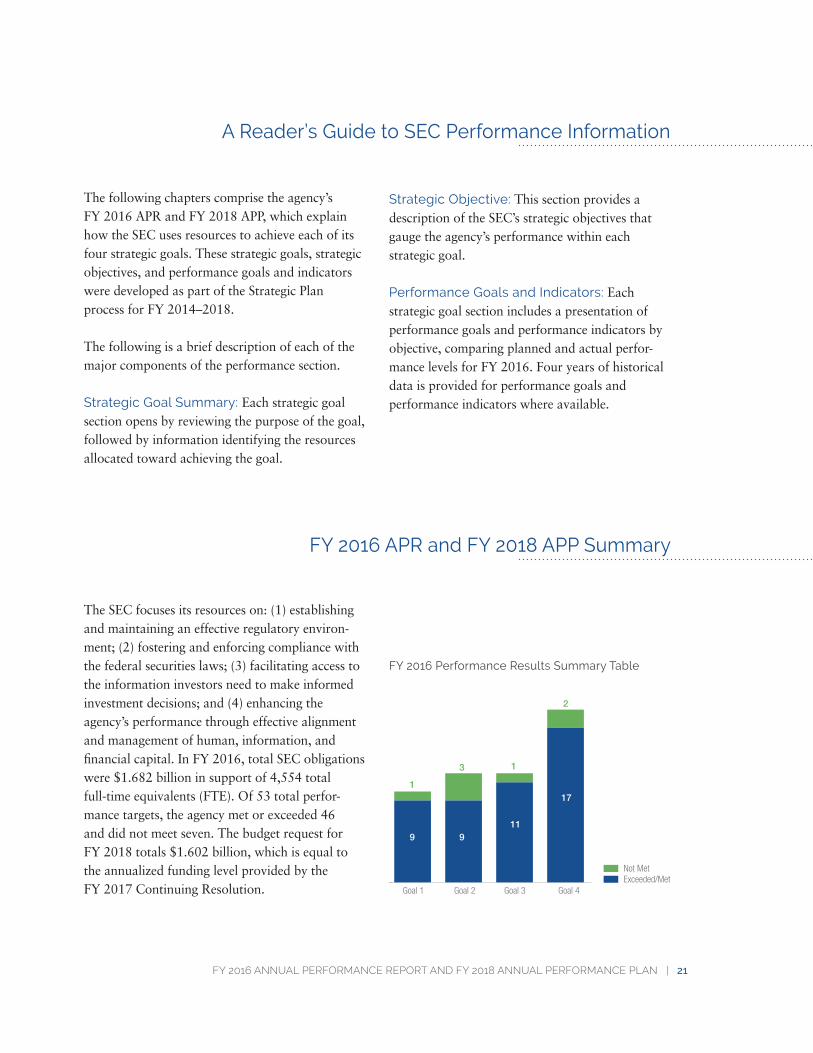
FY 2016 APR and FY 2018 APP Summary
The SEC focuses its resources on: (1) establishing and maintaining an effective regulatory environ-ment; (2) fostering and enforcing compliance with the federal securities laws; (3) facilitating access to the information investors need to make informed investment decisions; and (4) enhancing the agency’s performance through effective alignment and management of human, information, and financial capital. In FY 2016, total SEC obligations were $1.682 billion in support of 4,554 total full-time equivalents (FTE). Of 53 total perfor-mance targets, the agency met or exceeded 46 and did not meet seven. The budget request for FY 2018 totals $1.602 billion, which is equal to the annualized funding level provided by the FY 2017 Continuing Resolution.
FY 2016 Performance Results Summary Table
Goal 1 Goal 2 Goal 3 Goal 40
5
10
15
20
Exceeded/MetNot Met
9
1
9
3
11
1
17
2
Performance Summary by Strategic Goal and Strategic Objective
STRATEGIC GOAL 1: Establish and Maintain an Effective Regulatory EnvironmentThe Commission believes that its rules and regu-lations should be drafted to enable market partici-pants to clearly understand their obligations under the federal securities laws and to conduct their activities in compliance with law. The Commission aims to promulgate rules that are clearly written, easily understood, and tailored toward specific ends. In addition, the agency recognizes that regular reviews of Commission regulations and rulemaking processes are necessary to confirm that intended results are being achieved. When properly crafted, these rules serve to further the agency’s mission and allow for accurate and reliable information to be made available to investors.
In FY 2016, approximately $167.9 million and 459 full-time equivalents (FTE) were directed at achieving results in Strategic Goal 1. Of 10 perfor-mance targets, the agency met or exceeded nine and did not meet one. The SEC devotes a large share of resources responding to no-action letters and inter-pretive and other requests from regulated entities, public companies, and other outside parties. The agency is committed to speeding the response to such requests.
In FY 2018, the agency is requesting a total of $163.4 million and 464 FTEs toward achieving results in establishing an effective regulatory envi-ronment. Capital formation, investor protection, and market stability remain central to the SEC’s rulemaking agenda. The Division of Trading and Markets (TM) will work to develop measures to improve the design, deployment, integrity, and operation of automated systems controlled by exchanges, other market centers, and market par-ticipants. In coordination with other divisions and offices, TM will also work to improve its ability to quickly review and analyze equity and equity options market data.
Strategic Objective 1.1: The SEC establishes and maintains a regulatory environment that promotes high-quality disclosure, financial reporting, and governance, and prevents abusive practices by registrants, financial intermediaries, and other market participants.
Goal Leader(s): Director, Division of Trading and Markets; Director, Division of Corporation Finance; Director, Division of Investment Management
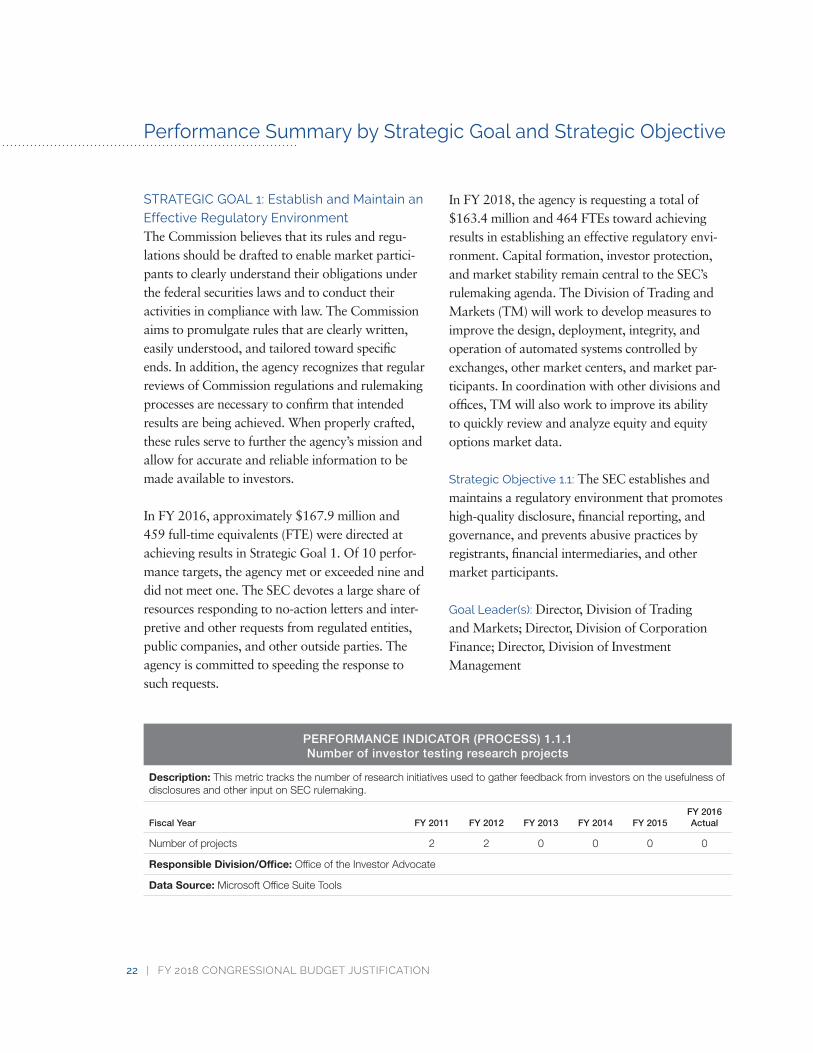
PERFORMANCE INDICATOR (PROCESS) 1.1.1 Number of investor testing research projects
Description: This metric tracks the number of research initiatives used to gather feedback from investors on the usefulness of disclosures and other input on SEC rulemaking.
Fiscal Year FY 2011 FY 2012 FY 2013 FY 2014 FY 2015FY 2016 Actual
Number of projects 2 2 0 0 0 0
Responsible Division/Office: Office of the Investor Advocate
Data Source: Microsoft Office Suite Tools
22 | FY 2018 CONGRESSIONAL BUDGET JUSTIFICATION
FY 2016 ANNUAL PERFORMANCE REPORT AND FY 2018 ANNUAL PERFORMANCE PLAN | 23
Strategic Objective 1.2: The SEC promotes capital markets that operate in a fair, efficient, transparent, and competitive manner, fostering capital forma-tion and innovation.
Goal Leader(s): Director, Division of Trading and Markets
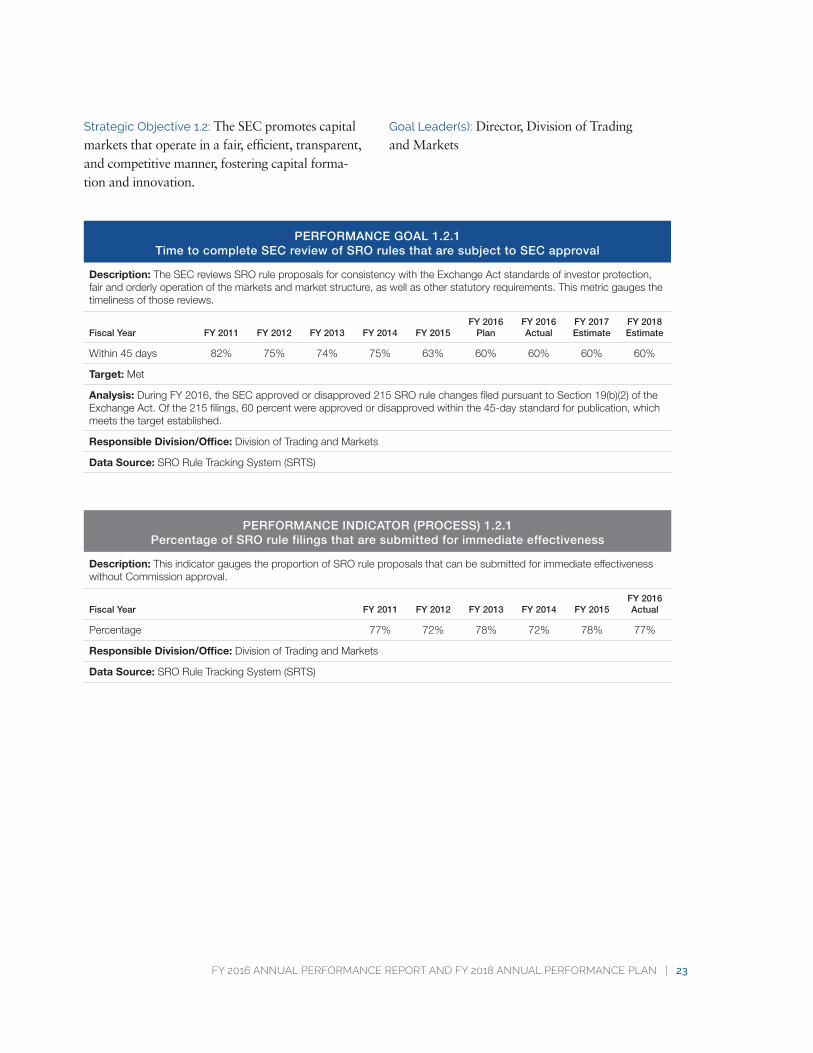
PERFORMANCE GOAL 1.2.1 Time to complete SEC review of SRO rules that are subject to SEC approval
Description: The SEC reviews SRO rule proposals for consistency with the Exchange Act standards of investor protection, fair and orderly operation of the markets and market structure, as well as other statutory requirements. This metric gauges the timeliness of those reviews.
Fiscal Year FY 2011 FY 2012 FY 2013 FY 2014 FY 2015FY 2016
PlanFY 2016 Actual
FY 2017 Estimate
FY 2018 Estimate
Within 45 days 82% 75% 74% 75% 63% 60% 60% 60% 60%
Target: Met
Analysis: During FY 2016, the SEC approved or disapproved 215 SRO rule changes filed pursuant to Section 19(b)(2) of the Exchange Act. Of the 215 filings, 60 percent were approved or disapproved within the 45-day standard for publication, which meets the target established.
Responsible Division/Office: Division of Trading and Markets
Data Source: SRO Rule Tracking System (SRTS)
PERFORMANCE INDICATOR (PROCESS) 1.2.1 Percentage of SRO rule filings that are submitted for immediate effectiveness
Description: This indicator gauges the proportion of SRO rule proposals that can be submitted for immediate effectiveness without Commission approval.
Fiscal Year FY 2011 FY 2012 FY 2013 FY 2014 FY 2015FY 2016 Actual
Percentage 77% 72% 78% 72% 78% 77%
Responsible Division/Office: Division of Trading and Markets
Data Source: SRO Rule Tracking System (SRTS)
24 | FY 2018 CONGRESSIONAL BUDGET JUSTIFICATION
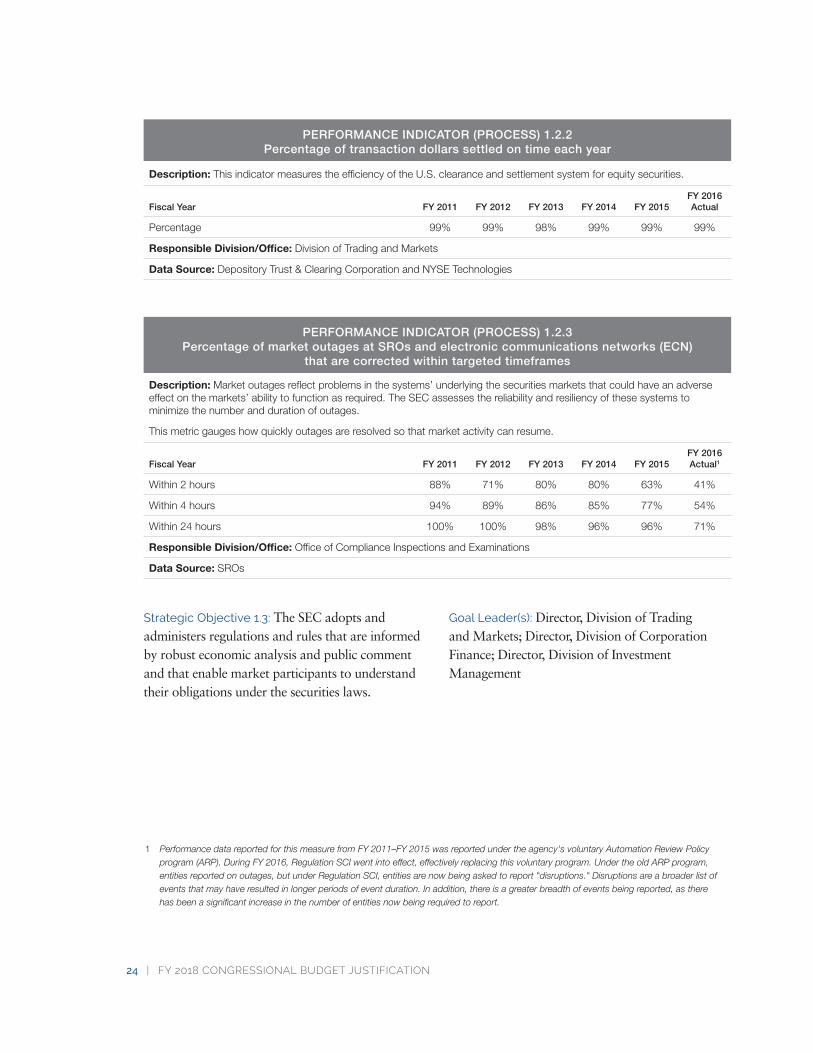
PERFORMANCE INDICATOR (PROCESS) 1.2.2 Percentage of transaction dollars settled on time each year
Description: This indicator measures the efficiency of the U.S. clearance and settlement system for equity securities.
Fiscal Year FY 2011 FY 2012 FY 2013 FY 2014 FY 2015FY 2016 Actual
Percentage 99% 99% 98% 99% 99% 99%
Responsible Division/Office: Division of Trading and Markets
Data Source: Depository Trust & Clearing Corporation and NYSE Technologies
PERFORMANCE INDICATOR (PROCESS) 1.2.3 Percentage of market outages at SROs and electronic communications networks (ECN)
that are corrected within targeted timeframes
Description: Market outages reflect problems in the systems’ underlying the securities markets that could have an adverse effect on the markets’ ability to function as required. The SEC assesses the reliability and resiliency of these systems to minimize the number and duration of outages.
This metric gauges how quickly outages are resolved so that market activity can resume.
Fiscal Year FY 2011 FY 2012 FY 2013 FY 2014 FY 2015FY 2016 Actual1
Within 2 hours 88% 71% 80% 80% 63% 41%
Within 4 hours 94% 89% 86% 85% 77% 54%
Within 24 hours 100% 100% 98% 96% 96% 71%
Responsible Division/Office: Office of Compliance Inspections and Examinations
Data Source: SROs
Strategic Objective 1.3: The SEC adopts and administers regulations and rules that are informed by robust economic analysis and public comment and that enable market participants to understand their obligations under the securities laws.
Goal Leader(s): Director, Division of Trading and Markets; Director, Division of Corporation Finance; Director, Division of Investment Management
1 PerformancedatareportedforthismeasurefromFY2011–FY2015wasreportedundertheagency'svoluntaryAutomationReviewPolicyprogram(ARP).DuringFY2016,RegulationSCIwentintoeffect,effectivelyreplacingthisvoluntaryprogram.UndertheoldARPprogram,entitiesreportedonoutages,butunderRegulationSCI,entitiesarenowbeingaskedtoreport"disruptions."Disruptionsareabroaderlistofeventsthatmayhaveresultedinlongerperiodsofeventduration.Inaddition,thereisagreaterbreadthofeventsbeingreported,astherehasbeenasignificantincreaseinthenumberofentitiesnowbeingrequiredtoreport.
FY 2016 ANNUAL PERFORMANCE REPORT AND FY 2018 ANNUAL PERFORMANCE PLAN | 25
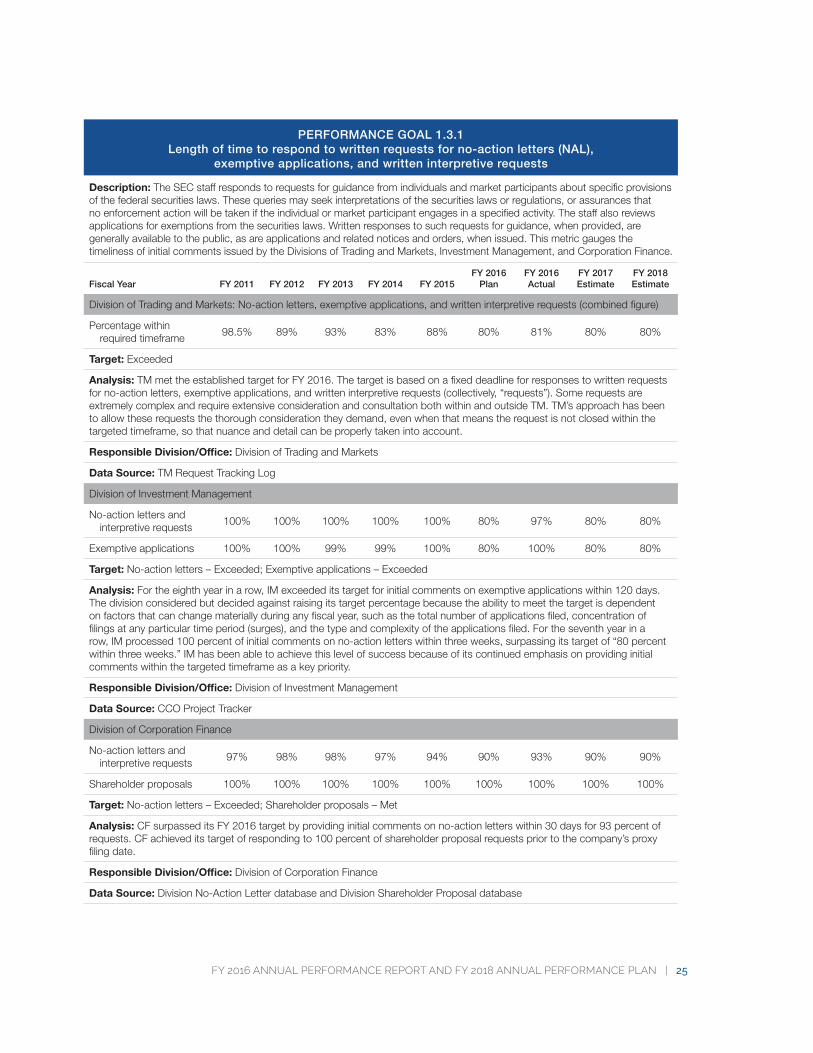
PERFORMANCE GOAL 1.3.1 Length of time to respond to written requests for no-action letters (NAL),
exemptive applications, and written interpretive requests
Description: The SEC staff responds to requests for guidance from individuals and market participants about specific provisions of the federal securities laws. These queries may seek interpretations of the securities laws or regulations, or assurances that no enforcement action will be taken if the individual or market participant engages in a specified activity. The staff also reviews applications for exemptions from the securities laws. Written responses to such requests for guidance, when provided, are generally available to the public, as are applications and related notices and orders, when issued. This metric gauges the timeliness of initial comments issued by the Divisions of Trading and Markets, Investment Management, and Corporation Finance.
Fiscal Year FY 2011 FY 2012 FY 2013 FY 2014 FY 2015FY 2016
PlanFY 2016 Actual
FY 2017 Estimate
FY 2018 Estimate
Division of Trading and Markets: No-action letters, exemptive applications, and written interpretive requests (combined figure)
Percentage within required timeframe
98.5% 89% 93% 83% 88% 80% 81% 80% 80%
Target: Exceeded
Analysis: TM met the established target for FY 2016. The target is based on a fixed deadline for responses to written requests for no-action letters, exemptive applications, and written interpretive requests (collectively, “requests”). Some requests are extremely complex and require extensive consideration and consultation both within and outside TM. TM’s approach has been to allow these requests the thorough consideration they demand, even when that means the request is not closed within the targeted timeframe, so that nuance and detail can be properly taken into account.
Responsible Division/Office: Division of Trading and Markets
Data Source: TM Request Tracking Log
Division of Investment Management
No-action letters and interpretive requests
100% 100% 100% 100% 100% 80% 97% 80% 80%
Exemptive applications 100% 100% 99% 99% 100% 80% 100% 80% 80%
Target: No-action letters – Exceeded; Exemptive applications – Exceeded
Analysis: For the eighth year in a row, IM exceeded its target for initial comments on exemptive applications within 120 days. The division considered but decided against raising its target percentage because the ability to meet the target is dependent on factors that can change materially during any fiscal year, such as the total number of applications filed, concentration of filings at any particular time period (surges), and the type and complexity of the applications filed. For the seventh year in a row, IM processed 100 percent of initial comments on no-action letters within three weeks, surpassing its target of “80 percent within three weeks.” IM has been able to achieve this level of success because of its continued emphasis on providing initial comments within the targeted timeframe as a key priority.
Responsible Division/Office: Division of Investment Management
Data Source: CCO Project Tracker
Division of Corporation Finance
No-action letters and interpretive requests
97% 98% 98% 97% 94% 90% 93% 90% 90%
Shareholder proposals 100% 100% 100% 100% 100% 100% 100% 100% 100%
Target: No-action letters – Exceeded; Shareholder proposals – Met
Analysis: CF surpassed its FY 2016 target by providing initial comments on no-action letters within 30 days for 93 percent of requests. CF achieved its target of responding to 100 percent of shareholder proposal requests prior to the company’s proxy filing date.
Responsible Division/Office: Division of Corporation Finance
Data Source: Division No-Action Letter database and Division Shareholder Proposal database
26 | FY 2018 CONGRESSIONAL BUDGET JUSTIFICATION
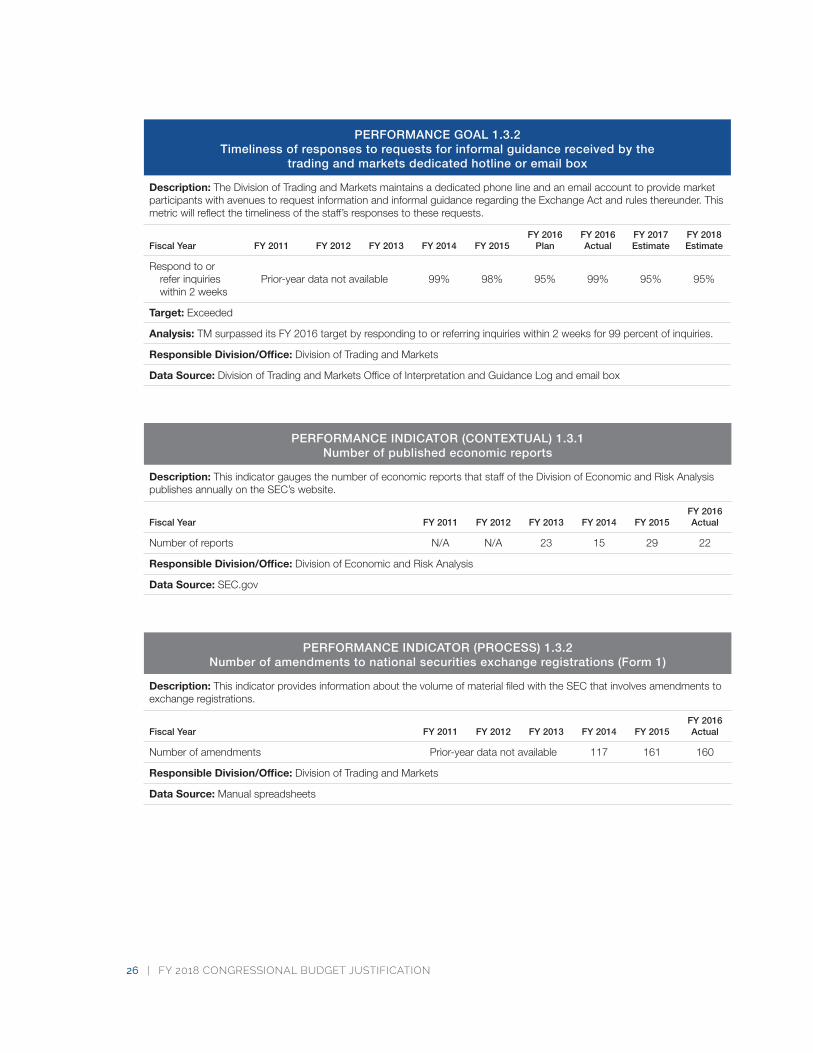
PERFORMANCE GOAL 1.3.2 Timeliness of responses to requests for informal guidance received by the
trading and markets dedicated hotline or email box
Description: The Division of Trading and Markets maintains a dedicated phone line and an email account to provide market participants with avenues to request information and informal guidance regarding the Exchange Act and rules thereunder. This metric will reflect the timeliness of the staff’s responses to these requests.
Fiscal Year FY 2011 FY 2012 FY 2013 FY 2014 FY 2015FY 2016
PlanFY 2016 Actual
FY 2017 Estimate
FY 2018 Estimate
Respond to or refer inquiries within 2 weeks
Prior-year data not available 99% 98% 95% 99% 95% 95%
Target: Exceeded
Analysis: TM surpassed its FY 2016 target by responding to or referring inquiries within 2 weeks for 99 percent of inquiries.
Responsible Division/Office: Division of Trading and Markets
Data Source: Division of Trading and Markets Office of Interpretation and Guidance Log and email box
PERFORMANCE INDICATOR (CONTEXTUAL) 1.3.1 Number of published economic reports
Description: This indicator gauges the number of economic reports that staff of the Division of Economic and Risk Analysis publishes annually on the SEC’s website.
Fiscal Year FY 2011 FY 2012 FY 2013 FY 2014 FY 2015FY 2016 Actual
Number of reports N/A N/A 23 15 29 22
Responsible Division/Office: Division of Economic and Risk Analysis
Data Source: SEC.gov
PERFORMANCE INDICATOR (PROCESS) 1.3.2 Number of amendments to national securities exchange registrations (Form 1)
Description: This indicator provides information about the volume of material filed with the SEC that involves amendments to exchange registrations.
Fiscal Year FY 2011 FY 2012 FY 2013 FY 2014 FY 2015FY 2016 Actual
Number of amendments Prior-year data not available 117 161 160
Responsible Division/Office: Division of Trading and Markets
Data Source: Manual spreadsheets
FY 2016 ANNUAL PERFORMANCE REPORT AND FY 2018 ANNUAL PERFORMANCE PLAN | 27
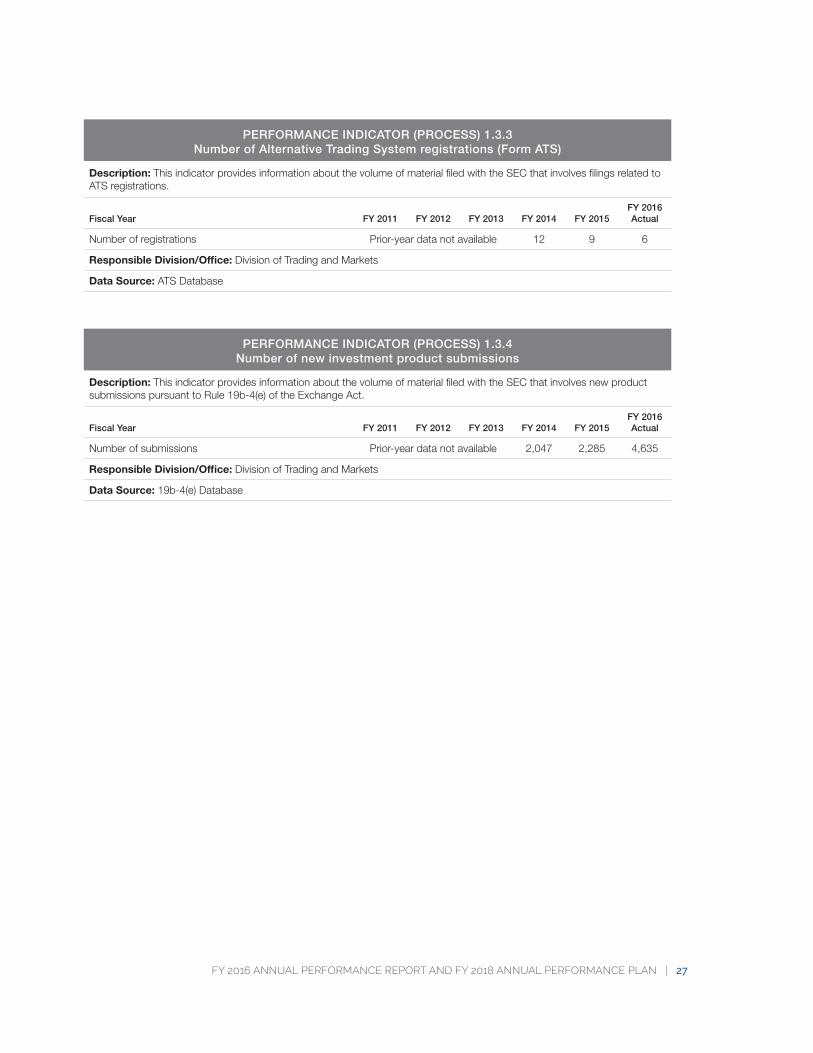
PERFORMANCE INDICATOR (PROCESS) 1.3.3 Number of Alternative Trading System registrations (Form ATS)
Description: This indicator provides information about the volume of material filed with the SEC that involves filings related to ATS registrations.
Fiscal Year FY 2011 FY 2012 FY 2013 FY 2014 FY 2015FY 2016 Actual
Number of registrations Prior-year data not available 12 9 6
Responsible Division/Office: Division of Trading and Markets
Data Source: ATS Database
PERFORMANCE INDICATOR (PROCESS) 1.3.4 Number of new investment product submissions
Description: This indicator provides information about the volume of material filed with the SEC that involves new product submissions pursuant to Rule 19b-4(e) of the Exchange Act.
Fiscal Year FY 2011 FY 2012 FY 2013 FY 2014 FY 2015FY 2016 Actual
Number of submissions Prior-year data not available 2,047 2,285 4,635
Responsible Division/Office: Division of Trading and Markets
Data Source: 19b-4(e) Database
28 | FY 2018 CONGRESSIONAL BUDGET JUSTIFICATION
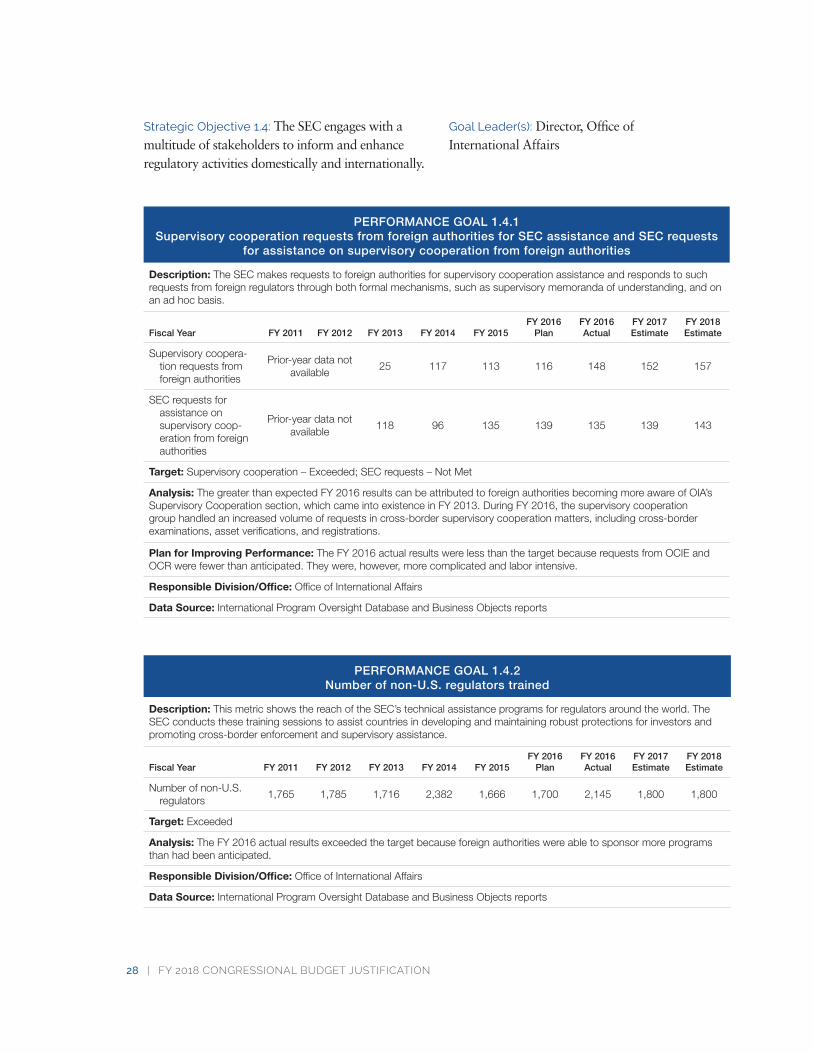
Strategic Objective 1.4: The SEC engages with a multitude of stakeholders to inform and enhance regulatory activities domestically and internationally.
Goal Leader(s): Director, Office of International Affairs
PERFORMANCE GOAL 1.4.1 Supervisory cooperation requests from foreign authorities for SEC assistance and SEC requests
for assistance on supervisory cooperation from foreign authorities
Description: The SEC makes requests to foreign authorities for supervisory cooperation assistance and responds to such requests from foreign regulators through both formal mechanisms, such as supervisory memoranda of understanding, and on an ad hoc basis.
Fiscal Year FY 2011 FY 2012 FY 2013 FY 2014 FY 2015FY 2016
PlanFY 2016 Actual
FY 2017 Estimate
FY 2018 Estimate
Supervisory coopera-tion requests from foreign authorities
Prior-year data not available
25 117 113 116 148 152 157
SEC requests for assistance on supervisory coop-eration from foreign authorities
Prior-year data not available
118 96 135 139 135 139 143
Target: Supervisory cooperation – Exceeded; SEC requests – Not Met
Analysis: The greater than expected FY 2016 results can be attributed to foreign authorities becoming more aware of OIA’s Supervisory Cooperation section, which came into existence in FY 2013. During FY 2016, the supervisory cooperation group handled an increased volume of requests in cross-border supervisory cooperation matters, including cross-border examinations, asset verifications, and registrations.
Plan for Improving Performance: The FY 2016 actual results were less than the target because requests from OCIE and OCR were fewer than anticipated. They were, however, more complicated and labor intensive.
Responsible Division/Office: Office of International Affairs
Data Source: International Program Oversight Database and Business Objects reports
PERFORMANCE GOAL 1.4.2 Number of non-U.S. regulators trained
Description: This metric shows the reach of the SEC’s technical assistance programs for regulators around the world. The SEC conducts these training sessions to assist countries in developing and maintaining robust protections for investors and promoting cross-border enforcement and supervisory assistance.
Fiscal Year FY 2011 FY 2012 FY 2013 FY 2014 FY 2015FY 2016
PlanFY 2016 Actual
FY 2017 Estimate
FY 2018 Estimate
Number of non-U.S. regulators
1,765 1,785 1,716 2,382 1,666 1,700 2,145 1,800 1,800
Target: Exceeded
Analysis: The FY 2016 actual results exceeded the target because foreign authorities were able to sponsor more programs than had been anticipated.
Responsible Division/Office: Office of International Affairs
Data Source: International Program Oversight Database and Business Objects reports
FY 2016 ANNUAL PERFORMANCE REPORT AND FY 2018 ANNUAL PERFORMANCE PLAN | 29
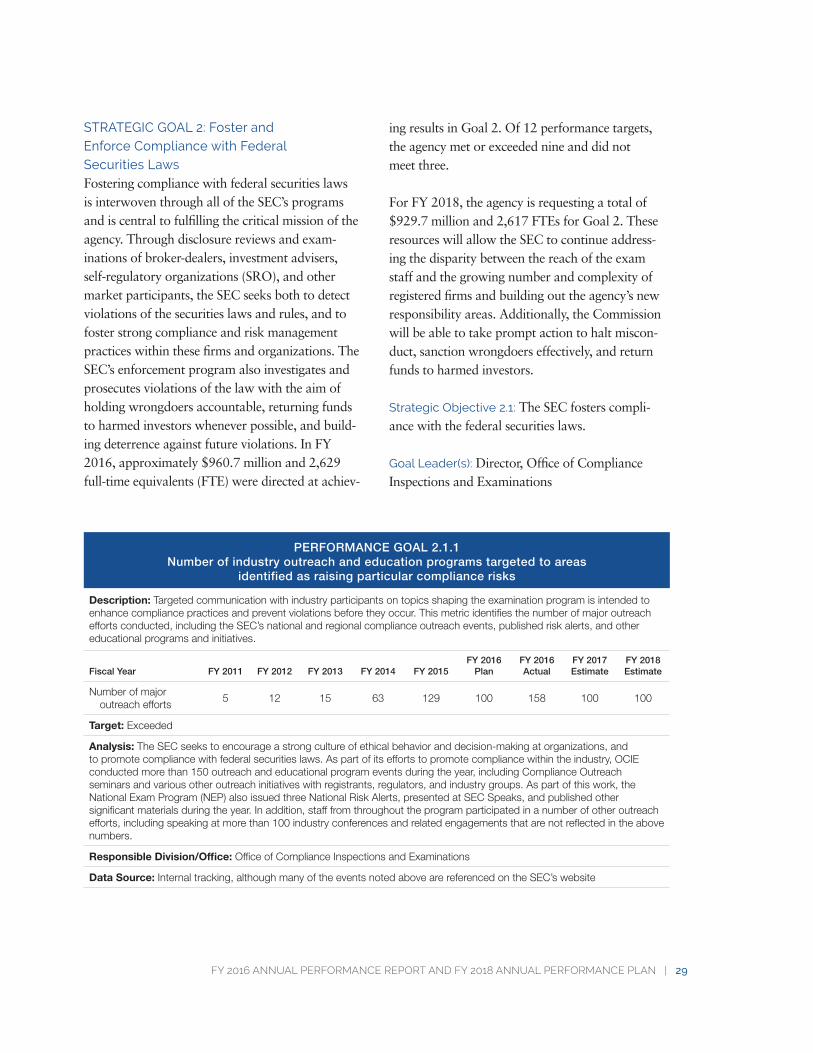
STRATEGIC GOAL 2: Foster and Enforce Compliance with Federal Securities LawsFostering compliance with federal securities laws is interwoven through all of the SEC’s programs and is central to fulfilling the critical mission of the agency. Through disclosure reviews and exam-inations of broker-dealers, investment advisers, self-regulatory organizations (SRO), and other market participants, the SEC seeks both to detect violations of the securities laws and rules, and to foster strong compliance and risk management practices within these firms and organizations. The SEC’s enforcement program also investigates and prosecutes violations of the law with the aim of holding wrongdoers accountable, returning funds to harmed investors whenever possible, and build-ing deterrence against future violations. In FY 2016, approximately $960.7 million and 2,629 full-time equivalents (FTE) were directed at achiev-
ing results in Goal 2. Of 12 performance targets, the agency met or exceeded nine and did not meet three.
For FY 2018, the agency is requesting a total of $929.7 million and 2,617 FTEs for Goal 2. These resources will allow the SEC to continue address-ing the disparity between the reach of the exam staff and the growing number and complexity of registered firms and building out the agency’s new responsibility areas. Additionally, the Commission will be able to take prompt action to halt miscon-duct, sanction wrongdoers effectively, and return funds to harmed investors.
Strategic Objective 2.1: The SEC fosters compli-ance with the federal securities laws.
Goal Leader(s): Director, Office of Compliance Inspections and Examinations
PERFORMANCE GOAL 2.1.1 Number of industry outreach and education programs targeted to areas
identified as raising particular compliance risks
Description: Targeted communication with industry participants on topics shaping the examination program is intended to enhance compliance practices and prevent violations before they occur. This metric identifies the number of major outreach efforts conducted, including the SEC’s national and regional compliance outreach events, published risk alerts, and other educational programs and initiatives.
Fiscal Year FY 2011 FY 2012 FY 2013 FY 2014 FY 2015FY 2016
PlanFY 2016 Actual
FY 2017 Estimate
FY 2018 Estimate
Number of major outreach efforts
5 12 15 63 129 100 158 100 100
Target: Exceeded
Analysis: The SEC seeks to encourage a strong culture of ethical behavior and decision-making at organizations, and to promote compliance with federal securities laws. As part of its efforts to promote compliance within the industry, OCIE conducted more than 150 outreach and educational program events during the year, including Compliance Outreach seminars and various other outreach initiatives with registrants, regulators, and industry groups. As part of this work, the National Exam Program (NEP) also issued three National Risk Alerts, presented at SEC Speaks, and published other significant materials during the year. In addition, staff from throughout the program participated in a number of other outreach efforts, including speaking at more than 100 industry conferences and related engagements that are not reflected in the above numbers.
Responsible Division/Office: Office of Compliance Inspections and Examinations
Data Source: Internal tracking, although many of the events noted above are referenced on the SEC’s website
30 | FY 2018 CONGRESSIONAL BUDGET JUSTIFICATION
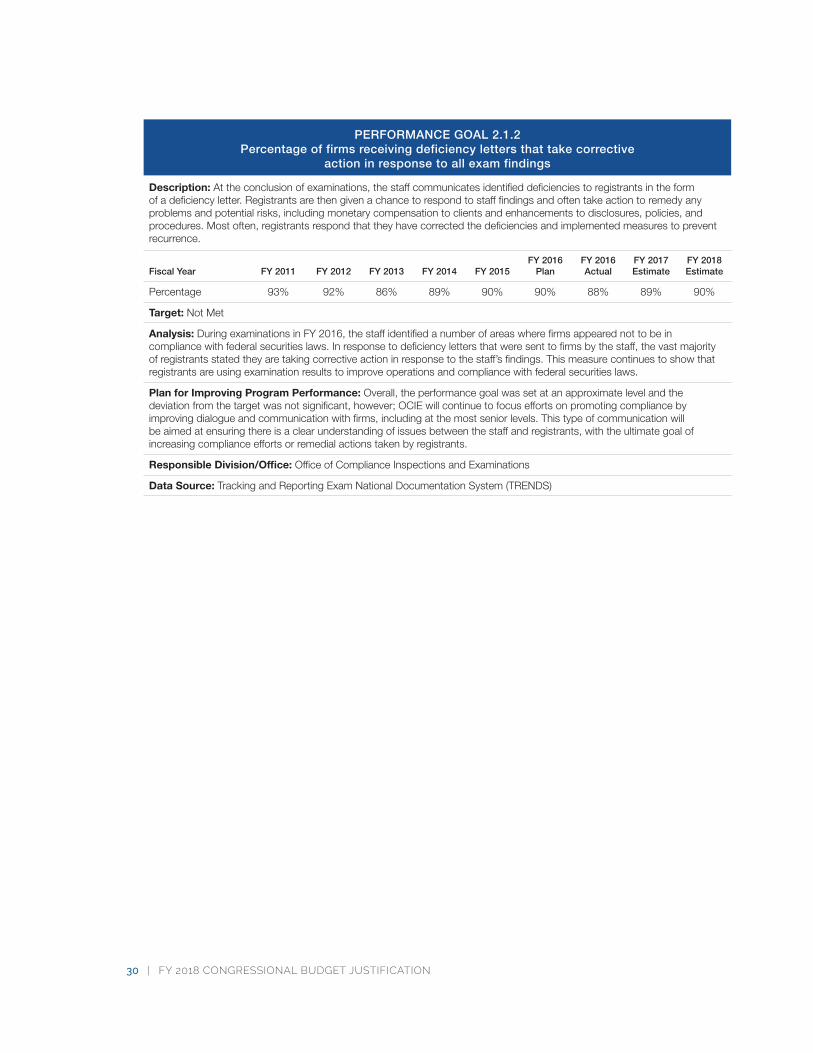
PERFORMANCE GOAL 2.1.2 Percentage of firms receiving deficiency letters that take corrective
action in response to all exam findings
Description: At the conclusion of examinations, the staff communicates identified deficiencies to registrants in the form of a deficiency letter. Registrants are then given a chance to respond to staff findings and often take action to remedy any problems and potential risks, including monetary compensation to clients and enhancements to disclosures, policies, and procedures. Most often, registrants respond that they have corrected the deficiencies and implemented measures to prevent recurrence.
Fiscal Year FY 2011 FY 2012 FY 2013 FY 2014 FY 2015FY 2016
PlanFY 2016 Actual
FY 2017 Estimate
FY 2018 Estimate
Percentage 93% 92% 86% 89% 90% 90% 88% 89% 90%
Target: Not Met
Analysis: During examinations in FY 2016, the staff identified a number of areas where firms appeared not to be in compliance with federal securities laws. In response to deficiency letters that were sent to firms by the staff, the vast majority of registrants stated they are taking corrective action in response to the staff’s findings. This measure continues to show that registrants are using examination results to improve operations and compliance with federal securities laws.
Plan for Improving Program Performance: Overall, the performance goal was set at an approximate level and the deviation from the target was not significant, however; OCIE will continue to focus efforts on promoting compliance by improving dialogue and communication with firms, including at the most senior levels. This type of communication will be aimed at ensuring there is a clear understanding of issues between the staff and registrants, with the ultimate goal of increasing compliance efforts or remedial actions taken by registrants.
Responsible Division/Office: Office of Compliance Inspections and Examinations
Data Source: Tracking and Reporting Exam National Documentation System (TRENDS)
FY 2016 ANNUAL PERFORMANCE REPORT AND FY 2018 ANNUAL PERFORMANCE PLAN | 31
Strategic Objective 2.2: The SEC promptly detects and deters violations of the federal securities laws.
Goal Leader(s): Director, Office of Compliance Inspections and Examinations
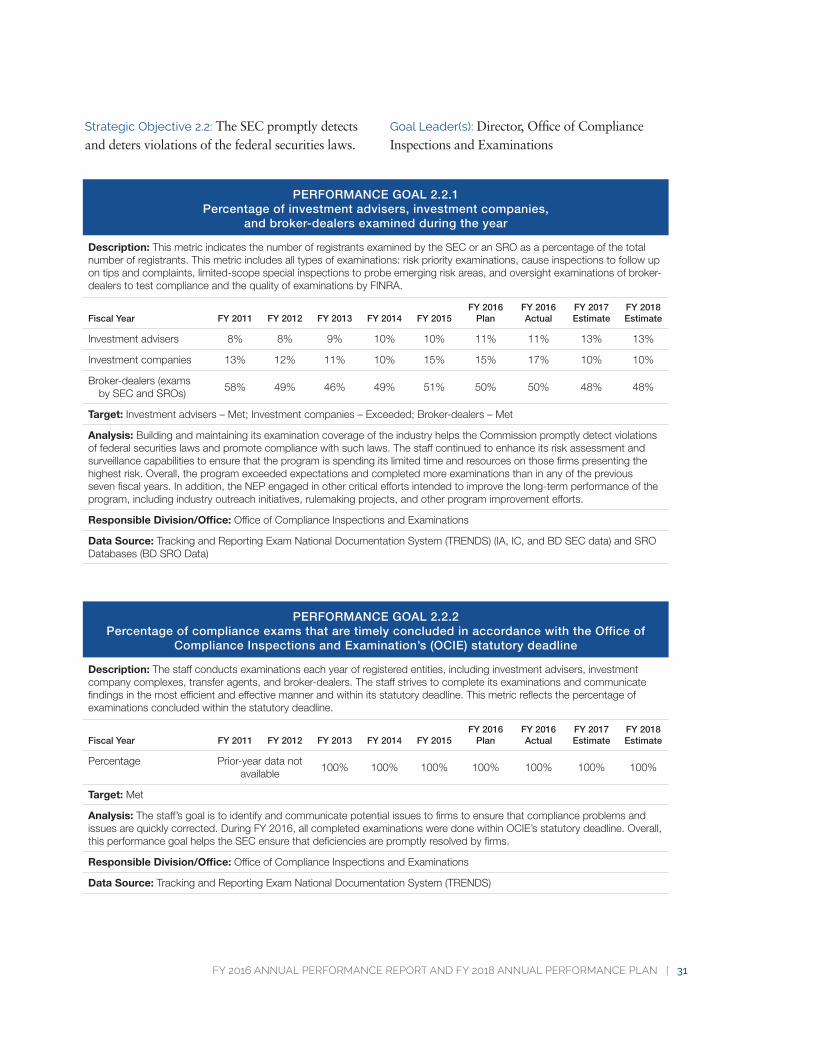
PERFORMANCE GOAL 2.2.1 Percentage of investment advisers, investment companies,
and broker-dealers examined during the year
Description: This metric indicates the number of registrants examined by the SEC or an SRO as a percentage of the total number of registrants. This metric includes all types of examinations: risk priority examinations, cause inspections to follow up on tips and complaints, limited-scope special inspections to probe emerging risk areas, and oversight examinations of broker-dealers to test compliance and the quality of examinations by FINRA.
Fiscal Year FY 2011 FY 2012 FY 2013 FY 2014 FY 2015FY 2016
PlanFY 2016 Actual
FY 2017 Estimate
FY 2018 Estimate
Investment advisers 8% 8% 9% 10% 10% 11% 11% 13% 13%
Investment companies 13% 12% 11% 10% 15% 15% 17% 10% 10%
Broker-dealers (exams by SEC and SROs)
58% 49% 46% 49% 51% 50% 50% 48% 48%
Target: Investment advisers – Met; Investment companies – Exceeded; Broker-dealers – Met
Analysis: Building and maintaining its examination coverage of the industry helps the Commission promptly detect violations of federal securities laws and promote compliance with such laws. The staff continued to enhance its risk assessment and surveillance capabilities to ensure that the program is spending its limited time and resources on those firms presenting the highest risk. Overall, the program exceeded expectations and completed more examinations than in any of the previous seven fiscal years. In addition, the NEP engaged in other critical efforts intended to improve the long-term performance of the program, including industry outreach initiatives, rulemaking projects, and other program improvement efforts.
Responsible Division/Office: Office of Compliance Inspections and Examinations
Data Source: Tracking and Reporting Exam National Documentation System (TRENDS) (IA, IC, and BD SEC data) and SRO Databases (BD SRO Data)
PERFORMANCE GOAL 2.2.2 Percentage of compliance exams that are timely concluded in accordance with the Office of
Compliance Inspections and Examination’s (OCIE) statutory deadline
Description: The staff conducts examinations each year of registered entities, including investment advisers, investment company complexes, transfer agents, and broker-dealers. The staff strives to complete its examinations and communicate findings in the most efficient and effective manner and within its statutory deadline. This metric reflects the percentage of examinations concluded within the statutory deadline.
Fiscal Year FY 2011 FY 2012 FY 2013 FY 2014 FY 2015FY 2016
PlanFY 2016 Actual
FY 2017 Estimate
FY 2018 Estimate
Percentage Prior-year data not available
100% 100% 100% 100% 100% 100% 100%
Target: Met
Analysis: The staff’s goal is to identify and communicate potential issues to firms to ensure that compliance problems and issues are quickly corrected. During FY 2016, all completed examinations were done within OCIE’s statutory deadline. Overall, this performance goal helps the SEC ensure that deficiencies are promptly resolved by firms.
Responsible Division/Office: Office of Compliance Inspections and Examinations
Data Source: Tracking and Reporting Exam National Documentation System (TRENDS)
32 | FY 2018 CONGRESSIONAL BUDGET JUSTIFICATION
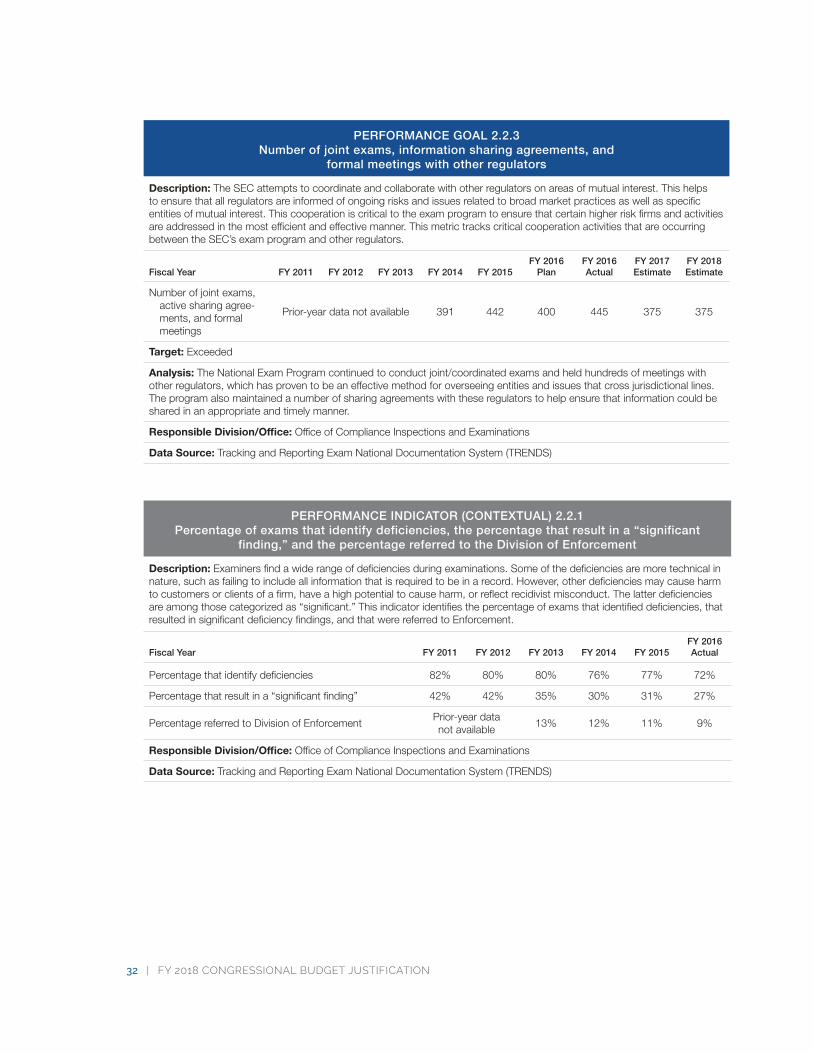
PERFORMANCE GOAL 2.2.3 Number of joint exams, information sharing agreements, and
formal meetings with other regulators
Description: The SEC attempts to coordinate and collaborate with other regulators on areas of mutual interest. This helps to ensure that all regulators are informed of ongoing risks and issues related to broad market practices as well as specific entities of mutual interest. This cooperation is critical to the exam program to ensure that certain higher risk firms and activities are addressed in the most efficient and effective manner. This metric tracks critical cooperation activities that are occurring between the SEC’s exam program and other regulators.
Fiscal Year FY 2011 FY 2012 FY 2013 FY 2014 FY 2015FY 2016
PlanFY 2016 Actual
FY 2017 Estimate
FY 2018 Estimate
Number of joint exams, active sharing agree-ments, and formal meetings
Prior-year data not available 391 442 400 445 375 375
Target: Exceeded
Analysis: The National Exam Program continued to conduct joint/coordinated exams and held hundreds of meetings with other regulators, which has proven to be an effective method for overseeing entities and issues that cross jurisdictional lines. The program also maintained a number of sharing agreements with these regulators to help ensure that information could be shared in an appropriate and timely manner.
Responsible Division/Office: Office of Compliance Inspections and Examinations
Data Source: Tracking and Reporting Exam National Documentation System (TRENDS)
PERFORMANCE INDICATOR (CONTEXTUAL) 2.2.1 Percentage of exams that identify deficiencies, the percentage that result in a “significant
finding,” and the percentage referred to the Division of Enforcement
Description: Examiners find a wide range of deficiencies during examinations. Some of the deficiencies are more technical in nature, such as failing to include all information that is required to be in a record. However, other deficiencies may cause harm to customers or clients of a firm, have a high potential to cause harm, or reflect recidivist misconduct. The latter deficiencies are among those categorized as “significant.” This indicator identifies the percentage of exams that identified deficiencies, that resulted in significant deficiency findings, and that were referred to Enforcement.
Fiscal Year FY 2011 FY 2012 FY 2013 FY 2014 FY 2015FY 2016 Actual
Percentage that identify deficiencies 82% 80% 80% 76% 77% 72%
Percentage that result in a “significant finding” 42% 42% 35% 30% 31% 27%
Percentage referred to Division of EnforcementPrior-year data not available
13% 12% 11% 9%
Responsible Division/Office: Office of Compliance Inspections and Examinations
Data Source: Tracking and Reporting Exam National Documentation System (TRENDS)
FY 2016 ANNUAL PERFORMANCE REPORT AND FY 2018 ANNUAL PERFORMANCE PLAN | 33
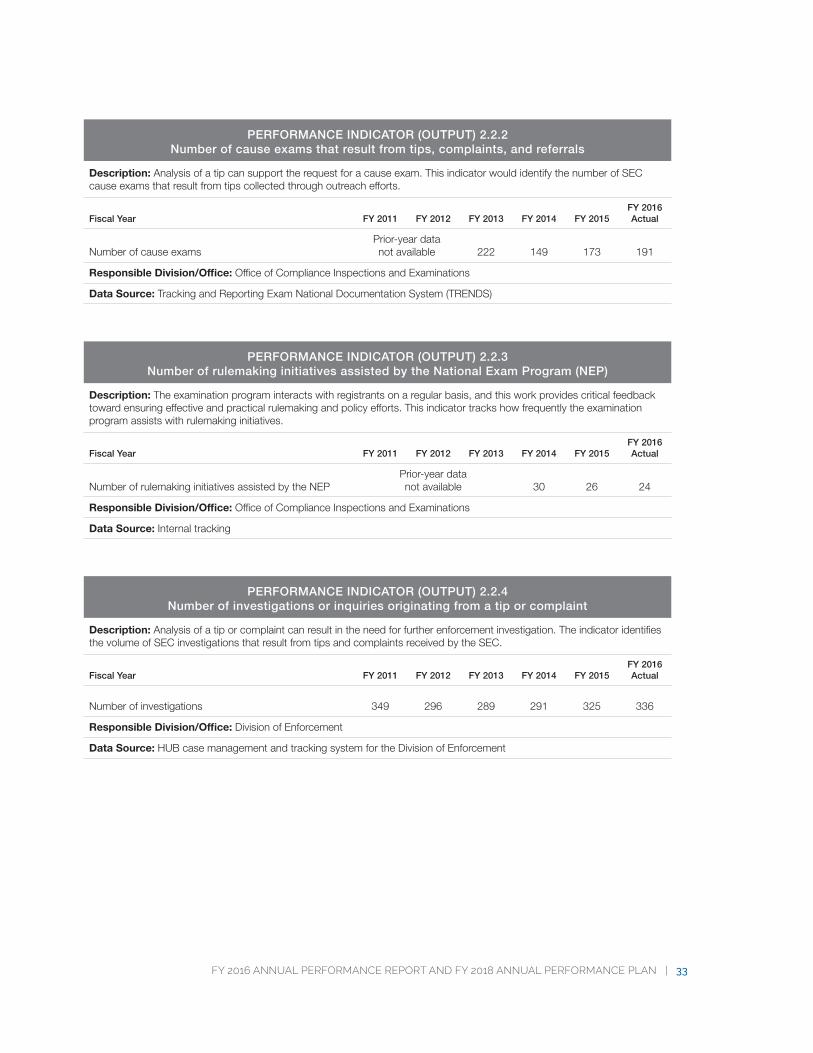
PERFORMANCE INDICATOR (OUTPUT) 2.2.2 Number of cause exams that result from tips, complaints, and referrals
Description: Analysis of a tip can support the request for a cause exam. This indicator would identify the number of SEC cause exams that result from tips collected through outreach efforts.
Fiscal Year FY 2011 FY 2012 FY 2013 FY 2014 FY 2015FY 2016 Actual
Number of cause examsPrior-year data not available 222 149 173 191
Responsible Division/Office: Office of Compliance Inspections and Examinations
Data Source: Tracking and Reporting Exam National Documentation System (TRENDS)
PERFORMANCE INDICATOR (OUTPUT) 2.2.3 Number of rulemaking initiatives assisted by the National Exam Program (NEP)
Description: The examination program interacts with registrants on a regular basis, and this work provides critical feedback toward ensuring effective and practical rulemaking and policy efforts. This indicator tracks how frequently the examination program assists with rulemaking initiatives.
Fiscal Year FY 2011 FY 2012 FY 2013 FY 2014 FY 2015FY 2016 Actual
Number of rulemaking initiatives assisted by the NEPPrior-year data not available 30 26 24
Responsible Division/Office: Office of Compliance Inspections and Examinations
Data Source: Internal tracking
PERFORMANCE INDICATOR (OUTPUT) 2.2.4 Number of investigations or inquiries originating from a tip or complaint
Description: Analysis of a tip or complaint can result in the need for further enforcement investigation. The indicator identifies the volume of SEC investigations that result from tips and complaints received by the SEC.
Fiscal Year FY 2011 FY 2012 FY 2013 FY 2014 FY 2015FY 2016 Actual
Number of investigations 349 296 289 291 325 336
Responsible Division/Office: Division of Enforcement
Data Source: HUB case management and tracking system for the Division of Enforcement
34 | FY 2018 CONGRESSIONAL BUDGET JUSTIFICATION
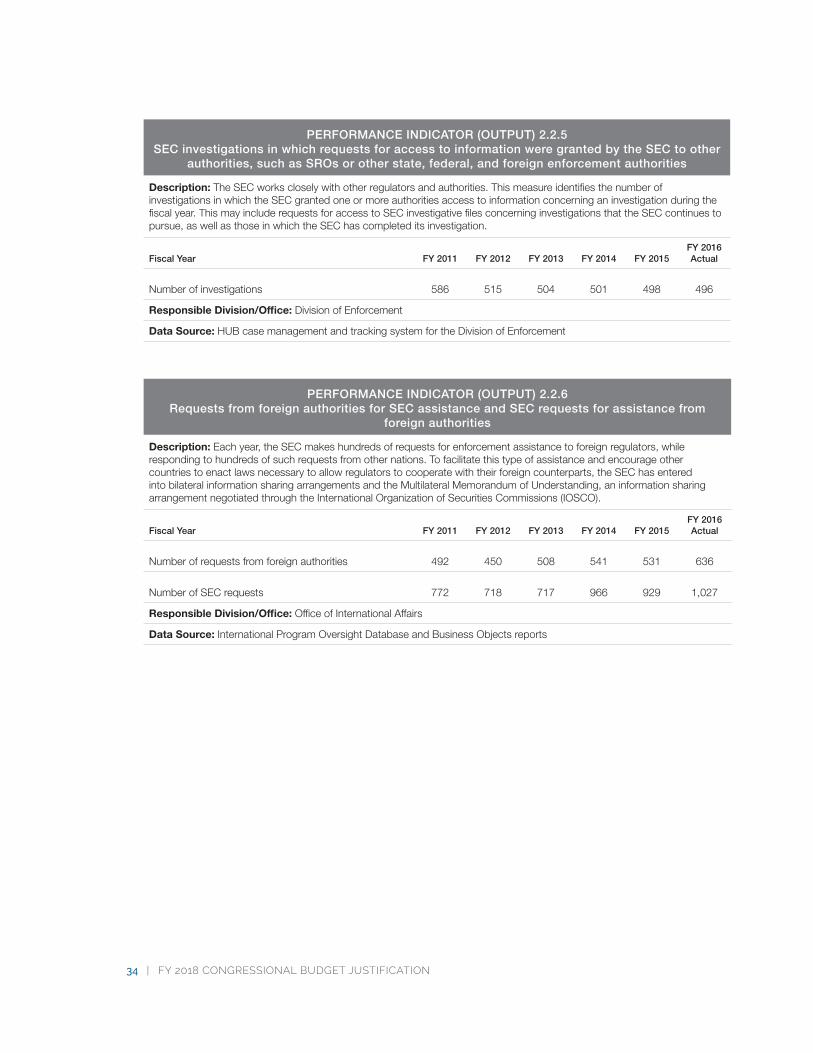
PERFORMANCE INDICATOR (OUTPUT) 2.2.5 SEC investigations in which requests for access to information were granted by the SEC to other
authorities, such as SROs or other state, federal, and foreign enforcement authorities
Description: The SEC works closely with other regulators and authorities. This measure identifies the number of investigations in which the SEC granted one or more authorities access to information concerning an investigation during the fiscal year. This may include requests for access to SEC investigative files concerning investigations that the SEC continues to pursue, as well as those in which the SEC has completed its investigation.
Fiscal Year FY 2011 FY 2012 FY 2013 FY 2014 FY 2015FY 2016 Actual
Number of investigations 586 515 504 501 498 496
Responsible Division/Office: Division of Enforcement
Data Source: HUB case management and tracking system for the Division of Enforcement
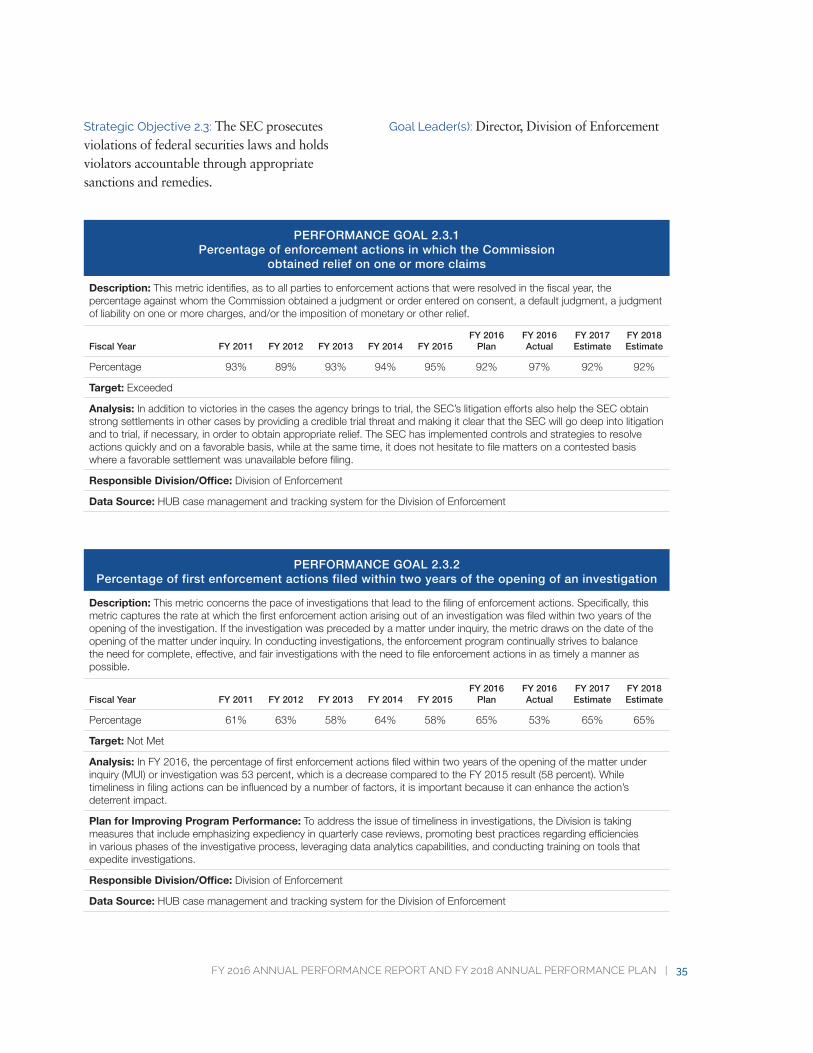
PERFORMANCE INDICATOR (OUTPUT) 2.2.6 Requests from foreign authorities for SEC assistance and SEC requests for assistance from
foreign authorities
Description: Each year, the SEC makes hundreds of requests for enforcement assistance to foreign regulators, while responding to hundreds of such requests from other nations. To facilitate this type of assistance and encourage other countries to enact laws necessary to allow regulators to cooperate with their foreign counterparts, the SEC has entered into bilateral information sharing arrangements and the Multilateral Memorandum of Understanding, an information sharing arrangement negotiated through the International Organization of Securities Commissions (IOSCO).
Fiscal Year FY 2011 FY 2012 FY 2013 FY 2014 FY 2015FY 2016 Actual
Number of requests from foreign authorities 492 450 508 541 531 636
Number of SEC requests 772 718 717 966 929 1,027
Responsible Division/Office: Office of International Affairs
Data Source: International Program Oversight Database and Business Objects reports
FY 2016 ANNUAL PERFORMANCE REPORT AND FY 2018 ANNUAL PERFORMANCE PLAN | 35
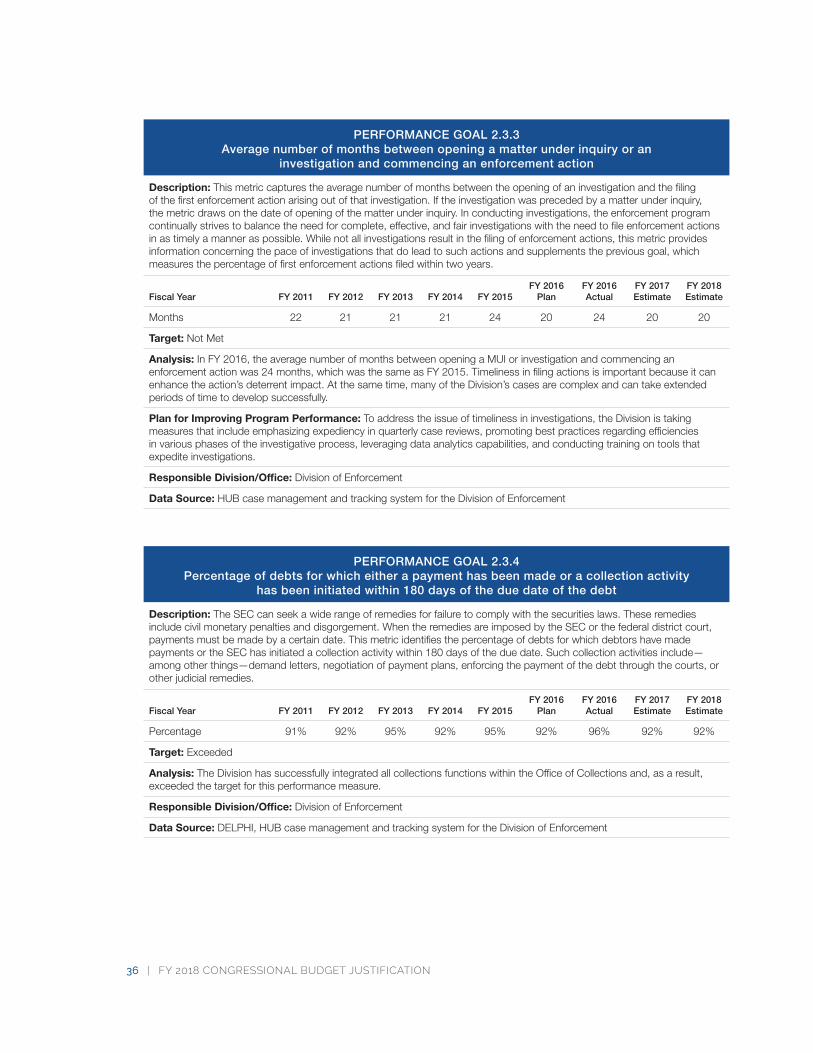
Strategic Objective 2.3: The SEC prosecutes violations of federal securities laws and holds violators accountable through appropriate sanctions and remedies.
Goal Leader(s): Director, Division of Enforcement
PERFORMANCE GOAL 2.3.1 Percentage of enforcement actions in which the Commission
obtained relief on one or more claims
Description: This metric identifies, as to all parties to enforcement actions that were resolved in the fiscal year, the percentage against whom the Commission obtained a judgment or order entered on consent, a default judgment, a judgment of liability on one or more charges, and/or the imposition of monetary or other relief.
Fiscal Year FY 2011 FY 2012 FY 2013 FY 2014 FY 2015FY 2016
PlanFY 2016 Actual
FY 2017 Estimate
FY 2018 Estimate
Percentage 93% 89% 93% 94% 95% 92% 97% 92% 92%
Target: Exceeded
Analysis: In addition to victories in the cases the agency brings to trial, the SEC’s litigation efforts also help the SEC obtain strong settlements in other cases by providing a credible trial threat and making it clear that the SEC will go deep into litigation and to trial, if necessary, in order to obtain appropriate relief. The SEC has implemented controls and strategies to resolve actions quickly and on a favorable basis, while at the same time, it does not hesitate to file matters on a contested basis where a favorable settlement was unavailable before filing.
Responsible Division/Office: Division of Enforcement
Data Source: HUB case management and tracking system for the Division of Enforcement
PERFORMANCE GOAL 2.3.2 Percentage of first enforcement actions filed within two years of the opening of an investigation
Description: This metric concerns the pace of investigations that lead to the filing of enforcement actions. Specifically, this metric captures the rate at which the first enforcement action arising out of an investigation was filed within two years of the opening of the investigation. If the investigation was preceded by a matter under inquiry, the metric draws on the date of the opening of the matter under inquiry. In conducting investigations, the enforcement program continually strives to balance the need for complete, effective, and fair investigations with the need to file enforcement actions in as timely a manner as possible.
Fiscal Year FY 2011 FY 2012 FY 2013 FY 2014 FY 2015FY 2016
PlanFY 2016 Actual
FY 2017 Estimate
FY 2018 Estimate
Percentage 61% 63% 58% 64% 58% 65% 53% 65% 65%
Target: Not Met
Analysis: In FY 2016, the percentage of first enforcement actions filed within two years of the opening of the matter under inquiry (MUI) or investigation was 53 percent, which is a decrease compared to the FY 2015 result (58 percent). While timeliness in filing actions can be influenced by a number of factors, it is important because it can enhance the action’s deterrent impact.
Plan for Improving Program Performance: To address the issue of timeliness in investigations, the Division is taking measures that include emphasizing expediency in quarterly case reviews, promoting best practices regarding efficiencies in various phases of the investigative process, leveraging data analytics capabilities, and conducting training on tools that expedite investigations.
Responsible Division/Office: Division of Enforcement
Data Source: HUB case management and tracking system for the Division of Enforcement
36 | FY 2018 CONGRESSIONAL BUDGET JUSTIFICATION
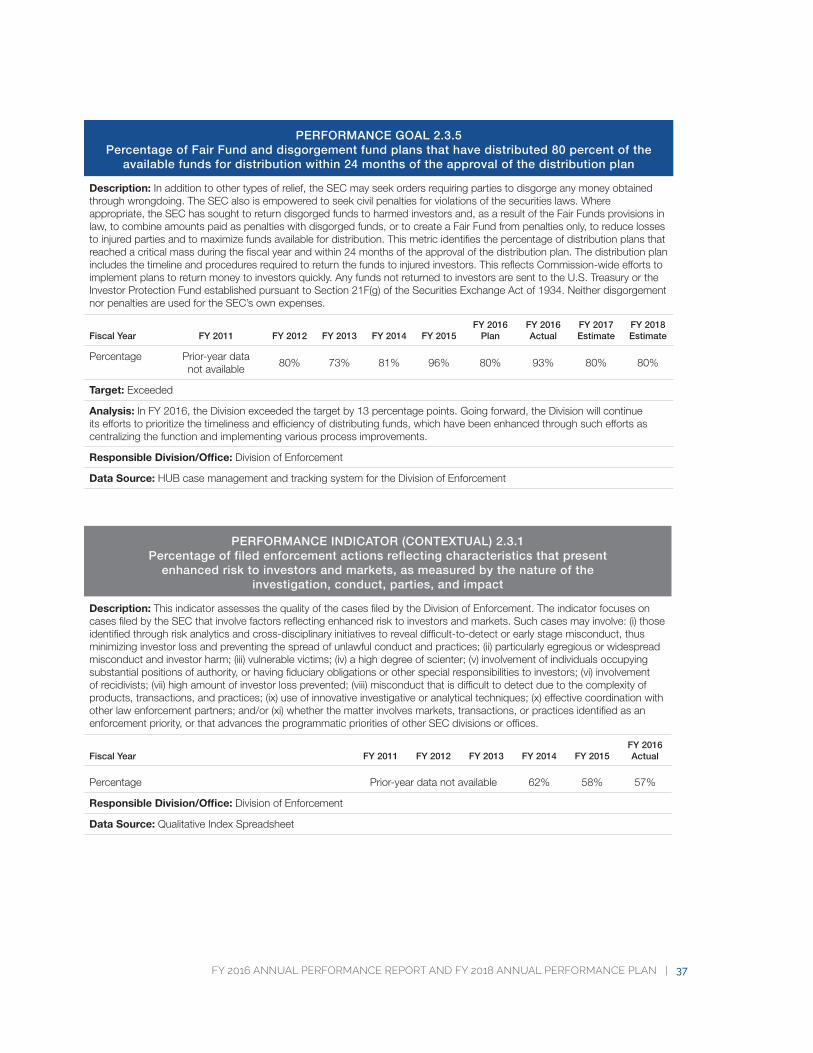
PERFORMANCE GOAL 2.3.3 Average number of months between opening a matter under inquiry or an
investigation and commencing an enforcement action
Description: This metric captures the average number of months between the opening of an investigation and the filing of the first enforcement action arising out of that investigation. If the investigation was preceded by a matter under inquiry, the metric draws on the date of opening of the matter under inquiry. In conducting investigations, the enforcement program continually strives to balance the need for complete, effective, and fair investigations with the need to file enforcement actions in as timely a manner as possible. While not all investigations result in the filing of enforcement actions, this metric provides information concerning the pace of investigations that do lead to such actions and supplements the previous goal, which measures the percentage of first enforcement actions filed within two years.
Fiscal Year FY 2011 FY 2012 FY 2013 FY 2014 FY 2015FY 2016
PlanFY 2016 Actual
FY 2017 Estimate
FY 2018 Estimate
Months 22 21 21 21 24 20 24 20 20
Target: Not Met
Analysis: In FY 2016, the average number of months between opening a MUI or investigation and commencing an enforcement action was 24 months, which was the same as FY 2015. Timeliness in filing actions is important because it can enhance the action’s deterrent impact. At the same time, many of the Division’s cases are complex and can take extended periods of time to develop successfully.
Plan for Improving Program Performance: To address the issue of timeliness in investigations, the Division is taking measures that include emphasizing expediency in quarterly case reviews, promoting best practices regarding efficiencies in various phases of the investigative process, leveraging data analytics capabilities, and conducting training on tools that expedite investigations.
Responsible Division/Office: Division of Enforcement
Data Source: HUB case management and tracking system for the Division of Enforcement
PERFORMANCE GOAL 2.3.4 Percentage of debts for which either a payment has been made or a collection activity
has been initiated within 180 days of the due date of the debt
Description: The SEC can seek a wide range of remedies for failure to comply with the securities laws. These remedies include civil monetary penalties and disgorgement. When the remedies are imposed by the SEC or the federal district court, payments must be made by a certain date. This metric identifies the percentage of debts for which debtors have made payments or the SEC has initiated a collection activity within 180 days of the due date. Such collection activities include— among other things —demand letters, negotiation of payment plans, enforcing the payment of the debt through the courts, or other judicial remedies.
Fiscal Year FY 2011 FY 2012 FY 2013 FY 2014 FY 2015FY 2016
PlanFY 2016 Actual
FY 2017 Estimate
FY 2018 Estimate
Percentage 91% 92% 95% 92% 95% 92% 96% 92% 92%
Target: Exceeded
Analysis: The Division has successfully integrated all collections functions within the Office of Collections and, as a result, exceeded the target for this performance measure.
Responsible Division/Office: Division of Enforcement
Data Source: DELPHI, HUB case management and tracking system for the Division of Enforcement
FY 2016 ANNUAL PERFORMANCE REPORT AND FY 2018 ANNUAL PERFORMANCE PLAN | 37
PERFORMANCE GOAL 2.3.5 Percentage of Fair Fund and disgorgement fund plans that have distributed 80 percent of the
available funds for distribution within 24 months of the approval of the distribution plan
Description: In addition to other types of relief, the SEC may seek orders requiring parties to disgorge any money obtained through wrongdoing. The SEC also is empowered to seek civil penalties for violations of the securities laws. Where appropriate, the SEC has sought to return disgorged funds to harmed investors and, as a result of the Fair Funds provisions in law, to combine amounts paid as penalties with disgorged funds, or to create a Fair Fund from penalties only, to reduce losses to injured parties and to maximize funds available for distribution. This metric identifies the percentage of distribution plans that reached a critical mass during the fiscal year and within 24 months of the approval of the distribution plan. The distribution plan includes the timeline and procedures required to return the funds to injured investors. This reflects Commission-wide efforts to implement plans to return money to investors quickly. Any funds not returned to investors are sent to the U.S. Treasury or the Investor Protection Fund established pursuant to Section 21F(g) of the Securities Exchange Act of 1934. Neither disgorgement nor penalties are used for the SEC’s own expenses.
Fiscal Year FY 2011 FY 2012 FY 2013 FY 2014 FY 2015FY 2016
PlanFY 2016 Actual
FY 2017 Estimate
FY 2018 Estimate
Percentage Prior-year data not available
80% 73% 81% 96% 80% 93% 80% 80%
Target: Exceeded
Analysis: In FY 2016, the Division exceeded the target by 13 percentage points. Going forward, the Division will continue its efforts to prioritize the timeliness and efficiency of distributing funds, which have been enhanced through such efforts as centralizing the function and implementing various process improvements.
Responsible Division/Office: Division of Enforcement
Data Source: HUB case management and tracking system for the Division of Enforcement
PERFORMANCE INDICATOR (CONTEXTUAL) 2.3.1 Percentage of filed enforcement actions reflecting characteristics that present
enhanced risk to investors and markets, as measured by the nature of the investigation, conduct, parties, and impact
Description: This indicator assesses the quality of the cases filed by the Division of Enforcement. The indicator focuses on cases filed by the SEC that involve factors reflecting enhanced risk to investors and markets. Such cases may involve: (i) those identified through risk analytics and cross-disciplinary initiatives to reveal difficult-to-detect or early stage misconduct, thus minimizing investor loss and preventing the spread of unlawful conduct and practices; (ii) particularly egregious or widespread misconduct and investor harm; (iii) vulnerable victims; (iv) a high degree of scienter; (v) involvement of individuals occupying substantial positions of authority, or having fiduciary obligations or other special responsibilities to investors; (vi) involvement of recidivists; (vii) high amount of investor loss prevented; (viii) misconduct that is difficult to detect due to the complexity of products, transactions, and practices; (ix) use of innovative investigative or analytical techniques; (x) effective coordination with other law enforcement partners; and/or (xi) whether the matter involves markets, transactions, or practices identified as an enforcement priority, or that advances the programmatic priorities of other SEC divisions or offices.
Fiscal Year FY 2011 FY 2012 FY 2013 FY 2014 FY 2015FY 2016 Actual
Percentage Prior-year data not available 62% 58% 57%
Responsible Division/Office: Division of Enforcement
Data Source: Qualitative Index Spreadsheet
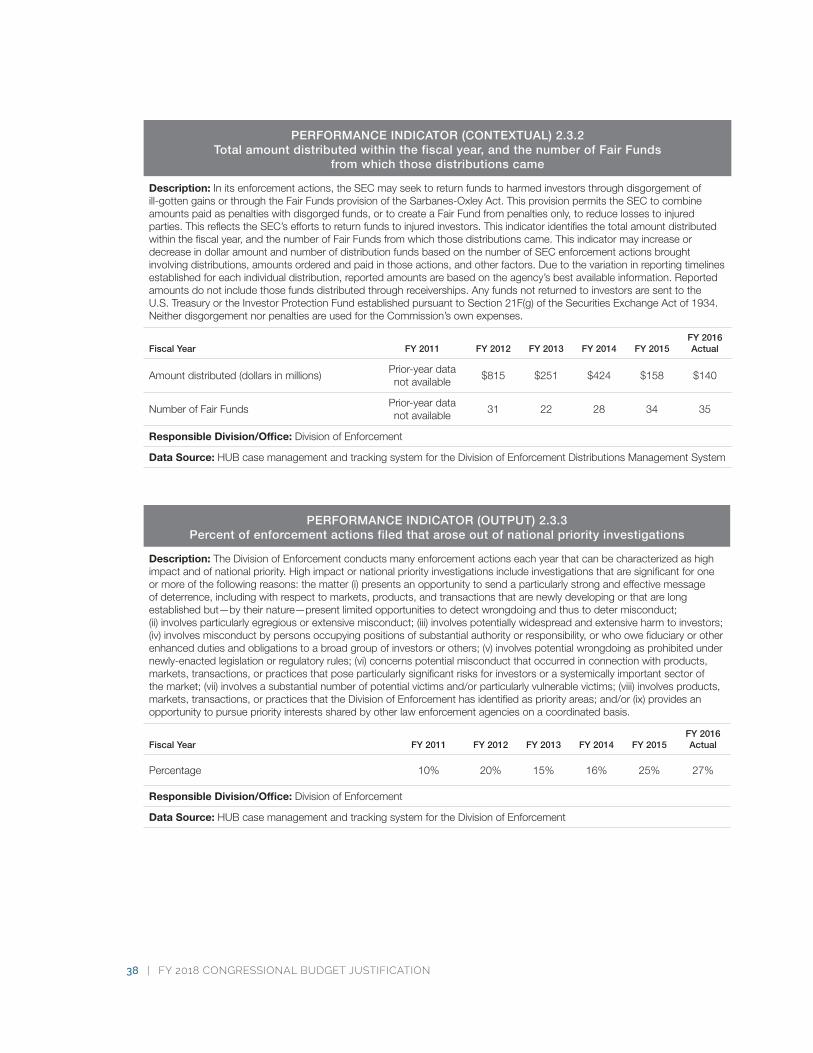
38 | FY 2018 CONGRESSIONAL BUDGET JUSTIFICATION
PERFORMANCE INDICATOR (CONTEXTUAL) 2.3.2 Total amount distributed within the fiscal year, and the number of Fair Funds
from which those distributions came
Description: In its enforcement actions, the SEC may seek to return funds to harmed investors through disgorgement of ill-gotten gains or through the Fair Funds provision of the Sarbanes-Oxley Act. This provision permits the SEC to combine amounts paid as penalties with disgorged funds, or to create a Fair Fund from penalties only, to reduce losses to injured parties. This reflects the SEC’s efforts to return funds to injured investors. This indicator identifies the total amount distributed within the fiscal year, and the number of Fair Funds from which those distributions came. This indicator may increase or decrease in dollar amount and number of distribution funds based on the number of SEC enforcement actions brought involving distributions, amounts ordered and paid in those actions, and other factors. Due to the variation in reporting timelines established for each individual distribution, reported amounts are based on the agency’s best available information. Reported amounts do not include those funds distributed through receiverships. Any funds not returned to investors are sent to the U.S. Treasury or the Investor Protection Fund established pursuant to Section 21F(g) of the Securities Exchange Act of 1934. Neither disgorgement nor penalties are used for the Commission’s own expenses.
Fiscal Year FY 2011 FY 2012 FY 2013 FY 2014 FY 2015FY 2016 Actual
Amount distributed (dollars in millions)Prior-year data not available
$815 $251 $424 $158 $140
Number of Fair FundsPrior-year data not available
31 22 28 34 35
Responsible Division/Office: Division of Enforcement
Data Source: HUB case management and tracking system for the Division of Enforcement Distributions Management System
PERFORMANCE INDICATOR (OUTPUT) 2.3.3 Percent of enforcement actions filed that arose out of national priority investigations
Description: The Division of Enforcement conducts many enforcement actions each year that can be characterized as high impact and of national priority. High impact or national priority investigations include investigations that are significant for one or more of the following reasons: the matter (i) presents an opportunity to send a particularly strong and effective message of deterrence, including with respect to markets, products, and transactions that are newly developing or that are long established but—by their nature—present limited opportunities to detect wrongdoing and thus to deter misconduct; (ii) involves particularly egregious or extensive misconduct; (iii) involves potentially widespread and extensive harm to investors; (iv) involves misconduct by persons occupying positions of substantial authority or responsibility, or who owe fiduciary or other enhanced duties and obligations to a broad group of investors or others; (v) involves potential wrongdoing as prohibited under newly-enacted legislation or regulatory rules; (vi) concerns potential misconduct that occurred in connection with products, markets, transactions, or practices that pose particularly significant risks for investors or a systemically important sector of the market; (vii) involves a substantial number of potential victims and/or particularly vulnerable victims; (viii) involves products, markets, transactions, or practices that the Division of Enforcement has identified as priority areas; and/or (ix) provides an opportunity to pursue priority interests shared by other law enforcement agencies on a coordinated basis.
Fiscal Year FY 2011 FY 2012 FY 2013 FY 2014 FY 2015FY 2016 Actual
Percentage 10% 20% 15% 16% 25% 27%
Responsible Division/Office: Division of Enforcement
Data Source: HUB case management and tracking system for the Division of Enforcement
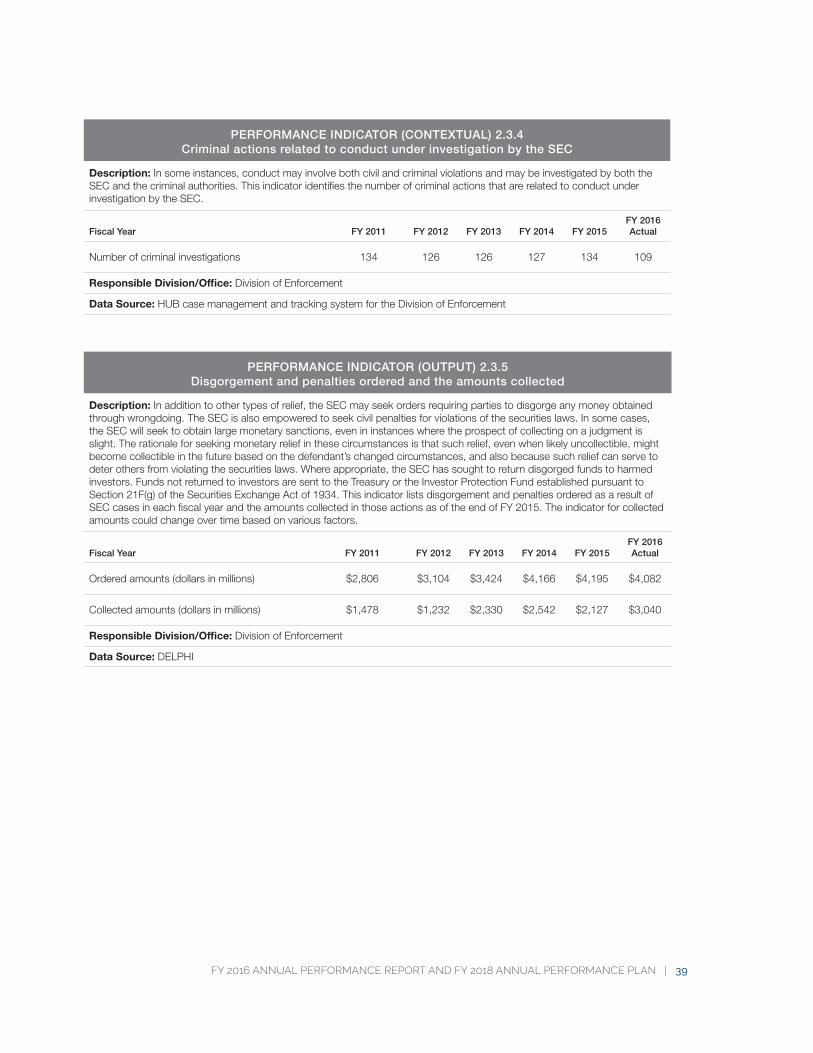
FY 2016 ANNUAL PERFORMANCE REPORT AND FY 2018 ANNUAL PERFORMANCE PLAN | 39
PERFORMANCE INDICATOR (CONTEXTUAL) 2.3.4 Criminal actions related to conduct under investigation by the SEC
Description: In some instances, conduct may involve both civil and criminal violations and may be investigated by both the SEC and the criminal authorities. This indicator identifies the number of criminal actions that are related to conduct under investigation by the SEC.
Fiscal Year FY 2011 FY 2012 FY 2013 FY 2014 FY 2015FY 2016 Actual
Number of criminal investigations 134 126 126 127 134 109
Responsible Division/Office: Division of Enforcement
Data Source: HUB case management and tracking system for the Division of Enforcement
PERFORMANCE INDICATOR (OUTPUT) 2.3.5 Disgorgement and penalties ordered and the amounts collected
Description: In addition to other types of relief, the SEC may seek orders requiring parties to disgorge any money obtained through wrongdoing. The SEC is also empowered to seek civil penalties for violations of the securities laws. In some cases, the SEC will seek to obtain large monetary sanctions, even in instances where the prospect of collecting on a judgment is slight. The rationale for seeking monetary relief in these circumstances is that such relief, even when likely uncollectible, might become collectible in the future based on the defendant’s changed circumstances, and also because such relief can serve to deter others from violating the securities laws. Where appropriate, the SEC has sought to return disgorged funds to harmed investors. Funds not returned to investors are sent to the Treasury or the Investor Protection Fund established pursuant to Section 21F(g) of the Securities Exchange Act of 1934. This indicator lists disgorgement and penalties ordered as a result of SEC cases in each fiscal year and the amounts collected in those actions as of the end of FY 2015. The indicator for collected amounts could change over time based on various factors.
Fiscal Year FY 2011 FY 2012 FY 2013 FY 2014 FY 2015FY 2016 Actual
Ordered amounts (dollars in millions) $2,806 $3,104 $3,424 $4,166 $4,195 $4,082
Collected amounts (dollars in millions) $1,478 $1,232 $2,330 $2,542 $2,127 $3,040
Responsible Division/Office: Division of Enforcement
Data Source: DELPHI
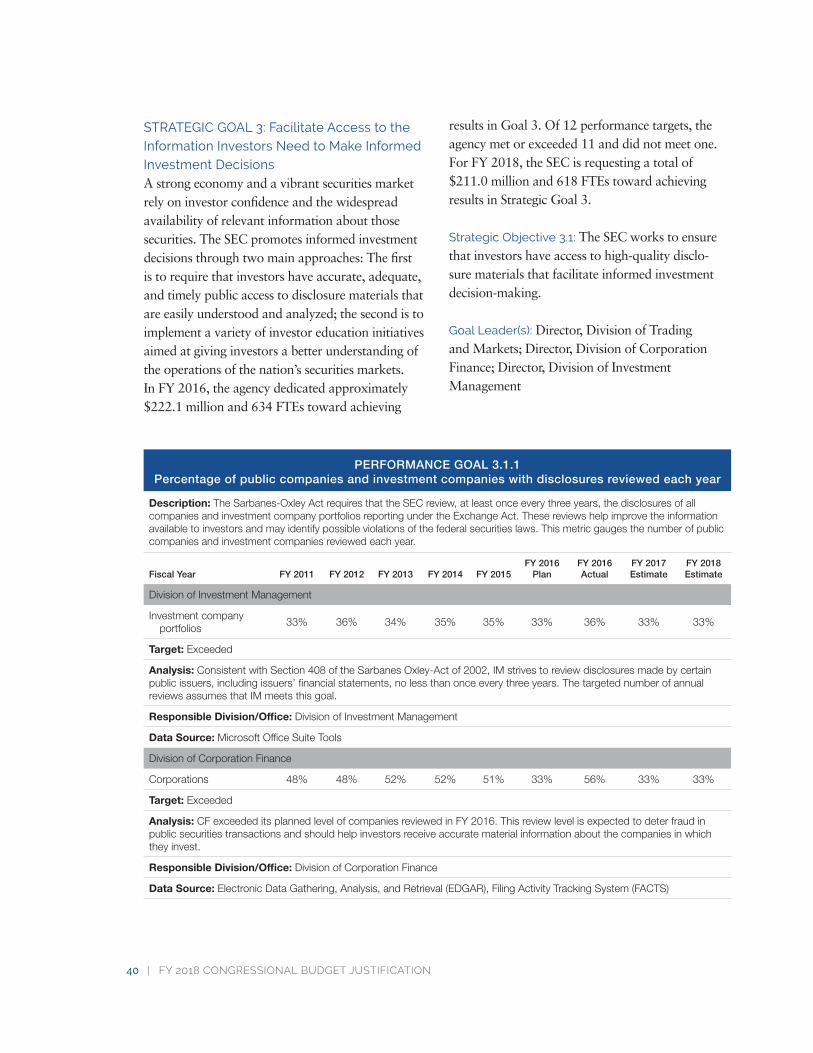
40 | FY 2018 CONGRESSIONAL BUDGET JUSTIFICATION
STRATEGIC GOAL 3: Facilitate Access to the Information Investors Need to Make Informed Investment Decisions
A strong economy and a vibrant securities market rely on investor confidence and the widespread availability of relevant information about those securities. The SEC promotes informed investment decisions through two main approaches: The first is to require that investors have accurate, adequate, and timely public access to disclosure materials that are easily understood and analyzed; the second is to implement a variety of investor education initiatives aimed at giving investors a better understanding of the operations of the nation’s securities markets.In FY 2016, the agency dedicated approximately $222.1 million and 634 FTEs toward achieving
results in Goal 3. Of 12 performance targets, the agency met or exceeded 11 and did not meet one. For FY 2018, the SEC is requesting a total of $211.0 million and 618 FTEs toward achieving results in Strategic Goal 3.
Strategic Objective 3.1: The SEC works to ensure that investors have access to high-quality disclo-sure materials that facilitate informed investment decision-making.
Goal Leader(s): Director, Division of Trading and Markets; Director, Division of Corporation Finance; Director, Division of Investment Management
PERFORMANCE GOAL 3.1.1 Percentage of public companies and investment companies with disclosures reviewed each year
Description: The Sarbanes-Oxley Act requires that the SEC review, at least once every three years, the disclosures of all companies and investment company portfolios reporting under the Exchange Act. These reviews help improve the information available to investors and may identify possible violations of the federal securities laws. This metric gauges the number of public companies and investment companies reviewed each year.
Fiscal Year FY 2011 FY 2012 FY 2013 FY 2014 FY 2015FY 2016
PlanFY 2016 Actual
FY 2017 Estimate
FY 2018 Estimate
Division of Investment Management
Investment company portfolios
33% 36% 34% 35% 35% 33% 36% 33% 33%
Target: Exceeded
Analysis: Consistent with Section 408 of the Sarbanes Oxley-Act of 2002, IM strives to review disclosures made by certain public issuers, including issuers’ financial statements, no less than once every three years. The targeted number of annual reviews assumes that IM meets this goal.
Responsible Division/Office: Division of Investment Management
Data Source: Microsoft Office Suite Tools
Division of Corporation Finance
Corporations 48% 48% 52% 52% 51% 33% 56% 33% 33%
Target: Exceeded
Analysis: CF exceeded its planned level of companies reviewed in FY 2016. This review level is expected to deter fraud in public securities transactions and should help investors receive accurate material information about the companies in which they invest.
Responsible Division/Office: Division of Corporation Finance
Data Source: Electronic Data Gathering, Analysis, and Retrieval (EDGAR), Filing Activity Tracking System (FACTS)
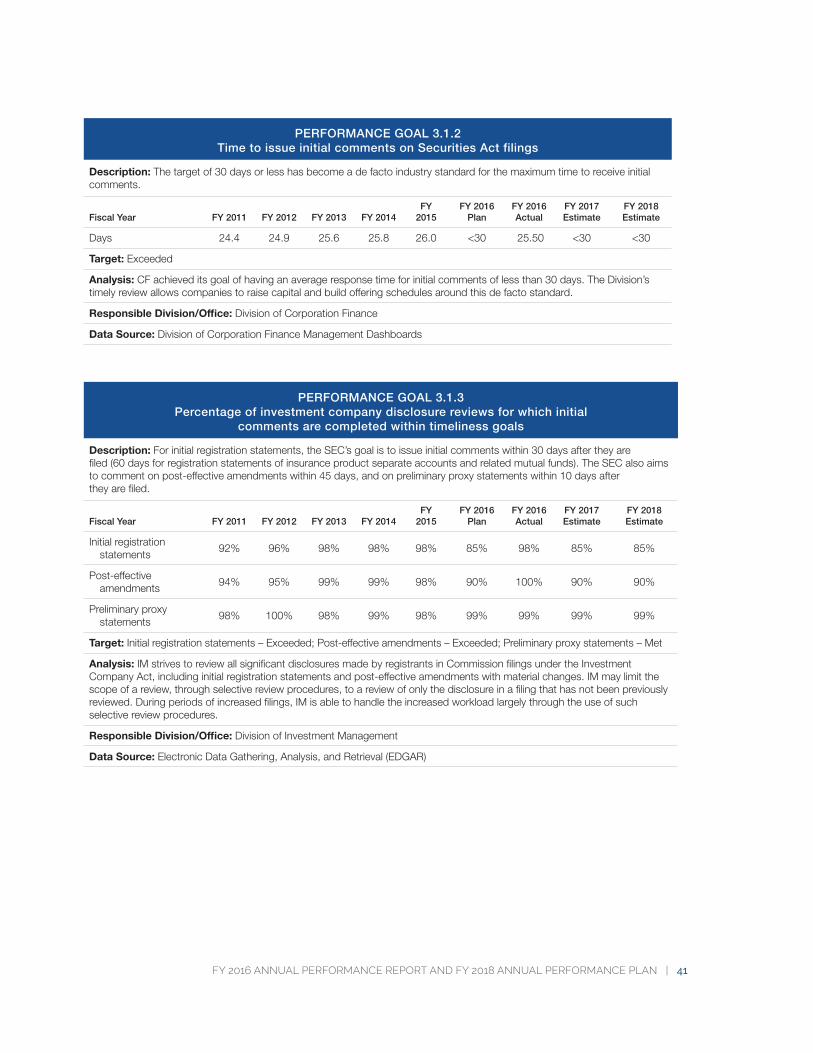
FY 2016 ANNUAL PERFORMANCE REPORT AND FY 2018 ANNUAL PERFORMANCE PLAN | 41
PERFORMANCE GOAL 3.1.2 Time to issue initial comments on Securities Act filings
Description: The target of 30 days or less has become a de facto industry standard for the maximum time to receive initial comments.
Fiscal Year FY 2011 FY 2012 FY 2013 FY 2014FY
2015FY 2016
PlanFY 2016 Actual
FY 2017 Estimate
FY 2018 Estimate
Days 24.4 24.9 25.6 25.8 26.0 <30 25.50 <30 <30
Target: Exceeded
Analysis: CF achieved its goal of having an average response time for initial comments of less than 30 days. The Division’s timely review allows companies to raise capital and build offering schedules around this de facto standard.
Responsible Division/Office: Division of Corporation Finance
Data Source: Division of Corporation Finance Management Dashboards
PERFORMANCE GOAL 3.1.3 Percentage of investment company disclosure reviews for which initial
comments are completed within timeliness goals
Description: For initial registration statements, the SEC’s goal is to issue initial comments within 30 days after they are filed (60 days for registration statements of insurance product separate accounts and related mutual funds). The SEC also aims to comment on post-effective amendments within 45 days, and on preliminary proxy statements within 10 days after they are filed.
Fiscal Year FY 2011 FY 2012 FY 2013 FY 2014FY
2015FY 2016
PlanFY 2016 Actual
FY 2017 Estimate
FY 2018 Estimate
Initial registration statements
92% 96% 98% 98% 98% 85% 98% 85% 85%
Post-effective amendments
94% 95% 99% 99% 98% 90% 100% 90% 90%
Preliminary proxy statements
98% 100% 98% 99% 98% 99% 99% 99% 99%
Target: Initial registration statements – Exceeded; Post-effective amendments – Exceeded; Preliminary proxy statements – Met
Analysis: IM strives to review all significant disclosures made by registrants in Commission filings under the Investment Company Act, including initial registration statements and post-effective amendments with material changes. IM may limit the scope of a review, through selective review procedures, to a review of only the disclosure in a filing that has not been previously reviewed. During periods of increased filings, IM is able to handle the increased workload largely through the use of such selective review procedures.
Responsible Division/Office: Division of Investment Management
Data Source: Electronic Data Gathering, Analysis, and Retrieval (EDGAR)
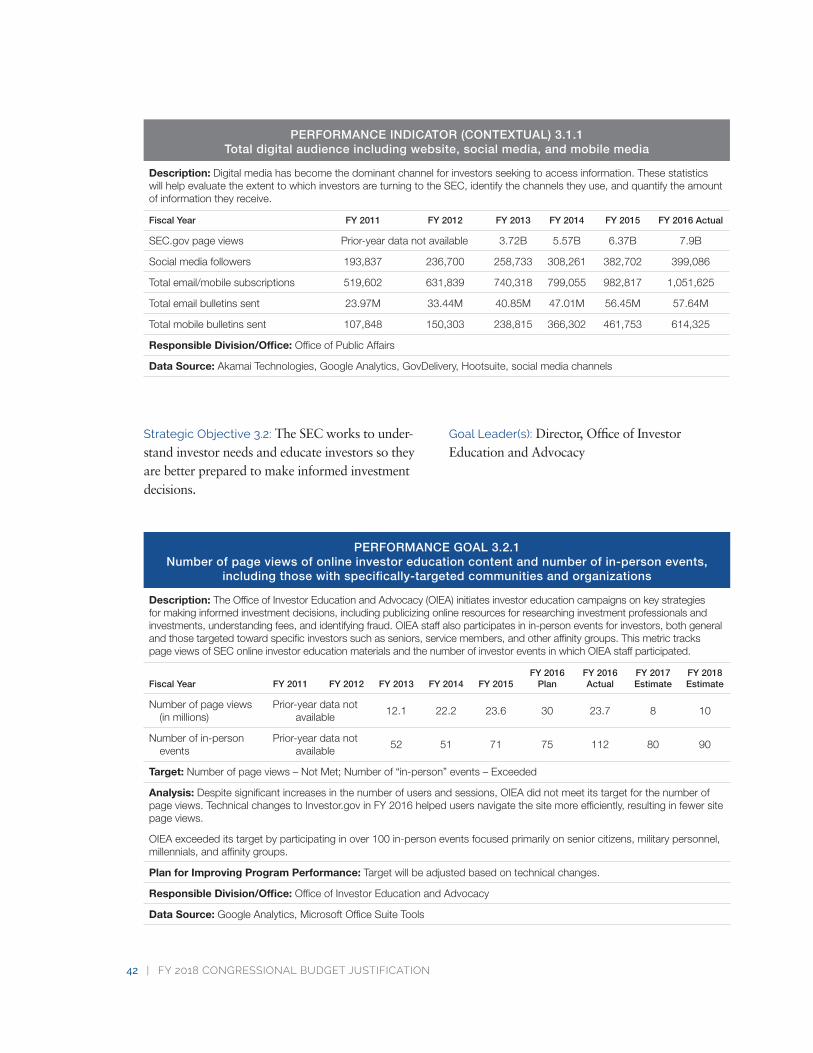
42 | FY 2018 CONGRESSIONAL BUDGET JUSTIFICATION
PERFORMANCE INDICATOR (CONTEXTUAL) 3.1.1 Total digital audience including website, social media, and mobile media
Description: Digital media has become the dominant channel for investors seeking to access information. These statistics will help evaluate the extent to which investors are turning to the SEC, identify the channels they use, and quantify the amount of information they receive.
Fiscal Year FY 2011 FY 2012 FY 2013 FY 2014 FY 2015 FY 2016 Actual
SEC.gov page views Prior-year data not available 3.72B 5.57B 6.37B 7.9B
Social media followers 193,837 236,700 258,733 308,261 382,702 399,086
Total email/mobile subscriptions 519,602 631,839 740,318 799,055 982,817 1,051,625
Total email bulletins sent 23.97M 33.44M 40.85M 47.01M 56.45M 57.64M
Total mobile bulletins sent 107,848 150,303 238,815 366,302 461,753 614,325
Responsible Division/Office: Office of Public Affairs
Data Source: Akamai Technologies, Google Analytics, GovDelivery, Hootsuite, social media channels
Strategic Objective 3.2: The SEC works to under-stand investor needs and educate investors so they are better prepared to make informed investment decisions.
Goal Leader(s): Director, Office of Investor Education and Advocacy
PERFORMANCE GOAL 3.2.1 Number of page views of online investor education content and number of in-person events,
including those with specifically-targeted communities and organizations
Description: The Office of Investor Education and Advocacy (OIEA) initiates investor education campaigns on key strategies for making informed investment decisions, including publicizing online resources for researching investment professionals and investments, understanding fees, and identifying fraud. OIEA staff also participates in in-person events for investors, both general and those targeted toward specific investors such as seniors, service members, and other affinity groups. This metric tracks page views of SEC online investor education materials and the number of investor events in which OIEA staff participated.
Fiscal Year FY 2011 FY 2012 FY 2013 FY 2014 FY 2015FY 2016
PlanFY 2016 Actual
FY 2017 Estimate
FY 2018 Estimate
Number of page views (in millions)
Prior-year data not available
12.1 22.2 23.6 30 23.7 8 10
Number of in-person events
Prior-year data not available
52 51 71 75 112 80 90
Target: Number of page views – Not Met; Number of “in-person” events – Exceeded
Analysis: Despite significant increases in the number of users and sessions, OIEA did not meet its target for the number of page views. Technical changes to Investor.gov in FY 2016 helped users navigate the site more efficiently, resulting in fewer site page views.
OIEA exceeded its target by participating in over 100 in-person events focused primarily on senior citizens, military personnel, millennials, and affinity groups.
Plan for Improving Program Performance: Target will be adjusted based on technical changes.
Responsible Division/Office: Office of Investor Education and Advocacy
Data Source: Google Analytics, Microsoft Office Suite Tools
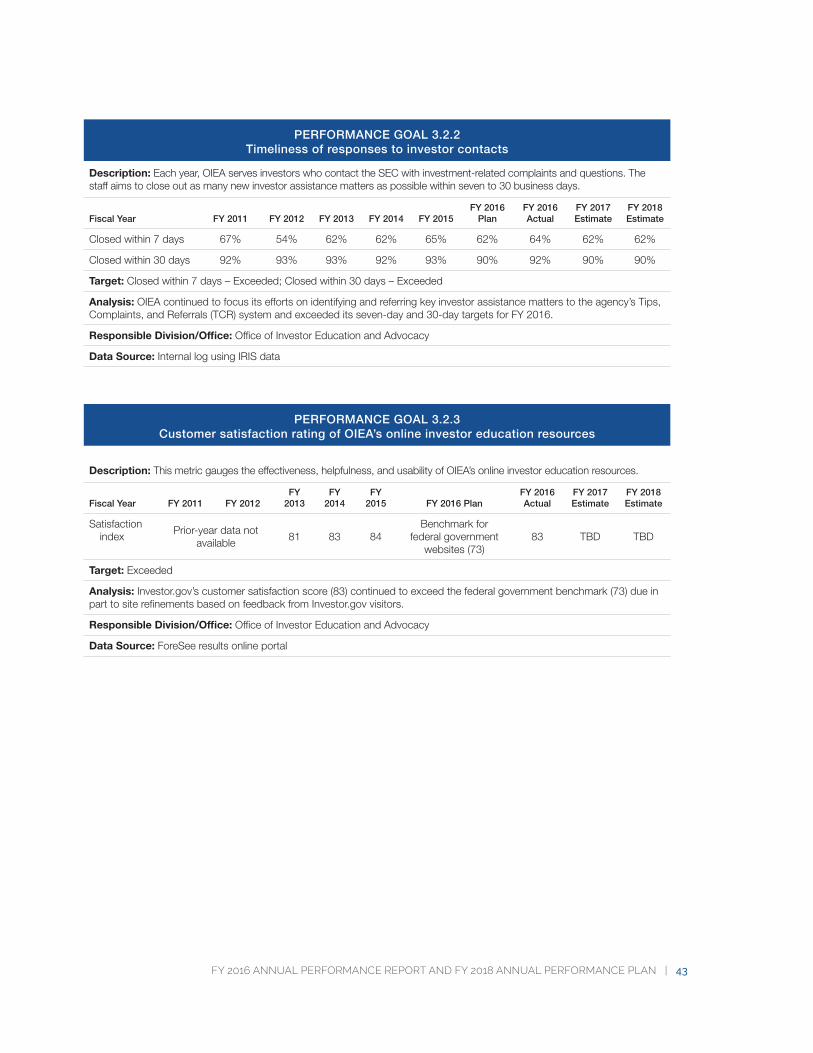
FY 2016 ANNUAL PERFORMANCE REPORT AND FY 2018 ANNUAL PERFORMANCE PLAN | 43
PERFORMANCE GOAL 3.2.2 Timeliness of responses to investor contacts
Description: Each year, OIEA serves investors who contact the SEC with investment-related complaints and questions. The staff aims to close out as many new investor assistance matters as possible within seven to 30 business days.
Fiscal Year FY 2011 FY 2012 FY 2013 FY 2014 FY 2015FY 2016
PlanFY 2016 Actual
FY 2017 Estimate
FY 2018 Estimate
Closed within 7 days 67% 54% 62% 62% 65% 62% 64% 62% 62%
Closed within 30 days 92% 93% 93% 92% 93% 90% 92% 90% 90%
Target: Closed within 7 days – Exceeded; Closed within 30 days – Exceeded
Analysis: OIEA continued to focus its efforts on identifying and referring key investor assistance matters to the agency’s Tips, Complaints, and Referrals (TCR) system and exceeded its seven-day and 30-day targets for FY 2016.
Responsible Division/Office: Office of Investor Education and Advocacy
Data Source: Internal log using IRIS data
PERFORMANCE GOAL 3.2.3 Customer satisfaction rating of OIEA’s online investor education resources
Description: This metric gauges the effectiveness, helpfulness, and usability of OIEA’s online investor education resources.
Fiscal Year FY 2011 FY 2012FY
2013FY
2014FY
2015 FY 2016 PlanFY 2016 Actual
FY 2017 Estimate
FY 2018 Estimate
Satisfaction index
Prior-year data not available
81 83 84Benchmark for
federal government websites (73)
83 TBD TBD
Target: Exceeded
Analysis: Investor.gov’s customer satisfaction score (83) continued to exceed the federal government benchmark (73) due in part to site refinements based on feedback from Investor.gov visitors.
Responsible Division/Office: Office of Investor Education and Advocacy
Data Source: ForeSee results online portal
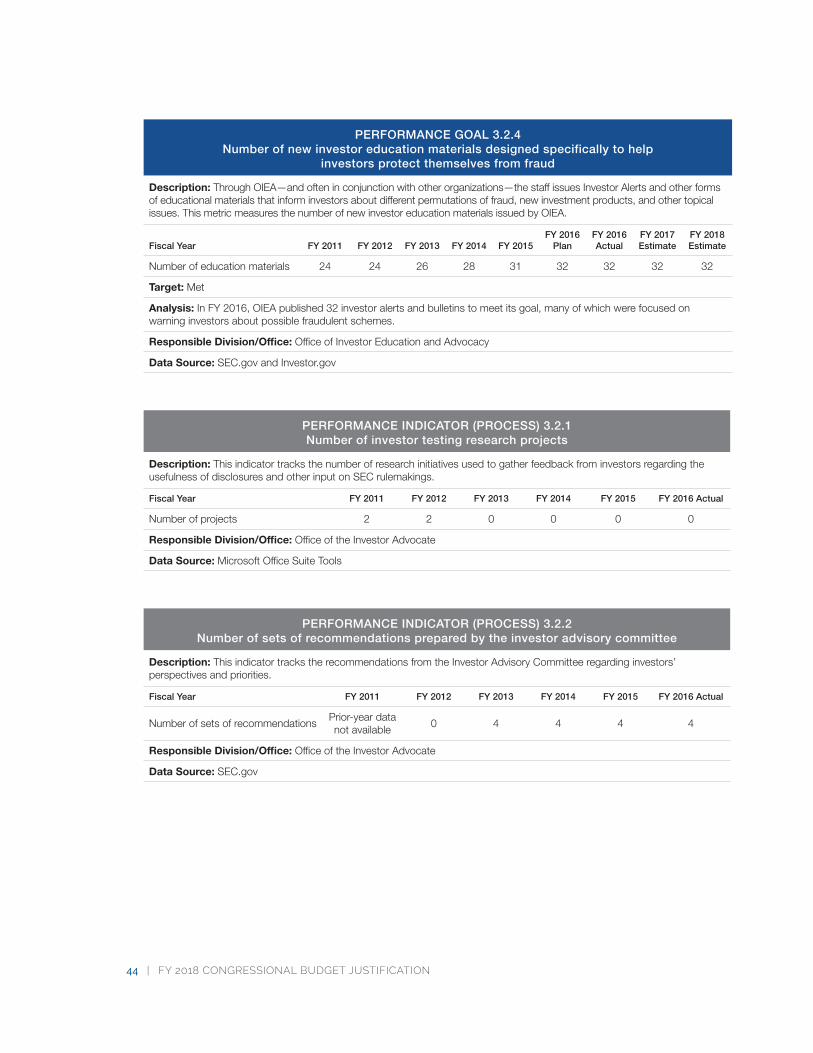
44 | FY 2018 CONGRESSIONAL BUDGET JUSTIFICATION
PERFORMANCE GOAL 3.2.4 Number of new investor education materials designed specifically to help
investors protect themselves from fraud
Description: Through OIEA—and often in conjunction with other organizations—the staff issues Investor Alerts and other forms of educational materials that inform investors about different permutations of fraud, new investment products, and other topical issues. This metric measures the number of new investor education materials issued by OIEA.
Fiscal Year FY 2011 FY 2012 FY 2013 FY 2014 FY 2015FY 2016
PlanFY 2016 Actual
FY 2017 Estimate
FY 2018 Estimate
Number of education materials 24 24 26 28 31 32 32 32 32
Target: Met
Analysis: In FY 2016, OIEA published 32 investor alerts and bulletins to meet its goal, many of which were focused on warning investors about possible fraudulent schemes.
Responsible Division/Office: Office of Investor Education and Advocacy
Data Source: SEC.gov and Investor.gov
PERFORMANCE INDICATOR (PROCESS) 3.2.1 Number of investor testing research projects
Description: This indicator tracks the number of research initiatives used to gather feedback from investors regarding the usefulness of disclosures and other input on SEC rulemakings.
Fiscal Year FY 2011 FY 2012 FY 2013 FY 2014 FY 2015 FY 2016 Actual
Number of projects 2 2 0 0 0 0
Responsible Division/Office: Office of the Investor Advocate
Data Source: Microsoft Office Suite Tools
PERFORMANCE INDICATOR (PROCESS) 3.2.2 Number of sets of recommendations prepared by the investor advisory committee
Description: This indicator tracks the recommendations from the Investor Advisory Committee regarding investors’ perspectives and priorities.
Fiscal Year FY 2011 FY 2012 FY 2013 FY 2014 FY 2015 FY 2016 Actual
Number of sets of recommendationsPrior-year data not available
0 4 4 4 4
Responsible Division/Office: Office of the Investor Advocate
Data Source: SEC.gov
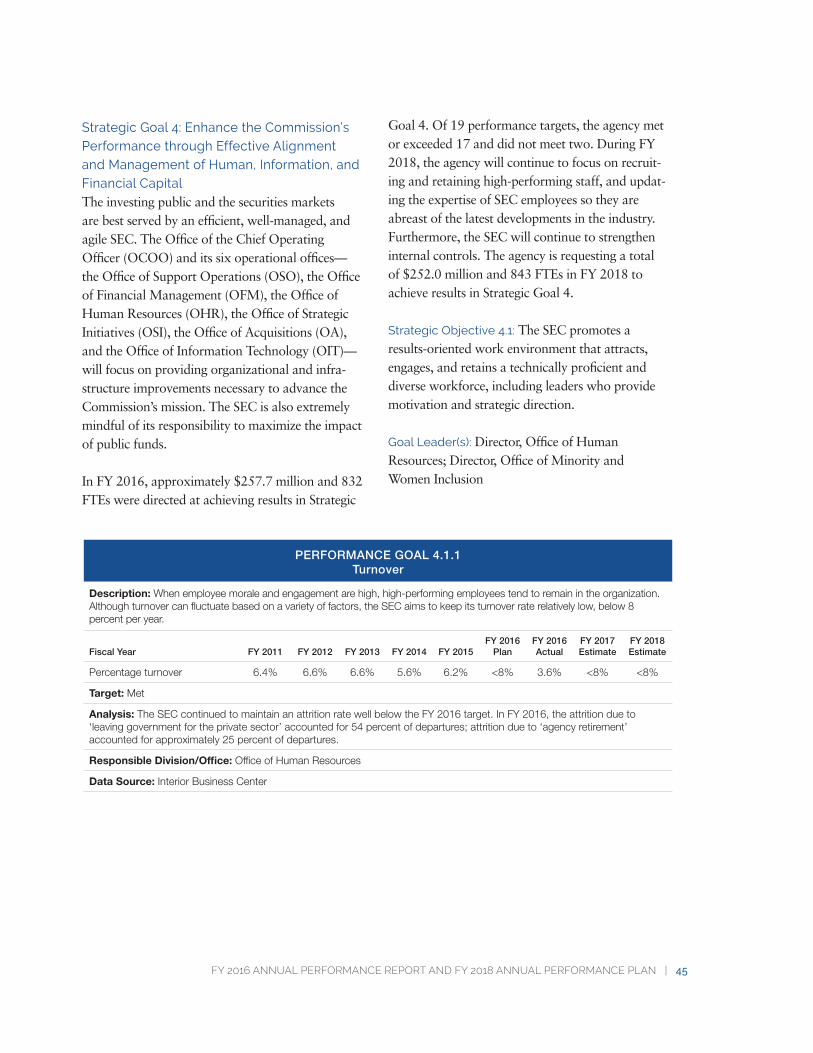
FY 2016 ANNUAL PERFORMANCE REPORT AND FY 2018 ANNUAL PERFORMANCE PLAN | 45
Strategic Goal 4: Enhance the Commission’s Performance through Effective Alignment and Management of Human, Information, and Financial CapitalThe investing public and the securities markets are best served by an efficient, well-managed, and agile SEC. The Office of the Chief Operating Officer (OCOO) and its six operational offices— the Office of Support Operations (OSO), the Office of Financial Management (OFM), the Office of Human Resources (OHR), the Office of Strategic Initiatives (OSI), the Office of Acquisitions (OA), and the Office of Information Technology (OIT)—will focus on providing organizational and infra-structure improvements necessary to advance the Commission’s mission. The SEC is also extremely mindful of its responsibility to maximize the impact of public funds.
In FY 2016, approximately $257.7 million and 832 FTEs were directed at achieving results in Strategic
Goal 4. Of 19 performance targets, the agency met or exceeded 17 and did not meet two. During FY 2018, the agency will continue to focus on recruit-ing and retaining high-performing staff, and updat-ing the expertise of SEC employees so they are abreast of the latest developments in the industry. Furthermore, the SEC will continue to strengthen internal controls. The agency is requesting a total of $252.0 million and 843 FTEs in FY 2018 to achieve results in Strategic Goal 4.
Strategic Objective 4.1: The SEC promotes a results-oriented work environment that attracts, engages, and retains a technically proficient and diverse workforce, including leaders who provide motivation and strategic direction.
Goal Leader(s): Director, Office of Human Resources; Director, Office of Minority and Women Inclusion
PERFORMANCE GOAL 4.1.1 Turnover
Description: When employee morale and engagement are high, high-performing employees tend to remain in the organization. Although turnover can fluctuate based on a variety of factors, the SEC aims to keep its turnover rate relatively low, below 8 percent per year.
Fiscal Year FY 2011 FY 2012 FY 2013 FY 2014 FY 2015FY 2016
PlanFY 2016 Actual
FY 2017 Estimate
FY 2018 Estimate
Percentage turnover 6.4% 6.6% 6.6% 5.6% 6.2% <8% 3.6% <8% <8%
Target: Met
Analysis: The SEC continued to maintain an attrition rate well below the FY 2016 target. In FY 2016, the attrition due to ‘leaving government for the private sector’ accounted for 54 percent of departures; attrition due to ‘agency retirement’ accounted for approximately 25 percent of departures.
Responsible Division/Office: Office of Human Resources
Data Source: Interior Business Center
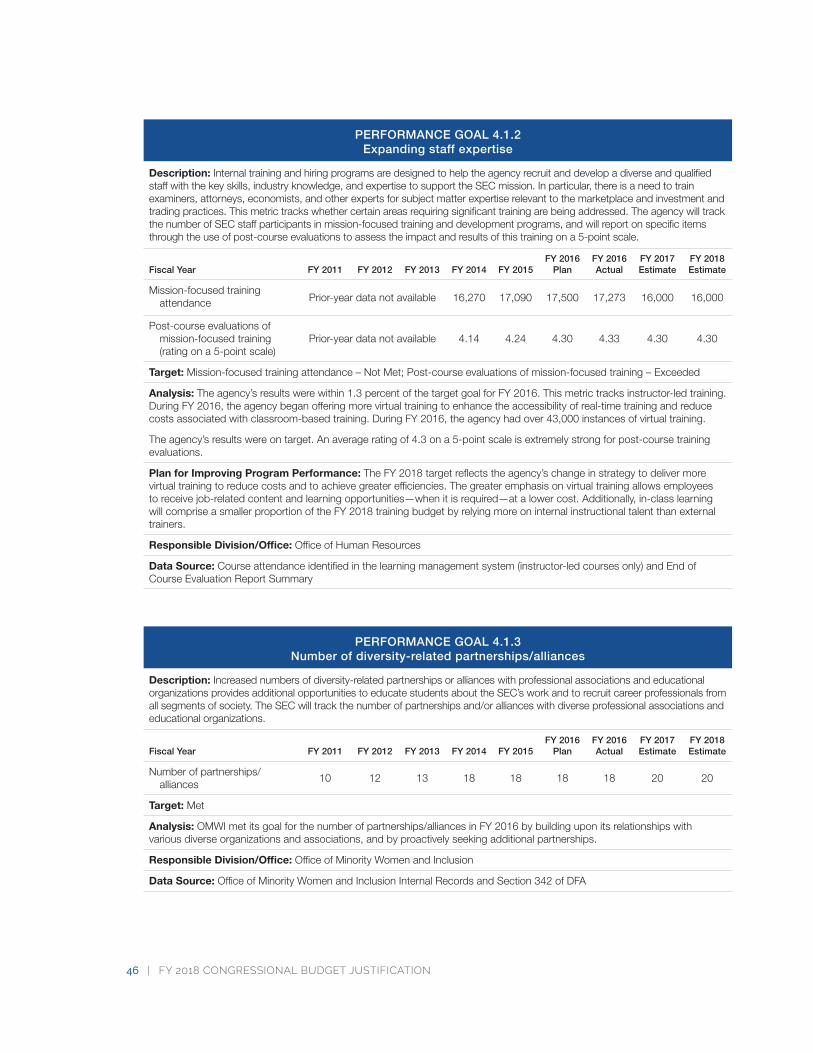
46 | FY 2018 CONGRESSIONAL BUDGET JUSTIFICATION
PERFORMANCE GOAL 4.1.2 Expanding staff expertise
Description: Internal training and hiring programs are designed to help the agency recruit and develop a diverse and qualified staff with the key skills, industry knowledge, and expertise to support the SEC mission. In particular, there is a need to train examiners, attorneys, economists, and other experts for subject matter expertise relevant to the marketplace and investment and trading practices. This metric tracks whether certain areas requiring significant training are being addressed. The agency will track the number of SEC staff participants in mission-focused training and development programs, and will report on specific items through the use of post-course evaluations to assess the impact and results of this training on a 5-point scale.
Fiscal Year FY 2011 FY 2012 FY 2013 FY 2014 FY 2015FY 2016
PlanFY 2016 Actual
FY 2017 Estimate
FY 2018 Estimate
Mission-focused training attendance Prior-year data not available 16,270 17,090 17,500 17,273 16,000 16,000
Post-course evaluations of mission-focused training (rating on a 5-point scale)
Prior-year data not available 4.14 4.24 4.30 4.33 4.30 4.30
Target: Mission-focused training attendance – Not Met; Post-course evaluations of mission-focused training – Exceeded
Analysis: The agency’s results were within 1.3 percent of the target goal for FY 2016. This metric tracks instructor-led training. During FY 2016, the agency began offering more virtual training to enhance the accessibility of real-time training and reduce costs associated with classroom-based training. During FY 2016, the agency had over 43,000 instances of virtual training.
The agency’s results were on target. An average rating of 4.3 on a 5-point scale is extremely strong for post-course training evaluations.
Plan for Improving Program Performance: The FY 2018 target reflects the agency’s change in strategy to deliver more virtual training to reduce costs and to achieve greater efficiencies. The greater emphasis on virtual training allows employees to receive job-related content and learning opportunities—when it is required—at a lower cost. Additionally, in-class learning will comprise a smaller proportion of the FY 2018 training budget by relying more on internal instructional talent than external trainers.
Responsible Division/Office: Office of Human Resources
Data Source: Course attendance identified in the learning management system (instructor-led courses only) and End of Course Evaluation Report Summary
PERFORMANCE GOAL 4.1.3 Number of diversity-related partnerships/alliances
Description: Increased numbers of diversity-related partnerships or alliances with professional associations and educational organizations provides additional opportunities to educate students about the SEC’s work and to recruit career professionals from all segments of society. The SEC will track the number of partnerships and/or alliances with diverse professional associations and educational organizations.
Fiscal Year FY 2011 FY 2012 FY 2013 FY 2014 FY 2015FY 2016
PlanFY 2016 Actual
FY 2017 Estimate
FY 2018 Estimate
Number of partnerships/ alliances
10 12 13 18 18 18 18 20 20
Target: Met
Analysis: OMWI met its goal for the number of partnerships/alliances in FY 2016 by building upon its relationships with various diverse organizations and associations, and by proactively seeking additional partnerships.
Responsible Division/Office: Office of Minority Women and Inclusion
Data Source: Office of Minority Women and Inclusion Internal Records and Section 342 of DFA
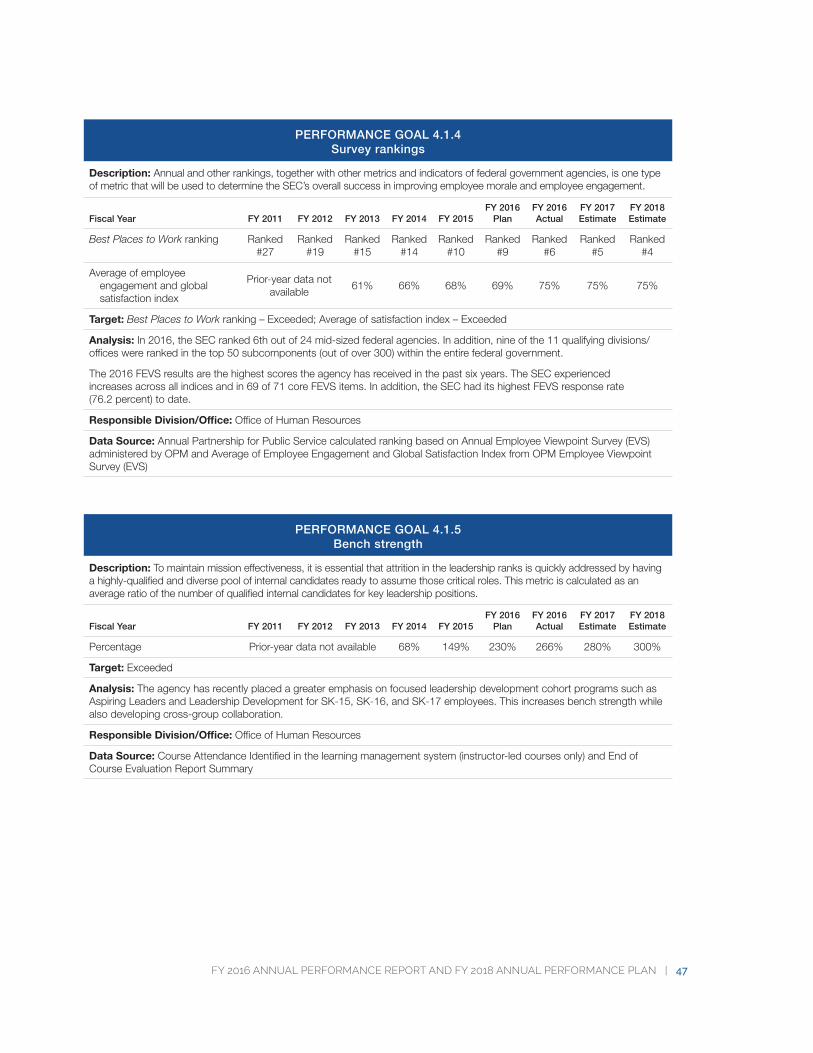
FY 2016 ANNUAL PERFORMANCE REPORT AND FY 2018 ANNUAL PERFORMANCE PLAN | 47
PERFORMANCE GOAL 4.1.4 Survey rankings
Description: Annual and other rankings, together with other metrics and indicators of federal government agencies, is one type of metric that will be used to determine the SEC’s overall success in improving employee morale and employee engagement.
Fiscal Year FY 2011 FY 2012 FY 2013 FY 2014 FY 2015FY 2016
PlanFY 2016 Actual
FY 2017 Estimate
FY 2018 Estimate
Best Places to Work ranking Ranked #27
Ranked #19
Ranked #15
Ranked #14
Ranked #10
Ranked #9
Ranked #6
Ranked #5
Ranked #4
Average of employee engagement and global satisfaction index
Prior-year data not available
61% 66% 68% 69% 75% 75% 75%
Target: Best Places to Work ranking – Exceeded; Average of satisfaction index – Exceeded
Analysis: In 2016, the SEC ranked 6th out of 24 mid-sized federal agencies. In addition, nine of the 11 qualifying divisions/offices were ranked in the top 50 subcomponents (out of over 300) within the entire federal government.
The 2016 FEVS results are the highest scores the agency has received in the past six years. The SEC experienced increases across all indices and in 69 of 71 core FEVS items. In addition, the SEC had its highest FEVS response rate (76.2 percent) to date.
Responsible Division/Office: Office of Human Resources
Data Source: Annual Partnership for Public Service calculated ranking based on Annual Employee Viewpoint Survey (EVS) administered by OPM and Average of Employee Engagement and Global Satisfaction Index from OPM Employee Viewpoint Survey (EVS)
PERFORMANCE GOAL 4.1.5 Bench strength
Description: To maintain mission effectiveness, it is essential that attrition in the leadership ranks is quickly addressed by having a highly-qualified and diverse pool of internal candidates ready to assume those critical roles. This metric is calculated as an average ratio of the number of qualified internal candidates for key leadership positions.
Fiscal Year FY 2011 FY 2012 FY 2013 FY 2014 FY 2015FY 2016
PlanFY 2016 Actual
FY 2017 Estimate
FY 2018 Estimate
Percentage Prior-year data not available 68% 149% 230% 266% 280% 300%
Target: Exceeded
Analysis: The agency has recently placed a greater emphasis on focused leadership development cohort programs such as Aspiring Leaders and Leadership Development for SK-15, SK-16, and SK-17 employees. This increases bench strength while also developing cross-group collaboration.
Responsible Division/Office: Office of Human Resources
Data Source: Course Attendance Identified in the learning management system (instructor-led courses only) and End of Course Evaluation Report Summary
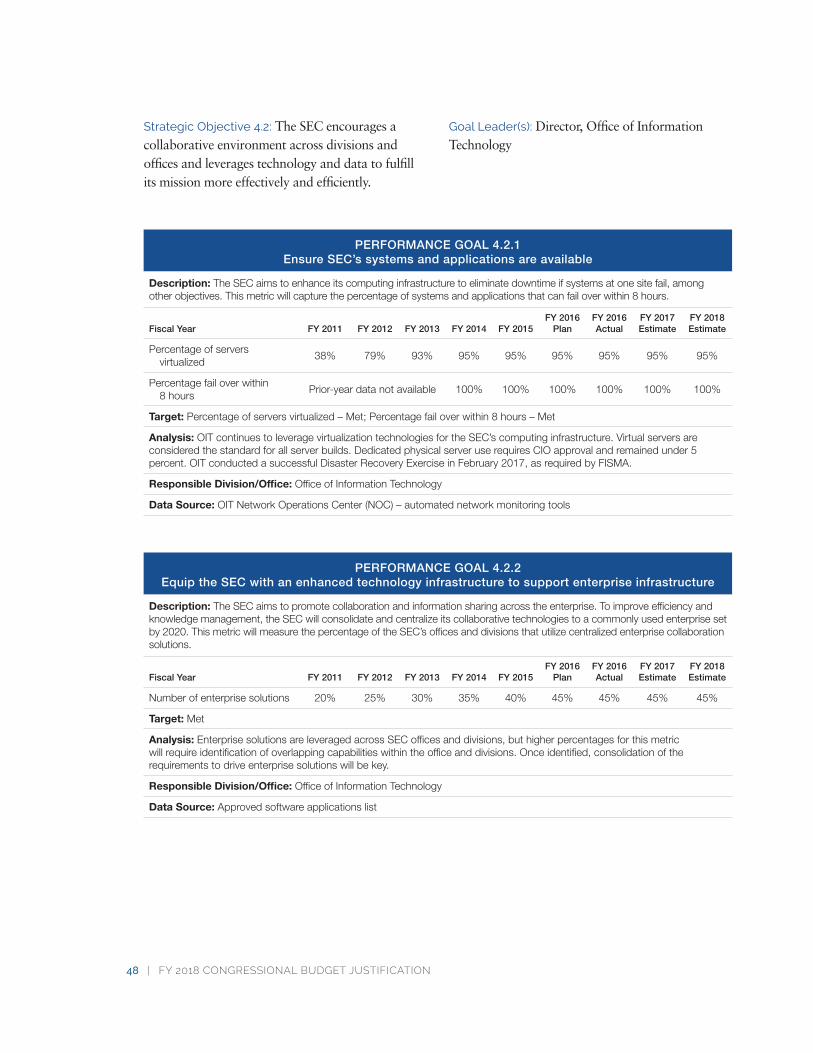
48 | FY 2018 CONGRESSIONAL BUDGET JUSTIFICATION
Strategic Objective 4.2: The SEC encourages a collaborative environment across divisions and offices and leverages technology and data to fulfill its mission more effectively and efficiently.
Goal Leader(s): Director, Office of Information Technology
PERFORMANCE GOAL 4.2.1 Ensure SEC’s systems and applications are available
Description: The SEC aims to enhance its computing infrastructure to eliminate downtime if systems at one site fail, among other objectives. This metric will capture the percentage of systems and applications that can fail over within 8 hours.
Fiscal Year FY 2011 FY 2012 FY 2013 FY 2014 FY 2015FY 2016
PlanFY 2016 Actual
FY 2017 Estimate
FY 2018 Estimate
Percentage of servers virtualized
38% 79% 93% 95% 95% 95% 95% 95% 95%
Percentage fail over within 8 hours
Prior-year data not available 100% 100% 100% 100% 100% 100%
Target: Percentage of servers virtualized – Met; Percentage fail over within 8 hours – Met
Analysis: OIT continues to leverage virtualization technologies for the SEC’s computing infrastructure. Virtual servers are considered the standard for all server builds. Dedicated physical server use requires CIO approval and remained under 5 percent. OIT conducted a successful Disaster Recovery Exercise in February 2017, as required by FISMA.
Responsible Division/Office: Office of Information Technology
Data Source: OIT Network Operations Center (NOC) – automated network monitoring tools
PERFORMANCE GOAL 4.2.2 Equip the SEC with an enhanced technology infrastructure to support enterprise infrastructure
Description: The SEC aims to promote collaboration and information sharing across the enterprise. To improve efficiency and knowledge management, the SEC will consolidate and centralize its collaborative technologies to a commonly used enterprise set by 2020. This metric will measure the percentage of the SEC’s offices and divisions that utilize centralized enterprise collaboration solutions.
Fiscal Year FY 2011 FY 2012 FY 2013 FY 2014 FY 2015FY 2016
PlanFY 2016 Actual
FY 2017 Estimate
FY 2018 Estimate
Number of enterprise solutions 20% 25% 30% 35% 40% 45% 45% 45% 45%
Target: Met
Analysis: Enterprise solutions are leveraged across SEC offices and divisions, but higher percentages for this metric will require identification of overlapping capabilities within the office and divisions. Once identified, consolidation of the requirements to drive enterprise solutions will be key.
Responsible Division/Office: Office of Information Technology
Data Source: Approved software applications list

FY 2016 ANNUAL PERFORMANCE REPORT AND FY 2018 ANNUAL PERFORMANCE PLAN | 49
PERFORMANCE GOAL 4.2.3 Expand the SEC’s video teleconferencing (VTC) capabilities to support
an increasing geographically-dispersed workforce
Description: The SEC seeks to develop a state-of-the-art video teleconference solution that allows users to conduct a video/teleconference meeting between headquarters, regional offices, and multiple endpoints simultaneously; collaborate and share presentation materials; and use VoIP technology to host video teleconferences from their offices/workspaces with other SEC users or conference rooms. This metric will measure the average “uptime” or availability of all VTC systems.
Fiscal Year FY 2011 FY 2012 FY 2013 FY 2014 FY 2015FY 2016
PlanFY 2016 Actual
FY 2017 Estimate
FY 2018 Estimate
Availability rate for VTC solutions
Prior-year data not available
80.00% 99.99% 99.99% 99.99% 99.99% 99.99% 99.99%
Target: Met
Analysis: VTC services are leveraged across the SEC. Their high availability is attributed to the SEC’s investments in better technology, documented procedures, and training.
Responsible Division/Office: Office of Information Technology
Data Source: Telecommunications monitoring system
PERFORMANCE GOAL 4.2.4 Pursue continuous technology cost reductions and efficiencies
Description: Recent technology enhancements such as data center consolidation, virtualization, and maintenance contract reductions are producing technical efficiencies and cost savings. This metric will measure the amount of these cost savings.
Fiscal YearFY
2011FY
2012 FY 2013 FY 2014 FY 2015FY 2016
PlanFY 2016 Actual
FY 2017 Estimate
FY 2018 Estimate
Percent reduction in operational run cost leveraging technology and process efficien-cies
Prior-year data not available
18.7% cost reduction in steady state
run costs
1% reduction
in cost
1% reduction
in cost
1% reduction
in cost
1% reduction
in cost
1% reduction
in cost
1% reduction
in cost
Target: Met
Analysis: OIT has implemented a strategic initiative, the Steady State Cost Reduction Plan, to review all Steady State project costs. This plan has both short- and long-term objectives as well as business impact assessments. This effort is SEC-wide as many of the steady state costs with a focus on leveraging market data to capture significant improvements during contract negotiations.
Responsible Division/Office: Office of Information Technology
Data Source: OIT Network Operations Center (NOC)
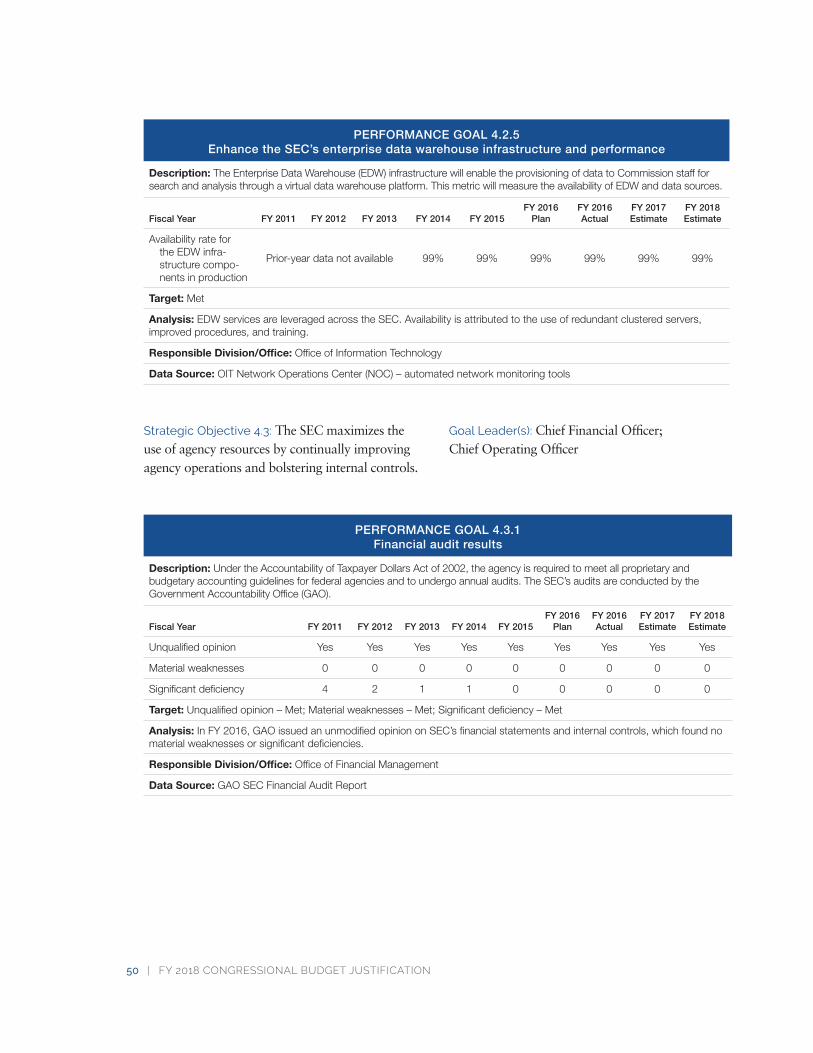
50 | FY 2018 CONGRESSIONAL BUDGET JUSTIFICATION
PERFORMANCE GOAL 4.2.5 Enhance the SEC’s enterprise data warehouse infrastructure and performance
Description: The Enterprise Data Warehouse (EDW) infrastructure will enable the provisioning of data to Commission staff for search and analysis through a virtual data warehouse platform. This metric will measure the availability of EDW and data sources.
Fiscal Year FY 2011 FY 2012 FY 2013 FY 2014 FY 2015FY 2016
PlanFY 2016 Actual
FY 2017 Estimate
FY 2018 Estimate
Availability rate for the EDW infra-structure compo-nents in production
Prior-year data not available 99% 99% 99% 99% 99% 99%
Target: Met
Analysis: EDW services are leveraged across the SEC. Availability is attributed to the use of redundant clustered servers, improved procedures, and training.
Responsible Division/Office: Office of Information Technology
Data Source: OIT Network Operations Center (NOC) – automated network monitoring tools
Strategic Objective 4.3: The SEC maximizes the use of agency resources by continually improving agency operations and bolstering internal controls.
Goal Leader(s): Chief Financial Officer; Chief Operating Officer
PERFORMANCE GOAL 4.3.1 Financial audit results
Description: Under the Accountability of Taxpayer Dollars Act of 2002, the agency is required to meet all proprietary and budgetary accounting guidelines for federal agencies and to undergo annual audits. The SEC’s audits are conducted by the Government Accountability Office (GAO).
Fiscal Year FY 2011 FY 2012 FY 2013 FY 2014 FY 2015FY 2016
PlanFY 2016 Actual
FY 2017 Estimate
FY 2018 Estimate
Unqualified opinion Yes Yes Yes Yes Yes Yes Yes Yes Yes
Material weaknesses 0 0 0 0 0 0 0 0 0
Significant deficiency 4 2 1 1 0 0 0 0 0
Target: Unqualified opinion – Met; Material weaknesses – Met; Significant deficiency – Met
Analysis: In FY 2016, GAO issued an unmodified opinion on SEC’s financial statements and internal controls, which found no material weaknesses or significant deficiencies.
Responsible Division/Office: Office of Financial Management
Data Source: GAO SEC Financial Audit Report
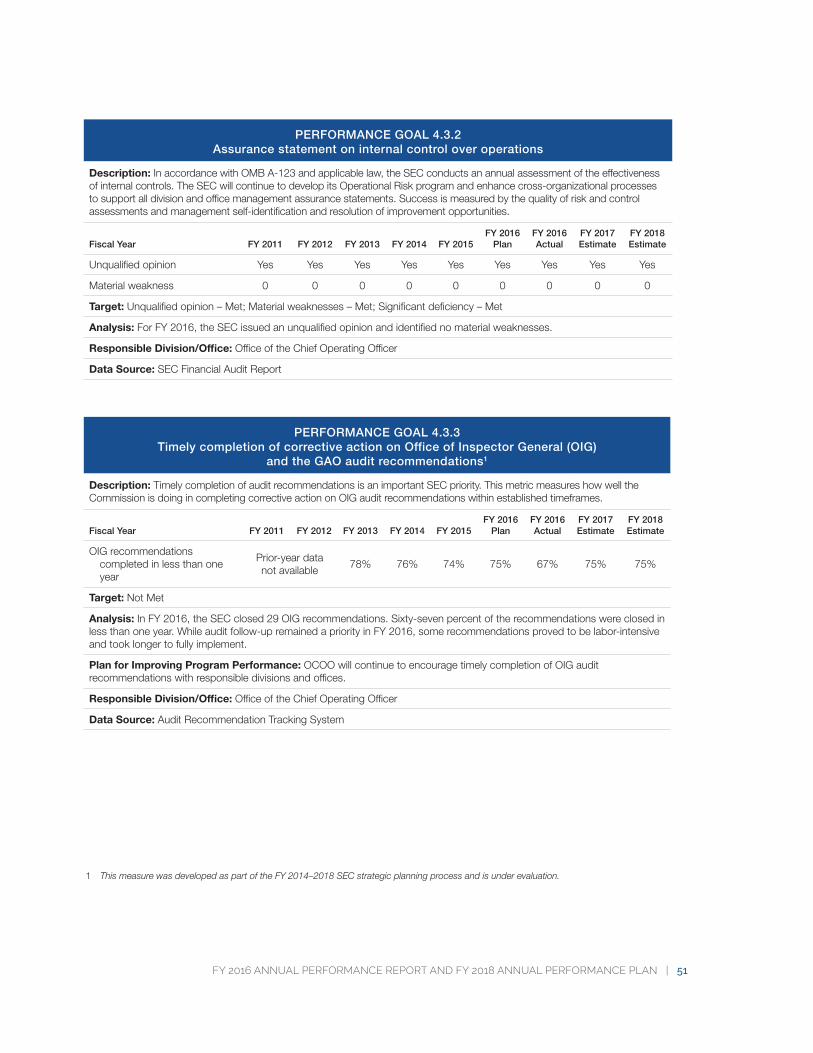
FY 2016 ANNUAL PERFORMANCE REPORT AND FY 2018 ANNUAL PERFORMANCE PLAN | 51
PERFORMANCE GOAL 4.3.2 Assurance statement on internal control over operations
Description: In accordance with OMB A-123 and applicable law, the SEC conducts an annual assessment of the effectiveness of internal controls. The SEC will continue to develop its Operational Risk program and enhance cross-organizational processes to support all division and office management assurance statements. Success is measured by the quality of risk and control assessments and management self-identification and resolution of improvement opportunities.
Fiscal Year FY 2011 FY 2012 FY 2013 FY 2014 FY 2015FY 2016
PlanFY 2016 Actual
FY 2017 Estimate
FY 2018 Estimate
Unqualified opinion Yes Yes Yes Yes Yes Yes Yes Yes Yes
Material weakness 0 0 0 0 0 0 0 0 0
Target: Unqualified opinion – Met; Material weaknesses – Met; Significant deficiency – Met
Analysis: For FY 2016, the SEC issued an unqualified opinion and identified no material weaknesses.
Responsible Division/Office: Office of the Chief Operating Officer
Data Source: SEC Financial Audit Report
PERFORMANCE GOAL 4.3.3 Timely completion of corrective action on Office of Inspector General (OIG)
and the GAO audit recommendations1
Description: Timely completion of audit recommendations is an important SEC priority. This metric measures how well the Commission is doing in completing corrective action on OIG audit recommendations within established timeframes.
Fiscal Year FY 2011 FY 2012 FY 2013 FY 2014 FY 2015FY 2016
PlanFY 2016 Actual
FY 2017 Estimate
FY 2018 Estimate
OIG recommendations completed in less than one year
Prior-year data not available
78% 76% 74% 75% 67% 75% 75%
Target: Not Met
Analysis: In FY 2016, the SEC closed 29 OIG recommendations. Sixty-seven percent of the recommendations were closed in less than one year. While audit follow-up remained a priority in FY 2016, some recommendations proved to be labor-intensive and took longer to fully implement.
Plan for Improving Program Performance: OCOO will continue to encourage timely completion of OIG audit recommendations with responsible divisions and offices.
Responsible Division/Office: Office of the Chief Operating Officer
Data Source: Audit Recommendation Tracking System
1 ThismeasurewasdevelopedaspartoftheFY2014–2018SECstrategicplanningprocessandisunderevaluation.
FY 2018 Budget Request by Program
Division of Enforcement ................................................................................................................................................55
Office of Compliance Inspections and Examinations .........................................................................57
Division of Corporation Finance............................................................................................................................ 58
Division of Trading and Markets ............................................................................................................................ 59
Division of Investment Management ................................................................................................................62
Division of Economic and Risk Analysis ......................................................................................................... 64
Office of the General Counsel ................................................................................................................................. 65
Other Program Offices ................................................................................................................................................... 67
Office of the Chief Accountant .......................................................................................................................69
Office of Investor Education and Advocacy ........................................................................................ 70
Office of International Affairs ..............................................................................................................................71
Office of Administrative Law Judges .........................................................................................................72
Office of the Investor Advocate ......................................................................................................................73
Office of Credit Ratings ..........................................................................................................................................74
Office of Municipal Securities ...........................................................................................................................75
Office of the Advocate for Small Business Capital Formation ............................................ 76
Agency Direction and Administrative Support .........................................................................................77
Agency Direction .........................................................................................................................................................78
Office of the Chief Operating Officer ..........................................................................................................82
Office of the Ethics Counsel ..............................................................................................................................91
Office of Minority and Women Inclusion ................................................................................................92
Office of Equal Employment Opportunity .............................................................................................93
Office of Inspector General........................................................................................................................................ 95

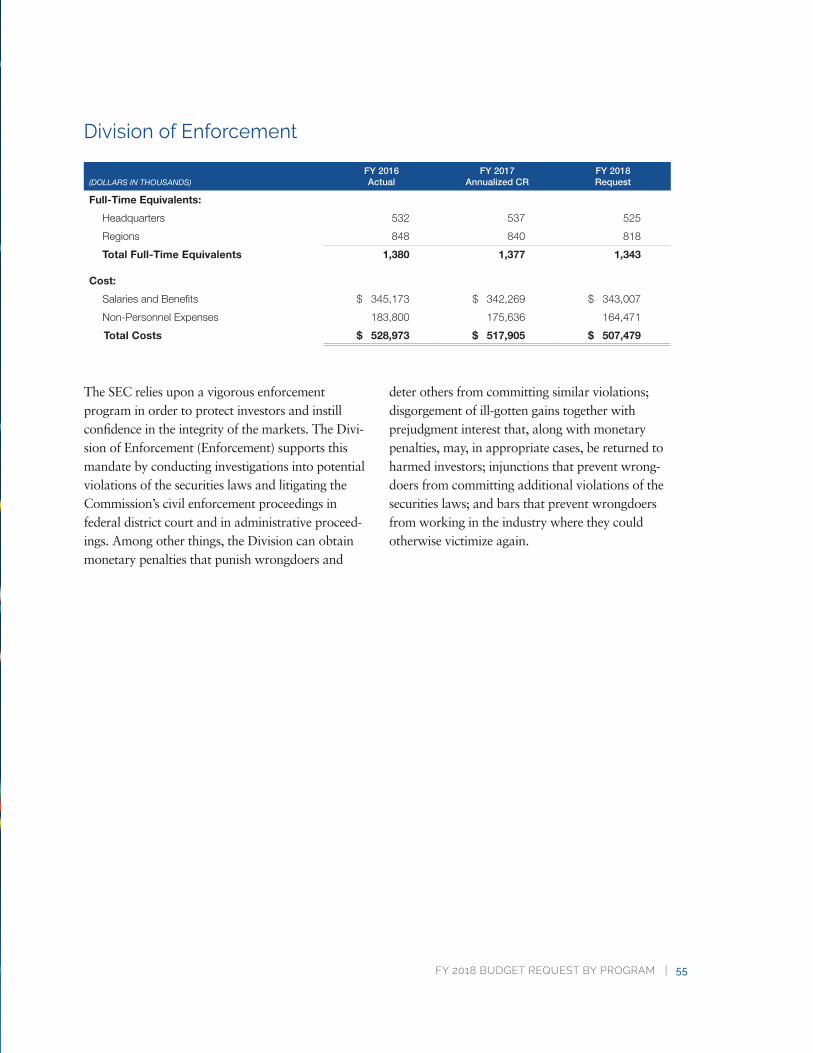
Division of Enforcement
(DOLLARS IN THOUSANDS)FY 2016Actual
FY 2017Annualized CR
FY 2018Request
Full-Time Equivalents:
Headquarters 532 537 525
Regions 848 840 818
Total Full-Time Equivalents 1,380 1,377 1,343
Cost:
Salaries and Benefits $ 345,173 $ 342,269 $ 343,007
Non-Personnel Expenses 183,800 175,636 164,471
Total Costs $ 528,973 $ 517,905 $ 507,479
The SEC relies upon a vigorous enforcement program in order to protect investors and instill confidence in the integrity of the markets. The Divi-sion of Enforcement (Enforcement) supports this mandate by conducting investigations into potential violations of the securities laws and litigating the Commission’s civil enforcement proceedings in federal district court and in administrative proceed-ings. Among other things, the Division can obtain monetary penalties that punish wrongdoers and
deter others from committing similar violations; disgorgement of ill-gotten gains together with prejudgment interest that, along with monetary penalties, may, in appropriate cases, be returned to harmed investors; injunctions that prevent wrong-doers from committing additional violations of the securities laws; and bars that prevent wrongdoers from working in the industry where they could otherwise victimize again.
FY 2018 BUDGET REQUEST BY PROGRAM | 55
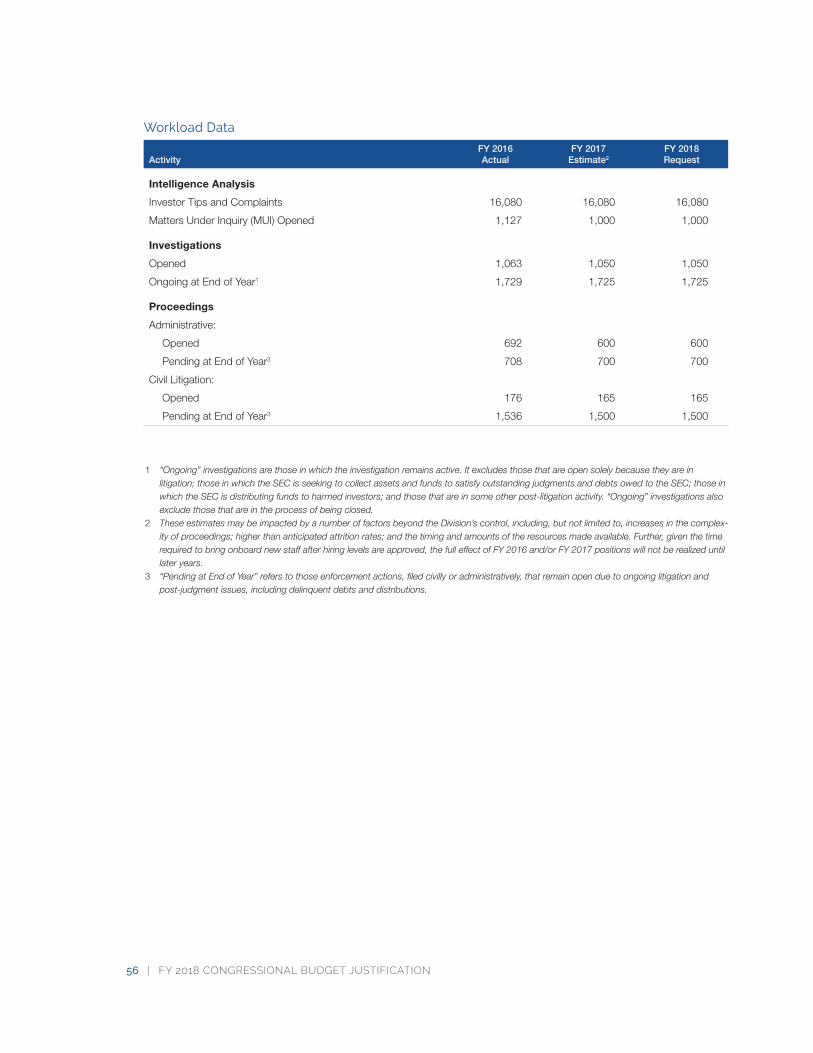
Workload Data
ActivityFY 2016Actual
FY 2017Estimate2
FY 2018Request
Intelligence Analysis
Investor Tips and Complaints 16,080 16,080 16,080
Matters Under Inquiry (MUI) Opened 1,127 1,000 1,000
Investigations
Opened 1,063 1,050 1,050
Ongoing at End of Year1 1,729 1,725 1,725
Proceedings
Administrative:
Opened 692 600 600
Pending at End of Year3 708 700 700
Civil Litigation:
Opened 176 165 165
Pending at End of Year3 1,536 1,500 1,500
1 “Ongoing”investigationsarethoseinwhichtheinvestigationremainsactive.Itexcludesthosethatareopensolelybecausetheyareinlitigation;thoseinwhichtheSECisseekingtocollectassetsandfundstosatisfyoutstandingjudgmentsanddebtsowedtotheSEC;thoseinwhichtheSECisdistributingfundstoharmedinvestors;andthosethatareinsomeotherpost-litigationactivity.“Ongoing”investigationsalsoexcludethosethatareintheprocessofbeingclosed.
2 TheseestimatesmaybeimpactedbyanumberoffactorsbeyondtheDivision’scontrol,including,butnotlimitedto,increasesinthecomplex-ityofproceedings;higherthananticipatedattritionrates;andthetimingandamountsoftheresourcesmadeavailable.Further,giventhetimerequiredtobringonboardnewstaffafterhiringlevelsareapproved,thefulleffectofFY2016and/orFY2017positionswillnotberealizeduntillateryears.
3 “PendingatEndofYear”referstothoseenforcementactions,filedcivillyoradministratively,thatremainopenduetoongoinglitigationandpost-judgmentissues,includingdelinquentdebtsanddistributions.
56 | FY 2018 CONGRESSIONAL BUDGET JUSTIFICATION
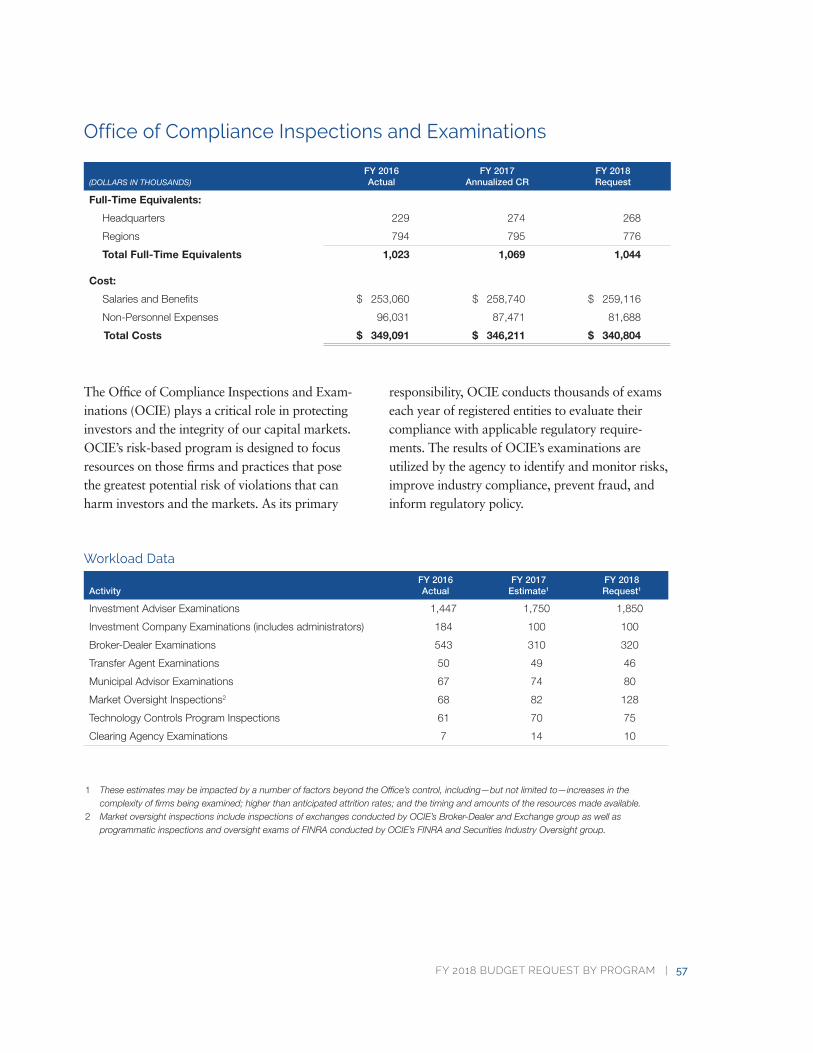
FY 2018 BUDGET REQUEST BY PROGRAM | 57
Office of Compliance Inspections and Examinations
(DOLLARS IN THOUSANDS)FY 2016Actual
FY 2017Annualized CR
FY 2018Request
Full-Time Equivalents:
Headquarters 229 274 268
Regions 794 795 776
Total Full-Time Equivalents 1,023 1,069 1,044
Cost:
Salaries and Benefits $ 253,060 $ 258,740 $ 259,116
Non-Personnel Expenses 96,031 87,471 81,688
Total Costs $ 349,091 $ 346,211 $ 340,804
The Office of Compliance Inspections and Exam-inations (OCIE) plays a critical role in protecting investors and the integrity of our capital markets. OCIE’s risk-based program is designed to focus resources on those firms and practices that pose the greatest potential risk of violations that can harm investors and the markets. As its primary
responsibility, OCIE conducts thousands of exams each year of registered entities to evaluate their compliance with applicable regulatory require-ments. The results of OCIE’s examinations are utilized by the agency to identify and monitor risks, improve industry compliance, prevent fraud, and inform regulatory policy.
Workload Data
ActivityFY 2016Actual
FY 2017Estimate1
FY 2018Request1
Investment Adviser Examinations 1,447 1,750 1,850
Investment Company Examinations (includes administrators) 184 100 100
Broker-Dealer Examinations 543 310 320
Transfer Agent Examinations 50 49 46
Municipal Advisor Examinations 67 74 80
Market Oversight Inspections2 68 82 128
Technology Controls Program Inspections 61 70 75
Clearing Agency Examinations 7 14 10
1 TheseestimatesmaybeimpactedbyanumberoffactorsbeyondtheOffice’scontrol,including—butnotlimitedto—increasesinthe complexityoffirmsbeingexamined;higherthananticipatedattritionrates;andthetimingandamountsoftheresourcesmadeavailable.
2 MarketoversightinspectionsincludeinspectionsofexchangesconductedbyOCIE’sBroker-DealerandExchangegroupaswellas programmaticinspectionsandoversightexamsofFINRAconductedbyOCIE’sFINRAandSecuritiesIndustryOversightgroup.
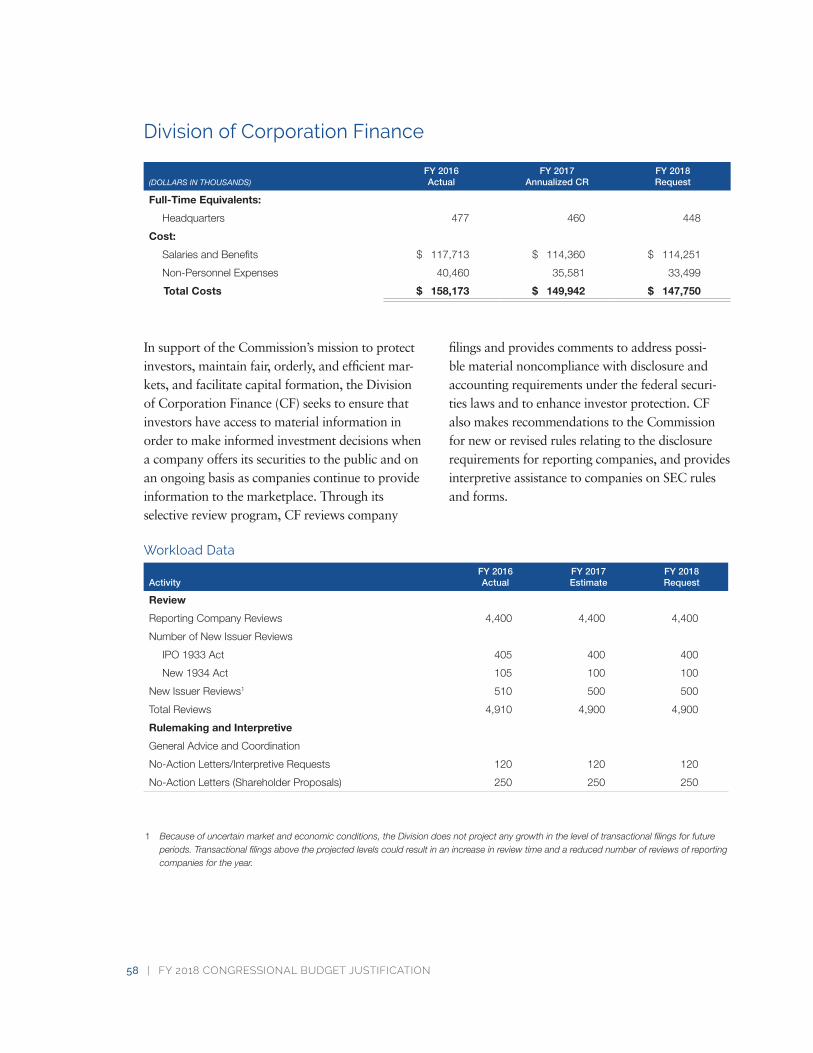
58 | FY 2018 CONGRESSIONAL BUDGET JUSTIFICATION
Division of Corporation Finance
(DOLLARS IN THOUSANDS)FY 2016Actual
FY 2017Annualized CR
FY 2018Request
Full-Time Equivalents:
Headquarters 477 460 448
Cost:
Salaries and Benefits $ 117,713 $ 114,360 $ 114,251
Non-Personnel Expenses 40,460 35,581 33,499
Total Costs $ 158,173 $ 149,942 $ 147,750
In support of the Commission’s mission to protect investors, maintain fair, orderly, and efficient mar-kets, and facilitate capital formation, the Division of Corporation Finance (CF) seeks to ensure that investors have access to material information in order to make informed investment decisions when a company offers its securities to the public and on an ongoing basis as companies continue to provide information to the marketplace. Through its selective review program, CF reviews company
filings and provides comments to address possi-ble material noncompliance with disclosure and accounting requirements under the federal securi-ties laws and to enhance investor protection. CF also makes recommendations to the Commission for new or revised rules relating to the disclosure requirements for reporting companies, and provides interpretive assistance to companies on SEC rules and forms.
Workload Data
ActivityFY 2016Actual
FY 2017Estimate
FY 2018Request
Review
Reporting Company Reviews 4,400 4,400 4,400
Number of New Issuer Reviews
IPO 1933 Act 405 400 400
New 1934 Act 105 100 100
New Issuer Reviews1 510 500 500
Total Reviews 4,910 4,900 4,900
Rulemaking and Interpretive
General Advice and Coordination
No-Action Letters/Interpretive Requests 120 120 120
No-Action Letters (Shareholder Proposals) 250 250 250
1 Becauseofuncertainmarketandeconomicconditions,theDivisiondoesnotprojectanygrowthintheleveloftransactionalfilingsforfutureperiods.Transactionalfilingsabovetheprojectedlevelscouldresultinanincreaseinreviewtimeandareducednumberofreviewsofreportingcompaniesfortheyear.
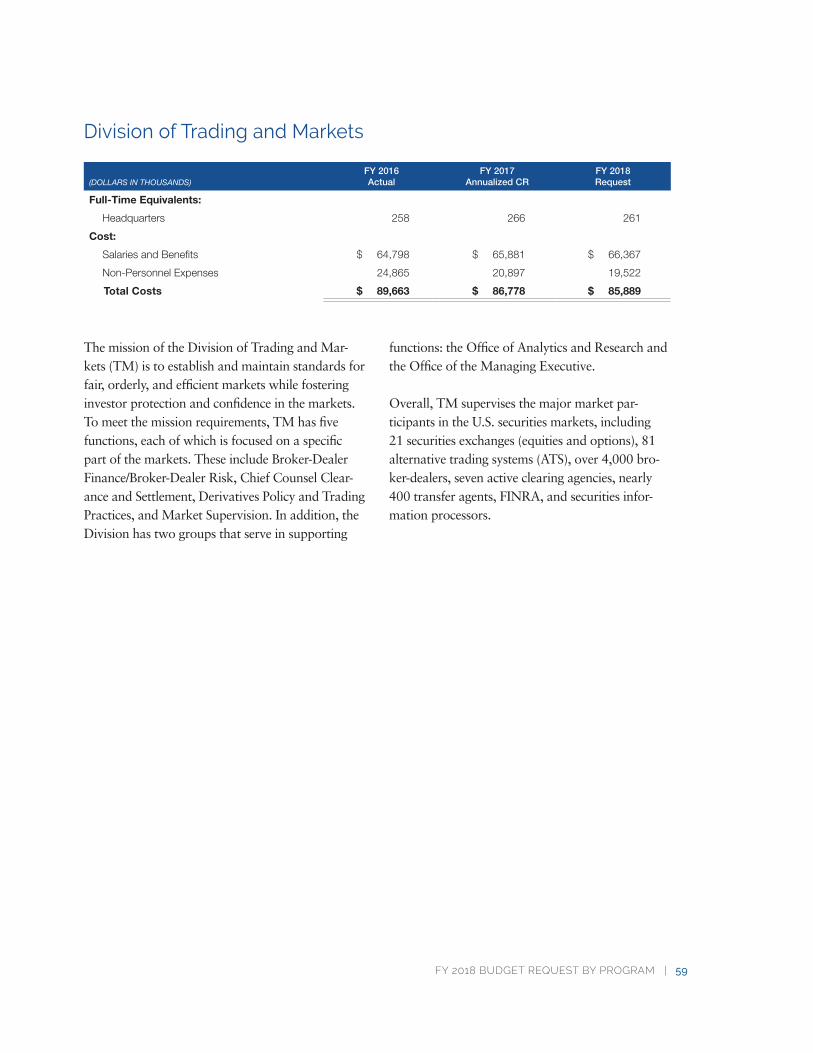
FY 2018 BUDGET REQUEST BY PROGRAM | 59
Division of Trading and Markets
(DOLLARS IN THOUSANDS)FY 2016Actual
FY 2017Annualized CR
FY 2018Request
Full-Time Equivalents:
Headquarters 258 266 261
Cost:
Salaries and Benefits $ 64,798 $ 65,881 $ 66,367
Non-Personnel Expenses 24,865 20,897 19,522
Total Costs $ 89,663 $ 86,778 $ 85,889
The mission of the Division of Trading and Mar-kets (TM) is to establish and maintain standards for fair, orderly, and efficient markets while fostering investor protection and confidence in the markets. To meet the mission requirements, TM has five functions, each of which is focused on a specific part of the markets. These include Broker-Dealer Finance/Broker-Dealer Risk, Chief Counsel Clear-ance and Settlement, Derivatives Policy and Trading Practices, and Market Supervision. In addition, the Division has two groups that serve in supporting
functions: the Office of Analytics and Research and the Office of the Managing Executive.
Overall, TM supervises the major market par-ticipants in the U.S. securities markets, including 21 securities exchanges (equities and options), 81 alternative trading systems (ATS), over 4,000 bro-ker-dealers, seven active clearing agencies, nearly 400 transfer agents, FINRA, and securities infor-mation processors.
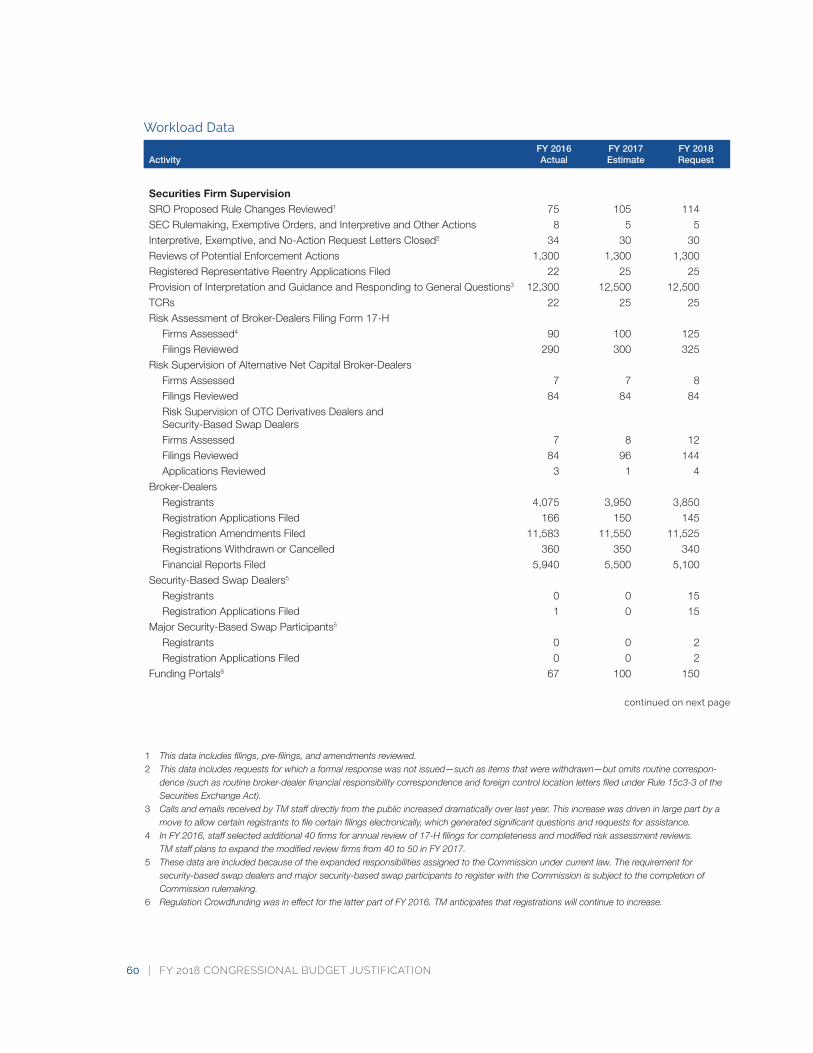
60 | FY 2018 CONGRESSIONAL BUDGET JUSTIFICATION
Workload Data
ActivityFY 2016Actual
FY 2017Estimate
FY 2018Request
Securities Firm SupervisionSRO Proposed Rule Changes Reviewed1 75 105 114SEC Rulemaking, Exemptive Orders, and Interpretive and Other Actions 8 5 5Interpretive, Exemptive, and No-Action Request Letters Closed2 34 30 30Reviews of Potential Enforcement Actions 1,300 1,300 1,300Registered Representative Reentry Applications Filed 22 25 25Provision of Interpretation and Guidance and Responding to General Questions3 12,300 12,500 12,500TCRs 22 25 25Risk Assessment of Broker-Dealers Filing Form 17-H
Firms Assessed4 90 100 125Filings Reviewed 290 300 325
Risk Supervision of Alternative Net Capital Broker-DealersFirms Assessed 7 7 8Filings Reviewed 84 84 84Risk Supervision of OTC Derivatives Dealers and Security-Based Swap DealersFirms Assessed 7 8 12Filings Reviewed 84 96 144Applications Reviewed 3 1 4
Broker-DealersRegistrants 4,075 3,950 3,850Registration Applications Filed 166 150 145Registration Amendments Filed 11,583 11,550 11,525Registrations Withdrawn or Cancelled 360 350 340Financial Reports Filed 5,940 5,500 5,100
Security-Based Swap Dealers5
Registrants 0 0 15Registration Applications Filed 1 0 15
Major Security-Based Swap Participants5
Registrants 0 0 2Registration Applications Filed 0 0 2
Funding Portals6 67 100 150
1 Thisdataincludesfilings,pre-filings,andamendmentsreviewed.2 Thisdataincludesrequestsforwhichaformalresponsewasnotissued—suchasitemsthatwerewithdrawn—butomitsroutinecorrespon-
dence(suchasroutinebroker-dealerfinancialresponsibilitycorrespondenceandforeigncontrollocationlettersfiledunderRule15c3-3oftheSecuritiesExchangeAct).
3 CallsandemailsreceivedbyTMstaffdirectlyfromthepublicincreaseddramaticallyoverlastyear.Thisincreasewasdriveninlargepartbyamovetoallowcertainregistrantstofilecertainfilingselectronically,whichgeneratedsignificantquestionsandrequestsforassistance.
4 InFY2016,staffselectedadditional40firmsforannualreviewof17-Hfilingsforcompletenessandmodifiedriskassessmentreviews. TMstaffplanstoexpandthemodifiedreviewfirmsfrom40to50inFY2017.
5 ThesedataareincludedbecauseoftheexpandedresponsibilitiesassignedtotheCommissionundercurrentlaw.Therequirementfor security-basedswapdealersandmajorsecurity-basedswapparticipantstoregisterwiththeCommissionissubjecttothecompletionofCommissionrulemaking.
6 RegulationCrowdfundingwasineffectforthelatterpartofFY2016.TManticipatesthatregistrationswillcontinuetoincrease.
continued on next page
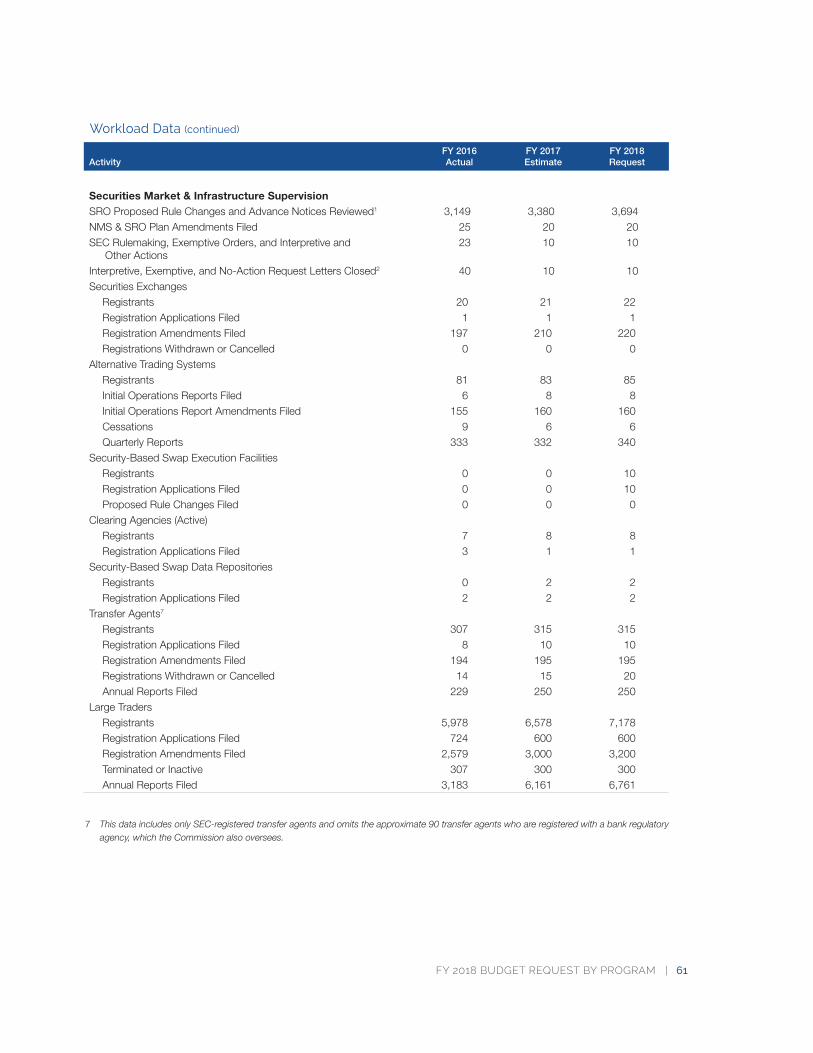
FY 2018 BUDGET REQUEST BY PROGRAM | 61
ActivityFY 2016Actual
FY 2017Estimate
FY 2018Request
Securities Market & Infrastructure SupervisionSRO Proposed Rule Changes and Advance Notices Reviewed1 3,149 3,380 3,694NMS & SRO Plan Amendments Filed 25 20 20SEC Rulemaking, Exemptive Orders, and Interpretive and
Other Actions23 10 10
Interpretive, Exemptive, and No-Action Request Letters Closed2 40 10 10Securities Exchanges
Registrants 20 21 22Registration Applications Filed 1 1 1Registration Amendments Filed 197 210 220Registrations Withdrawn or Cancelled 0 0 0
Alternative Trading SystemsRegistrants 81 83 85Initial Operations Reports Filed 6 8 8Initial Operations Report Amendments Filed 155 160 160Cessations 9 6 6Quarterly Reports 333 332 340
Security-Based Swap Execution FacilitiesRegistrants 0 0 10Registration Applications Filed 0 0 10Proposed Rule Changes Filed 0 0 0
Clearing Agencies (Active)Registrants 7 8 8Registration Applications Filed 3 1 1
Security-Based Swap Data RepositoriesRegistrants 0 2 2Registration Applications Filed 2 2 2
Transfer Agents7
Registrants 307 315 315Registration Applications Filed 8 10 10Registration Amendments Filed 194 195 195Registrations Withdrawn or Cancelled 14 15 20Annual Reports Filed 229 250 250
Large TradersRegistrants 5,978 6,578 7,178Registration Applications Filed 724 600 600Registration Amendments Filed 2,579 3,000 3,200Terminated or Inactive 307 300 300Annual Reports Filed 3,183 6,161 6,761
7 ThisdataincludesonlySEC-registeredtransferagentsandomitstheapproximate90transferagentswhoareregisteredwithabankregulatoryagency,whichtheCommissionalsooversees.
Workload Data (continued)
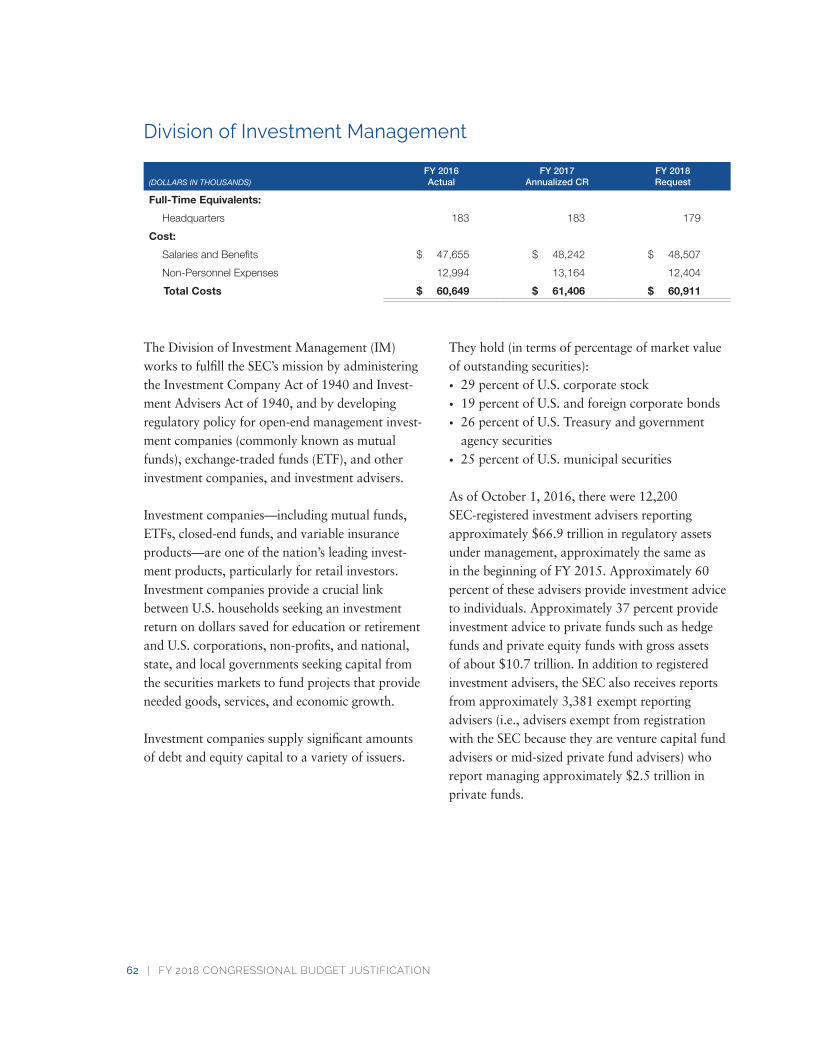
62 | FY 2018 CONGRESSIONAL BUDGET JUSTIFICATION
Division of Investment Management
(DOLLARS IN THOUSANDS)FY 2016Actual
FY 2017Annualized CR
FY 2018Request
Full-Time Equivalents:
Headquarters 183 183 179
Cost:
Salaries and Benefits $ 47,655 $ 48,242 $ 48,507
Non-Personnel Expenses 12,994 13,164 12,404
Total Costs $ 60,649 $ 61,406 $ 60,911
The Division of Investment Management (IM) works to fulfill the SEC’s mission by administering the Investment Company Act of 1940 and Invest-ment Advisers Act of 1940, and by developing regulatory policy for open-end management invest-ment companies (commonly known as mutual funds), exchange-traded funds (ETF), and other investment companies, and investment advisers.
Investment companies—including mutual funds, ETFs, closed-end funds, and variable insurance products—are one of the nation’s leading invest-ment products, particularly for retail investors. Investment companies provide a crucial link between U.S. households seeking an investment return on dollars saved for education or retirement and U.S. corporations, non-profits, and national, state, and local governments seeking capital from the securities markets to fund projects that provide needed goods, services, and economic growth.
Investment companies supply significant amounts of debt and equity capital to a variety of issuers.
They hold (in terms of percentage of market value of outstanding securities):
• 29 percent of U.S. corporate stock
• 19 percent of U.S. and foreign corporate bonds
• 26 percent of U.S. Treasury and government agency securities
• 25 percent of U.S. municipal securities
As of October 1, 2016, there were 12,200 SEC-registered investment advisers reporting approximately $66.9 trillion in regulatory assets under management, approximately the same as in the beginning of FY 2015. Approximately 60 percent of these advisers provide investment advice to individuals. Approximately 37 percent provide investment advice to private funds such as hedge funds and private equity funds with gross assets of about $10.7 trillion. In addition to registered investment advisers, the SEC also receives reports from approximately 3,381 exempt reporting advisers (i.e., advisers exempt from registration with the SEC because they are venture capital fund advisers or mid-sized private fund advisers) who report managing approximately $2.5 trillion in private funds.
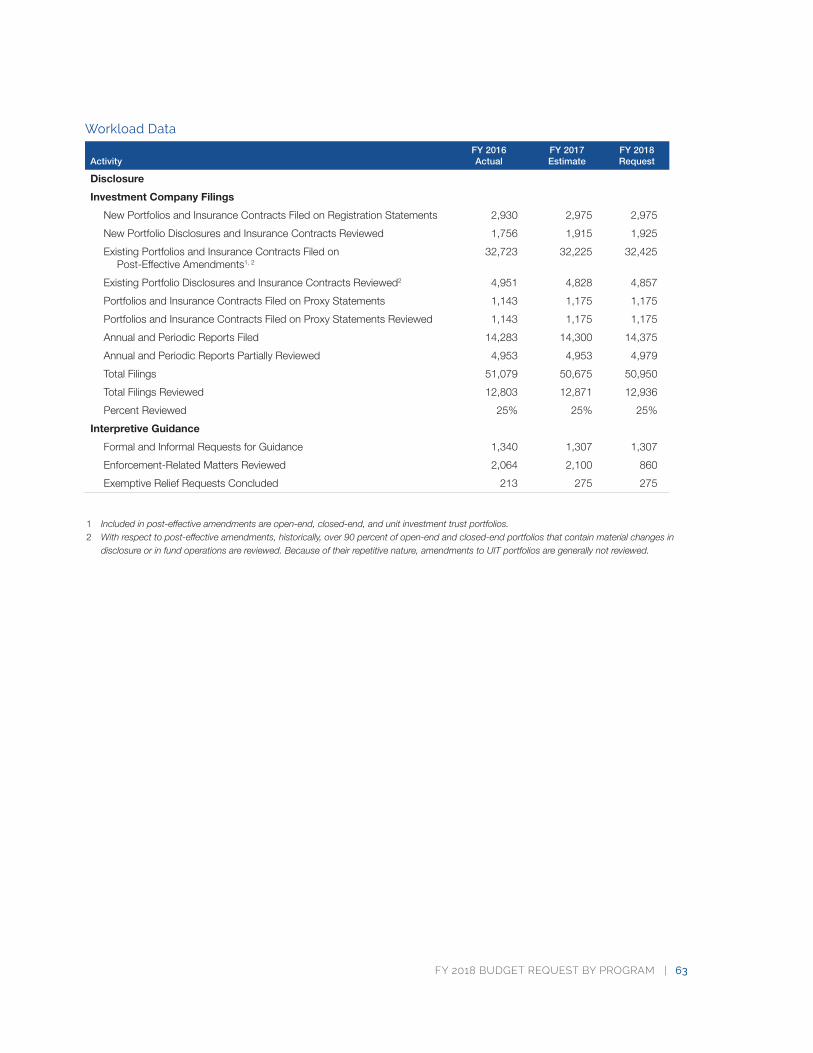
FY 2018 BUDGET REQUEST BY PROGRAM | 63
Workload Data
ActivityFY 2016Actual
FY 2017Estimate
FY 2018Request
Disclosure
Investment Company Filings
New Portfolios and Insurance Contracts Filed on Registration Statements 2,930 2,975 2,975
New Portfolio Disclosures and Insurance Contracts Reviewed 1,756 1,915 1,925
Existing Portfolios and Insurance Contracts Filed on Post-Effective Amendments1, 2
32,723 32,225 32,425
Existing Portfolio Disclosures and Insurance Contracts Reviewed2 4,951 4,828 4,857
Portfolios and Insurance Contracts Filed on Proxy Statements 1,143 1,175 1,175
Portfolios and Insurance Contracts Filed on Proxy Statements Reviewed 1,143 1,175 1,175
Annual and Periodic Reports Filed 14,283 14,300 14,375
Annual and Periodic Reports Partially Reviewed 4,953 4,953 4,979
Total Filings 51,079 50,675 50,950
Total Filings Reviewed 12,803 12,871 12,936
Percent Reviewed 25% 25% 25%
Interpretive Guidance
Formal and Informal Requests for Guidance 1,340 1,307 1,307
Enforcement-Related Matters Reviewed 2,064 2,100 860
Exemptive Relief Requests Concluded 213 275 275
1 Includedinpost-effectiveamendmentsareopen-end,closed-end,andunitinvestmenttrustportfolios.2 Withrespecttopost-effectiveamendments,historically,over90percentofopen-endandclosed-endportfoliosthatcontainmaterialchangesin
disclosureorinfundoperationsarereviewed.Becauseoftheirrepetitivenature,amendmentstoUITportfoliosaregenerallynotreviewed.
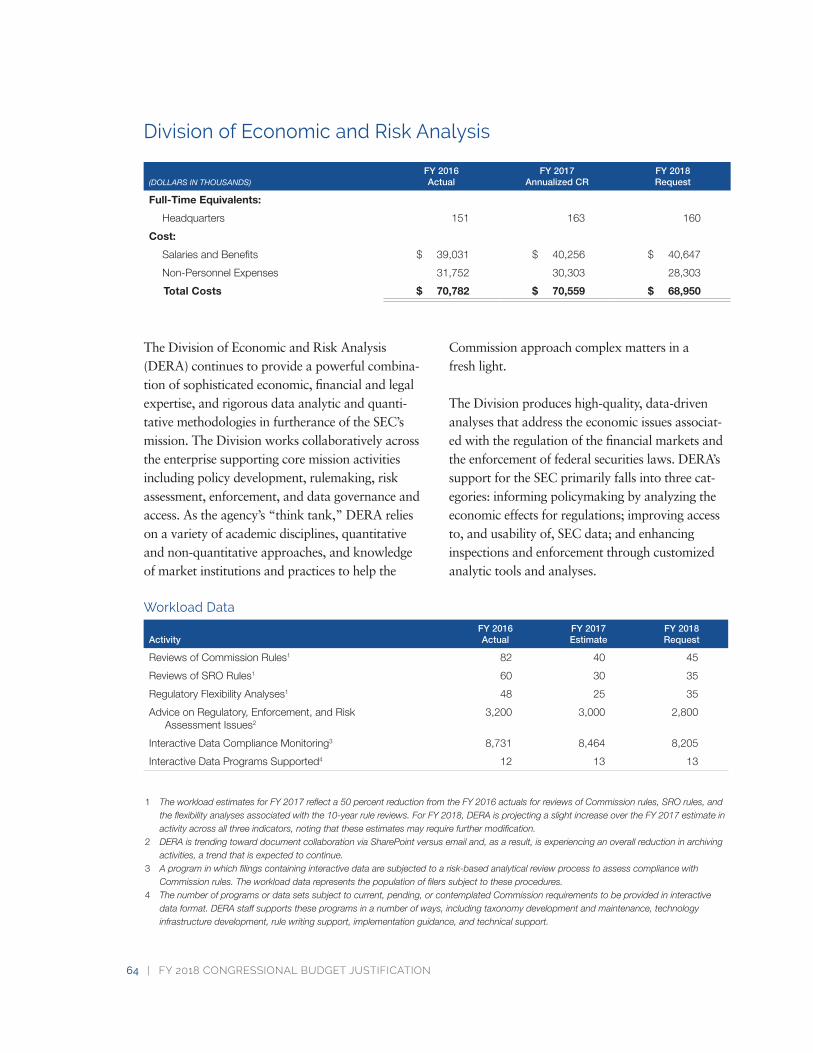
64 | FY 2018 CONGRESSIONAL BUDGET JUSTIFICATION
Division of Economic and Risk Analysis
(DOLLARS IN THOUSANDS)FY 2016Actual
FY 2017Annualized CR
FY 2018Request
Full-Time Equivalents:
Headquarters 151 163 160
Cost:
Salaries and Benefits $ 39,031 $ 40,256 $ 40,647
Non-Personnel Expenses 31,752 30,303 28,303
Total Costs $ 70,782 $ 70,559 $ 68,950
The Division of Economic and Risk Analysis (DERA) continues to provide a powerful combina-tion of sophisticated economic, financial and legal expertise, and rigorous data analytic and quanti-tative methodologies in furtherance of the SEC’s mission. The Division works collaboratively across the enterprise supporting core mission activities including policy development, rulemaking, risk assessment, enforcement, and data governance and access. As the agency’s “think tank,” DERA relies on a variety of academic disciplines, quantitative and non-quantitative approaches, and knowledge of market institutions and practices to help the
Commission approach complex matters in a fresh light.
The Division produces high-quality, data-driven analyses that address the economic issues associat-ed with the regulation of the financial markets and the enforcement of federal securities laws. DERA’s support for the SEC primarily falls into three cat-egories: informing policymaking by analyzing the economic effects for regulations; improving access to, and usability of, SEC data; and enhancing inspections and enforcement through customized analytic tools and analyses.
Workload Data
ActivityFY 2016Actual
FY 2017Estimate
FY 2018Request
Reviews of Commission Rules1 82 40 45
Reviews of SRO Rules1 60 30 35
Regulatory Flexibility Analyses1 48 25 35
Advice on Regulatory, Enforcement, and Risk Assessment Issues2
3,200 3,000 2,800
Interactive Data Compliance Monitoring3 8,731 8,464 8,205
Interactive Data Programs Supported4 12 13 13
1 TheworkloadestimatesforFY2017reflecta50percentreductionfromtheFY2016actualsforreviewsofCommissionrules,SROrules,andtheflexibilityanalysesassociatedwiththe10-yearrulereviews.ForFY2018,DERAisprojectingaslightincreaseovertheFY2017estimateinactivityacrossallthreeindicators,notingthattheseestimatesmayrequirefurthermodification.
2 DERAistrendingtowarddocumentcollaborationviaSharePointversusemailand,asaresult,isexperiencinganoverallreductioninarchivingactivities,atrendthatisexpectedtocontinue.
3 Aprograminwhichfilingscontaininginteractivedataaresubjectedtoarisk-basedanalyticalreviewprocesstoassesscompliancewith Commissionrules.Theworkloaddatarepresentsthepopulationoffilerssubjecttotheseprocedures.
4 Thenumberofprogramsordatasetssubjecttocurrent,pending,orcontemplatedCommissionrequirementstobeprovidedininteractive dataformat.DERAstaffsupportstheseprogramsinanumberofways,includingtaxonomydevelopmentandmaintenance,technology infrastructuredevelopment,rulewritingsupport,implementationguidance,andtechnicalsupport.
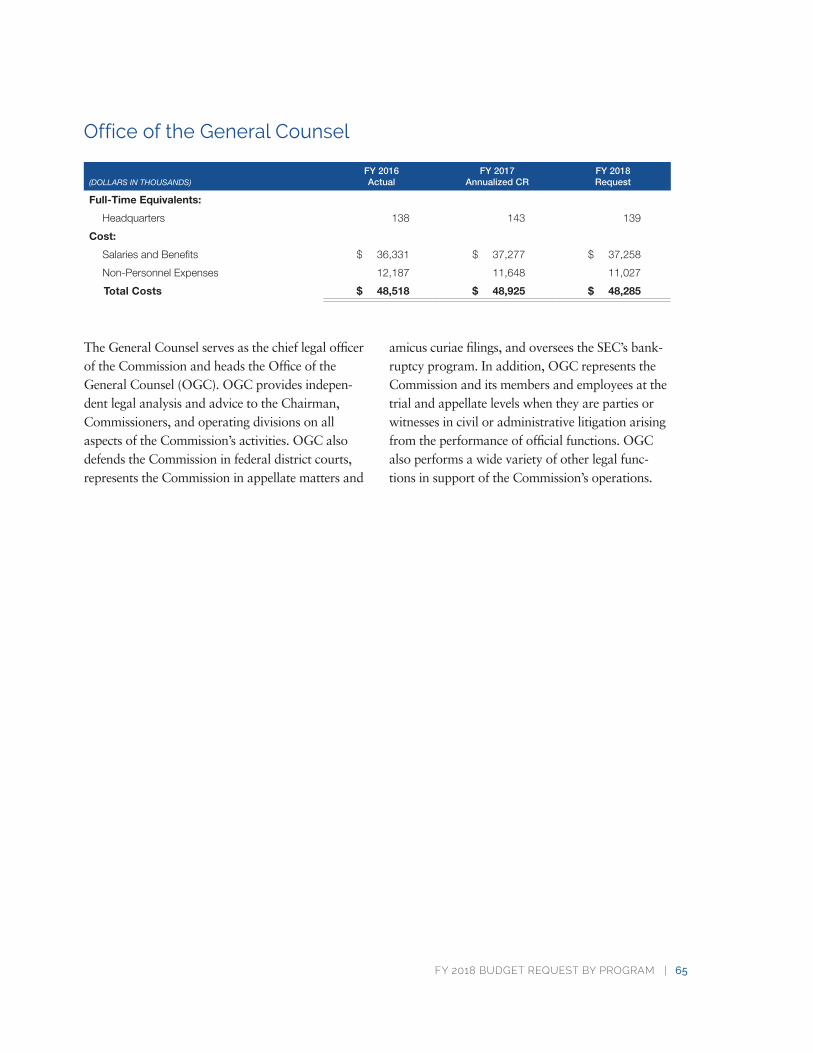
FY 2018 BUDGET REQUEST BY PROGRAM | 65
Office of the General Counsel
(DOLLARS IN THOUSANDS)FY 2016Actual
FY 2017Annualized CR
FY 2018Request
Full-Time Equivalents:
Headquarters 138 143 139
Cost:
Salaries and Benefits $ 36,331 $ 37,277 $ 37,258
Non-Personnel Expenses 12,187 11,648 11,027
Total Costs $ 48,518 $ 48,925 $ 48,285
The General Counsel serves as the chief legal officer of the Commission and heads the Office of the General Counsel (OGC). OGC provides indepen-dent legal analysis and advice to the Chairman, Commissioners, and operating divisions on all aspects of the Commission’s activities. OGC also defends the Commission in federal district courts, represents the Commission in appellate matters and
amicus curiae filings, and oversees the SEC’s bank-ruptcy program. In addition, OGC represents the Commission and its members and employees at the trial and appellate levels when they are parties or witnesses in civil or administrative litigation arising from the performance of official functions. OGC also performs a wide variety of other legal func-tions in support of the Commission’s operations.
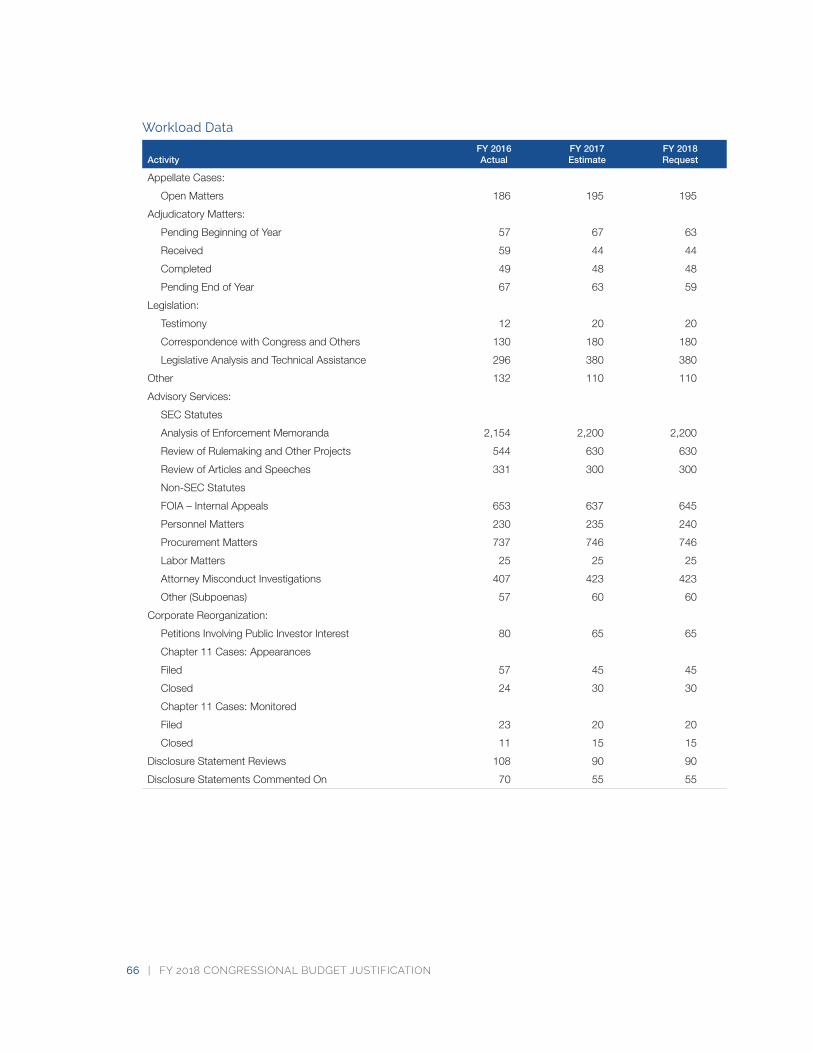
66 | FY 2018 CONGRESSIONAL BUDGET JUSTIFICATION
Workload Data
ActivityFY 2016Actual
FY 2017Estimate
FY 2018Request
Appellate Cases:
Open Matters 186 195 195
Adjudicatory Matters:
Pending Beginning of Year 57 67 63
Received 59 44 44
Completed 49 48 48
Pending End of Year 67 63 59
Legislation:
Testimony 12 20 20
Correspondence with Congress and Others 130 180 180
Legislative Analysis and Technical Assistance 296 380 380
Other 132 110 110
Advisory Services:
SEC Statutes
Analysis of Enforcement Memoranda 2,154 2,200 2,200
Review of Rulemaking and Other Projects 544 630 630
Review of Articles and Speeches 331 300 300
Non-SEC Statutes
FOIA – Internal Appeals 653 637 645
Personnel Matters 230 235 240
Procurement Matters 737 746 746
Labor Matters 25 25 25
Attorney Misconduct Investigations 407 423 423
Other (Subpoenas) 57 60 60
Corporate Reorganization:
Petitions Involving Public Investor Interest 80 65 65
Chapter 11 Cases: Appearances
Filed 57 45 45
Closed 24 30 30
Chapter 11 Cases: Monitored
Filed 23 20 20
Closed 11 15 15
Disclosure Statement Reviews 108 90 90
Disclosure Statements Commented On 70 55 55
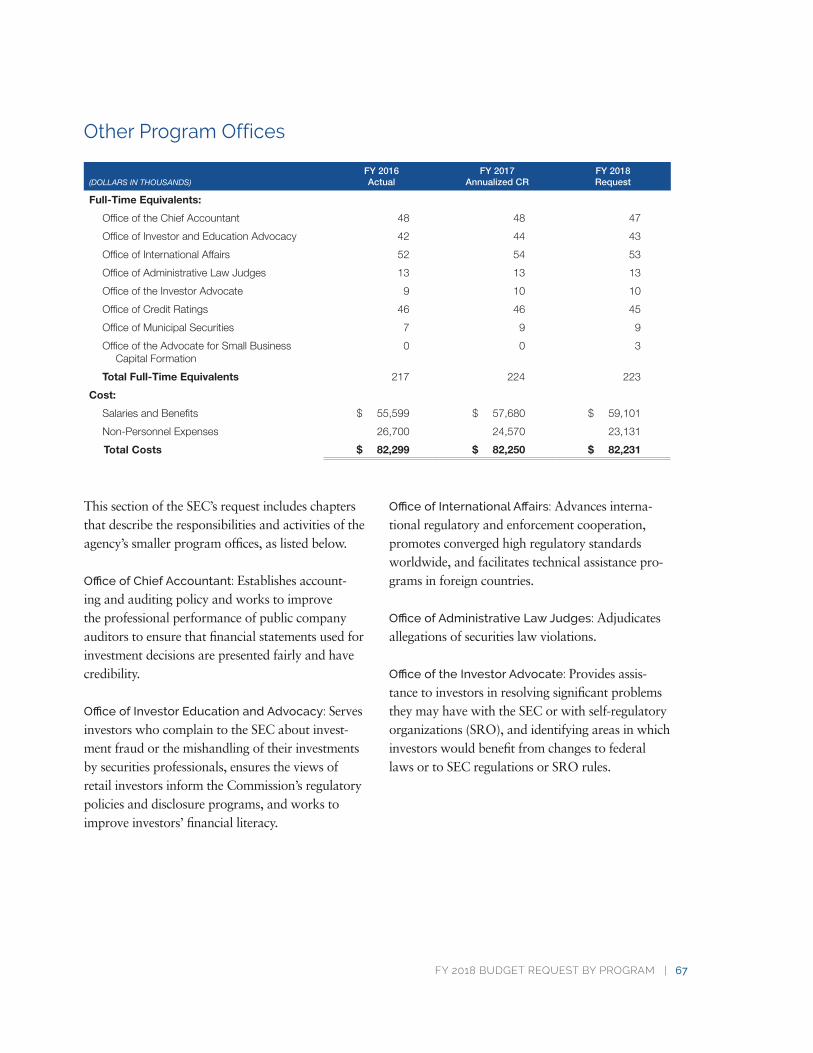
FY 2018 BUDGET REQUEST BY PROGRAM | 67
Other Program Offices
(DOLLARS IN THOUSANDS)FY 2016Actual
FY 2017Annualized CR
FY 2018Request
Full-Time Equivalents:
Office of the Chief Accountant 48 48 47
Office of Investor and Education Advocacy 42 44 43
Office of International Affairs 52 54 53
Office of Administrative Law Judges 13 13 13
Office of the Investor Advocate 9 10 10
Office of Credit Ratings 46 46 45
Office of Municipal Securities 7 9 9
Office of the Advocate for Small Business Capital Formation
0 0 3
Total Full-Time Equivalents 217 224 223
Cost:
Salaries and Benefits $ 55,599 $ 57,680 $ 59,101
Non-Personnel Expenses 26,700 24,570 23,131
Total Costs $ 82,299 $ 82,250 $ 82,231
This section of the SEC’s request includes chapters that describe the responsibilities and activities of the agency’s smaller program offices, as listed below.
Office of Chief Accountant: Establishes account-ing and auditing policy and works to improve the professional performance of public company auditors to ensure that financial statements used for investment decisions are presented fairly and have credibility.
Office of Investor Education and Advocacy: Serves investors who complain to the SEC about invest-ment fraud or the mishandling of their investments by securities professionals, ensures the views of retail investors inform the Commission’s regulatory policies and disclosure programs, and works to improve investors’ financial literacy.
Office of International Affairs: Advances interna-tional regulatory and enforcement cooperation, promotes converged high regulatory standards worldwide, and facilitates technical assistance pro-grams in foreign countries.
Office of Administrative Law Judges: Adjudicates allegations of securities law violations.
Office of the Investor Advocate: Provides assis-tance to investors in resolving significant problems they may have with the SEC or with self-regulatory organizations (SRO), and identifying areas in which investors would benefit from changes to federal laws or to SEC regulations or SRO rules.
68 | FY 2018 CONGRESSIONAL BUDGET JUSTIFICATION
Office of Credit Ratings: Administers the rules of the Commission with respect to the practices of nationally recognized statistical rating organiza-tions (NRSRO) in determining ratings; protects the users of credit ratings; promotes accuracy in credit ratings issued by NRSROs; and ensures that such ratings are not unduly influenced by conflicts of interest.
Office of Municipal Securities: Administers the rules of the Commission with respect to the prac-tices of municipal securities brokers and dealers, municipal advisors, and investors in, and issuers of,
municipal securities. The Office also coordinates with the Municipal Securities Rulemaking Board (MSRB) on rulemaking and enforcement actions.
Office of the Advocate for Small Business Capital
Formation: Will be created by the SEC as required by the SEC Small Business Advocate Act of 2016 (P.L. 114-284). Among other functions, the Office will identify needs of small businesses and small business investors, and how the regulations of the Commission or SROs can be changed to better address those needs.
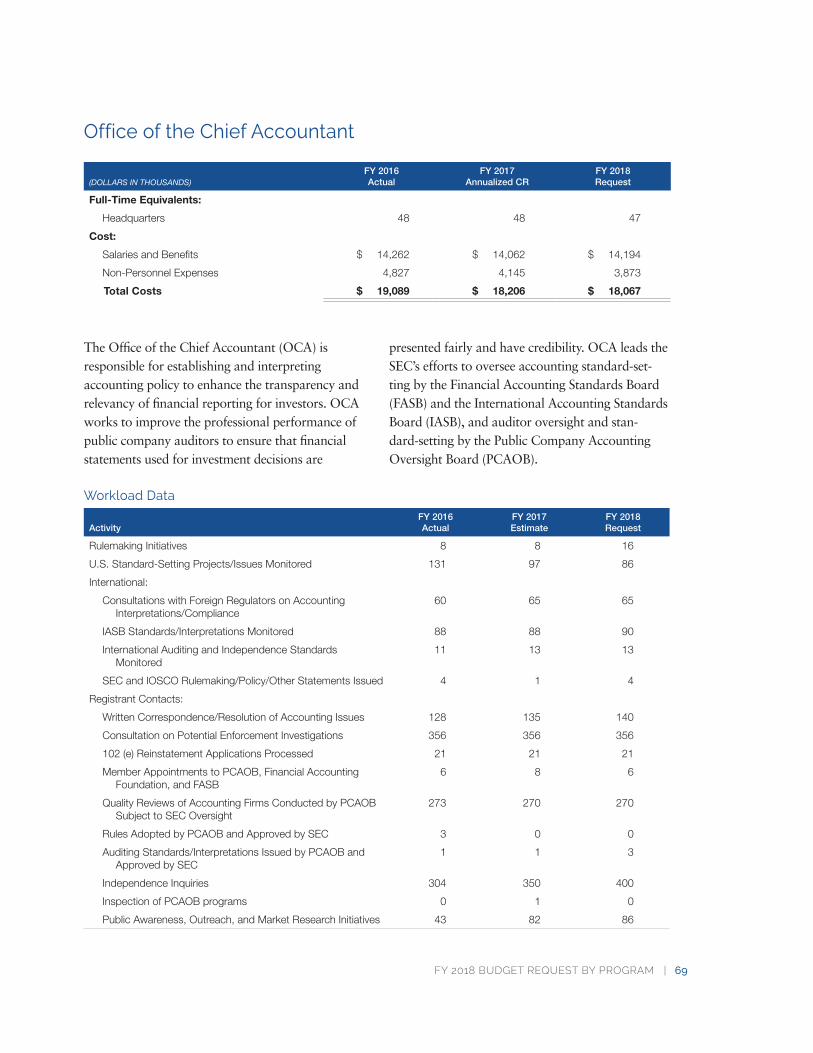
FY 2018 BUDGET REQUEST BY PROGRAM | 69
Office of the Chief Accountant
(DOLLARS IN THOUSANDS)FY 2016Actual
FY 2017Annualized CR
FY 2018Request
Full-Time Equivalents:
Headquarters 48 48 47
Cost:
Salaries and Benefits $ 14,262 $ 14,062 $ 14,194
Non-Personnel Expenses 4,827 4,145 3,873
Total Costs $ 19,089 $ 18,206 $ 18,067
The Office of the Chief Accountant (OCA) is responsible for establishing and interpreting accounting policy to enhance the transparency and relevancy of financial reporting for investors. OCA works to improve the professional performance of public company auditors to ensure that financial statements used for investment decisions are
presented fairly and have credibility. OCA leads the SEC’s efforts to oversee accounting standard-set-ting by the Financial Accounting Standards Board (FASB) and the International Accounting Standards Board (IASB), and auditor oversight and stan-dard-setting by the Public Company Accounting Oversight Board (PCAOB).
Workload Data
ActivityFY 2016Actual
FY 2017Estimate
FY 2018Request
Rulemaking Initiatives 8 8 16
U.S. Standard-Setting Projects/Issues Monitored 131 97 86
International:
Consultations with Foreign Regulators on Accounting Interpretations/Compliance
60 65 65
IASB Standards/Interpretations Monitored 88 88 90
International Auditing and Independence Standards Monitored
11 13 13
SEC and IOSCO Rulemaking/Policy/Other Statements Issued 4 1 4
Registrant Contacts:
Written Correspondence/Resolution of Accounting Issues 128 135 140
Consultation on Potential Enforcement Investigations 356 356 356
102 (e) Reinstatement Applications Processed 21 21 21
Member Appointments to PCAOB, Financial Accounting Foundation, and FASB
6 8 6
Quality Reviews of Accounting Firms Conducted by PCAOB Subject to SEC Oversight
273 270 270
Rules Adopted by PCAOB and Approved by SEC 3 0 0
Auditing Standards/Interpretations Issued by PCAOB and Approved by SEC
1 1 3
Independence Inquiries 304 350 400
Inspection of PCAOB programs 0 1 0
Public Awareness, Outreach, and Market Research Initiatives 43 82 86
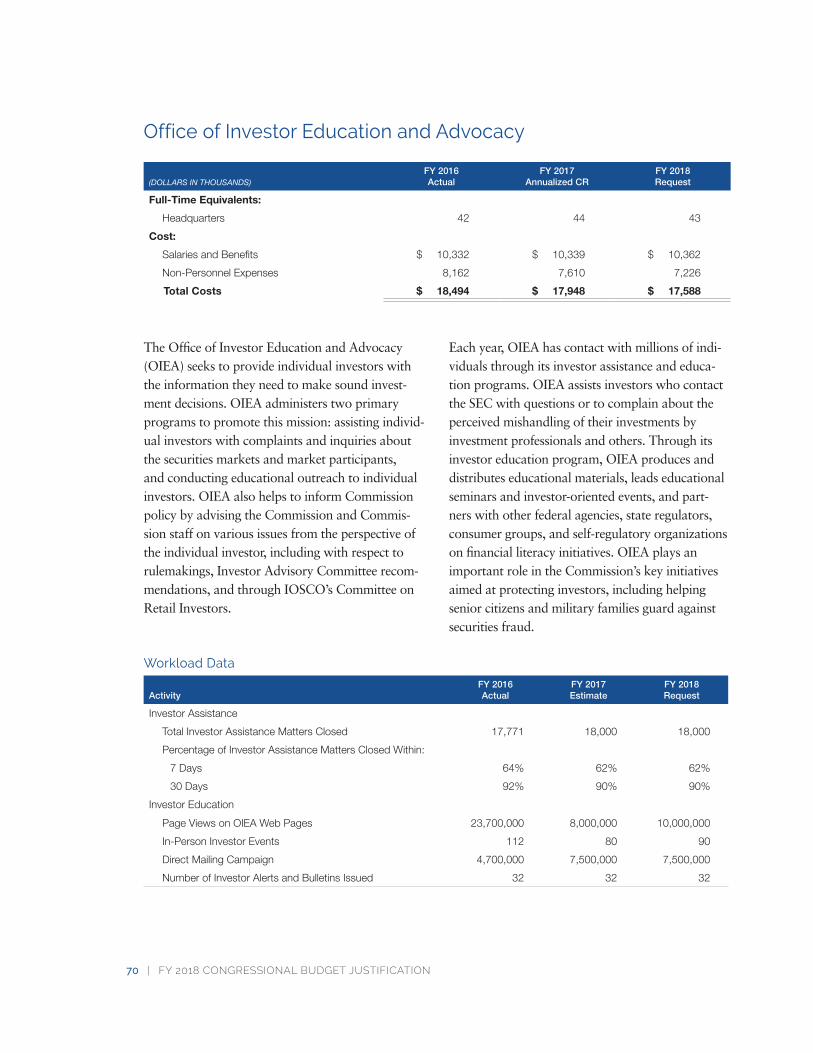
70 | FY 2018 CONGRESSIONAL BUDGET JUSTIFICATION
Office of Investor Education and Advocacy
(DOLLARS IN THOUSANDS)FY 2016Actual
FY 2017Annualized CR
FY 2018Request
Full-Time Equivalents:
Headquarters 42 44 43
Cost:
Salaries and Benefits $ 10,332 $ 10,339 $ 10,362
Non-Personnel Expenses 8,162 7,610 7,226
Total Costs $ 18,494 $ 17,948 $ 17,588
The Office of Investor Education and Advocacy (OIEA) seeks to provide individual investors with the information they need to make sound invest-ment decisions. OIEA administers two primary programs to promote this mission: assisting individ-ual investors with complaints and inquiries about the securities markets and market participants, and conducting educational outreach to individual investors. OIEA also helps to inform Commission policy by advising the Commission and Commis-sion staff on various issues from the perspective of the individual investor, including with respect to rulemakings, Investor Advisory Committee recom-mendations, and through IOSCO’s Committee on Retail Investors.
Each year, OIEA has contact with millions of indi-viduals through its investor assistance and educa-tion programs. OIEA assists investors who contact the SEC with questions or to complain about the perceived mishandling of their investments by investment professionals and others. Through its investor education program, OIEA produces and distributes educational materials, leads educational seminars and investor-oriented events, and part-ners with other federal agencies, state regulators, consumer groups, and self-regulatory organizations on financial literacy initiatives. OIEA plays an important role in the Commission’s key initiatives aimed at protecting investors, including helping senior citizens and military families guard against securities fraud.
Workload Data
ActivityFY 2016Actual
FY 2017Estimate
FY 2018Request
Investor Assistance
Total Investor Assistance Matters Closed 17,771 18,000 18,000
Percentage of Investor Assistance Matters Closed Within:
7 Days 64% 62% 62%
30 Days 92% 90% 90%
Investor Education
Page Views on OIEA Web Pages 23,700,000 8,000,000 10,000,000
In-Person Investor Events 112 80 90
Direct Mailing Campaign 4,700,000 7,500,000 7,500,000
Number of Investor Alerts and Bulletins Issued 32 32 32
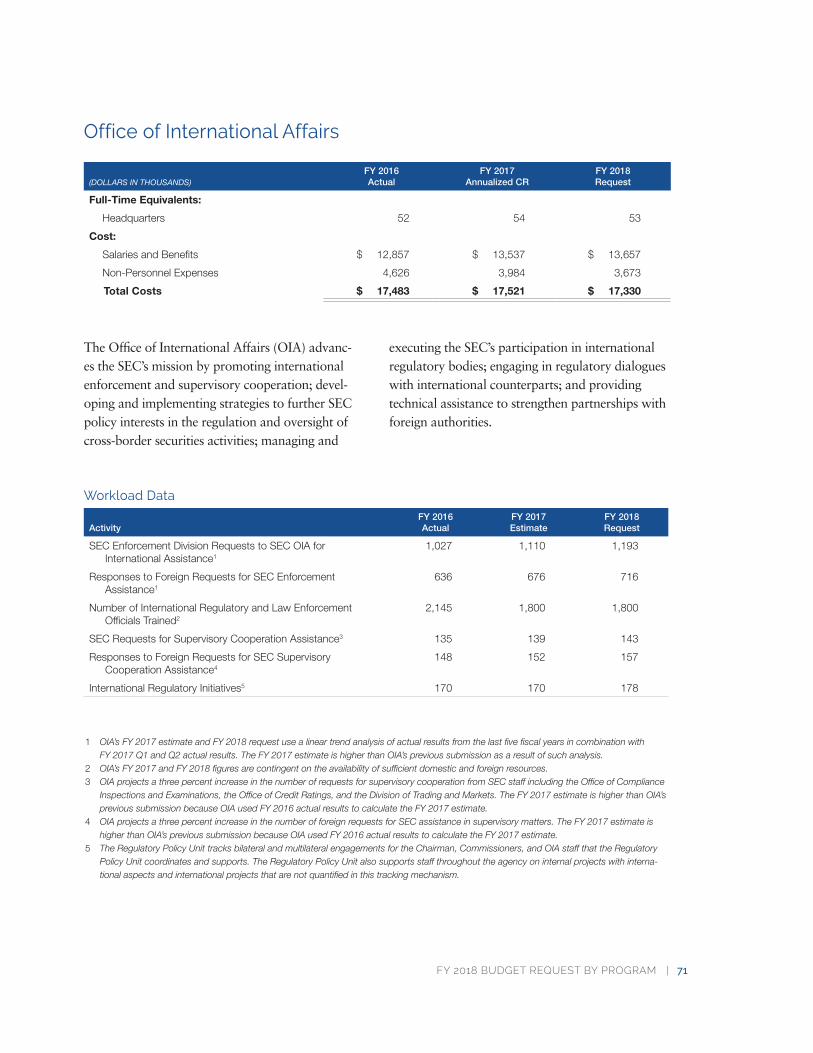
FY 2018 BUDGET REQUEST BY PROGRAM | 71
Office of International Affairs
(DOLLARS IN THOUSANDS)FY 2016Actual
FY 2017Annualized CR
FY 2018Request
Full-Time Equivalents:
Headquarters 52 54 53
Cost:
Salaries and Benefits $ 12,857 $ 13,537 $ 13,657
Non-Personnel Expenses 4,626 3,984 3,673
Total Costs $ 17,483 $ 17,521 $ 17,330
The Office of International Affairs (OIA) advanc-es the SEC’s mission by promoting international enforcement and supervisory cooperation; devel-oping and implementing strategies to further SEC policy interests in the regulation and oversight of cross-border securities activities; managing and
executing the SEC’s participation in international regulatory bodies; engaging in regulatory dialogues with international counterparts; and providing technical assistance to strengthen partnerships with foreign authorities.
Workload Data
ActivityFY 2016Actual
FY 2017Estimate
FY 2018Request
SEC Enforcement Division Requests to SEC OIA for International Assistance1
1,027 1,110 1,193
Responses to Foreign Requests for SEC Enforcement Assistance1
636 676 716
Number of International Regulatory and Law Enforcement Officials Trained2
2,145 1,800 1,800
SEC Requests for Supervisory Cooperation Assistance3 135 139 143
Responses to Foreign Requests for SEC Supervisory Cooperation Assistance4
148 152 157
International Regulatory Initiatives5 170 170 178
1 OIA’sFY2017estimateandFY2018requestusealineartrendanalysisofactualresultsfromthelastfivefiscalyearsincombinationwith FY2017Q1andQ2actualresults.TheFY2017estimateishigherthanOIA’sprevioussubmissionasaresultofsuchanalysis.
2 OIA’sFY2017andFY2018figuresarecontingentontheavailabilityofsufficientdomesticandforeignresources.3 OIAprojectsathreepercentincreaseinthenumberofrequestsforsupervisorycooperationfromSECstaffincludingtheOfficeofCompliance
InspectionsandExaminations,theOfficeofCreditRatings,andtheDivisionofTradingandMarkets.TheFY2017estimateishigherthanOIA’sprevioussubmissionbecauseOIAusedFY2016actualresultstocalculatetheFY2017estimate.
4 OIAprojectsathreepercentincreaseinthenumberofforeignrequestsforSECassistanceinsupervisorymatters.TheFY2017estimateishigherthanOIA’sprevioussubmissionbecauseOIAusedFY2016actualresultstocalculatetheFY2017estimate.
5 TheRegulatoryPolicyUnittracksbilateralandmultilateralengagementsfortheChairman,Commissioners,andOIAstaffthattheRegulatoryPolicyUnitcoordinatesandsupports.TheRegulatoryPolicyUnitalsosupportsstaffthroughouttheagencyoninternalprojectswithinterna-tionalaspectsandinternationalprojectsthatarenotquantifiedinthistrackingmechanism.
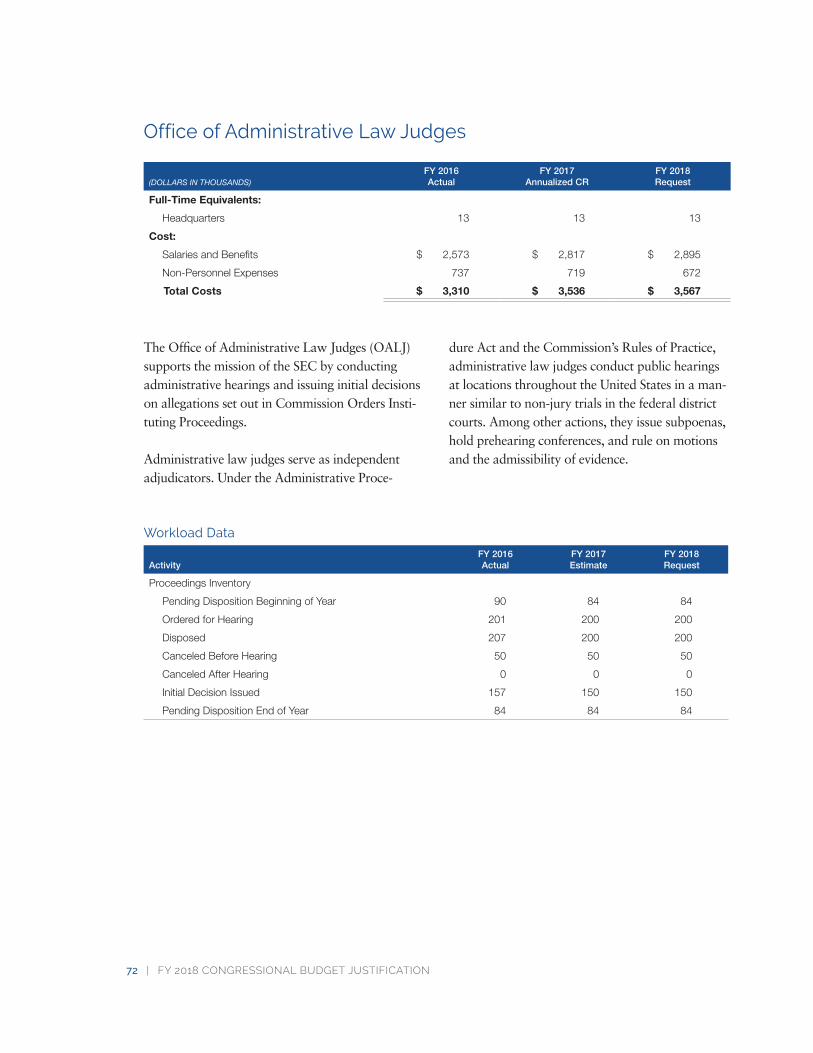
72 | FY 2018 CONGRESSIONAL BUDGET JUSTIFICATION
Office of Administrative Law Judges
(DOLLARS IN THOUSANDS)FY 2016Actual
FY 2017Annualized CR
FY 2018Request
Full-Time Equivalents:
Headquarters 13 13 13
Cost:
Salaries and Benefits $ 2,573 $ 2,817 $ 2,895
Non-Personnel Expenses 737 719 672
Total Costs $ 3,310 $ 3,536 $ 3,567
The Office of Administrative Law Judges (OALJ) supports the mission of the SEC by conducting administrative hearings and issuing initial decisions on allegations set out in Commission Orders Insti-tuting Proceedings.
Administrative law judges serve as independent adjudicators. Under the Administrative Proce-
dure Act and the Commission’s Rules of Practice, administrative law judges conduct public hearings at locations throughout the United States in a man-ner similar to non-jury trials in the federal district courts. Among other actions, they issue subpoenas, hold prehearing conferences, and rule on motions and the admissibility of evidence.
Workload Data
ActivityFY 2016Actual
FY 2017Estimate
FY 2018Request
Proceedings Inventory
Pending Disposition Beginning of Year 90 84 84
Ordered for Hearing 201 200 200
Disposed 207 200 200
Canceled Before Hearing 50 50 50
Canceled After Hearing 0 0 0
Initial Decision Issued 157 150 150
Pending Disposition End of Year 84 84 84
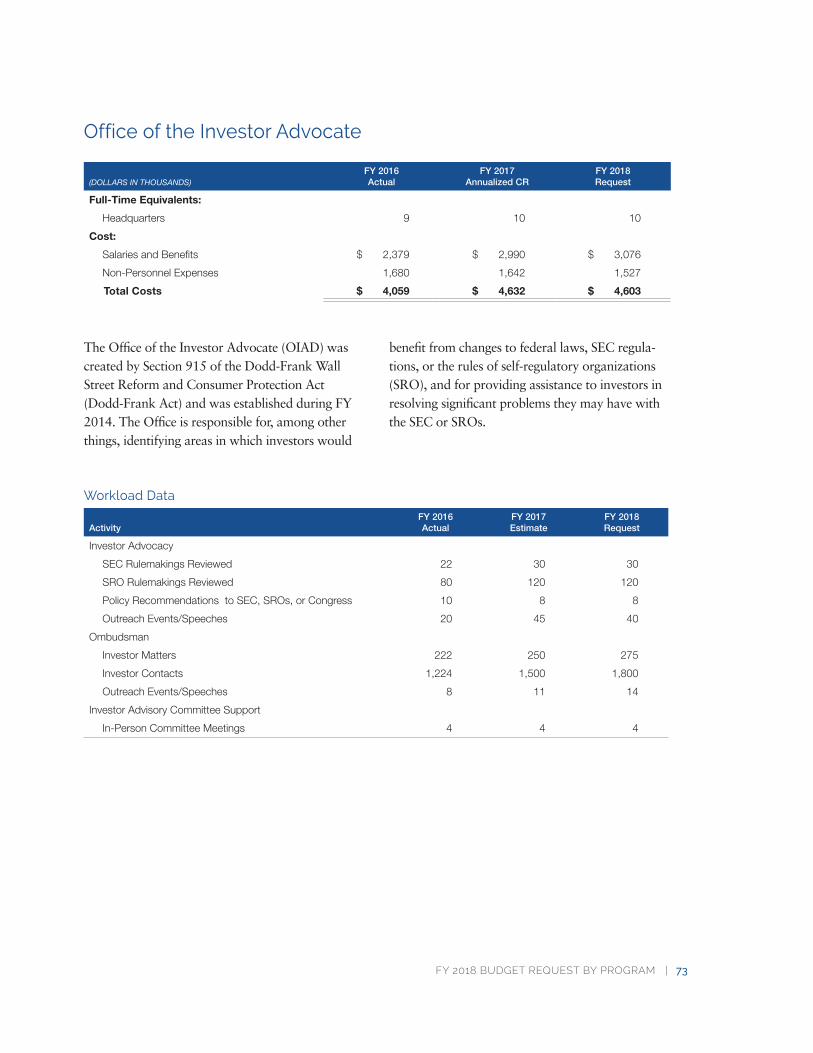
FY 2018 BUDGET REQUEST BY PROGRAM | 73
Office of the Investor Advocate
(DOLLARS IN THOUSANDS)FY 2016Actual
FY 2017Annualized CR
FY 2018Request
Full-Time Equivalents:
Headquarters 9 10 10
Cost:
Salaries and Benefits $ 2,379 $ 2,990 $ 3,076
Non-Personnel Expenses 1,680 1,642 1,527
Total Costs $ 4,059 $ 4,632 $ 4,603
The Office of the Investor Advocate (OIAD) was created by Section 915 of the Dodd-Frank Wall Street Reform and Consumer Protection Act (Dodd-Frank Act) and was established during FY 2014. The Office is responsible for, among other things, identifying areas in which investors would
benefit from changes to federal laws, SEC regula-tions, or the rules of self-regulatory organizations (SRO), and for providing assistance to investors in resolving significant problems they may have with the SEC or SROs.
Workload Data
ActivityFY 2016Actual
FY 2017Estimate
FY 2018Request
Investor Advocacy
SEC Rulemakings Reviewed 22 30 30
SRO Rulemakings Reviewed 80 120 120
Policy Recommendations to SEC, SROs, or Congress 10 8 8
Outreach Events/Speeches 20 45 40
Ombudsman
Investor Matters 222 250 275
Investor Contacts 1,224 1,500 1,800
Outreach Events/Speeches 8 11 14
Investor Advisory Committee Support
In-Person Committee Meetings 4 4 4
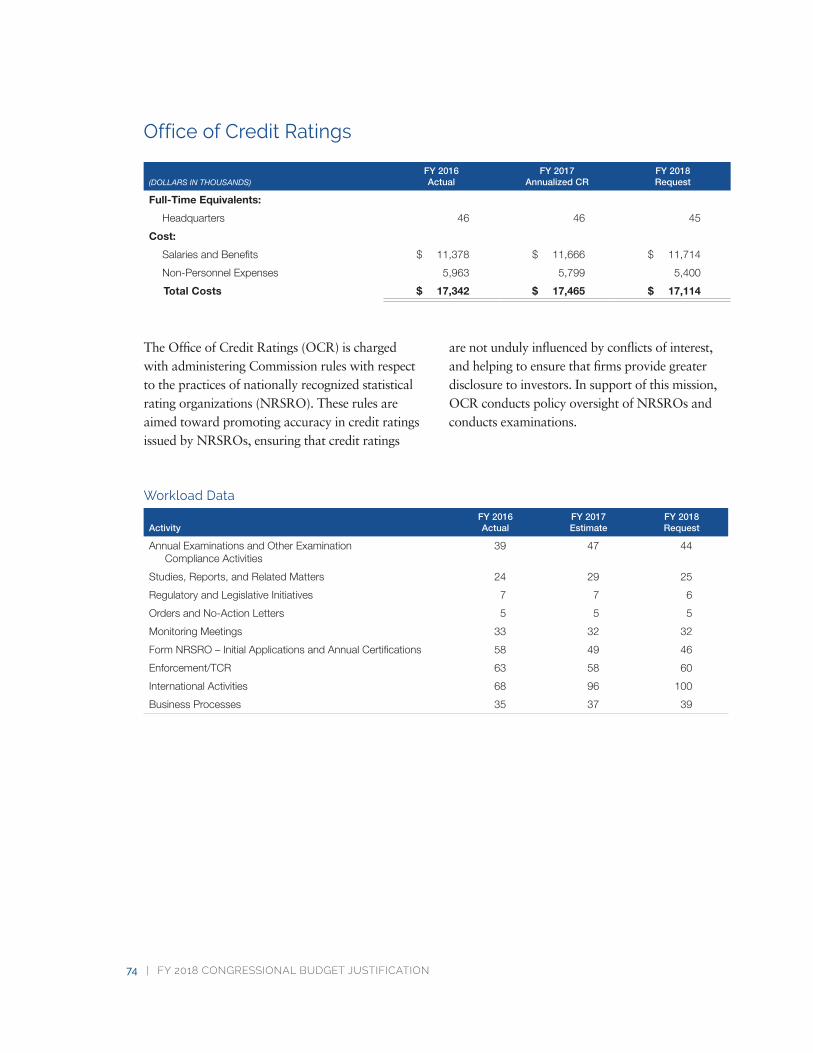
74 | FY 2018 CONGRESSIONAL BUDGET JUSTIFICATION
Office of Credit Ratings
(DOLLARS IN THOUSANDS)FY 2016Actual
FY 2017Annualized CR
FY 2018Request
Full-Time Equivalents:
Headquarters 46 46 45
Cost:
Salaries and Benefits $ 11,378 $ 11,666 $ 11,714
Non-Personnel Expenses 5,963 5,799 5,400
Total Costs $ 17,342 $ 17,465 $ 17,114
The Office of Credit Ratings (OCR) is charged with administering Commission rules with respect to the practices of nationally recognized statistical rating organizations (NRSRO). These rules are aimed toward promoting accuracy in credit ratings issued by NRSROs, ensuring that credit ratings
are not unduly influenced by conflicts of interest, and helping to ensure that firms provide greater disclosure to investors. In support of this mission, OCR conducts policy oversight of NRSROs and conducts examinations.
Workload Data
ActivityFY 2016Actual
FY 2017Estimate
FY 2018Request
Annual Examinations and Other Examination Compliance Activities
39 47 44
Studies, Reports, and Related Matters 24 29 25
Regulatory and Legislative Initiatives 7 7 6
Orders and No-Action Letters 5 5 5
Monitoring Meetings 33 32 32
Form NRSRO – Initial Applications and Annual Certifications 58 49 46
Enforcement/TCR 63 58 60
International Activities 68 96 100
Business Processes 35 37 39
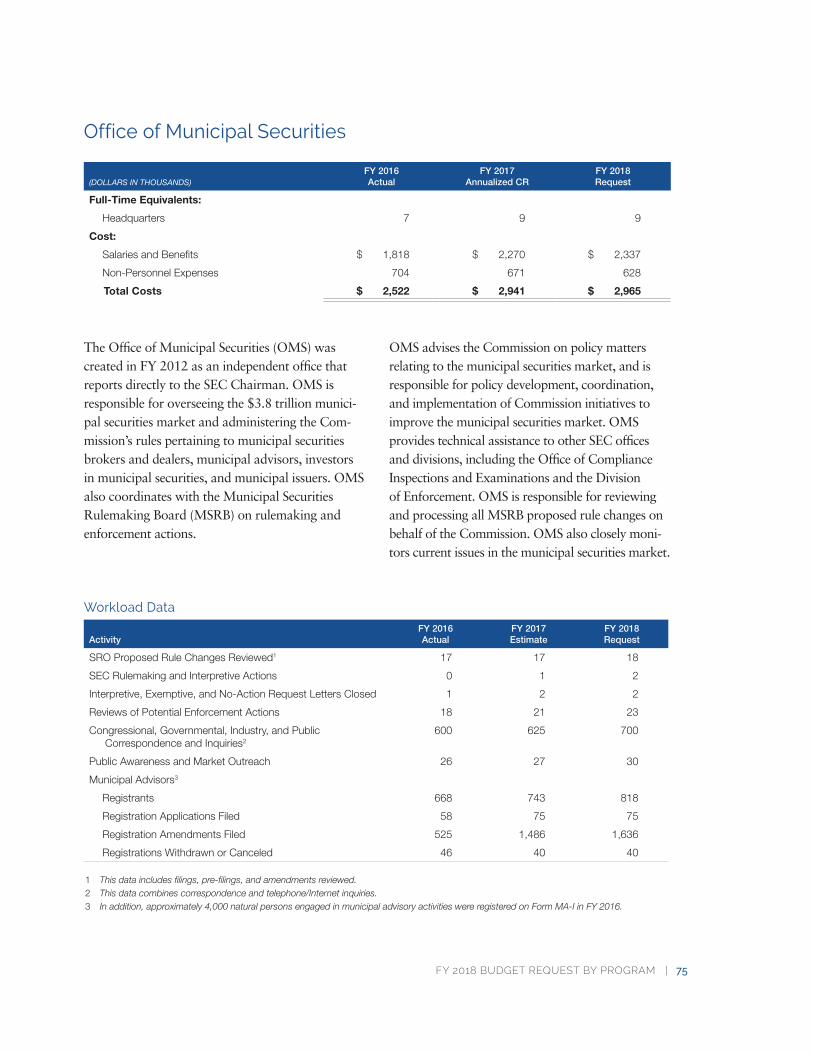
FY 2018 BUDGET REQUEST BY PROGRAM | 75
Office of Municipal Securities
(DOLLARS IN THOUSANDS)FY 2016Actual
FY 2017Annualized CR
FY 2018Request
Full-Time Equivalents:
Headquarters 7 9 9
Cost:
Salaries and Benefits $ 1,818 $ 2,270 $ 2,337
Non-Personnel Expenses 704 671 628
Total Costs $ 2,522 $ 2,941 $ 2,965
The Office of Municipal Securities (OMS) was created in FY 2012 as an independent office that reports directly to the SEC Chairman. OMS is responsible for overseeing the $3.8 trillion munici-pal securities market and administering the Com-mission’s rules pertaining to municipal securities brokers and dealers, municipal advisors, investors in municipal securities, and municipal issuers. OMS also coordinates with the Municipal Securities Rulemaking Board (MSRB) on rulemaking and enforcement actions.
OMS advises the Commission on policy matters relating to the municipal securities market, and is responsible for policy development, coordination, and implementation of Commission initiatives to improve the municipal securities market. OMS provides technical assistance to other SEC offices and divisions, including the Office of Compliance Inspections and Examinations and the Division of Enforcement. OMS is responsible for reviewing and processing all MSRB proposed rule changes on behalf of the Commission. OMS also closely moni-tors current issues in the municipal securities market.
Workload Data
ActivityFY 2016Actual
FY 2017Estimate
FY 2018Request
SRO Proposed Rule Changes Reviewed1 17 17 18
SEC Rulemaking and Interpretive Actions 0 1 2
Interpretive, Exemptive, and No-Action Request Letters Closed 1 2 2
Reviews of Potential Enforcement Actions 18 21 23
Congressional, Governmental, Industry, and Public Correspondence and Inquiries2
600 625 700
Public Awareness and Market Outreach 26 27 30
Municipal Advisors3
Registrants 668 743 818
Registration Applications Filed 58 75 75
Registration Amendments Filed 525 1,486 1,636
Registrations Withdrawn or Canceled 46 40 40
1 Thisdataincludesfilings,pre-filings,andamendmentsreviewed.2 Thisdatacombinescorrespondenceandtelephone/Internetinquiries.3 Inaddition,approximately4,000naturalpersonsengagedinmunicipaladvisoryactivitieswereregisteredonFormMA-IinFY2016.
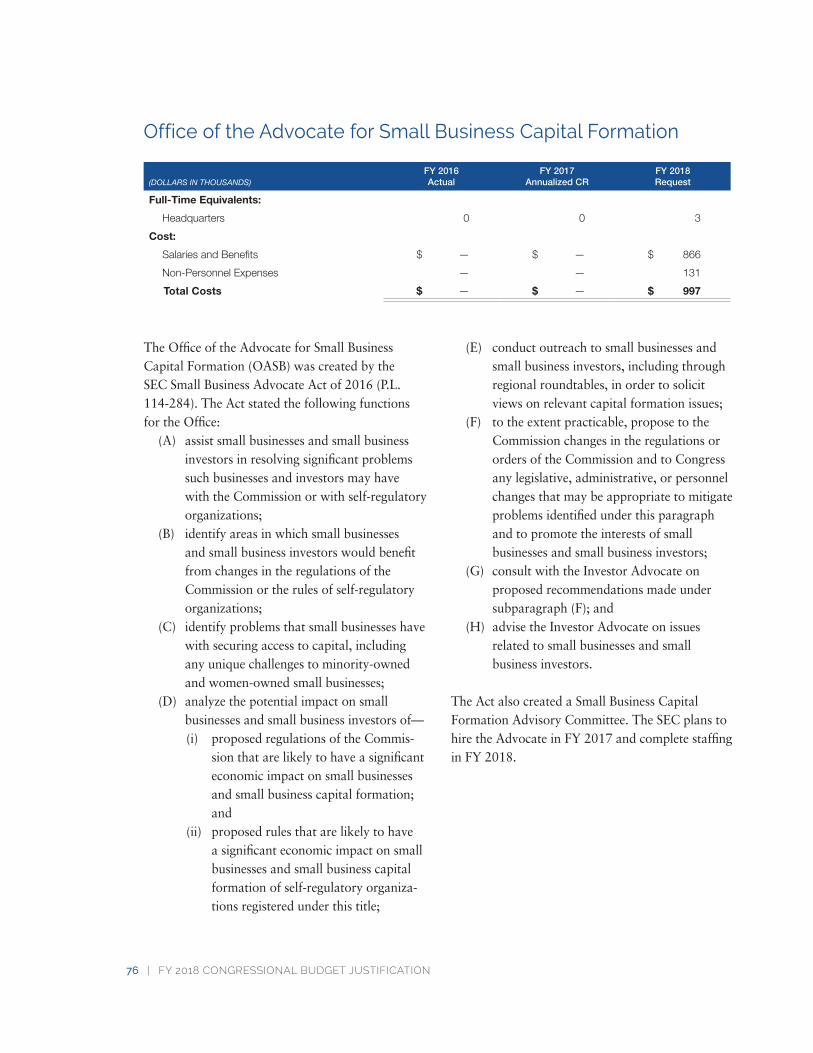
76 | FY 2018 CONGRESSIONAL BUDGET JUSTIFICATION
Office of the Advocate for Small Business Capital Formation
(DOLLARS IN THOUSANDS)FY 2016Actual
FY 2017Annualized CR
FY 2018Request
Full-Time Equivalents:
Headquarters 0 0 3
Cost:
Salaries and Benefits $ — $ — $ 866
Non-Personnel Expenses — — 131
Total Costs $ — $ — $ 997
The Office of the Advocate for Small Business Capital Formation (OASB) was created by the SEC Small Business Advocate Act of 2016 (P.L. 114-284). The Act stated the following functions for the Office:
(A) assist small businesses and small business investors in resolving significant problems such businesses and investors may have with the Commission or with self-regulatory organizations;
(B) identify areas in which small businesses and small business investors would benefit from changes in the regulations of the Commission or the rules of self-regulatory organizations;
(C) identify problems that small businesses have with securing access to capital, including any unique challenges to minority-owned and women-owned small businesses;
(D) analyze the potential impact on small businesses and small business investors of—(i) proposed regulations of the Commis-
sion that are likely to have a significant economic impact on small businesses and small business capital formation; and
(ii) proposed rules that are likely to have a significant economic impact on small businesses and small business capital formation of self-regulatory organiza-tions registered under this title;
(E) conduct outreach to small businesses and small business investors, including through regional roundtables, in order to solicit views on relevant capital formation issues;
(F) to the extent practicable, propose to the Commission changes in the regulations or orders of the Commission and to Congress any legislative, administrative, or personnel changes that may be appropriate to mitigate problems identified under this paragraph and to promote the interests of small businesses and small business investors;
(G) consult with the Investor Advocate on proposed recommendations made under subparagraph (F); and
(H) advise the Investor Advocate on issues related to small businesses and small business investors.
The Act also created a Small Business Capital Formation Advisory Committee. The SEC plans to hire the Advocate in FY 2017 and complete staffing in FY 2018.
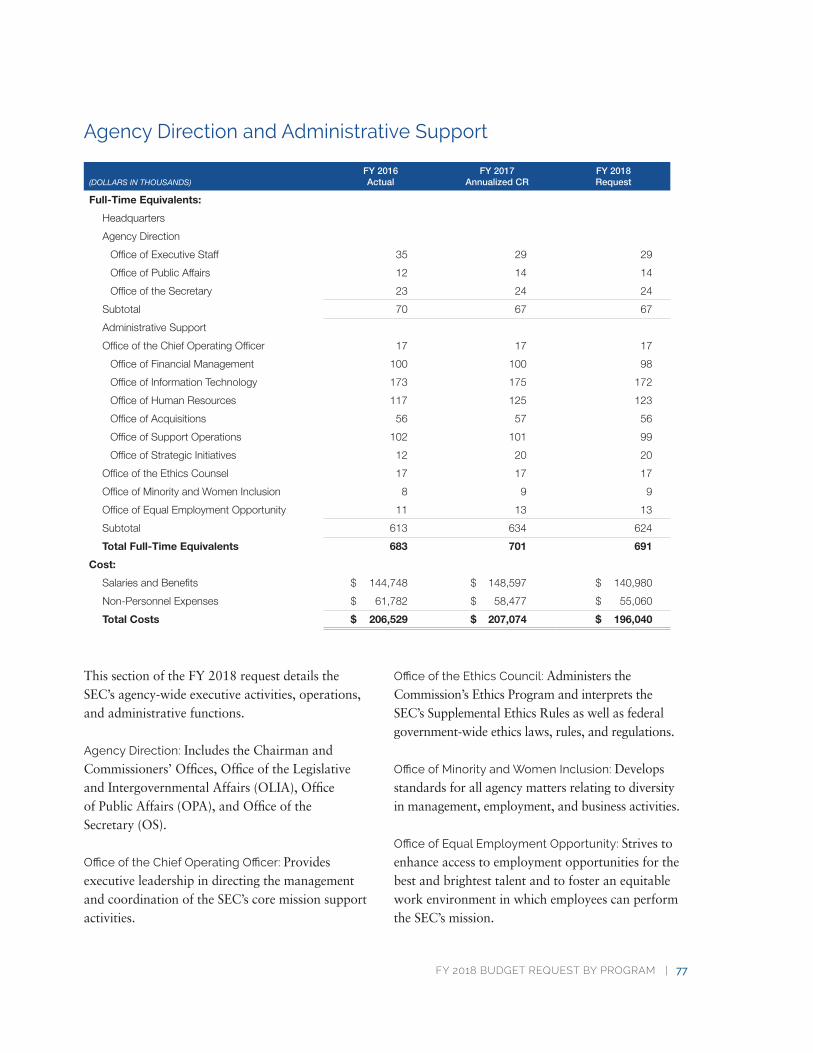
FY 2018 BUDGET REQUEST BY PROGRAM | 77
Agency Direction and Administrative Support
(DOLLARS IN THOUSANDS)FY 2016Actual
FY 2017Annualized CR
FY 2018Request
Full-Time Equivalents:
Headquarters
Agency Direction
Office of Executive Staff 35 29 29
Office of Public Affairs 12 14 14
Office of the Secretary 23 24 24
Subtotal 70 67 67
Administrative Support
Office of the Chief Operating Officer 17 17 17
Office of Financial Management 100 100 98
Office of Information Technology 173 175 172
Office of Human Resources 117 125 123
Office of Acquisitions 56 57 56
Office of Support Operations 102 101 99
Office of Strategic Initiatives 12 20 20
Office of the Ethics Counsel 17 17 17
Office of Minority and Women Inclusion 8 9 9
Office of Equal Employment Opportunity 11 13 13
Subtotal 613 634 624
Total Full-Time Equivalents 683 701 691
Cost:
Salaries and Benefits $ 144,748 $ 148,597 $ 140,980
Non-Personnel Expenses $ 61,782 $ 58,477 $ 55,060
Total Costs $ 206,529 $ 207,074 $ 196,040
This section of the FY 2018 request details the SEC’s agency-wide executive activities, operations, and administrative functions.
Agency Direction: Includes the Chairman and Commissioners’ Offices, Office of the Legislative and Intergovernmental Affairs (OLIA), Office of Public Affairs (OPA), and Office of the Secretary (OS).
Office of the Chief Operating Officer: Provides executive leadership in directing the management and coordination of the SEC’s core mission support activities.
Office of the Ethics Council: Administers the Commission’s Ethics Program and interprets the SEC’s Supplemental Ethics Rules as well as federal government-wide ethics laws, rules, and regulations.
Office of Minority and Women Inclusion: Develops standards for all agency matters relating to diversity in management, employment, and business activities.
Office of Equal Employment Opportunity: Strives to enhance access to employment opportunities for the best and brightest talent and to foster an equitable work environment in which employees can perform the SEC’s mission.
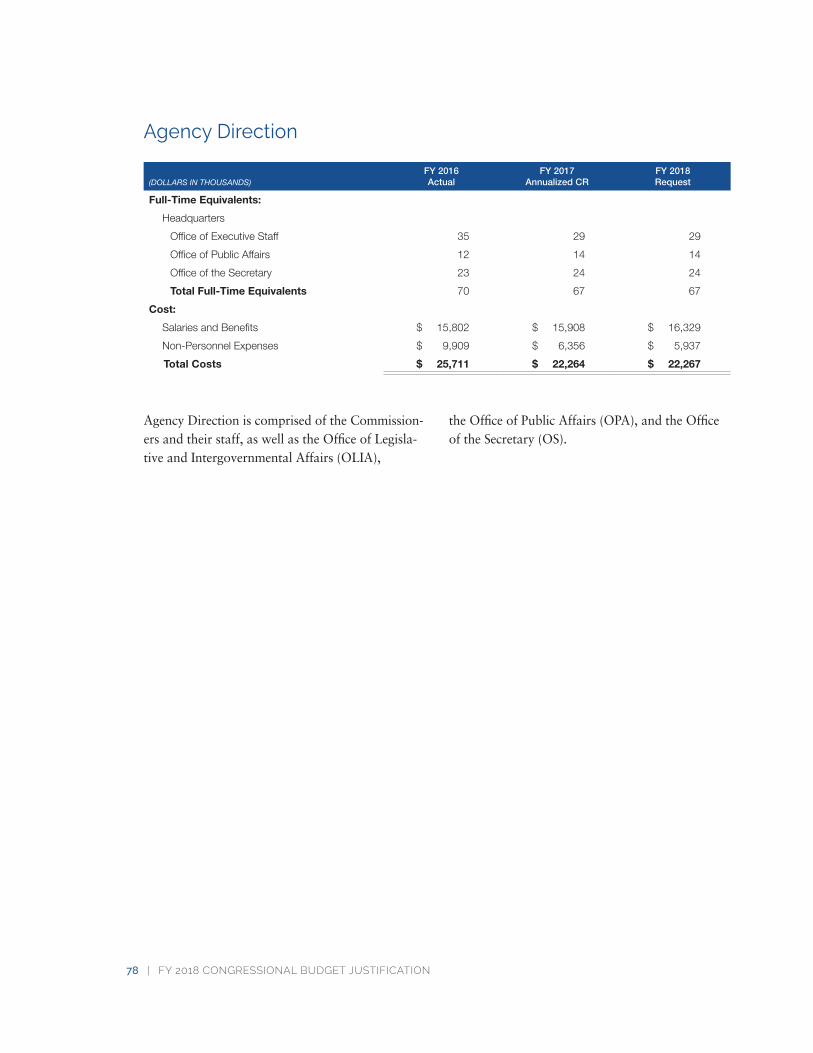
78 | FY 2018 CONGRESSIONAL BUDGET JUSTIFICATION
Agency Direction
(DOLLARS IN THOUSANDS)FY 2016Actual
FY 2017Annualized CR
FY 2018Request
Full-Time Equivalents:
Headquarters
Office of Executive Staff 35 29 29
Office of Public Affairs 12 14 14
Office of the Secretary 23 24 24
Total Full-Time Equivalents 70 67 67
Cost:
Salaries and Benefits $ 15,802 $ 15,908 $ 16,329
Non-Personnel Expenses $ 9,909 $ 6,356 $ 5,937
Total Costs $ 25,711 $ 22,264 $ 22,267
Agency Direction is comprised of the Commission-ers and their staff, as well as the Office of Legisla-tive and Intergovernmental Affairs (OLIA),
the Office of Public Affairs (OPA), and the Office of the Secretary (OS).
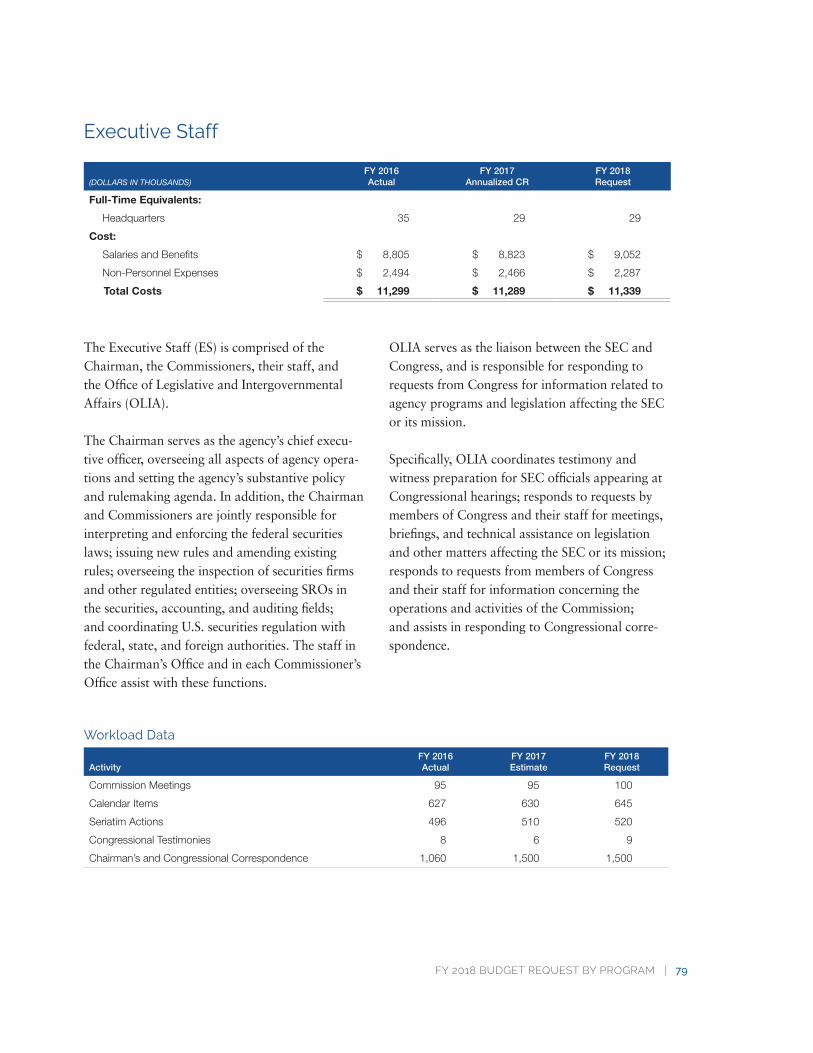
FY 2018 BUDGET REQUEST BY PROGRAM | 79
Executive Staff
(DOLLARS IN THOUSANDS)FY 2016Actual
FY 2017Annualized CR
FY 2018Request
Full-Time Equivalents:
Headquarters 35 29 29
Cost:
Salaries and Benefits $ 8,805 $ 8,823 $ 9,052
Non-Personnel Expenses $ 2,494 $ 2,466 $ 2,287
Total Costs $ 11,299 $ 11,289 $ 11,339
The Executive Staff (ES) is comprised of the Chairman, the Commissioners, their staff, and the Office of Legislative and Intergovernmental Affairs (OLIA).
The Chairman serves as the agency’s chief execu-tive officer, overseeing all aspects of agency opera-tions and setting the agency’s substantive policy and rulemaking agenda. In addition, the Chairman and Commissioners are jointly responsible for interpreting and enforcing the federal securities laws; issuing new rules and amending existing rules; overseeing the inspection of securities firms and other regulated entities; overseeing SROs in the securities, accounting, and auditing fields; and coordinating U.S. securities regulation with federal, state, and foreign authorities. The staff in the Chairman’s Office and in each Commissioner’s Office assist with these functions.
OLIA serves as the liaison between the SEC and Congress, and is responsible for responding to requests from Congress for information related to agency programs and legislation affecting the SEC or its mission.
Specifically, OLIA coordinates testimony and witness preparation for SEC officials appearing at Congressional hearings; responds to requests by members of Congress and their staff for meetings, briefings, and technical assistance on legislation and other matters affecting the SEC or its mission; responds to requests from members of Congress and their staff for information concerning the operations and activities of the Commission; and assists in responding to Congressional corre-spondence.
Workload Data
ActivityFY 2016Actual
FY 2017Estimate
FY 2018Request
Commission Meetings 95 95 100
Calendar Items 627 630 645
Seriatim Actions 496 510 520
Congressional Testimonies 8 6 9
Chairman’s and Congressional Correspondence 1,060 1,500 1,500
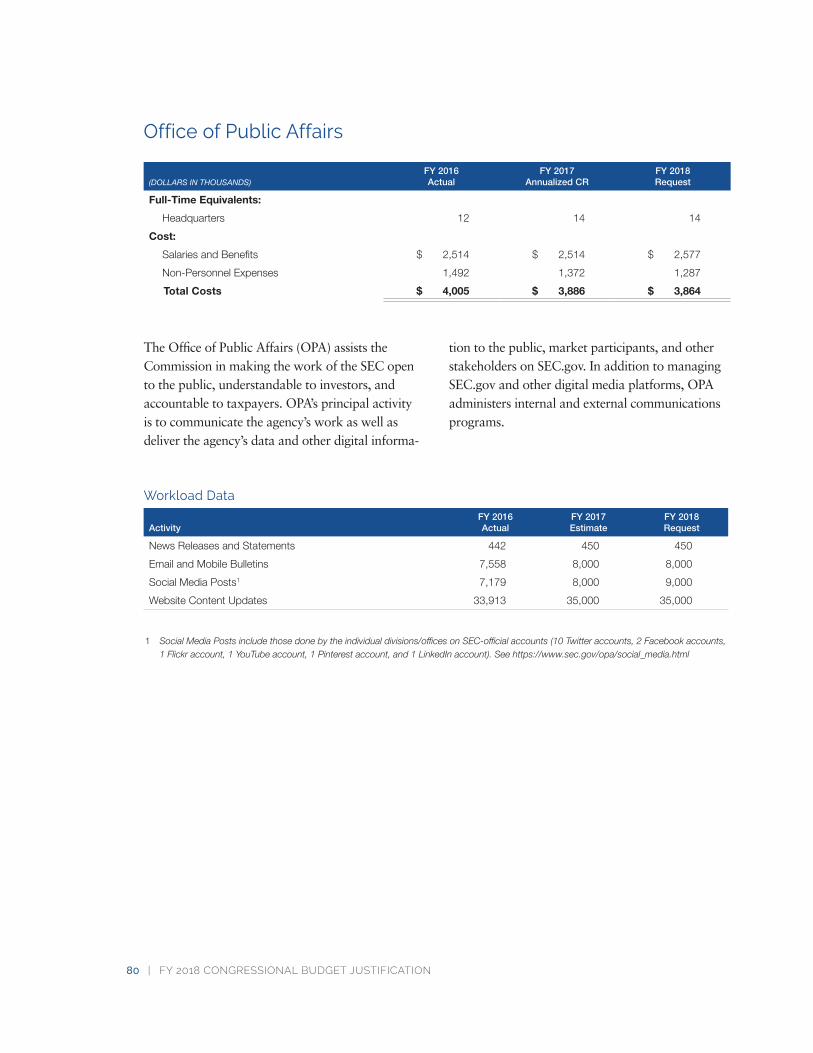
80 | FY 2018 CONGRESSIONAL BUDGET JUSTIFICATION
Office of Public Affairs
(DOLLARS IN THOUSANDS)FY 2016Actual
FY 2017Annualized CR
FY 2018Request
Full-Time Equivalents:
Headquarters 12 14 14
Cost:
Salaries and Benefits $ 2,514 $ 2,514 $ 2,577
Non-Personnel Expenses 1,492 1,372 1,287
Total Costs $ 4,005 $ 3,886 $ 3,864
The Office of Public Affairs (OPA) assists the Commission in making the work of the SEC open to the public, understandable to investors, and accountable to taxpayers. OPA’s principal activity is to communicate the agency’s work as well as deliver the agency’s data and other digital informa-
tion to the public, market participants, and other stakeholders on SEC.gov. In addition to managing SEC.gov and other digital media platforms, OPA administers internal and external communications programs.
Workload Data
ActivityFY 2016Actual
FY 2017Estimate
FY 2018Request
News Releases and Statements 442 450 450
Email and Mobile Bulletins 7,558 8,000 8,000
Social Media Posts1 7,179 8,000 9,000
Website Content Updates 33,913 35,000 35,000
1 SocialMediaPostsincludethosedonebytheindividualdivisions/officesonSEC-officialaccounts(10Twitteraccounts,2Facebookaccounts,1Flickraccount,1YouTubeaccount,1Pinterestaccount,and1LinkedInaccount).Seehttps://www.sec.gov/opa/social_media.html
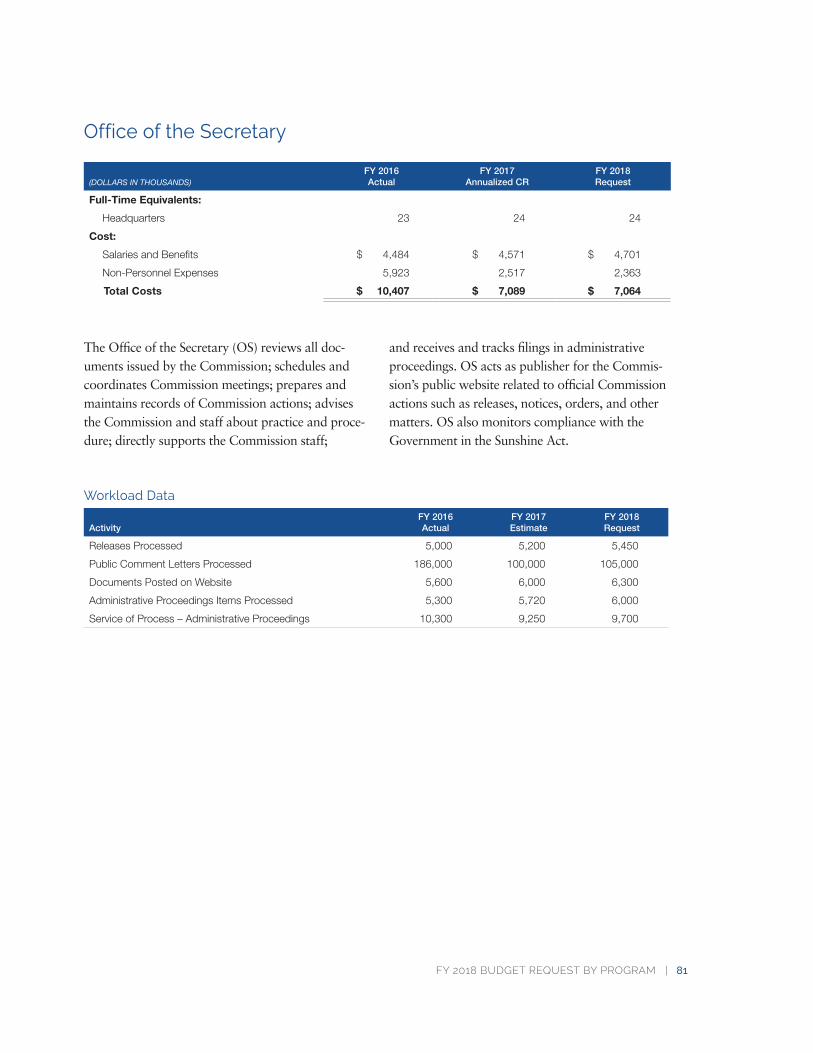
FY 2018 BUDGET REQUEST BY PROGRAM | 81
Office of the Secretary
(DOLLARS IN THOUSANDS)FY 2016Actual
FY 2017Annualized CR
FY 2018Request
Full-Time Equivalents:
Headquarters 23 24 24
Cost:
Salaries and Benefits $ 4,484 $ 4,571 $ 4,701
Non-Personnel Expenses 5,923 2,517 2,363
Total Costs $ 10,407 $ 7,089 $ 7,064
The Office of the Secretary (OS) reviews all doc-uments issued by the Commission; schedules and coordinates Commission meetings; prepares and maintains records of Commission actions; advises the Commission and staff about practice and proce-dure; directly supports the Commission staff;
and receives and tracks filings in administrative proceedings. OS acts as publisher for the Commis-sion’s public website related to official Commission actions such as releases, notices, orders, and other matters. OS also monitors compliance with the Government in the Sunshine Act.
Workload Data
ActivityFY 2016Actual
FY 2017Estimate
FY 2018Request
Releases Processed 5,000 5,200 5,450
Public Comment Letters Processed 186,000 100,000 105,000
Documents Posted on Website 5,600 6,000 6,300
Administrative Proceedings Items Processed 5,300 5,720 6,000
Service of Process – Administrative Proceedings 10,300 9,250 9,700
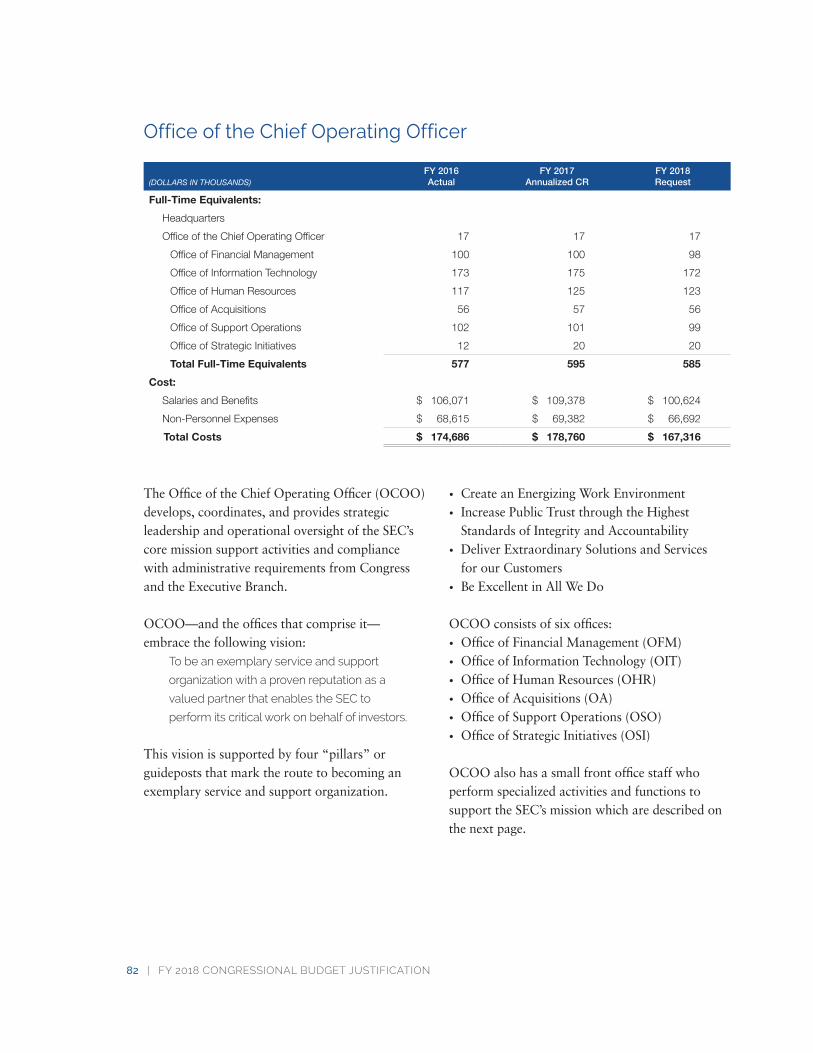
82 | FY 2018 CONGRESSIONAL BUDGET JUSTIFICATION
Office of the Chief Operating Officer
(DOLLARS IN THOUSANDS)FY 2016Actual
FY 2017Annualized CR
FY 2018Request
Full-Time Equivalents:
Headquarters
Office of the Chief Operating Officer 17 17 17
Office of Financial Management 100 100 98
Office of Information Technology 173 175 172
Office of Human Resources 117 125 123
Office of Acquisitions 56 57 56
Office of Support Operations 102 101 99
Office of Strategic Initiatives 12 20 20
Total Full-Time Equivalents 577 595 585
Cost:
Salaries and Benefits $ 106,071 $ 109,378 $ 100,624
Non-Personnel Expenses $ 68,615 $ 69,382 $ 66,692
Total Costs $ 174,686 $ 178,760 $ 167,316
The Office of the Chief Operating Officer (OCOO) develops, coordinates, and provides strategic leadership and operational oversight of the SEC’s core mission support activities and compliance with administrative requirements from Congress and the Executive Branch.
OCOO—and the offices that comprise it—embrace the following vision:
To be an exemplary service and support
organization with a proven reputation as a
valued partner that enables the SEC to
perform its critical work on behalf of investors.
This vision is supported by four “pillars” or guideposts that mark the route to becoming an exemplary service and support organization.
• Create an Energizing Work Environment
• Increase Public Trust through the Highest Standards of Integrity and Accountability
• Deliver Extraordinary Solutions and Services for our Customers
• Be Excellent in All We Do
OCOO consists of six offices:
• Office of Financial Management (OFM)
• Office of Information Technology (OIT)
• Office of Human Resources (OHR)
• Office of Acquisitions (OA)
• Office of Support Operations (OSO)
• Office of Strategic Initiatives (OSI)
OCOO also has a small front office staff who perform specialized activities and functions to support the SEC’s mission which are described on the next page.
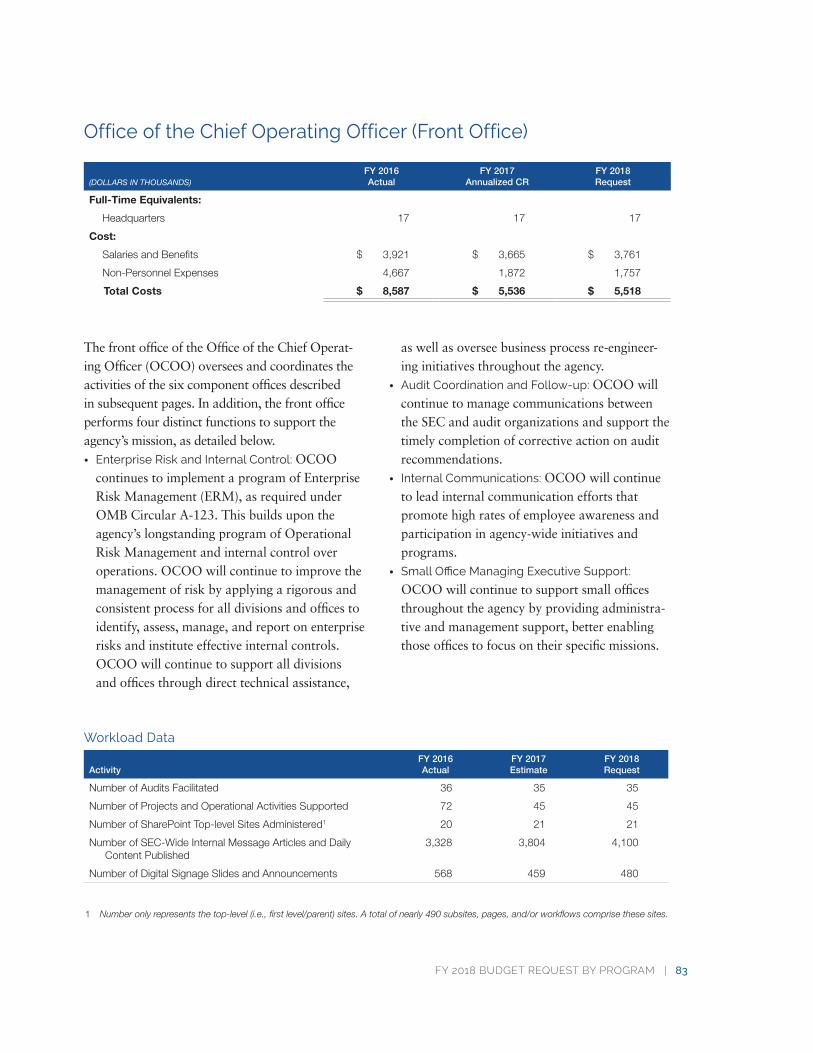
FY 2018 BUDGET REQUEST BY PROGRAM | 83
Office of the Chief Operating Officer (Front Office)
(DOLLARS IN THOUSANDS)FY 2016Actual
FY 2017Annualized CR
FY 2018Request
Full-Time Equivalents:
Headquarters 17 17 17
Cost:
Salaries and Benefits $ 3,921 $ 3,665 $ 3,761
Non-Personnel Expenses 4,667 1,872 1,757
Total Costs $ 8,587 $ 5,536 $ 5,518
The front office of the Office of the Chief Operat-ing Officer (OCOO) oversees and coordinates the activities of the six component offices described in subsequent pages. In addition, the front office performs four distinct functions to support the agency’s mission, as detailed below.
• Enterprise Risk and Internal Control: OCOO continues to implement a program of Enterprise Risk Management (ERM), as required under OMB Circular A-123. This builds upon the agency’s longstanding program of Operational Risk Management and internal control over operations. OCOO will continue to improve the management of risk by applying a rigorous and consistent process for all divisions and offices to identify, assess, manage, and report on enterprise risks and institute effective internal controls. OCOO will continue to support all divisions and offices through direct technical assistance,
as well as oversee business process re-engineer-ing initiatives throughout the agency.
• Audit Coordination and Follow-up: OCOO will continue to manage communications between the SEC and audit organizations and support the timely completion of corrective action on audit recommendations.
• Internal Communications: OCOO will continue to lead internal communication efforts that promote high rates of employee awareness and participation in agency-wide initiatives and programs.
• Small Office Managing Executive Support:
OCOO will continue to support small offices throughout the agency by providing administra-tive and management support, better enabling those offices to focus on their specific missions.
Workload Data
ActivityFY 2016Actual
FY 2017Estimate
FY 2018Request
Number of Audits Facilitated 36 35 35
Number of Projects and Operational Activities Supported 72 45 45
Number of SharePoint Top-level Sites Administered1 20 21 21
Number of SEC-Wide Internal Message Articles and Daily Content Published
3,328 3,804 4,100
Number of Digital Signage Slides and Announcements 568 459 480
1 Numberonlyrepresentsthetop-level(i.e.,firstlevel/parent)sites.Atotalofnearly490subsites,pages,and/orworkflowscomprisethesesites.
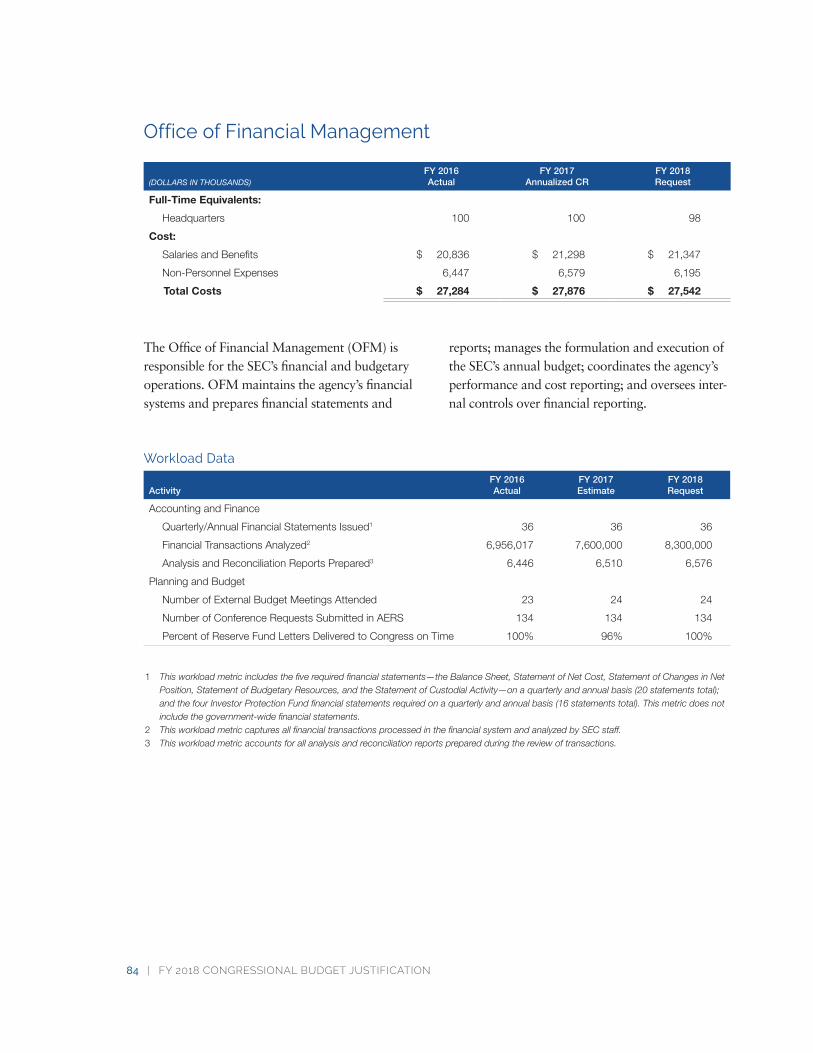
84 | FY 2018 CONGRESSIONAL BUDGET JUSTIFICATION
Office of Financial Management
(DOLLARS IN THOUSANDS)FY 2016Actual
FY 2017Annualized CR
FY 2018Request
Full-Time Equivalents:
Headquarters 100 100 98
Cost:
Salaries and Benefits $ 20,836 $ 21,298 $ 21,347
Non-Personnel Expenses 6,447 6,579 6,195
Total Costs $ 27,284 $ 27,876 $ 27,542
The Office of Financial Management (OFM) is responsible for the SEC’s financial and budgetary operations. OFM maintains the agency’s financial systems and prepares financial statements and
reports; manages the formulation and execution of the SEC’s annual budget; coordinates the agency’s performance and cost reporting; and oversees inter-nal controls over financial reporting.
Workload Data
ActivityFY 2016Actual
FY 2017Estimate
FY 2018Request
Accounting and Finance
Quarterly/Annual Financial Statements Issued1 36 36 36
Financial Transactions Analyzed2 6,956,017 7,600,000 8,300,000
Analysis and Reconciliation Reports Prepared3 6,446 6,510 6,576
Planning and Budget
Number of External Budget Meetings Attended 23 24 24
Number of Conference Requests Submitted in AERS 134 134 134
Percent of Reserve Fund Letters Delivered to Congress on Time 100% 96% 100%
1 Thisworkloadmetricincludesthefiverequiredfinancialstatements—theBalanceSheet,StatementofNetCost,StatementofChangesinNetPosition,StatementofBudgetaryResources,andtheStatementofCustodialActivity—onaquarterlyandannualbasis(20statementstotal);andthefourInvestorProtectionFundfinancialstatementsrequiredonaquarterlyandannualbasis(16statementstotal).Thismetricdoesnotincludethegovernment-widefinancialstatements.
2 ThisworkloadmetriccapturesallfinancialtransactionsprocessedinthefinancialsystemandanalyzedbySECstaff.3 Thisworkloadmetricaccountsforallanalysisandreconciliationreportspreparedduringthereviewoftransactions.
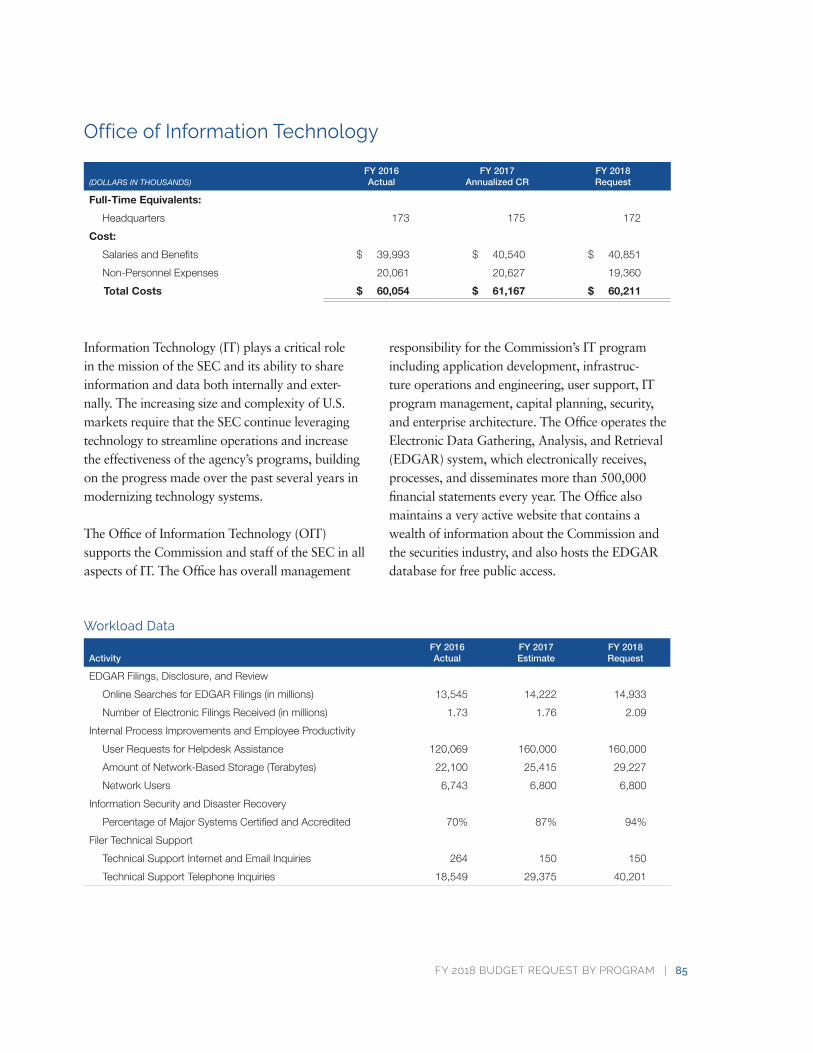
FY 2018 BUDGET REQUEST BY PROGRAM | 85
Office of Information Technology
(DOLLARS IN THOUSANDS)FY 2016Actual
FY 2017Annualized CR
FY 2018Request
Full-Time Equivalents:
Headquarters 173 175 172
Cost:
Salaries and Benefits $ 39,993 $ 40,540 $ 40,851
Non-Personnel Expenses 20,061 20,627 19,360
Total Costs $ 60,054 $ 61,167 $ 60,211
Information Technology (IT) plays a critical role in the mission of the SEC and its ability to share information and data both internally and exter-nally. The increasing size and complexity of U.S. markets require that the SEC continue leveraging technology to streamline operations and increase the effectiveness of the agency’s programs, building on the progress made over the past several years in modernizing technology systems.
The Office of Information Technology (OIT) supports the Commission and staff of the SEC in all aspects of IT. The Office has overall management
responsibility for the Commission’s IT program including application development, infrastruc-ture operations and engineering, user support, IT program management, capital planning, security, and enterprise architecture. The Office operates the Electronic Data Gathering, Analysis, and Retrieval (EDGAR) system, which electronically receives, processes, and disseminates more than 500,000 financial statements every year. The Office also maintains a very active website that contains a wealth of information about the Commission and the securities industry, and also hosts the EDGAR database for free public access.
Workload Data
ActivityFY 2016Actual
FY 2017Estimate
FY 2018Request
EDGAR Filings, Disclosure, and Review
Online Searches for EDGAR Filings (in millions) 13,545 14,222 14,933
Number of Electronic Filings Received (in millions) 1.73 1.76 2.09
Internal Process Improvements and Employee Productivity
User Requests for Helpdesk Assistance 120,069 160,000 160,000
Amount of Network-Based Storage (Terabytes) 22,100 25,415 29,227
Network Users 6,743 6,800 6,800
Information Security and Disaster Recovery
Percentage of Major Systems Certified and Accredited 70% 87% 94%
Filer Technical Support
Technical Support Internet and Email Inquiries 264 150 150
Technical Support Telephone Inquiries 18,549 29,375 40,201
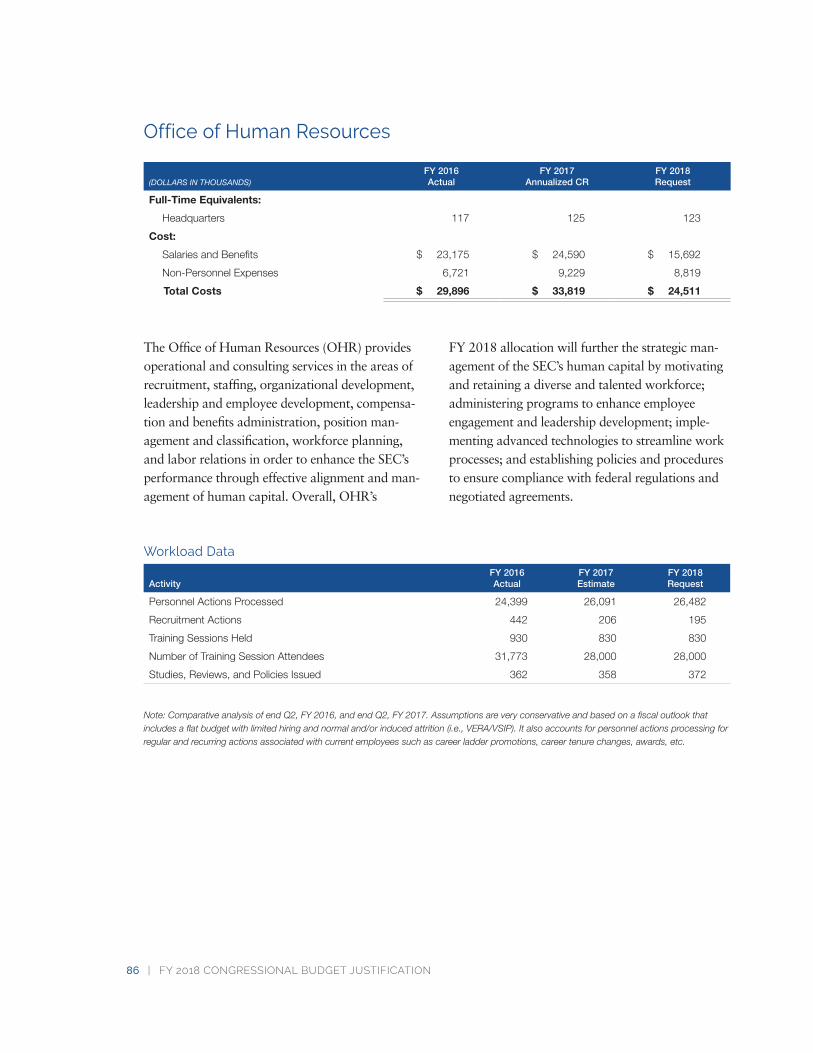
86 | FY 2018 CONGRESSIONAL BUDGET JUSTIFICATION
Office of Human Resources
(DOLLARS IN THOUSANDS)FY 2016Actual
FY 2017Annualized CR
FY 2018Request
Full-Time Equivalents:
Headquarters 117 125 123
Cost:
Salaries and Benefits $ 23,175 $ 24,590 $ 15,692
Non-Personnel Expenses 6,721 9,229 8,819
Total Costs $ 29,896 $ 33,819 $ 24,511
The Office of Human Resources (OHR) provides operational and consulting services in the areas of recruitment, staffing, organizational development, leadership and employee development, compensa-tion and benefits administration, position man-agement and classification, workforce planning, and labor relations in order to enhance the SEC’s performance through effective alignment and man-agement of human capital. Overall, OHR’s
FY 2018 allocation will further the strategic man-agement of the SEC’s human capital by motivating and retaining a diverse and talented workforce; administering programs to enhance employee engagement and leadership development; imple-menting advanced technologies to streamline work processes; and establishing policies and procedures to ensure compliance with federal regulations and negotiated agreements.
Workload Data
ActivityFY 2016Actual
FY 2017Estimate
FY 2018Request
Personnel Actions Processed 24,399 26,091 26,482
Recruitment Actions 442 206 195
Training Sessions Held 930 830 830
Number of Training Session Attendees 31,773 28,000 28,000
Studies, Reviews, and Policies Issued 362 358 372
Note:ComparativeanalysisofendQ2,FY2016,andendQ2,FY2017.Assumptionsareveryconservativeandbasedonafiscaloutlookthatincludesaflatbudgetwithlimitedhiringandnormaland/orinducedattrition(i.e.,VERA/VSIP).Italsoaccountsforpersonnelactionsprocessingforregularandrecurringactionsassociatedwithcurrentemployeessuchascareerladderpromotions,careertenurechanges,awards,etc.
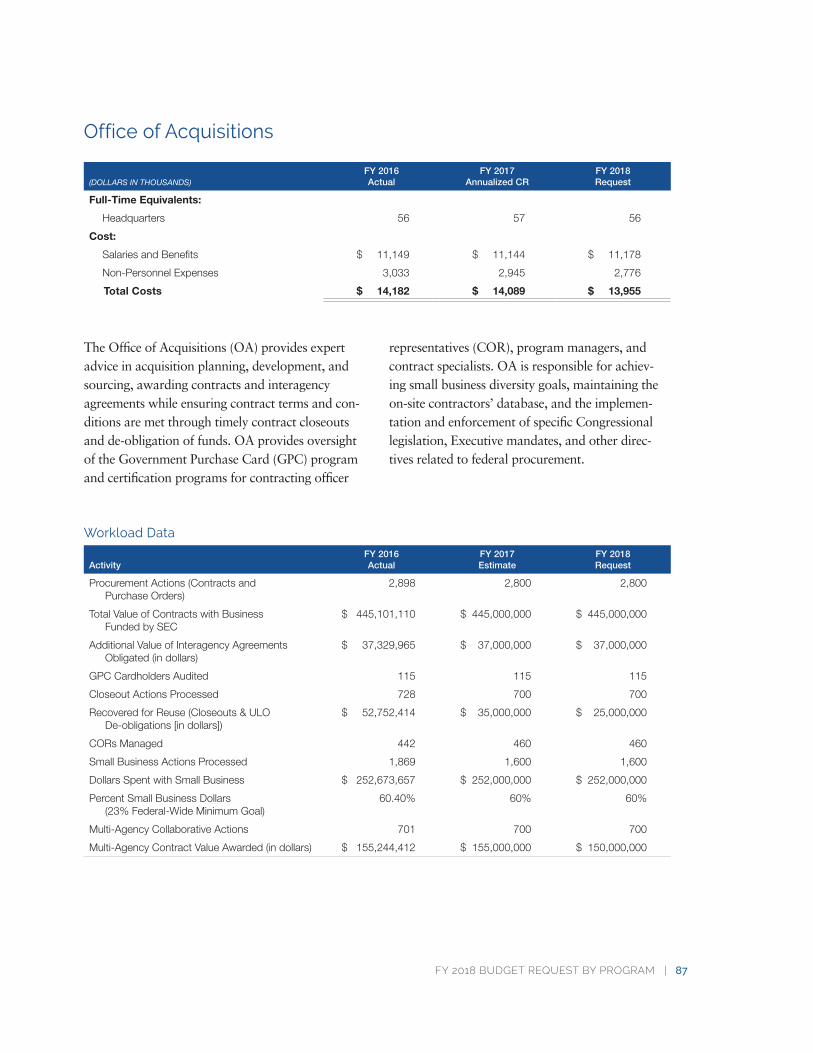
FY 2018 BUDGET REQUEST BY PROGRAM | 87
Office of Acquisitions
(DOLLARS IN THOUSANDS)FY 2016Actual
FY 2017Annualized CR
FY 2018Request
Full-Time Equivalents:
Headquarters 56 57 56
Cost:
Salaries and Benefits $ 11,149 $ 11,144 $ 11,178
Non-Personnel Expenses 3,033 2,945 2,776
Total Costs $ 14,182 $ 14,089 $ 13,955
The Office of Acquisitions (OA) provides expert advice in acquisition planning, development, and sourcing, awarding contracts and interagency agreements while ensuring contract terms and con-ditions are met through timely contract closeouts and de-obligation of funds. OA provides oversight of the Government Purchase Card (GPC) program and certification programs for contracting officer
representatives (COR), program managers, and contract specialists. OA is responsible for achiev-ing small business diversity goals, maintaining the on-site contractors’ database, and the implemen-tation and enforcement of specific Congressional legislation, Executive mandates, and other direc-tives related to federal procurement.
Workload Data
ActivityFY 2016Actual
FY 2017Estimate
FY 2018Request
Procurement Actions (Contracts and Purchase Orders)
2,898 2,800 2,800
Total Value of Contracts with Business Funded by SEC
$ 445,101,110 $ 445,000,000 $ 445,000,000
Additional Value of Interagency Agreements Obligated (in dollars)
$ 37,329,965 $ 37,000,000 $ 37,000,000
GPC Cardholders Audited 115 115 115
Closeout Actions Processed 728 700 700
Recovered for Reuse (Closeouts & ULO De-obligations [in dollars])
$ 52,752,414 $ 35,000,000 $ 25,000,000
CORs Managed 442 460 460
Small Business Actions Processed 1,869 1,600 1,600
Dollars Spent with Small Business $ 252,673,657 $ 252,000,000 $ 252,000,000
Percent Small Business Dollars (23% Federal-Wide Minimum Goal)
60.40% 60% 60%
Multi-Agency Collaborative Actions 701 700 700
Multi-Agency Contract Value Awarded (in dollars) $ 155,244,412 $ 155,000,000 $ 150,000,000
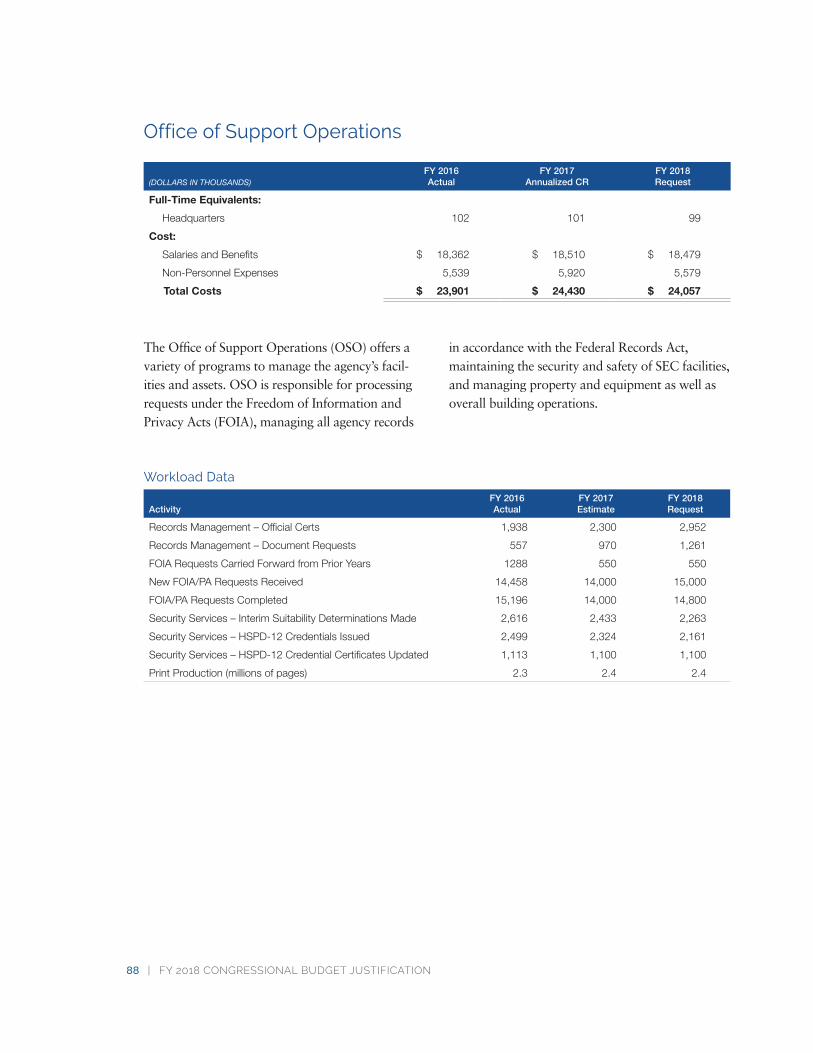
88 | FY 2018 CONGRESSIONAL BUDGET JUSTIFICATION
Office of Support Operations
(DOLLARS IN THOUSANDS)FY 2016Actual
FY 2017Annualized CR
FY 2018Request
Full-Time Equivalents:
Headquarters 102 101 99
Cost:
Salaries and Benefits $ 18,362 $ 18,510 $ 18,479
Non-Personnel Expenses 5,539 5,920 5,579
Total Costs $ 23,901 $ 24,430 $ 24,057
The Office of Support Operations (OSO) offers a variety of programs to manage the agency’s facil-ities and assets. OSO is responsible for processing requests under the Freedom of Information and Privacy Acts (FOIA), managing all agency records
in accordance with the Federal Records Act, maintaining the security and safety of SEC facilities, and managing property and equipment as well as overall building operations.
Workload Data
ActivityFY 2016Actual
FY 2017Estimate
FY 2018Request
Records Management – Official Certs 1,938 2,300 2,952
Records Management – Document Requests 557 970 1,261
FOIA Requests Carried Forward from Prior Years 1288 550 550
New FOIA/PA Requests Received 14,458 14,000 15,000
FOIA/PA Requests Completed 15,196 14,000 14,800
Security Services – Interim Suitability Determinations Made 2,616 2,433 2,263
Security Services – HSPD-12 Credentials Issued 2,499 2,324 2,161
Security Services – HSPD-12 Credential Certificates Updated 1,113 1,100 1,100
Print Production (millions of pages) 2.3 2.4 2.4
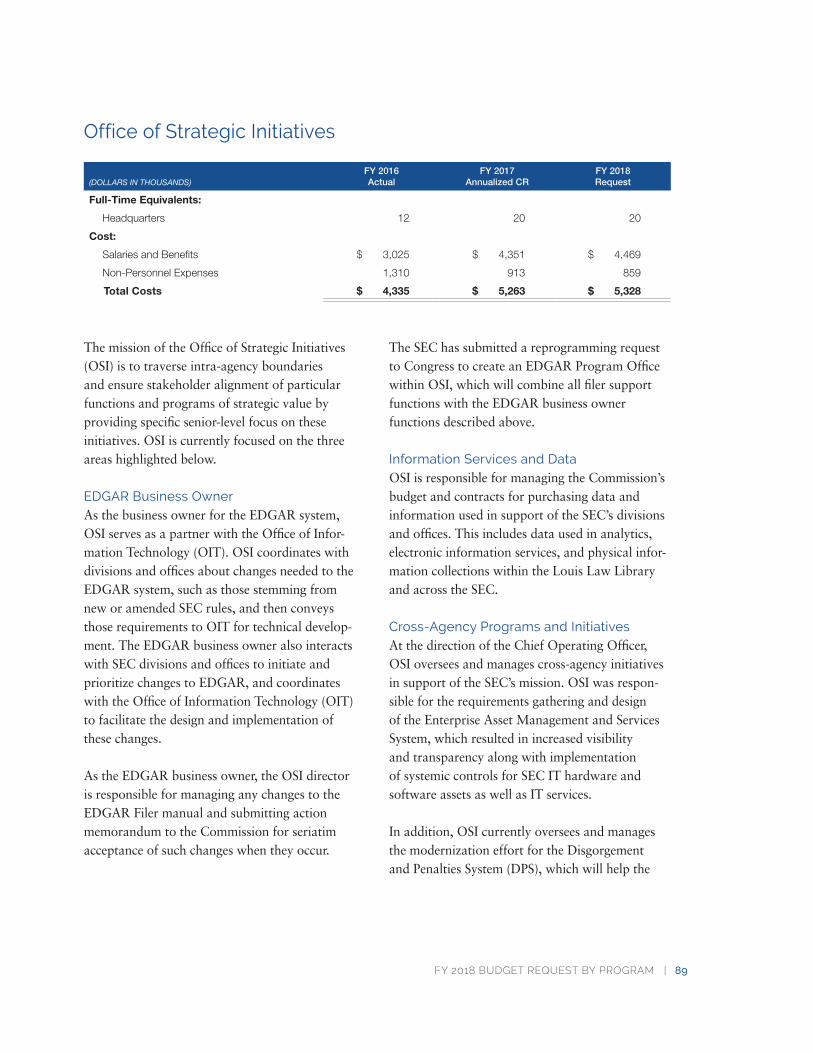
FY 2018 BUDGET REQUEST BY PROGRAM | 89
Office of Strategic Initiatives
(DOLLARS IN THOUSANDS)FY 2016Actual
FY 2017Annualized CR
FY 2018Request
Full-Time Equivalents:
Headquarters 12 20 20
Cost:
Salaries and Benefits $ 3,025 $ 4,351 $ 4,469
Non-Personnel Expenses 1,310 913 859
Total Costs $ 4,335 $ 5,263 $ 5,328
The mission of the Office of Strategic Initiatives (OSI) is to traverse intra-agency boundaries and ensure stakeholder alignment of particular functions and programs of strategic value by providing specific senior-level focus on these initiatives. OSI is currently focused on the three areas highlighted below.
EDGAR Business OwnerAs the business owner for the EDGAR system, OSI serves as a partner with the Office of Infor-mation Technology (OIT). OSI coordinates with divisions and offices about changes needed to the EDGAR system, such as those stemming from new or amended SEC rules, and then conveys those requirements to OIT for technical develop-ment. The EDGAR business owner also interacts with SEC divisions and offices to initiate and prioritize changes to EDGAR, and coordinates with the Office of Information Technology (OIT) to facilitate the design and implementation of these changes.
As the EDGAR business owner, the OSI director is responsible for managing any changes to the EDGAR Filer manual and submitting action memorandum to the Commission for seriatim acceptance of such changes when they occur.
The SEC has submitted a reprogramming request to Congress to create an EDGAR Program Office within OSI, which will combine all filer support functions with the EDGAR business owner functions described above.
Information Services and DataOSI is responsible for managing the Commission’s budget and contracts for purchasing data and information used in support of the SEC’s divisions and offices. This includes data used in analytics, electronic information services, and physical infor-mation collections within the Louis Law Library and across the SEC.
Cross-Agency Programs and InitiativesAt the direction of the Chief Operating Officer, OSI oversees and manages cross-agency initiatives in support of the SEC’s mission. OSI was respon-sible for the requirements gathering and design of the Enterprise Asset Management and Services System, which resulted in increased visibility and transparency along with implementation of systemic controls for SEC IT hardware and software assets as well as IT services.
In addition, OSI currently oversees and manages the modernization effort for the Disgorgement and Penalties System (DPS), which will help the
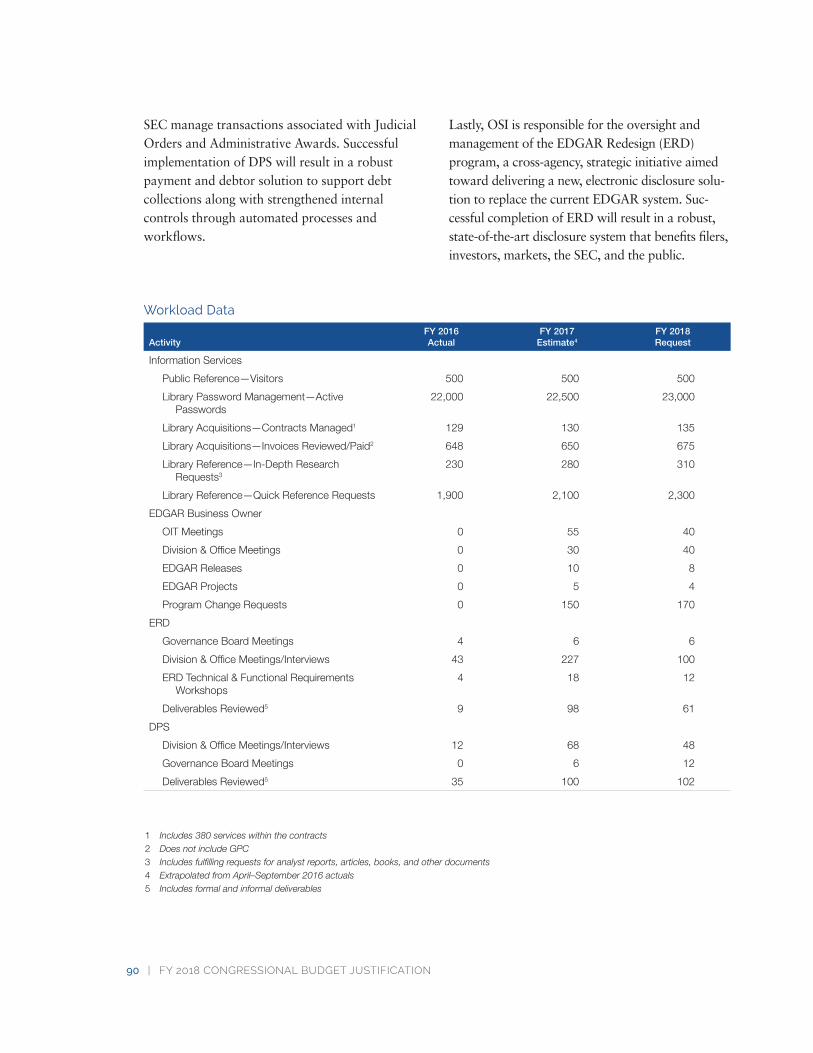
90 | FY 2018 CONGRESSIONAL BUDGET JUSTIFICATION
SEC manage transactions associated with Judicial Orders and Administrative Awards. Successful implementation of DPS will result in a robust payment and debtor solution to support debt collections along with strengthened internal controls through automated processes and workflows.
Lastly, OSI is responsible for the oversight and management of the EDGAR Redesign (ERD) program, a cross-agency, strategic initiative aimed toward delivering a new, electronic disclosure solu-tion to replace the current EDGAR system. Suc-cessful completion of ERD will result in a robust, state-of-the-art disclosure system that benefits filers, investors, markets, the SEC, and the public.
Workload Data
ActivityFY 2016Actual
FY 2017Estimate4
FY 2018Request
Information Services
Public Reference—Visitors 500 500 500
Library Password Management—Active Passwords
22,000 22,500 23,000
Library Acquisitions—Contracts Managed1 129 130 135
Library Acquisitions—Invoices Reviewed/Paid2 648 650 675
Library Reference—In-Depth Research Requests3
230 280 310
Library Reference—Quick Reference Requests 1,900 2,100 2,300
EDGAR Business Owner
OIT Meetings 0 55 40
Division & Office Meetings 0 30 40
EDGAR Releases 0 10 8
EDGAR Projects 0 5 4
Program Change Requests 0 150 170
ERD
Governance Board Meetings 4 6 6
Division & Office Meetings/Interviews 43 227 100
ERD Technical & Functional Requirements Workshops
4 18 12
Deliverables Reviewed5 9 98 61
DPS
Division & Office Meetings/Interviews 12 68 48
Governance Board Meetings 0 6 12
Deliverables Reviewed5 35 100 102
1 Includes380serviceswithinthecontracts2 DoesnotincludeGPC3 Includesfulfillingrequestsforanalystreports,articles,books,andotherdocuments4 ExtrapolatedfromApril–September2016actuals5 Includesformalandinformaldeliverables
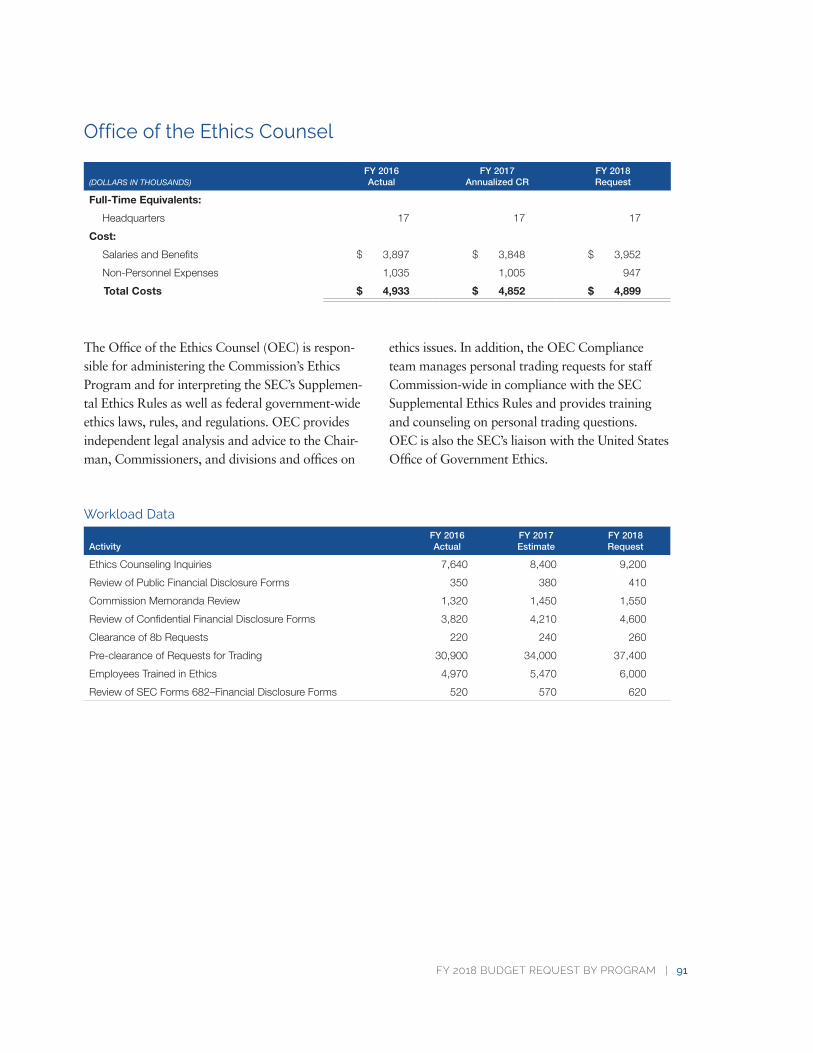
FY 2018 BUDGET REQUEST BY PROGRAM | 91
Office of the Ethics Counsel
(DOLLARS IN THOUSANDS)FY 2016Actual
FY 2017Annualized CR
FY 2018Request
Full-Time Equivalents:
Headquarters 17 17 17
Cost:
Salaries and Benefits $ 3,897 $ 3,848 $ 3,952
Non-Personnel Expenses 1,035 1,005 947
Total Costs $ 4,933 $ 4,852 $ 4,899
The Office of the Ethics Counsel (OEC) is respon-sible for administering the Commission’s Ethics Program and for interpreting the SEC’s Supplemen-tal Ethics Rules as well as federal government-wide ethics laws, rules, and regulations. OEC provides independent legal analysis and advice to the Chair-man, Commissioners, and divisions and offices on
ethics issues. In addition, the OEC Compliance team manages personal trading requests for staff Commission-wide in compliance with the SEC Supplemental Ethics Rules and provides training and counseling on personal trading questions. OEC is also the SEC’s liaison with the United States Office of Government Ethics.
Workload Data
ActivityFY 2016Actual
FY 2017Estimate
FY 2018Request
Ethics Counseling Inquiries 7,640 8,400 9,200
Review of Public Financial Disclosure Forms 350 380 410
Commission Memoranda Review 1,320 1,450 1,550
Review of Confidential Financial Disclosure Forms 3,820 4,210 4,600
Clearance of 8b Requests 220 240 260
Pre-clearance of Requests for Trading 30,900 34,000 37,400
Employees Trained in Ethics 4,970 5,470 6,000
Review of SEC Forms 682–Financial Disclosure Forms 520 570 620
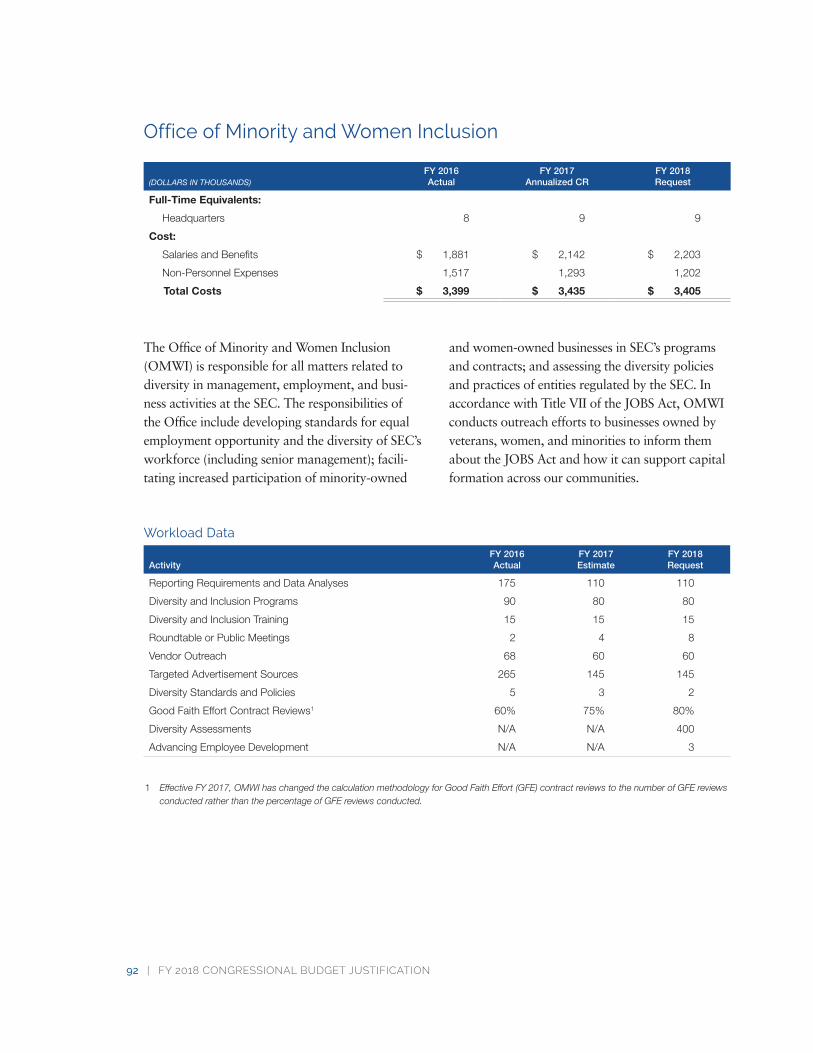
92 | FY 2018 CONGRESSIONAL BUDGET JUSTIFICATION
Office of Minority and Women Inclusion
(DOLLARS IN THOUSANDS)FY 2016Actual
FY 2017Annualized CR
FY 2018Request
Full-Time Equivalents:
Headquarters 8 9 9
Cost:
Salaries and Benefits $ 1,881 $ 2,142 $ 2,203
Non-Personnel Expenses 1,517 1,293 1,202
Total Costs $ 3,399 $ 3,435 $ 3,405
The Office of Minority and Women Inclusion (OMWI) is responsible for all matters related to diversity in management, employment, and busi-ness activities at the SEC. The responsibilities of the Office include developing standards for equal employment opportunity and the diversity of SEC’s workforce (including senior management); facili-tating increased participation of minority-owned
and women-owned businesses in SEC’s programs and contracts; and assessing the diversity policies and practices of entities regulated by the SEC. In accordance with Title VII of the JOBS Act, OMWI conducts outreach efforts to businesses owned by veterans, women, and minorities to inform them about the JOBS Act and how it can support capital formation across our communities.
Workload Data
ActivityFY 2016Actual
FY 2017Estimate
FY 2018Request
Reporting Requirements and Data Analyses 175 110 110
Diversity and Inclusion Programs 90 80 80
Diversity and Inclusion Training 15 15 15
Roundtable or Public Meetings 2 4 8
Vendor Outreach 68 60 60
Targeted Advertisement Sources 265 145 145
Diversity Standards and Policies 5 3 2
Good Faith Effort Contract Reviews1 60% 75% 80%
Diversity Assessments N/A N/A 400
Advancing Employee Development N/A N/A 3
1 EffectiveFY2017,OMWIhaschangedthecalculationmethodologyforGoodFaithEffort(GFE)contractreviewstothenumberofGFEreviewsconductedratherthanthepercentageofGFEreviewsconducted.
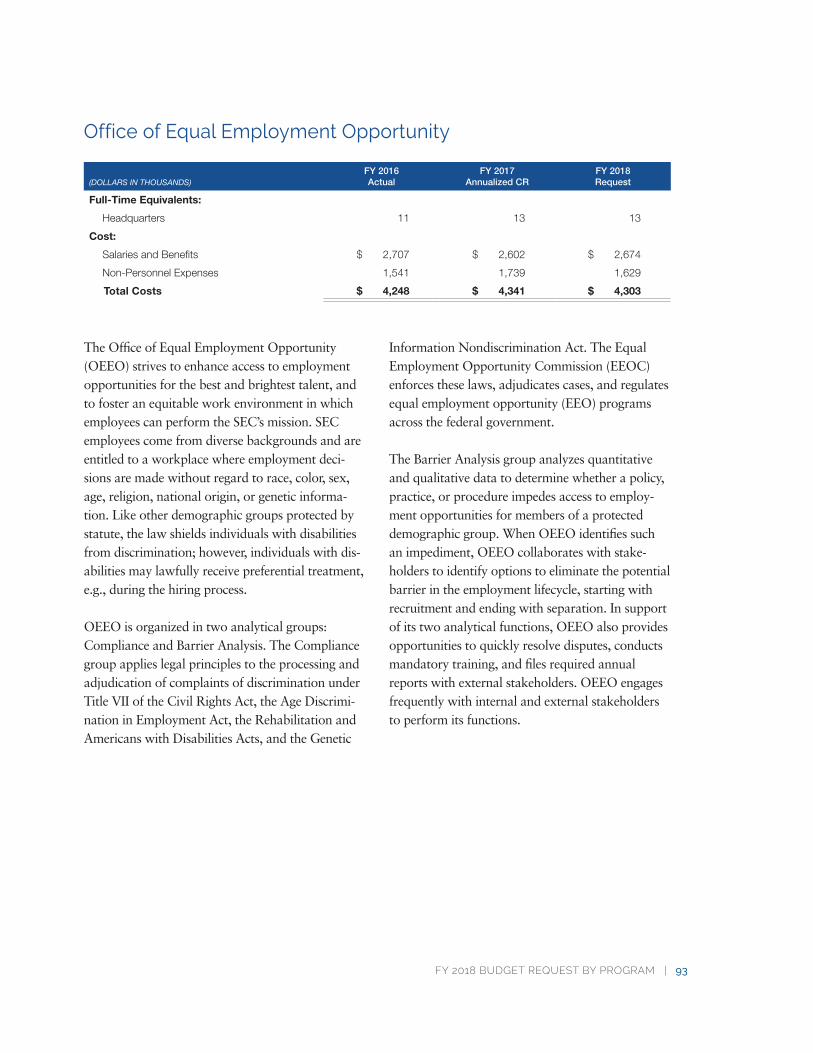
FY 2018 BUDGET REQUEST BY PROGRAM | 93
Office of Equal Employment Opportunity
(DOLLARS IN THOUSANDS)FY 2016Actual
FY 2017Annualized CR
FY 2018Request
Full-Time Equivalents:
Headquarters 11 13 13
Cost:
Salaries and Benefits $ 2,707 $ 2,602 $ 2,674
Non-Personnel Expenses 1,541 1,739 1,629
Total Costs $ 4,248 $ 4,341 $ 4,303
The Office of Equal Employment Opportunity (OEEO) strives to enhance access to employment opportunities for the best and brightest talent, and to foster an equitable work environment in which employees can perform the SEC’s mission. SEC employees come from diverse backgrounds and are entitled to a workplace where employment deci-sions are made without regard to race, color, sex, age, religion, national origin, or genetic informa-tion. Like other demographic groups protected by statute, the law shields individuals with disabilities from discrimination; however, individuals with dis-abilities may lawfully receive preferential treatment, e.g., during the hiring process.
OEEO is organized in two analytical groups: Compliance and Barrier Analysis. The Compliance group applies legal principles to the processing and adjudication of complaints of discrimination under Title VII of the Civil Rights Act, the Age Discrimi-nation in Employment Act, the Rehabilitation and Americans with Disabilities Acts, and the Genetic
Information Nondiscrimination Act. The Equal Employment Opportunity Commission (EEOC) enforces these laws, adjudicates cases, and regulates equal employment opportunity (EEO) programs across the federal government.
The Barrier Analysis group analyzes quantitative and qualitative data to determine whether a policy, practice, or procedure impedes access to employ-ment opportunities for members of a protected demographic group. When OEEO identifies such an impediment, OEEO collaborates with stake-holders to identify options to eliminate the potential barrier in the employment lifecycle, starting with recruitment and ending with separation. In support of its two analytical functions, OEEO also provides opportunities to quickly resolve disputes, conducts mandatory training, and files required annual reports with external stakeholders. OEEO engages frequently with internal and external stakeholders to perform its functions.
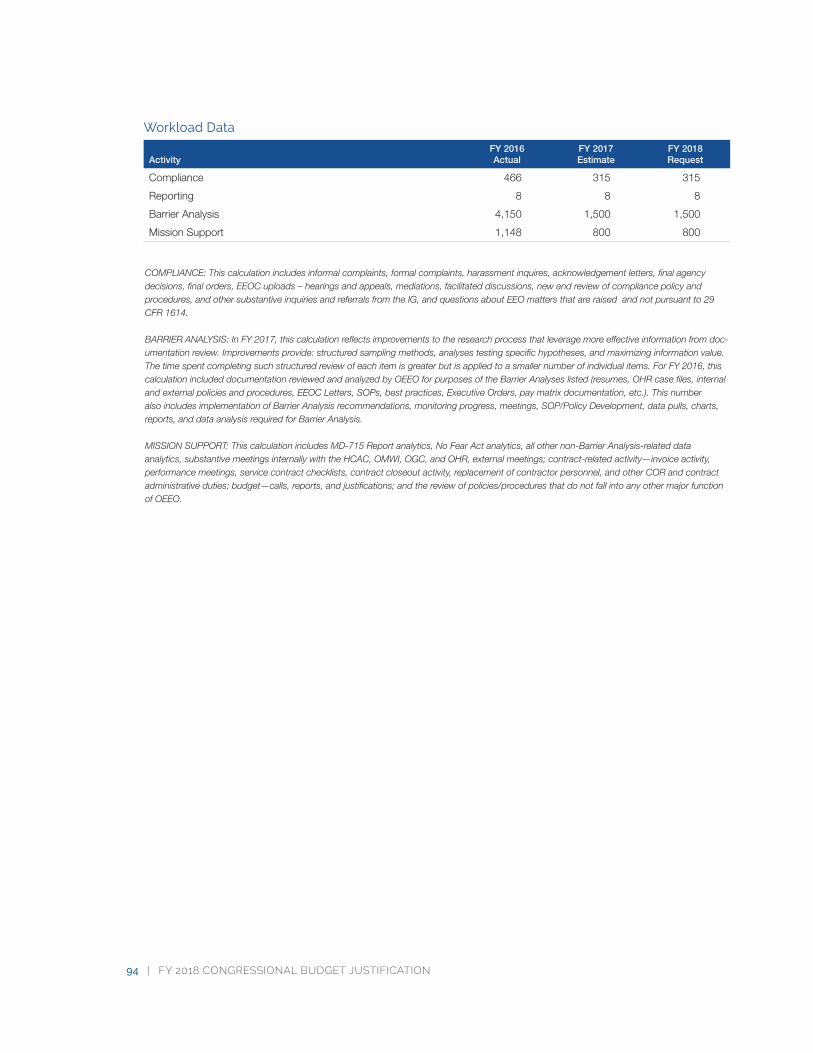
94 | FY 2018 CONGRESSIONAL BUDGET JUSTIFICATION
Workload Data
ActivityFY 2016Actual
FY 2017Estimate
FY 2018Request
Compliance 466 315 315
Reporting 8 8 8
Barrier Analysis 4,150 1,500 1,500
Mission Support 1,148 800 800
COMPLIANCE:Thiscalculationincludesinformalcomplaints,formalcomplaints,harassmentinquires,acknowledgementletters,finalagencydecisions,finalorders,EEOCuploads–hearingsandappeals,mediations,facilitateddiscussions,newandreviewofcompliancepolicyandprocedures,andothersubstantiveinquiriesandreferralsfromtheIG,andquestionsaboutEEOmattersthatareraisedandnotpursuantto29CFR1614.
BARRIERANALYSIS:InFY2017,thiscalculationreflectsimprovementstotheresearchprocessthatleveragemoreeffectiveinformationfromdoc-umentationreview.Improvementsprovide:structuredsamplingmethods,analysestestingspecifichypotheses,andmaximizinginformationvalue.Thetimespentcompletingsuchstructuredreviewofeachitemisgreaterbutisappliedtoasmallernumberofindividualitems.ForFY2016,thiscalculationincludeddocumentationreviewedandanalyzedbyOEEOforpurposesoftheBarrierAnalyseslisted(resumes,OHRcasefiles,internalandexternalpoliciesandprocedures,EEOCLetters,SOPs,bestpractices,ExecutiveOrders,paymatrixdocumentation,etc.).ThisnumberalsoincludesimplementationofBarrierAnalysisrecommendations,monitoringprogress,meetings,SOP/PolicyDevelopment,datapulls,charts,reports,anddataanalysisrequiredforBarrierAnalysis.
MISSIONSUPPORT:ThiscalculationincludesMD-715Reportanalytics,NoFearActanalytics,allothernon-BarrierAnalysis-relateddataanalytics,substantivemeetingsinternallywiththeHCAC,OMWI,OGC,andOHR,externalmeetings;contract-relatedactivity—invoiceactivity,performancemeetings,servicecontractchecklists,contractcloseoutactivity,replacementofcontractorpersonnel,andotherCORandcontractadministrativeduties;budget—calls,reports,andjustifications;andthereviewofpolicies/proceduresthatdonotfallintoanyothermajorfunctionofOEEO.
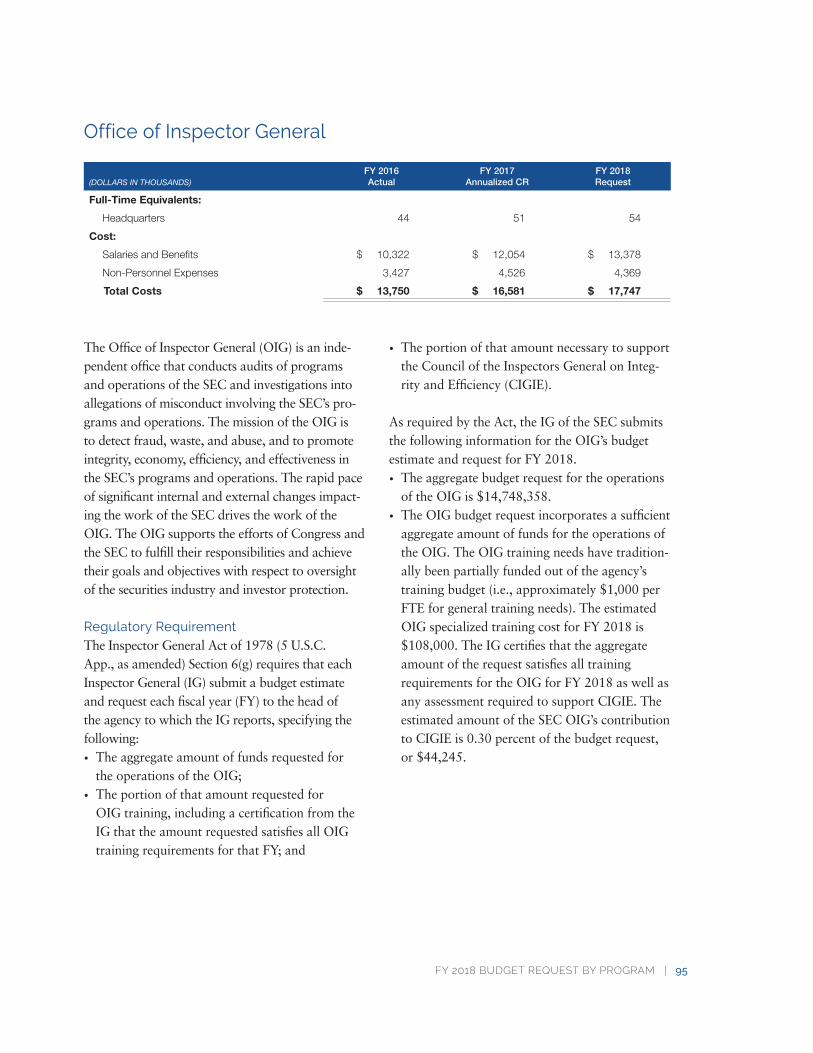
FY 2018 BUDGET REQUEST BY PROGRAM | 95
Office of Inspector General
(DOLLARS IN THOUSANDS)FY 2016Actual
FY 2017Annualized CR
FY 2018Request
Full-Time Equivalents:
Headquarters 44 51 54
Cost:
Salaries and Benefits $ 10,322 $ 12,054 $ 13,378
Non-Personnel Expenses 3,427 4,526 4,369
Total Costs $ 13,750 $ 16,581 $ 17,747
The Office of Inspector General (OIG) is an inde-pendent office that conducts audits of programs and operations of the SEC and investigations into allegations of misconduct involving the SEC’s pro-grams and operations. The mission of the OIG is to detect fraud, waste, and abuse, and to promote integrity, economy, efficiency, and effectiveness in the SEC’s programs and operations. The rapid pace of significant internal and external changes impact-ing the work of the SEC drives the work of the OIG. The OIG supports the efforts of Congress and the SEC to fulfill their responsibilities and achieve their goals and objectives with respect to oversight of the securities industry and investor protection.
Regulatory RequirementThe Inspector General Act of 1978 (5 U.S.C. App., as amended) Section 6(g) requires that each Inspector General (IG) submit a budget estimate and request each fiscal year (FY) to the head of the agency to which the IG reports, specifying the following:
• The aggregate amount of funds requested for the operations of the OIG;
• The portion of that amount requested for OIG training, including a certification from the IG that the amount requested satisfies all OIG training requirements for that FY; and
• The portion of that amount necessary to support the Council of the Inspectors General on Integ-rity and Efficiency (CIGIE).
As required by the Act, the IG of the SEC submits the following information for the OIG’s budget estimate and request for FY 2018.
• The aggregate budget request for the operations of the OIG is $14,748,358.
• The OIG budget request incorporates a sufficient aggregate amount of funds for the operations of the OIG. The OIG training needs have tradition-ally been partially funded out of the agency’s training budget (i.e., approximately $1,000 per FTE for general training needs). The estimated OIG specialized training cost for FY 2018 is $108,000. The IG certifies that the aggregate amount of the request satisfies all training requirements for the OIG for FY 2018 as well as any assessment required to support CIGIE. The estimated amount of the SEC OIG’s contribution to CIGIE is 0.30 percent of the budget request, or $44,245.
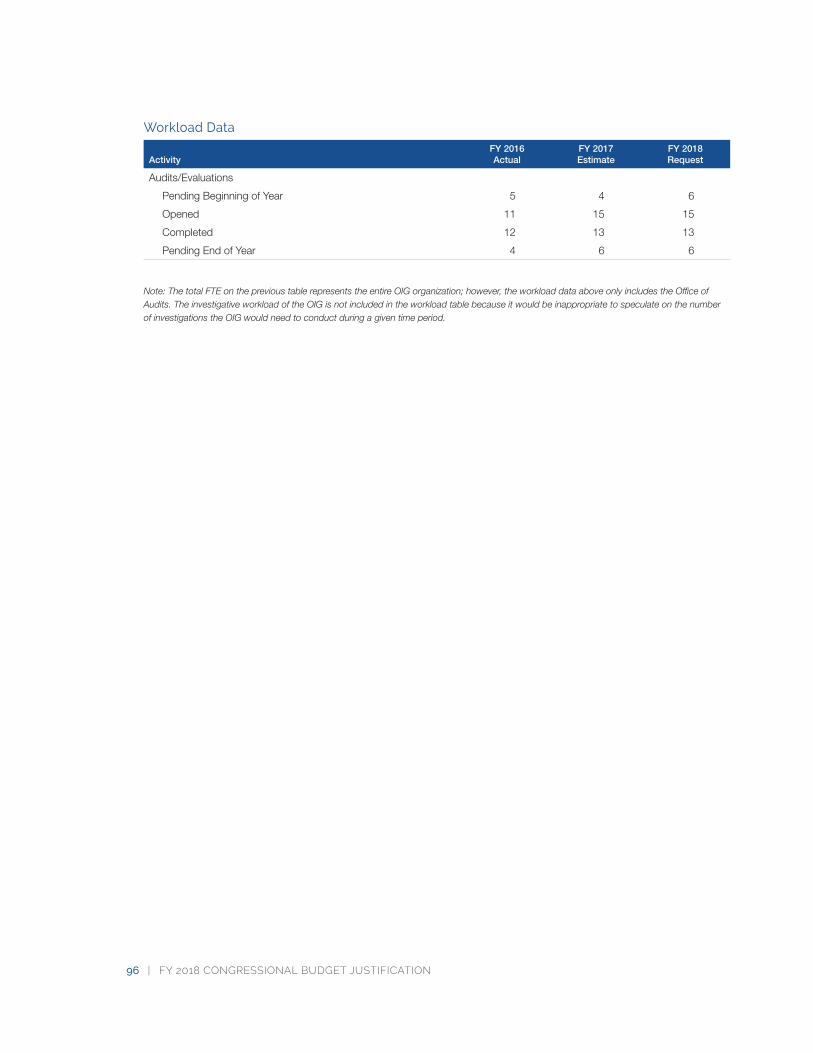
96 | FY 2018 CONGRESSIONAL BUDGET JUSTIFICATION
Workload Data
ActivityFY 2016Actual
FY 2017Estimate
FY 2018Request
Audits/Evaluations
Pending Beginning of Year 5 4 6
Opened 11 15 15
Completed 12 13 13
Pending End of Year 4 6 6
Note:ThetotalFTEontheprevioustablerepresentstheentireOIGorganization;however,theworkloaddataaboveonlyincludestheOfficeofAudits.TheinvestigativeworkloadoftheOIGisnotincludedintheworkloadtablebecauseitwouldbeinappropriatetospeculateonthenumberofinvestigationstheOIGwouldneedtoconductduringagiventimeperiod.
Other Information
Risks, Internal Controls, and Management Challenges ..................................................................99
Cross-Agency Collaboration .................................................................................................................................103
Evidence Building ...........................................................................................................................................................106
Hyperlinks to Other Information and Resources .................................................................................107

Risks, Internal Controls, and Management Challenges
As the markets, products, and participants that the SEC oversees and regulates increase in size and complexity, the agency’s mandate to protect inves-tors, maintain fair, orderly, and efficient markets, and facilitate capital formation becomes more challenging. To maximize the use of the SEC’s resources to fulfill this mission, the agency contin-ually strives to allocate its time and funds toward the highest and best uses. The SEC must always reevaluate its operations to identify emerging risks and ensure the agency's resources are deployed to most efficiently address agency priorities.
Risk Management Enterprise risk management at the SEC is coordi-nated by the front office of the Office of the Chief Operating Officer. This risk management program assists the agency in achieving its strategic and operational objectives by providing an enter-prise-wide, strategically aligned, systematic, and structured methodology for managing the agency’s most significant risks and challenges.
The Risk Management Oversight Committee is the SEC’s designated Risk Management Council, which provides governance and oversight of the SEC’s Enterprise Risk Management program. This committee oversees the development and implementation of strategic and programmatic risk policies, frameworks, and methodologies, and also produces and maintains the agency’s risk profile.
In FY 2018, the SEC will continue to focus on its enterprise risk management practices and ensure compliance with applicable laws, regulations, and standards.
Management Assessments of Internal ControlsThe SEC remains committed to maintaining strong internal controls. Internal control is an integral component of effective agency management, providing reasonable assurance that the following objectives are being achieved: effectiveness and efficiency of operations, reliability of reporting, and compliance with laws and regulations. The Federal Managers’ Financial Integrity Act of 1982 (FMFIA) establishes management’s responsibility to assess and report on internal accounting and administrative controls. Such controls include program, operational, and administrative areas, as well as accounting and financial management. The FMFIA requires federal agencies to establish controls that reasonably ensure obligations and costs are in compliance with applicable law; funds, property, and other assets are safeguarded against waste, loss, unauthorized use, or mis-appropria-tion; and revenues and expenditures are properly recorded and accounted for to maintain account-ability over the assets. The FMFIA also requires agencies to annually assess whether financial management systems conform to related require-ments (FMFIA § 4). Section 963 of the Dodd-Frank Wall Street Reform and Consumer Protection Act of 2010 (Dodd-Frank Act) describes the responsibility of SEC management to establish and maintain adequate internal controls and procedures for financial reporting. This section requires an annual financial controls audit, a Government Account-ability Office (GAO) audit of the SEC’s assessment of the effectiveness of internal control, and internal controls attestations by the Chairman and the Chief Financial Officer (CFO).
OTHER INFORMATION | 99
The assurance statements are based on reports from each division director and office head on the effectiveness of their controls. These statements were based on self-assessments and internal reviews supported by control testing, as well as recommendations for improvement from audits, investigations, and reviews conducted internally by the SEC Office of Inspector General (OIG) and GAO. In evaluating internal controls, the SEC also considers other sources of information, which included, but were not limited to, the following:
• An entity-level control assessment;
• Internal management reviews, self-assessments, and tests of internal controls;
• Management’s personal knowledge gained from daily operations;
• Reports from GAO and the OIG;
• Reviews of financial management systems;
• Reports pursuant to the Federal Information Security Management Act (FISMA) and OMB Circular A-130, Management of Federal Information Resources;
• Annual reviews on improper payments;
• Reports and other information from Congress or agencies such as OMB, the Office of Personnel Management (OPM), or the General Services Administration (GSA) reflecting the adequacy of internal controls; and
• Additional reviews relating to a division or office’s operations.
The SEC’s annual assessment of internal controls, based on these sources, is discussed in the agency’s Annual Financial Report (AFR), which can be found on the SEC website.
Management Challenges Identified by the Office of Inspector GeneralThe SEC’s FY 2016 AFR provides a summary of the most serious management and performance challenges facing the SEC, as identified by OIG in the Other Information section. The AFR also details the actions currently being taken to address these challenges.
The table starting on the next page describes how the resources requested for FY 2018 will help address the challenges identified by the Inspector General.
100 | FY 2018 CONGRESSIONAL BUDGET JUSTIFICATION
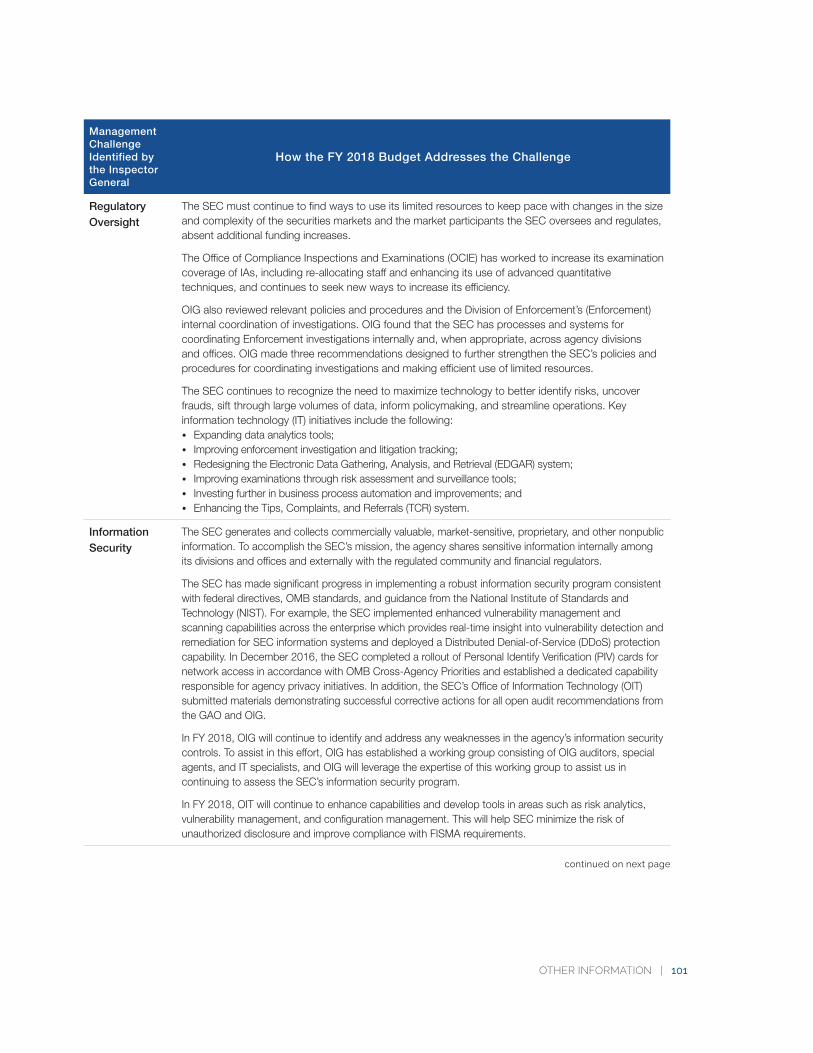
OTHER INFORMATION | 101
Management Challenge Identified by the Inspector General
How the FY 2018 Budget Addresses the Challenge
Regulatory Oversight
The SEC must continue to find ways to use its limited resources to keep pace with changes in the size and complexity of the securities markets and the market participants the SEC oversees and regulates, absent additional funding increases.
The Office of Compliance Inspections and Examinations (OCIE) has worked to increase its examination coverage of IAs, including re-allocating staff and enhancing its use of advanced quantitative techniques, and continues to seek new ways to increase its efficiency.
OIG also reviewed relevant policies and procedures and the Division of Enforcement’s (Enforcement) internal coordination of investigations. OIG found that the SEC has processes and systems for coordinating Enforcement investigations internally and, when appropriate, across agency divisions and offices. OIG made three recommendations designed to further strengthen the SEC’s policies and procedures for coordinating investigations and making efficient use of limited resources.
The SEC continues to recognize the need to maximize technology to better identify risks, uncover frauds, sift through large volumes of data, inform policymaking, and streamline operations. Key information technology (IT) initiatives include the following:• Expanding data analytics tools; • Improving enforcement investigation and litigation tracking; • Redesigning the Electronic Data Gathering, Analysis, and Retrieval (EDGAR) system; • Improving examinations through risk assessment and surveillance tools; • Investing further in business process automation and improvements; and • Enhancing the Tips, Complaints, and Referrals (TCR) system.
Information Security
The SEC generates and collects commercially valuable, market-sensitive, proprietary, and other nonpublic information. To accomplish the SEC’s mission, the agency shares sensitive information internally among its divisions and offices and externally with the regulated community and financial regulators.
The SEC has made significant progress in implementing a robust information security program consistent with federal directives, OMB standards, and guidance from the National Institute of Standards and Technology (NIST). For example, the SEC implemented enhanced vulnerability management and scanning capabilities across the enterprise which provides real-time insight into vulnerability detection and remediation for SEC information systems and deployed a Distributed Denial-of-Service (DDoS) protection capability. In December 2016, the SEC completed a rollout of Personal Identify Verification (PIV) cards for network access in accordance with OMB Cross-Agency Priorities and established a dedicated capability responsible for agency privacy initiatives. In addition, the SEC’s Office of Information Technology (OIT) submitted materials demonstrating successful corrective actions for all open audit recommendations from the GAO and OIG.
In FY 2018, OIG will continue to identify and address any weaknesses in the agency’s information security controls. To assist in this effort, OIG has established a working group consisting of OIG auditors, special agents, and IT specialists, and OIG will leverage the expertise of this working group to assist us in continuing to assess the SEC’s information security program.
In FY 2018, OIT will continue to enhance capabilities and develop tools in areas such as risk analytics, vulnerability management, and configuration management. This will help SEC minimize the risk of unauthorized disclosure and improve compliance with FISMA requirements.
continued on next page
102 | FY 2018 CONGRESSIONAL BUDGET JUSTIFICATION
Management Challenge Identified by the Inspector General
How the FY 2018 Budget Addresses the Challenge (continued)
Acquisition Management
In FY 2018, the Office of Acquisitions (OA) will use its resources to complete the migration from a paper-based contracting filing system to an electronic contract file system, eFile. This effort will include centralizing the files of the SEC’s contracting officer representatives (COR), and maintaining focus on the COR Improvement Initiative, which is aimed toward providing greater efficient and effective management of the COR program across the SEC through both formal and informal training. OA also will continue to ensure proper certifications of the SEC’s program/project managers.
Human Capital Management
During FY 2016, the SEC released a Human Capital Strategic Plan to align the agency’s human capital with the achievement of its mission, goals, and objectives. The agency also released an SEC Strategic Workforce Plan, which provides an overview of the current workforce; identifies critical workforce competencies for SEC mission critical occupations; and identifies perceived workforce competency gaps from supervisors/managers.
In FY 2018, the Office of Human Resources (OHR) will conduct periodic reviews to assess whether the plan aligns with current agency workforce and succession planning efforts.
In FY 2018, the Office of Women and Minority Inclusion (OMWI) will continue to work with all divisions and offices, SEC senior leadership, the agency’s Diversity Council, the Office of Equal Employment Opportunity, and OHR to promote diversity in the agency’s workforce and cultivate an inclusive work environment. The SEC will continue to implement existing initiatives and explore new strategies for improving gender, racial, and ethnic diversity in SEC mission critical occupations and senior management positions. Further, OMWI will continue to work with OA to build on the agency’s success in advancing the agency’s supplier diversity goals.
Pending OMB approval for its Diversity Assessment Report for Entities Regulated by the SEC in FY 2017, OMWI will begin requesting diversity assessment information in FY 2018. OMWI will use educational events with industry trade associations to promote the use of the Joint Standards and encourage SEC-regulated entities to conduct self-assessments of their diversity policies and practices. OMWI will also continue to conduct post-award reviews of agency contractors to determine compliance with SEC Contract Standard for Contractor Workforce Inclusion.
OTHER INFORMATION | 103
Cross-Agency Collaboration
Working with partners across regulatory boundar-ies, market segments, and national borders furthers the SEC’s ability to protect investors, maintain fair, orderly, and efficient markets, and facilitate capital formation. The SEC values these partnerships and understands that these collaborations are critical for the SEC to meet its strategic goals. Examples of these collaborative efforts are discussed below.
Strategic Goal 1 To establish an effective regulatory environment, several SEC divisions and offices regularly collabo-rate with external partners.
For example, the SEC participates in international regulatory organizations such as the Financial Stability Board (FSB) and the International Organization of Securities Commissions (IOSCO). Through these entities, the SEC addresses interna-tional regulatory issues by influencing the develop-ment of international guidance, recommendations and standards, and participating in assessing the implementation of financial market reforms and their ramifications for U.S. investors. The SEC is involved in multiple FSB and IOSCO committees, working groups, and task forces, and also influ-ences IOSCO’s contributions to the FSB.
The SEC also participates in bilateral dialogues with foreign counterparts on securities markets issues, including dialogues led by the Treasury Department such as the U.S.-EU Financial Regulatory Forum, NAFTA Financial Services Committee, U.S.-EU Financial Services Committee, U.S.-China Comprehensive Economic Dialogue, and U.S.-India Financial Regulatory Dialogue. In FY 2017, the SEC anticipates that the pace
of regulatory action in other jurisdictions will increase—particularly in the European Union—and the SEC will continue to explore opportunities for converged approaches to high-quality regula-tory standards. Moreover, the demand for super-visory MOUs with foreign regulators will grow as regulators look to share information and exchange views in cross-border supervisory matters.
In FY 2016, the Division of Corporation Finance consulted and coordinated with the appropriate federal banking agencies before issuing comments to banks regarding loan loss allowances. Further-more, the SEC’s staff also meets quarterly and on an ad hoc basis with the chief accountants and certain other offices (e.g., examinations) of the banking regulators to discuss relevant accounting issues and rulemaking in the banking industry.
At minimum, the Office of the Chief Accountant meets with staff from each of the federal banking agencies every quarter to discuss accounting standards-setting activities and interpretations for the purposes of collaborating on financial report-ing matters. Examples of topics discussed are the accounting for financial instruments and related credit impairments (loan losses), revenue recogni-tion activities, and consolidations.
Strategic Goal 2 To foster and enforce compliance with the federal securities laws, the SEC works closely with other agencies and foreign governments.
The Division of Enforcement collaborates with a number of criminal authorities. For example, the Division, the U.S. Department of Justice, and the
104 | FY 2018 CONGRESSIONAL BUDGET JUSTIFICATION
94 U.S. Attorney’s Offices frequently collaborate on individual cases and broad sweeps or task forces through access grants to their respective investigative files. The Division also collaborates with the Federal Bureau of Investigation (FBI) on individual matters and through a Memorandum of Understanding to embed on a full-time basis several agents and intelligence analysts from the FBI’s Economic Crimes Unit into the Division’s Office of Market Intelligence (OMI) for the purpose of information sharing and combat-ting securities fraud by leveraging each other’s resources and expertise.
The Division of Enforcement also coordinates with other federal agencies, routinely exchanging tips, complaints and referrals (received by OMI) and sharing information and intelligence. The Division primarily coordinated in this regard with the U.S. Department of Justice, the 94 U.S. Attorney’s Offices, and the FBI, but also coordinates with other federal and state agencies including, among others, the Consumer Financial Protection Bureau, the Commodity Futures Trading Commission, the Department of Education, the Department of Labor, the Federal Trade Commission, the Internal Revenue Service, the Financial Crimes Enforce-ment Network, and the Office of the Comptroller of the Currency.
In coordination with the SEC’s Office of Interna-tional Affairs (OIA), the Enforcement Division routinely collaborates with the SEC’s law enforce-ment and regulatory counterparts abroad. This collaboration includes, for example, requests from the Division for international assistance and requests for assistance from foreign regulatory and law enforcement authorities. In addition, each year the Division participates in the SEC’s Annual International Enforcement Institute, at which staff share important information about enforce-ment-related issues.
The Office of Compliance Inspections and Examinations is responsible for the oversight of broker-dealers and does so through many coordinated efforts with the Financial Industry Regulatory Authority (FINRA). The SEC and FINRA have regular contact to discuss strategic initiatives, examination coordination, risk assess-ment efforts, rulemaking issues, industry risks, etc. This type of coordination is ultimately intended to make oversight of broker-dealers more effective and to improve compliance within the industry. As an example, the two agencies coordinate to formally present Compliance Outreach Seminars. Additional SEC offices—particularly the Division of Trading and Markets—are heavily involved in this coordination as well.
OIA actively participates in multilateral efforts to enhance international enforcement cooperation, representing the SEC on multiple IOSCO commit-tees and steering groups. OIA coordinates with foreign counterparts to develop policies relating to enforcement matters, and to promote international cooperation among securities regulators in their respective investigations and cases.
Strategic Goal 3 The SEC frequently works with other entities to facilitate access to the information investors need to make informed investment decisions.
Through the Outsmarting Investing Fraud program, the Office of Investor Education and Advocacy (OIEA) staff conducts educational programs with the FINRA Investor Education Foundation, state securities regulators, and AARP on how to identify common persuasion techniques used by con artists.
OTHER INFORMATION | 105
OIEA represents the SEC on the Financial Literacy and Education Commission (FLEC), which was established under the Fair and Accurate Credit Transactions Act of 2003. FLEC is chaired by the Secretary of the Treasury and made up of the heads over 20 additional federal agencies.
Strategic Goal 4To enhance the Commission’s performance through effective alignment and management of human, information, and financial capital, the Commission’s administrative offices often work collaboratively with other agencies.
For example, the Office of Human Resources participates in roundtable discussions with other FIRREA agencies on a variety of staffing initiatives, concerns, and benchmarking activities
within the FIRREA community. The purpose is to explore best practices, share information, and discuss agency challenges. Participants include the FDIC, the CFTC, the Federal Housing Finance Administration, the OCC, NCUA, CFPB, Federal Reserve Board of Governors, and the Farm Credit Administration.
The Office of Support Operations (OSO) is working together with GSA to consolidate the SEC’s real estate portfolio nationwide. Since 2011, OSO and GSA have identified and pursued eight opportunities representing an estimated annual rent savings of up to $15.9 million by 2021, primarily by exiting leases and rightsizing rentable square footage requirements upon existing lease expirations.
106 | FY 2018 CONGRESSIONAL BUDGET JUSTIFICATION
Evidence Building
Internal and external evaluations play a significant role in monitoring and improving SEC program performance. Through objective measurement and analysis, agency managers determine the extent to which programs are achieving mission objectives allowing them to direct SEC resources accordingly. In FY 2016, there were seven Govern-ment Accountability Office (GAO) reports and eight Office of Inspector General reports related to agency operations. Beyond this, examples of reviews and evaluations that the agency has initiated and plan to continue are listed below.
• The agency will continue to advance broad-based reviews of core agency programs involving equity market structure and the effectiveness of its public company disclosure rules to protect investors and promote capital formation.
• The Division of Trading and Markets also continues work with staff at other applicable regulators to explore ways to improve price transparency and address potential regulatory gaps in the government securities markets.
• Through customer satisfaction surveys and other research, the Office of Investor Education
and Advocacy and the Office of the Investor Advocate will seek additional information regarding the behavior of individual investors, the type of information they need and use when making investment decisions, and the usefulness of SEC’s investor education programs and materials.
• The SEC reviews performance goal data on a quarterly basis through the Chairman’s Quarterly Operating Report, which was created to establish a performance measure monitoring process for the agency. Each quarter, the SEC’s performance improvement officer and the Chair-man’s Office review the status of performance goals and indicators to determine whether the agency is on target for achieving these goals for the fiscal year. The report includes the quarterly result for each performance goal or indicator and the progress achieved toward meeting the target for the fiscal year. This review process is in-line with OMB and Performance Improve-ment Council recommendations for frequent data-driven reviews.
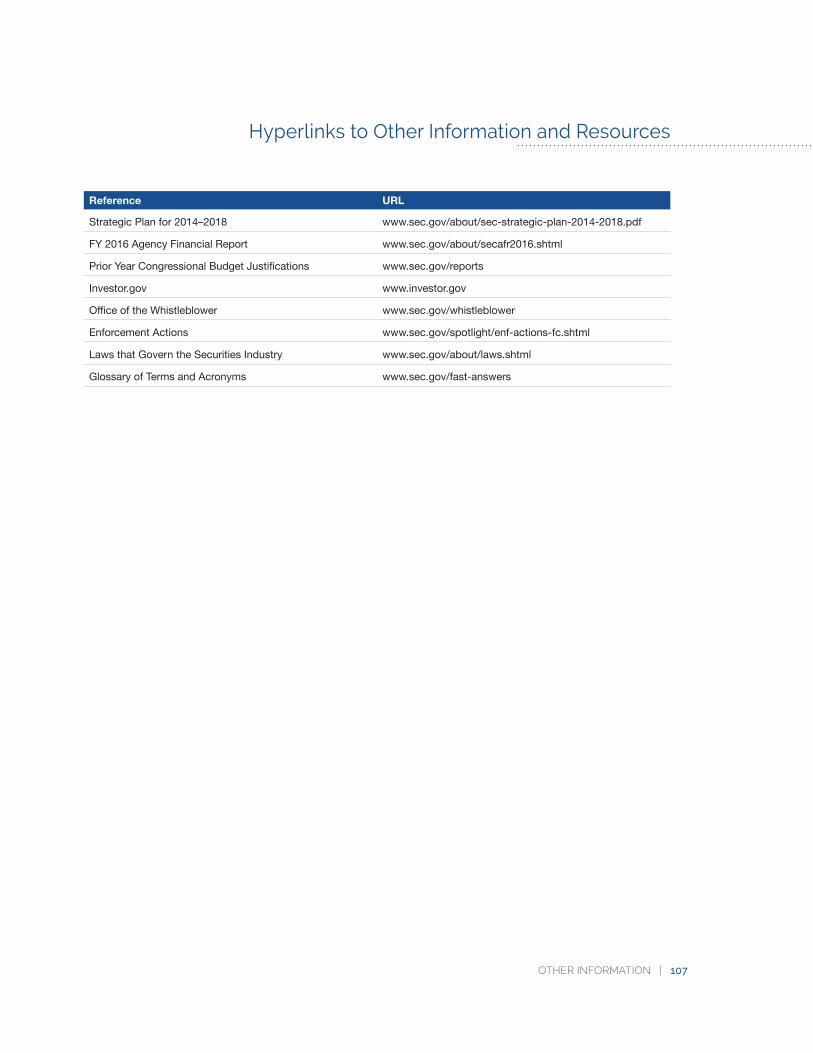
OTHER INFORMATION | 107
Hyperlinks to Other Information and Resources
Reference URL
Strategic Plan for 2014–2018 www.sec.gov/about/sec-strategic-plan-2014-2018.pdf
FY 2016 Agency Financial Report www.sec.gov/about/secafr2016.shtml
Prior Year Congressional Budget Justifications www.sec.gov/reports
Investor.gov www.investor.gov
Office of the Whistleblower www.sec.gov/whistleblower
Enforcement Actions www.sec.gov/spotlight/enf-actions-fc.shtml
Laws that Govern the Securities Industry www.sec.gov/about/laws.shtml
Glossary of Terms and Acronyms www.sec.gov/fast-answers
Appendices
Appendix A: SEC Divisions and Offices ...........................................................................................................111
Appendix B: Verification and Validation of Performance Data ..................................................114
Appendix C: SEC’s Responses to Government
Accountability Office Reports .....................................................................................................................115

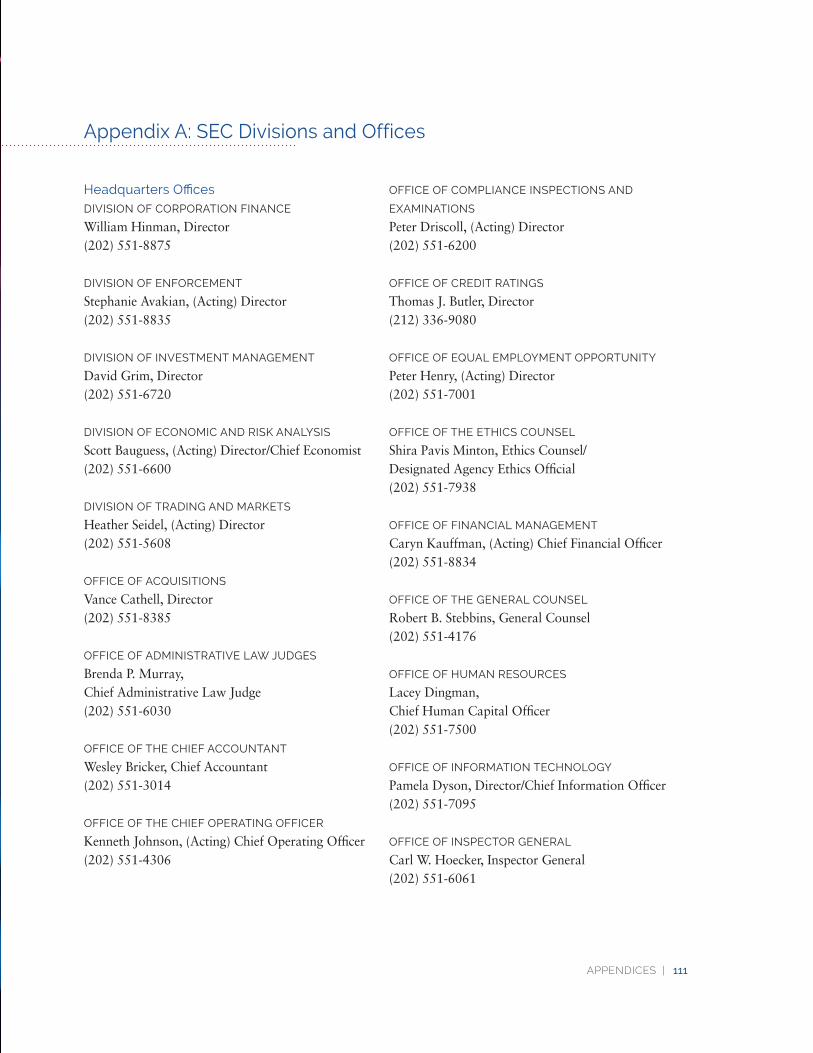
Appendix A: SEC Divisions and Offices
Headquarters OfficesDIVISION OF CORPORATION FINANCE
William Hinman, Director(202) 551-8875
DIVISION OF ENFORCEMENT
Stephanie Avakian, (Acting) Director (202) 551-8835
DIVISION OF INVESTMENT MANAGEMENT
David Grim, Director(202) 551-6720
DIVISION OF ECONOMIC AND RISK ANALYSIS
Scott Bauguess, (Acting) Director/Chief Economist(202) 551-6600
DIVISION OF TRADING AND MARKETS
Heather Seidel, (Acting) Director (202) 551-5608
OFFICE OF ACQUISITIONS
Vance Cathell, Director (202) 551-8385
OFFICE OF ADMINISTRATIVE LAW JUDGES
Brenda P. Murray,Chief Administrative Law Judge (202) 551-6030
OFFICE OF THE CHIEF ACCOUNTANT
Wesley Bricker, Chief Accountant(202) 551-3014
OFFICE OF THE CHIEF OPERATING OFFICER
Kenneth Johnson, (Acting) Chief Operating Officer (202) 551-4306
OFFICE OF COMPLIANCE INSPECTIONS AND
EXAMINATIONS
Peter Driscoll, (Acting) Director(202) 551-6200
OFFICE OF CREDIT RATINGS
Thomas J. Butler, Director (212) 336-9080
OFFICE OF EQUAL EMPLOYMENT OPPORTUNITY
Peter Henry, (Acting) Director(202) 551-7001
OFFICE OF THE ETHICS COUNSEL
Shira Pavis Minton, Ethics Counsel/ Designated Agency Ethics Official(202) 551-7938
OFFICE OF FINANCIAL MANAGEMENT
Caryn Kauffman, (Acting) Chief Financial Officer (202) 551-8834
OFFICE OF THE GENERAL COUNSEL
Robert B. Stebbins, General Counsel (202) 551-4176
OFFICE OF HUMAN RESOURCES
Lacey Dingman,Chief Human Capital Officer (202) 551-7500
OFFICE OF INFORMATION TECHNOLOGY
Pamela Dyson, Director/Chief Information Officer (202) 551-7095
OFFICE OF INSPECTOR GENERAL
Carl W. Hoecker, Inspector General (202) 551-6061
APPENDICES | 111
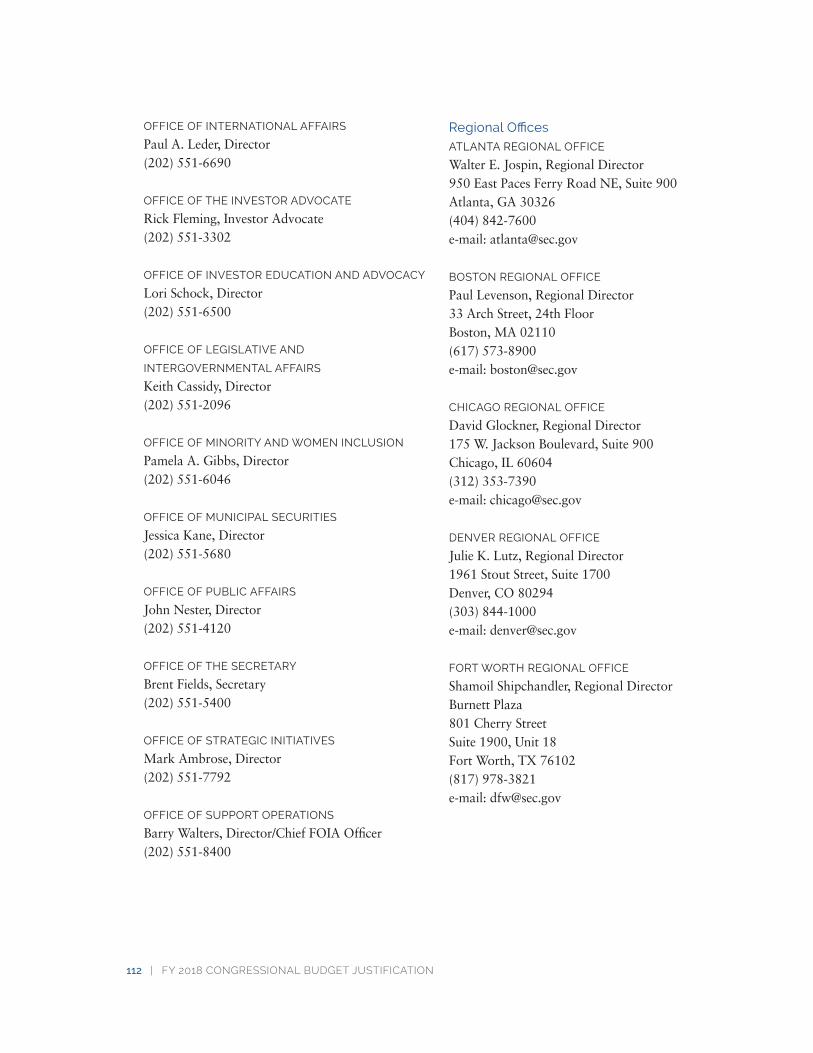
OFFICE OF INTERNATIONAL AFFAIRS
Paul A. Leder, Director(202) 551-6690
OFFICE OF THE INVESTOR ADVOCATE
Rick Fleming, Investor Advocate (202) 551-3302
OFFICE OF INVESTOR EDUCATION AND ADVOCACY
Lori Schock, Director(202) 551-6500
OFFICE OF LEGISLATIVE AND
INTERGOVERNMENTAL AFFAIRS
Keith Cassidy, Director(202) 551-2096
OFFICE OF MINORITY AND WOMEN INCLUSION
Pamela A. Gibbs, Director (202) 551-6046
OFFICE OF MUNICIPAL SECURITIES
Jessica Kane, Director (202) 551-5680
OFFICE OF PUBLIC AFFAIRS
John Nester, Director (202) 551-4120
OFFICE OF THE SECRETARY
Brent Fields, Secretary (202) 551-5400
OFFICE OF STRATEGIC INITIATIVES
Mark Ambrose, Director(202) 551-7792
OFFICE OF SUPPORT OPERATIONS
Barry Walters, Director/Chief FOIA Officer(202) 551-8400
Regional OfficesATLANTA REGIONAL OFFICE
Walter E. Jospin, Regional Director 950 East Paces Ferry Road NE, Suite 900Atlanta, GA 30326(404) 842-7600e-mail: [email protected]
BOSTON REGIONAL OFFICE
Paul Levenson, Regional Director 33 Arch Street, 24th FloorBoston, MA 02110(617) 573-8900e-mail: [email protected]
CHICAGO REGIONAL OFFICE
David Glockner, Regional Director 175 W. Jackson Boulevard, Suite 900 Chicago, IL 60604(312) 353-7390e-mail: [email protected]
DENVER REGIONAL OFFICE
Julie K. Lutz, Regional Director 1961 Stout Street, Suite 1700 Denver, CO 80294(303) 844-1000e-mail: [email protected]
FORT WORTH REGIONAL OFFICE
Shamoil Shipchandler, Regional DirectorBurnett Plaza801 Cherry StreetSuite 1900, Unit 18 Fort Worth, TX 76102 (817) 978-3821 e-mail: [email protected]
112 | FY 2018 CONGRESSIONAL BUDGET JUSTIFICATION
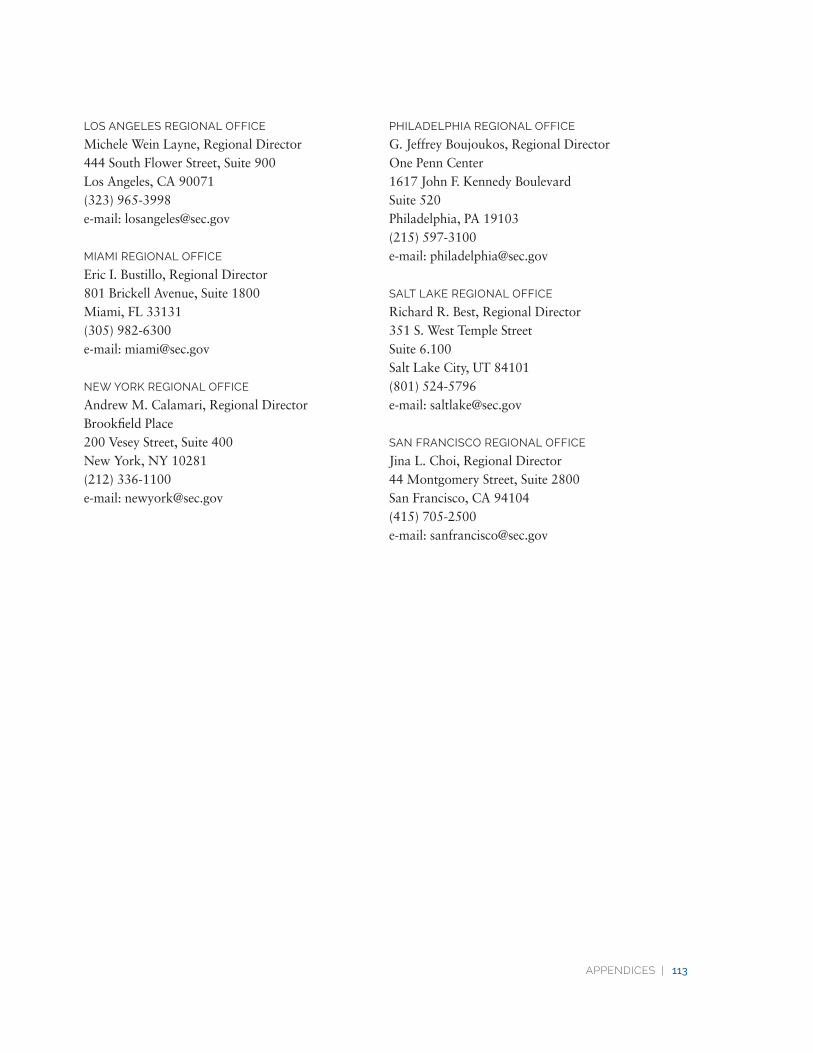
APPENDICES | 113
LOS ANGELES REGIONAL OFFICE
Michele Wein Layne, Regional Director 444 South Flower Street, Suite 900 Los Angeles, CA 90071(323) 965-3998e-mail: [email protected]
MIAMI REGIONAL OFFICE
Eric I. Bustillo, Regional Director 801 Brickell Avenue, Suite 1800 Miami, FL 33131(305) 982-6300e-mail: [email protected]
NEW YORK REGIONAL OFFICE
Andrew M. Calamari, Regional Director Brookfield Place200 Vesey Street, Suite 400New York, NY 10281(212) 336-1100e-mail: [email protected]
PHILADELPHIA REGIONAL OFFICE
G. Jeffrey Boujoukos, Regional Director One Penn Center1617 John F. Kennedy Boulevard Suite 520Philadelphia, PA 19103(215) 597-3100e-mail: [email protected]
SALT LAKE REGIONAL OFFICE
Richard R. Best, Regional Director 351 S. West Temple StreetSuite 6.100Salt Lake City, UT 84101(801) 524-5796e-mail: [email protected]
SAN FRANCISCO REGIONAL OFFICE
Jina L. Choi, Regional Director44 Montgomery Street, Suite 2800 San Francisco, CA 94104(415) 705-2500e-mail: [email protected]
114 | FY 2018 CONGRESSIONAL BUDGET JUSTIFICATION
Appendix B: Verification and Validation of Performance Data
The SEC’s programs require accurate data to properly assess program performance and make good management decisions. The SEC performs data verification and validation to evaluate whether data has been generated according to specifications, satisfy acceptance criteria, and is appropriate and consistent with its intended use. Data verification is a systematic process for evaluating a dataset compared to a series of standards regarding its completeness, correctness, and consistency, using the methods and criteria defined in the project documentation. Data validation follows the data verification process and uses information from the project documentation to ascertain the usability of the data in light of its objectives and to ensure that results obtained are scientifically defensible.
The SEC ensures that the performance data presented in this report is complete, reliable and accurate based upon the following assessment steps:
(1) The agency develops performance measures through its strategic planning process.
(2) The SEC’s divisions and offices perform steps to ensure that data used in the calculation of performance measures is accurate and reliable, including adequately documenting:
• The sources of the underlying data elements, and the procedures used to gather the data;
• The procedures used to obtain assurance as to the accuracy and reliability of the data; and
• The data definitions for reference, as well as the measure calculations.
(3) The divisions and offices calculate and report the performance measures to the Office of Finan-cial Management, and the measures are approved by division directors and office heads. This process ensures that the data used in the calculation of performance measures is accurate and reliable and that internal control is maintained through the approval process.
APPENDICES | 115
Appendix C: SEC’s Responses to Government Accountability Office Reports
This appendix provides the SEC’s responses to Government Accountability Office (GAO) reports that included recommendations for the agency head.
The following are examples of letters that were sent to each appropriate committee.
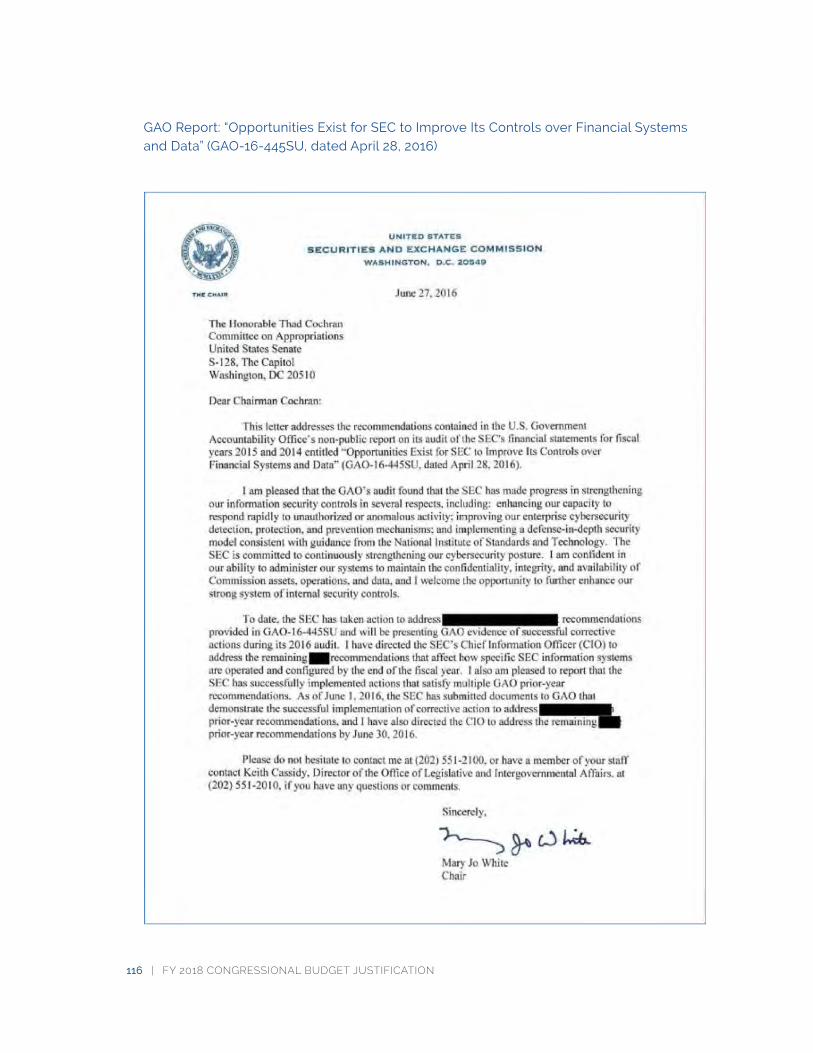
GAO Report: “Opportunities Exist for SEC to Improve Its Controls over Financial Systems and Data” (GAO-16-445SU, dated April 28, 2016)
116 | FY 2018 CONGRESSIONAL BUDGET JUSTIFICATION
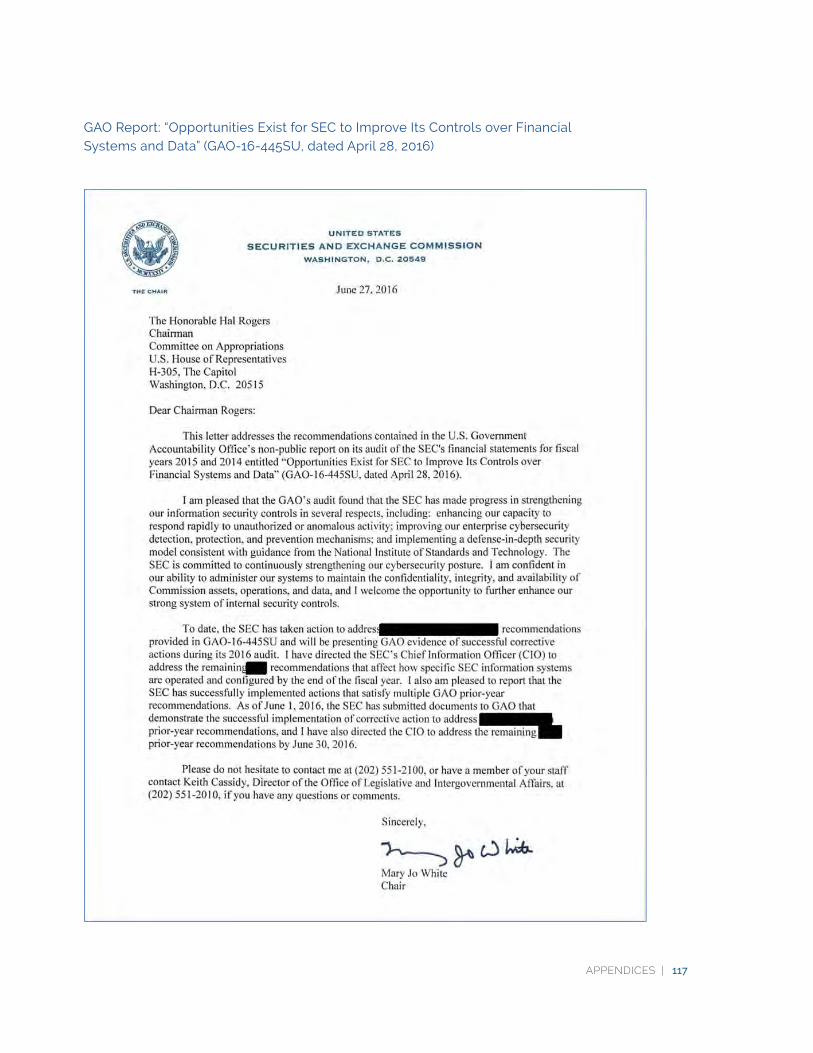
GAO Report: “Opportunities Exist for SEC to Improve Its Controls over Financial Systems and Data” (GAO-16-445SU, dated April 28, 2016)
APPENDICES | 117
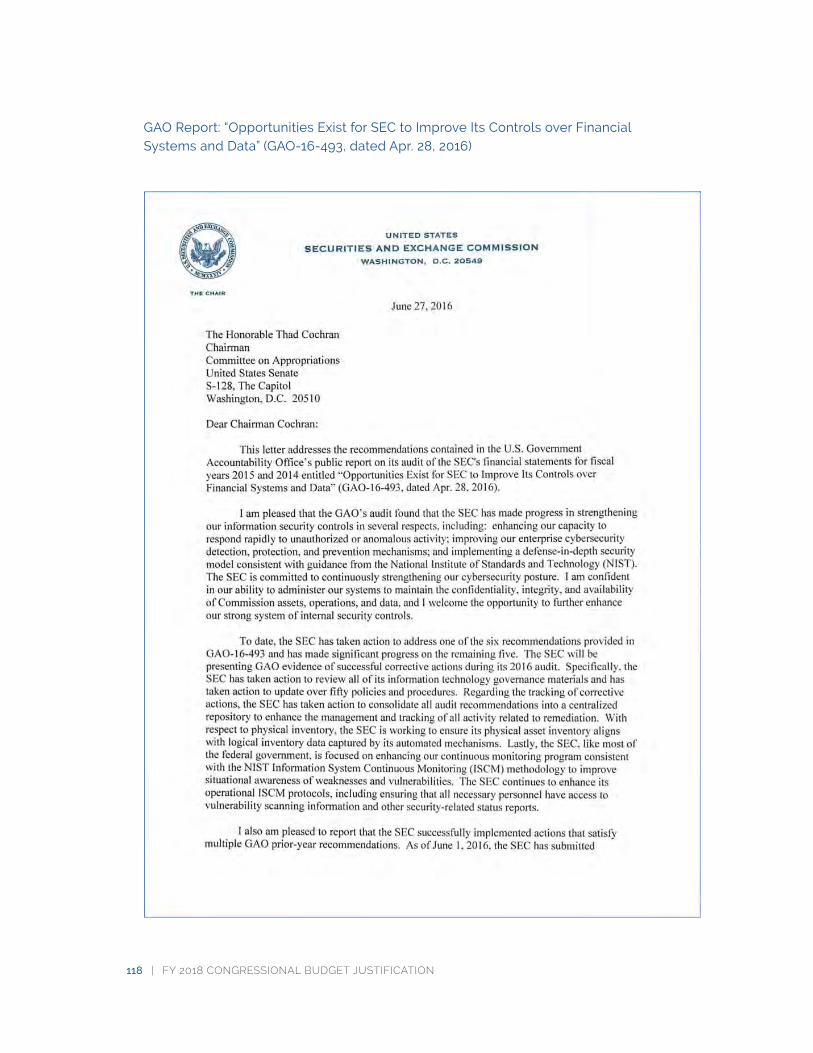
118 | FY 2018 CONGRESSIONAL BUDGET JUSTIFICATION
GAO Report: “Opportunities Exist for SEC to Improve Its Controls over Financial Systems and Data” (GAO-16-493, dated Apr. 28, 2016)
APPENDICES | 119
GAO Report: “Opportunities Exist for SEC to Improve Its Controls over Financial Systems and Data” (GAO-16-493, dated Apr. 28, 2016) (continued)
120 | FY 2018 CONGRESSIONAL BUDGET JUSTIFICATION
GAO Report: "Opportunities Exist for SEC to Improve Its Controls over Financial Systems and Data" (GAO-16-493, dated Apr. 28, 2016)
APPENDICES | 121
GAO Report: "Opportunities Exist for SEC to Improve Its Controls over Financial Systems and Data" (GAO-16-493, dated Apr. 28, 2016) (continued)
122 | FY 2018 CONGRESSIONAL BUDGET JUSTIFICATION
GAO Report: "Securities and Exchange Commission: Management Has Enhanced Supervisory Controls and Could Further Improve Efficiency" (GAO-17-16, dated October 6, 2016)
APPENDICES | 123
GAO Report: "Securities and Exchange Commission: Management Has Enhanced Supervisory Controls and Could Further Improve Efficiency" (GAO-17-16, dated October 6, 2016)
124 | FY 2018 CONGRESSIONAL BUDGET JUSTIFICATION
GAO Report: “Permanent Funding Authorities: Some Selected Entities Should Review Financial Management, Oversight, and Transparency Policies” (GAO-17-59, dated December 9, 2016)
APPENDICES | 125
GAO Report: “Permanent Funding Authorities: Some Selected Entities Should Review Financial Management, Oversight, and Transparency Policies” (GAO-17-59, dated December 9, 2016) (continued)
126 | FY 2018 CONGRESSIONAL BUDGET JUSTIFICATION
GAO Report: “Permanent Funding Authorities: Some Selected Entities Should Review Financial Management, Oversight, and Transparency Policies” (GAO-17-59, dated December 9, 2016)
APPENDICES | 127
GAO Report: “Permanent Funding Authorities: Some Selected Entities Should Review Financial Management, Oversight, and Transparency Policies” (GAO-17-59, dated December 9, 2016) (continued)
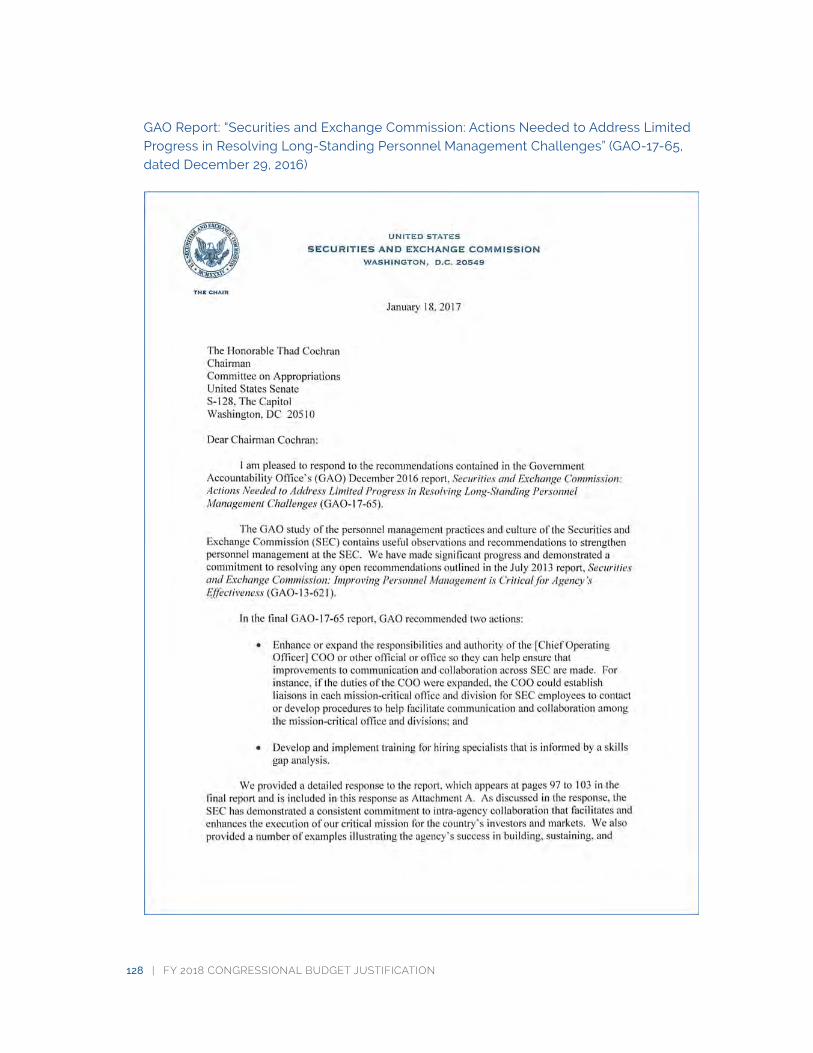
128 | FY 2018 CONGRESSIONAL BUDGET JUSTIFICATION
GAO Report: “Securities and Exchange Commission: Actions Needed to Address Limited Progress in Resolving Long-Standing Personnel Management Challenges” (GAO-17-65, dated December 29, 2016)
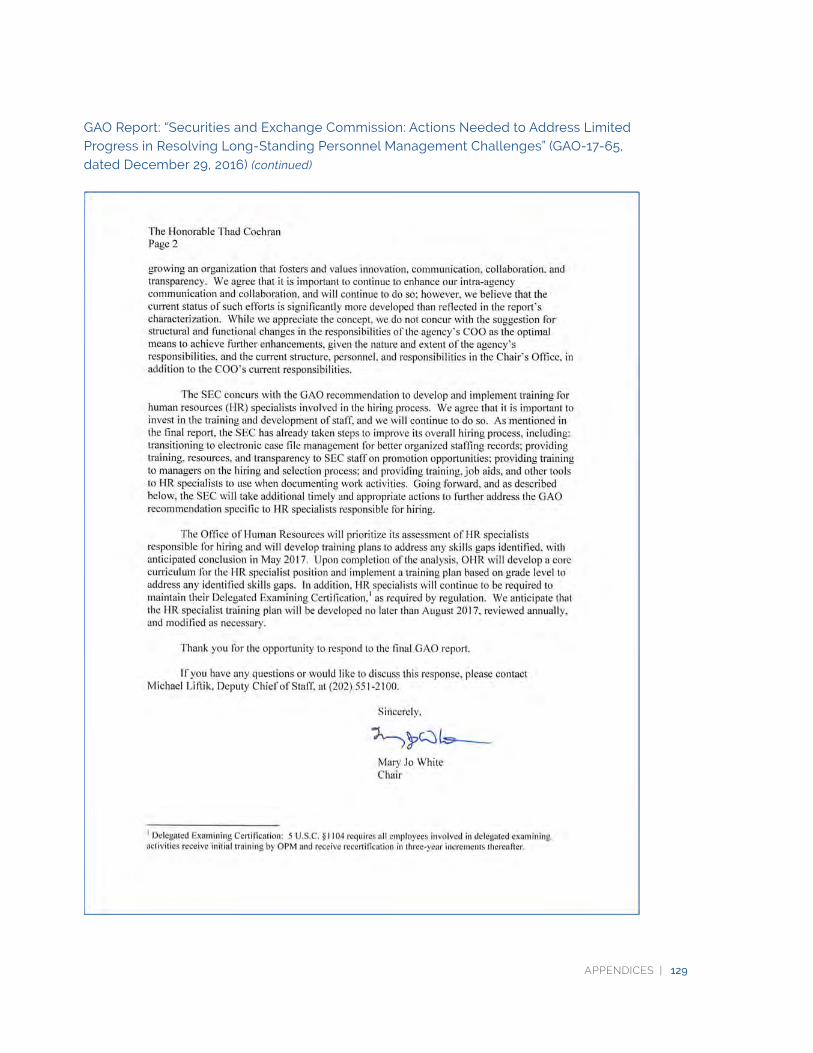
APPENDICES | 129
GAO Report: “Securities and Exchange Commission: Actions Needed to Address Limited Progress in Resolving Long-Standing Personnel Management Challenges” (GAO-17-65, dated December 29, 2016) (continued)
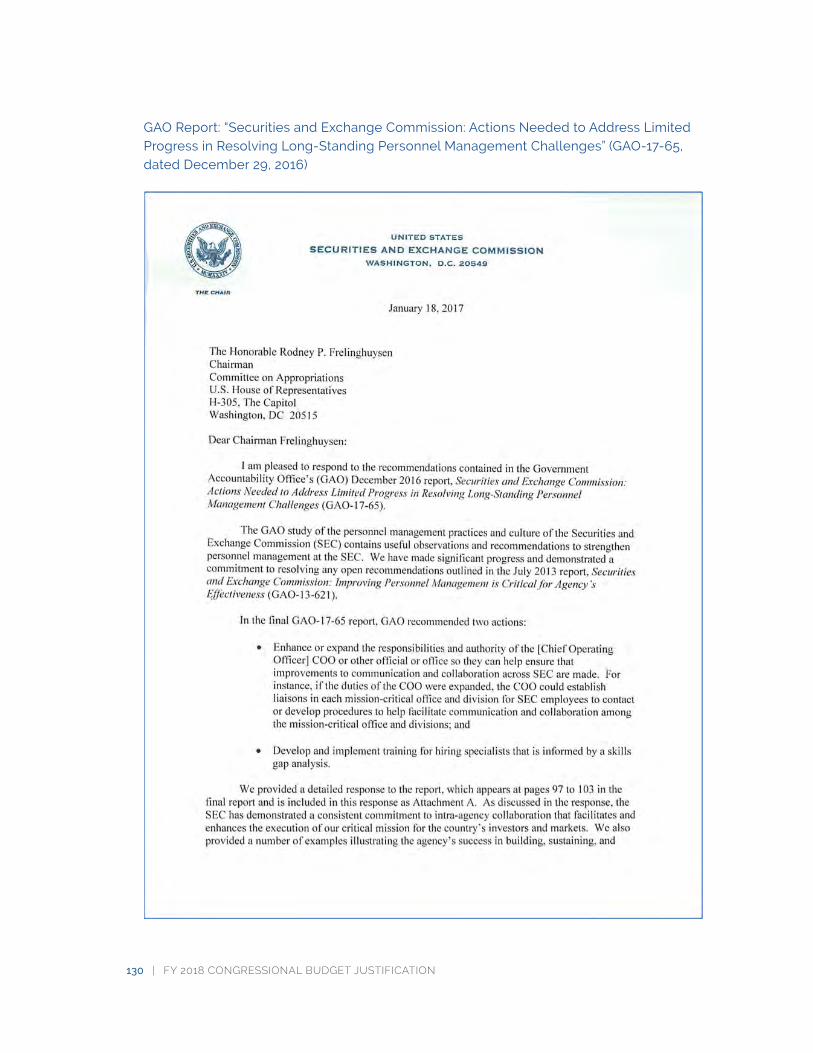
130 | FY 2018 CONGRESSIONAL BUDGET JUSTIFICATION
GAO Report: “Securities and Exchange Commission: Actions Needed to Address Limited Progress in Resolving Long-Standing Personnel Management Challenges” (GAO-17-65, dated December 29, 2016)
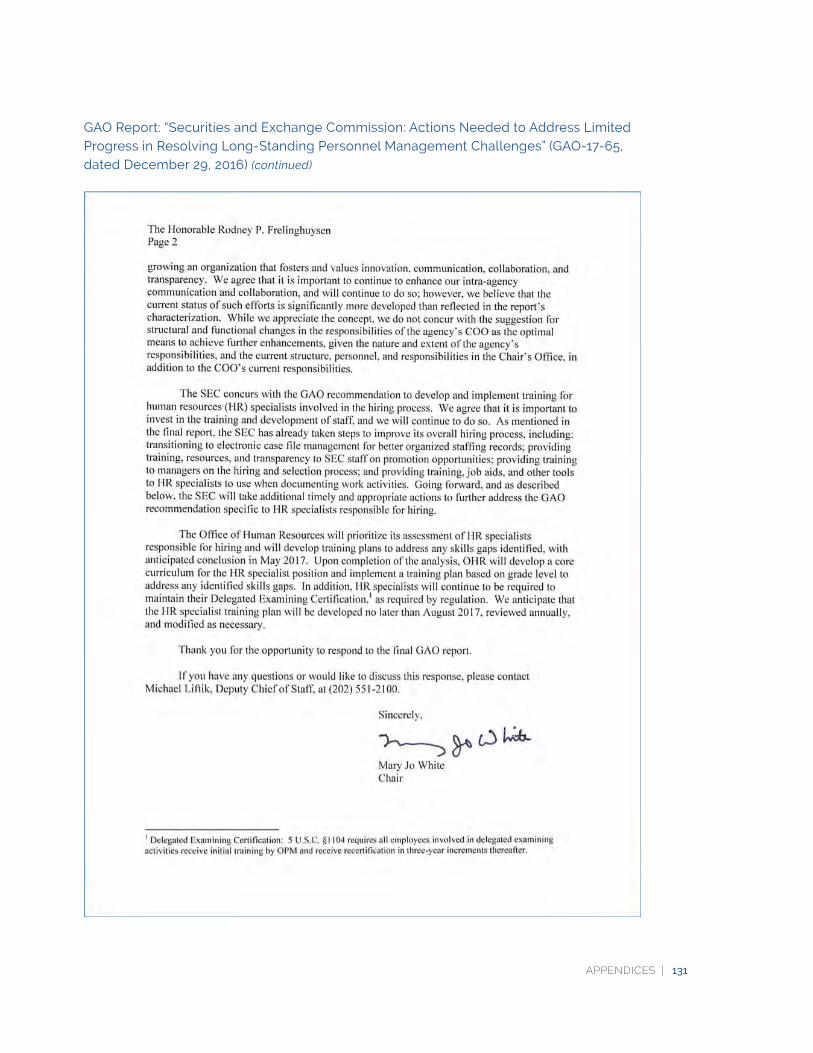
APPENDICES | 131
GAO Report: “Securities and Exchange Commission: Actions Needed to Address Limited Progress in Resolving Long-Standing Personnel Management Challenges” (GAO-17-65, dated December 29, 2016) (continued)
U.S. Securities and
Exchange Commission
100 F Street NE
Washington, DC 20549
www.sec.gov