

Fiscal Year 2016 Results FY17 Outlook · 2013 2014 2015 FY16 FY17 Guidance $1.61 $2.02 $2.01 $2.05...
29
1 Fiscal Year 2016 Results FY17 Outlook John Walsh President & CEO, UGI Kirk Oliver Chief Financial Officer, UGI Jerry Sheridan President & CEO, AmeriGas
Transcript of Fiscal Year 2016 Results FY17 Outlook · 2013 2014 2015 FY16 FY17 Guidance $1.61 $2.02 $2.01 $2.05...
1
Fiscal Year 2016 Results
FY17 Outlook
John Walsh
President & CEO, UGI
Kirk Oliver
Chief Financial Officer, UGI
Jerry Sheridan
President & CEO, AmeriGas

2
This presentation contains certain forward-looking statements that management
believes to be reasonable as of today’s date only. Actual results may differ
significantly because of risks and uncertainties that are difficult to predict and many
of which are beyond management’s control. You should read UGI’s Annual Report on
Form 10-K and quarterly reports on Form 10-Q for a more extensive list of factors
that could affect results. Among them are adverse weather conditions, cost volatility
and availability of all energy products, including propane, natural gas, electricity and
fuel oil, increased customer conservation measures, the impact of pending and
future legal proceedings, domestic and international political, regulatory and
economic conditions in the United States and in foreign countries, including the
current conflicts in the Middle East and those involving Russia, and currency
exchange rate fluctuations (particularly the euro), the timing of development of
Marcellus Shale gas production, the timing and success of our acquisitions,
commercial initiatives and investments to grow our business, and our ability to
successfully integrate acquired businesses and achieve anticipated synergies. UGI
undertakes no obligation to release revisions to its forward-looking statements to
reflect events or circumstances occurring after today.
About This Presentation

3
2016 Fiscal Year Recap
John Walsh
President & CEO, UGI

4
FY16 Earnings Recap
• Record earnings despite very warm
weather
• Significant contributions from
growth initiatives • Marcellus infrastructure projects
• Strong results from Finagaz $2.01 $2.05
$0.00
$0.50
$1.00
$1.50
$2.00
$2.50
FY-15 FY-16
Fiscal Year Weather
AmeriGas UGI
France
Midstream &
Marketing
Gas
Utility
Adjusted EPS1
1 Adjusted Earnings Per Share is a non-GAAP measure. See
Appendix for reconciliation. 2 Percent change in Heating Degree Days.
VERSUS
PRIOR
YEAR2
12.5%
Warmer 3.3%
Warmer
20.5%
Warmer
17.8%
Warmer
vs. Normal vs. Normal vs. Normal vs. Normal

5
-15.9%
-13.6%
-6.4%
-13.9% -15.4% -15.0%
-20.0%
-10.0%
0.0%
10.0%
Fiscal 2016 vs. Fiscal 2012
$1.25
$2.05
$-
$0.50
$1.00
$1.50
$2.00
$2.50
FY12 FY16
…64% higher Adjusted EPS1 Comparable weather…
Heating Degree Days versus Normal2
GA
S U
TILI
TIES
GA
S U
TILI
TIES
UG
I FR
AN
CE
UG
I FR
AN
CE
AM
ERIG
AS
AM
ERIG
AS
FY12 FY16
1 Adjusted Earnings Per Share is a non-GAAP measure. See Appendix for reconciliation. 2 Percent change in Heating Degree Days versus normal.

6
FY17 Guidance midpoint:
• 16% CAGR over FY16
• 10% CAGR over FY13
Fiscal 2017 Guidance
Key Drivers
Organic Growth
Strategic Investments
Return to normal weather
and volatility
$1.00
$1.60
$2.20
$2.80
2013 2014 2015 FY16 FY17Guidance
$1.61
$2.02 $2.01 $2.05
$2.30 – $2.451
Adjusted Earnings Per Share1
1 Adjusted Earnings Per Share is a non-GAAP measure. See Appendix for reconciliation. Because we are unable to predict certain potentially material items affecting diluted earnings
per share on a GAAP basis, principally mark-to-market gains and losses on commodity derivative instruments and Finagaz integration expenses, we cannot reconcile 2017 adjusted
diluted earnings per share, a non-GAAP measure, to diluted earnings per share, the most directly comparable GAAP measure, in reliance on the “unreasonable efforts” exception set
forth in SEC rules.

7
Midstream & Marketing Utility
FY16 Key Accomplishments – Natural Gas
• Successful $27 mm base rate case for UGI
Gas
• Executed a record amount of capital
investment
• Added ~16,000 new heating customers
• Cast iron and bare steel infrastructure
replacement programs are on track
• Sunbury pipeline: Began construction;
anticipate completion in FY17
• Manning LNG liquefaction: Began
construction; anticipate completion in FY17
• PennEast pipeline: Received draft
environmental impact statement in July;
expect final environmental impact
statement in February 2017

8
FY16 Key Accomplishments – Propane
AmeriGas
• Expanded all of our growth platforms
• M&A
• National Accounts
• ACE • Agreements with major retailers that
will add 1 million cylinders
International
• Earnings more than doubled on
strength of Finagaz acquisition
• Smaller acquisitions in Norway, U.K.
and Austria
• Finagaz integration on track

9
Financial Review
Kirk Oliver
Chief Financial Officer, UGI

10
FY16 Adjusted Earnings
FY
2016
FY
2015
Net income attributable to UGI Corporation $364.7 $281.0
Net after-tax gains (losses) on commodity derivative instruments1,2 (29.9) 53.3
Integration and acquisition expenses associated with Finagaz 17.3 14.9
Loss on extinguishments of debt2,3 7.9 4.6
Adjusted net income attributable to UGI Corporation $360.0 $353.8
1 Includes impact of rounding.
2 Income taxes associated with pre-tax adjustments determined using statutory business unit tax rates. 3 Loss on extinguishment of debt in the twelve months ended September 30, 2015 is included in interest expense on the Consolidated Statement of Income.
FY
2016
FY
2015
UGI Corporation - Diluted Earnings Per Share (GAAP) $2.08 $1.60
Net after-tax gains (losses) on commodity derivative instruments1,2 (0.17) 0.30
Acquisition and integration expenses associated with Finagaz 0.10 0.08
Loss on extinguishments of debt2,3 0.04 0.03
Adjusted diluted earnings per share $2.05 $2.01
11
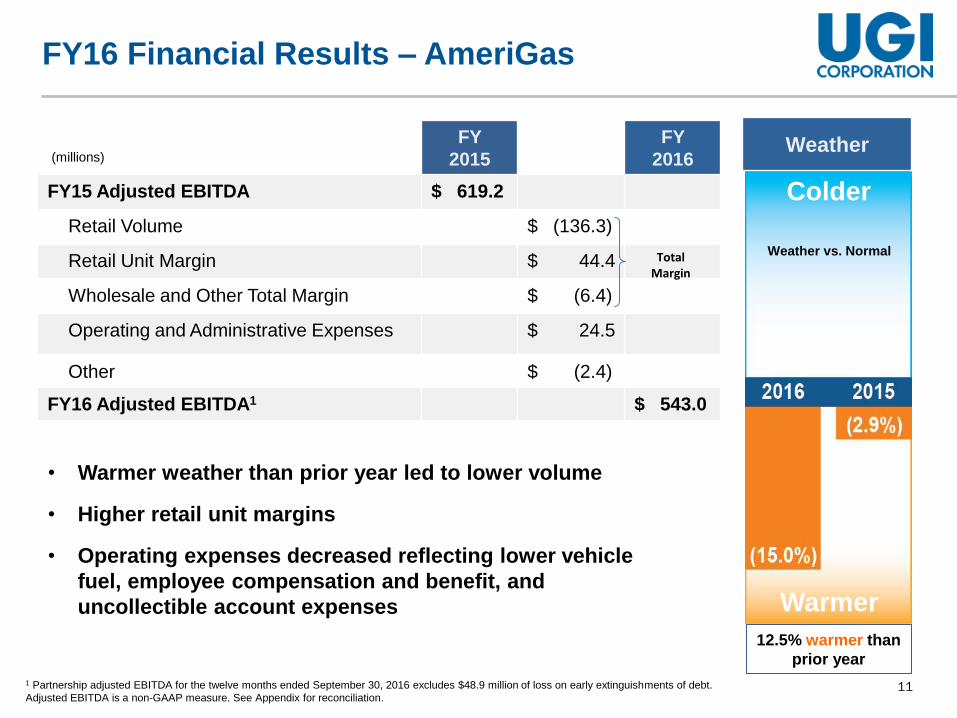
FY16 Financial Results – AmeriGas
Weather vs. Normal
12.5% warmer than
prior year
FY
2015
FY
2016
FY15 Adjusted EBITDA $ 619.2
Retail Volume $ (136.3)
Retail Unit Margin $ 44.4
Wholesale and Other Total Margin $ (6.4)
Operating and Administrative Expenses $ 24.5
Other $ (2.4)
FY16 Adjusted EBITDA1 $ 543.0
Total Margin
1 Partnership adjusted EBITDA for the twelve months ended September 30, 2016 excludes $48.9 million of loss on early extinguishments of debt.
Adjusted EBITDA is a non-GAAP measure. See Appendix for reconciliation.
(millions)
• Warmer weather than prior year led to lower volume
• Higher retail unit margins
• Operating expenses decreased reflecting lower vehicle
fuel, employee compensation and benefit, and
uncollectible account expenses
Colder
Warmer
Weather

12
FY16 Financial Results – UGI International
FY
2015
FY
2016
FY15 Income Before Taxes $ 76.4
Total Margin $ 276.5
Operating and Administrative Expenses $ (146.0)
Depreciation and Amortization $ (25.5)
Interest Expense, including loss on
extinguishments in prior year
$ 10.8
Other Operating Income $ (9.7)
FY16 Income Before Taxes $ 182.0
(millions) UGI France
Warmer
Colder
3.3% warmer than prior year
1 Adjusted Income Before Income Taxes is a Non-GAAP measure. See Appendix for reconciliation.
• Acquisition of Finagaz nearly doubled retail distribution in
France
• Higher unit margins at legacy businesses
Integration and Acquisition Expenses $ 22.6 $ 27.9
Loss on Debt Extinguishment $ 10.3 $ -
Adjusted Income Before Taxes1 $ 109.3 $ 209.9
Weather vs. Normal

13
FY16 Financial Results – Midstream & Marketing
FY
2015
FY
2016
FY15 Income Before Taxes $ 180.5
Total Margin $ (44.6)
Operating and Administrative Expenses $ 7.7
Depreciation and Amortization $ (2.6)
Other $ 3.6
FY16 Income Before Taxes $ 144.6
Colder
Weather vs. Normal
Warmer
20.5% warmer than
prior year
• Lower prices for pipeline capacity due to locational basis
differentials between Marcellus and non-Marcellus
delivery points
• Natural gas and retail power margins impacted by warmer
weather
• Higher margin in peaking and natural gas gathering
• Lower margin in capacity management, natural gas and
retail power, and electric generation
(millions) Weather

14
FY16 Financial Results – Utilities
FY
2015
FY
2016
FY15 Income Before Taxes $ 200.6
Total Margin $ (51.3)
Operating and Administrative Expenses $ 25.6
Depreciation and Amortization $ (3.8)
Interest Expense $ 3.5
Other Income and Expense, net $ (11.3)
FY16 Income Before Taxes $ 163.3
(millions)
• Lower core market throughput driven by significantly
warmer weather than the prior year
• Lower operating expenses
• Lower other income
Colder
Warmer 17.8% warmer than
prior year
Weather vs. Normal
Gas Utility

15
-$1200MM
-$600MM
$0MM
$600MM
$1200MM
-20%
-15%
-10%
-5%
0%
5%
10%
15%
20%
FY06 FY08 FY10 FY12 FY14 FY16
Strong Cash Flow and Balance Sheet
Weather vs.
Normal
Cash Flow From
Operations
• Strong and consistent cash
flow despite fluctuations of
weather
• Strong balance sheet with
capacity
• No need to access the capital
markets in the near term
• Recent AmeriGas refinancing
extends the maturity profile
while reducing interest rates
AmeriGas weather vs. Normal
Utility weather vs. Normal
Cash Flow from Operations
$1.2B
$0.6B
$0

16
Fiscal Year Recap
Jerry Sheridan
President & CEO, AmeriGas

17
FY16 Adjusted EBITDA1
Retail volumes sold for FY16
decreased 10% to 1.07 billion
gallons from 1.18 billion
gallons in the prior year
2nd warmest year in 121 years
$619
$543
$0
$100
$200
$300
$400
$500
$600
$700
FY15 FY16
1 Adjusted EBITDA is a non-GAAP measure. See appendix for reconciliation.

18
Growth Initiatives
National Accounts
Added 39 accounts and renewed 40 agreements
AmeriGas Cylinder Exchange
Added new business that represents sales of ~ 1 million cylinders
M&A
Closed six tuck-in acquisitions adding ~10 million gallons annually

19
Continuing to Deliver Value
12th consecutive annual distribution increase
Outstanding total unitholder returns:
Annualized Total Returns
1 Year 5 Year 10 Year
19.8% 8.8% 12.2%
Looking ahead we expect adjusted EBITDA of
$660 – $700 million in FY171
1 Because we are unable to predict certain potentially material items affecting net income on a GAAP basis, principally mark-to-market gains and losses on commodity derivative
instruments, we cannot reconcile 2017 Adjusted EBITDA, a non-GAAP measure, to net income attribute to AmeriGas Partners, L.P., the most directly comparable GAAP measure,
in reliance on the “unreasonable efforts” exception set forth in SEC rules. Adjustments that management can reasonably estimate are provided in the appendix.

20
Conclusion
John Walsh
President & CEO, UGI

21
• Demand and limited capacity additions will
continue to stress the gas system
• Sunbury and PennEast will help bridge the
infrastructure gap
• Peak demand driving LNG infrastructure
• $60 million Manning liquefaction plant
• Smaller investments in storage,
vaporization, and fueling
• Capex nearly tripled from FY11-
FY16
• Expect capital spend over next 4
years will be 40% higher than past
four years
• Growth through new customer
additions and higher rate base
MIDSTREAM & MARKETING UGI UTILITIES
INTERNATIONAL AMERIGAS
• Continued integration activities in FY17
• Potential for continued M&A growth
• M&A, National Accounts, Cylinder
Exchange will continue driving growth
• Will continue deploying technology to
drive efficiency and improve the
customer experience
MIDSTREAM & MARKETING
Segment Outlook

22
Conclusion
Outlook is very promising
Several investments that came online in past 18 months will
contribute to earnings
Cash flow and balance sheet strength to fund active projects
with additional capacity for investment
UGI IS CONTINUING TO DELIVER

23
Appendix

24
Management uses "adjusted net income attributable to UGI" and "adjusted diluted earnings per share“ (sometimes also
referred to as “adjusted earnings per share”), both of which are non-GAAP financial measures, when evaluating UGI's
overall performance. Adjusted net income attributable to UGI is net income attributable to UGI Corporation after excluding
net after-tax gains and losses on commodity derivative instruments not associated with current period transactions, loss
on extinguishment of debt, Finagaz integration and acquisition expenses and the retroactive impact of a change in French
tax law. Volatility in net income at UGI can occur as a result of gains and losses on commodity derivative instruments not
associated with current period transactions but included in earnings in accordance with U.S. generally accepted
accounting principles ("GAAP"). Midstream & Marketing records gains and losses on commodity derivative instruments not
associated with current-period transactions in cost of sales or revenues for all periods presented. Effective October 1,
2014, UGI International determined that on a prospective basis it would not elect cash flow hedge accounting for its
commodity derivative transactions and also de-designated its then-existing commodity derivative instruments accounted
for as cash flow hedges. Also effective October 1, 2014, AmeriGas Propane de-designated its remaining commodity
derivative instruments accounted for as cash flow hedges. Previously, AmeriGas Propane had discontinued cash flow
hedge accounting for all commodity derivative instruments entered into beginning April 1, 2014.
Non-GAAP financial measures are not in accordance with, or an alternative to, GAAP and should be considered in
addition to, and not as a substitute for, the comparable GAAP measures. Management believes that these non-GAAP
measures provide meaningful information to investors about UGI’s performance because they eliminate the impact of (1)
gains and losses on commodity derivative instruments not associated with current-period transactions and (2) other
discrete items that can affect the comparison of period-over-period results.
The following table reconciles net income attributable to UGI Corporation, the most directly comparable GAAP measure, to
adjusted net income attributable to UGI Corporation, and reconciles diluted earnings per share, the most comparable
GAAP measure, to adjusted diluted earnings per share, to reflect the adjustments referred to above.
UGI Supplemental Footnotes

25
Non-GAAP Reconciliation
(Million of dollars, except per share amounts) 2016 2015 2014 2013 2012
NON-GAAP RECONCILIATION:
Adjusted net income attributable to UGI Corporation:
Net income attributable to UGI Corporation 364.7$ 281.0$ 337.2 278.1$ 210.2
Net (gains) losses on commodity derivative instruments not associated with current-period
transactions (net of tax of $13.5, $(30.9), $(4.5), $3.1 and $6.3, respectively) (a) (b)(29.9) 53.3 6.6 (4.3) (8.9)
Integration and acquisition expenses associated with Finagaz acquired on May 29, 2015 (net of tax
of $(10.6), $(7.7), $(2.2), $0 and $0, respectively) (a)17.3 14.9 4.3 - -
Loss on extinguishments of debt (net of tax of $(5.0), $0, $0, $0 and $(1.4), respectively) (a) 7.9 - - - 2.2
Costs associated with extinguishment of debt (net of tax of $0, $(5.7), $0, $0 and $0, respectively)
(a) (c)- 4.6 - - -
Impact of retroactive change in French tax law - - 5.7 - -
Integration and acquisition expenses associated with the retail propane businesses of Energy
Transfer Partners, L.P. (“Heritage Propane”) acquired by the Partnership on January 12, 2012 (net
of tax of $0, $0, $0, $(2.8) and $(5.6), respectively) (a)
- - - $4.4 $8.8
Adjusted net income attributable to UGI Corporation (d) 360.0$ 353.8$ 353.8$ 278.2$ 212.3$
Adjusted earnings per common share attributable to UGI stockholders:
UGI Corporation earnings per share - diluted 2.08$ 1.60$ 1.92$ 1.60$ 1.24$ Net (gains) losses on commodity derivative instruments not associated with current-period
transactions (b)(0.17) 0.30 0.04 (0.02) (0.05)
Integration and acquisition expenses associated with Finagaz acquired on May 29, 2015 0.10 0.08 0.03 - -
Loss on extinguishments of debt 0.04 - - - 0.01
Costs associated with extinguishment of debt - 0.03 - - -
Impact of retroactive change in French tax law - - $0.03 - -
Integration and acquisition expenses associated with the Heritage Propane acquisition on January
12, 2012- - - 0.03 0.05
Adjusted diluted earnings per share (d) 2.05$ 2.01$ 2.02$ 1.61$ 1.25$
(d) Management uses "adjusted net income attributable to UGI" and "adjusted diluted earnings per share," both of which are non-GAAP financial measures,
when evaluating UGI's overall performance. Adjusted net income attributable to UGI is net income attributable to UGI after excluding net after-tax gains and
losses on commodity derivative instruments not associated with current-period transactions (principally comprising unrealized gains and losses on commodity
derivative instruments), losses on extinguishments of debt, Finagaz and Heritage Propane integration and acquisition expenses and the impact of a retroactive
change in French tax law.
(c) Costs associated with extinguishment of debt in 2015 are included in interest expense on the Consolidated Statements of Income.
(b) Includes the effects of rounding.
(a) Income taxes associated with pre-tax adjustments determined using statutory business unit tax rate.
Year Ended September 30,

26
The enclosed supplemental information contains a reconciliation of earnings before interest expense, income taxes, depreciation and amortization ("EBITDA") and Adjusted EBITDA to Net Income.
EBITDA and Adjusted EBITDA are not measures of performance or financial condition under accounting principles generally accepted in the United States ("GAAP"). Management believes EBITDA and Adjusted EBITDA are meaningful non-GAAP financial measures used by investors to compare the Partnership's operating performance with that of other companies within the propane industry. The Partnership's definitions of EBITDA and Adjusted EBITDA may be different from those used by other companies.
EBITDA and Adjusted EBITDA should not be considered as alternatives to net income (loss) attributable to AmeriGas Partners, L.P. Management uses EBITDA to compare year-over-year profitability of the business without regard to capital structure as well as to compare the relative performance of the Partnership to that of other master limited partnerships without regard to their financing methods, capital structure, income taxes or historical cost basis. Management uses Adjusted EBITDA to exclude from AmeriGas Partners’ EBITDA gains and losses that competitors do not necessarily have to provide additional insight into the comparison of year-over-year profitability to that of other master limited partnerships. In view of the omission of interest, income taxes, depreciation and amortization from EBITDA and Adjusted EBITDA, management also assesses the profitability of the business by comparing net income attributable to AmeriGas Partners, L.P. for the relevant years. Management also uses EBITDA to assess the Partnership's profitability because its parent, UGI Corporation, uses the Partnership's EBITDA to assess the profitability of the Partnership, which is one of UGI Corporation’s business segments. UGI Corporation discloses the Partnership's EBITDA in its disclosures about its business segments as the profitability measure for its domestic propane segment.
AmeriGas Supplemental Footnotes

27
AmeriGas Adjusted EBITDA
(Millions of dollars) Year Ended September 30,
EBITDA and Adjusted EBITDA: 2016 2015
Net income attributable to AmeriGas Partners 207.0$ 211.2$
Income tax (benefit) expense (a) (1.6) 2.9
Interest expense 164.1 162.8
Depreciation 146.8 152.2
Amortization 43.2 42.7
EBITDA 559.5 571.8
(Subtract net gains) add net losses on commodity derivative
instruments not associated with current-period transactions(66.1) 47.8
Add loss on extinguishments of debt 48.9 -
Noncontrolling interest in net gains (losses) on commodity
derivative instruments not associated with current-period
transactions
0.7 (0.4)
Adjusted EBITDA 543.0$ 619.3$
(a) Includes the impact of rounding.

28
AmeriGas Adjusted EBITDA Guidance
(Low End) (High End)
Adjusted EBITDA (estimate) 660,000$ 700,000$
Interest expense (estimate) 160,000 159,000
Income tax expense (estimate) 3,000 3,000
Depreciation (estimate) 141,000 141,000
Amortization (estimate) 43,000 43,000
Forecast Fiscal Year
Ending September 30, 2017
(Thousands)


