
Fiscal Policy Response to External Crises: The Case of Moldova ...
33
Fiscal Policy Response to External Crises: The Case of Moldova 1998-2010 Driton Qehaja WP/12/82
-
Upload
hoangthuan -
Category
Documents
-
view
222 -
download
1
Transcript of Fiscal Policy Response to External Crises: The Case of Moldova ...
Fiscal Policy Response to External Crises:
The Case of Moldova 1998-2010
Driton Qehaja
WP/12/82
© 2012 International Monetary Fund WP/12/82
IMF Working Paper
European Department
Fiscal Policy Response to External Crises: The Case of Moldova 1998-2010
Prepared by Driton Qehaja1
Authorized for distribution by Nikolay Gueorguiev
March 2012
Abstract
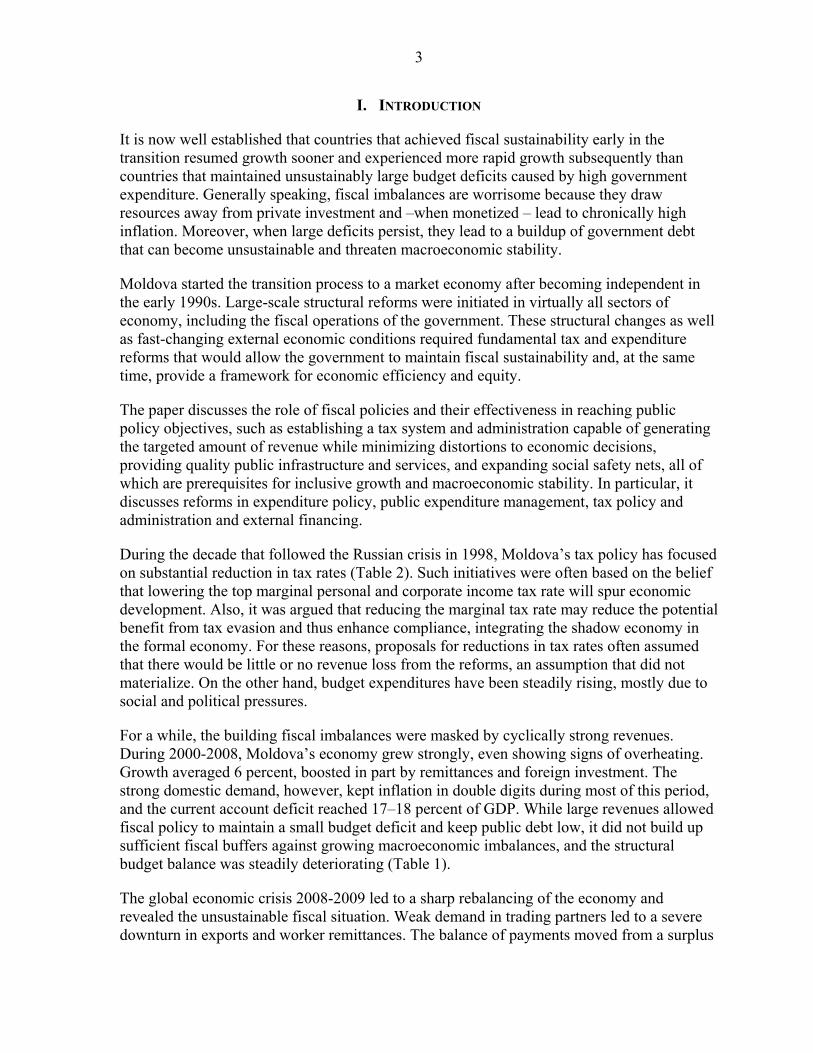
External shocks pose major challenges to fiscal policy makers through lower output and large fiscal imbalances. This paper analyzes the case of Moldova, which faced parallel crises a decade apart: the Russian crisis of 1998 and the global financial crisis of 2008-2009. The country went through large fiscal adjustments during these crises and launched important fiscal reforms. The paper reviews the crises and reform experience. In particular, it aims to explain the motivation for reforms, describe reform design and implementation, and provide an understanding of their outcomes. The paper also catalogues the form and size of international assistance for Moldova.
JEL Classification Numbers: H5, H6, H8
Keywords: Moldova, Fiscal policy, structural fiscal balance, international assistance.
Author’s E-Mail Address: [email protected] 1 This paper was prepared while the author was a special appointee with the IMF’s Moldova team. All remaining errors are entirely mine.
This Working Paper should not be reported as representing the views of the IMF. The views expressed in this Working Paper are those of the author(s) and do not necessarily represent those of the IMF or IMF policy. Working Papers describe research in progress by the author(s) and are published to elicit comments and to further debate.
2
Contents Page
Abstract ......................................................................................................................................1
I. Introduction ............................................................................................................................3
II. Fiscal Policy - Structural and Cyclical Developments ..........................................................4
III. Revenue and Tax Policy Developments ..............................................................................7
IV. General Government Expenditure Developments .............................................................13
V. International Assistance for the General Government ........................................................19
VI. Recommendations for Future Reforms ..............................................................................23
VII. Conclusion ........................................................................................................................27
Tables 1. Headline and Structural Fiscal Balances of the General Government, 1998–2010 ...............6 2. Main Changes in Tax Policy ..................................................................................................8 3. Moldova and Selected Countries: Tax Revenue Breakdown, 2009 ......................................9 4. Moldova and Selected Countries: General Government Expenditures, 2009 .....................13 5. Total External Loans by Donor, 2000–2010 ........................................................................19 6. External Grants and Loans to the Budget, 2000–2010 ........................................................20
Figures 1. Budget Balance, 1998–2010 ..................................................................................................6 2. Tax Revenue Structure, 1998–2010 .....................................................................................11 3. Structure of Expenditures, 1998–2010 ................................................................................14 4. Education Trends, 2000–2009 .............................................................................................18 5. International Assistance, 2000–2010 ...................................................................................22
Boxes 1. The Ten Most Common Arguments Against Tax Incentives ................................................7 2. Direct Taxes .........................................................................................................................10 3. Indirect Taxes .......................................................................................................................11 4. Pension System Reforms .....................................................................................................15 5. Moldova and the IMF ..........................................................................................................21 6. Milestones for Donor Coordination .....................................................................................23 7. Multilateral, Bilateral and Commercial Creditors in the Medium term ...............................26
Appendixes I. General Government Budget, 1998–2010 ............................................................................28 II. Public Sector Debt Sustainability Framework, Baseline Scenario, 2004–2010 .................29
References ................................................................................................................................30
3
I. INTRODUCTION
It is now well established that countries that achieved fiscal sustainability early in the transition resumed growth sooner and experienced more rapid growth subsequently than countries that maintained unsustainably large budget deficits caused by high government expenditure. Generally speaking, fiscal imbalances are worrisome because they draw resources away from private investment and –when monetized – lead to chronically high inflation. Moreover, when large deficits persist, they lead to a buildup of government debt that can become unsustainable and threaten macroeconomic stability.
Moldova started the transition process to a market economy after becoming independent in the early 1990s. Large-scale structural reforms were initiated in virtually all sectors of economy, including the fiscal operations of the government. These structural changes as well as fast-changing external economic conditions required fundamental tax and expenditure reforms that would allow the government to maintain fiscal sustainability and, at the same time, provide a framework for economic efficiency and equity.
The paper discusses the role of fiscal policies and their effectiveness in reaching public policy objectives, such as establishing a tax system and administration capable of generating the targeted amount of revenue while minimizing distortions to economic decisions, providing quality public infrastructure and services, and expanding social safety nets, all of which are prerequisites for inclusive growth and macroeconomic stability. In particular, it discusses reforms in expenditure policy, public expenditure management, tax policy and administration and external financing.
During the decade that followed the Russian crisis in 1998, Moldova’s tax policy has focused on substantial reduction in tax rates (Table 2). Such initiatives were often based on the belief that lowering the top marginal personal and corporate income tax rate will spur economic development. Also, it was argued that reducing the marginal tax rate may reduce the potential benefit from tax evasion and thus enhance compliance, integrating the shadow economy in the formal economy. For these reasons, proposals for reductions in tax rates often assumed that there would be little or no revenue loss from the reforms, an assumption that did not materialize. On the other hand, budget expenditures have been steadily rising, mostly due to social and political pressures.
For a while, the building fiscal imbalances were masked by cyclically strong revenues. During 2000-2008, Moldova’s economy grew strongly, even showing signs of overheating. Growth averaged 6 percent, boosted in part by remittances and foreign investment. The strong domestic demand, however, kept inflation in double digits during most of this period, and the current account deficit reached 17–18 percent of GDP. While large revenues allowed fiscal policy to maintain a small budget deficit and keep public debt low, it did not build up sufficient fiscal buffers against growing macroeconomic imbalances, and the structural budget balance was steadily deteriorating (Table 1).
The global economic crisis 2008-2009 led to a sharp rebalancing of the economy and revealed the unsustainable fiscal situation. Weak demand in trading partners led to a severe downturn in exports and worker remittances. The balance of payments moved from a surplus

4
to a deficit as foreign direct investment and other capital inflows fell dramatically. Unemployment rose significantly. The effects of the crisis and pre-election spending resulted in a large fiscal gap in 2009. In the run-up to the highly contested elections, the government increased pensions and public sector wages while public revenues declined.
The crisis revealed the need for deep fiscal structural reforms of both revenue and expenditure. These reforms have formed the focus of the government’s efforts since late 2009. On the revenue side, reforms have aimed to restore a sustainable revenue level and structure and significantly improve tax administration. As for expenditure, rationalization of current expenditure has gone hand-in-hand with increasing the amounts allocated to social assistance and investment. The paper recommends directions for future reforms expected to contribute to sustained outcomes.
The paper outlines the role of international community in helping the government to stabilize the economy. Through technical assistance, policy advice, and program arrangements, the IMF has supported Moldova’s reforms since 1993. Most recently, a three-year program under the Extended Credit Facility (ECF) and the Extended Fund Facility (EFF) arrangements was approved on January 29, 2010 (Box 5). The program is designed to gradually restore fiscal and external sustainability while protecting the poor, implement flexible monetary policy focused on price stability, ensure financial stability, and raise growth. The World Bank has taken the lead in the policy dialogue on a number of structural issues relevant to economic growth and poverty reduction, including private sector development, infrastructure, health, education, social protection, and agricultural sector reforms. The European Commission (EC) is becoming an increasingly important international partner, supporting institutional capacity building and a number of sectors including agriculture, education, road construction, energy, and trade through loans and technical assistance. The EBRD and the EIB are active in the sectors of banking, winemaking, and infrastructure as well.
The paper is structured into seven sections. Section II briefly explores the ebbs and flows of fiscal adjustment that was undertaken in Moldova in 1998-2010. Section III outlines the major characteristics of the tax system and administration. Section IV reviews expenditure developments and composition of government expenditure. Section V reviews the structures and dynamics of international assistance as well as donor coordination. Section VI reviews short-term expenditure-rationalization and revenue-enhancing measures that are essential to stop further deterioration of Moldova’s fiscal balances. However, they need to be complemented by targeted structural reforms to ensure durable solutions. Section VII concludes.
II. FISCAL POLICY - STRUCTURAL AND CYCLICAL DEVELOPMENTS
Moldova has large public investment and human development needs; at the same time, sustained domestic growth and improvement in human development indicators will not be possible without ensuring macroeconomic stabilization and strong private sector development. Finding the right balance between increasing public spending in key targeted areas and maintaining fiscal sustainability has been a key challenge for the design of fiscal policy in the past ten years.
5
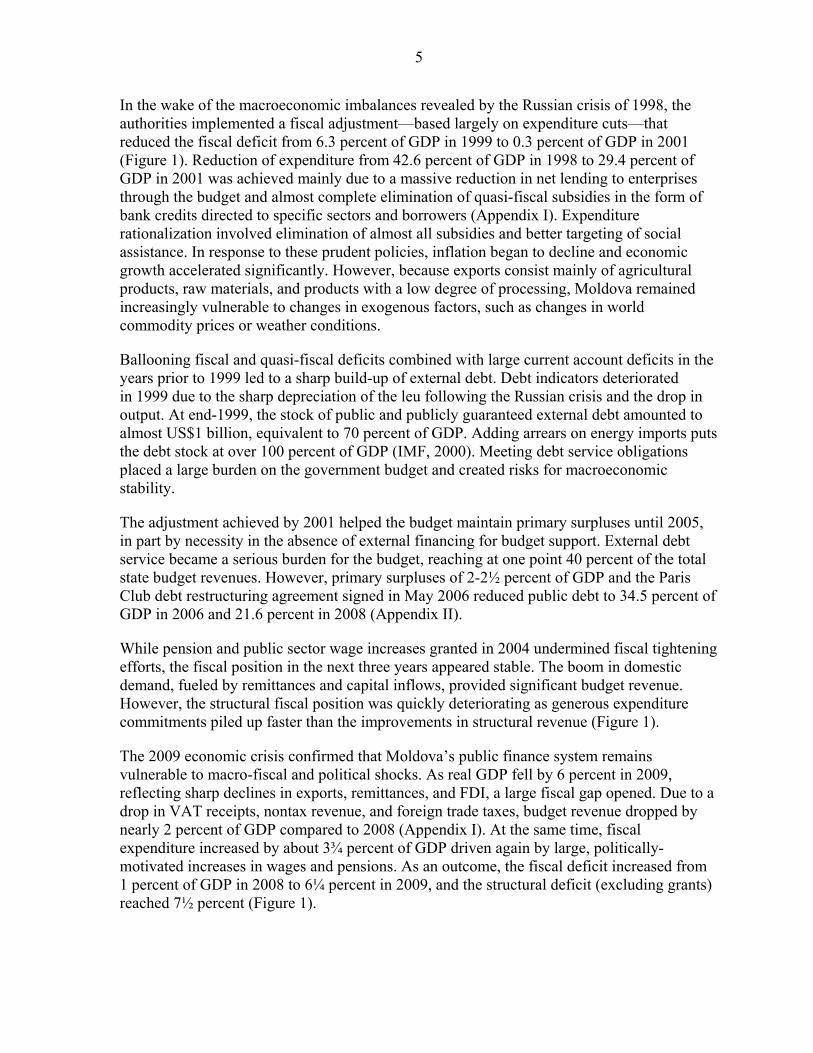
In the wake of the macroeconomic imbalances revealed by the Russian crisis of 1998, the authorities implemented a fiscal adjustment—based largely on expenditure cuts—that reduced the fiscal deficit from 6.3 percent of GDP in 1999 to 0.3 percent of GDP in 2001 (Figure 1). Reduction of expenditure from 42.6 percent of GDP in 1998 to 29.4 percent of GDP in 2001 was achieved mainly due to a massive reduction in net lending to enterprises through the budget and almost complete elimination of quasi-fiscal subsidies in the form of bank credits directed to specific sectors and borrowers (Appendix I). Expenditure rationalization involved elimination of almost all subsidies and better targeting of social assistance. In response to these prudent policies, inflation began to decline and economic growth accelerated significantly. However, because exports consist mainly of agricultural products, raw materials, and products with a low degree of processing, Moldova remained increasingly vulnerable to changes in exogenous factors, such as changes in world commodity prices or weather conditions.
Ballooning fiscal and quasi-fiscal deficits combined with large current account deficits in the years prior to 1999 led to a sharp build-up of external debt. Debt indicators deteriorated in 1999 due to the sharp depreciation of the leu following the Russian crisis and the drop in output. At end-1999, the stock of public and publicly guaranteed external debt amounted to almost US$1 billion, equivalent to 70 percent of GDP. Adding arrears on energy imports puts the debt stock at over 100 percent of GDP (IMF, 2000). Meeting debt service obligations placed a large burden on the government budget and created risks for macroeconomic stability.
The adjustment achieved by 2001 helped the budget maintain primary surpluses until 2005, in part by necessity in the absence of external financing for budget support. External debt service became a serious burden for the budget, reaching at one point 40 percent of the total state budget revenues. However, primary surpluses of 2-2½ percent of GDP and the Paris Club debt restructuring agreement signed in May 2006 reduced public debt to 34.5 percent of GDP in 2006 and 21.6 percent in 2008 (Appendix II).
While pension and public sector wage increases granted in 2004 undermined fiscal tightening efforts, the fiscal position in the next three years appeared stable. The boom in domestic demand, fueled by remittances and capital inflows, provided significant budget revenue. However, the structural fiscal position was quickly deteriorating as generous expenditure commitments piled up faster than the improvements in structural revenue (Figure 1).
The 2009 economic crisis confirmed that Moldova’s public finance system remains vulnerable to macro-fiscal and political shocks. As real GDP fell by 6 percent in 2009, reflecting sharp declines in exports, remittances, and FDI, a large fiscal gap opened. Due to a drop in VAT receipts, nontax revenue, and foreign trade taxes, budget revenue dropped by nearly 2 percent of GDP compared to 2008 (Appendix I). At the same time, fiscal expenditure increased by about 3¾ percent of GDP driven again by large, politically-motivated increases in wages and pensions. As an outcome, the fiscal deficit increased from 1 percent of GDP in 2008 to 6¼ percent in 2009, and the structural deficit (excluding grants) reached 7½ percent (Figure 1).
6
Figure 1. Moldova: Budget Balance, 1998–2010 (Percent of GDP)
Source: IMF staff calculations.
Realizing that such high structural deficit cannot be sustained, the authorities began implementing fundamental reforms to rationalize expenditure and enhance revenue in 2010. The authorities have appropriately chosen restraint in current spending, in particular on rationalizing the government wage bill and spending on goods and services while expanding public investment and priority social spending. The authorities have begun with the reforms in social insurance system, particularly regarding sick leave benefits and early retirement. These reforms have been complemented by further structural reforms. The authorities have scrapped a number of export and import restrictions and simplified customs controls, licensing requirements, and procedures for business registration and liquidation. The energy regulator ANRE raised energy tariffs to cost-recovery levels (IMF, 2010c). Coupled with a rebound in tax revenue in 2010 as GDP growth reached almost 7 percent, these reforms brought the deficit down to 2.5 percent of GDP in 2010. At the same time, social assistance expenditure increased by over 30 percent and was better targeted to the poor (IMF, 2011a). The structural balance began to improve as well, although it remained well below levels consistent with fiscal sustainability.
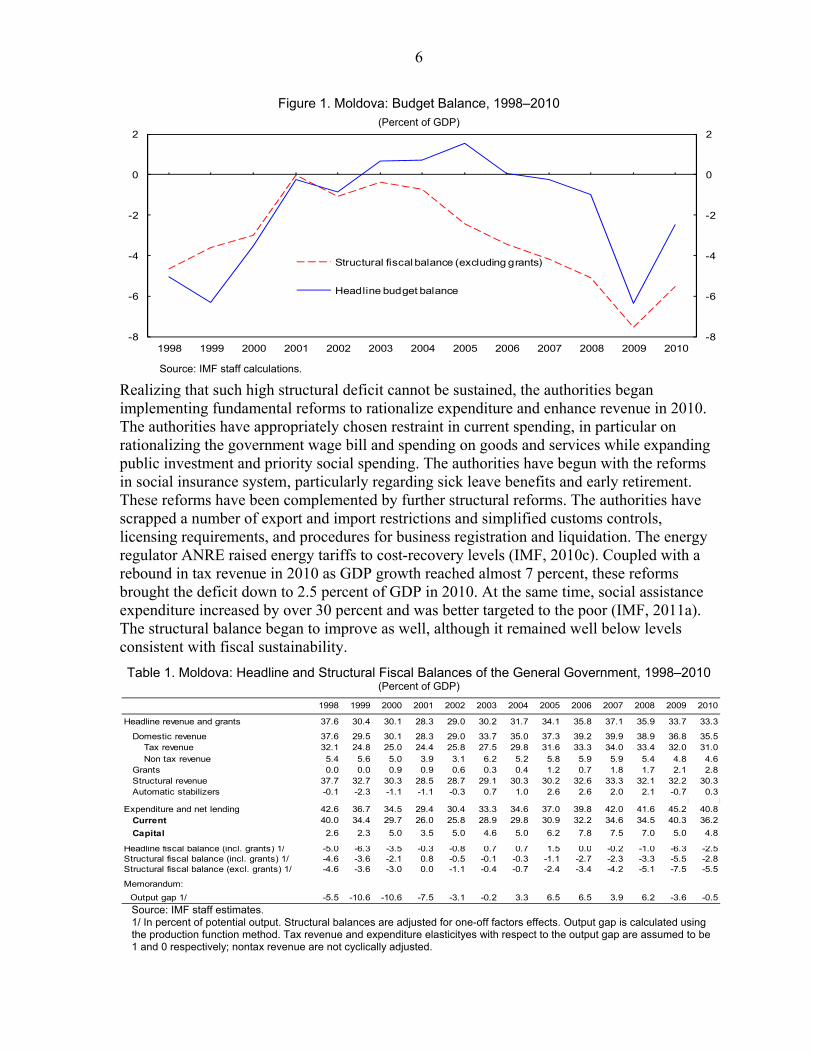
Table 1. Moldova: Headline and Structural Fiscal Balances of the General Government, 1998–2010 (Percent of GDP)
Source: IMF staff estimates.
1/ In percent of potential output. Structural balances are adjusted for one-off factors effects. Output gap is calculated using the production function method. Tax revenue and expenditure elasticityes with respect to the output gap are assumed to be 1 and 0 respectively; nontax revenue are not cyclically adjusted.
-8
-6
-4
-2
0
2
-8
-6
-4
-2
0
2
1998 1999 2000 2001 2002 2003 2004 2005 2006 2007 2008 2009 2010
Structural fiscal balance (excluding grants)
Headline budget balance
1998 1999 2000 2001 2002 2003 2004 2005 2006 2007 2008 2009 2010
Headline revenue and grants 37.6 30.4 30.1 28.3 29.0 30.2 31.7 34.1 35.8 37.1 35.9 33.7 33.3
Domestic revenue 37.6 29.5 30.1 28.3 29.0 33.7 35.0 37.3 39.2 39.9 38.9 36.8 35.5 Tax revenue 32.1 24.8 25.0 24.4 25.8 27.5 29.8 31.6 33.3 34.0 33.4 32.0 31.0 Non tax revenue 5.4 5.6 5.0 3.9 3.1 6.2 5.2 5.8 5.9 5.9 5.4 4.8 4.6 Grants 0.0 0.0 0.9 0.9 0.6 0.3 0.4 1.2 0.7 1.8 1.7 2.1 2.8 Structural revenue 37.7 32.7 30.3 28.5 28.7 29.1 30.3 30.2 32.6 33.3 32.1 32.2 30.3 Automatic stabilizers -0.1 -2.3 -1.1 -1.1 -0.3 0.7 1.0 2.6 2.6 2.0 2.1 -0.7 0.3
Expenditure and net lending 42.6 36.7 34.5 29.4 30.4 33.3 34.6 37.0 39.8 42.0 41.6 45.2 40.8 Current 40.0 34.4 29.7 26.0 25.8 28.9 29.8 30.9 32.2 34.6 34.5 40.3 36.2
Capital 2.6 2.3 5.0 3.5 5.0 4.6 5.0 6.2 7.8 7.5 7.0 5.0 4.8
Headline fiscal balance (incl. grants) 1/ -5.0 -6.3 -3.5 -0.3 -0.8 0.7 0.7 1.5 0.0 -0.2 -1.0 -6.3 -2.5Structural fiscal balance (incl. grants) 1/ -4.6 -3.6 -2.1 0.8 -0.5 -0.1 -0.3 -1.1 -2.7 -2.3 -3.3 -5.5 -2.8Structural fiscal balance (excl. grants) 1/ -4.6 -3.6 -3.0 0.0 -1.1 -0.4 -0.7 -2.4 -3.4 -4.2 -5.1 -7.5 -5.5
Memorandum:
Output gap 1/ -5.5 -10.6 -10.6 -7.5 -3.1 -0.2 3.3 6.5 6.5 3.9 6.2 -3.6 -0.5
7
III. REVENUE AND TAX POLICY DEVELOPMENTS
The tax system should be as fair and efficient as possible in raising the revenue required to meet the government’s needs. The main characteristics of such a system generally include the provision of adequate revenue subject to certain constraints –achievement of economic efficiency, provision of equity, an optimal tax mix, simplicity, effective tax administration and transparency (Shome, 1995). However, the effectiveness of the tax systems depends not only on the design of tax policies but also on effectiveness of the tax administration. Once governments have their policies appropriately designed, the tax administration plays the main role by securing the effective implementation of these policies for reaching the objectives.
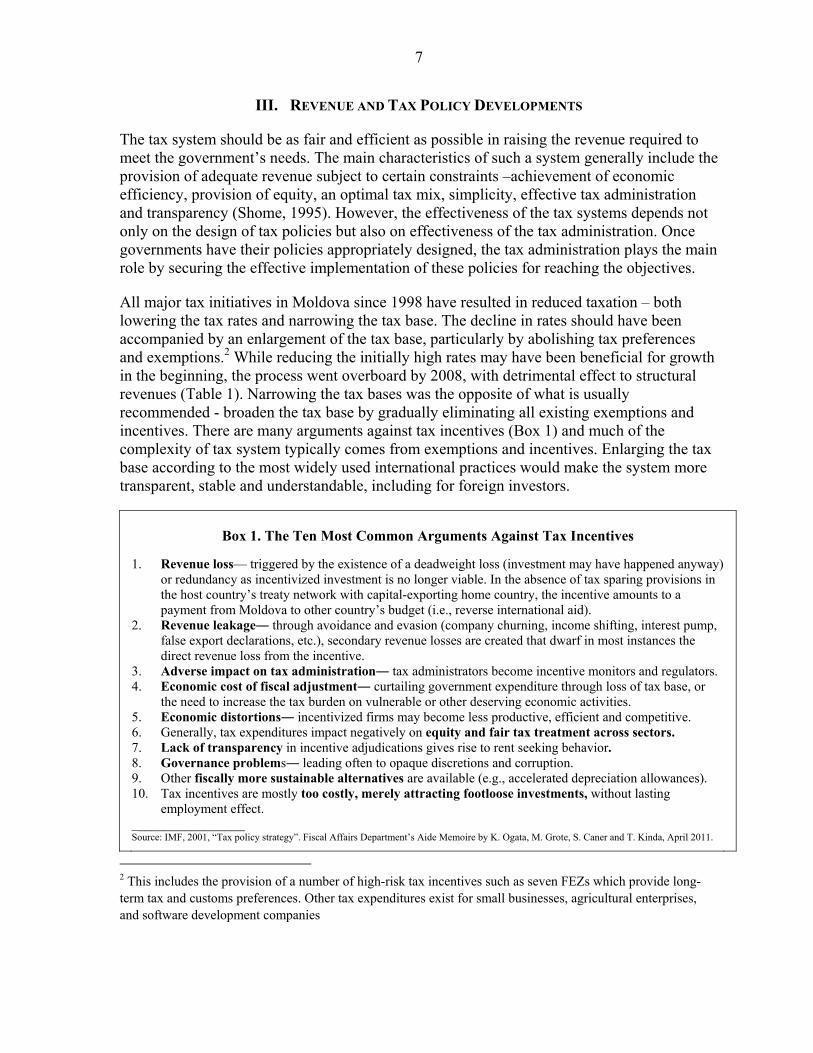
All major tax initiatives in Moldova since 1998 have resulted in reduced taxation – both lowering the tax rates and narrowing the tax base. The decline in rates should have been accompanied by an enlargement of the tax base, particularly by abolishing tax preferences and exemptions.2 While reducing the initially high rates may have been beneficial for growth in the beginning, the process went overboard by 2008, with detrimental effect to structural revenues (Table 1). Narrowing the tax bases was the opposite of what is usually recommended - broaden the tax base by gradually eliminating all existing exemptions and incentives. There are many arguments against tax incentives (Box 1) and much of the complexity of tax system typically comes from exemptions and incentives. Enlarging the tax base according to the most widely used international practices would make the system more transparent, stable and understandable, including for foreign investors.
Box 1. The Ten Most Common Arguments Against Tax Incentives
1. Revenue loss— triggered by the existence of a deadweight loss (investment may have happened anyway)
or redundancy as incentivized investment is no longer viable. In the absence of tax sparing provisions in the host country’s treaty network with capital-exporting home country, the incentive amounts to a payment from Moldova to other country’s budget (i.e., reverse international aid).
2. Revenue leakage― through avoidance and evasion (company churning, income shifting, interest pump, false export declarations, etc.), secondary revenue losses are created that dwarf in most instances the direct revenue loss from the incentive.
3. Adverse impact on tax administration― tax administrators become incentive monitors and regulators. 4. Economic cost of fiscal adjustment― curtailing government expenditure through loss of tax base, or
the need to increase the tax burden on vulnerable or other deserving economic activities. 5. Economic distortions― incentivized firms may become less productive, efficient and competitive. 6. Generally, tax expenditures impact negatively on equity and fair tax treatment across sectors. 7. Lack of transparency in incentive adjudications gives rise to rent seeking behavior. 8. Governance problems― leading often to opaque discretions and corruption. 9. Other fiscally more sustainable alternatives are available (e.g., accelerated depreciation allowances). 10. Tax incentives are mostly too costly, merely attracting footloose investments, without lasting
employment effect. _________________ Source: IMF, 2001, “Tax policy strategy”. Fiscal Affairs Department’s Aide Memoire by K. Ogata, M. Grote, S. Caner and T. Kinda, April 2011.
2 This includes the provision of a number of high-risk tax incentives such as seven FEZs which provide long-term tax and customs preferences. Other tax expenditures exist for small businesses, agricultural enterprises, and software development companies

8
The revenues of the general government were 29.5 percent of GDP in 1999, a drop of 8.1 percent of GDP relative to 1998. The financial crisis in Russia had an adverse impact on economic activity and foreign trade and the revenue loss in VAT, excises, and customs was estimated to be in the neighborhood of 2 percent of GDP in 1998. The share of VAT revenues in GDP fell from 12.3 percent in 1998 to 7.6 percent in 1999 (Appendix I). Despite the increase in excises rates, their share in GDP fell from 4.1 percent in 1998 to 3.6 percent in 1999 due in part to falling exports to Russia and weak customs administration. Profit and personal income tax yield also fell and non-tax revenue was lower as a share of GDP in 1999 relative to 1998.
Table 2. Moldova: Main Changes in Tax Policy
After a series of reductions, the CIT rate was reduced from 32 percent to zero (for undistributed profit) over a period of 10 years (Table 2). The authorities did not implement base broadening measures to make this reduction more affordable. In contrast, along with the reduction in the CIT rate, numerous tax exemptions were granted: to agricultural entities and cooperatives; residents of scientific and innovation parks; banking; companies making investments; residents of free economic zones and free ports; and software companies. The main reported rationale for the CIT reduction was to facilitate investment. But at the same time, a difficult-to-refund VAT burden of 20 percent on investment in two main cities was maintained to secure revenue, which effectively defeated the purpose (Box 2).
19941999
200620082010
1992199920012002200320042005 CIT lowered to 18 percent2006 CIT lowered to 15 percent2008 CIT rate set to zero except for a few categories of entrepreneurs and reinvested profit (15 percent)
199219982000200420052008
Exemptions introduced and income threshold raised to MDL 10,800Max rate reduced to 22 percent Max rate reduced to 20 percent
Value-added tax
CIT lowered to 25 percentCIT lowered to 22 percentCIT lowered to 20 percent
Personal income tax
Income brackets reduced to two, max rate reduced to 18 percent, min rate at 7 percent.
Source: Moldovan authorities
Law on VAT adopted with a standard rate of 20 percentReduced rate of 8 percent introduced for selected food items
Sugar and selected plants and animals were moved to the reduced rate group (8 percent)
Reduced rate of 8 percent introduced for natural gasSelected medical drugs were moved to the reduced rate (8 percent) groupSelected other medical items were included in the reduced rate (8 percent) group
Corporate income tax
Law on CIT adopted wit tax rate 32 percentCIT rate was reduced to 25 percentCIT rate raised to 28 percent
Law on PIT adopted with 5 income brackets and 50 percent highest rate, min rate 10 percentTax code enacted (3 brackets, max rate 25 percent, min rate 10 percent for income <MDL 6,000)

9
The Personal income tax (PIT) is also characterized with a low tax productivity which may be the direct result of a number of tax exemptions. During the last ten years, the PIT has experienced several revisions of allowances and rate structure, partly to offset the fiscal drag stemming from double-digit inflation, and partly to reduce the burden and the progressivity of the tax. The aim was to make the PIT more competitive as compared to other countries in the region, particularly in light of the extensive phenomenon of labor migration. Reforms have taken the form of increasing the personal and family allowances, increasing the thresholds and lowering the rates. As Table 2 shows the maximum rate was reduced from 22 percent in 2004 to 20 percent in 2005 and 18 percent in 2008. Moreover, the taxable income brackets were reduced from three to two (Box 2). Another justification for changes was to lower the tax wedge on labor and hence reduce the incentive to perform activities in the shadow economy and to increase international competitiveness (IMF 2007).
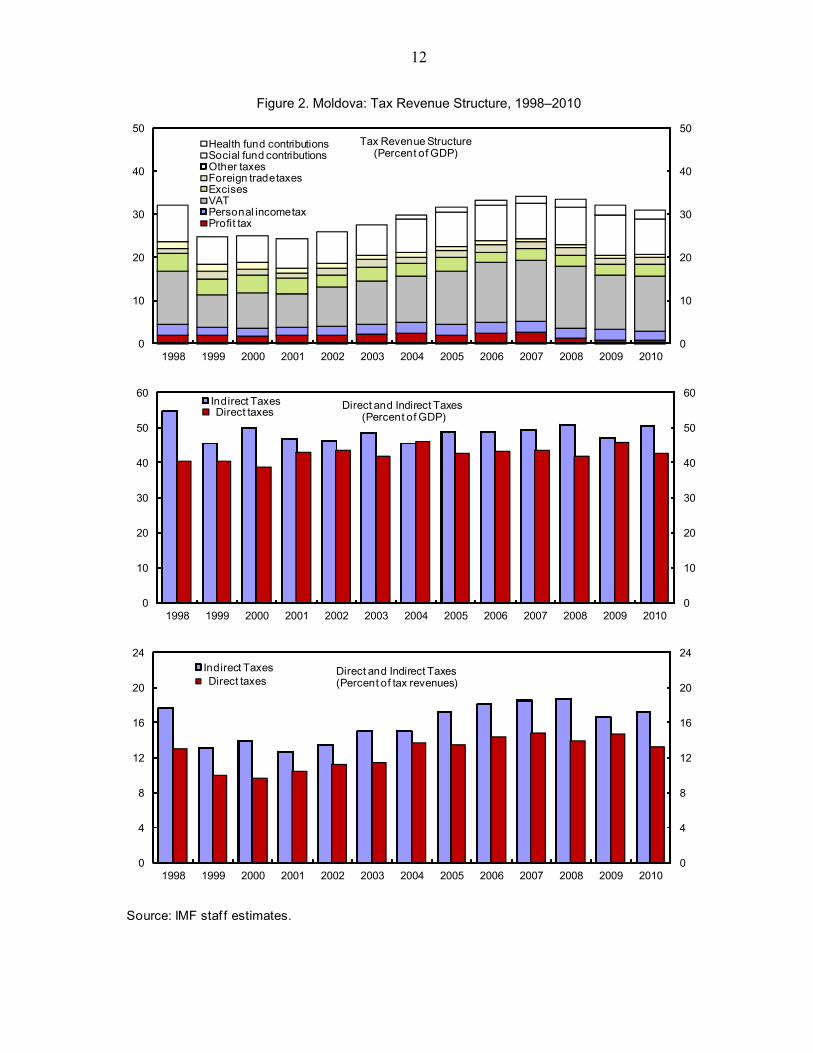
While both PIT and CIT perform below average relative to other countries (Table 3), the VAT is the largest source of tax revenue. Over 1999-2008 tax revenues have been steadily growing as a percent of GDP, mostly thanks to fast growth in revenue from VAT on imports financed by flows of remittances. The VAT was adopted in 1994 with a standard rate of 20 percent. However, in the following years the VAT rate was reduced for a number of goods and services (Table 2). In addition to the loss of revenue, excessive use of exemptions and reduced rates can lead to a build-up of difficult-to-refund excess input credits, which block companies’ working capital – an issue that the extension of VAT refunds on purchases of investment goods to the two largest cities in 2012 seeks to resolve (section VI).
Table 3. Moldova and Selected Countries: Tax Revenue Breakdown, 2009
General Government (Percent of GDP) Total Taxes PIT CIT VAT Excises
Social Security
Estonia 35.0 5.7 1.9 8.8 4.6 7.3Latvia 26.5 5.5 1.5 6.0 3.8 8.8Lithuania 30.2 6.7 2.6 8.0 2.9 9.3Slovakia 29.0 2.9 3.0 6.8 3.5 11.8Romania 27.8 3.8 2.7 7.0 3.2 9.7Moldova 32.2 2.4 0.7 12.7 2.6 9.3Macedonia 26.3 2.1 1.1 8.6 8.6 8.8Ukraine 1/ 35.6 4.9 3.6 9.3 2.4 11.1Russia 31.2 4.3 3.2 5.3 0.9 5.4Georgia 24.5 6.2 2.9 11.4 2.9 0.0
Average 29.6 4.7 2.5 7.9 3.7 8.0
Source: FAD Tax Revenue Database, and IMF Staff Calculations. 1/ Social Security: Payroll taxes and other Pension Fund own revenues.

10
Box 2. Moldova: Direct Taxes
Corporate income tax (CIT): Between 1998 and 2008, the CIT rate was reduced from 32 percent to 15 percent. In addition, a number of generous tax exemptions and incentives were granted. In 2008, the CIT rate was reduced from 15 percent to zero. The zero rate was well below the average of 19.5 percent for the CIS, the 15.6 percent for CEE countries, and below the 22.2 percent for European Union member states.
The CIT rate was reduced with a view to facilitating investment. The international experience shows that tax expenditures or lower rates are ineffective tools to attract investments and costly to the budget. Other government policies are more important in attracting investments. Empirical evidence suggests that in emerging and developing countries the impact of taxes on FDI is minor compared to the quality of governance, the business climate, the quality of the infrastructure, the size of the domestic market, the distance to main markets in Western Europe, and labor costs (Demekas and others, 2005).
The authorities have signaled their intention to reintroduce the CIT in 2012 at a rate of 12 percent together with the cancellation of most investment incentives except those explicitly grandfathered by the law (e.g., in the free economic zones).
Personal income tax (PIT): The PIT comprises the following four components: (1) a progressive tax on taxable income with two positive rates of 7 percent (on taxable income up to MDL 25,200) and 18 percent (on taxable income above MDL 25,200), with wage income subject to withholding tax that is final if it is the only source of income; (2) final withholding tax on certain non-wage income at 15 percent; (3) rental income taxed at 10 percent; and (4) capital gains taxed at half the normal rate. The current effective PIT rate calculated over the average yearly wages is 7.8 percent––the lowest among the CIS and CEE countries––with 71.5 percent of taxpayers subject to the lower bracket of 7 percent (IMF 2011). Over the medium term (2012 – 2014), the government intends to keep the progressive PIT, while further increasing the annual personal exemption (allowance), subject to maintaining PIT revenue at 2¼ percent of GDP.
Social Fund Contributions (SSC) and Health Fund Contributions (HFC): The SSCs, levied at 29 percent on the wage bill, accounted for about 9.2 percent of GDP in 2009, more than three times the share of PIT. The employer pays 23 percent of the wage bill, and the employee 6 percent. The SSC are capped at a value equal to five times the average monthly wage. Since 71 percent of employees earn below or at the average monthly wage rate in 2009, their social security contributions are below the maximum amount of contributions. The social security contributions of the remaining 29 percent of the employees are capped at the maximum (IMF 2011).
Both the employer and the employee contribute 3.5 percent separately to the health insurance fund totaling 7 percent of the total wage bill. Health insurance contributions at 2.3 percent of GDP are generally as high as the PIT. The contributions to the SSC and the health insurance fund are tax-deductible both for the employer and the employee. In addition to social security contribution, entrepreneurial patent holders can buy health insurance by paying MDL 2,800 per annum and get the same health benefits as individuals employed by a business.
Over the medium term, 2012 – 2014, the government intends to keep the rates of social security contributions at 29 percent and medical insurance at 7 percent.
11
Box 3. Moldova: Indirect Taxes
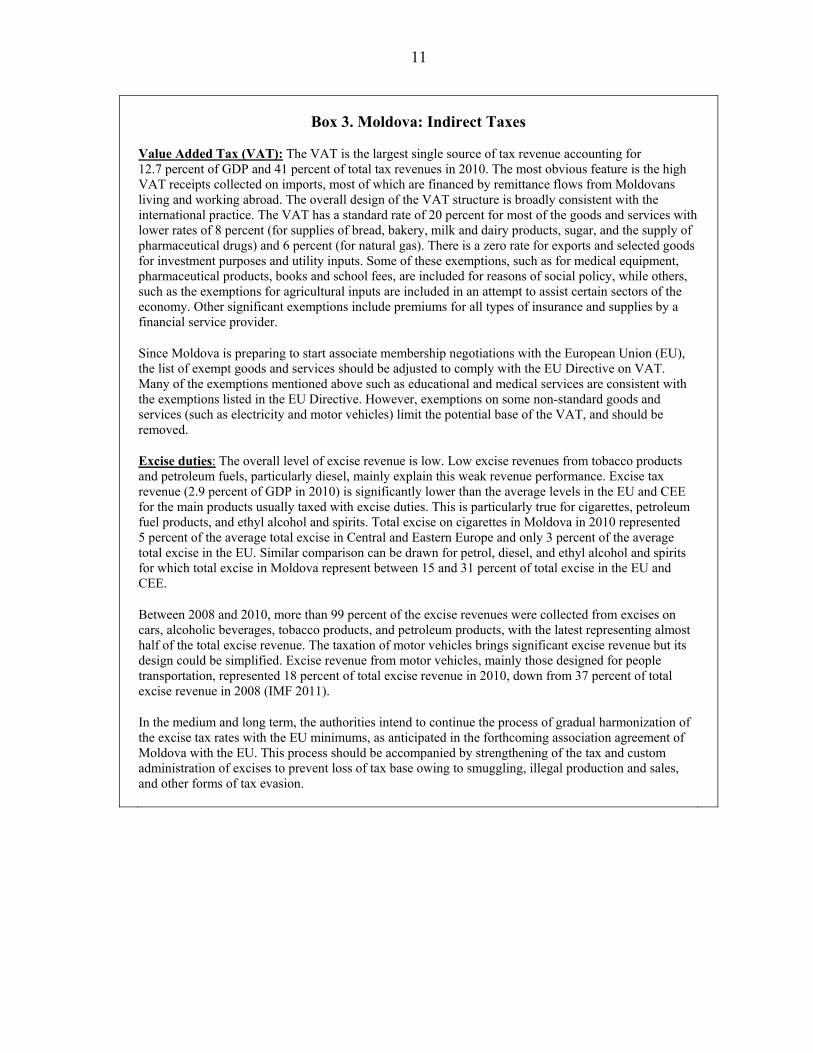
Value Added Tax (VAT): The VAT is the largest single source of tax revenue accounting for 12.7 percent of GDP and 41 percent of total tax revenues in 2010. The most obvious feature is the high VAT receipts collected on imports, most of which are financed by remittance flows from Moldovans living and working abroad. The overall design of the VAT structure is broadly consistent with the international practice. The VAT has a standard rate of 20 percent for most of the goods and services with lower rates of 8 percent (for supplies of bread, bakery, milk and dairy products, sugar, and the supply of pharmaceutical drugs) and 6 percent (for natural gas). There is a zero rate for exports and selected goods for investment purposes and utility inputs. Some of these exemptions, such as for medical equipment, pharmaceutical products, books and school fees, are included for reasons of social policy, while others, such as the exemptions for agricultural inputs are included in an attempt to assist certain sectors of the economy. Other significant exemptions include premiums for all types of insurance and supplies by a financial service provider.
Since Moldova is preparing to start associate membership negotiations with the European Union (EU), the list of exempt goods and services should be adjusted to comply with the EU Directive on VAT. Many of the exemptions mentioned above such as educational and medical services are consistent with the exemptions listed in the EU Directive. However, exemptions on some non-standard goods and services (such as electricity and motor vehicles) limit the potential base of the VAT, and should be removed.
Excise duties: The overall level of excise revenue is low. Low excise revenues from tobacco products and petroleum fuels, particularly diesel, mainly explain this weak revenue performance. Excise tax revenue (2.9 percent of GDP in 2010) is significantly lower than the average levels in the EU and CEE for the main products usually taxed with excise duties. This is particularly true for cigarettes, petroleum fuel products, and ethyl alcohol and spirits. Total excise on cigarettes in Moldova in 2010 represented 5 percent of the average total excise in Central and Eastern Europe and only 3 percent of the average total excise in the EU. Similar comparison can be drawn for petrol, diesel, and ethyl alcohol and spirits for which total excise in Moldova represent between 15 and 31 percent of total excise in the EU and CEE.
Between 2008 and 2010, more than 99 percent of the excise revenues were collected from excises on cars, alcoholic beverages, tobacco products, and petroleum products, with the latest representing almost half of the total excise revenue. The taxation of motor vehicles brings significant excise revenue but its design could be simplified. Excise revenue from motor vehicles, mainly those designed for people transportation, represented 18 percent of total excise revenue in 2010, down from 37 percent of total excise revenue in 2008 (IMF 2011).
In the medium and long term, the authorities intend to continue the process of gradual harmonization of the excise tax rates with the EU minimums, as anticipated in the forthcoming association agreement of Moldova with the EU. This process should be accompanied by strengthening of the tax and custom administration of excises to prevent loss of tax base owing to smuggling, illegal production and sales, and other forms of tax evasion.
12
Figure 2. Moldova: Tax Revenue Structure, 1998–2010
Source: IMF staf f estimates.
0
10
20
30
40
50
0
10
20
30
40
50
1998 1999 2000 2001 2002 2003 2004 2005 2006 2007 2008 2009 2010
Health fund contributionsSocial fund contributionsOther taxes Foreign trade taxesExcisesVATPersonal income taxProfit tax
Tax Revenue Structure(Percent of GDP)
0
10
20
30
40
50
60
0
10
20
30
40
50
60
1998 1999 2000 2001 2002 2003 2004 2005 2006 2007 2008 2009 2010
Indirect TaxesDirect taxes
Direct and Indirect Taxes(Percent of GDP)
0
4
8
12
16
20
24
0
4
8
12
16
20
24
1998 1999 2000 2001 2002 2003 2004 2005 2006 2007 2008 2009 2010
Indirect TaxesDirect taxes
Direct and Indirect Taxes(Percent of tax revenues)
13
IV. GENERAL GOVERNMENT EXPENDITURE DEVELOPMENTS
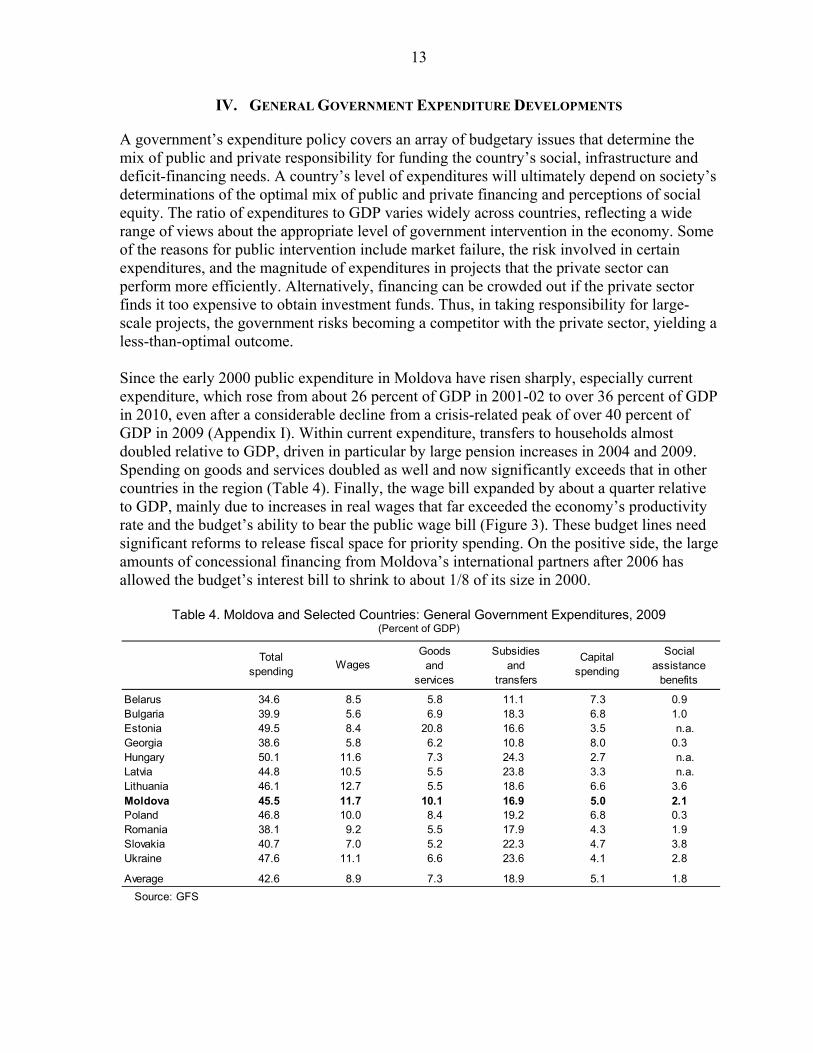
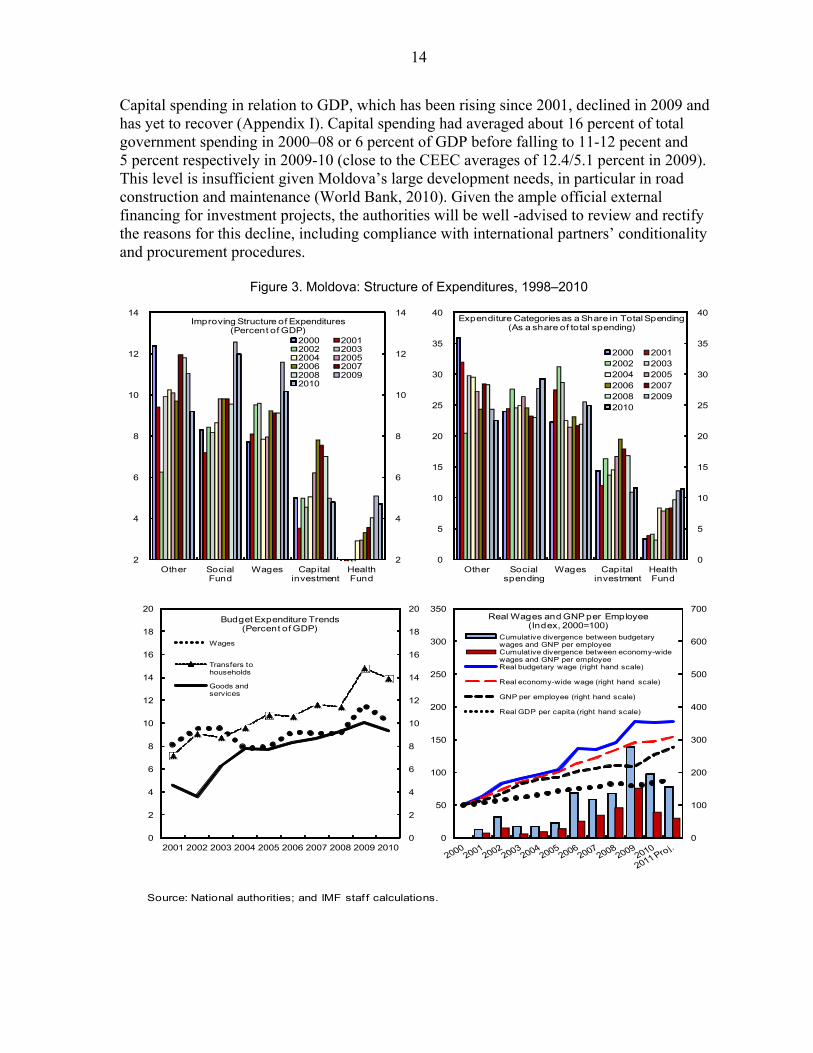
A government’s expenditure policy covers an array of budgetary issues that determine the mix of public and private responsibility for funding the country’s social, infrastructure and deficit-financing needs. A country’s level of expenditures will ultimately depend on society’s determinations of the optimal mix of public and private financing and perceptions of social equity. The ratio of expenditures to GDP varies widely across countries, reflecting a wide range of views about the appropriate level of government intervention in the economy. Some of the reasons for public intervention include market failure, the risk involved in certain expenditures, and the magnitude of expenditures in projects that the private sector can perform more efficiently. Alternatively, financing can be crowded out if the private sector finds it too expensive to obtain investment funds. Thus, in taking responsibility for large-scale projects, the government risks becoming a competitor with the private sector, yielding a less-than-optimal outcome. Since the early 2000 public expenditure in Moldova have risen sharply, especially current expenditure, which rose from about 26 percent of GDP in 2001-02 to over 36 percent of GDP in 2010, even after a considerable decline from a crisis-related peak of over 40 percent of GDP in 2009 (Appendix I). Within current expenditure, transfers to households almost doubled relative to GDP, driven in particular by large pension increases in 2004 and 2009. Spending on goods and services doubled as well and now significantly exceeds that in other countries in the region (Table 4). Finally, the wage bill expanded by about a quarter relative to GDP, mainly due to increases in real wages that far exceeded the economy’s productivity rate and the budget’s ability to bear the public wage bill (Figure 3). These budget lines need significant reforms to release fiscal space for priority spending. On the positive side, the large amounts of concessional financing from Moldova’s international partners after 2006 has allowed the budget’s interest bill to shrink to about 1/8 of its size in 2000.
Table 4. Moldova and Selected Countries: General Government Expenditures, 2009 (Percent of GDP)
Total spending
WagesGoods
and services
Subsidies and
transfers
Capital spending
Social assistance
benefits
Belarus 34.6 8.5 5.8 11.1 7.3 0.9Bulgaria 39.9 5.6 6.9 18.3 6.8 1.0Estonia 49.5 8.4 20.8 16.6 3.5 n.a.Georgia 38.6 5.8 6.2 10.8 8.0 0.3Hungary 50.1 11.6 7.3 24.3 2.7 n.a.Latvia 44.8 10.5 5.5 23.8 3.3 n.a.Lithuania 46.1 12.7 5.5 18.6 6.6 3.6Moldova 45.5 11.7 10.1 16.9 5.0 2.1Poland 46.8 10.0 8.4 19.2 6.8 0.3Romania 38.1 9.2 5.5 17.9 4.3 1.9Slovakia 40.7 7.0 5.2 22.3 4.7 3.8Ukraine 47.6 11.1 6.6 23.6 4.1 2.8
Average 42.6 8.9 7.3 18.9 5.1 1.8
Source: GFS
14
Capital spending in relation to GDP, which has been rising since 2001, declined in 2009 and has yet to recover (Appendix I). Capital spending had averaged about 16 percent of total government spending in 2000–08 or 6 percent of GDP before falling to 11-12 pecent and 5 percent respectively in 2009-10 (close to the CEEC averages of 12.4/5.1 percent in 2009). This level is insufficient given Moldova’s large development needs, in particular in road construction and maintenance (World Bank, 2010). Given the ample official external financing for investment projects, the authorities will be well -advised to review and rectify the reasons for this decline, including compliance with international partners’ conditionality and procurement procedures.
Figure 3. Moldova: Structure of Expenditures, 1998–2010
Source: National authorities; and IMF staf f calculations.
2
4
6
8
10
12
14
2
4
6
8
10
12
14
Other Social Fund
Wages Capital investment
Health Fund
Improving Structure of Expenditures(Percent of GDP)
2000 20012002 20032004 20052006 20072008 20092010
0
5
10
15
20
25
30
35
40
0
5
10
15
20
25
30
35
40
Other Social spending
Wages Capital investment
Health Fund
Expenditure Categories as a Share in Total Spending(As a share of total spending)
2000 20012002 20032004 20052006 20072008 20092010
0
100
200
300
400
500
600
700
0
50
100
150
200
250
300
350
Cumulative divergence between budgetary wages and GNP per employeeCumulative divergence between economy-wide wages and GNP per employeeReal budgetary wage (right hand scale)
Real economy-wide wage (right hand scale)
GNP per employee (right hand scale)
Real GDP per capita (right hand scale)
Real Wages and GNP per Employee(Index, 2000=100)
0
2
4
6
8
10
12
14
16
18
20
0
2
4
6
8
10
12
14
16
18
20
2001 2002 2003 2004 2005 2006 2007 2008 2009 2010
Wages
Transfers to households
Goods and services
Budget Expenditure Trends(Percent of GDP)

15
Box 4. Moldova: Pension System Reforms
The reform of the Moldovan pension system started in 1998, with enactment of the Law on State Social Insurance Pension Benefits. In 1999, in collaboration with the World Bank, Moldova introduced a new hybrid pension system, where future pensions are linked both to the period of employment, judged on the basis of the number of years of payments of social security contributions, and the size of the contributions (with gross wage base capped at the level of an average three-month salary in the economy). Although some progress was made in implementing these reforms, none of the objectives has been fully achieved. Increases in the retirement age were suspended in 2003. In 2008, the government drafted a set of strategy documents on further pension system reforms.1 The strategy documents set forth the government’s objective of completing the unfinished 1998 pension reform agenda by strengthening the link between benefits and contributions paid, unifying the contribution rates, reducing the privileges, strengthening the benefit formula, and tightening the disability pension rules. However, these documents did not present a set of specific, concrete policy measures nor did they estimate their fiscal and social impact. Along with the efforts to adopt and implement the strategies, the government intended to explore other reform options, including supplementing the pay-as-you-go (PAYG) pillar with a mandatory fully funded second-pillar pension scheme and spur the establishment of the voluntary pension funds (World Bank, 2009b). The retirement age is still low by international standards. The current system sets the retirement age at 57 years for women and 62 for men with an insurance period (payment of contributions) of 15 years.2 While the retirement age for men is similar to that in EU10+1 countries,3 retirement age for women is the lowest in this sample. The 1998 Law introduced retirement age increases in 6-months increments for both men and women to reach 60/65 by 2008. After the retirement age reached 62/57 in 2002, further increases were suspended. Civil servants retire at 52/57 years for women/men and judges and prosecutors - at 50 years. In 2011 government adopted legislation that, starting July 1, 2011, would raise the statutory retirement age of civil servants, judges, and prosecutors by six months every year until it reaches the regular retirement age. This legislation will also extend the requirement to pay social contributions to all persons employed in Moldova in line with bilateral treaties. Another related piece of legislation will put in place a policy of increasing the years of contribution required for full pension eligibility from 30 to 35 years (and from 20 to 25 years for military and police personnel), by 6 months every year, starting July 1, 2011. _________________
1 Strategies include: i) Unification of Pension System; ii) Farmers’ Pension System Reform Strategy; and iii) Strategy of Reform of the System for Social Protection of Persons with Disabilities in the Republic Moldova. The documents have never been finalized.
2 There are categories that can earn old-age pension at a younger age: mothers with 5 or more children and employees working in hazardous occupations. Some professional groups (civil servants, government and parliament members, judges and local authority officials) can earn old-age pension before they reach the standard age required for old-age pension if they have met special conditions envisaged for their category. Their pension benefits are calculated under more favorable terms than those in the general system.
3 EU10+1 refers to ten CEE EU countries and Croatia.
16
Pension system The costs of the pension system increased from 4.4 percent of GDP in 1999 to 7.2 percent in 2007 and 9.1 percent of GDP in 2009. This is more than double the 1999 level and is above the 2008 CEEC median of 7.3 percent of GDP. Moreover, the system covers just over 40 percent of the working- age population. The number of insured persons (contributors) has been decreasing over the past five years due to emigration, unemployment, and the apparent expansion of large informal economy.
On current polices and trends, the pension system dependency ratio (defined as the ratio of pensioners to contributors) is expected to rise from 59 pensioners per 100 contributors in 2008 (already quite high by comparable international standards) to 86 by 2050 due to the declining trend in contributors and early retirement (World Bank 2009b). The large number of pensioners and small (and declining) numbers of contributors lead to low replacement rates: the average old-age pension is 35.1 percent of the average net wage, which is below the ILO recommendation of 40 percent (IMF, 2010b).
Both recession-related and policy-induced factors contributed to the worsening financial situation of the pension system. The recession-related effect on pension contributions—an increase in unemplyment and an expansion of the informal economy reduced own revenue growth. However, discretionary expenditure policies were primarily responsible for the widening gap between revenue and expenditure. Pensions were raised before the elections in April 2009 on top of already large increase allowed by the indexation rule (a Swiss formula).3 Other factors and policies pertaining to the structure of the system (i.e., minimum pension rates, pension benefit rates, treatment of past valorization) have also played a role. Numerous special and privileged pension schemes have emerged on top of the general pension system in Moldova. For example, the average civil servant pension is currently twice higher than the average old-age pension.
Wage system The reform of the public sector wage system has in recent years emerged as one of the key issues in the public administration reform process in Moldova. Despite the recession, public sector wages rose in 2009 by 8.6 percent in real terms as the government granted public sector workers large wage increases before the elections in April 2009. The public sector wage bill in Moldova has increased from 7.8 percent of GDP in 2004 to 10.2 percent of GDP in 2010, substantially larger then a CEEC average of 7.3 percent of GDP. The education sector constitutes the highest share of the wage bill at 3.9 percent of GDP, followed by health at 1.9 percent of GDP. Central Civil Service constitutes only 1 percent of GDP and local government administration 0.5 percent of GDP, with the remainder accounted for by the military and police. Wages and salaries also constitute a high proportion of general
3 The indexation formula is based on last calendar year averages of wages and inflation to estimate pension entitlements for the period running from April to March of the subsequent year.

17
government expenditure, standing at 26 percent of total government expenditures, compared to an average of 21 percent in selected CEEC (IMF, 2010).
The proportion of public employment in overall employment is quite high, standing at 23 percent of overall employment. The highest contributor to the employment levels in Moldova is education at 3.9 percent of population. Health employment stands at 1.7 percent of population, while central government institutions comprise about 1 percent of overall population.
In nominal terms, the general government wage bill more than doubled in six years. The average public sector wage had also grown by 3½ times in real terms in 2000-2010, much faster than the economy-wide average wage and GNP per employee (Figure 3). This situation has given rise to a number of concerns:
The wage bill seems already high relative to other countries with similar per capita income.
The increases in government wages—unless targeted to alleviate skills shortages—run the risk of ratcheting up the economy-wide wage structure, which may undermine Moldova’s external competitiveness.
Across the board wage increases will inevitably crowd out other priority expenditures.
Education From a functional budget perspective, education is the sector with the most significant need for adjustment. Spending in this sector reached 9.5 percent of GDP in 2010 (almost double a CEEC average of just over 5 percent (Figure 4). The sector accounts for over 60 percent of public employment and almost a quarter of expenditure despite a steady decline in the student population (figure 4). Yet education struggles to deliver positive results, as most of the spending in wasted on maintaining empty schools and small classes (World Bank, 2009a). Student numbers have been declining for more than two decades and are projected to continue to decline in the coming years. There were 43 percent fewer students in 2008/2009 compared to 1990/91 and the school age population is projected to decline by a further 15 percent by 2020. While student numbers have plummeted, the number of schools has stayed effectively unchanged since 1994 and the average class sizes have been allowed to become smaller. As a result, the decline in the number of teachers has been much less pronounced than the decline in student numbers, driving up the cost of educating a child (World Bank, 2010).

18
Figure 4. Moldova: Education Trends, 2000–2009
Source: National authorities, GFS and IMF staff calculations.
70
80
90
100
110
2
3
4
5
6
7
8
9
10
11
12
2000 2001 2002 2003 2004 2005 2006 2007 2008 2009
Spending on education (percent of GDP)
Number of teachers (2000=100, rhs)
Number of students (2000=100, rhs)
Number of schools (2000=100, rhs)
Moldova: Education Trends
9.4
7.26.8 6.7
5.8
5.3
4.8
4.3 4.23.9
3.2
0
1
2
3
4
5
6
7
8
9
10
0
1
2
3
4
5
6
7
8
9
10
Moldova and Selected Countries: General Government Expenditure on Education, 2009
(Percent of GDP)
Average excluding Moldova
Wage bill
19
V. INTERNATIONAL ASSISTANCE FOR THE GENERAL GOVERNMENT
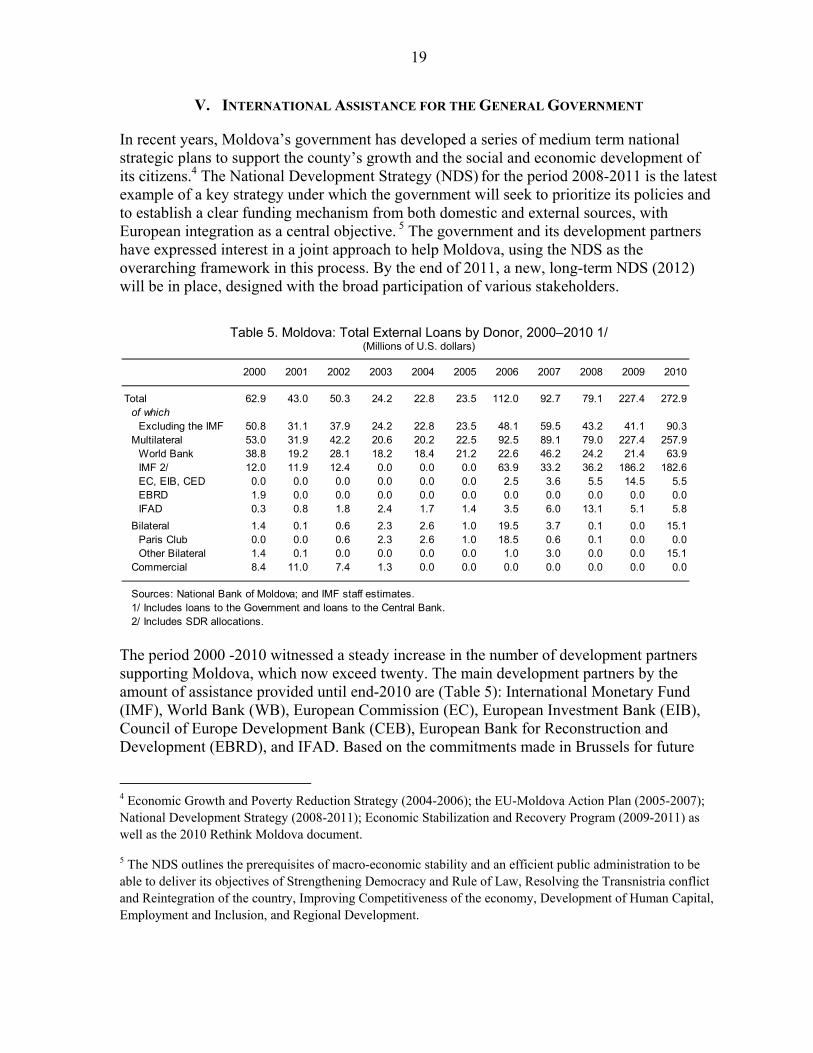
In recent years, Moldova’s government has developed a series of medium term national strategic plans to support the county’s growth and the social and economic development of its citizens.4 The National Development Strategy (NDS) for the period 2008-2011 is the latest example of a key strategy under which the government will seek to prioritize its policies and to establish a clear funding mechanism from both domestic and external sources, with European integration as a central objective. 5 The government and its development partners have expressed interest in a joint approach to help Moldova, using the NDS as the overarching framework in this process. By the end of 2011, a new, long-term NDS (2012) will be in place, designed with the broad participation of various stakeholders.
Table 5. Moldova: Total External Loans by Donor, 2000–2010 1/
(Millions of U.S. dollars)
The period 2000 -2010 witnessed a steady increase in the number of development partners supporting Moldova, which now exceed twenty. The main development partners by the amount of assistance provided until end-2010 are (Table 5): International Monetary Fund (IMF), World Bank (WB), European Commission (EC), European Investment Bank (EIB), Council of Europe Development Bank (CEB), European Bank for Reconstruction and Development (EBRD), and IFAD. Based on the commitments made in Brussels for future
4 Economic Growth and Poverty Reduction Strategy (2004-2006); the EU-Moldova Action Plan (2005-2007); National Development Strategy (2008-2011); Economic Stabilization and Recovery Program (2009-2011) as well as the 2010 Rethink Moldova document.
5 The NDS outlines the prerequisites of macro-economic stability and an efficient public administration to be able to deliver its objectives of Strengthening Democracy and Rule of Law, Resolving the Transnistria conflict and Reintegration of the country, Improving Competitiveness of the economy, Development of Human Capital, Employment and Inclusion, and Regional Development.
2000 2001 2002 2003 2004 2005 2006 2007 2008 2009 2010
Total 62.9 43.0 50.3 24.2 22.8 23.5 112.0 92.7 79.1 227.4 272.9of which
Excluding the IMF 50.8 31.1 37.9 24.2 22.8 23.5 48.1 59.5 43.2 41.1 90.3Multilateral 53.0 31.9 42.2 20.6 20.2 22.5 92.5 89.1 79.0 227.4 257.9
World Bank 38.8 19.2 28.1 18.2 18.4 21.2 22.6 46.2 24.2 21.4 63.9IMF 2/ 12.0 11.9 12.4 0.0 0.0 0.0 63.9 33.2 36.2 186.2 182.6EC, EIB, CED 0.0 0.0 0.0 0.0 0.0 0.0 2.5 3.6 5.5 14.5 5.5EBRD 1.9 0.0 0.0 0.0 0.0 0.0 0.0 0.0 0.0 0.0 0.0IFAD 0.3 0.8 1.8 2.4 1.7 1.4 3.5 6.0 13.1 5.1 5.8
Bilateral 1.4 0.1 0.6 2.3 2.6 1.0 19.5 3.7 0.1 0.0 15.1Paris Club 0.0 0.0 0.6 2.3 2.6 1.0 18.5 0.6 0.1 0.0 0.0Other Bilateral 1.4 0.1 0.0 0.0 0.0 0.0 1.0 3.0 0.0 0.0 15.1
Commercial 8.4 11.0 7.4 1.3 0.0 0.0 0.0 0.0 0.0 0.0 0.0
Sources: National Bank of Moldova; and IMF staff estimates.1/ Includes loans to the Government and loans to the Central Bank.2/ Includes SDR allocations.
20
assistance, the United States (through the Millennium Challenge Corporation and USAID) is the Republic of Moldova’s largest bilateral Development Partner over the period 2010-2013, followed by Romania. Over recent years, there have also been changes in the composition of the donors; some of them, like the DFID, are leaving, while others are becoming more active, like the EU and a number of its member states, like Sweden (SIDA), Germany (GTZ), Roma-nia, Austria, Poland, Czech Republic and Slovakia (Gaibu and others, 2011).
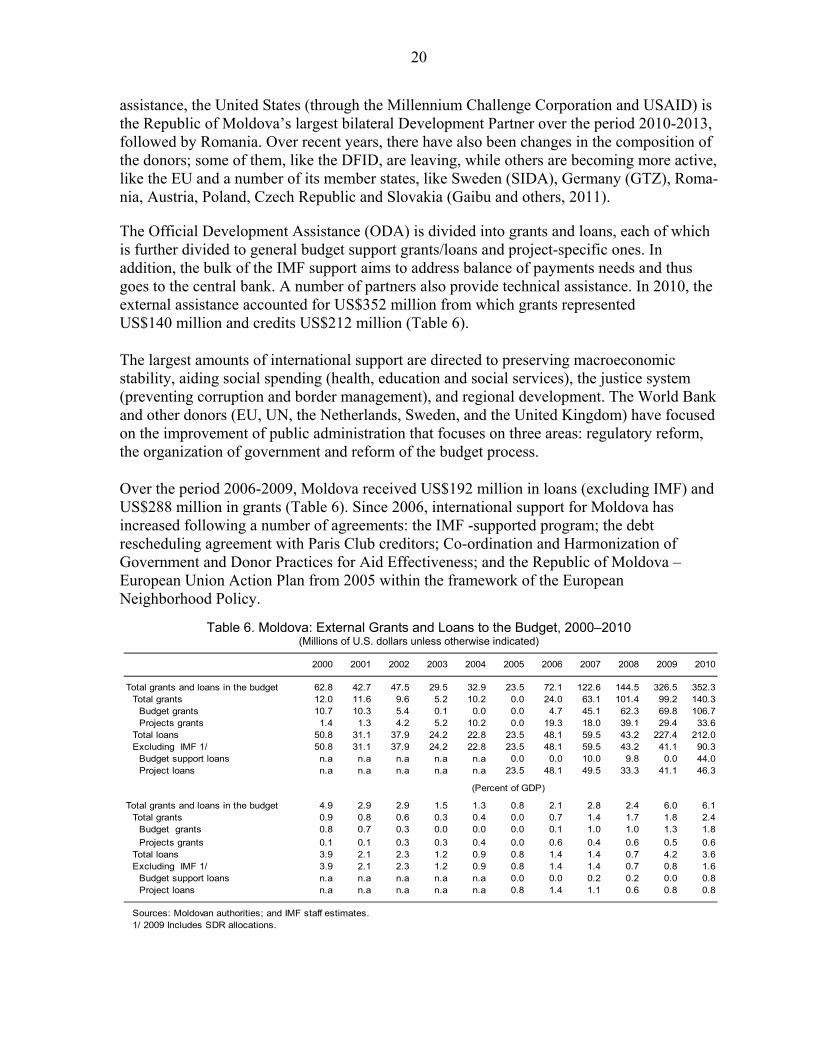
The Official Development Assistance (ODA) is divided into grants and loans, each of which is further divided to general budget support grants/loans and project-specific ones. In addition, the bulk of the IMF support aims to address balance of payments needs and thus goes to the central bank. A number of partners also provide technical assistance. In 2010, the external assistance accounted for US$352 million from which grants represented US$140 million and credits US$212 million (Table 6).
The largest amounts of international support are directed to preserving macroeconomic stability, aiding social spending (health, education and social services), the justice system (preventing corruption and border management), and regional development. The World Bank and other donors (EU, UN, the Netherlands, Sweden, and the United Kingdom) have focused on the improvement of public administration that focuses on three areas: regulatory reform, the organization of government and reform of the budget process.
Over the period 2006-2009, Moldova received US$192 million in loans (excluding IMF) and US$288 million in grants (Table 6). Since 2006, international support for Moldova has increased following a number of agreements: the IMF -supported program; the debt rescheduling agreement with Paris Club creditors; Co-ordination and Harmonization of Government and Donor Practices for Aid Effectiveness; and the Republic of Moldova – European Union Action Plan from 2005 within the framework of the European Neighborhood Policy.
Table 6. Moldova: External Grants and Loans to the Budget, 2000–2010 (Millions of U.S. dollars unless otherwise indicated)
2000 2001 2002 2003 2004 2005 2006 2007 2008 2009 2010
Total grants and loans in the budget 62.8 42.7 47.5 29.5 32.9 23.5 72.1 122.6 144.5 326.5 352.3Total grants 12.0 11.6 9.6 5.2 10.2 0.0 24.0 63.1 101.4 99.2 140.3
Budget grants 10.7 10.3 5.4 0.1 0.0 0.0 4.7 45.1 62.3 69.8 106.7Projects grants 1.4 1.3 4.2 5.2 10.2 0.0 19.3 18.0 39.1 29.4 33.6
Total loans 50.8 31.1 37.9 24.2 22.8 23.5 48.1 59.5 43.2 227.4 212.0Excluding IMF 1/ 50.8 31.1 37.9 24.2 22.8 23.5 48.1 59.5 43.2 41.1 90.3
Budget support loans n.a n.a n.a n.a n.a 0.0 0.0 10.0 9.8 0.0 44.0Project loans n.a n.a n.a n.a n.a 23.5 48.1 49.5 33.3 41.1 46.3
Total grants and loans in the budget 4.9 2.9 2.9 1.5 1.3 0.8 2.1 2.8 2.4 6.0 6.1Total grants 0.9 0.8 0.6 0.3 0.4 0.0 0.7 1.4 1.7 1.8 2.4
Budget grants 0.8 0.7 0.3 0.0 0.0 0.0 0.1 1.0 1.0 1.3 1.8
Projects grants 0.1 0.1 0.3 0.3 0.4 0.0 0.6 0.4 0.6 0.5 0.6Total loans 3.9 2.1 2.3 1.2 0.9 0.8 1.4 1.4 0.7 4.2 3.6Excluding IMF 1/ 3.9 2.1 2.3 1.2 0.9 0.8 1.4 1.4 0.7 0.8 1.6
Budget support loans n.a n.a n.a n.a n.a 0.0 0.0 0.2 0.2 0.0 0.8Project loans n.a n.a n.a n.a n.a 0.8 1.4 1.1 0.6 0.8 0.8
Sources: Moldovan authorities; and IMF staff estimates.1/ 2009 Includes SDR allocations.
(Percent of GDP)

21
Box 5. Moldova and the IMF
Since 1993, Moldova has had the following arrangements with the IMF in support of the authorities' economic adjustment programs: Compensatory and Contingency Financing Facility (CCFF), Systemic Transformation Facility (STF), Stand-by arrangements (SBA), Extended Fund Facilities (EFF), Poverty Reduction and Growth Facilities (PRGF), and (after 2009) Extended Credit Facility (ECF). In 2009 Moldova also benefited from a one-time SDR allocation amounting to SDR 117.71 million. Total Fund credit and loans outstanding at the end of March 2011 amounted to SDR 210.8 million (about US$334 million).
Type of arrangement/resources
Approval date Expiration or Cancellation date
Amount approved (millions of SDR)
Amount drawn (millions of SDR)
CCFF 15-Jan-93 & 19-Dec-94 … 25.7 25.7
STF 1 16,-Sep 1993 15-Sep, 1994 45 45
Stand-by 17-Dec, 1993 16-Mar-95 51.75 51.75
Stand-by 22-Mar, 1995 21-Mar, 1996 58.5 32.4
EFF 20-May, 1996 19-May, 2000 135 87.5
PRGF 21-Dec, 2000 20-Dec, 2003 110.88 27.72
PRGF 2 5-May, 2006 4-May, 2009 110.88 88
ECF 29-Jan, 2010 28-Jan, 2013 184.8 140
EFF 29-Jan, 2010 28-Jan, 2013 184.8 80
Source: Moldova Financial Position in the Fund as of September 30, 2011 http://www.imf.org/external/np/fin/tad/exfin2.aspx?memberKey1=672&date1key=2011-10-20
1 The STF was a temporary IMF financing facility that provided assistance to member countries facing balance of payments difficulties arising from severe disruptions in their trade and payments arrangements owing to a shift from reliance on trading at nonmarket prices to multilateral market-based trade. 2 The PRGF was replaced by the ECF in 2009.
In view of a dramatic worsening of the fiscal situation and a halt of government access to international capital markets, the Executive Board of the IMF approved in January 2010, three-year arrangements for Moldova under the Extended Credit Facility and the Extended Fund Facility (ECF/EFF). With each facility providing an equal amount, the combined financial assistance is equivalent to SDR 369.6 million (about US$574.4 million) to support the country’s economic program. The approval made an amount equivalent to SDR 60 million (about US$93.2 million) immediately available, with the remainder available in installments subject to semiannual reviews. Since late 2009, the Republic of Moldova has taken a course towards deeper integration with the EU. Moreover, the resumption of an IMF-supported program signaled the authorities’ resolve to restore macroeconomic sustainability and counter the effects of the economic crisis. Encouraged by these developments, the international community strongly supported the authorities’ reforms at the Consultative Group Meeting in March 2010. Moldova’s international partners pledged the equivalent of US$2.6 billion over 2010-2014. Most of this amount was provided as budget support (EUR 873.28 million, EC 2010).
22
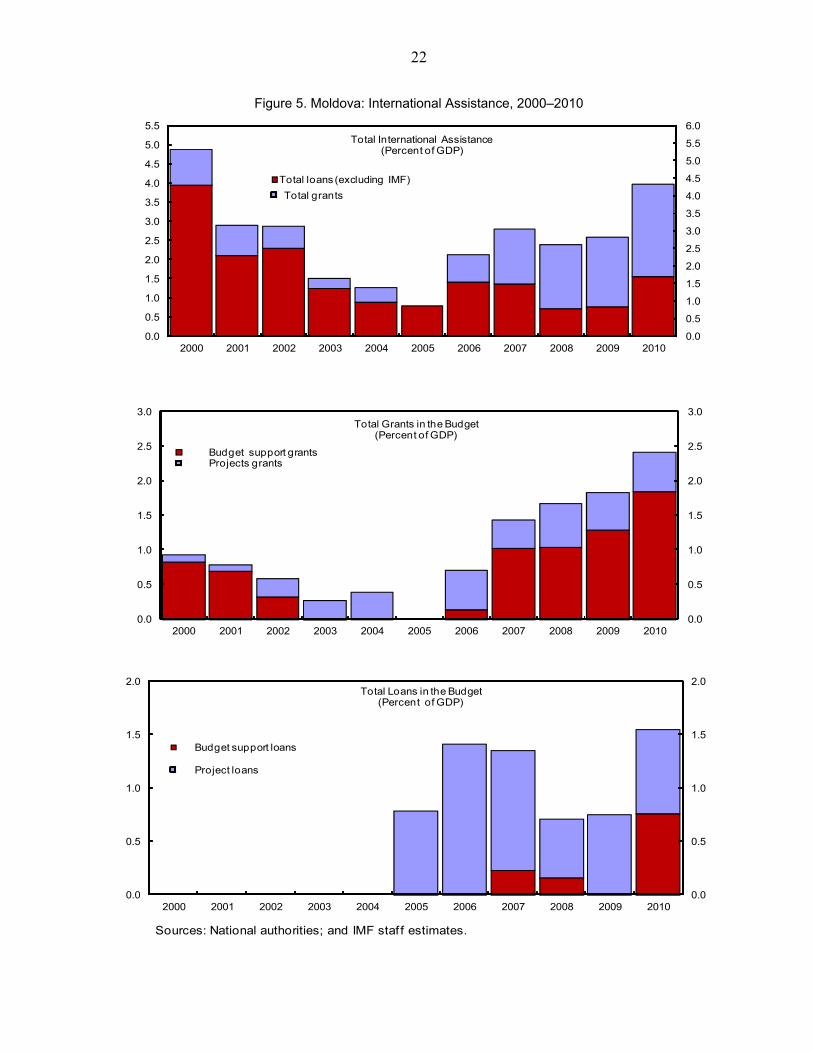
Figure 5. Moldova: International Assistance, 2000–2010
0.0
0.5
1.0
1.5
2.0
2.5
3.0
3.5
4.0
4.5
5.0
5.5
6.0
0.0
0.5
1.0
1.5
2.0
2.5
3.0
3.5
4.0
4.5
5.0
5.5
2000 2001 2002 2003 2004 2005 2006 2007 2008 2009 2010
Total loans (excluding IMF)
Total grants
Total International Assistance(Percent of GDP)
0.0
0.5
1.0
1.5
2.0
2.5
3.0
0.0
0.5
1.0
1.5
2.0
2.5
3.0
2000 2001 2002 2003 2004 2005 2006 2007 2008 2009 2010
Budget support grantsProjects grants
Total Grants in the Budget(Percent of GDP)
0.0
0.5
1.0
1.5
2.0
0.0
0.5
1.0
1.5
2.0
2000 2001 2002 2003 2004 2005 2006 2007 2008 2009 2010
Budget support loans
Project loans
Total Loans in the Budget(Percent of GDP)
Sources: National authorities; and IMF staf f estimates.

23
In spite of donor efforts to better co-ordinate the assistance, accommodating international aid and technical assistance remains a problem for the Moldovan government.6 In particular, the irregularity of disbursements and their integration in the national budget process remain areas of concern (Hajkova and others, 2006). The increasing number of donors limits the possibility of the government to efficiently coordinate donor`s activities, given its already weak capacity (Lozovanu and Viorel, 2010).
Box 6. Moldova: Milestones for Donor Coordination
Moldova signatory to Paris Declaration on Aid Harmonization in 2005. Development Partnership Framework between government and major donors signed in
May 2006. Brussels Consultative Group meeting hosted by the EC and World Bank in December 2006,
with US$1.2 billion pledged. National Development Strategy fully aligned with European Neighborhood Policy Action Plan. Consultative Group Meeting on March 2010 in Brussels pledge on US$2.6 billion to support
Moldova over five years. International partners and government developing new coordination mechanisms, including a
division of labor and mapping exercise for a joint NDS response, to provide a useful, high-level overview of ODA support to the new NDS and map and align projects/programs with theresults of the NDS to better ensure coordination, avoid duplication, and make development assistance more efficient and effective.
VI. RECOMMENDATIONS FOR FUTURE REFORMS
The economy of Moldova strongly rebounded after the crisis in 2009; GDP grew by 6.9 percent in 2010 and 7.5 percent year-on-year in H1 2011. Growth was driven by private domestic demand, spurred by recovering inflows of capital and remittances, and exports aided by improved external environment, good harvests, and favorable agricultural prices. Domestic demand financed by external inflows will remain the main engine of growth over the medium term, but exports, supported by structural reforms and closer integration with the EU, will make a steadily increasing contribution. However, the economy is still vulnerable to external shocks with its large dependence on remittances, external demand, and exceptionally large international assistance to the budget. The current account deficit is expected to widen to over 11 percent of GDP in 2011-12, also reflecting higher costs of energy imports, and significant efforts will be needed to bring it down to the estimated sustainable level of 8 percent of GDP. Rising energy and food prices push inflation up and persistent political instability hinders economic development. On the positive side, public debt at end-2010 was moderate at 30 percent of GDP, and is projected to decline further going forward. Moreover, public external debt largely consists of low-interest
6 An important step in this direction was the Development Partnership Framework ”Co-ordination and Harmonization of Government and Donor Practices for Aid Effectiveness in the Republic of Moldova” between the government and major donors signed in May 2006.
24
debt extended by Moldova’s international development partners. However, private external debt is projected to reach almost 50 percent of GDP in 2012-13, raising the economy’s vulnerability to deterioration in external financing terms. Excluding grants, the structural budget deficit in 2012 would be almost 4 percent of GDP, a level that can be sustained only with the help of large international grants (over 2½ percent of GDP). However, beyond 2012, gains from the tax administration reforms and expenditure rationalization will be needed to compensate for the gradually declining external support, and bring the structural deficit excluding grants down to a more manageable level of 2 percent of GDP by 2016. Fiscal policy therefore needs to remain on a consolidation path. The headline budget deficit is projected to narrow to below 1 percent of GDP in 2012-13, stabilizing at the level over the medium term. This policy will reduce the budget’s dependence on exceptional external assistance and improve its resilience to macroeconomic shocks. The consolidation is expected to be supported by ongoing tax and tax policy administration reforms and rationalization of primary current expenditures. Future tax policy changes should be guided by the well established economic principles of good tax system. While this may involve difficult trade-offs, it is nevertheless important that each tax measure as well as the tax system as a whole be scrutinized against these principles. These principles are:
Neutrality (or efficiency): the tax system should minimize distortions in investment, consumption, saving, and production decisions (with the exception of excises which seek to alleviate negative externalities by affecting consumption decision);
Equity (and perceived fairness): the tax system should treat taxpayers in an identical economic situation equally (horizontal equity) and impose a higher tax burden on those with a higher ability-to-pay (vertical equity);
Simplicity: the tax system should be kept as simple as possible.
As of 2010, Moldova’s tax revenue was still insufficient to finance the public sector’s large needs and maintain a sustainable fiscal position at the same time. Over the medium-term the tax system should therefore generate more revenue, both through a tax policy reform and improvements in tax administration.
The following tax policy measures are envisaged: Reintroduction of the corporate income tax (CIT) at 12 percent, and the cancellation of
most general and individual tax incentives. At the same time, amortization of selected productive assets will be accelerated;
Regarding small business taxation, replacement of the entrepreneurial patent with a single-rate (4 percent) presumptive tax on turnover for businesses not registered as VAT taxpayers.
25
To promote investment, the reform will extend the option to receive value-added tax (VAT) refunds for purchases of investment goods to Chişinău and Bălți. Moreover, VAT exemptions on some non-standard goods and services (such as electricity and motor vehicles) limit the VAT’s revenue-generating potential and should be eventually removed. In addition, the two reduced rates which are only two percentage point apart (6 percent and 8 percent against the standard 20 percent rate) should be unified at 8 percent, as they unnecessarily complicate the regime. Over time, the list of exempt goods and services should be adjusted to comply with the EU Directive on VAT;
Moldova’s excise tax revenues significantly underperform as compared to average levels in the EU and CEE, owing very low rates. Within the framework of the EU Association Agreement, many excise rates need to be significantly increased to comply with the EU minimum requirements at a pace that minimizes the risk of loss of tax base.
On the expenditure side, further rationalization of public spending should be implemented in order to promote a more efficient and pro-poor use of resources. In particular, it is necessary to improve the system of social assistance through better targeting. The unemployment insurance system has significant gaps and does not cover the agricultural, urban informal sector, and returning migrant workers who would share in the suffering from an economic contraction. Public works programs could be an effective mechanism for employing skilled workers to work on planned investments in priority infrastructure. These and other options will need careful consideration to provide effective social protection for Moldovan citizens.
During the period 1998-2010 the wage bill has increased significantly, reaching 10.2 percent of GDP in 2010. The medium-term objective of the authorities is to bring the wage bill back to an affordable ratio of 9-9½ percent relative to GDP. This will be achieved by gradually reducing the number of public sector employees and introducing a performance-based pay.
While the public sector wage system reform has in recent years emerged as one of the key issues in the public administration reform process, significant work remains to be done. The competitiveness of remuneration across job categories should be made more consistent and, ideally, seniority should play less of a role in determining wages in favor of human capital requirements to perform the job (difficulty and complexity of the work, particularly for public health employees). The main policy tools include refraining from unaffordable wage increases and rationalizing budgetary sector employment to efficient levels through attrition, reorganization of offices, and elimination of permanent vacancies. An administrative reform of local government can help rationalize the size of public employment as well.
Expenditure in social sectors, such as education and health, need also to be rationalized and better targeted. Technical assistance from the World Bank and the IMF has been provided in this area since 1998; and a series of recommendations have been provided to enhance the efficiency of education and health care services that could be offset by cutting nonproductive expenditures or poorly targeted subsidies.
The government has launched a comprehensive reform of the education sector. Its main goals are to provide education that meets the demands of the modern economy, create a leaner and better-equipped education system with adequately trained and paid staff, and generate
26
savings to pay for the reform by eliminating excess capacity. The reform will seek class, school, and employment consolidation. These reforms should help permanently reduce expenditure by about ½ percent of GDP per year over the medium term. A large part of the eventual budget savings and financial assistance from the World Bank will be used to improve school quality, secure transportation for students, and repair school bus routes. Long delayed pension reforms (Box 4) need to be finally completed to maintain the social and financial sustainability of the pension system. Early retirement privileges have already begun to be gradually phased out, but more comprehensive reforms are needed. Such reforms cover key changes with respect to retirement age, valorization of wage history, improving compliance and collection, and minimizing the redistributive nature of the system in an effort to strengthen contribution incentives by all groups (IMF 2010b). Public capital spending below 5 percent of GDP is insufficient given Moldova’s large development needs. There is a perception that critical infrastructure needs are largely unmet and that state assets, roads in particular, have suffered massive physical deterioration. As such, sustained long-term economic growth and social development is at risk unless the road network is rehabilitated and maintained (World Bank, 2010). In response, the government has recently mobilized sizable external and domestic resources to rehabilitate and maintain the road network. In the medium term, external financing is assumed to shift away from concessional financing reflecting Moldova’s expected graduation from low-income status. Given development needs and absorption capacity, public external borrowing would probably stay around 2 percent of GDP over the long term, compared with 1.6 percent in 2010.
Box 7. Moldova: Multilateral, Bilateral and Commercial Creditors in the Medium Term
Multilateral creditors: Projected loan disbursements in the near to medium term are relatively high due to the commitments made at the March 2010 Consultative Group meeting, in particular for infrastructure development. From mid-2011, terms on new IDA loans were changed to 1.25 percent interest change, 5-year grace period and a 25-year maturity.
Bilateral creditors: Over the medium and long term, borrowing from bilateral sources is projected to decline due to the likely opening of market access.
Commercial creditors: Over the long term, commercial borrowing is projected to increase. Economic development and financial integration are likely to widen the range of financing sources, including market access. The terms are assumed to be in line with the recent borrowings of sub-investment grade sovereigns.
The decline in the grant element of new external borrowing would make domestic borrowing relatively more attractive, also taking into the account the exchange rate risks associated with external borrowing and a likely increase in foreign interest rates. The authorities’ effort to develop domestic capital markets are also expected to increase the range of investors and lower the cost of domestic debt. The shift towards non-concessional external borrowing and domestic debt would lead to a pick-up in debt service ratios in the long term.
27
Finally, Moldova should improve its management of international assistance and better harness it for economic and social development. As a first step, the authorities will be well advised to create a centralized database to cover the full information on international assistance, as such data is quite dispersed and difficult to access.
VII. CONCLUSION
During 1998-2010, Moldova experienced two major crises, each of which revealed the need for fiscal adjustment and, more importantly, for putting public revenue and expenditure on a long-term sustainable path. While the crises did lead to certain reforms in this direction, these reforms fell victim in the mid-2000s to an environment characterized by constant pressures to reduce taxation and increase expenditures. The challenge in the current round of fiscal consolidation is to sustain and deepen the ongoing reforms in education, public employment and pay, social assistance, and the pension system. The reform agenda remains unfinished and will require sustained efforts in the period ahead. Maintaining the structural fiscal adjustment course to restore fiscal sustainability is the most immediate economic policy priority for Moldova. Accordingly, the fiscal strategy is based on four main pillars: (i) essentially eliminating the large structural fiscal deficit over several years, at a pace matching the economy’s speed of recovery; (ii) achieving fiscal adjustment initially through restraints on the unaffordable public sector wage bill and low priority current spending, and later through deep-reaching pension and administrative reforms; (iii) strengthening revenue primarily through improved tax administration to broaden the tax base, and a growth-friendly tax policy reform; and (iv) using the created fiscal space to increase infrastructure investment and provide well-targeted social assistance to the most vulnerable.
The consolidation plan should initially focus on expenditure rationalization in government wages, goods and services, and transfers, while including important revenue-enhancing measures in tax base broadening, exemptions reduction, and tax administration improvements. While specific short-term expenditure-rationalization and revenue-enhancing measures are essential to stop further deterioration of Moldova’s fiscal balances, they need to be complemented by targeted structural reforms to ensure durable solutions. Public sector wages and employment, education, pension and health care as well as revenue administration are key reform areas. High quality fiscal adjustment measures should be pursued including protecting vital public investment and well-targeted social benefits.
28
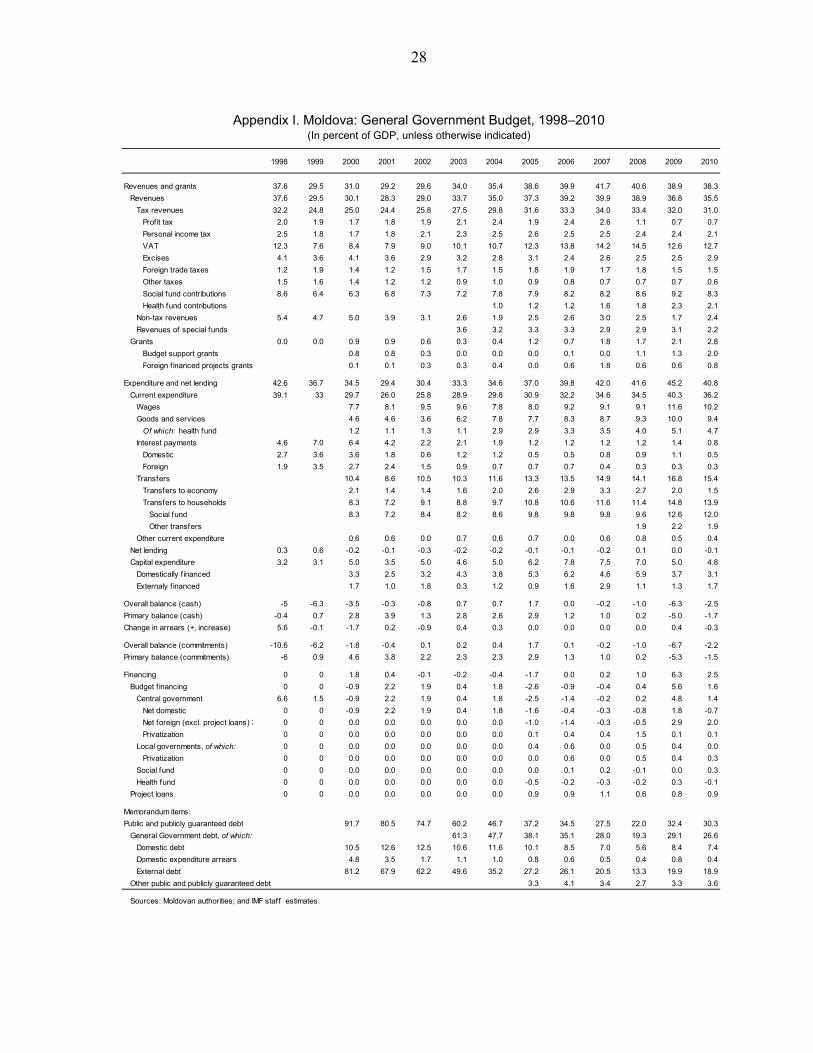
Appendix I. Moldova: General Government Budget, 1998–2010
(In percent of GDP, unless otherwise indicated)
1998 1999 2000 2001 2002 2003 2004 2005 2006 2007 2008 2009 2010
Revenues and grants 37.6 29.5 31.0 29.2 29.6 34.0 35.4 38.6 39.9 41.7 40.6 38.9 38.3
Revenues 37.6 29.5 30.1 28.3 29.0 33.7 35.0 37.3 39.2 39.9 38.9 36.8 35.5
Tax revenues 32.2 24.8 25.0 24.4 25.8 27.5 29.8 31.6 33.3 34.0 33.4 32.0 31.0
Prof it tax 2.0 1.9 1.7 1.8 1.9 2.1 2.4 1.9 2.4 2.6 1.1 0.7 0.7
Personal income tax 2.5 1.8 1.7 1.8 2.1 2.3 2.5 2.6 2.5 2.5 2.4 2.4 2.1
VAT 12.3 7.6 8.4 7.9 9.0 10.1 10.7 12.3 13.8 14.2 14.5 12.6 12.7
Excises 4.1 3.6 4.1 3.6 2.9 3.2 2.8 3.1 2.4 2.6 2.5 2.5 2.9
Foreign trade taxes 1.2 1.9 1.4 1.2 1.5 1.7 1.5 1.8 1.9 1.7 1.8 1.5 1.5
Other taxes 1.5 1.6 1.4 1.2 1.2 0.9 1.0 0.9 0.8 0.7 0.7 0.7 0.6
Social fund contributions 8.6 6.4 6.3 6.8 7.3 7.2 7.8 7.9 8.2 8.2 8.6 9.2 8.3
Health fund contributions 1.0 1.2 1.2 1.6 1.8 2.3 2.1
Non-tax revenues 5.4 4.7 5.0 3.9 3.1 2.6 1.9 2.5 2.6 3.0 2.5 1.7 2.4
Revenues of special funds 3.6 3.2 3.3 3.3 2.9 2.9 3.1 2.2
Grants 0.0 0.0 0.9 0.9 0.6 0.3 0.4 1.2 0.7 1.8 1.7 2.1 2.8
Budget support grants 0.8 0.8 0.3 0.0 0.0 0.0 0.1 0.0 1.1 1.3 2.0
Foreign financed projects grants 0.1 0.1 0.3 0.3 0.4 0.0 0.6 1.8 0.6 0.6 0.8
Expenditure and net lending 42.6 36.7 34.5 29.4 30.4 33.3 34.6 37.0 39.8 42.0 41.6 45.2 40.8
Current expenditure 39.1 33 29.7 26.0 25.8 28.9 29.8 30.9 32.2 34.6 34.5 40.3 36.2
Wages 7.7 8.1 9.5 9.6 7.8 8.0 9.2 9.1 9.1 11.6 10.2
Goods and services 4.6 4.6 3.6 6.2 7.8 7.7 8.3 8.7 9.3 10.0 9.4
Of which: health fund 1.2 1.1 1.3 1.1 2.9 2.9 3.3 3.5 4.0 5.1 4.7
Interest payments 4.6 7.0 6.4 4.2 2.2 2.1 1.9 1.2 1.2 1.2 1.2 1.4 0.8
Domestic 2.7 3.6 3.6 1.8 0.6 1.2 1.2 0.5 0.5 0.8 0.9 1.1 0.5
Foreign 1.9 3.5 2.7 2.4 1.5 0.9 0.7 0.7 0.7 0.4 0.3 0.3 0.3
Transfers 10.4 8.6 10.5 10.3 11.6 13.3 13.5 14.9 14.1 16.8 15.4
Transfers to economy 2.1 1.4 1.4 1.6 2.0 2.6 2.9 3.3 2.7 2.0 1.5
Transfers to households 8.3 7.2 9.1 8.8 9.7 10.8 10.6 11.6 11.4 14.8 13.9
Social fund 8.3 7.2 8.4 8.2 8.6 9.8 9.8 9.8 9.6 12.6 12.0
Other transfers 1.9 2.2 1.9
Other current expenditure 0.6 0.6 0.0 0.7 0.6 0.7 0.0 0.6 0.8 0.5 0.4
Net lending 0.3 0.6 -0.2 -0.1 -0.3 -0.2 -0.2 -0.1 -0.1 -0.2 0.1 0.0 -0.1
Capital expenditure 3.2 3.1 5.0 3.5 5.0 4.6 5.0 6.2 7.8 7.5 7.0 5.0 4.8
Domestically f inanced 3.3 2.5 3.2 4.3 3.8 5.3 6.2 4.6 5.9 3.7 3.1
Externaly f inanced 1.7 1.0 1.8 0.3 1.2 0.9 1.6 2.9 1.1 1.3 1.7
Overall balance (cash) -5 -6.3 -3.5 -0.3 -0.8 0.7 0.7 1.7 0.0 -0.2 -1.0 -6.3 -2.5
Primary balance (cash) -0.4 0.7 2.8 3.9 1.3 2.8 2.6 2.9 1.2 1.0 0.2 -5.0 -1.7
Change in arrears (+, increase) 5.6 -0.1 -1.7 0.2 -0.9 0.4 0.3 0.0 0.0 0.0 0.0 0.4 -0.3
Overall balance (commitments) -10.6 -6.2 -1.8 -0.4 0.1 0.2 0.4 1.7 0.1 -0.2 -1.0 -6.7 -2.2
Primary balance (commitments) -6 0.9 4.6 3.8 2.2 2.3 2.3 2.9 1.3 1.0 0.2 -5.3 -1.5
Financing 0 0 1.8 0.4 -0.1 -0.2 -0.4 -1.7 0.0 0.2 1.0 6.3 2.5
Budget f inancing 0 0 -0.9 2.2 1.9 0.4 1.8 -2.6 -0.9 -0.4 0.4 5.6 1.6
Central government 6.6 1.5 -0.9 2.2 1.9 0.4 1.8 -2.5 -1.4 -0.2 0.2 4.8 1.4
Net domestic 0 0 -0.9 2.2 1.9 0.4 1.8 -1.6 -0.4 -0.3 -0.8 1.8 -0.7
Net foreign (excl. project loans) 3 0 0 0.0 0.0 0.0 0.0 0.0 -1.0 -1.4 -0.3 -0.5 2.9 2.0
Privatization 0 0 0.0 0.0 0.0 0.0 0.0 0.1 0.4 0.4 1.5 0.1 0.1
Local governments, of which: 0 0 0.0 0.0 0.0 0.0 0.0 0.4 0.6 0.0 0.5 0.4 0.0
Privatization 0 0 0.0 0.0 0.0 0.0 0.0 0.0 0.6 0.0 0.5 0.4 0.3
Social fund 0 0 0.0 0.0 0.0 0.0 0.0 0.0 0.1 0.2 -0.1 0.0 0.3
Health fund 0 0 0.0 0.0 0.0 0.0 0.0 -0.5 -0.2 -0.3 -0.2 0.3 -0.1
Project loans 0 0 0.0 0.0 0.0 0.0 0.0 0.9 0.9 1.1 0.6 0.8 0.9
Memorandum items:
Public and publicly guaranteed debt 91.7 80.5 74.7 60.2 46.7 37.2 34.5 27.5 22.0 32.4 30.3
General Government debt, of which: 61.3 47.7 38.1 35.1 28.0 19.3 29.1 26.6
Domestic debt 10.5 12.6 12.5 10.6 11.6 10.1 8.5 7.0 5.6 8.4 7.4
Domestic expenditure arrears 4.8 3.5 1.7 1.1 1.0 0.8 0.6 0.5 0.4 0.8 0.4
External debt 81.2 67.9 62.2 49.6 35.2 27.2 26.1 20.5 13.3 19.9 18.9
Other public and publicly guaranteed debt 3.3 4.1 3.4 2.7 3.3 3.6
Sources: Moldovan authorities; and IMF staff estimates.
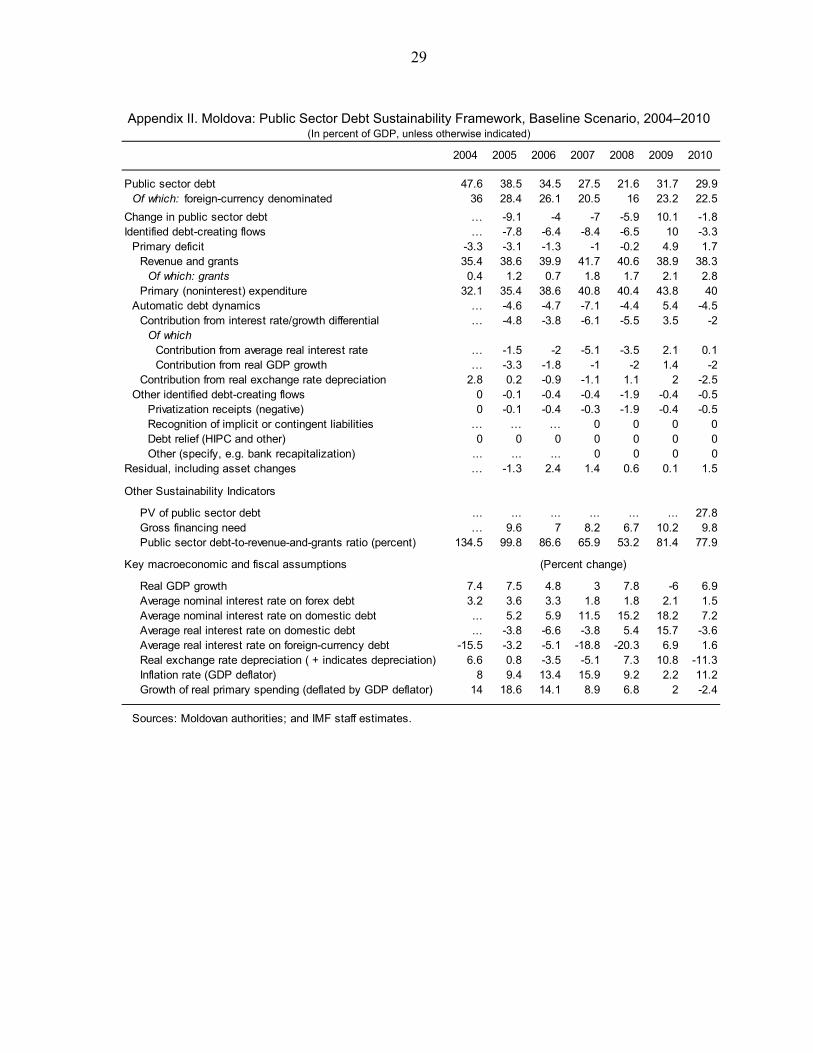
29
Appendix II. Moldova: Public Sector Debt Sustainability Framework, Baseline Scenario, 2004–2010 (In percent of GDP, unless otherwise indicated)
2004 2005 2006 2007 2008 2009 2010
Public sector debt 47.6 38.5 34.5 27.5 21.6 31.7 29.9Of which: foreign-currency denominated 36 28.4 26.1 20.5 16 23.2 22.5
Change in public sector debt … -9.1 -4 -7 -5.9 10.1 -1.8Identified debt-creating flows … -7.8 -6.4 -8.4 -6.5 10 -3.3
Primary deficit -3.3 -3.1 -1.3 -1 -0.2 4.9 1.7Revenue and grants 35.4 38.6 39.9 41.7 40.6 38.9 38.3
Of which: grants 0.4 1.2 0.7 1.8 1.7 2.1 2.8Primary (noninterest) expenditure 32.1 35.4 38.6 40.8 40.4 43.8 40
Automatic debt dynamics … -4.6 -4.7 -7.1 -4.4 5.4 -4.5Contribution from interest rate/growth differential … -4.8 -3.8 -6.1 -5.5 3.5 -2
Of whichContribution from average real interest rate … -1.5 -2 -5.1 -3.5 2.1 0.1Contribution from real GDP growth … -3.3 -1.8 -1 -2 1.4 -2
Contribution from real exchange rate depreciation 2.8 0.2 -0.9 -1.1 1.1 2 -2.5Other identified debt-creating flows 0 -0.1 -0.4 -0.4 -1.9 -0.4 -0.5
Privatization receipts (negative) 0 -0.1 -0.4 -0.3 -1.9 -0.4 -0.5Recognition of implicit or contingent liabilities … … … 0 0 0 0Debt relief (HIPC and other) 0 0 0 0 0 0 0Other (specify, e.g. bank recapitalization) ... ... ... 0 0 0 0
Residual, including asset changes … -1.3 2.4 1.4 0.6 0.1 1.5
Other Sustainability Indicators
PV of public sector debt ... ... ... ... ... ... 27.8Gross financing need … 9.6 7 8.2 6.7 10.2 9.8Public sector debt-to-revenue-and-grants ratio (percent) 134.5 99.8 86.6 65.9 53.2 81.4 77.9
Key macroeconomic and fiscal assumptions
Real GDP growth 7.4 7.5 4.8 3 7.8 -6 6.9Average nominal interest rate on forex debt 3.2 3.6 3.3 1.8 1.8 2.1 1.5Average nominal interest rate on domestic debt ... 5.2 5.9 11.5 15.2 18.2 7.2Average real interest rate on domestic debt ... -3.8 -6.6 -3.8 5.4 15.7 -3.6Average real interest rate on foreign-currency debt -15.5 -3.2 -5.1 -18.8 -20.3 6.9 1.6Real exchange rate depreciation ( + indicates depreciation) 6.6 0.8 -3.5 -5.1 7.3 10.8 -11.3Inflation rate (GDP deflator) 8 9.4 13.4 15.9 9.2 2.2 11.2
14 18.6 14.1 8.9 6.8 2 -2.4
Sources: Moldovan authorities; and IMF staff estimates.
Growth of real primary spending (deflated by GDP deflator)
(Percent change)
30
REFERENCES Ana Popa, Valeriu Prohnitchi, Alex Oprunenco, Adrian Lupusor, Elena Culiuc, and Dumitru
Budianschi, 2011. MEGA, Moldova Economic Growth Analysis / Centru Analitic Independent “Expert Grup” Issue no.4. Chisinau 2011.
Andris Spruds, Renars Danelsons, Vadim Kononenko, 2008. Analysis of the EU’s Assistance
to Moldova. European Parliament, Policy Department External Policies, Brussels, 2008. Corina Gaibu, Leonid Litra, Valentin Lozovanu and Viorel Gîrbu, 2011. “Evaluation of
Moldova’s absorption capacity of external assistance”; Institute for Development and Social Initiatives (IDIS), Chişinău, 2011
Demekas Dimitri G., Balázs Horváth, Elina Ribakova, Yi Wu, 2005, “Foreign Direct
Investment in Southeastern Europe: How (and How Much) Can Policies Help?”, IMF Working Paper No. 05/110 (Washington: International Monetary Fund).
Economic Growth and Poverty Reduction Strategy Paper, 2004, “Economic Growth and
Poverty Reduction Strategy Paper (2004-2006)”, IMF Country Report No. 04/395 (Washington: International Monetary Fund).
European Commission (EC) assistance to Moldova, 2010
http://www.eumission.mfa.md/asistenta-ue pentru-moldova/ Hajkova Giuseppe Nicoletti, Laura Vartia, Kwang-Yeol Yoo1 and Kwang-Yeol Yoo, 2006,
“Taxation, Business Environment and FDI Location in OECD Countries,” OECD, Economic Department Working Papers No. 502, Paris 2006.
Henry Lorie, 2003. “Priorities for Further Fiscal Reforms in the Commonwealth of
Independent States”, IMF Working paper No. 03/209, International Monetary Fund, Washington DC.)
International Monetary Fund,1999. Republic of Moldova: Recent Economic Developments,
IMF Staff Country Report No. 99/110, September 1999. ––––––, 2000. Republic of Moldova – Staff Report for the 2000 Article IV Consultation and
Poverty Reduction and Growth Facility - Request for a Three-Year Arrangement. EBS/00/249. International Monetary Fund, Washington DC.
––––––, 2001, “Options for short-term public expenditure rationalization”. Fiscal Affairs
Department. Report by B. Clements, E. Baldacci, and M. T. Guin-Siu, July 2001. (Washington: International Monetary Fund).
31
––––––, 2001a, Republic of Moldova: Recent Economic Developments, IMF Staff Country
Report No. 01/22, September 1999 ––––––, 2004. Republic of Moldova: Statistical Appendix. IMF Country Report No. 04/40,
May February 2004. (Washington: International Monetary Fund). ––––––, 2007, “Reforming the Income Tax in Moldova”. Fiscal Affairs Department’s
Technical Assistance Report by P. Mullins, A. Jensen, M. Piatkowski, V. Ceriani and S. Giannini, November. (Washington: International Monetary Fund).
––––––, 2008, “Strategies for strengthening tax administration”. Fiscal Affairs Department.
Report by A. Jensen, T. Story and D. Collins, March 2008. (Washington: International Monetary Fund).
––––––, 2009, “Public Financial Management Issues—Progress Report to the Government of
Moldova”. Prepared by B. Olden, IMF Regional Advisor. (Washington: International Monetary Fund).
––––––, 2010a, “Tax Administration—Strengthening Compliance Managament in Moldova”.
Fiscal Affairs Department’s Technical Assistance Report by A. Jensen, F. Bosch and J. Buchanan, February. (Washington: International Monetary Fund).
––––––, 2010b. Republic of Moldova: Selected Issues Paper. IMF Country Report
No. 10/232, Michael Gorbanyov, Tokhir Mirzoev, Octavian Scerbatchi, Gabriel Srour and Philippe Karam. (Washington: International Monetary Fund).
––––––, 2010c. IMF Country Report No. 10/234, July 2010. Republic of Moldova: 2010
Article IV Consultation and Staff Report for the 2010 Article IV Consultation, First Reviews Under the Extended Arrangement and Under the Three-Year Arrangement Under the Extended Credit Facility, and Request for Modification of a Performance Criterion. (Washington: International Monetary Fund).
––––––, 2011, “Tax policy strategy”. Fiscal Affairs Department’s Aide Memoire by K.
Ogata, M. Grote, S. Caner and T. Kinda, April 2011. (Washington: International Monetary Fund).
––––––, 2011a, IMF Country Report No. 11/89, April 2011. Republic of Moldova: Second
Reviews Under the Extended Arrangement and Under the Three–Year Arrangement Under the Extended Credit Facility, and Request for Waiver of Applicability of Performance Criteria. (Washington: International Monetary Fund).
32
Lozovanu Valentin and Gîrbu Viorel, 2010. “Foreign assistance and Moldova`s economic development”. Moldova’s Foreign Policy Statewatch, Issue 11, Chisinau 2010.
Nikoloz Gigineishvili, Marcin Piatkowski, Johan Mathisen, and Irena Asmundson, 2008.
Republic of Moldova: Selected Issues Paper. IMF Country Report No. 08/134 (Washington: International Monetary Fund).
Rethink Moldova, 2010, “Rethink Moldova. Priorities for Medium Term Development.”
Government of Moldova, Report for the Consultative Group Meeting in Brussels, mimeo, March 24, 2010.
Sanjeev Gupta, Benedict Clements, Emanuele Baldacci, and Carlos Mulas-Granados, 2002.
“Expenditure Composition, Fiscal Adjustment, and Growth in Low-Income Countries”, IMF Working paper No. 02/77, International Monetary Fund, Washington DC.)
Shome (ed.), 1995, “Tax Policy Handbook” (Washington: International Monetary Fund). Victoria Boian, 2010. “Taking Stock and Evaluation of Financial Assistance Granted to
Moldova by the European Union”, Chisinau, 2010. World Bank, 2004. Moldova, Country Assistance Evaluation, Report No. 28981. ––––––, 2007, “Improving Public Expenditure Efficiency for Growth and Poverty Reduction
”, A Public Expenditure Review for the Republic of Moldova , Report No. 37933 – MD, February 12, 2007
––––––, 2009a, “Moldova: Policy Notes for the Government”, October 2009. ––––––, 2009b, “Republic of Moldova: Policy Options for Further Reform of the Pension
System”, June 2009. ––––––, 2010, “Program Document—Moldova Economic Recovery Development Policy
Operation”, February 2010.