Fiscal Impact Analysis: New Methods, New Data and Best Practices
53
Fiscal Impact Analysis: New Methods, New Data and Best Practices NJ-APA Conference, New Brunswick Fiscal Impact Analysis New Methods, New Data and Best Practices Speakers Steven L. Nelson, AICP, Econsult Solutions, Inc. Peter Angelides, AICP, Ph.D., Econsult Solutions, Inc. Charles Heydt, AICP, Dresdner Robin Sidney Wong, Ph.D., Community Data Analytics American Planning Association The New Jersey Chapter Conference January 26, 2017 New Brunswick
-
Upload
econsult-solutions -
Category
Economy & Finance
-
view
246 -
download
2
Transcript of Fiscal Impact Analysis: New Methods, New Data and Best Practices

Fiscal Impact Analysis: New Methods, New Data and Best Practices
NJ-APA Conference, New Brunswick
Fiscal Impact Analysis New Methods, New Data and Best
Practices
Speakers
Steven L. Nelson, AICP, Econsult Solutions, Inc.
Peter Angelides, AICP, Ph.D., Econsult Solutions, Inc.
Charles Heydt, AICP, Dresdner Robin
Sidney Wong, Ph.D., Community Data Analytics
American Planning Association The New Jersey Chapter Conference
January 26, 2017 New Brunswick

Fiscal Impact Analysis: New Methods, New Data and Best Practices
NJ-APA Conference, New Brunswick
Introduction
• Fiscal Impact Analysis Methods and
Issues
• Demographic Multipliers in New
Jersey
• Reverse Fiscal Impact Analysis
• Discussions

Fiscal Impact Analysis: New Methods, New Data and Best Practices
NJ-APA Conference, New Brunswick
Fiscal Impact Analysis
Methods and Issues

Fiscal Impact Analysis: New Methods, New Data and Best Practices
NJ-APA Conference, New Brunswick
Why Do We Care about Development Impacts?
• Fiscal
• Economic
• School
• Traffic
• Environment
• Social
• Political
• Others

Fiscal Impact Analysis: New Methods, New Data and Best Practices
NJ-APA Conference, New Brunswick
Fiscal Benefits
• Property tax revenues
• Local wage tax revenues
• Sales tax revenues
• Other levies
• User charges, fees and fines
• Increment of property values / tax base
expansion
• Others

Fiscal Impact Analysis: New Methods, New Data and Best Practices
NJ-APA Conference, New Brunswick
Fiscal Costs
• School expenditures
• Government operating expenses
• Capital improvement costs
• Traffic improvement expenditures
• Debt financing
• Others
Fiscal Impact Analysis: New Methods, New Data and Best Practices
NJ-APA Conference, New Brunswick
Fiscal Impact Analysis
“[a] projection of the direct, current,
public costs, and revenues
associated with residential or
nonresidential growth to the local
jurisdiction(s) in which this growth is
taking place.”
Page 1,
Burchell, Robert W. and David
Listokin, 1978.
The Fiscal Impact Handbook Source: http://www.transactionpub.com/title/The-Complete-Illustrated-Book-of-Development-Definitions-978-1-4128-5504-4.html
Fiscal Impact Analysis: New Methods, New Data and Best Practices
NJ-APA Conference, New Brunswick
“Is growth good or bad for my
for community?” • It depends…
• Development generates a host of new costs for
a municipality.
• Also generates new revenues.
• It is important that municipalities determine if
the new revenues offset the associated costs.
• FIA can help elected officials make fiscally sound land use decisions.

Fiscal Impact Analysis: New Methods, New Data and Best Practices
NJ-APA Conference, New Brunswick
The Uses of FIA
• Planning Applications of FIA include: – Land use policies
– Rezonings
– Annexations/Acquisitions
– Redevelopment
• Budget and Finance Applications – Capital improvement programming
– Revenue forecasting
– Fiscal planning
– Level of service changes

Fiscal Impact Analysis: New Methods, New Data and Best Practices
NJ-APA Conference, New Brunswick
Methods of Fiscal Impact
Analysis • There are number of standard approaches to
choose from.
• For revenues, determine local assessment approach or industry standard.
• For costs, the two most common include: – The Average Cost approach
– The Marginal Cost approach
• The distinction between the two is fundamental to FIA.
• They may result in dramatically different estimates of the fiscal impacts.

Fiscal Impact Analysis: New Methods, New Data and Best Practices
NJ-APA Conference, New Brunswick
The Hybrid Cost Approach
• Combines the Average Cost approach with
a case study analysis.
• The Average Cost approach is used to
calculate per-capita costs and revenues.
• The case studies are used to identify areas of
capacity constraints.
– This helps bring in the benefits of the Marginal
Approach.

Fiscal Impact Analysis: New Methods, New Data and Best Practices
NJ-APA Conference, New Brunswick
Steps of Fiscal Impact Analysis

Fiscal Impact Analysis: New Methods, New Data and Best Practices
NJ-APA Conference, New Brunswick
FIA Steps
• Step 1: Estimate the number of
residents and/or employees
– Total population
– School-Age Children
Based on the type of housing units
– PUMS data provides the most up-to-date
information
Fiscal Impact Analysis: New Methods, New Data and Best Practices
NJ-APA Conference, New Brunswick
FIA Steps
• Step 2: Estimate the costs associated with the development. – Not all spending categories will be
impacted.
• Step 3: Allocate costs between residential and non-residential uses – The method depends on the cost
categories.

Fiscal Impact Analysis: New Methods, New Data and Best Practices
NJ-APA Conference, New Brunswick
FIA Steps
• Step 4: Derive per-capita, per-student,
per-employee expenditure estimates
• Step 5: Sum Total Costs
– Operating costs vs. capital costs
– Use case studies and interviews to
understand potential capital costs
• Step 6: Assess need for new capacity

Fiscal Impact Analysis: New Methods, New Data and Best Practices
NJ-APA Conference, New Brunswick
FIA Steps
• Step 7: Estimate the revenues
associated with the project.
– Property tax vs. other revenues
• Step 8: Allocate other revenue to land
uses
– Estimate per-capita and per-employee
revenues

Fiscal Impact Analysis: New Methods, New Data and Best Practices
NJ-APA Conference, New Brunswick
FIA Steps
• Step 9: Sum Total Revenues
– Property taxes
– Other revenues
– One-time revenue
• Step 10: Calculate the Net-fiscal
impacts
– Revenues - costs

Fiscal Impact Analysis: New Methods, New Data and Best Practices
NJ-APA Conference, New Brunswick
Potential Issues
• Property Tax Abatements – Could pose an issue for the period where
any taxes are abated.
• As if first “fully” occupied.
• The outputs are only as good as the inputs.
• Critical data for estimating impacts.
• Link between revenues and taxes.

Fiscal Impact Analysis: New Methods, New Data and Best Practices
NJ-APA Conference, New Brunswick
• Local Data – Office of Budget/Finance – Tax Assessor
– Clerk’s Office
• State Data – Department of Consumer Affairs
– Department of Education
– Department of Labor and Workforce Development
– Department of Treasury
• Federal Data – Census
– American Community Survey - PUMS
General Data Resources

Fiscal Impact Analysis: New Methods, New Data and Best Practices
NJ-APA Conference, New Brunswick
Estimate Impacts
With a focus on
Demographic Multipliers

Fiscal Impact Analysis: New Methods, New Data and Best Practices
NJ-APA Conference, New Brunswick
Per household
Demographic Multipliers Occupants • Household Size
• Age Breakdown
Housing Types
• Structure Types
• Number of Bedrooms
• Rental or Owned
• Year Structure Built
• Other attributes
School
• School-Age Children
• Public School Attendees
Traffic
• Number of Cars Available

Fiscal Impact Analysis: New Methods, New Data and Best Practices
NJ-APA Conference, New Brunswick
Traditional Demographic
Multiplier
• Developed at Rutgers by Professors Robert
Burchell and David Listokin in the 1980s.
• State level data (except 3 sub-state regions
for NJ)
• The last series is based on 2000 Census PUMS,
i.e. information in the 1990s.
• Sample of occupied units built between
1990 and 2000.

Fiscal Impact Analysis: New Methods, New Data and Best Practices
NJ-APA Conference, New Brunswick
Possible Data Sources
• Census (Summary 1 File)
• American Community Survey
• American Housing Survey
• Customized Survey
• Administrative Records
• Public Use Microdata Sample
X
X
X
X
X

Fiscal Impact Analysis: New Methods, New Data and Best Practices
NJ-APA Conference, New Brunswick
Public Use Microdata Sample
Viable, robust and workable
but not so easy to use

Fiscal Impact Analysis: New Methods, New Data and Best Practices
NJ-APA Conference, New Brunswick
Public Use Microdata Sample
(PUMS)
• ACS raw data: Un-tabulated records about individuals,
households, and housing units.
• Released every year, sample size:1% per year.
• 1-year, 3-year, and 5-year samples.
• 2011-2015 5-year PUMS just released on January 19,
2017.
• Geographic Areas: Region, Division, State, and
PUMA.

Fiscal Impact Analysis: New Methods, New Data and Best Practices
NJ-APA Conference, New Brunswick
Public Use Microdata Areas
(PUMA)
• A PUMA represents at least 100,000 residents, but
can be up to 200,000
• Size depends on population density.
• Revised after each decennial census.
• 73 PUMAs in New Jersey, their 2010 population total
is 8.8 million persons (100% coverage)
• 8 PUMAs in Bergen County, 2 in Jersey City, 2 in
Newark City.
Fiscal Impact Analysis: New Methods, New Data and Best Practices
NJ-APA Conference, New Brunswick
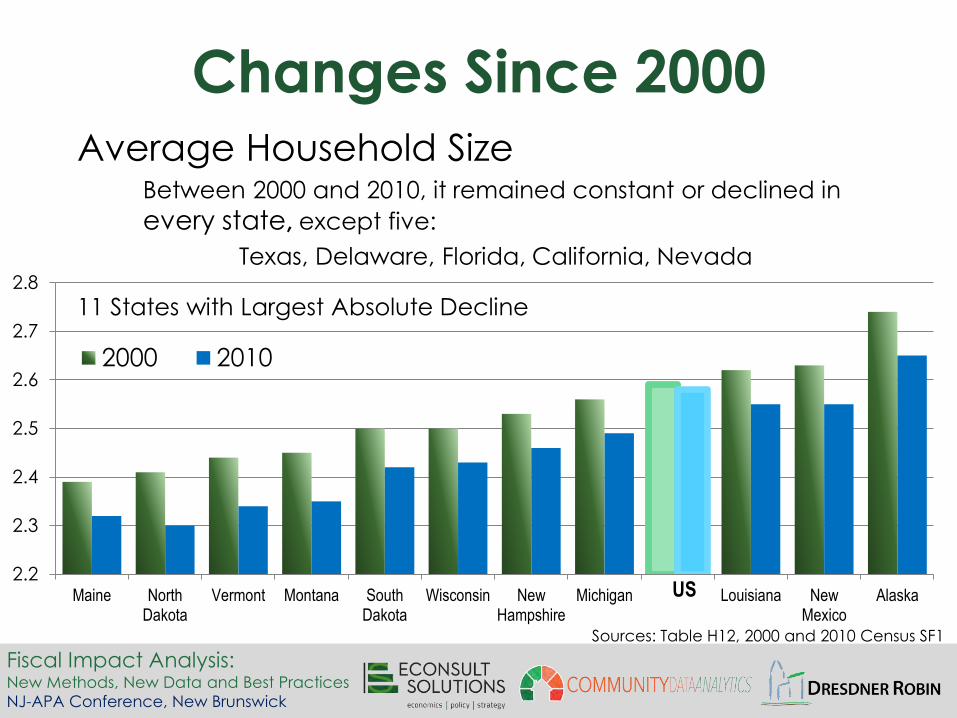
Changes Since 2000 Average Household Size
Between 2000 and 2010, it remained constant or declined in
every state, except five:
Texas, Delaware, Florida, California, Nevada
2.2
2.3
2.4
2.5
2.6
2.7
2.8
Maine NorthDakota
Vermont Montana SouthDakota
Wisconsin NewHampshire
Michigan US Louisiana NewMexico
Alaska
2000 2010
US
11 States with Largest Absolute Decline
Sources: Table H12, 2000 and 2010 Census SF1

Fiscal Impact Analysis: New Methods, New Data and Best Practices
NJ-APA Conference, New Brunswick
Current Demographic Multipliers
and Planning Ratios
Changes since 2000
Local Variations
Fiscal Impact Analysis: New Methods, New Data and Best Practices
NJ-APA Conference, New Brunswick
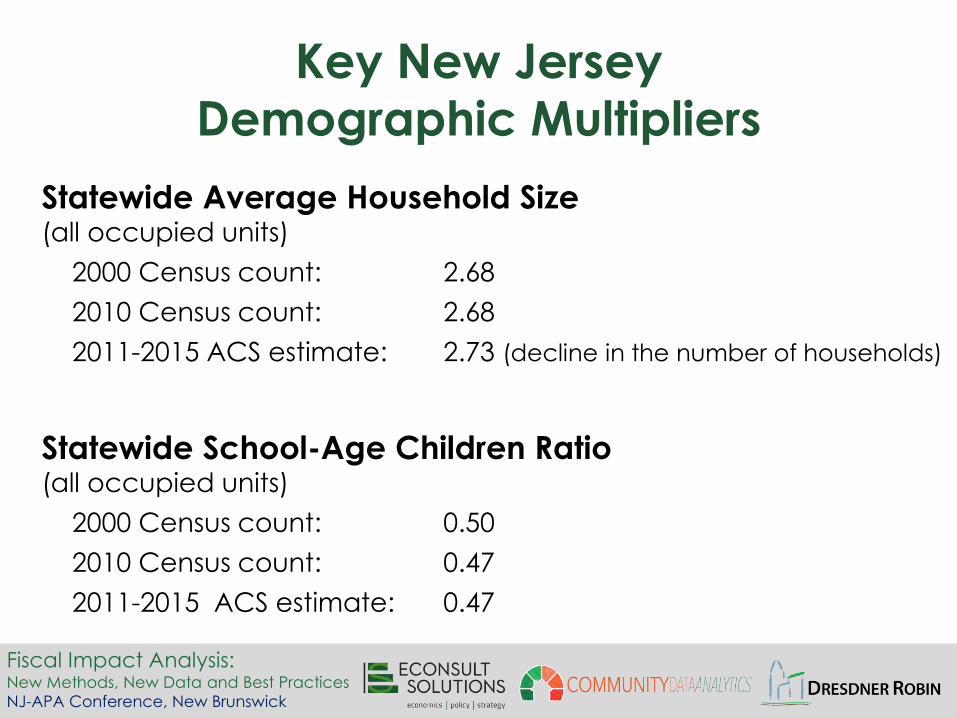
Key New Jersey
Demographic Multipliers
Statewide Average Household Size (all occupied units)
2000 Census count: 2.68
2010 Census count: 2.68
2011-2015 ACS estimate: 2.73 (decline in the number of households)
Statewide School-Age Children Ratio (all occupied units)
2000 Census count: 0.50
2010 Census count: 0.47
2011-2015 ACS estimate: 0.47

Fiscal Impact Analysis: New Methods, New Data and Best Practices
NJ-APA Conference, New Brunswick
0.0
0.5
1.0 2000 20142-Bedroom Units
School-Age Children Ratio New Jersey State Level, New Units Sample,
Sources: Community Data Analytics (2017), based on 2000 Census and 2010-2014 5-Year ACS-PUMS Fannie Mae Foundation (2006), Residential Demographic Multipliers, New Jersey Table 2
0.0
0.5
1.0
1.5
SF
Attached
SF
Detached
MF2-4 MF5+ MF5+
Owned
MF5+
Rented
All Owned All Rented
3-Bedroom Units

Fiscal Impact Analysis: New Methods, New Data and Best Practices
NJ-APA Conference, New Brunswick
Improved New Residents Sample
2014 New Jersey State Level
Scatterplot, 0 to 4 Bedroom Units • New units sample is a subset of
new residents sample.
• New units sample size
fluctuates – housing market.
• New units sample is less reliable.
• New residents sample reflects
long-term effects.
• New residents sample has
slightly larger value except for
units with 5 or more bedrooms.
1
2
3
4
5
1 2 3 4 5
Ne
w U
nits
Sa
mp
le
New Residents Sample Source: Community Data Analytics (2017),
based on 2010-2014 5-Year ACS-PUMS
Pearson R = 0.988
N = 72

Fiscal Impact Analysis: New Methods, New Data and Best Practices
NJ-APA Conference, New Brunswick
Selected PUMAs in New Jersey
• Geography: From different parts of the state
• Counties: 17 PUMAs from 13 counties
• Development density: City, suburb/exurb, shore, rural
• These 17 PUMAs represent a population of 2 million
(2010), or 23% of NJ population.
• Population ranges from 100,700 (Plainfield City) to
188,400 (East Orange City)

Fiscal Impact Analysis: New Methods, New Data and Best Practices
NJ-APA Conference, New Brunswick
New Brunswick
New Jersey
North

Fiscal Impact Analysis: New Methods, New Data and Best Practices
NJ-APA Conference, New Brunswick
New Jersey
South

Fiscal Impact Analysis: New Methods, New Data and Best Practices
NJ-APA Conference, New Brunswick
PUMA Level, New Residents Sample
New Jersey Local Variations: School-Age Children
Occupied Units, all Bedroom Size
Source: Community Data Analytics (2017), based on 2010-2014 5-Year ACS-PUMS
0
0.2
0.4
0.6
0.8
101 304 306 601 701 901 906 1003 1103 1205 1302 1404 1700 2002 2301 2303 2500 NJ
Owned Rented

Fiscal Impact Analysis: New Methods, New Data and Best Practices
NJ-APA Conference, New Brunswick
0.0
0.5
1.0
PUMA Level, New Residents Sample
New Jersey Local Variations: School-Age Children
Source: Community Data Analytics (2017), based on 2010-2014 5-Year ACS-PUMS
All 2-Bedroom Multifamily Units
0.0
0.5
1.0
101 304 306 601 701 901 906 1003 1103 1205 1302 1404 1700 2002 2301 2303 2500 NJ
3-Bedroom Single Family Detached Units

Fiscal Impact Analysis: New Methods, New Data and Best Practices
NJ-APA Conference, New Brunswick
Reverse Fiscal Impact Analysis
Innovative tool in property buy-outs
and acquisition proposals
Disaster prone areas

Fiscal Impact Analysis: New Methods, New Data and Best Practices
NJ-APA Conference, New Brunswick
Reverse Fiscal Impact Analysis
• Reverse FIA is tool for decision-makers
• Hazard mitigation strategy analysis
• Targeted tool for targeted audience
• Focus on fiscal impacts (excludes public
safety/health considerations)
Fiscal Impact Analysis: New Methods, New Data and Best Practices
NJ-APA Conference, New Brunswick
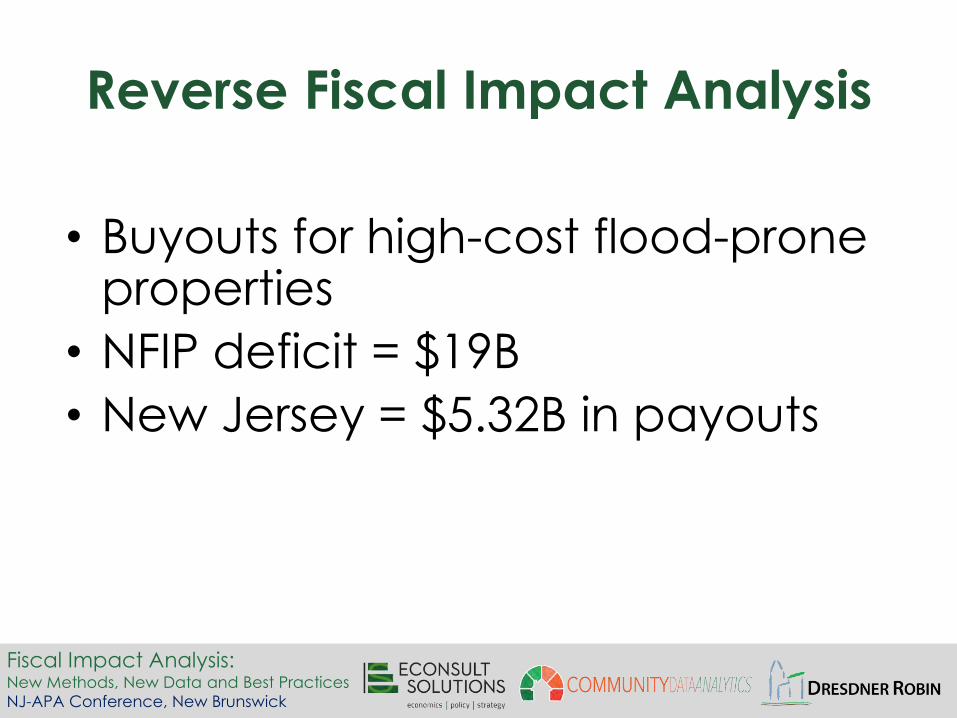
Reverse Fiscal Impact Analysis
• Buyouts for high-cost flood-prone properties
• NFIP deficit = $19B
• New Jersey = $5.32B in payouts

Fiscal Impact Analysis: New Methods, New Data and Best Practices
NJ-APA Conference, New Brunswick
Reverse FIA Framework
• FIA estimates new construction & development
• Reverse FIA estimates loss of development &
“de-construction.”
• Uses real data
• Reduced population = reduced demand for
services
• Typically uses avg. cost method
• Does not include “induced impacts.”
• Does not include acquisition & demo costs.

Fiscal Impact Analysis: New Methods, New Data and Best Practices
NJ-APA Conference, New Brunswick
Reverse FIA Framework
Traditional
• Revenue (taxes, fees,
non-local)
• Costs (municipal
services, education,
debt service)
Reverse FIA
• Costs (revenue lost
from taxes, fees, etc.)
• Revenue (cost savings
from lower demand for
services)

Fiscal Impact Analysis: New Methods, New Data and Best Practices
NJ-APA Conference, New Brunswick
Reverse Fiscal Impact
Methodology 1. Determine geographic area.
2. Identify & quantify type of properties & values.
3. Estimate existing costs by type of property, number of
residents, workers, school children.
4. Estimate losses of residents, workers, school kids.
5. Estimate total revenue loss.
6. Estimate cost savings.
7. Apply sensitivity analysis.
8. Final impact estimate(s).

Fiscal Impact Analysis: New Methods, New Data and Best Practices
NJ-APA Conference, New Brunswick
Simplified Example of Reverse FIA 1. Geographic Area:
– 11 properties;
• 10 residential, 1 non-residential
2. Identify & Quantify Values and Population:
– Assessed value = $1,5000,000;
• $1,000,000 for residential, $500,000 for non-residential.
– 30 residents, 2 school kids, 5 workers
3. Estimate Existing Costs:
– $900/resident, $100/worker, $13000/child
4. Project Losses
– Residents, school kids, workers
– Revenue to municipality and school district

Fiscal Impact Analysis: New Methods, New Data and Best Practices
NJ-APA Conference, New Brunswick
Simplified Example (cont’d)
5. Revenue lost
• Municipal revenue loss:
10 homes x $100,000 + 1 non-residential property x $500,000 x 0.005
(municipal tax rate)
= $5,000 + $2,500 = $7,500
• School District revenue loss:
10 homes x $100,000 + 1 commercial property x $500,000 x 0.01
(school tax rate)
= $5,000 + $10,000 = $15,000

Fiscal Impact Analysis: New Methods, New Data and Best Practices
NJ-APA Conference, New Brunswick
Simplified Example (cont’d)
6. Estimate Cost Savings
• Municipal:
30 persons x $900 + 5 workers x $100 = $27,000
+ $500 = $27,500
• School District:
2 children x $13000 x .5 (share of budget from
local tax) = $13,000

Fiscal Impact Analysis: New Methods, New Data and Best Practices
NJ-APA Conference, New Brunswick
Simplified Example (cont’d) 7. Sensitivity Analysis
• Muni: $27,500 (cost savings) - $7,500 (lost revenue) =
$20,000 potential savings
If muni can save 50% of potential cost savings = $6,250
If muni can save 10% of potential savings = -$4,750
• School District: $13,000 (cost savings) - $15,000 (lost revenue) =
-$2,000 potential cost
If School District can save 50% of potential savings = -$6,500
If School District can save 10% of cost savings = - $14,700
• Interview key staff

Fiscal Impact Analysis: New Methods, New Data and Best Practices
NJ-APA Conference, New Brunswick
Sea Bright Borough
• 198 residential units, 21
commercial properties,
municipal impact only.
• $85,000 (savings) (50% of
savings realized)
• -$208,000 (cost) (25% of
savings realized)
2050 Sea Level Rise
Examples of Reverse FIA

Fiscal Impact Analysis: New Methods, New Data and Best Practices
NJ-APA Conference, New Brunswick
Examples of Reverse FIA
• 100 to 500 residential
properties, municipal
and primary school
impact only.
• Municipal impact:
- $70,000 to -$515,000
(cost)
• Primary School District
impact:
- $37,000 to - $363,000
(cost)
Mystic Island
Fiscal Impact Analysis: New Methods, New Data and Best Practices
NJ-APA Conference, New Brunswick
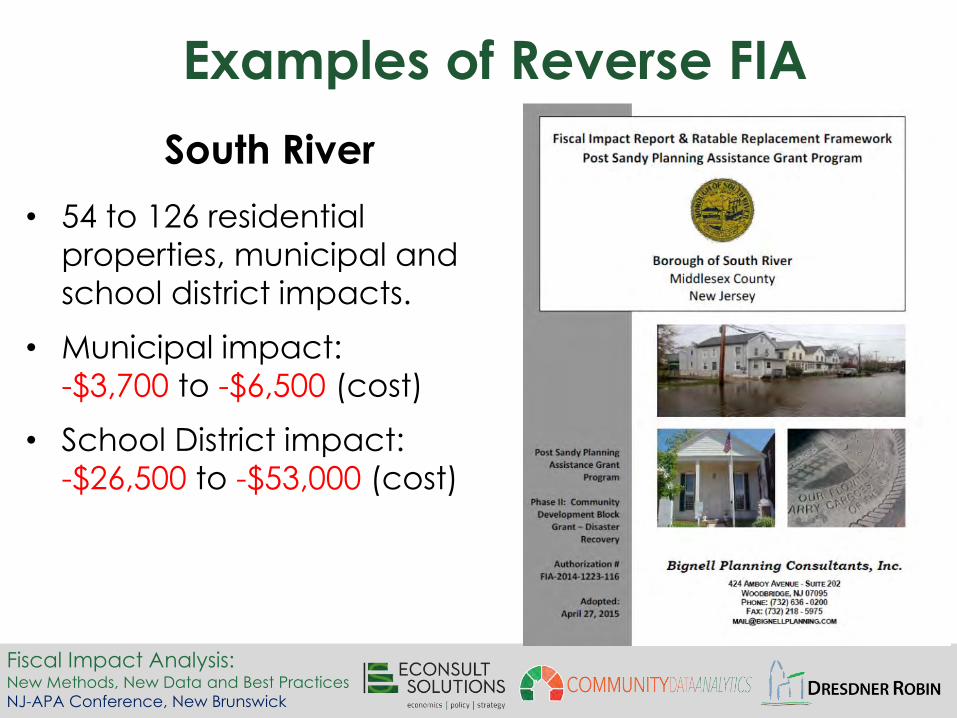
Examples of Reverse FIA
South River
• 54 to 126 residential
properties, municipal and
school district impacts.
• Municipal impact:
-$3,700 to -$6,500 (cost)
• School District impact:
-$26,500 to -$53,000 (cost)
Fiscal Impact Analysis: New Methods, New Data and Best Practices
NJ-APA Conference, New Brunswick
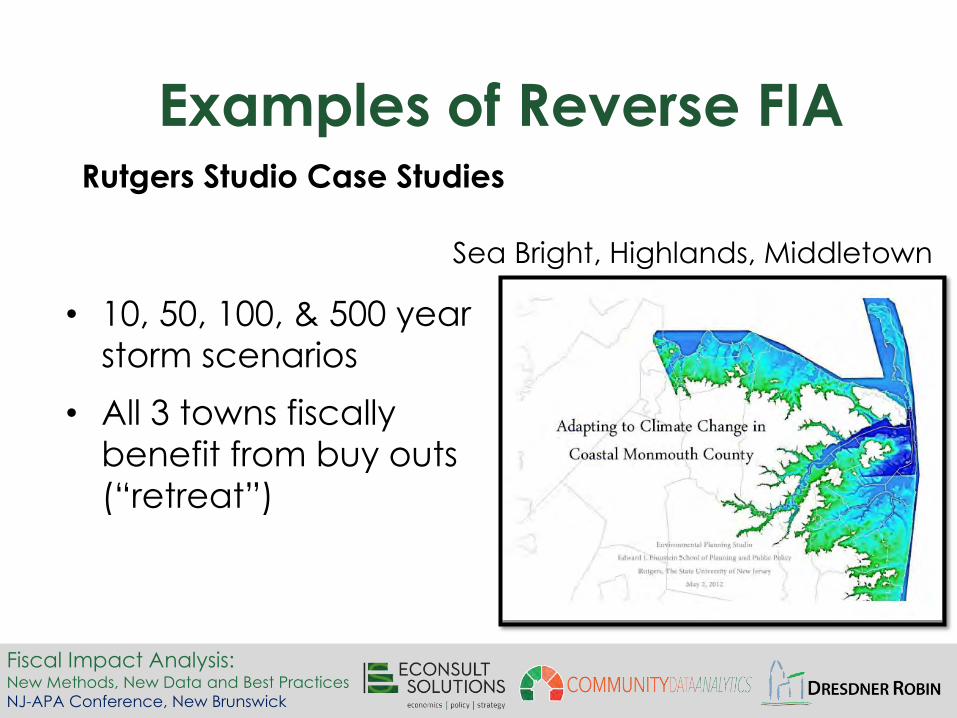
Examples of Reverse FIA
• 10, 50, 100, & 500 year storm scenarios
• All 3 towns fiscally
benefit from buy outs (“retreat”)
Rutgers Studio Case Studies
Sea Bright, Highlands, Middletown

Fiscal Impact Analysis: New Methods, New Data and Best Practices
NJ-APA Conference, New Brunswick
Reverse Fiscal Impact Analysis
Conclusions
• Part of larger analysis of mitigation strategies
• Very limited number of examples, varied results.
• South River example probably overestimates
municipal cost impact.
• Characteristics of different towns result in
significant differences in results.
• School district impacts not fully analyzed
• Need to perform more analyses.

Fiscal Impact Analysis: New Methods, New Data and Best Practices
NJ-APA Conference, New Brunswick
SESSION CONCLUSIONS
• Fiscal Impact Analysis remains an important
tool.
• Hybrid cost approach should be used.
• Current and geographically specific
demographic multipliers & planning ratios from
PUMS should be used.
• FIA can be used to evaluate property buy-outs
and acquisition proposals.

Fiscal Impact Analysis: New Methods, New Data and Best Practices
NJ-APA Conference, New Brunswick
Discussion