First reported occurrence of deformation bands in a ... · First reported occurrence of deformation...
20
First reported occurrence of deformation bands in a platform limestone, the Jurassic Calcare Massiccio Fm., northern Apennines, Italy Marco Antonellini a, ⁎, Lorenzo Petracchini a,b , Andrea Billi b , Davide Scrocca b a Department of Biological, Geological and Environmental Sciences, University of Bologna, via San Alberto 163, 48123 RA, Italy b Institute of Environmental Geology and Geoengineering (IGAG), National Research Council, Rome, Italy abstract article info Article history: Received 22 January 2014 Received in revised form 11 April 2014 Accepted 21 April 2014 Available online 30 April 2014 Keywords: Limestones Micromechanics Strain localization Breccia Permeability Two sets of thrust compactive shear bands and one set of dip–slip compactive shear bands with, in places, asso- ciated slip surfaces have been recognized for the first time in a peculiar high-porosity grainstones of the Calcare Massiccio Fm., a Lower Jurassic platform limestone deformed during the development of the late Messinian Cingoli anticline of northern Apennines, Italy. The deformation bands have been studied by field mapping, thin section image analysis, back scatter SEM imaging, and pressure pulse decay minipermeametry. The deformation micro-mechanism in the compactive shear bands is controlled by plastic smearing and grain size reduction of soft micrite peloids with rare grain crushing and even rarer pressure solution. Plastic smearing is characteristic of the micrite peloids and is different from mechanisms occurring in other known carbonate deformation bands where the grains are bioclastic fragments and sparite ooids. The syntectonic diagenetic episode that brought to cement precipitation in the high-porosity grainstones of the Calcare Massiccio caused the loss of porosity and a change in deformation style from strain localization accommodated by banding to classical faulting along slip surfaces accompanied by thick zones of gouge and breccia. The permeability reduction from the host rock normal to the slip surfaces with associated compactive shear bands is, on average, an order of magnitude, which is less than what measured across deformation bands in other porous carbonates. We speculate that the diagenetic his- tory provides a conceivable hypothesis to explain the high porosity in a Mesozoic platform carbonate at the time of orogenic compression (late Messinian), so that deformation bands, hitherto unknown in this type of rock, could develop. © 2014 Elsevier B.V. All rights reserved. 1. Introduction Strain localization due to failure in porous granular rocks is a well- documented process in the geologic literature especially in siliciclastic sedimentary rocks (Aydin et al., 2006; Fossen et al., 2007 and references therein). The process of strain localization results in characteristic tabu- lar structures called deformation bands (sensu Aydin, 1978; Aydin and Johnson, 1978), which can accommodate shear and compaction or even dilatancy (Antonellini et al., 1994; Aydin et al., 2006; Fossen et al., 2007). Depending on some rock properties (i.e., grain size, grain sorting, porosity, and clay content) and on the stress state at the time of their formation, deformation bands may be associated with porosity reduction accomplished by grain sliding and rotation, grain crushing, and pore collapse (Antonellini et al., 1994; Fossen et al., 2007). The development of deformation bands in porous rocks has been a matter of interest especially for the possible effect that may have on fluid flow in otherwise excellent reservoir rocks (Nelson, 2001). The literature characterizing the petrophysical properties of deformation bands in siliciclastic rocks is now large and significant (Antonellini and Aydin, 1994; Ballas et al., 2012, 2013; Balsamo and Storti, 2010; Braathen et al., 2013; Faulkner et al., 2010; Flodin et al., 2001, 2004; Fossen and Bale, 2002; Fowles and Burley, 1994; Lothe et al., 2002; Main et al., 2000; Ngwenya et al., 2003; Shipton et al., 2002; Sternlof et al., 2004; Taylor and Pollard, 2000). Some studies, in particular, have investigated how important are deformation bands in controlling fluid flow in a reservoir and how their effect is most influential at the scale of the wellbore and small reservoir compartments (Ahmadov et al., 2007; Antonellini and Aydin, 1994, 1995; Jourde et al., 2002; Manzocchi et al., 1999; Matthäi et al., 1998; Sternlof et al., 2006). As mentioned above, deformation bands are typical of porous siliciclastic rocks but, recently, a few examples of these structures have also been documented in porous carbonate rocks (i.e., poorly- cemented porous grainstones and chalk) both in nature (Balsamo et al., 2008; Cilona et al., 2012; Micarelli et al., 2006; Rath et al., 2011; Rustichelli et al., 2012; Tondi, 2007; Tondi et al., 2006; Tondi et al., 2012; Wennberg et al., 2013) and in laboratory physical experiments (Baud et al., 2009; Baxevanis et al., 2006; Cilona et al., 2012; Vajdova et al., 2004, 2010, 2012; Zhu et al., 2010). More frequently, rather than deformation bands, shear deformation across carbonate strata leads to the development of mirror-like through-going slip surfaces accompa- nied by gouge and breccia zones (Billi, 2005, 2007; Billi and Salvini, Tectonophysics 628 (2014) 85–104 ⁎ Corresponding author. Tel.: +39 339 4978001. E-mail address: [email protected] (M. Antonellini). http://dx.doi.org/10.1016/j.tecto.2014.04.034 0040-1951/© 2014 Elsevier B.V. All rights reserved. Contents lists available at ScienceDirect Tectonophysics journal homepage: www.elsevier.com/locate/tecto
Transcript of First reported occurrence of deformation bands in a ... · First reported occurrence of deformation...

Tectonophysics 628 (2014) 85–104
Contents lists available at ScienceDirect
Tectonophysics
j ourna l homepage: www.e lsev ie r .com/ locate / tecto
First reported occurrence of deformation bands in a platform limestone,the Jurassic Calcare Massiccio Fm., northern Apennines, Italy
Marco Antonellini a,⁎, Lorenzo Petracchini a,b, Andrea Billi b, Davide Scrocca b
a Department of Biological, Geological and Environmental Sciences, University of Bologna, via San Alberto 163, 48123 RA, Italyb Institute of Environmental Geology and Geoengineering (IGAG), National Research Council, Rome, Italy
⁎ Corresponding author. Tel.: +39 339 4978001.E-mail address: [email protected] (M. Antonellin
http://dx.doi.org/10.1016/j.tecto.2014.04.0340040-1951/© 2014 Elsevier B.V. All rights reserved.
a b s t r a c t
a r t i c l e i n f oArticle history:Received 22 January 2014Received in revised form 11 April 2014Accepted 21 April 2014Available online 30 April 2014
Keywords:LimestonesMicromechanicsStrain localizationBrecciaPermeability
Two sets of thrust compactive shear bands and one set of dip–slip compactive shear bands with, in places, asso-ciated slip surfaces have been recognized for the first time in a peculiar high-porosity grainstones of the CalcareMassiccio Fm., a Lower Jurassic platform limestone deformed during the development of the late MessinianCingoli anticline of northern Apennines, Italy. The deformation bands have been studied by field mapping, thinsection image analysis, back scatter SEM imaging, and pressure pulse decay minipermeametry. The deformationmicro-mechanism in the compactive shear bands is controlled by plastic smearing and grain size reduction of softmicrite peloids with rare grain crushing and even rarer pressure solution. Plastic smearing is characteristic of themicrite peloids and is different frommechanisms occurring in other known carbonate deformation bandswherethe grains are bioclastic fragments and sparite ooids. The syntectonic diagenetic episode that brought to cementprecipitation in the high-porosity grainstones of the CalcareMassiccio caused the loss of porosity and a change indeformation style from strain localization accommodated by banding to classical faulting along slip surfacesaccompanied by thick zones of gouge and breccia. The permeability reduction from the host rock normal tothe slip surfaces with associated compactive shear bands is, on average, an order of magnitude, which is lessthanwhatmeasured across deformation bands in other porous carbonates.We speculate that the diagenetic his-tory provides a conceivable hypothesis to explain the high porosity in aMesozoic platform carbonate at the timeof orogenic compression (late Messinian), so that deformation bands, hitherto unknown in this type of rock,could develop.
© 2014 Elsevier B.V. All rights reserved.
1. Introduction
Strain localization due to failure in porous granular rocks is a well-documented process in the geologic literature especially in siliciclasticsedimentary rocks (Aydin et al., 2006; Fossen et al., 2007 and referencestherein). The process of strain localization results in characteristic tabu-lar structures called deformation bands (sensu Aydin, 1978; Aydin andJohnson, 1978), which can accommodate shear and compaction oreven dilatancy (Antonellini et al., 1994; Aydin et al., 2006; Fossenet al., 2007). Depending on some rock properties (i.e., grain size, grainsorting, porosity, and clay content) and on the stress state at the timeof their formation, deformation bands may be associated with porosityreduction accomplished by grain sliding and rotation, grain crushing,and pore collapse (Antonellini et al., 1994; Fossen et al., 2007).
The development of deformation bands in porous rocks has been amatter of interest especially for the possible effect that may have onfluid flow in otherwise excellent reservoir rocks (Nelson, 2001). Theliterature characterizing the petrophysical properties of deformationbands in siliciclastic rocks is now large and significant (Antonellini and
i).
Aydin, 1994; Ballas et al., 2012, 2013; Balsamo and Storti, 2010;Braathen et al., 2013; Faulkner et al., 2010; Flodin et al., 2001, 2004;Fossen and Bale, 2002; Fowles and Burley, 1994; Lothe et al., 2002;Main et al., 2000; Ngwenya et al., 2003; Shipton et al., 2002; Sternlofet al., 2004; Taylor and Pollard, 2000). Some studies, in particular,have investigated how important are deformation bands in controllingfluid flow in a reservoir and how their effect is most influential at thescale of the wellbore and small reservoir compartments (Ahmadovet al., 2007; Antonellini and Aydin, 1994, 1995; Jourde et al., 2002;Manzocchi et al., 1999; Matthäi et al., 1998; Sternlof et al., 2006).
As mentioned above, deformation bands are typical of poroussiliciclastic rocks but, recently, a few examples of these structureshave also been documented in porous carbonate rocks (i.e., poorly-cemented porous grainstones and chalk) both in nature (Balsamoet al., 2008; Cilona et al., 2012; Micarelli et al., 2006; Rath et al., 2011;Rustichelli et al., 2012; Tondi, 2007; Tondi et al., 2006; Tondi et al.,2012; Wennberg et al., 2013) and in laboratory physical experiments(Baud et al., 2009; Baxevanis et al., 2006; Cilona et al., 2012; Vajdovaet al., 2004, 2010, 2012; Zhu et al., 2010). More frequently, rather thandeformation bands, shear deformation across carbonate strata leads tothe development of mirror-like through-going slip surfaces accompa-nied by gouge and breccia zones (Billi, 2005, 2007; Billi and Salvini,
86 M. Antonellini et al. / Tectonophysics 628 (2014) 85–104
2000; Fondriest et al., 2013; Siman-Tov et al., 2013; Smith et al., 2011,2013). This rule applies, in particular, to well-cemented platform lime-stones, where primary porosity is usually very low and deformationbands are therefore absent and hitherto unknown.
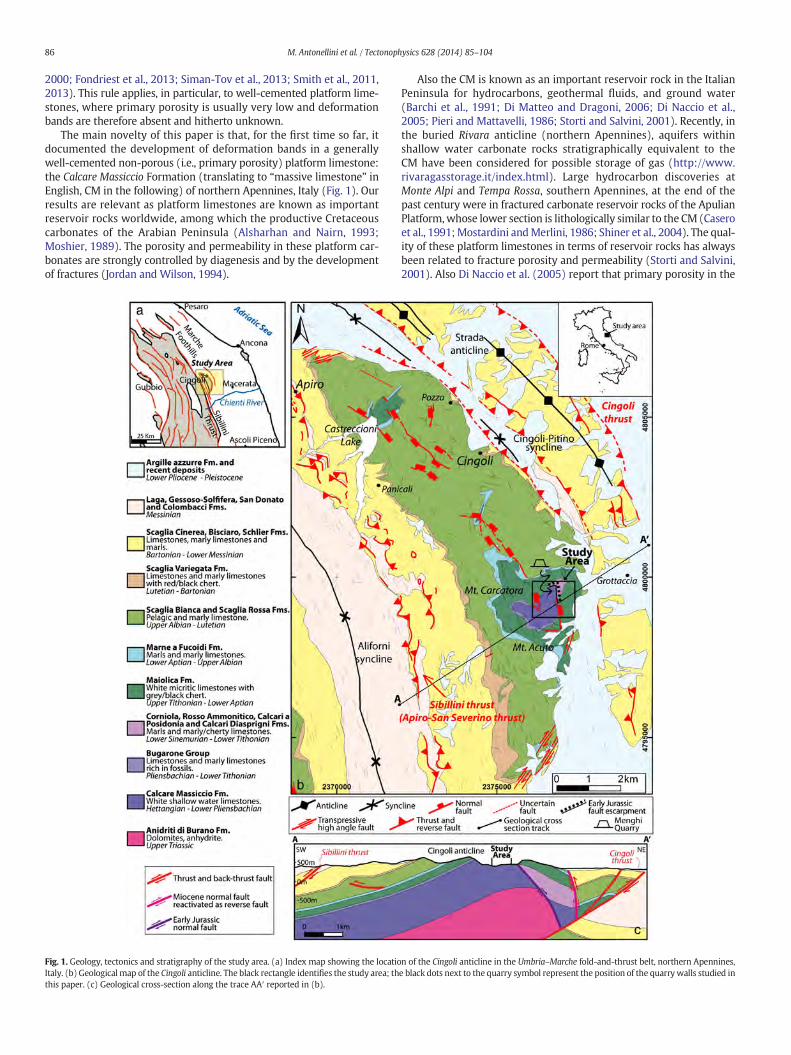
The main novelty of this paper is that, for the first time so far, itdocumented the development of deformation bands in a generallywell-cemented non-porous (i.e., primary porosity) platform limestone:the Calcare Massiccio Formation (translating to “massive limestone” inEnglish, CM in the following) of northern Apennines, Italy (Fig. 1). Ourresults are relevant as platform limestones are known as importantreservoir rocks worldwide, among which the productive Cretaceouscarbonates of the Arabian Peninsula (Alsharhan and Nairn, 1993;Moshier, 1989). The porosity and permeability in these platform car-bonates are strongly controlled by diagenesis and by the developmentof fractures (Jordan and Wilson, 1994).
Fig. 1. Geology, tectonics and stratigraphy of the study area. (a) Index map showing the locatioItaly. (b) Geological map of the Cingoli anticline. The black rectangle identifies the study area; ththis paper. (c) Geological cross-section along the trace AA′ reported in (b).
Also the CM is known as an important reservoir rock in the ItalianPeninsula for hydrocarbons, geothermal fluids, and ground water(Barchi et al., 1991; Di Matteo and Dragoni, 2006; Di Naccio et al.,2005; Pieri and Mattavelli, 1986; Storti and Salvini, 2001). Recently, inthe buried Rivara anticline (northern Apennines), aquifers withinshallow water carbonate rocks stratigraphically equivalent to theCM have been considered for possible storage of gas (http://www.rivaragasstorage.it/index.html). Large hydrocarbon discoveries atMonte Alpi and Tempa Rossa, southern Apennines, at the end of thepast century were in fractured carbonate reservoir rocks of the ApulianPlatform,whose lower section is lithologically similar to the CM (Caseroet al., 1991;Mostardini andMerlini, 1986; Shiner et al., 2004). The qual-ity of these platform limestones in terms of reservoir rocks has alwaysbeen related to fracture porosity and permeability (Storti and Salvini,2001). Also Di Naccio et al. (2005) report that primary porosity in the
n of the Cingoli anticline in the Umbria–Marche fold-and-thrust belt, northern Apennines,e black dots next to the quarry symbol represent the position of the quarrywalls studied in
87M. Antonellini et al. / Tectonophysics 628 (2014) 85–104
CM is notwell-developed, because of cement precipitation and pressuresolution. Where rarely present, primary porosity is mostly localizedwithin high energy thin levels of peritidal origin, whereas the most im-portant porosity in the CM is secondary porosity related to dissolutionand fractures (Di Naccio et al., 2005).
The nomenclature that we adopt for describing the deformationbands in this study is the following: (1) The term deformation bands(DB) is used in a general sense and it refers to most types of failurestructures within porous granular rocks described in the literature(Aydin, 1978; Aydin et al., 2006; Fossen et al., 2007). (2) A compactiveshear band (CSB) is a single shear band that accommodates a smallamount of shear (usually less than 50 mm) and compaction (by grainsliding or crushing) (Aydin et al., 2006; Tondi, 2007). (3) A zone ofcompactive shear bands (ZB) is made up by a variable number (from 2to 50) of sub-parallel CSB localized into a zone (area of strain localiza-tion); if the offset in the ZB is larger than 0.5–1 m a sharp discontinuityor slip surface (SS) forms within the ZB or adjacent to it (Aydin, 1978;Aydin et al., 2006). (4) The term compaction band (CB) is used to describea deformation band with a pure decrease in volume with respect to thesurrounding host rock and no shear; the volumetric compaction is ac-commodated by grain crushing, sliding, pressure solution or plastic defor-mation (Mollema and Antonellini 1996; Aydin et al., 2006). (5) The faultnucleation and evolution process within porous granular rocks usuallydevelop from single (compactive) shear bands (a few mm offset), tozones of (compactive) shear bands (up to 0.5–1 m offset), and to devel-oped faults containing zones of (compactive) shear bands and slip sur-faces representing a discontinuity in the rock mass (Aydin et al., 2006).
The main objectives of this paper are three: (1) to describe and con-strain a partly newmicro-mechanism of compactive shear band (sensuAydin et al., 2006) development in a platform limestone; (2) to docu-ment porosity, pore sizes, and permeability of the host rock and defor-mation bands (including slip surfaces); and (3) to point out the roleof local high-porosity carbonates, as well as the role of the diagenetic–rheological history, in the development of deformation bands across aplatform limestone.
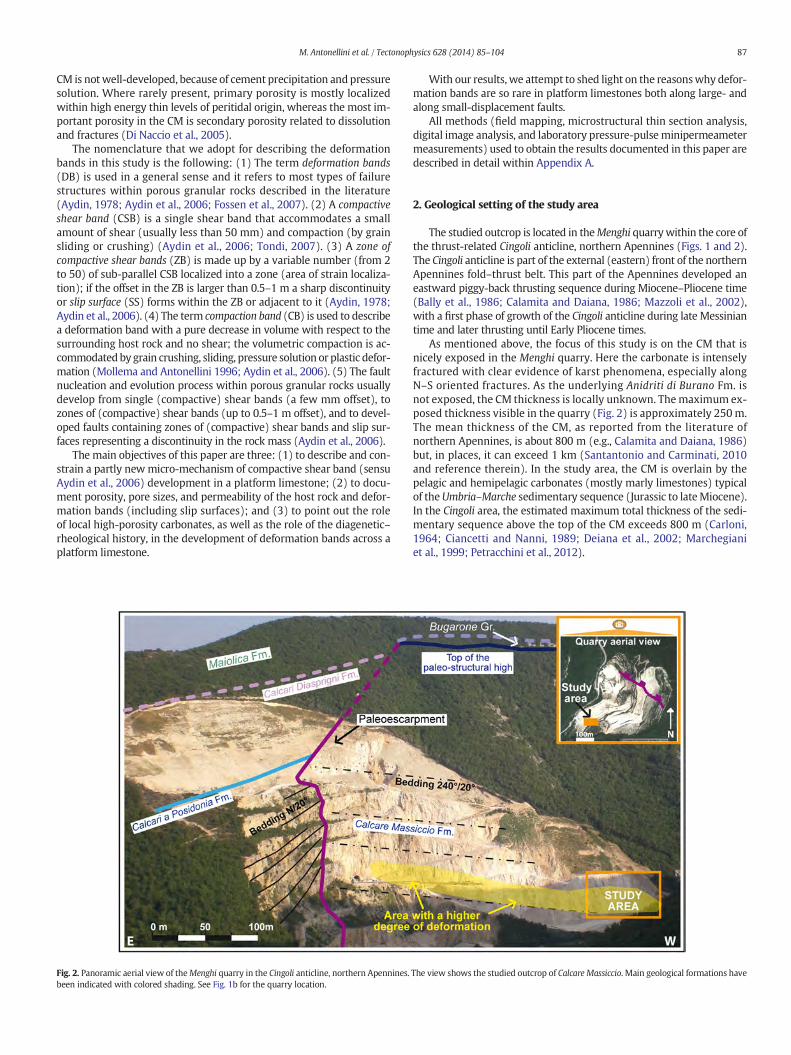
Fig. 2. Panoramic aerial view of theMenghi quarry in the Cingoli anticline, northern Apennines.been indicated with colored shading. See Fig. 1b for the quarry location.
With our results, we attempt to shed light on the reasonswhy defor-mation bands are so rare in platform limestones both along large- andalong small-displacement faults.
All methods (field mapping, microstructural thin section analysis,digital image analysis, and laboratory pressure-pulse minipermeametermeasurements) used to obtain the results documented in this paper aredescribed in detail within Appendix A.
2. Geological setting of the study area
The studied outcrop is located in theMenghi quarrywithin the core ofthe thrust-related Cingoli anticline, northern Apennines (Figs. 1 and 2).The Cingoli anticline is part of the external (eastern) front of the northernApennines fold–thrust belt. This part of the Apennines developed aneastward piggy-back thrusting sequence during Miocene–Pliocene time(Bally et al., 1986; Calamita and Daiana, 1986; Mazzoli et al., 2002),with a first phase of growth of the Cingoli anticline during late Messiniantime and later thrusting until Early Pliocene times.
As mentioned above, the focus of this study is on the CM that isnicely exposed in the Menghi quarry. Here the carbonate is intenselyfractured with clear evidence of karst phenomena, especially alongN–S oriented fractures. As the underlying Anidriti di Burano Fm. isnot exposed, the CM thickness is locally unknown. Themaximum ex-posed thickness visible in the quarry (Fig. 2) is approximately 250m.The mean thickness of the CM, as reported from the literature ofnorthern Apennines, is about 800 m (e.g., Calamita and Daiana, 1986)but, in places, it can exceed 1 km (Santantonio and Carminati, 2010and reference therein). In the study area, the CM is overlain by thepelagic and hemipelagic carbonates (mostly marly limestones) typicalof theUmbria–Marche sedimentary sequence (Jurassic to lateMiocene).In the Cingoli area, the estimated maximum total thickness of the sedi-mentary sequence above the top of the CM exceeds 800 m (Carloni,1964; Ciancetti and Nanni, 1989; Deiana et al., 2002; Marchegianiet al., 1999; Petracchini et al., 2012).
The view shows the studied outcrop of Calcare Massiccio. Main geological formations have
88 M. Antonellini et al. / Tectonophysics 628 (2014) 85–104
The Cingoli anticline is a NE-verging asymmetrical thrust-relatedanticline characterized by a NW–SE-oriented fold axis curving to ap-proximately N–S in the southern part of the fold (Fig. 1). The anticlineis confined by E–W-striking left-lateral faults in the north, and byNNE–SSW-striking right-lateral faults in the south (Fig. 1). In places,the core of the anticline preserves the NW–SE-oriented normal faultsactive during the Early Jurassic rifting, which led to the dismemberingof the CM carbonate platform with the formation of the structuralhigh and the tectonically controlled basins (Marchegiani et al., 1999;
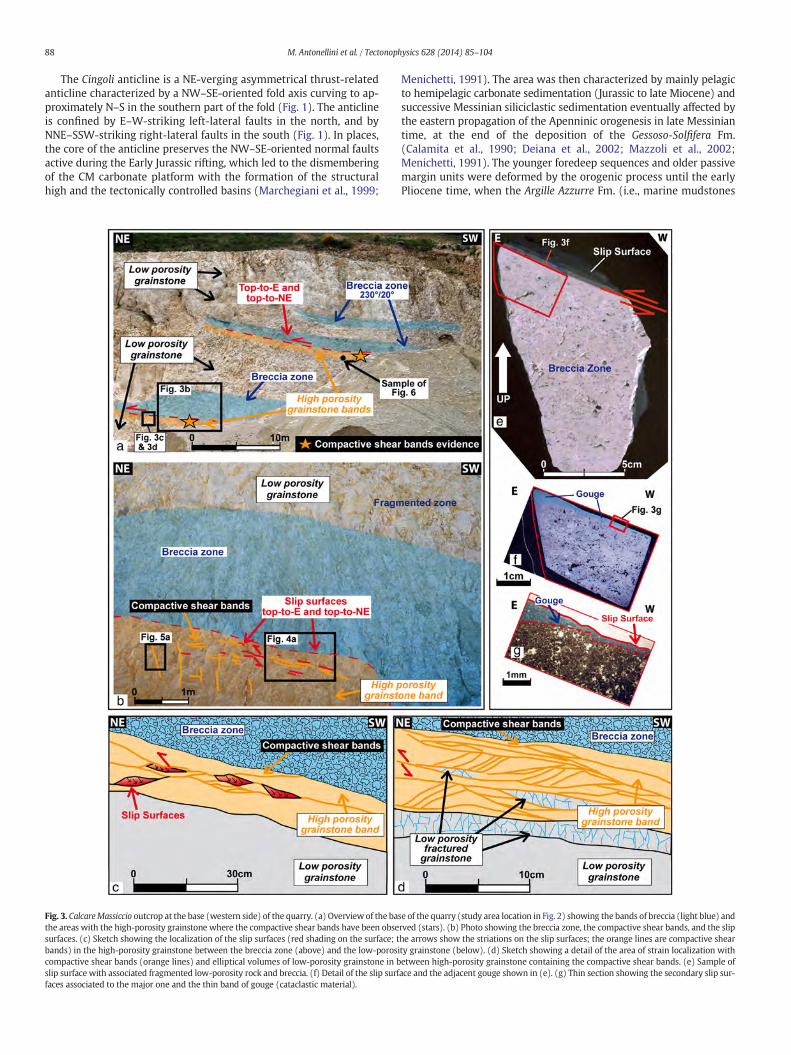
Fig. 3. CalcareMassiccio outcrop at the base (western side) of the quarry. (a) Overviewof the bathe areas with the high-porosity grainstone where the compactive shear bands have been obsesurfaces. (c) Sketch showing the localization of the slip surfaces (red shading on the surface; tbands) in the high-porosity grainstone between the breccia zone (above) and the low-porosicompactive shear bands (orange lines) and elliptical volumes of low-porosity grainstone in bslip surface with associated fragmented low-porosity rock and breccia. (f) Detail of the slip surffaces associated to the major one and the thin band of gouge (cataclastic material).
Menichetti, 1991). The area was then characterized by mainly pelagicto hemipelagic carbonate sedimentation (Jurassic to late Miocene) andsuccessive Messinian siliciclastic sedimentation eventually affected bythe eastern propagation of the Apenninic orogenesis in late Messiniantime, at the end of the deposition of the Gessoso-Solfifera Fm.(Calamita et al., 1990; Deiana et al., 2002; Mazzoli et al., 2002;Menichetti, 1991). The younger foredeep sequences and older passivemargin units were deformed by the orogenic process until the earlyPliocene time, when the Argille Azzurre Fm. (i.e., marine mudstones
se of the quarry (study area location in Fig. 2) showing the bands of breccia (light blue) andrved (stars). (b) Photo showing the breccia zone, the compactive shear bands, and the sliphe arrows show the striations on the slip surfaces; the orange lines are compactive shearty grainstone (below). (d) Sketch showing a detail of the area of strain localization withetween high-porosity grainstone containing the compactive shear bands. (e) Sample oface and the adjacent gouge shown in (e). (g) Thin section showing the secondary slip sur-

Table 1Summary reporting the range in composition, porosity and grain sorting for the undeformed grainstone and for the grainstone deformed by CSB and SS.
Sample Composition % Porosity % Sorting
Peloids Bioclasts Matrix(b20 μm)
Cement ϕ intra-granular(2D SEM)
ϕ inter-granular(2D OSEM)
ϕskeleton
Cu
Host rock— undeformedCalcare Massiccio
Low-porosity Calcare Massiccio 39–49 0 0 45–55 6 0–4 45–55 2High-porosity Calcare Massiccio 73–83 0 0 17–27 7 10–20 17–27 2
Compactive shear bands Compactive shear band (Fig. 9d) 32 0 60 3 5 2–5 0 N4Compactive shear band boundary (Fig. 9e) 60 10 0 14 5–8 10–15 22–25 2Calcare Massiccio next to CSBa (Fig. 9f) 60 8 0 18 5 9 27 2
Slip surface Slip surface wall rockb (Fig. 11d) 70 0 22 0 2–3 5 0 N4Slip surface boundaryc (Fig. 11e) 40 0 55 0 5 0 0 N4Calcare Massiccio next to SSd (Fig. 11f) 60 8 0 18 5 9 27 2
2D SEM porosity: 2D determined from SEM images; 2D OSEM porosity: 2D determined from binary images of thin sections and SEM images.a Zone of host rock outside the boundary.b Zone between the slip surface and 0.5 mm in the wall rock.c Zone between 0.5 mm and 2.5 mm in the wall rock.d Zone of host rock farther than 2.5 mm from the slip surface.
89M. Antonellini et al. / Tectonophysics 628 (2014) 85–104
with minor sandstones) sutured the NE-verging basal thrust of theCingoli anticline.
Previous studies on the Cingoli anticline have documented that thisstructure is affected, at the meso-scale, by diversely-oriented sets offractures and by low-displacement faults (e.g. Ciancetti and Nanni,1989; Marchegiani et al., 1999; Petracchini et al., 2012). Most structuresthat now appear in the exposures as disjunctive fractures and faultsoriginally nucleated as pressure solution seams during the progressivecontraction and formation of the anticline. Petracchini et al. (2012), inparticular, recognized seven sets of pristine pressure solution seamslater evolved, in part, into disjunctive fractures or into low-displacement faults within the pelagic marly limestone of the ScagliaGroup. Most of these sets of pressure solution seams are amenable tothe pre-folding phase of layer-parallel shortening or to the early phasesof folding. Similar fracture patterns have been documented also innearby anticlines involving the same carbonate sedimentary successiontypical of the Umbria–Marche region in the northern Apennines (e.g.,Alvarez et al., 1976, 1978; Engelder and Marshak, 1985; Marshaket al., 1982; Storti and Salvini, 2001; Tavani et al., 2008, 2010, 2012).
3. Results
3.1. Field and mesoscopic observations
The field characteristics of the structures, including their orientation,cross-cutting relationships andmorphological appearance, allow to gainsome insight on their type, origin and timing of development.
The CM exposed at the bottom of theMenghi quarry (Fig. 2) consistsof cyclothemic limestone with rich benthic fauna and flora (mostlygreen algae) accumulated in peritidal environments, mostly sub-tidal.Peloidal/bioclastic grainstones (ooids and bioclasts sometimes visibleat the naked eye) are dominant in this section of the CM.
Pressure solution is not well-developed in the studied CM except fora few isolated short pressure solution seams and some bedding-parallelstylolites where the crude stratification of the rock is visible. The prima-ry porosity of the CM of theMenghi quarry has been generally obliterat-ed by cementation. We will refer to this CM as the “low-porositygrainstone”. In contrast, along an intensely deformed zone croppingout at the base of the CM and, in particular, below some sub-horizontal breccia bands, most of the primary porosity has been pre-served (Figs. 2 and 3a to d). We will refer to this latter CM as the“high-porosity grainstone”. In this high-porosity grainstone we havefound and studied the deformation bands.
Three layers of tectonic breccia with a thickness of 2 to 5 m are ex-posed in the quarry wall (Fig. 3a) and are roughly parallel to the strati-fication that is poorly developed; these layers have an average trend of230°/20° (dip azimuth/dip angle) and contain rock fragments rangingfrom a fraction of 1 mm to a few tens of cm in size. The rock fragments
in the breccia zones are mostly well-cemented low-porosity (b5%)grainstones (Fig. 3e, f, g). The origin of the breccia zones is probably con-nected with a process of sudden low-strain non-rotational brecciation(e.g., Agosta and Aydin, 2006; Doan and Billi, 2011) that will bediscussed in a future dedicated paper. There are two high-porosity(N10% — see Table 1) poorly-cemented grainstone beds just belowtwo of the three breccia zones (Fig. 3a, b; the outcrop conditions didnot allow to reach the upper third breccia layer). These two bed pack-ages of high-porosity grainstone below the breccia zones have a thick-ness ranging from 20 cm to 2 m (Fig. 3b, c, d). Deformation bands areapparent in the high-porosity rock, but they are difficult to identify inthe breccia zones (Fig. 3e, f, g).
An inferred set of compaction bands (CB) and three sets ofcompactive shear bands (CSBs) (sensu Aydin et al., 2006) are presentin the high-porosity grainstone of the studied outcrop (Figs. 4 and 5).The set of CB is bedding-parallel and is virtually indistinguishablefrom the set of CSB (Set CSB 1) next to the thrust slip surfaces(Figs. 4b and 6). The existence of a set of bedding-parallel CB has beensupposed based on the lack of offset among many of the bedding-parallel deformation bands. The set of bedding-parallel CSB (Set CSB 1)adjacent to the slip surface (SS 1) shown in Fig. 6 have an orientation(always following the dip-azimuth/dip convention in this paper) rang-ing from 230°/25° to 290°/25° with an average around 250°/25°. Thebedding has an average orientation 230°/25° (Fig. 4a inset). The stria-tions on the bedding-parallel SS 1 are oriented 230°/20° to 280°/15°and they show a thrust sense of motion (top-to-the-NE for the 230°/20° and top-to-the-E for the 280°/15°) confirmed by small compres-sional steps connecting shear surfaces bymeans of some pressure solu-tion surfaces (stylolites). A second set of CSB (Set CSB 2), which is bestvisible in the slabs cut normal to the SS 1 (Fig. 6b, c), has the same dipazimuth of the bedding-parallel CSB 1 but a lower dip (50°/03° to 70°/05°) and tend to localize in between the bedding-parallel CSB 1(Fig. 6b, c). The third, sparse, and youngest set of CSB (Set CSB 3) cuttingall other sets (Fig. 5) is high angle to bedding and oriented 270°/80°with striations on associated SS 3 showing dip slip movement. Thislatter set is not as well-developed as the other two CSB sets.
The CSB 1 (250°/25°) are organized in zones with a thickness rang-ing from 0.5 to 15 cm; each zone may contain 4 to 20 CSBs whereeach deformation band has a thickness of about 1 mm. The CSB 2(50°/05°) have a density in between SS 1 ranging from 1 to 5 per cmand display an apparent offset of 1–2 mm or less (Fig. 6a). The offseton the SS 1 has been estimated in the order of 5–10 cm. A 10-mm-thick ZB (Fig. 5b, c) belonging to CSB 3 (270°/80°) cuts across a20-mm-thick ZB of CSB 1 causing an apparent offset of 1–1.5 cm(SE side down).
As mentioned above, the ZB often evolves into SS with well-developed slickensides and striations. The SS are short (0.1–1.0 m)and segmented and they have both compressional and extensional
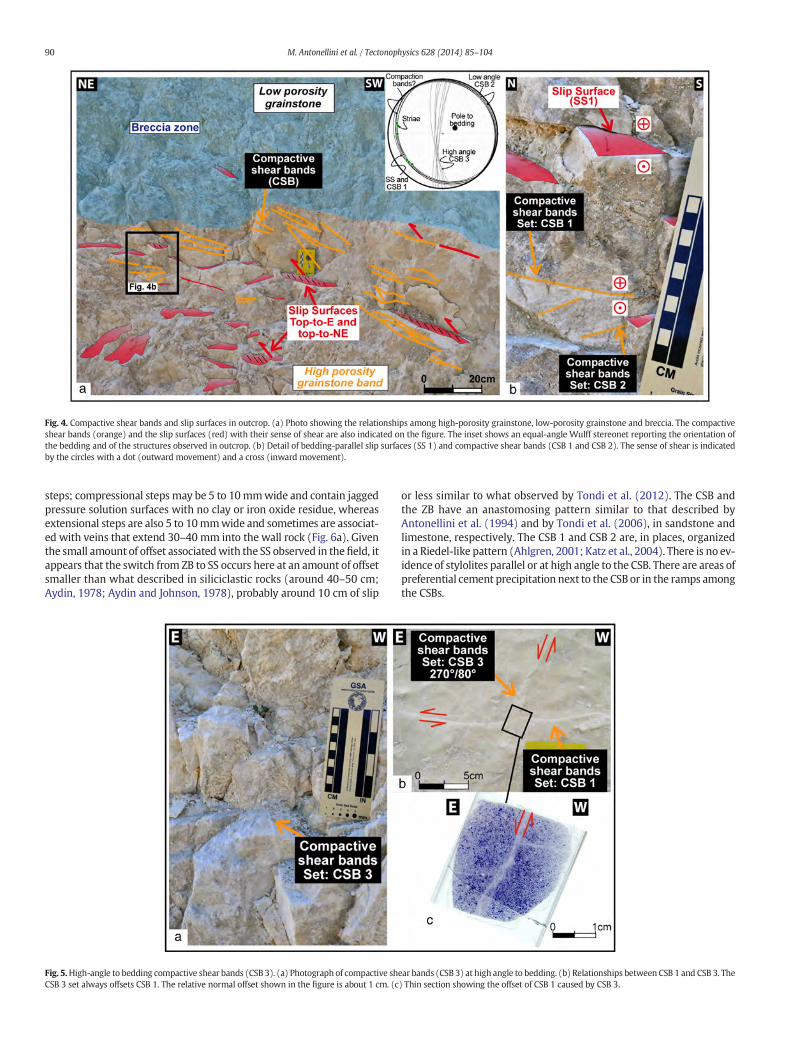
Fig. 4. Compactive shear bands and slip surfaces in outcrop. (a) Photo showing the relationships among high-porosity grainstone, low-porosity grainstone and breccia. The compactiveshear bands (orange) and the slip surfaces (red) with their sense of shear are also indicated on the figure. The inset shows an equal-angle Wulff stereonet reporting the orientation ofthe bedding and of the structures observed in outcrop. (b) Detail of bedding-parallel slip surfaces (SS 1) and compactive shear bands (CSB 1 and CSB 2). The sense of shear is indicatedby the circles with a dot (outward movement) and a cross (inward movement).
90 M. Antonellini et al. / Tectonophysics 628 (2014) 85–104
steps; compressional steps may be 5 to 10mmwide and contain jaggedpressure solution surfaces with no clay or iron oxide residue, whereasextensional steps are also 5 to 10mmwide and sometimes are associat-ed with veins that extend 30–40 mm into the wall rock (Fig. 6a). Giventhe small amount of offset associatedwith the SS observed in thefield, itappears that the switch from ZB to SS occurs here at an amount of offsetsmaller than what described in siliciclastic rocks (around 40–50 cm;Aydin, 1978; Aydin and Johnson, 1978), probably around 10 cm of slip
Fig. 5.High-angle to bedding compactive shear bands (CSB 3). (a) Photograph of compactive shCSB 3 set always offsets CSB 1. The relative normal offset shown in the figure is about 1 cm. (c
or less similar to what observed by Tondi et al. (2012). The CSB andthe ZB have an anastomosing pattern similar to that described byAntonellini et al. (1994) and by Tondi et al. (2006), in sandstone andlimestone, respectively. The CSB 1 and CSB 2 are, in places, organizedin a Riedel-like pattern (Ahlgren, 2001; Katz et al., 2004). There is no ev-idence of stylolites parallel or at high angle to the CSB. There are areas ofpreferential cement precipitation next to the CSB or in the ramps amongthe CSBs.
ear bands (CSB 3) at high angle to bedding. (b) Relationships between CSB 1 and CSB 3. The) Thin section showing the offset of CSB 1 caused by CSB 3.
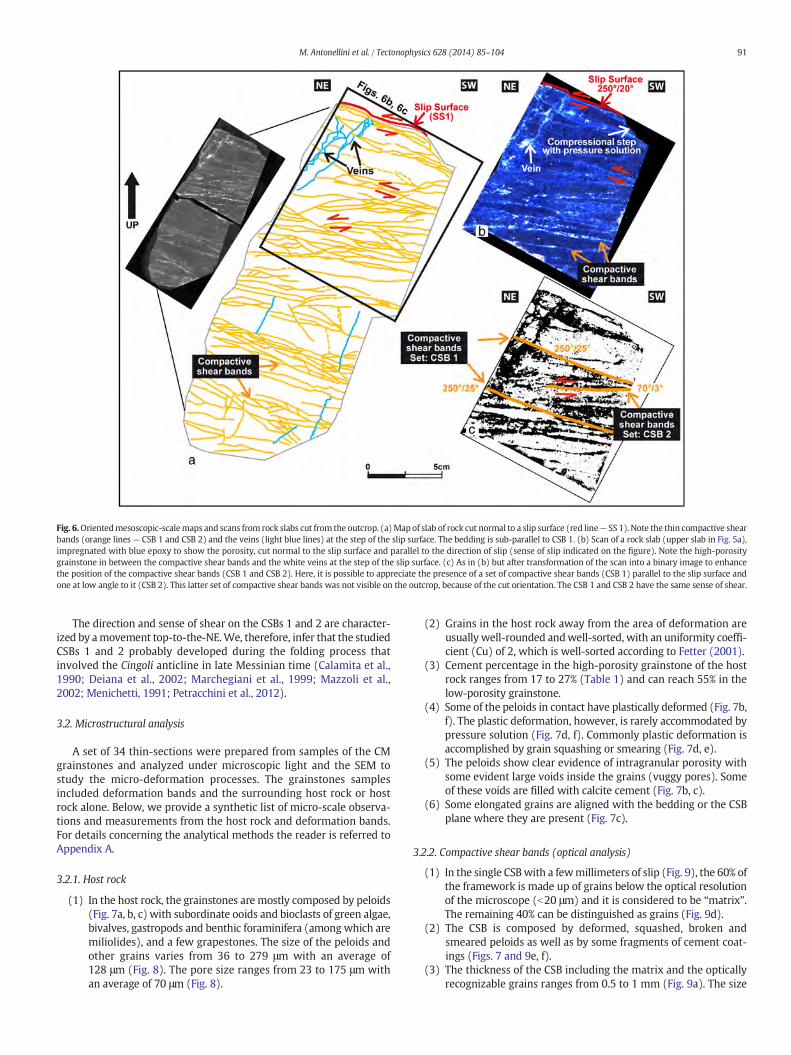
Fig. 6.Orientedmesoscopic-scalemaps and scans from rock slabs cut from the outcrop. (a)Map of slab of rock cut normal to a slip surface (red line— SS 1). Note the thin compactive shearbands (orange lines — CSB 1 and CSB 2) and the veins (light blue lines) at the step of the slip surface. The bedding is sub-parallel to CSB 1. (b) Scan of a rock slab (upper slab in Fig. 5a),impregnated with blue epoxy to show the porosity, cut normal to the slip surface and parallel to the direction of slip (sense of slip indicated on the figure). Note the high-porositygrainstone in between the compactive shear bands and the white veins at the step of the slip surface. (c) As in (b) but after transformation of the scan into a binary image to enhancethe position of the compactive shear bands (CSB 1 and CSB 2). Here, it is possible to appreciate the presence of a set of compactive shear bands (CSB 1) parallel to the slip surface andone at low angle to it (CSB 2). This latter set of compactive shear bands was not visible on the outcrop, because of the cut orientation. The CSB 1 and CSB 2 have the same sense of shear.
91M. Antonellini et al. / Tectonophysics 628 (2014) 85–104
The direction and sense of shear on the CSBs 1 and 2 are character-ized by amovement top-to-the-NE.We, therefore, infer that the studiedCSBs 1 and 2 probably developed during the folding process thatinvolved the Cingoli anticline in late Messinian time (Calamita et al.,1990; Deiana et al., 2002; Marchegiani et al., 1999; Mazzoli et al.,2002; Menichetti, 1991; Petracchini et al., 2012).
3.2. Microstructural analysis
A set of 34 thin-sections were prepared from samples of the CMgrainstones and analyzed under microscopic light and the SEM tostudy the micro-deformation processes. The grainstones samplesincluded deformation bands and the surrounding host rock or hostrock alone. Below, we provide a synthetic list of micro-scale observa-tions and measurements from the host rock and deformation bands.For details concerning the analytical methods the reader is referred toAppendix A.
3.2.1. Host rock
(1) In the host rock, the grainstones are mostly composed by peloids(Fig. 7a, b, c) with subordinate ooids and bioclasts of green algae,bivalves, gastropods and benthic foraminifera (amongwhich aremiliolides), and a few grapestones. The size of the peloids andother grains varies from 36 to 279 μm with an average of128 μm (Fig. 8). The pore size ranges from 23 to 175 μm withan average of 70 μm (Fig. 8).
(2) Grains in the host rock away from the area of deformation areusually well-rounded andwell-sorted, with an uniformity coeffi-cient (Cu) of 2, which is well-sorted according to Fetter (2001).
(3) Cement percentage in the high-porosity grainstone of the hostrock ranges from 17 to 27% (Table 1) and can reach 55% in thelow-porosity grainstone.
(4) Some of the peloids in contact have plastically deformed (Fig. 7b,f). The plastic deformation, however, is rarely accommodated bypressure solution (Fig. 7d, f). Commonly plastic deformation isaccomplished by grain squashing or smearing (Fig. 7d, e).
(5) The peloids show clear evidence of intragranular porosity withsome evident large voids inside the grains (vuggy pores). Someof these voids are filled with calcite cement (Fig. 7b, c).
(6) Some elongated grains are aligned with the bedding or the CSBplane where they are present (Fig. 7c).
3.2.2. Compactive shear bands (optical analysis)
(1) In the single CSBwith a fewmillimeters of slip (Fig. 9), the 60% ofthe framework is made up of grains below the optical resolutionof the microscope (b20 μm) and it is considered to be “matrix”.The remaining 40% can be distinguished as grains (Fig. 9d).
(2) The CSB is composed by deformed, squashed, broken andsmeared peloids as well as by some fragments of cement coat-ings (Figs. 7 and 9e, f).
(3) The thickness of the CSB including the matrix and the opticallyrecognizable grains ranges from 0.5 to 1 mm (Fig. 9a). The size
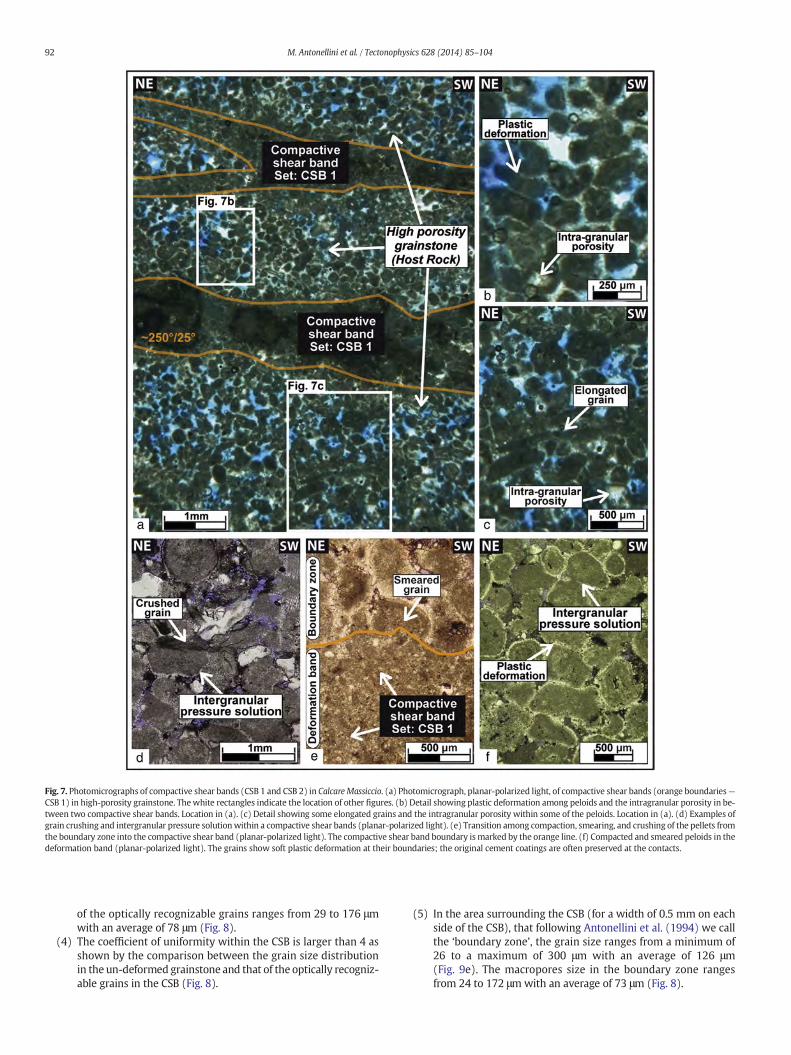
Fig. 7. Photomicrographs of compactive shear bands (CSB 1 and CSB 2) in Calcare Massiccio. (a) Photomicrograph, planar-polarized light, of compactive shear bands (orange boundaries—CSB 1) in high-porosity grainstone. Thewhite rectangles indicate the location of other figures. (b) Detail showing plastic deformation among peloids and the intragranular porosity in be-tween two compactive shear bands. Location in (a). (c) Detail showing some elongated grains and the intragranular porosity within some of the peloids. Location in (a). (d) Examples ofgrain crushing and intergranular pressure solutionwithin a compactive shear bands (planar-polarized light). (e) Transition among compaction, smearing, and crushing of the pellets fromthe boundary zone into the compactive shear band (planar-polarized light). The compactive shear band boundary ismarked by the orange line. (f) Compacted and smeared peloids in thedeformation band (planar-polarized light). The grains show soft plastic deformation at their boundaries; the original cement coatings are often preserved at the contacts.
92 M. Antonellini et al. / Tectonophysics 628 (2014) 85–104
of the optically recognizable grains ranges from 29 to 176 μmwith an average of 78 μm (Fig. 8).
(4) The coefficient of uniformity within the CSB is larger than 4 asshown by the comparison between the grain size distributionin the un-deformed grainstone and that of the optically recogniz-able grains in the CSB (Fig. 8).
(5) In the area surrounding the CSB (for a width of 0.5 mm on eachside of the CSB), that following Antonellini et al. (1994) we callthe ‘boundary zone’, the grain size ranges from a minimum of26 to a maximum of 300 μm with an average of 126 μm(Fig. 9e). The macropores size in the boundary zone rangesfrom 24 to 172 μm with an average of 73 μm (Fig. 8).

Fig. 8. Grain and macropore size distributions in the compactive shear bands, the bound-ary zone, and the host rock. The x-axis is logarithmic in scale.
93M. Antonellini et al. / Tectonophysics 628 (2014) 85–104
3.2.3. Compactive shear bands (SEM analysis)
(1) Analysis of the back scatter (BSE) density images obtained fromthe SEM on samples of ZB (made up of CSB 1) and the surround-ing host rock (Fig. 10) shows the whole of the ZB as an area oflow-porosity.
(2) In the central part of the ZB (Fig. 10a, b), multiple arrays of iso-oriented and somewhere en-echelon open cracks (50 μm to0.5mm in length) can be observed. In someplaces, the cracks ap-pear to have opened taking advantage of grain boundaries(Fig. 10b). The cracks are oriented 70 to 90° from the plane ofthe ZB.
(3) The X-ray diffractometer analysis of the grains inside the ZB andin the host rock shows that the composition of the grainstoneand of the band is pure calcium carbonate (CaCO3) (Fig. 10c).
3.2.4. Slip surfaces
(1) Themicrostructure in samples of CM containing SS 1 (Fig. 11a, b,c) with 10–20 cm apparent offset shows that the area of defor-mation next to the SS 1 includes deformed peloids and matrix(squashed pellets aggregated to the matrix and subordinatecataclastic micrite fragments). This area extends from the slipsurface for 1 to 2 mm into the wall rock (Fig. 11a, b).
(2) In the area close to the slip surface (b0.5 mm from the slip sur-face), the optically detectable grains are 70–75% (Fig. 11d),whereas the matrix is around 25–30%. The optically detectablegrains range in size from 29 to 230 μmwith an average of 107 μm.
(3) In the boundary zone of the SS 1 (from 0.5 to 2.5 mm into thewall rock; Fig. 11e), thematrix is 55% and the optically detectablegrains are 45% of the framework. The optically detectable grainsrange in size from 28 to 240 μm with an average of 113 μm.
(4) Several secondary SS 1 parallel to themain one are visible up to adistance of 1 mm from the main slip surface (Fig. 11b).
(5) Macropores are localized at the termination of the SS or in stepsbetween them (Fig. 11b, c in red). The macropores' shape is sim-ilar to that of a pull-apart gash and they show a sense of shear
consistent with the shear measured on the main SS. Themacropores size ranges from 36 to 500 μm with an average of77 μm.
3.3. Diagenesis
The characteristics of the cement precipitated in the pore spaceamong the grains allowmaking some inferences about the cementationand porosity of carbonate grainstones at the time of deformation bandsdevelopment. In the following, we list the important observationsconcerning the diagenesis:
(1) The first kind of cement observed in the low-porosity grainstoneis made up by fiber calcite fringes and calcite blades around thepeloids (fibrous cement — type 1a cement; Fig. 12a). This is anisopachous even-thickness crust thatmay have formed inmarineconditions (Moore, 2001).
(2) The second kind of cement observed in the low-porositygrainstone fills the center of the pores with sparry equant crys-tals of calcite that is typical of cementation (type 1b; Fig. 12a)in phreatic or burial conditions (Moore, 2001).
(3) The first kind of cement In the high-porosity grainstone (type 2acement; Fig. 12b, c) surrounds the peloids with small equantcrystals of calcite that usually form in freshwater or mixingzone saturated conditions (Moore, 2001). Both the optical mor-phological characteristics of the calcite crystals and the X-raySEM diffraction analysis (EDX) confirm that they are composedof low-Mg-calcite usually forming in freshwater environmentsor burial conditions (Moore, 2001).
(4) The second kind of cement (type 2b cement; Fig. 12b, c) presentin the high-porosity grainstone is composed by large mosaic-equant crystals of calcite probably precipitated from freshwaterin the vadose zone. This latter cement typically has a patchy dis-tribution (typical for the vadose zone), reflecting the occurrenceof both air and water in the pore space. EDX analysis has notshown the presence of Mg in this cement, this evidence also sug-gesting that it may have precipitated in a freshwater unsaturatedaquifer (Moore, 2001).
(5) At the grain contacts within the un-deformed host rock and inthe CSB, type 2a cement is present and is often preserved alongdeformed grain contacts (Fig. 12b).
(6) Rare pressure solution sutures have been observed (Fig. 12b).(7) Some thin (5 to 10 μm thickness) calcite veins (type 3 cement)
cut across all types of cement (types 1 and 2), the CSB, and thesingle grains in both the low-porosity and the high-porositygrainstones (Fig. 12a, c).
In synthesis, the chronological sequence of cement formation is asfollows from the oldest to the youngest ones: in the low-porositygrainstone types 1a, 1b, and 3, in the high-porosity grainstone types2a, 2b, and 3. The different diagenetic characteristics between thelow-porosity grainstone and the high-porosity grainstone are thefollowing:
(1) The first cement precipitation event in the low-porositygrainstone (type 1a) occurs in marine conditions whereas inthe high-porosity grainstone it occurs in a freshwater or mixingenvironment (type 2a).
(2) The second cement precipitation event in the low-porositygrainstone (type 1b) occurs in freshwater-saturated conditionswhereas in the high-porosity grainstone it occurs in freshwater-unsaturated conditions (type 2b).
3.4. Porosity
The measurement of the porosity has two main objectives: the firstone is to gain some insights in the micromechanics of deformation
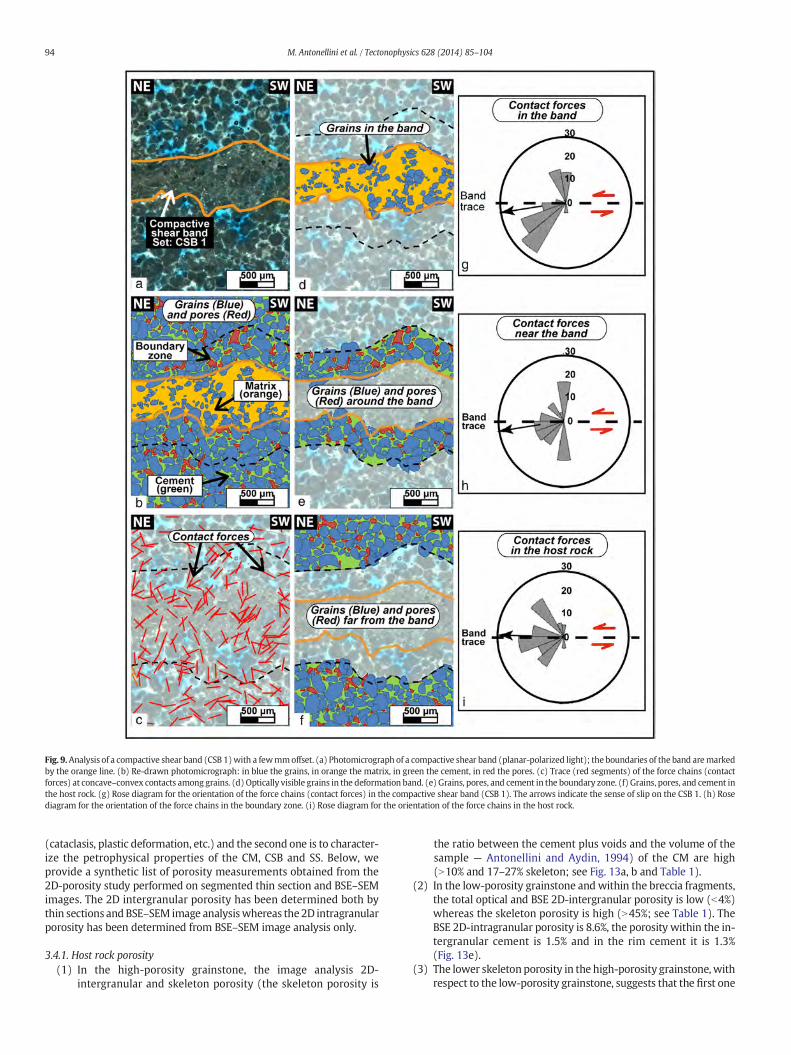
Fig. 9.Analysis of a compactive shear band (CSB 1)with a fewmmoffset. (a) Photomicrograph of a compactive shear band (planar-polarized light); the boundaries of the band aremarkedby the orange line. (b) Re-drawn photomicrograph: in blue the grains, in orange the matrix, in green the cement, in red the pores. (c) Trace (red segments) of the force chains (contactforces) at concave–convex contacts among grains. (d) Optically visible grains in the deformation band. (e) Grains, pores, and cement in the boundary zone. (f) Grains, pores, and cement inthe host rock. (g) Rose diagram for the orientation of the force chains (contact forces) in the compactive shear band (CSB 1). The arrows indicate the sense of slip on the CSB 1. (h) Rosediagram for the orientation of the force chains in the boundary zone. (i) Rose diagram for the orientation of the force chains in the host rock.
94 M. Antonellini et al. / Tectonophysics 628 (2014) 85–104
(cataclasis, plastic deformation, etc.) and the second one is to character-ize the petrophysical properties of the CM, CSB and SS. Below, weprovide a synthetic list of porosity measurements obtained from the2D-porosity study performed on segmented thin section and BSE–SEMimages. The 2D intergranular porosity has been determined both bythin sections and BSE–SEM image analysiswhereas the2D intragranularporosity has been determined from BSE–SEM image analysis only.
3.4.1. Host rock porosity(1) In the high-porosity grainstone, the image analysis 2D-
intergranular and skeleton porosity (the skeleton porosity is
the ratio between the cement plus voids and the volume of thesample — Antonellini and Aydin, 1994) of the CM are high(N10% and 17–27% skeleton; see Fig. 13a, b and Table 1).
(2) In the low-porosity grainstone and within the breccia fragments,the total optical and BSE 2D-intergranular porosity is low (b4%)whereas the skeleton porosity is high (N45%; see Table 1). TheBSE 2D-intragranular porosity is 8.6%, the porosity within the in-tergranular cement is 1.5% and in the rim cement it is 1.3%(Fig. 13e).
(3) The lower skeleton porosity in the high-porosity grainstone,withrespect to the low-porosity grainstone, suggests that the first one

Fig. 10.Analysis of the BSE density images obtained from the SEMon two samples of zonesof deformation bands (CSB 1) with slip surfaces (SS 1— thrust fault) and the surroundinghost rock. (a) The zone of deformation bands is an area of low porosity with somescattered open cracks in between the single bands. The two black rectangles indicate thepositions of Figs. 10b and 13d. The orange lines are the boundaries of the zone. (b) Detailof the arrays of en-echelon cracks in the area of compaction within the zone of deforma-tion bands. The two red lines show two slip surfaces (SS 1 — thrust faults).(c) Diffractogram analysis of the grains inside the deformation band and in the host rockshowing that the composition of the grainstone and of the band is purely calcium carbon-ate (CaCO3).
95M. Antonellini et al. / Tectonophysics 628 (2014) 85–104
underwent a certain degree of compaction whereas the secondone underwent early cementation before important compactiontook place. This might have been caused by the highly dynamicconditions in space and time of the peritidal environment.
3.4.2. Compactive shear band porosity(1) In the boundary of the CSB (within 0.5 mm from each side of the
band), the image analysis 2D-intergranular porosity ranges from10 to 15% and the skeleton porosity ranges from22 to 25% (Table 1).
(2) In the CSB, the BSE intergranular effective porosity is 2–5% (Table 1).The intragranular porositywithin the peloids of the CSB (5%) is pre-served and visible from the BSE images (Fig. 10b).
(3) TheBSE2D-intragranular porosity in grainswithin the area adjacentto the CSB ranges from 5 to 8% and in the CSB is around 5% (Table 1and Fig. 13b, d).
3.4.3. Slip surface wall rock porosity(1) The BSE 2D-intragranular porosity in the area (wall rock) next to
the slip surface (Fig. 13c— from the slip surface to 2.5mmwithinthe wall rock) ranges from 2 to 3%.
3.5. Contact forces and chains
The contact forces and force chains (from now on the term forcechainswill include both) among the grains have beenmeasured to char-acterize the micromechanics of deformation bands and in particular tohelp in their classification and/or in the identification of a prevalentcomponent of shear or compaction (Eichhubl et al., 2010). Force chainspreferentially aligned normal to the plane of the band suggest a mech-anism of prevalent compaction whereas force chains preferentiallyaligned at low angle to the plane of the band suggest a prevalent com-ponent of shear (Eichhubl et al., 2010). In the following, we report therelevant observations on the force chains in and around CSB and SS.The reference plane for measuring the orientation of the force chainsin the rose diagram has been the plane of the band (or slip surface) onwhich the sense of shear is also indicated (Fig. 9g).
3.5.1. Force chains in compactive shear bands(1) In the CSB (Fig. 9c, d), most of the force chains (47%) are oriented
40 to 65° from the plane of the band; 30–35% of the force chainsare oriented almost normal to the plane of the band (Fig. 9g).Given that the majority of the force chains are aligned along thelocalσ1 (40 to 65° from the plane of the band), there is indicationof a substantial component of shear.
(2) In the boundary zone of the CSB (0.5 mm from each side of theband) (Fig. 9c, e),most of the force chains (40%) are oriented nor-mal or high angle to the plane of the CSB and 30% of the chainsare oriented 20 to 40° from the plane of the CSB (Fig. 9h). Thissuggests compaction before the development of the CSB andshear localization afterward.
(3) In the area far from the CSB (Fig. 9c, f; N0.5mmdistance), there isa spread in the force chains orientation (Fig. 9i).
3.5.2. Force chains in slip surface wall rock(1) In thewall rock adjacent to the SS (from the SS to 0.5mm into the
wall rock, Fig. 11c, d) and in between the subsidiary parallel slipsurfaces, 50% of the force chains are oriented parallel to the SSand 20% are inclined 60 to 70° to its plane (Fig. 11g). Thisshows that some of the contact forces (20%) are still alignedalong the local σ1 (40 to 65° from the plane of the SS), as thesense of shear predicts, but that enhanced slip along the SS hasaltered the original orientation of the force chains.
(2) In the zone extending from 0.5 mm to 2.5 mm into the wall rock(Fig. 11c, e), most of the force chains (42%) are oriented 50 to 70°from the SS (Fig. 11h) coherent with the σ1 predicted by thesense of shear.

Fig. 11.Analysis of a slip surface (SS 1— thrust fault)with 10–20 cmoffset. (a) Photomicrograph of a slip surface (red line— planar-polarized light); the cut of the thin section is parallel tothe slip vector and normal to the slip surface. (b) Re-drawn photomicrograph: in blue the grains, in orange the matrix, in green the cement, in red the pores and macro-pores; the thindashed red lines represent secondary slip surfaces (SS 1) parallel to themajor one. The arrow gives the sense of shear on the slip surface. (c) Trace (red segments) of the force chains (con-tact forces) at concave–convex contacts among grains. (d) Visible grains and macro-pores in the area adjacent to the slip surface (b0.5 mm). (e) Grains, macro-pores, and cement in thearea at a distance between 0.5 and 2mmfrom the slip surface. (f) Grains, pores, and cement in the host rock far from the slip surface. (g) Rosediagram for the orientation of the force chains(contact forces) adjacent to the slip surface (b0.5mm). The black arrow shows the average orientation. The red arrows indicate the sense of slip. (h) Rose diagram for the orientation of theforce chains (contact forces) in the area at a distance between 0.5 and 2mmfrom the slip surface. (i) Rose diagram for the orientation of the force chains (contact forces) in the host rock farfrom the slip surface.
96 M. Antonellini et al. / Tectonophysics 628 (2014) 85–104
(3) In the wall rock farther than 2.5 mm from the SS (Fig. 11c, f), theforce chains are mostly oriented (25%) 50 to 70° from the SS(Fig. 11i).
3.6. Permeability
The permeability of the CSB and the SS has been measured to char-acterize the flow properties of the deformed high-porosity grainstoneand to compare them with those of the host rock. Provided that thehigh-porosity grainstones may be locally (regionally most of the aqui-fer porosity in the low-porosity CM is provided by fractures) impor-tant flow units within the CM, we want to assess if the presence ofCSB and SS may degrade the permeability characteristics of theseflow units.
The permeability has been measured with the pressure pulseminipermeameter on 4 samples of grainstone all containing SS, an adja-cent ZB, and un-deformed host rock. The measurements have beendone normal to the SS, parallel to the ZB (where it had a thickness ofat least 10 mm), and in the un-deformed host rock. All details of themeasurements are reported for each sample within Table 2. In the fol-lowing we summarize the measurements in the four samples:
(1) The average permeability in the un-deformed high-porositygrainstone host rock is 112.3 mD (1.11E-13 m2) with a rangefrom 26.5 to 265.3 mD (2.62E-14–2.62E-13 m2).
(2) The average permeability normal to the SS is 7.8 mD (7.67E-15m2) with a range from 1.3 to 21.7 mD (1.28E-15–2.14E-14 m2).
(3) The average permeability parallel to the ZB is 48.2 mD (4.76E-14m2) with a range from 1.1 to 122 mD (1.09E-15–1.21E-13 m2).
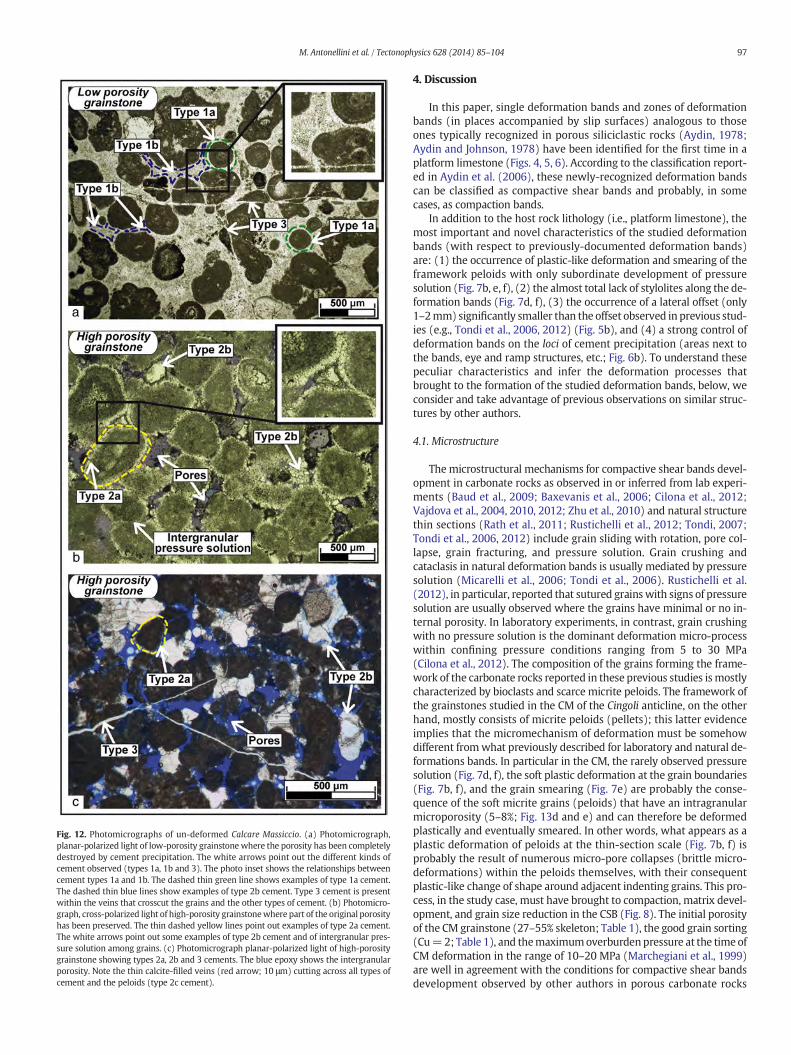
Fig. 12. Photomicrographs of un-deformed Calcare Massiccio. (a) Photomicrograph,planar-polarized light of low-porosity grainstone where the porosity has been completelydestroyed by cement precipitation. The white arrows point out the different kinds ofcement observed (types 1a, 1b and 3). The photo inset shows the relationships betweencement types 1a and 1b. The dashed thin green line shows examples of type 1a cement.The dashed thin blue lines show examples of type 2b cement. Type 3 cement is presentwithin the veins that crosscut the grains and the other types of cement. (b) Photomicro-graph, cross-polarized light of high-porosity grainstonewhere part of the original porosityhas been preserved. The thin dashed yellow lines point out examples of type 2a cement.The white arrows point out some examples of type 2b cement and of intergranular pres-sure solution among grains. (c) Photomicrograph planar-polarized light of high-porositygrainstone showing types 2a, 2b and 3 cements. The blue epoxy shows the intergranularporosity. Note the thin calcite-filled veins (red arrow; 10 μm) cutting across all types ofcement and the peloids (type 2c cement).
97M. Antonellini et al. / Tectonophysics 628 (2014) 85–104
4. Discussion
In this paper, single deformation bands and zones of deformationbands (in places accompanied by slip surfaces) analogous to thoseones typically recognized in porous siliciclastic rocks (Aydin, 1978;Aydin and Johnson, 1978) have been identified for the first time in aplatform limestone (Figs. 4, 5, 6). According to the classification report-ed in Aydin et al. (2006), these newly-recognized deformation bandscan be classified as compactive shear bands and probably, in somecases, as compaction bands.
In addition to the host rock lithology (i.e., platform limestone), themost important and novel characteristics of the studied deformationbands (with respect to previously-documented deformation bands)are: (1) the occurrence of plastic-like deformation and smearing of theframework peloids with only subordinate development of pressuresolution (Fig. 7b, e, f), (2) the almost total lack of stylolites along the de-formation bands (Fig. 7d, f), (3) the occurrence of a lateral offset (only1–2mm) significantly smaller than the offset observed in previous stud-ies (e.g., Tondi et al., 2006, 2012) (Fig. 5b), and (4) a strong control ofdeformation bands on the loci of cement precipitation (areas next tothe bands, eye and ramp structures, etc.; Fig. 6b). To understand thesepeculiar characteristics and infer the deformation processes thatbrought to the formation of the studied deformation bands, below, weconsider and take advantage of previous observations on similar struc-tures by other authors.
4.1. Microstructure
The microstructural mechanisms for compactive shear bands devel-opment in carbonate rocks as observed in or inferred from lab experi-ments (Baud et al., 2009; Baxevanis et al., 2006; Cilona et al., 2012;Vajdova et al., 2004, 2010, 2012; Zhu et al., 2010) and natural structurethin sections (Rath et al., 2011; Rustichelli et al., 2012; Tondi, 2007;Tondi et al., 2006, 2012) include grain sliding with rotation, pore col-lapse, grain fracturing, and pressure solution. Grain crushing andcataclasis in natural deformation bands is usually mediated by pressuresolution (Micarelli et al., 2006; Tondi et al., 2006). Rustichelli et al.(2012), in particular, reported that sutured grainswith signs of pressuresolution are usually observed where the grains have minimal or no in-ternal porosity. In laboratory experiments, in contrast, grain crushingwith no pressure solution is the dominant deformation micro-processwithin confining pressure conditions ranging from 5 to 30 MPa(Cilona et al., 2012). The composition of the grains forming the frame-work of the carbonate rocks reported in these previous studies ismostlycharacterized by bioclasts and scarce micrite peloids. The framework ofthe grainstones studied in the CM of the Cingoli anticline, on the otherhand, mostly consists of micrite peloids (pellets); this latter evidenceimplies that the micromechanism of deformation must be somehowdifferent fromwhat previously described for laboratory and natural de-formations bands. In particular in the CM, the rarely observed pressuresolution (Fig. 7d, f), the soft plastic deformation at the grain boundaries(Fig. 7b, f), and the grain smearing (Fig. 7e) are probably the conse-quence of the soft micrite grains (peloids) that have an intragranularmicroporosity (5–8%; Fig. 13d and e) and can therefore be deformedplastically and eventually smeared. In other words, what appears as aplastic deformation of peloids at the thin-section scale (Fig. 7b, f) isprobably the result of numerous micro-pore collapses (brittle micro-deformations) within the peloids themselves, with their consequentplastic-like change of shape around adjacent indenting grains. This pro-cess, in the study case, must have brought to compaction, matrix devel-opment, and grain size reduction in the CSB (Fig. 8). The initial porosityof the CM grainstone (27–55% skeleton; Table 1), the good grain sorting(Cu=2; Table 1), and themaximumoverburdenpressure at the timeofCM deformation in the range of 10–20 MPa (Marchegiani et al., 1999)are well in agreement with the conditions for compactive shear bandsdevelopment observed by other authors in porous carbonate rocks

Fig. 13. Binary images showing porosity in compactive shear bands (CSB 1) and next to slip surfaces (SS 1). (a) Binary image of a CSB 1 showing inwhite the skeleton porosity. The orangeline is the boundary of the CSB 1 and the dashed blue line indicates the limit of the boundary zone. (b) Same image as in (a) but showing inwhite the porosity. (c) Binary image showing inwhite the porosity next to the slip surface (SS 1) represented also in Fig. 11. Note the large macro-poreswith the form of tension gashes at a distance less than 1mm from the slip surface.(d) Binary image of a detail from (a) showing the intragranular and intergranular porosity in the boundary of a zone of deformation bands. Location in Fig. 10a. (e) Binary elaboration of aBSE image of an un-deformed low-porosity grainstone sample; the 2D porosity has been computed in different zones of the image.
98 M. Antonellini et al. / Tectonophysics 628 (2014) 85–104
(Baud et al., 2009; Cilona et al., 2012; Tondi et al., 2006). It is interestingto note that compactive shear bands with no pressure solution orcataclasis are common structures in lab experiments of porous carbon-ates with a wide range of porosity (3–45%) and mean stresses (11 to450 MPa) (Baud et al., 2000, Vajdova et al., 2004). In nature, accordingto Cilona et al. (2012), during shearing along deformation bands, partic-ulate flow takes place without significant grain crushing and grain con-tacts have a more ductile behavior than in the lab experiments.
An important lithological difference between the studied CMgrainstone and the porous carbonates where deformation bands havebeen previously analyzed (e.g., Tondi et al., 2006) is the presence of ma-trix in the rock framework. The CM has no matrix in its frameworkwhereas the Orfento Fm. described by Tondi et al. (2006) contains 20–30%matrix; the fine grains of thematrixmight be important in promot-ing pressure solution development. Another element that can controlpressure solution development is the presence of clay. The CM, as
confirmed by the EDX diffractograms, does not contain clay minerals(Fig. 10c). This compositional clay deficiency must have hindered theformation of pressure solution, which is a process notoriously facilitatedby the presence of clay and by the lack of intragranular porosity(Aharonov and Katsman, 2009; Renard et al., 1997, 2001; Rustichelliet al., 2012). On the other hand, plastic deformation and smearing areoften associated with clay minerals and it is peculiar to see in the CSBof the CM how intragranular porosity may be the mediating agent forplastic deformation.
4.2. Deformation and diagenesis
A further interesting issue to be discussed is the spatial–temporal re-lationship between the studied deformation bands and cement precip-itation. Unlike Rath et al. (2011), who described deformation bands(disaggregation bands) that were locked by cementation and later re-

Table 2Summary reporting the range in permeability measured within the undeformed grainstone and in the grainstone deformed by CSB and SS.
Sampleno.
Numberof measurements
Permeability in host rock mD (m2) Permeability parallel to deformation bandzone mD (m2)
Permeability normal to fault zone(slip surface and bands) mD (m2)
Min Mean Max Min Mean Max Min Mean Max
1 45 153.2 155.8 158.3 47.8 2.5 9.3 21.7(1.51E-13) (1.54E-13) (1.56E-13) (4.72E-14) (2.47E-15) (9.18E-15) (2.14E-14)
2 77 53.7 159.7 245.3 11 42.9 122.1 1.3 10.2 17.9(5.3E-14) (1.58E-13) (2.42E-13) (1.09E-14) (4.23E-14) (1.21E-13) (1.28E-15) (1.01E-14) (1.77E-14)
3 18 123.1 180.8 265.3 1.1 4 7.3(1.21E-13) (1.78E-13) (2.62E-13) (1.09E-15) (3.95E-15) (7.2E-15)
4 56 26.5 66 134.6 39.8 55.6 78 2.8 7.4 15(2.62E-14) (6.51E-14) (1.33E-13) (3.93E-14) (5.49E-14) (7.7E-14) (2.76E-15) (7.3E-15) (1.48E-14)
99M. Antonellini et al. / Tectonophysics 628 (2014) 85–104
activated with the formation of a cataclastic rim on one of their sides,some microscopic and field observations (ghosts of deformation bandsin the cemented breccia fragments, small filled veins cutting acrossthe grains and the deformation bands; Figs. 7, 12a, c) along thedeforma-tion bands studied in the CM suggest that the diagenetic fluids that re-duced porosity by cement precipitation were syn-deformational.These syn-tectonic Ca2+-enriched fluids may have generated frompressure solution in the overlying basinal sequence, where syn-foldingpressure solution structures are abundant (Petracchini et al., 2012). Inthe studied CM outcrops, post-cementation deformation must havebeen accommodated by shear on the slip surfaces formed adjacent tothe zones of deformation bands (Fig. 6). In fact, once cement induratedand reduced porosity of the CM porous grainstone, deformationbanding could not be a viable mechanism anymore to accommodateshear, which was eventually accommodated by slip surfaces accompa-nied by gouge and breccia (Fig. 3c, d) (e.g., Billi, 2005, 2007). The mostimportant result from the cement analysis (Fig. 9) is, therefore, that, atthe time of deformation band nucleation and early growth, the cementwas substantially absent in the volume of deformation band develop-ment. The cement syn-tectonically precipitated in dilation volumes con-nected with the deformation band development, thus progressivelyleading to the rock induration, porosity reduction, and the consequent(i.e., younger than deformation bands) slip surface development.
4.3. Strain localization
The grain contact forces and their chains within the deformationbands form a preferential angle of 50–60° with the band plane, withthe apex of this acute angle pointing toward the sense of shear(Fig. 9d, g). Similar grain chains have also been observed by Cilonaet al. (2012) and by Eichhubl et al. (2010) in CSB and shear-enhancedcompaction bands (bands with a prevalent component of compactionand a subordinate component of shear). In contrast, contact forces inthe boundary zone (Fig. 9e, h) of the deformation bands are preferen-tially oriented along two directions: one main direction normal to theplane of the CSB and one subordinate direction similar to that observedwithin the band (i.e., 50–60° from the deformation band). This evidencesuggests that the force chains in the boundary zone are more controlledby normal to band compaction rather than by shear, whereas shear is animportant process controlling the organization of force chains withinthe deformation bands. In contrast, no organization of the force chainshas been observed in the host rock far away from the band (Fig. 9f, i).This evidence emphasizes the compaction and shear localization pro-cess involved in the formation of the studied deformation bands. Thepresence of an important component of normal to the band compactionmay also explain the small shear offset detected in the CSB of the CMsimilar to what observed by Eichhubl et al. (2010) and by Soliva et al.(2013) in the shear-enhanced compaction bands of the Valley of Fire(USA) and of Provence (France) respectively.
4.4. Porosity and permeability
The 2D-porosity in the deformation bands of the CM has valuesranging from 2 to 5%, which is significantly lower than the pre-deformation/diagenesis skeleton porosity ranging from 17 to 27%.Through thin sections' point counting and helium porosimetry, respec-tively, Tondi et al. (2006) and Rath et al. (2011)measured a deformationband porosity similar to that measured in this study for the CSB of theCM. Moreover, pore sizes measured in the CM (10 to 200 μm) are gen-erally larger than thepore sizesmeasured by Tondi (2007) in theporouscarbonates of San Vito Lo Capo (0.1 to 100 μm) and are similar to thosemeasured by Cilona et al. (2012) in the Orfento Fm. (1 to 100 μm).
In the CM, the permeability measured normally to the SS with adja-cent ZB (Table 2) is on average about one order of magnitude less thanin the un-deformed host rock. This difference is significantly smallerthan the difference measured by Rath et al. (2011), who documenteda permeability reduction by as much as three orders of magnitudefrom the host rock to the deformation bands.We believe that this differ-ence could be due to the large structural macro-pores (releasing pro-cesses at pull-apart and step-over areas along secondary slip surfaces;Fig. 11b) adjacent to the slip surface and to the rather high intragranularmicroporosity of themicrite peloids in the CM(Table 1). Another reasonfor the relatively high permeability normal to the SS with respect towhat observed in siliciclastic rocks, could be the lack of microcrystallineglassy textures along the SS as instead are observed in SS withinsiliciclastic rocks (Antonellini and Aydin, 1994).
4.5. Structural model
The higher skeleton porosity in the low-porosity grainstonewith re-spect to the high-porosity one and the kinds of cement observed in thinsections suggest that the diagenetic processes have not been homoge-neous throughout the CM. Probably, the low-porosity grainstoneunderwent early cement precipitation and lost most of the porosityshortly after deposition (due to cement precipitation). On the otherhand, the high-porosity grainstone underwent some compaction butcould preserve part of its original porosity until recent times. This wasa key element for allowing the development of deformation bands.We synthesize the above-discussed evidence and inferences in themodel of Fig. 14, where the development of CB, CSB, and SS are viewedwithin a progressive compressional deformation during folding of theCingoli area (anticline) induced by the lateMessinian orogenic deforma-tion (northern Apennines). We reconstruct the evolution of deforma-tion during folding in the CM according to the following steps(Fig. 14): (1) Deposition of the CM and possible formation of CB as thelithostatic loading was progressively increasing (Fig. 14a). (2) Forma-tion of the low-angle-to-bedding CSB with an anastomosing patternpossibly re-activating previously formed CB. Formation of SS associatedto zones of CSB in a direction consistent with orogenic thrusting in late
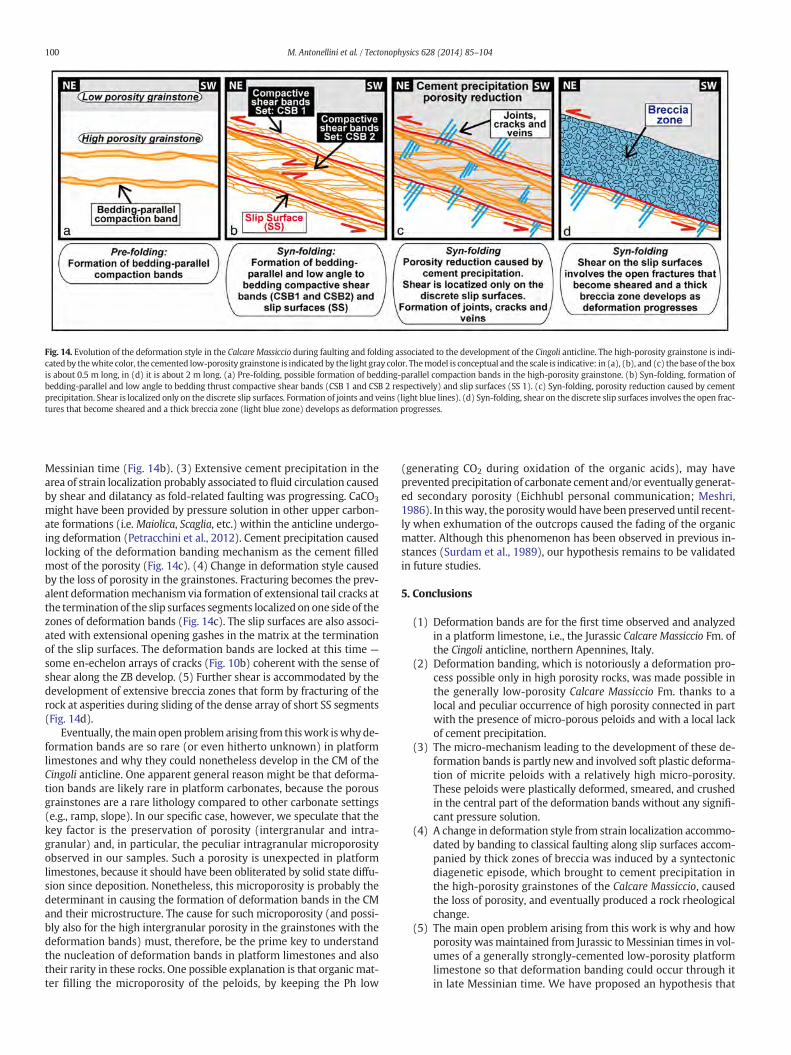
Fig. 14. Evolution of the deformation style in the Calcare Massiccio during faulting and folding associated to the development of the Cingoli anticline. The high-porosity grainstone is indi-cated by thewhite color, the cemented low-porosity grainstone is indicated by the light gray color. Themodel is conceptual and the scale is indicative: in (a), (b), and (c) the base of the boxis about 0.5 m long, in (d) it is about 2 m long. (a) Pre-folding, possible formation of bedding-parallel compaction bands in the high-porosity grainstone. (b) Syn-folding, formation ofbedding-parallel and low angle to bedding thrust compactive shear bands (CSB 1 and CSB 2 respectively) and slip surfaces (SS 1). (c) Syn-folding, porosity reduction caused by cementprecipitation. Shear is localized only on the discrete slip surfaces. Formation of joints and veins (light blue lines). (d) Syn-folding, shear on the discrete slip surfaces involves the open frac-tures that become sheared and a thick breccia zone (light blue zone) develops as deformation progresses.
100 M. Antonellini et al. / Tectonophysics 628 (2014) 85–104
Messinian time (Fig. 14b). (3) Extensive cement precipitation in thearea of strain localization probably associated to fluid circulation causedby shear and dilatancy as fold-related faulting was progressing. CaCO3
might have been provided by pressure solution in other upper carbon-ate formations (i.e.Maiolica, Scaglia, etc.) within the anticline undergo-ing deformation (Petracchini et al., 2012). Cement precipitation causedlocking of the deformation banding mechanism as the cement filledmost of the porosity (Fig. 14c). (4) Change in deformation style causedby the loss of porosity in the grainstones. Fracturing becomes the prev-alent deformationmechanism via formation of extensional tail cracks atthe termination of the slip surfaces segments localized on one side of thezones of deformation bands (Fig. 14c). The slip surfaces are also associ-ated with extensional opening gashes in the matrix at the terminationof the slip surfaces. The deformation bands are locked at this time —
some en-echelon arrays of cracks (Fig. 10b) coherent with the sense ofshear along the ZB develop. (5) Further shear is accommodated by thedevelopment of extensive breccia zones that form by fracturing of therock at asperities during sliding of the dense array of short SS segments(Fig. 14d).
Eventually, themain open problemarising from thiswork iswhyde-formation bands are so rare (or even hitherto unknown) in platformlimestones and why they could nonetheless develop in the CM of theCingoli anticline. One apparent general reason might be that deforma-tion bands are likely rare in platform carbonates, because the porousgrainstones are a rare lithology compared to other carbonate settings(e.g., ramp, slope). In our specific case, however, we speculate that thekey factor is the preservation of porosity (intergranular and intra-granular) and, in particular, the peculiar intragranular microporosityobserved in our samples. Such a porosity is unexpected in platformlimestones, because it should have been obliterated by solid state diffu-sion since deposition. Nonetheless, this microporosity is probably thedeterminant in causing the formation of deformation bands in the CMand their microstructure. The cause for such microporosity (and possi-bly also for the high intergranular porosity in the grainstones with thedeformation bands) must, therefore, be the prime key to understandthe nucleation of deformation bands in platform limestones and alsotheir rarity in these rocks. One possible explanation is that organic mat-ter filling the microporosity of the peloids, by keeping the Ph low
(generating CO2 during oxidation of the organic acids), may haveprevented precipitation of carbonate cement and/or eventually generat-ed secondary porosity (Eichhubl personal communication; Meshri,1986). In thisway, the porositywould have been preserveduntil recent-ly when exhumation of the outcrops caused the fading of the organicmatter. Although this phenomenon has been observed in previous in-stances (Surdam et al., 1989), our hypothesis remains to be validatedin future studies.
5. Conclusions
(1) Deformation bands are for the first time observed and analyzedin a platform limestone, i.e., the Jurassic Calcare Massiccio Fm. ofthe Cingoli anticline, northern Apennines, Italy.
(2) Deformation banding, which is notoriously a deformation pro-cess possible only in high porosity rocks, was made possible inthe generally low-porosity Calcare Massiccio Fm. thanks to alocal and peculiar occurrence of high porosity connected in partwith the presence of micro-porous peloids and with a local lackof cement precipitation.
(3) The micro-mechanism leading to the development of these de-formation bands is partly new and involved soft plastic deforma-tion of micrite peloids with a relatively high micro-porosity.These peloids were plastically deformed, smeared, and crushedin the central part of the deformation bands without any signifi-cant pressure solution.
(4) A change in deformation style from strain localization accommo-dated by banding to classical faulting along slip surfaces accom-panied by thick zones of breccia was induced by a syntectonicdiagenetic episode, which brought to cement precipitation inthe high-porosity grainstones of the Calcare Massiccio, causedthe loss of porosity, and eventually produced a rock rheologicalchange.
(5) The main open problem arising from this work is why and howporosity wasmaintained from Jurassic to Messinian times in vol-umes of a generally strongly-cemented low-porosity platformlimestone so that deformation banding could occur through itin late Messinian time. We have proposed an hypothesis that

101M. Antonellini et al. / Tectonophysics 628 (2014) 85–104
has to be validated in future studies and would involve porositypreservation through a syn-diagenesis maintenance of the or-ganic matter filling the rock porosity.
Fig. A1. Explanation of the methodology used to measure the force chains (and contactforces) direction in the section parallel to the slip vector, inside and next to the compactiveshear bands or the slip surfaces.
Acknowledgments
Funding of this work has been provided by Oriented Research Fundsof the University of Bologna and by the IGAG-CNR of Rome. AlbertoCastellarin, Giuseppe Maria Bargossi, Fabio Gasperini, Paolo Gasparotto,MarcoAlbano andPeter Eichhubl are thanked for help in the lab anddis-cussions that contributed to improve the manuscript. L. Micarelli andtwo anonymous reviewers are thanked for their constructive reviews.The Servizio Ambiente e Paesaggio ofMarche Region provided useful geo-logical data. Midland Valley is acknowledged for providing the Move™software useful for geological cross section construction. We alsothank the direction and the personnel of theMenghi quarry for grantingus access and help in the field.
Appendix A. Methods
An integratedmethodology based on fieldmapping, microstructuralthin section analysis, image analysis, and laboratory pressure-pulseminipermeameter measurements has been used to study the deforma-tion bands in the Calcare Massiccio Fm.
The deformation bands, slip surfaces, and the breccia zones havebeen mapped in the field on acetates or from high resolution digitalphotographs assembled in photo-mosaics of the quarry wall. Theamount of offset across the CSB was estimated from the visible crosscutting relationships in the field, in the thin sections, and in polishedrock slabs. The orientations of the bedding and of the structures wereplotted on an equal angle Wulff net using the Stereonet 8 software(Allmendinger et al., 2012).
Fifteen oriented samples were collected in the quarry wall. Someof the samples included the SS associated with the ZB. The orientedsamples were cut in slabs with two surfaces at 90° from each other:(1) one slab surface orthogonal to the tabular deformation band or,where present, to the slip surface and parallel to the slip vector inferredfrom the striations on the slip surfaces, and (2) one second slab surfacenormal to the first one and to the slip vector. Some of the slabs wereimpregnated with blue epoxy to enhance the pore space and somewere left in their native state to be later used for permeability measure-ments in the lab. Some of the slabs impregnated with blue epoxy werepolished and then scanned at high resolution (1200 dpi); enlargementsof the high resolution images were used to map the thin deformationbands and slip surfaces.
Thirty thin sections, twenty of them impregnated with blue epoxy,were cut from the slabs for microstructural analysis, SEM analysis, and2D-porosity determination (point counting and image analysis). Fivethin sections were prepared for SEM analysis by impregnation withclear epoxy, polished, and then carbon coated to avoid charging andachieve conductivity of the electron beam; the five thin sections weretaken from two fault zone samples, two per sample at 90° from eachother as explained above and one in the low-porosity grainstone.
The CM grainstone samples were investigated with a polarizing mi-croscope Wild M420 equipped with a digital camera at 12 megapixelsresolution (Nikon D4400). Standard optical microscopy analysis wasperformed on the thin sections to recognize the different kind of grains,the pore types, the types of cement, and the diagenetic history of thesamples. Point counting (300 points × section) was used for porositydetermination and calibration of the image analysis algorithm. In twoselected thin sections, the shape of each grain and pore throat wasredrawn directly on the photomicrographs of a deformation band andof a slip surface. This was done to quantify the grain, matrix, and poresize distribution within the band, in its proximity, and far in the hostrock as well as to check the thresholds and the results of the
computer-based quantitative image analysis software that will bediscussed later on.
The methodology described by Eichhubl et al. (2010) was used tomeasure the degree of micro-textural ordering inside and outside thedeformation bands. In this methodology, the preferred orientation ofchains composed of grains that are in concave–convex contact is mea-sured (Fig. A1). The trajectories can be measured directly on thin sec-tions and/or in Back Scatter (BSE) SEM images and they can beconstructed for a minimum of three contacting grains perpendicularto the grain contacts. Because of the softness of the micrite grains, inour study, we have considered also convex–concave contacts for twograins where they show clear signs of interpenetration; in this case, itwould be more correct to talk about “contact forces” rather than“force chains”. The trajectories of force chains have been computedin numerical models by Cundall and Hart (1985) and Potyondyand Cundall (2004) and they are considered a two-dimensional proxyfor the orientation of the load-bearing framework in the three-dimensional granular aggregate. Following Eichhubl et al. (2010), con-tact forces and the force chains have been mapped on thin sectionscut perpendicular to the band or the slip surface, parallel to the slip vec-tor, and containing the direction of maximum principal shortening. Theforce chains have been measured within the deformation bands, in theboundary zone (500 μm from the plane of the band), and furtheraway from the band (N500 μm from the band). The orientation of theforce chains was drawn directly on photomicrographs and plotted inrose diagrams with petals of 18° using the Stereonet 8 software andwith theN of the rose diagramoriented along the direction of the defor-mation band or slip plane trace in thin section (Fig. A1).
A scanning electron microscope (SEM, Philips 515) was used tostudy the morphology and the surface of the five carbon-coatedpolished thin sections. The backscatter electron detector (BSE 15 kV)and energy dispersive X-ray diffraction analysis (EDX)were used to ob-tain high-resolution BSE images (19 to 400×) and to characterize thechemical composition of the samples.
Image analysis of the thin sections photomicrographs and ofthe BSE–SEM images was done using the software ImageJ v. 1.46r(Ferreira and Rasband, 2012). The objective of image analysis hasbeen the determination of grain size and pore size distributions, grainshape, and the measurement of the 2D-macroporosity (intergranular)

Fig. A2. Schematic flow chart showing the different steps in the image analysis of the thin sections and the SEM BSE images for 2D porosity and grain size distribution determination.
102 M. Antonellini et al. / Tectonophysics 628 (2014) 85–104
and 2D-microporosity (intragranular). The general procedure (Fig. A2)followed in ImageJ is described as follows. The original color image ofthe thin section (or of the BSE–SEM) has been transformed in a blackand white 8 bit image and then a threshold has been applied. Giventhat an automatic application of a thresholdmay lead to awide variabil-ity of the porosity determination from an image (Ahamadov, 2006;Ahmadov et al., 2007), the method was calibrated by using drawingsof a deformation band and of a ZB containing a SS photomicrographswhere each grain was drafted directly on the thin section image. Inthis way, by assigning the color black to the element to measure andthe colorwhite towhatwas not of interest, itwas possible to test the ac-curacy of the threshold level applied automatically by the program andeventually to adjust it to replicate the results of the drafted image. Aftercalibration, the threshold levels were used also on the rest of the thinsections. Once the threshold was applied, the image was transformedin binary form. Pixel counting on the binary image allows measuringthe 2D-porosity and the grain or pore size distribution (Fig. A2). Giventhat ImageJ measures the area of each grain or pore elements, it is as-sumed that each element is circular in a way to calculate its diameterfrom the formula 2 ∗ (4 / π)1/2. Grain sorting has been measured usingthe coefficient of uniformity Cu=d60 / d10, where d60 is the grain diam-eter at 60% passing and d10 is the grain diameter at 10% passing thesieves (Fetter, 2001).
A gas (nitrogen) pressure-pulse benchmini-permeameter was used toobtainpermeabilitymeasurements parallel andnormal to thedeformationbands and fault zones. The advantage of using mini-permeameters withsmall diameter tip seals is that they can perform localized measurements
on small volumes of rock. They are designed to make rapid, inexpensive,and nondestructive measurements where localized determinations areneeded to characterize spatial distribution of permeability in an outcropor in a core (Goggin et al., 1988). The geometric characteristics of themini-permeameter tip are the same as those reported in Goggin et al.(1988) and Antonellini and Aydin (1994). In particular, the permeameterhas an internal tip-seal radius of 0.5 cm and an outer tip seal radius of1.5 cm, a configuration that allows sampling at a depth of about 1 cm. Incontrast to the one of Goggin et al. (1988), the permeameter that hasbeen used in this study operates in transient mode and measures thetime for the pressure to decay from 15 psi (103,422 Pa where 1 psi =6.8948 × 10³ Pa) to 5 psi (34,474 Pa). This allows for more efficient andfast measurement of low permeabilities. Because an analytical solutionfor this mini-permeameter configuration is not available, we have con-structed a calibration curve for the pressure–time response by using aset of seven grainstone and sandstone samples with known permeability(obtained in the lab by making tests with a steady state permeameter on1.5 × 2.5 cm plugs). The permeability range of the calibration samplesspans from 0.001 mD (9.87E-19 m2) to 1 Darcy (9.87E-13 m2). Theminipermeameter measurements were made by fixing the samples atthe bench and the tip of the permeameter was pressed using a boreframe holder on a smoothly cut slab surface.
References
Agosta, F., Aydin, A., 2006. Architecture and deformation mechanism of a basin-boundingnormal fault in Mesozoic platform carbonates, central Italy. J. Struct. Geol. 28,1445–1467.

103M. Antonellini et al. / Tectonophysics 628 (2014) 85–104
Ahamadov, R.S., 2006. Petrophysical Characterization and Permeability Upscaling ofFault Zones in Sandstone with a Focus on Slip Surfaces and Slip Bands. Thesis StanfordUniversity MSc (96 pp.).
Aharonov, E., Katsman, R., 2009. Interaction between pressure solution and clays instylolite development: insights from modeling. Am. J. Sci. 309, 607–632.
Ahlgren, S.G., 2001. The nucleation and evolution of Riedel shear-zones as deformationbands in porous sandstone. J. Struct. Geol. 23, 1203–1214.
Ahmadov, R.S., Aydin, A., Karimi-Fard, M., Durlofsky, L.J., 2007. Permeability upscaling offault zones in the Aztec Sandstone, Valley of Fire State Park, Nevada, with a focuson slip surfaces and slip bands. Hydrogeol. J. 15, 1239–1250.
Allmendinger, R.W., Cardozo, N., Fisher, D., 2012. Structural Geology Algorithms: Vectorsand Tensors in Structural Geology. Cambridge University Press, Cambridge.
Alsharhan, A.S., Nairn, A.E.M., 1993. Carbonate platform models of Arabian Cretaceousreservoirs. Mem. AAPG A044, 173–184.
Alvarez, W., Engelder, T., Lowrie,W., 1976. Formation of spaced cleavage and folds in brit-tle limestone by dissolution. Geology 4, 698–701.
Alvarez, W., Engelder, T., Geiser, P.A., 1978. Classification of solution cleavage in pelagiclimestones. Geology 1978, 263–266.
Antonellini, M., Aydin, A., 1994. Effect of faulting on fluid flow in porous sandstones:petrophysical properties. AAPG Bull. 78, 355–377.
Antonellini, M., Aydin, A., 1995. Effect of faulting on fluid flow in porous sandstones:geometry and spatial distribution. AAPG Bull. 79, 642–671.
Antonellini, M., Aydin, A., Pollard, D.D., 1994. Microstructure of deformation bands inporous sandstones at Arches National Park, Utah. J. Struct. Geol. 16, 941–959.
Aydin, A., 1978. Small faults formed as deformation bands in sandstone. Pure Appl.Geophys. 116, 913–930.
Aydin, A., Johnson, A.M., 1978. Development of faults as zones of deformation bands andas slip surfaces in sandstone. Pure Appl. Geophys. 116, 931–942.
Aydin, A., Borja, R.I., Eichhubl, P., 2006. Geological and mathematical framework for fail-ure modes in granular rock. J. Struct. Geol. 28, 83–98.
Ballas, G., Soliva, R., Sizun, J.P., Benedicto, A., Cavailhes, T., Raynaud, S., 2012. The impor-tance of the degree of cataclasis in shear bands for fluid flow in porous sandstone,Provence, France. AAPG Bull. 96, 2167–2186.
Ballas, G., Soliva, R., Sizun, J.P., Fossen, H., Benedicto, A., Skurtveit, E., 2013. Shear-enhanced compaction bands formed at shallow burial conditions; implications forfluid flow (Provence, France). J. Struct. Geol. 47, 3–15.
Bally, A.W., Burbi, L., Cooper, C., Ghelardoni, R., 1986. Balanced sections and seismic reflec-tion profiles across the Central Apennines. Mem. Soc. Geol. Ital. 35, 257–310.
Balsamo, F., Storti, F., 2010. Grain size permeability evolution of soft-sediment extensionalsub-seismic and seismic fault zones in high-porosity sediments from the Crotonebasin, southern Apennines, Italy. Mar. Petrol. Geol. 27, 822–837.
Balsamo, F., Storti, F., Piovano, B., Salvini, F., Cifelli, F., Lima, C., 2008. Time dependentstructural architecture of subsidiary faulting and stress pattern in the tip region ofan extensional growth fault system, Tarquinia basin, Italy. Tectonophysics 454,54–69.
Barchi, M., Lavecchia, G., Menichetti, M., Minelli, G., Pialli, G., Nardon, S., 1991. Analisi dellafratturazione del Calcare Massiccio in una struttura anticlinalica dell'AppenninoUmbro-marchigiano. Boll. Soc. Geol. Ital. 110, 101–124.
Baud, P., Zhu, W., Wong, T.F., 2000. Failure mode and weakening effect of water on sand-stone. J. Geophys. Res. 105, 16371–16389.
Baud, P., Vinciguerra, S., David, C., Cavallo, A., Walker, E., Reuschlé, T., 2009. Compactionand failure in high-porosity carbonates: mechanical data and microstructural obser-vations. Pure Appl. Geophys. 166, 869–898.
Baxevanis, T., Papamichos, E., Flornes, O., Larsen, I., 2006. Compaction bands and induced per-meability reduction in Tuffeau de Maastricht calcarenite. Acta Geotech. 1, 123–135.
Billi, A., 2005. Grain size distribution and thickness of breccia and gouge zones from thin(b1 m) strike–slip fault cores in limestone. J. Struct. Geol. 27, 1823–1837.
Billi, A., 2007. On the extent of size range and power law scaling for particles of naturalcarbonate fault cores. J. Struct. Geol. 29, 1512–1521.
Billi, A., Salvini, F., 2000. Sistemi di fratture associati a faglie in rocce carbonatiche: nuovidati sull'evoluzione tettonica del Promontorio del Gargano. Boll. Soc. Geol. Ital. 119,237–250.
Braathen, A., Osmundsen, P.T., Hauso, H., Semshaug, S., Fredman, N., Buckley, S.J., 2013.Fault-induced deformation in a poorly consolidated, siliciclastic growth basin: astudy from the Devonian in Norway. Tectonophysics 586, 112–129.
Calamita, F., Daiana, G., 1986. Geodinamica dell'Appennino umbro-marchigiano. Mem.Soc. Geol. Ital. 35, 311–316.
Calamita, F., Cello, G., Invernizzi, C., Paltrinieri,W., 1990. Stile strutturale e cronologia delladeformazione lungo la traversa M.S. Vicino – Polverigi (Appennino marchigianoesterno). Stud. Geol. Camerti 69–86 (Special Volume).
Carloni, G.C., 1964. La Geologia dei dintorni di Cingoli (Appennino Marchigiano). Giorn.Geol. 32, 365–401.
Casero, P., Roure, F., Vially, R., 1991. Tectonic framework and petroleum potential of thesouthern Apennines. In: Spencer, A.M. (Ed.), Generation, Accumulation, and Productionof Europe's Hydrocarbons. , vol. 1. Special Publication of the European Association ofPetroleum Geoscientists, pp. 381–387.
Ciancetti, G., Nanni, T., 1989. Note sulla Geologia dell'anticlinale di Monte Acuto di Cingoli(Marche). Boll. Soc. Geol. Ital. 108, 553–564.
Cilona, A., Baud, P., Tondi, E., Agosta, F., Vinciguerra, S., Rustichelli, A., Spiers, C.J., 2012.Deformation bands in porous carbonate grainstones: field and laboratory observa-tions. J. Struct. Geol. 45, 137–157.
Cundall, P.A., Hart, R.D., 1985. Development of Generalized 2D and 3D Distinct ElementPrograms for Modeling Jointed Rocks. Miscellaneous Paper SL-85-1. US Army Corpsof Engineer.
Deiana, G., Cello, G., Chiocchini, M., Galdenzi, S., Mazzoli, S., Pistolesi, E., Potetti, M.,Romano, A., Turco, E., Principi, M., 2002. Tectonic evolution of the external zones of
the Umbria–Marche Apennines in the Monte San Vicino–Cingoli area. Boll. Soc.Geol. Ital. 1, 229–238.
Di Matteo, L., Dragoni, W., 2006. Climate change and water resources in limestone andmountain areas: the case of Firenzuola Lake (Umbria, Italy). In: Goldscheider, N.,Mudry, J., Savoy, L., Zwahlen, F. (Eds.), Proceedings of the 8th Conference on Lime-stone Hydrogeology 2006, Neuchâtel Switzerland. Presses universitaires deFranche-Comté,Université de Franche-Comt, pp. 83–88.
Di Naccio, D., Boncio, P., Cirilli, S., Casaglia, F., Morettini, E., Lavecchia, G., Brozzetti, F., 2005.Role of mechanical stratigraphy on fracture development in carbonate reservoirs: in-sights from outcropping shallowwater carbonates in the Umbria–Marche Apennines,Italy. J. Volcanol. Geoth. Res. 148, 98–115.
Doan, M.L., Billi, A., 2011. High strain rate damage of Carrara marble. Geophys. Res. Lett.38. http://dx.doi.org/10.1029/2011GL049169 (L19302).
Eichhubl, P., Hooker, J.N., Laubach, S.E., 2010. Pure and shear-enhanced compaction bandsin Aztec sandstone. J. Struct. Geol. 32, 1873–1886.
Engelder, T., Marshak, S., 1985. Disjunctive cleavage formed at shallow depths in sedi-mentary rocks. J. Struct. Geol. 7, 327–343.
Faulkner, D.R., Jackson, C.A.L., Lunn, R.J., Schlische, R.W., Shipton, Z.K., Wibberley, C.A.J.,Withjack, M.O., 2010. A review of recent developments concerning the structure,mechanics and fluid flow properties of fault zones. J. Struct. Geol. 32, 1557–1575.
Ferreira, T., Rasband, W., 2012. ImageJ User Guide IJ 1.46r. NIH, Washington.Fetter, C.W., 2001. Applied Hydrogeology. Prentice Hall, New Jersey.Flodin, E., Aydin, A., Durlofsky, L., Yeten, B., 2001. Representation of Fault Zone Permeabil-
ity in Reservoir Flow Models. SPE Paper 71671. SPE, Houston, TX, USA.Flodin, E., Durlofsky, L., Aydin, A., 2004. Upscaled models of flow and transport in faulted
sandstone: boundary condition effects and explicit fracture modeling. Pet. Geosci. 10,173–181.
Fondriest, M., Smith, S.A.F., Candela, T., Nielsen, S.B., Mair, J., Di Toro, G., 2013. Mirror-likefaults and power dissipation during earthquakes. Geology. http://dx.doi.org/10.1130/G34641.1.
Fossen, H., Bale, A., 2002. Deformation bands and their influence on fluid flow. AAPG Bull.91, 1685–1700.
Fossen, H., Schultz, R.A., Shipton, Z.K., Mair, K., 2007. Deformation bands in sandstone: areview. J. Geol. Soc. London 164, 755–769.
Fowles, J., Burley, S., 1994. Textural and permeability characteristics of faulted, highporosity sandstones. Mar. Petrol. Geol. 11, 608–623.
Goggin, D.J., Thrasher, R.L., Lake, L.W., 1988. A theoretical and experimental analysis ofminipermeameter response including gas slippage and high velocity flow effects. InSitu 12, 79–116.
Jordan Jr., C.F., Wilson, J.L., 1994. Carbonate reservoir rocks. Mem. AAPG M60, 141–158.Jourde, H., Flodin, E., Aydin, A., Durlofsky, L., Wen, X., 2002. Computing permeability of
fault zones in eolian sandstone from outcrop measurements. AAPG Bull. 86,1187–1200.
Katz, Y., Weinberger, R., Aydin, A., 2004. Geometry and kinematic evolution of Riedelshear structures, Capitol Reef National Park, Utah. J. Struct. Geol. 26, 491–501.
Lothe, A.E., Gabrielsen, R.H., Bjornevoll-Hagen, N., Larsen, B.T., 2002. An experimentalstudy of the texture of deformation bands: effects on the porosity and permeabilityof sandstones. Pet. Geosci. 8, 195–207.
Main, I.G., Kwon, O., Ngwenya, B.T., Elphick, S.C., 2000. Fault sealing during deformation-band growth in porous sandstone. Geology 28, 1131–1134.
Manzocchi, T., Walsh, J., Nell, P., Yielding, G., 1999. Fault transmissibility multipliers forflow simulations models. Pet. Geosci. 5, 53–63.
Marchegiani, L., Bertotti, G., Cello, G., Deiana, G., Mazzoli, S., Tondi, E., 1999. Pre-orogenictectonics in the Umbria–Marche sector of the Afro-Adriatic continental margin.Tectonophysics 315, 123–143.
Marshak, S., Geiser, P.A., Alvarez, W., Engelder, T., 1982. Mesoscopic fault array of thenorthern Umbrian Apennine fold belt, Italy: geometry of conjugate shear bypressure-solution slip. Geol. Soc. Am. Bull. 93, 1013–1022.
Matthäi, S., Aydin, A., Pollard, D., Roberts, S., 1998. Numerical simulation of deviationsfrom radial drawdown in a faulted sandstone reservoir with joints and zones of de-formation bands. In: Jones, G., Fisher, Q., Knipe, R. (Eds.), Faulting, Fault Sealing andFluid Flow in Hydrocarbon Reservoirs. Geol. Soc. Spec. Publ, 147, pp. 157–191.
Mazzoli, S., Deiana, G., Galdenzi, S., Cello, G., 2002. Miocene fault-controlled sedimen-tation and thrust propagation in the previously faulted external zones of theUmbria–Marche Apennines, Italy. EGU Stephan Mueller Special PublicationSeries. , 1, pp. 195–209.
Menichetti, M., 1991. La sezione geologica Cingoli-M. Maggio-Tevere nell'Appenninoumbro-marchigiano: analisi cinematica e strutturale. Studi Geol. Camerti 1, 315–328.
Meshri, I.D., 1986. On the reactivity of carbonic and organic acids and generation ofsecondary porosity. SEPM Special Publication. Roles of Organic Matter in SedimentDiagenesis, 38, p. 123.
Micarelli, L., Benedicto, A., Wibberley, C.A.J., 2006. Structural evolution and permeabilityof normal fault zones in highly porous carbonate rocks. J. Struct. Geol. 28, 1214–1227.
Mollema, P.N., Antonellini, M.A., 1996. Compaction bands: a structural analog for anti-mode I cracks in Aeolian sandstone. Tectonophysics 267, 209–228.
Moore, C.H., 2001. Carbonate Reservoirs: Porosity Evolution and Diagenesis in a SequenceStratigraphic Framework. Elsevier, Amsterdam.
Moshier, S.O., 1989. Microporosity in micritic limestones: a review. Sediment. Geol. 63,191–213.
Mostardini, F., Merlini, S., 1986. Appennino centro-meridionale: sezione geologiche eproposta di modello strutturale. Mem. Soc. Geol. Ital. 35, 177–202.
Nelson, R.A., 2001. Geological Analysis of Naturally Fractured Reservoirs. The Gulf Publish-ing Company, Houston.
Ngwenya, B.T., Kwon, O., Elphick, S.C., Main, I.G., 2003. Permeability evolution during pro-gressive development of deformation bands in porous sandstones. J. Geophys. Res.108, 2343. http://dx.doi.org/10.1029/2002JB001854 (B7).
104 M. Antonellini et al. / Tectonophysics 628 (2014) 85–104
Petracchini, L., Antonellini, M., Billi, A., Scrocca, D., 2012. Fault development through frac-tured pelagic carbonates of the Cingoli anticline, Italy: possible analog for subsurfacefluid-conductive fractures. J. Struct. Geol. 46, 21–37.
Pieri, M., Mattavelli, L., 1986. Geologic framework of Italian petroleum resources. AAPGBull. 70, 103–130.
Potyondy, D.O., Cundall, P.A., 2004. A bonded-particle model for rock. Int. J. Rock Mech.Min. 41, 1329–1364.
Rath, A., Exner, U., Tschegg, C., Grasemann, B., Laner, R., Draganits, E., 2011. Diageneticcontrol of deformation mechanisms in deformation bands in a carbonate grainstone.AAPG Bull. 95, 1369–1381.
Renard, F., Ortoleva, P., Gratier, J.P., 1997. Pressure solution in sandstones: influence ofclays and dependence on temperature and stress. Tectonophysics 30, 257–266.
Renard, F., Dysthe, D., Feder, J., Bjørlykke, K., Jamtveit, B., 2001. Enhanced pressure solu-tion creep rates induced by clay particles: experimental evidence in salt aggregates.Geophys. Res. Lett. 28, 1295–1298.
Rustichelli, A., Tondi, E., Agosta, F., Cilona, A., Giorgioni, M., 2012. Development and distri-bution of bed-parallel compaction bands and pressure solution seams in theBolognano Formation carbonates (Majella Mountain, Italy). J. Struct. Geol. 37,181–199.
Santantonio, M., Carminati, E., 2010. Jurassic rifting evolution of the Apennines and South-ern Alps (Italy): parallels and differences. Geol. Soc. Am. Bull. 123, 468.
Shiner, P., Beccacini, A., Mazzoli, S., 2004. Thin-skinned versus thick-skinned structuralmodels for Apulian carbonate reservoirs: constraints from the Val d'Agri Fields, SApennines, Italy. Mar. Petrol. Geol. 21, 805–827.
Shipton, Z., Evans, J., Robeson, K., Forster, C., Snelgrove, S., 2002. Structural heterogeneityand permeability in faulted eolian sandstone: implications for subsurfacemodeling offaults. AAPG Bull. 86, 863–883.
Siman-Tov, S., Aharonov, E., Sagy, A., Emmanuel, S., 2013. Nanograins form carbonatefault mirrors. Geology 41, 703–706.
Smith, S.A.F., Billi, A., Di Toro, G., Spiess, R., 2011. Principal slip zones in limestone: micro-structural characterization and implications for the seismic cycle (Tre Monti Fault,central Apennines, Italy). Pure Appl. Geophys. 168, 2365–2393.
Smith, S.A.F., Di Toro, G., Kim, S., Ree, J.-H., Nielsen, S., Billi, A., Spiess, R., 2013. Co-seismicrecrystallization during shallow earthquake slip. Geology 41, 63–66.
Soliva, R., Schultz, R.A., Ballas, G., Taboada, A., Wibberley, C., Saillet, E., Benedicto, A., 2013.A model of strain localization in porous sandstone as a function of tectonic setting,burial andmaterial properties; new insight fromProvence (southern France). J. Struct.Geol. 49, 50–63.
Sternlof, K., Chapin, J., Pollard, D., Durlofsky, L., 2004. Permeability effects of deformationband arrays in sandstone. AAPG Bull. 88, 1315–1329.
Sternlof, K., Karimi-Fard, M., Pollard, D., Durlofsky, L., 2006. Flow effects of compactionbands in sandstone at scales relevant to aquifer and reservoir management. WaterResour. Res. 42. http://dx.doi.org/10.1029/2005WR004664 (W07425).
Storti, F., Salvini, F., 2001. The evolution of a model trap in the Central Apennines, Italy:fracture patterns, fault reactivation and development of cataclastic rocks in carbon-ates at the Narni anticline. J. Pet. Geol. 24, 171–190.
Surdam, R.C., Crossey, L.J., Hagen, E.S., Heasler, H.P., 1989. Organic–inorganic interactionsand sandstone diagenesis. AAPG Bull. 73, 1–23.
Tavani, S., Storti, F., Salvini, F., Toscano, C., 2008. Stratigraphic versus structural control onthe deformation pattern associated with the evolution of the Mt. Catria anticline,Italy. J. Struct. Geol. 30, 664–681.
Tavani, S., Storti, F., Muñoz, J.A., 2010. Scaling relationships between stratabound pressuresolution cleavage spacing and layer thickness in a folded carbonate multilayer of thenorthern Apennines (Italy). J. Struct. Geol. 32, 278–287.
Tavani, S., Storti, F., Bausà, J., Muñoz, J.A., 2012. Late thrusting extensional collapse at themountain front of the northern Apennines (Italy). Tectonics 31. http://dx.doi.org/10.1029/2011TC003059.
Taylor, W.L., Pollard, D.D., 2000. Estimation of in situ permeability of deformation bandsin porous sandstone, Valley of Fire, Nevada. Water Resour. Res. 36, 2595–2606.
Tondi, E., 2007. Nucleation, development and petrophysical properties of faults in carbon-ate grainstones: evidence from the San Vito Lo Capo Peninsula (Sicily, Italy). J. Struct.Geol. 29, 614–628.
Tondi, E., Antonellini, M., Aydin, A., Marchegiani, L., Cello, G., 2006. The role of deforma-tion bands, stylolites and sheared stylolites in fault development in carbonategrainstones of Majella Mountain, Italy. J. Struct. Geol. 28, 376–391.
Tondi, E., Cilona, A., Agosta, F., Aydin, A., Rustichelli, A., Renda, P., Giunta, G., 2012. Growthprocesses, dimensional parameters and scaling relationships of two conjugate setsof compactive shear bands in porous carbonate grainstones, Favignana Island, Italy.J. Struct. Geol. 37, 53–64.
Vajdova, V., Baud, P., Wong, T.F., 2004. Compaction, dilatancy, and failure in porouscarbonate rocks. J. Geophys. Res. 109. http://dx.doi.org/10.1029/2003JB002508(B05204).
Vajdova, V., Zhu, W., Chen, T.M.N., Wong, T.F., 2010. Micromechanics of brittle faultingand cataclastic flow in Tavel limestone. J. Struct. Geol. 32, 1158–1169.
Vajdova, V., Baud, P., Wu, L., Wong, T.F., 2012. Micromechanics of inelastic compaction intwo allochemical limestones. J. Struct. Geol. 43, 100–117.
Wennberg, O.P., Casini, G., Jahanpanah, A., Lapponi, F., Ineson, J., Graham Wall, B.,Gillespie, P., 2013. Deformation bands in chalk, examples from the Shetland Groupof the Oseberg Field, North Sea, Norway. J. Struct. Geol.. http://dx.doi.org/10.1016/j.jsg.2013.09.005.
Zhu, W., Baud, P., Wong, T.F., 2010. Micromechanics of cataclastic pore collapse in lime-stone. J. Geophys. Res. 115, B04405.1–B04405.17.