First quarter report 2014 - Santander Consumer
38
First quarter report 2014 Santander Consumer Bank Nordics (group) and Santander Consumer Bank AS
Transcript of First quarter report 2014 - Santander Consumer

First quarter report 2014
Santander Consumer Bank Nordics (group) and
Santander Consumer Bank AS

Santander Consumer Bank
2014 Interim Report First Quarter - unaudited
Table of contents Report of the Board of Directors ............................................................................................................. 3
Profit and loss account – first quarter ..................................................................................................... 6
Statement of comprehensive income ..................................................................................................... 7
Profit and loss account – quarterly ......................................................................................................... 8
Statement of comprehensive income – quarterly .................................................................................. 9
Balance sheet – Assets .......................................................................................................................... 10
Balance sheet - Liabilities ...................................................................................................................... 11
Statement of changes in equity ............................................................................................................ 13
Cash flow statement.............................................................................................................................. 15
Notes ................................................................................................................................................. 16
1. Basis of preparation .................................................................................................................. 16
2. Accounting policies .................................................................................................................... 16
3. Significant accounting policies and estimates ........................................................................... 16
4. Financial risk management ........................................................................................................ 16
5. Financial instruments measured at fair value ........................................................................... 24
6. Business segments .................................................................................................................... 26
7. Income taxes ............................................................................................................................. 28
8. Goodwill .................................................................................................................................... 28
9. Losses and write-downs ............................................................................................................ 29
10. Non-performing and loss exposed loans ................................................................................... 30
11. Risk classification ....................................................................................................................... 31
12. Receivables and liabilities to group companies ........................................................................ 32
13. Capital adequacy ....................................................................................................................... 33
14. Issued securities ........................................................................................................................ 35
15. Securitization ............................................................................................................................. 37

Santander Consumer Bank
2014 Interim Report First Quarter - unaudited
Report of the Board of Directors
Introduction The accounts of Santander Consumer Bank AS show the activities of the company in Norway, Sweden and Denmark. In the group section, the Finnish subsidiary is included. All figures and notes were prepared on the assumption that the business is a going concern.
Highlights
Savings account and the related product High Interest Account reached NOK 11.6 billion
Losses and non-performing loans remain stable on a moderate level
Profits before tax of MNOK 304 against MNOK 318 in 2013
Business areas Division Norway New business volume (NBV) for car Norway is 3% above March 2013. Profit before tax (PBT) is 12,3% above the same period last year.
Sweden New business volume (NBV) is 3% higher than last year. Profit before tax is 23,6% above the same period last year. Deposits reached MNOK 3.468 by end of March.
Denmark New business volume (NBV) is 12% above first quarter 2013. Profit before tax (PBT) is 23,3% above the same period last year. Deposits reached MNOK 194 by end of March.
Finland
New sales of auto in March ended 34% above March last year. Sales of Direct Loan ended 16% above last year. Profit before tax (PBT) is 15,1% above the same period last year.
Cards
New business volume (NBV) is 15% above the same period last year. Credit cards sales are still over budget with 9.831 cards sold YTD, which is an increase regarding to budget with 11,2%. PBT has decreased with 2,4% compared to last year.
Financial review
The Nordic Group accounts show a profit before tax of MNOK 304 against MNOK 318 in 2013, which is an
decrease of 4,3%. The main reason for the decrease is a changed funding structure (hybrid capital) with an
impact of MNOK 40.8 compared to last year. This represents a ROA of 1,82 % of average assets in 2014
Santander Consumer Bank
2014 Interim Report First Quarter - unaudited
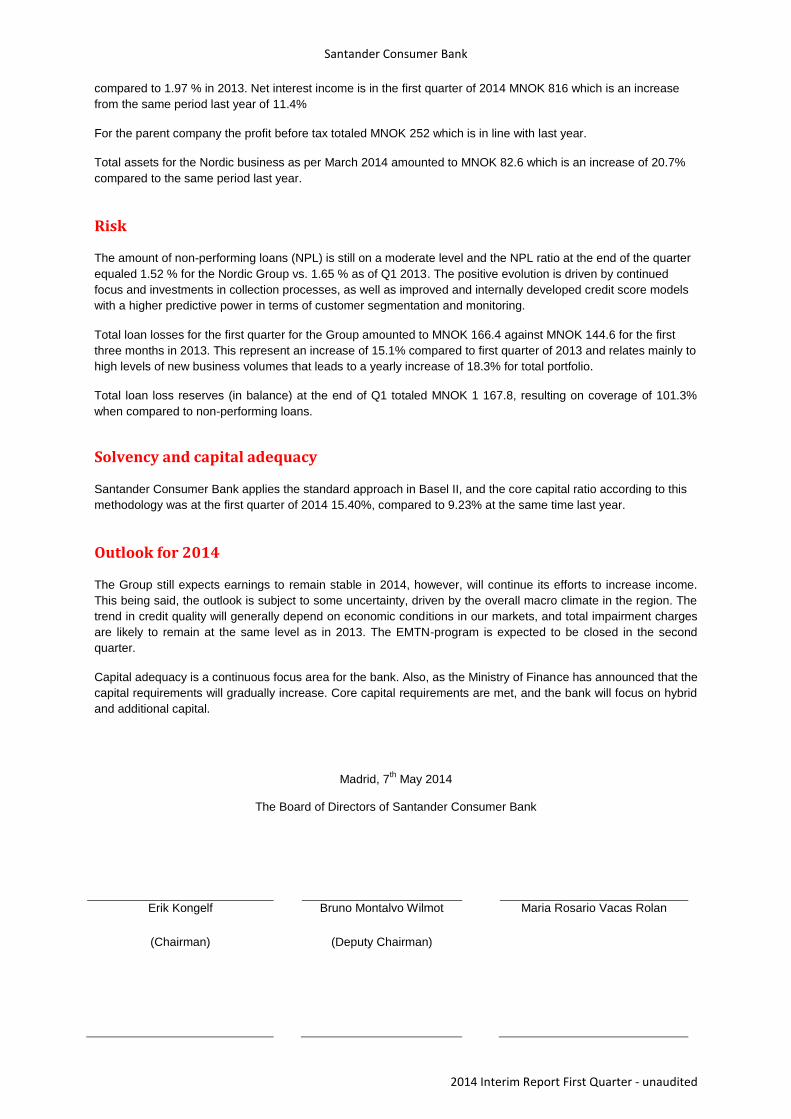
compared to 1.97 % in 2013. Net interest income is in the first quarter of 2014 MNOK 816 which is an increase
from the same period last year of 11.4%
For the parent company the profit before tax totaled MNOK 252 which is in line with last year.
Total assets for the Nordic business as per March 2014 amounted to MNOK 82.6 which is an increase of 20.7%
compared to the same period last year.
Risk
The amount of non-performing loans (NPL) is still on a moderate level and the NPL ratio at the end of the quarter
equaled 1.52 % for the Nordic Group vs. 1.65 % as of Q1 2013. The positive evolution is driven by continued
focus and investments in collection processes, as well as improved and internally developed credit score models
with a higher predictive power in terms of customer segmentation and monitoring.
Total loan losses for the first quarter for the Group amounted to MNOK 166.4 against MNOK 144.6 for the first
three months in 2013. This represent an increase of 15.1% compared to first quarter of 2013 and relates mainly to
high levels of new business volumes that leads to a yearly increase of 18.3% for total portfolio.
Total loan loss reserves (in balance) at the end of Q1 totaled MNOK 1 167.8, resulting on coverage of 101.3%
when compared to non-performing loans.
Solvency and capital adequacy
Santander Consumer Bank applies the standard approach in Basel II, and the core capital ratio according to this
methodology was at the first quarter of 2014 15.40%, compared to 9.23% at the same time last year.
Outlook for 2014
The Group still expects earnings to remain stable in 2014, however, will continue its efforts to increase income.
This being said, the outlook is subject to some uncertainty, driven by the overall macro climate in the region. The
trend in credit quality will generally depend on economic conditions in our markets, and total impairment charges
are likely to remain at the same level as in 2013. The EMTN-program is expected to be closed in the second
quarter.
Capital adequacy is a continuous focus area for the bank. Also, as the Ministry of Finance has announced that the
capital requirements will gradually increase. Core capital requirements are met, and the bank will focus on hybrid
and additional capital.
Madrid, 7th
May 2014
The Board of Directors of Santander Consumer Bank
Erik Kongelf Bruno Montalvo Wilmot Maria Rosario Vacas Rolan
(Chairman) (Deputy Chairman)

Santander Consumer Bank
2014 Interim Report First Quarter - unaudited
Francisco Javier Anton San
Pablo
Bjørn Elvestad Henning Strøm
Vibeke Hamre Krey
(Employee Representative)
Michael Hvidsten
(Chief Executive Officer)
Santander Consumer Bank
2014 Interim Report First Quarter - unaudited
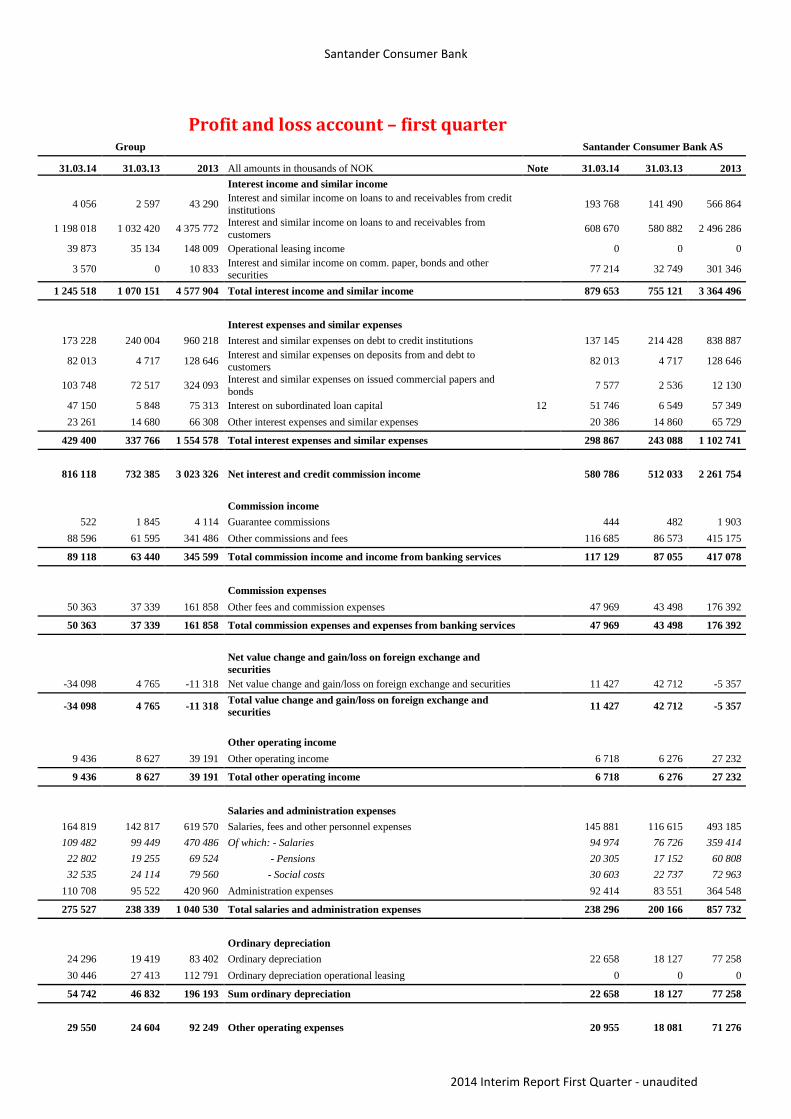
Profit and loss account – first quarter Group Santander Consumer Bank AS
31.03.14 31.03.13 2013 All amounts in thousands of NOK Note 31.03.14 31.03.13 2013
Interest income and similar income
4 056 2 597 43 290 Interest and similar income on loans to and receivables from credit
institutions 193 768 141 490 566 864
1 198 018 1 032 420 4 375 772 Interest and similar income on loans to and receivables from
customers 608 670 580 882 2 496 286
39 873 35 134 148 009 Operational leasing income 0 0 0
3 570 0 10 833 Interest and similar income on comm. paper, bonds and other securities
77 214 32 749 301 346
1 245 518 1 070 151 4 577 904 Total interest income and similar income 879 653 755 121 3 364 496
Interest expenses and similar expenses
173 228 240 004 960 218 Interest and similar expenses on debt to credit institutions 137 145 214 428 838 887
82 013 4 717 128 646 Interest and similar expenses on deposits from and debt to customers
82 013 4 717 128 646
103 748 72 517 324 093 Interest and similar expenses on issued commercial papers and
bonds 7 577 2 536 12 130
47 150 5 848 75 313 Interest on subordinated loan capital 12 51 746 6 549 57 349
23 261 14 680 66 308 Other interest expenses and similar expenses 20 386 14 860 65 729
429 400 337 766 1 554 578 Total interest expenses and similar expenses 298 867 243 088 1 102 741
816 118 732 385 3 023 326 Net interest and credit commission income 580 786 512 033 2 261 754
Commission income
522 1 845 4 114 Guarantee commissions 444 482 1 903
88 596 61 595 341 486 Other commissions and fees 116 685 86 573 415 175
89 118 63 440 345 599 Total commission income and income from banking services 117 129 87 055 417 078
Commission expenses
50 363 37 339 161 858 Other fees and commission expenses 47 969 43 498 176 392
50 363 37 339 161 858 Total commission expenses and expenses from banking services 47 969 43 498 176 392
Net value change and gain/loss on foreign exchange and
securities
-34 098 4 765 -11 318 Net value change and gain/loss on foreign exchange and securities 11 427 42 712 -5 357
-34 098 4 765 -11 318 Total value change and gain/loss on foreign exchange and
securities 11 427 42 712 -5 357
Other operating income
9 436 8 627 39 191 Other operating income 6 718 6 276 27 232
9 436 8 627 39 191 Total other operating income 6 718 6 276 27 232
Salaries and administration expenses
164 819 142 817 619 570 Salaries, fees and other personnel expenses 145 881 116 615 493 185
109 482 99 449 470 486 Of which: - Salaries 94 974 76 726 359 414
22 802 19 255 69 524 - Pensions 20 305 17 152 60 808
32 535 24 114 79 560 - Social costs 30 603 22 737 72 963
110 708 95 522 420 960 Administration expenses 92 414 83 551 364 548
275 527 238 339 1 040 530 Total salaries and administration expenses 238 296 200 166 857 732
Ordinary depreciation
24 296 19 419 83 402 Ordinary depreciation 22 658 18 127 77 258
30 446 27 413 112 791 Ordinary depreciation operational leasing 0 0 0
54 742 46 832 196 193 Sum ordinary depreciation 22 658 18 127 77 258
29 550 24 604 92 249 Other operating expenses 20 955 18 081 71 276

Santander Consumer Bank
2014 Interim Report First Quarter - unaudited
Losses on loans, guarantees etc
166 355 144 552 513 469 Loan losses 9 133 839 115 604 419 702
166 355 144 552 513 469 Total losses on loans, guarantees etc 133 839 115 604 419 702
304 036 317 551 1 392 500 Operating result 252 344 252 599 1 098 347
85 882 85 221 376 458 Taxes charge 7 68 991 69 219 289 812
218 154 232 330 1 016 043 Profit after tax* 183 353 183 379 808 534
Statement of comprehensive income Group Santander Consumer Bank AS
31.03.14 31.03.13 2013 All amounts in thousands of NOK Note 31.03.14 31.03.13 2013
218 154 232 330 1 016 043 Profit after tax for the period 183 353 183 379 808 534
Other Comprehensive income:
Items to be recycled to profit and loss
-81 986 -745 -67 157 Net exchange differences on translating foreign operations -2 898 -9 067 -1 399
128 796 0 144 101 Net investment hedge 0 0 0
16 952 0 0 Net interest relating to government bond 16 952 0 0
Items not to be recycled to profit and loss
-136 512 0 -136 512 Remeasurement of defined benefit obligation 0 0 -136 512
28 406 0 37 020 Income tax relating to remeasurement of defined benefit obligation 0 0 37 020
173 810 231 585 993 495 Total comprehensive income for the period, net of tax* 197 407 174 312 707 643

Santander Consumer Bank
2014 Interim Report First Quarter - unaudited
Profit and loss account – quarterly
Group Santander Consumer Bank AS
Q1 14 Q1 13 All amounts in thousands of NOK Note Q1 14 Q1 13
Interest income and similar income
4 056 2 597 Interest and similar income on loans to and receivables from credit institutions
193 768 141 490
1 198 018 1 032 420 Interest and similar income on loans to and receivables from customers
608 670 580 882
39 873 35 134 Operational leasing income 0 0
3 570 0 Interest and similar income on comm. paper, bonds and other securities
77 214 32 749
1 245 518 1 070 151 Total interest income and similar income 879 653 755 121
Interest expenses and similar expenses
173 228 240 004 Interest and similar expenses on debt to credit institutions
137 145 214 428
82 013 4 717 Interest and similar expenses on deposits from and debt to customers
82 013 4 717
103 748 72 517 Interest and similar expenses on issued commercial papers and bonds
7 577 2 536
47 150 5 848 Interest on subordinated loan capital 12 51 746 6 549
23 261 14 680 Other interest expenses and similar expenses
20 386 14 860
429 400 337 766 Total interest expenses and similar expenses 298 867 243 088
816 118 732 385 Net interest and credit commission income
580 786 512 033
Commission income
522 1 845 Guarantee commissions
444 482
88 596 61 595 Other commissions and fees
116 685 86 573
89 118 63 440 Total commission income and income from banking services 117 129 87 055
Commission expenses
50 363 37 339 Other fees and commission expenses
47 969 43 498
50 363 37 339 Total commission expenses and expenses from banking services 47 969 43 498
Net value change and gain/loss on foreign exchange and securities
-34 098 4 765 Net value change and gain/loss on foreign exchange and securities 11 427 42 712
-34 098 4 765 Total value change and gain/loss on foreign exchange and securities
11 427 42 712
Other operating income
9 436 8 627 Other operating income
6 718 6 276
9 436 8 627 Total other operating income 6 718 6 276
Salaries and administration expenses
164 819 142 817 Salaries, fees and other personnel expenses
145 881 116 615
109 482 99 449 Of which: - Salaries
94 974 76 726
22 802 19 255 - Pensions
20 305 17 152
32 535 24 114 - Social costs
30 603 22 737
110 708 95 522 Administration expenses
92 414 83 551
275 527 238 339 Total salaries and administration expenses 238 296 200 166
Ordinary depreciation
24 296 19 419 Ordinary depreciation
22 658 18 127
30 446 27 413 Ordinary depreciation operational leasing 0 0
54 742 46 832 Sum ordinary depreciation 22 658 18 127
29 550 24 604 Other operating expenses
20 955 18 081
Losses on loans, guarantees etc
166 355 144 552 Loan losses 9 133 839 115 604
166 355 144 552 Total losses on loans, guarantees etc 133 839 115 604
304 036 317 551 Operating result 252 344 252 599

Santander Consumer Bank
2014 Interim Report First Quarter - unaudited
85 882 85 221 Taxes charge 7 68 991 69 219
218 154 232 330 Profit after tax 183 353 183 379
Allocation of profit after tax
218 154 232 330 Transferred to other earned equity
183 353 183 379
218 154 232 330 Total allocations 183 353 183 379
Statement of comprehensive income – quarterly Group Santander Consumer Bank AS
31.03.14 31.03.13 All amounts in thousands of NOK Note 31.03.14 31.03.13
218 154 232 330 Profit after tax for the period 183 353 183 379
Other Comprehensive income:
Items to be recycled to profit and loss
-81 986 -745 Net exchange differences on translating foreign operations -2 898 -9 067
128 796 0 Net investment hedge 0 0
16 952 0 Net interest relating to government bond 16 952 0
Items not to be recycled to profit and loss
-136 512 0 Remeasurement of defined benefit obligation 0 0
28 406 0 Income tax relating to remeasurement of defined benefit obligation 0 0
173 810 231 585 Total comprehensive income for the period, net of tax* 197 407 174 312

Santander Consumer Bank
2014 Interim Report First Quarter - unaudited
Balance sheet – Assets Group Santander Consumer Bank AS
31.03.14 31.03.13 2013 All amounts in thousands of NOK Note 31.03.14 31.03.13 2013
Cash and receivables on central banks
50 059 0 0 Cash and receivables on central banks 50 059 0 0
50 059 0 0 Total cash and receivables on central banks 50 059 0 0
Deposits with and receivables on financial institutions
4 548 032 3 684 644 4 908 825 Deposits with and receivables on financial institutions 4 2 931 022 2 427 802 3 024 211
4 548 032 3 684 644 4 908 825 Total deposits with and loans to financial institutions 2 931 022 2 427 802 3 024 211
Loans to customers
2 538 446 2 174 740 2 461 641 Credit cards 2 538 446 2 174 740 2 461 641
4 973 234 3 618 348 4 639 197 Unsecured loans
3 021 771 1 860 307 2 689 660
54 101 324 45 814 048 53 063 747 Installment loans 45 813 942 39 406 907 45 027 852
11 959 723 10 887 148 11 726 477 Financial leasing 11 291 715 10 418 872 11 098 395
73 572 727 62 494 285 71 891 062 Total loans before individual and group write-downs 4 62 665 874 53 860 827 61 277 547
98 775 100 170 92 045 -Individual write-downs 4, 9 60 969 62 861 55 498
1 069 017 921 079 1 061 253 -Group write-downs 4, 9 822 892 678 026 787 172
72 404 934 61 473 036 70 737 764 Net loans 4, 11 61 782 014 53 119 940 60 434 877
-
19 051 17 810 18 339 Repossessed assets 5 561 8 458 5 312
-
Commercial papers, bonds and other fixed-income
securities
1 057 799 - 995 650 Commercial papers and bonds 7 240 623 4 657 712 8 849 099
1 057 799 - 995 650 Total commercial papers, bonds, other fixed-income
securities 7 240 623 4 657 712 8 849 099
-
473 338 136 316 862 151 Financial derivatives 4 143 368 123 735 200 479
Ownership interests in group companies
0 0 0 Ownership interest in credit institutions 1 071 681 975 223 1 085 701
0 0 0 Sum ownership interest in group companies 1 071 681 975 223 1 085 701
-
Intangible assets
445 420 429 381 421 600 Goodwill 8 112 359 102 391 113 934
184 265 142 571 201 412 Deferred tax assets 37 020 4 525 37 020
350 150 275 974 352 445 Other intangible assets 338 788 264 763 339 840
979 835 847 927 975 458 Total intangible assets 488 167 371 679 490 794
-
Fixed assets
42 009 33 252 35 332 Machinery, fittings and vehicles 35 707 28 805 30 686
436 977 398 300 440 585 Operational leasing 0 0 0
478 986 431 553 475 917 Total fixed assets 35 707 28 805 30 686
Other assets
2 013 278 1 381 844 1 775 409 Consignment 867 744 701 587 699 441
348 308 273 327 282 845 Other assets 211 072 544 197 424 407
2 361 586 1 655 171 2 058 254 Total other assets 1 078 816 1 245 784 1 123 847
Prepayments and earned income
197 664 159 866 182 357 Earned income not received and prepaid expenses not incurred
147 595 131 831 121 214
197 664 159 866 182 357 Total prepayments and earned income 147 595 131 831 121 214
82 571 285 68 406 323 81 214 715 Total assets 74 974 611 63 090 968 75 366 222
Santander Consumer Bank
2014 Interim Report First Quarter - unaudited
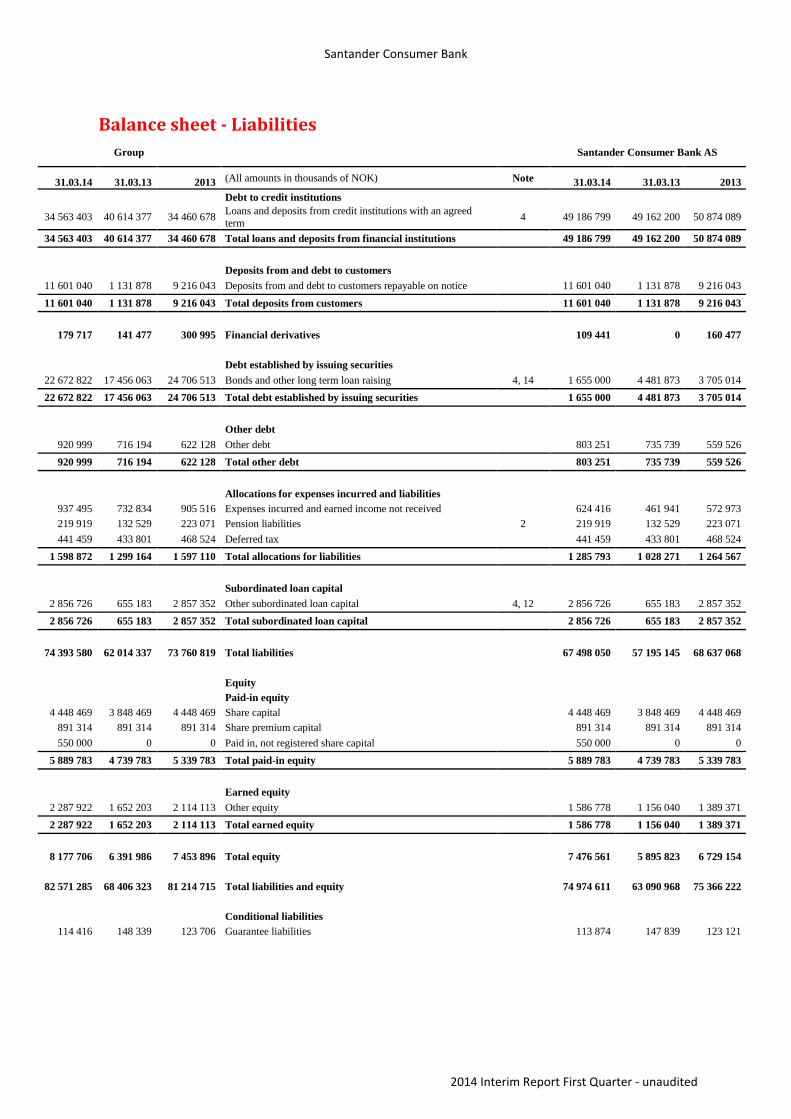
Balance sheet - Liabilities
Group Santander Consumer Bank AS
31.03.14 31.03.13 2013 (All amounts in thousands of NOK) Note 31.03.14 31.03.13 2013
Debt to credit institutions
34 563 403 40 614 377 34 460 678 Loans and deposits from credit institutions with an agreed
term 4 49 186 799 49 162 200 50 874 089
34 563 403 40 614 377 34 460 678 Total loans and deposits from financial institutions 49 186 799 49 162 200 50 874 089
Deposits from and debt to customers
11 601 040 1 131 878 9 216 043 Deposits from and debt to customers repayable on notice 11 601 040 1 131 878 9 216 043
11 601 040 1 131 878 9 216 043 Total deposits from customers 11 601 040 1 131 878 9 216 043
179 717 141 477 300 995 Financial derivatives 109 441 0 160 477
Debt established by issuing securities
22 672 822 17 456 063 24 706 513 Bonds and other long term loan raising 4, 14 1 655 000 4 481 873 3 705 014
22 672 822 17 456 063 24 706 513 Total debt established by issuing securities 1 655 000 4 481 873 3 705 014
Other debt
920 999 716 194 622 128 Other debt 803 251 735 739 559 526
920 999 716 194 622 128 Total other debt 803 251 735 739 559 526
Allocations for expenses incurred and liabilities
937 495 732 834 905 516 Expenses incurred and earned income not received 624 416 461 941 572 973
219 919 132 529 223 071 Pension liabilities 2 219 919 132 529 223 071
441 459 433 801 468 524 Deferred tax 441 459 433 801 468 524
1 598 872 1 299 164 1 597 110 Total allocations for liabilities 1 285 793 1 028 271 1 264 567
Subordinated loan capital
2 856 726 655 183 2 857 352 Other subordinated loan capital 4, 12 2 856 726 655 183 2 857 352
2 856 726 655 183 2 857 352 Total subordinated loan capital 2 856 726 655 183 2 857 352
74 393 580 62 014 337 73 760 819 Total liabilities 67 498 050 57 195 145 68 637 068
Equity
Paid-in equity
4 448 469 3 848 469 4 448 469 Share capital 4 448 469 3 848 469 4 448 469
891 314 891 314 891 314 Share premium capital 891 314 891 314 891 314
550 000 0 0 Paid in, not registered share capital 550 000 0 0
5 889 783 4 739 783 5 339 783 Total paid-in equity 5 889 783 4 739 783 5 339 783
Earned equity
2 287 922 1 652 203 2 114 113 Other equity 1 586 778 1 156 040 1 389 371
2 287 922 1 652 203 2 114 113 Total earned equity 1 586 778 1 156 040 1 389 371
8 177 706 6 391 986 7 453 896 Total equity 7 476 561 5 895 823 6 729 154
82 571 285 68 406 323 81 214 715 Total liabilities and equity 74 974 611 63 090 968 75 366 222
Conditional liabilities
114 416 148 339 123 706 Guarantee liabilities
113 874 147 839 123 121

Santander Consumer Bank
2014 Interim Report First Quarter - unaudited
Madrid, 7th
May 2014
The Board of Directors of Santander Consumer Bank
Erik Kongelf Bruno Montalvo Wilmot Maria Rosario Vacas Rolan
(Chairman) (Deputy Chairman)
Francisco Javier Anton San
Pablo
Bjørn Elvestad Henning Strøm
Vibeke Hamre Krey
(Employee Representative)
Michael Hvidsten
(Chief Executive Officer)

Santander Consumer Bank
2014 Interim Report First Quarter - unaudited
Statement of changes in equity Group:
All amounts in thousands of NOK Share capital
Share capital
premium
Paid in, not
registered share
capital Other equity
Retained
earnings Total
Balance at 1 January 2014 4 448 469 891 314 - (32 350) 2 146 463 7 453 896
Net profit for the year
218 154 218 154 Acturaial gain/loss on post employment benefit
obligations
(136 512)
(136 512)
Income tax relating to components of post
employment benefit obligations
28 406
28 406
Net investment hedge
128 796
128 796
Net exchange differences on translating foreign
operations
(81 986)
(81 986)
Net interest relating to government bonds 16 952 16 952
Other comprehensive income, net of tax - - - (44 344) - (44 344)
Total comprehensive income - - - (44 344) 218 154 173 810
Share dividend
-
Capital increase
- Other changes (Paid in, not registered share
capital) 550 000 550 000
Balance at 31 March 2014 4 448 469 891 314 550 000 (76 694) 2 364 617 8 177 706
All amounts in thousands of NOK Share capital
Share capital
premium
Paid in, not
registered share
capital Other equity
Retained
earnings Total
Balance at 1 January 2013 3 848 469 891 314 - (9 803) 1 430 420 6 160 401
Conversion differences foreign currencies (branches)
(745)
(745)
Profit for the period 232 330 232 330
Total comprehensive income for the period - - - (745) 232 330 231 585
Capital increase -
Share dividend
-
Other changes (Paid in, not registered share
capital) -
Balance at 31 March 2013 3 848 469 891 314 - (10 548) 1 662 750 6 391 986
Santander Consumer Bank AS:
All amounts in thousands of NOK Share capital
Share capital
premium
Paid in, not
registered share
capital Other equity
Retained
earnings Total
Balance at 1 January 2014 4 448 469 891 314 - (105 387) 1 494 758 6 729 154
Profit for the period
183 353 183 353
Conversion differences foreign currencies
(branches) (2 898)
(2 898)
Currency translation differences during the year 16 952 16 952
Total comprehensive income for the period - - - 14 054 183 353 197 407
Capital increase as of March 2014 550 000 550 000
Share dividend 0
Other changes (Paid in, not registered share
capital) 0
Balance at 31 March 2014 4 448 469 891 314 550 000 -91 333 1 678 111 7 476 561

Santander Consumer Bank
2014 Interim Report First Quarter - unaudited
All amounts in thousands of NOK Share capital
Share capital
premium
Paid in, not
registered share
capital Other equity
Retained
earnings Total
Balance at 1 January 2013 3 848 469 891 314 0 -4 496 986 224 5 721 511
Conversion differences foreign currencies (branches)
-9 067
-9 067
Profit for the period 183 379 183 379
Total comprehensive income for the period 0 0 0 -9 067 183 379 174 312
Capital increase 0
Share dividend
0
Corrections previous periods 0
Balance at 31 March 2013 3 848 469 891 314 0 -13 563 1 169 603 5 895 823
Santander Consumer Bank
2014 Interim Report First Quarter - unaudited
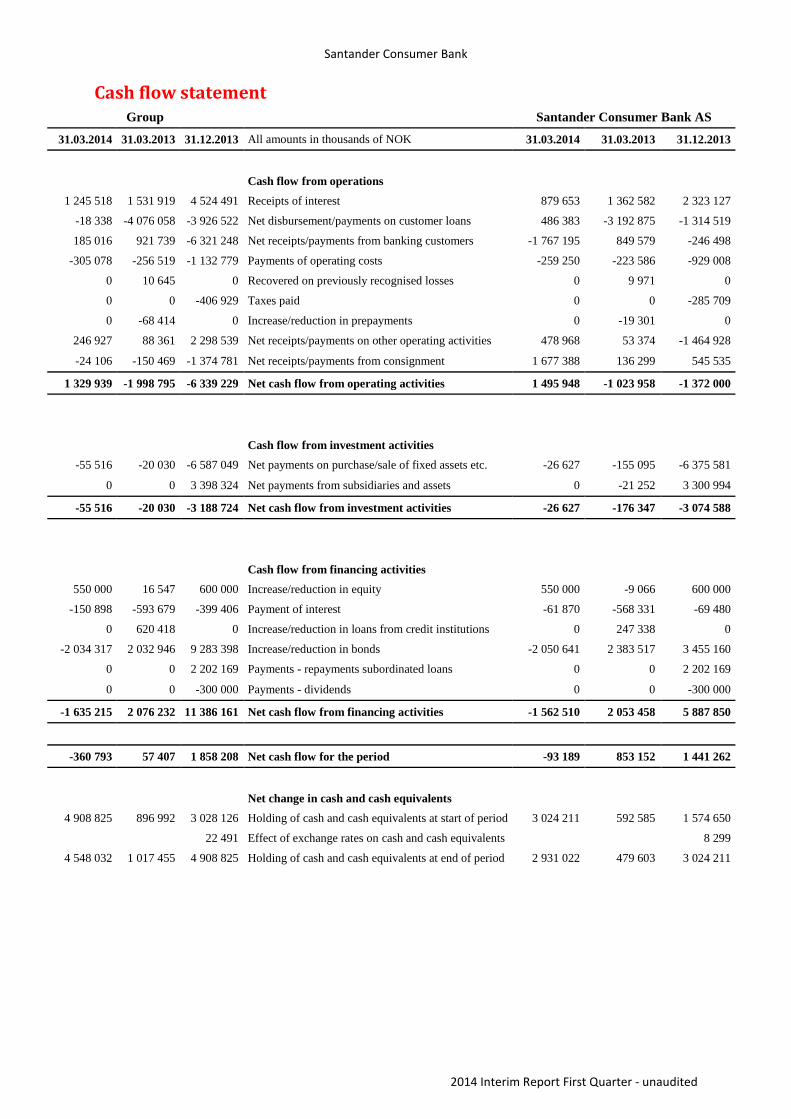
Cash flow statement Group Santander Consumer Bank AS
31.03.2014 31.03.2013 31.12.2013 All amounts in thousands of NOK 31.03.2014 31.03.2013 31.12.2013
Cash flow from operations
1 245 518 1 531 919 4 524 491 Receipts of interest 879 653 1 362 582 2 323 127
-18 338 -4 076 058 -3 926 522 Net disbursement/payments on customer loans 486 383 -3 192 875 -1 314 519
185 016 921 739 -6 321 248 Net receipts/payments from banking customers -1 767 195 849 579 -246 498
-305 078 -256 519 -1 132 779 Payments of operating costs -259 250 -223 586 -929 008
0 10 645 0 Recovered on previously recognised losses 0 9 971 0
0 0 -406 929 Taxes paid 0 0 -285 709
0 -68 414 0 Increase/reduction in prepayments 0 -19 301 0
246 927 88 361 2 298 539 Net receipts/payments on other operating activities 478 968 53 374 -1 464 928
-24 106 -150 469 -1 374 781 Net receipts/payments from consignment 1 677 388 136 299 545 535
1 329 939 -1 998 795 -6 339 229 Net cash flow from operating activities 1 495 948 -1 023 958 -1 372 000
Cash flow from investment activities
-55 516 -20 030 -6 587 049 Net payments on purchase/sale of fixed assets etc. -26 627 -155 095 -6 375 581
0 0 3 398 324 Net payments from subsidiaries and assets 0 -21 252 3 300 994
-55 516 -20 030 -3 188 724 Net cash flow from investment activities -26 627 -176 347 -3 074 588
Cash flow from financing activities
550 000 16 547 600 000 Increase/reduction in equity 550 000 -9 066 600 000
-150 898 -593 679 -399 406 Payment of interest -61 870 -568 331 -69 480
0 620 418 0 Increase/reduction in loans from credit institutions 0 247 338 0
-2 034 317 2 032 946 9 283 398 Increase/reduction in bonds -2 050 641 2 383 517 3 455 160
0 0 2 202 169 Payments - repayments subordinated loans 0 0 2 202 169
0 0 -300 000 Payments - dividends 0 0 -300 000
-1 635 215 2 076 232 11 386 161 Net cash flow from financing activities -1 562 510 2 053 458 5 887 850
-360 793 57 407 1 858 208 Net cash flow for the period -93 189 853 152 1 441 262
Net change in cash and cash equivalents
4 908 825 896 992 3 028 126 Holding of cash and cash equivalents at start of period 3 024 211 592 585 1 574 650
22 491 Effect of exchange rates on cash and cash equivalents 8 299
4 548 032 1 017 455 4 908 825 Holding of cash and cash equivalents at end of period 2 931 022 479 603 3 024 211

Santander Consumer Bank
2014 Interim Report First Quarter - unaudited
Notes
1. Basis of preparation The accounts show the activities of the company in Norway, Sweden and Denmark (Santander Consumer Bank AS). In the group accounts, the Finnish subsidiary (Santander Consumer Finance OY) and the special purpose Vehicles Bilkreditt 2 ltd., Bilkreditt 3 ltd., Bilkreditt 4 ltd., Bilkreditt 5 ltd., SCG Ajoneuro-hallinto ltd., SCF Rahoitus-palvelut ltd., SCF Ajoneuvo-hallinta ltd, SCF Rahoitus-palvelut 2013 ltd, Dansk Auto Finansiering 1 ltd., Svensk Autofinans 1 ltd. and Svensk Autofinans WH ltd related to the securitized portfolios are included. All figures and notes were prepared under the assumption that the business is a going concern. The Santander Consumer Bank interim accounts for the first quarter of 2014 are prepared in accordance with IAS 34 Interim Financial reporting as endorsed by EU. The interim accounts do not include all the information and disclosures required for full annual accounts and should be read in conjunction with the company’s annual report as of 31 December 2013, which was prepared in accordance with IFRS. The annual report for 2013 may be obtained by contacting Santander Consumer Bank AS, Strandveien 18, Lysaker – or by visiting www.santander.no.
2. Accounting policies The Group’s accounting policies are consistent with those of the previous financial year as described in the 2013 Annual Report except as described below.
Interim reporting policies: The amendment of disclosure requirements Interim Financial reporting in IAS 34 regarding fair value and segment reporting is reflected in the notes to the financial statement. The presentation in the statement of comprehensive income is changed to reflect the amendment of IAS 1 which requires a split between items that will be reclassified to profit or loss. Taxes on income in the interim periods are accrued using the tax rate that would be applicable to expected total annual profit or loss.
3. Significant accounting policies and estimates Management’s estimates and assumptions of future events that will significantly affect the carrying amounts of assets and liabilities underlie the preparation of the consolidated financial statements. The preparation of interim financial statements requires management to make judgments, estimates and assumptions that affect the application of accounting policies and the reported amounts of assets and liabilities, income and expense. Actual results may differ from these estimates. In preparing these condensed interim financial statements, the significant judgments made by management in applying the group’s accounting policies and the key sources of estimation uncertainty were the same as those that applied to the consolidated financial statements for the year ended 31 December 2013, with the exception of changes in estimates that are required in determining the provision for income taxes. The estimates and assumptions that are deemed critical to the consolidated financial statements are listed in the Santander Consumer Bank 2013 annual report.
4. Financial risk management The group’s activities expose it to a variety of financial risks: market risk, credit risk, liquidity risk and operational risk. The interim financial statements do not include all financial risk management information and disclosures required in the annual financial statements; they should be read in conjunction with note 23 in the group’s 2013 annual financial statements.
Fair value estimation: The table below analyses financial instruments carried at fair value, by valuation method. The different levels have been defined as follows:
Level 1: Quoted prices (unadjusted) in active markets for identical assets or liabilities

Santander Consumer Bank
2014 Interim Report First Quarter - unaudited
Level 2: Inputs other than quoted prices included within level 1 that are observable for the asset or liability, either directly (that is, as prices) or indirectly (that is, derived from prices)
Level 3: Inputs for the asset or liability that are not based on observable market data (that is, unobservable inputs)
The following table presents the Group’s assets and liabilities that are measured at fair value at 31 March 2014:
Group:
Classification of financial assets first quarter 2014
Financial assets at
fair value through
P&L
Held to
maturity
investments
Loans and
receivables
Securitization
assets
Booked
value Fair value
All amounts in thousands of NOK
Cash and receivables on central banks
Cash and receivables on central banks -
- 50 059 - 50 059 50 059
Total cash and receivables on central banks -
- 50 059 - 50 059 50 059
Deposits with and receivables on financial institutions
Deposits with Norwegian financial institutions - 4 548 032 - 4 548 032 4 548 032
Total deposits with and loans to financial institutions -
- 4 548 032 - 4 548 032 4 548 032
Loans to customers
Credit cards -
- 2 538 446 - 2 538 446 2 538 446
Unsecured loans -
- 4 973 234 - 4 973 234 4 973 234
Instalment loans -
- 54 101 324 - 54 101 324 54 101 324
Financial leasing -
- 11 959 723 - 11 959 723 11 959 723
Total loans before individual and group write-downs -
- 73 572 727 - 73 572 727 73 572 727
-Individual write-downs -
- 98 775 - 98 775 98 775
-Group write-downs -
- 1 069 017 - 1 069 017 1 069 017
Net loans -
- 72 404 934 - 72 404 934 72 404 934
Comm papers, bonds and other fixed-income securities
Commercial papers and bonds - 1 057 799 - - 1 057 799 1 057 799
Total comm. papers, bonds, other fixed-income securities - 1 057 799 - - 1 057 799 1 057 799
Financial derivatives
Financial derivatives 473 338
- - - 473 338 473 338
Sum financial derivatives 473 338
- - - 473 338 473 338
Other assets
Operational leasing 19 051 - 19 051 19 051
Sum other assets -
- 19 051 - 19 051 19 051
Total financial assets 473 338 1 057 799 77 022 077 - 78 553 213 78 553 213

Santander Consumer Bank
2014 Interim Report First Quarter - unaudited
Classification of financial liabilities first quarter 2014
Financial
liabilities at fair
value through
P&L
Financial liabilities
measured at amortised
cost
Securitization
assets Booked value Fair value
All amounts in thousands of NOK
Debt to credit institutions
Loans and deposits from credit institutions - 34 563 403 - 34 563 403 34 563 403
Total loans and deposits from financial institutions - 34 563 403 - 34 563 403 34 563 403
Deposits from and debt to customers
Deposits from and debt to customers repayable on notice - 11 601 040 - 11 601 040 11 601 040
Total deposits from customers - 11 601 040 - 11 601 040 11 601 040
Financial derivatives
Financial derivatives 176 497 - - 176 497 176 497
Total financial derivatives 176 497 - - 176 497 176 497
Debt established by issuing securities
Bonds and other long term loan raising - - 22 672 822 22 672 822 22 672 822
Total debt established by issuing securities - - 22 672 822 22 672 822 22 672 822
Subordinated loan capital
Other subordinated loan capital - 2 856 726 - 2 856 726 2 856 726
Total subordinated loan capital - 2 856 726 - 2 856 726 2 856 726
Total financial liabilities 176 497 49 021 169 22 672 822 71 870 488 71 870 488
Classification of financial assets 31 December 2013
Financial assets at
fair value through
Profit & Loss -
Held for trading
Held to
maturity
investments
Loans and
receivables
Securitization
assets
Booked
value Fair value
All amounts in thousands of NOK
Deposits with and receivables on financial institutions
Deposits with Norwegian financial institutions - 4 908 825 - 4 908 825 4 908 825
Total deposits with and loans to financial institutions -
- 4 908 825 - 4 908 825 4 908 825
Loans to customers
Credit cards -
- 2 461 641 - 2 461 641 2 461 641
Unsecured loans - 4 639 197 - 4 639 197 4 639 197
Instalment loans -
- 53 063 747 - 53 063 747 53 063 747
Financial leasing -
- 11 726 477 - 11 726 477 11 726 477
Total loans before individual and group write-downs -
- 71 891 062 - 71 891 062 71 891 062
-Individual write-downs - 92 045 - 92 045 92 045
-Group write-downs - 1 061 253 - 1 061 253 1 061 253
Net loans -
- 70 737 764 - 70 737 764 70 737 764
Comm papers, bonds and other fixed-income securities
Commercial papers and bonds - 995 650 - - 995 650 995 650
Total comm. papers, bonds, other fixed-income securities - 995 650 - - 995 650 995 650
Financial derivatives
Financial derivatives 862 151
- - - 862 151 862 151
Sum financial derivatives 862 151
- - - 862 151 862 151

Santander Consumer Bank
2014 Interim Report First Quarter - unaudited
Other assets
Operational leasing -
- 18 339 - 18 339 18 339
Sum other assets -
- 18 339 - 18 339 18 339
Total financial assets 862 151 995 650 75 664 928 - 77 522 730 77 522 730
Classification of financial liabilities 31 December 2013
Financial liabilities at
fair value through
Profit & Loss - Held
for trading
Financial liabilities
measured at amortised
cost
Securitization
assets Booked value Fair value
All amounts in thousands of NOK
Debt to credit institutions
Loans and deposits from credit institutions - 34 460 678 - 34 460 678 34 460 678
Total loans and deposits from financial institutions - 34 460 678 - 34 460 678 34 460 678
Deposits from and debt to customers
Deposits from and debt to customers repayable on notice - 9 216 043 - 9 216 043 9 216 043
Total deposits from customers - 9 216 043 - 9 216 043 9 216 043
Financial derivatives
Financial derivatives 300 995
- - 300 995 300 995
Sum financial derivatives 300 995
- - 300 995 300 995
Debt established by issuing securities
Bonds and other long term loan raising - - 24 706 513 24 706 513 24 706 513
Total debt established by issuing securities - - 24 706 513 24 706 513 24 706 513
Subordinated loan capital
Other subordinated loan capital - 2 857 352 - 2 857 352 2 857 352
Total subordinated loan capital - 2 857 352 - 2 857 352 2 857 352
Total financial liabilities 300 995 46 534 073 24 706 513 71 541 581 71 541 581
Santander Consumer Bank AS:
Classification of financial assets first quarter 2014
Financial assets at
fair value through
P&L
Held to
maturity
investments
Loans and
receivables
Securitization
assets
Booked
value Fair value
All amounts in thousands of NOK
Cash and receivables on central banks
Cash and receivables on central banks - - 50 059 - 50 059 50 059
Total cash and receivables on central banks - - 50 059 - 50 059 50 059
Deposits with and receivables on financial institutions
Deposits with Norwegian financial institutions - 2 931 022 - 2 931 022 2 931 022
Total deposits with and loans to financial institutions - - 2 931 022 - 2 931 022 2 931 022
Loans to customers
Credit cards - - 2 538 446 - 2 538 446 2 538 446
Unsecured loans - - 3 021 771 - 3 021 771 3 021 771
Instalment loans - - 45 813 942 - 45 813 942 45 813 942
Financial leasing - - 11 291 715 - 11 291 715 11 291 715
Total loans before individual and group write-downs - - 62 665 874 - 62 665 874 62 665 874
-Individual write-downs - - 60 969 - 60 969 60 969
-Group write-downs - - 822 892 - 822 892 822 892
Net loans - - 61 782 014 - 61 782 014 61 782 014

Santander Consumer Bank
2014 Interim Report First Quarter - unaudited
Comm papers, bonds and other fixed-income securities
Commercial papers and bonds - 1 057 799 - 6 182 824 7 240 623 7 240 623
Total comm. papers, bonds, other fixed-income
securities - 1 057 799 - 6 182 824 7 240 623 7 240 623
Financial derivatives
Financial derivatives 143 368 - - 143 368 143 368
Sum financial derivatives 143 368 - - - 143 368 143 368
Other assets
Operational leasing - - 5 561 - 5 561 5 561
Sum other assets - - 5 561 - 5 561 5 561
Total financial assets 143 368 1 057 799 64 768 655 6 182 824 72 152 645 72 152 645
Classification of financial liabilities first quarter 2014
Financial
liabilities at fair
value through
P&L
Financial
liabilities
measured at
amortised cost Securitization assets Booked value Fair value
All amounts in thousands of NOK
Debt to credit institutions
Loans and deposits from credit institutions -
49 186 799 - 49 186 799 49 186 799
Total loans and deposits from financial institutions -
49 186 799 - 49 186 799 49 186 799
Deposits from and debt to customers
Deposits from and debt to customers repayable on notice -
11 601 040 - 11 601 040 11 601 040
Total deposits from customers -
11 601 040 - 11 601 040 11 601 040
Financial derivatives
Financial derivatives 109 441 - - 109 441
Sum financial derivatives 109 441 - - 109 441
Debt established by issuing securities
Bonds and other long term loan raising - -
1 655 000 1 655 000 1 655 000
Total debt established by issuing securities -
- 1 655 000 1 655 000 1 655 000
Subordinated loan capital
Other subordinated loan capital -
2 856 726 - 2 856 726 2 856 726
Total subordinated loan capital -
2 856 726 - 2 856 726 2 856 726
Total financial liabilities -
63 644 565 1 655 000 65 299 565 65 299 565

Santander Consumer Bank
2014 Interim Report First Quarter - unaudited
Classification of financial assets 31 December 2013
Financial assets at
fair value through
Profit & Loss
Held to
maturity
investments
Loans and
receivables
Securitization
assets Booked value Fair value
All amounts in thousands of NOK
Deposits with and receivables on financial institutions
Deposits with Norwegian financial institutions - - 3 024 211 - 3 024 211 3 024 211
Total deposits with and loans to financial institutions - - 3 024 211 - 3 024 211 3 024 211
Loans to customers
Credit cards - - 2 461 641 - 2 461 641 2 461 641
Unsecured loans - - 2 689 660 - 2 689 660 2 689 660
Instalment loans - - 45 027 852 - 45 027 852 45 027 852
Financial leasing - - 11 098 395 - 11 098 395 11 098 395
Total loans before individual and group write-downs - - 61 277 547 - 61 277 548 61 277 548
-Individual write-downs - - 55 498 - 55 498 55 498
-Group write-downs - - 787 172 - 787 172 787 172
Net loans - - 60 434 877 - 60 434 878 60 434 878
Comm papers, bonds and other fixed-income securities
Commercial papers and bonds - 995 650 - 7 853 449 8 849 099 8 849 099
Total comm. papers, bonds, other fixed-income
securities - 995 650 - 7 853 449 8 849 099 8 849 099
Financial derivatives
Financial derivatives 200 479 - - - 200 479 200 479
Sum financial derivatives 200 479 - - - 200 479 200 479
Other assets
Operational leasing - - 5 312 - 5 312 5 312
Sum other assets - - 5 312 - 5 312 5 312
Total financial assets 200 479 995 650 63 464 400 7 853 449 72 513 979 72 513 979
Classification of financial liabilities 31 December 2013
Financial liabilities
at fair value through
P&L
Financial liabilities
measured at
amortised cost
Securitization
assets Booked value Fair value
All amounts in thousands of NOK
Debt to credit institutions
Loans and deposits from credit institutions - 50 874 089 - 50 874 089 50 874 089
Total loans and deposits from financial institutions - 50 874 089 - 50 874 089 50 874 089
Deposits from and debt to customers
Deposits from and debt to customers repayable on notice - 9 216 043 - 9 216 043 9 216 043
Total deposits from customers - 9 216 043 - 9 216 043 9 216 043
Financial derivatives
Financial derivatives 160 477
-
- 160 477 160 477
Sum financial derivatives 160 477 -
- 160 477 160 477
Debt established by issuing securities
Certificates and other short term loan raising - - - -
Bonds and other long term loan raising - - 3 705 014 3 705 014 3 705 014
Total debt established by issuing securities - - 3 705 014 3 705 014 3 705 014
Subordinated loan capital
Other subordinated loan capital - 2 857 352 - 2 857 352 2 857 352
Total subordinated loan capital - 2 857 352 - 2 857 352 2 857 352
Total financial liabilities 160 477 62 947 484 3 705 014 66 812 975 66 812 975

Santander Consumer Bank
2014 Interim Report First Quarter - unaudited
Valuation techniques used to derive Level 2 fair values: Level 2 trading and hedging derivatives comprise forward foreign exchange contracts and interest rate swaps. These forward foreign exchange contracts have been fair valued using forward exchange rates that are quoted in an active market. Interest rate swaps are fair valued using forward interest rates extracted from observable yield curves. The effects of discounting are generally insignificant for Level 2 derivatives. Level 2 debt investments are fair valued using a discounted cash flow approach, which discounts the contractual cash flows using discount rates derived from observable market prices of other quoted debt instruments of the counterparties.
Interest risk and interest adjustments: Group and SCB AS 31.04.14 Norway in NOK
1M 3M 6M 12M 2 Y 3 Y 4 Y 5 Y >5 Y
Non Interest Bearing Total
ASSET 6 422 30 763 1 230 1 264 646 62 9 4 5 2 094 42 499
LIABITITY 17 220 12 765 1 521 1 700 414 150 0 0 0 8 729 42 499
NET BALANCE -10 798 17 998 -291 -436 232 -88 9 4 5 -6 634 0
NET OBS 0
REPRICING GAP -10 798 17 998 -291 -436 232 -88 9 4 5 -6 634 0
CUMULATIVE GAP -10 798 7 200 6 908 6 472 6 704 6 616 6 626 6 630 6 634 0
A +1,00 % parallell increase in market rates will result in a 23,72 million NOK loss in Norway.
Sweden in SEK
1M 3M 6M 12M 2 Y 3 Y 4 Y 5 Y >5 Y
Non Interest Bearing Total
ASSET 14 084 578 4 4 2 1 1 0 1 249 14 923
LIABITITY 7 423 5 582 566 752 0 0 0 0 0 601 14 923
NET BALANCE 6 661 -5 004 -562 -747 2 1 1 0 1 -352 0
NET OBS 0
REPRICING GAP 6 661 -5 004 -562 -747 2 1 1 0 1 -352 0
CUMULATIVE GAP 6 661 1 657 1 095 348 350 351 351 351 352 0
A +1,00 % parallell increase in market rates will result in a 13,48 million SEK increase in profit in Sweden.
Denmark in DKK
1M 3M 6M 12M 2 Y 3 Y 4 Y 5 Y >5 Y
Non Interest Bearing Total
ASSET 7 822 248 357 649 1 040 765 534 341 332 75 12 163
LIABITITY 5 580 2 821 186 1 165 430 1 170 0 440 0 370 12 163
NET BALANCE 2 242 -2 573 171 -517 610 -405 534 -99 332 -295 0
NET OBS 0
REPRICING GAP 2 242 -2 573 171 -517 610 -405 534 -99 332 -295 0
CUMULATIVE GAP 2 242 -331 -160 -677 -66 -471 63 -36 295 0
A +1,00 % parallell increase in market rates will result in a 28,23 million DKK loss in Denmark

Santander Consumer Bank
2014 Interim Report First Quarter - unaudited
Finland in EUR
1M 3M 6M 12M 2 Y 3 Y 4 Y 5 Y >5 Y
Non Interest Bearing Total
ASSET 520 106 143 237 308 132 88 57 1 25 1 618
LIABITITY 601 171 61 150 315 42 10 20 0 248 1 618
NET BALANCE -81 -65 82 87 -6 90 78 37 1 -223 0
NET OBS 31 -15 -16 0 0 0
REPRICING GAP -50 -80 65 87 -6 90 78 37 1 -223 0
CUMULATIVE GAP -50 -129 -64 23 17 107 185 222 223 0
A +1,00 % parallell increase in market rates will result in a 6,83 million EUR loss in Finland.

Santander Consumer Bank
2014 Interim Report First Quarter - unaudited
5. Financial instruments measured at fair value
Group:
All amounts in thousands of NOK
Quoted
market
price Level
1
Using
observable
inputs
Level 2
With
significant
unobservable
inputs
Level 3 Total
Financial assets
Bilkreditt 2 Limited, BtB
- - 31 809 094 31 809 094
Dansk Autofinans 1 Limited, basis
- - 446 830 446 830
Bilkreditt 3 limited, Currency Swap
- - 249 207 023 249 207 023
Bilkreditt 4 limited, Currency Swap
- - 77 255 504 77 255 504
Bilkreditt 5 limited, Currency Swap
- - 34 640 531 34 640 531
SCF Rahoituspalvelut Limited, B2B swap
- - 3 077 498 3 077 498
IRS swap
- - - -
Total - - 396 436 480 396 436 480
Financial liabilities
Bilkreditt 2 Limited, Basis Swap
- - -32 241 882 -32 241 882
Dansk Autofinans 1 Limited, BtB
- - -1 521 907 -1 521 907
Bilkreditt 3 limited, Swap
- - -77 255 504 -77 255 504
Bilkreditt 4 limited, Swap
- - 76 918 030 76 918 030
Bilkreditt 5 limited,fixed Swap
- - -30 664 055 -30 664 055
Bilkreditt 5 limited,front Swap
- - -34 640 531 -34 640 531
SCF Rahoituspalvelut limited, Basis
- - 3 186 005 3 186 005
IRS swap
225 494 - - 225 494
Total 225 494 - -96 219 844 -95 994 350
Reconciliation of fair value measurements categorized within Level 3
All amounts in thousands of NOK Opening
balance
Total gains or
losses for the
period Purchases Issues Sales Settlements
Closing
balance
Bilkreditt 1 Limited, BtB swap 25 010 315 - - - - -25 010 315 -
Bilkreditt 1 Limited, Basis Swap -25 260 964 - - - - 25 260 964 -
Bilkreditt 2 Limited, BtB swap 42 345 827 -10 536 733 - - - - 31 809 094
Bilkreditt 2 Limited, Basis Swap -42 876 769 10 634 887 - - - - -32 241 882
Bilkreditt 3 limited, Currency Swap 367 367 344 -118 160 321 - - - - 249 207 023
Bilkreditt 4 limited, Currency Swap 74 864 241 2 053 789 - - - - 76 918 030
Bilkreditt 4 limited, Swap 139 058 587 -61 803 083 - - - - 77 255 504
Bilkreditt 4 limited, Swap -139 058 587 61 803 083 - - - - -77 255 504
Bilkreditt 5 limited, Currency Swap - - - - - - -
Bilkreditt 5 limited, Currency Swap 10 792 729 23 847 803 - - - - 34 640 532
Bilkreditt 5 limited, Swap -8 967 605 -21 696 450 - - - - -30 664 055
Dansk Autofinans 1 Limited, BtB 11 209 452 -12 731 359 - - - - -1 521 907
Dansk Autofinans 1 Limited, Basis -12 451 229 12 898 059 - - - - 446 830
SCF Rahoituspalvelut Limited, B2B swap 5 143 718 -2 066 219 - - - - 3 077 498
SCF Rahoituspalvelut limited, Basis 5 306 256 -2 120 251 - - - - 3 186 005
IRS swap - - - - - - -
Total 452 483 315 -117 876 795 - - - 250 649 334 857 169

Santander Consumer Bank
2014 Interim Report First Quarter - unaudited
Santander Consumer Bank AS:
All amounts in thousands of NOK
Quoted
market
price Level
1
Using
observable
inputs
Level 2
With significant
unobservable
inputs
Level 3 Total
Financial assets
Bilkreditt 2 Limited, BtB
31 809 094,00 31 809 094
Dansk Autofinans 1 Limited, basis
446 830,00 446 830
Bilkreditt 3 limited, Currency Swap
249 207 023 249 207 023
Bilkreditt 4 limited, Currency Swap
77 255 504 77 255 504
Bilkreditt 5 limited, Currency Swap
34 640 531 34 640 531
Total - - 393 358 982 393 358 982
Financial liabilities
Bilkreditt 2 Limited, Basis Swap
-32 241 882 -32 241 882
Dansk Autofinans 1 Limited, BtB
-1 521 907 -1 521 907
Bilkreditt 3 limited, Swap
-77 255 504 -77 255 504
Bilkreditt 4 limited, Swap
76 918 030 76 918 030
Bilkreditt 5 limited,fixed Swap
-30 664 055 -30 664 055
Bilkreditt 5 limited,front Swap
-34 640 531 -34 640 531
Total - - -99 405 849 -99 405 849
Reconciliation of fair value measurements categorized within Level 3
All amounts in thousands of NOK Opening
balance
Total gains or
losses for the
period Purchases Issues sales settlements
Closing
balance
Bilkreditt 1 Limited, BtB swap 25 010 315 - - - - -25 010 315 -
Bilkreditt 1 Limited, Basis Swap -25 260 964 - - - - 25 260 964 -
Bilkreditt 2 Limited, BtB swap 42 345 827 -10 536 733 - - - - 31 809 094
Bilkreditt 2 Limited, Basis Swap -42 876 769 10 634 887 - - - - -32 241 882
Bilkreditt 3 limited, Currency Swap 367 367 344 -118 160 321 - - - - 249 207 023
Bilkreditt 4 limited, Currency Swap 74 864 241 2 053 789 - - - - 76 918 030
Bilkreditt 4 limited, Swap 139 058 587 -61 803 083 - - - - 77 255 504
Bilkreditt 4 limited, Swap -139 058 587 61 803 083 - - - - -77 255 504
Bilkreditt 5 limited, Currency Swap - - - - - - -
Bilkreditt 5 limited, Currency Swap 10 792 729 23 847 803 - - - - 34 640 532
Bilkreditt 5 limited, Swap -8 967 605 -21 696 450 - - - - -30 664 055
Dansk Autofinans 1 Limited, BtB 11 209 452 -12 731 359 - - - - -1 521 907
Dansk Autofinans 1 Limited, Basis -12 451 229 12 898 059 - - - - 446 830
Total 442 033 341 -113 690 325 - - - 250 649 328 593 665

Santander Consumer Bank
2014 Interim Report First Quarter - unaudited
6. Business segments The Santander Consumer Bank Group's chief operating decision maker is the board of directors. Management has determined the operating segments based in the information reviewed by the strategic steering committee for the purposes of allocating resources and assessing performance. The operating segments are divided into the different geographical markets the Group operates within. The segments are; Norway, Sweden, Denmark and Finland. Internal income and expenses are allocated to the individual segments on an arm’s-length basis. The following table presents revenue and profit information regarding Santander Consumer Bank’s operating segments for the three months ended 31 March 2014 Group:
First quarter 2014
All amounts in thousands of NOK Norway Sweden Denmark Finland Eliminations Total Group
Net interest income 411 920 104 076 130 628 169 494 - 816 118
Net commission income and income from banking services 13 977 12 017 7 817 4 944 - 38 755
Value change and gain/loss on foreign exchange
and securities 421 (1 019) (861)
(735) (31 905) (34 098)
Oher operating income 5 573 2 145 (533) 2 251 - 9 436
Operating expences, salaries, depreciation 183 259 55 104 45 293 76 164 - 359 820
Losses on loans, guarantees etc 113 736 14 895 21 530 16 193 - 166 355
Operating result 134 896 47 220 70 229 83 596 (31 905) 304 036
Total tax 68 991 - - 16 891 - 85 882
Profit after tax 65 904 47 220 70 229 66 706 (31 905) 218 154
-
Cash and receivables on central banks 50 059 - - -
50 059
Deposits with and loans to financial institutions 2 320 116 1 038 356 552 657 636 903 - 4 548 032
Net loans 37 378 547 11 898 978 12 537 812 10 589 598 - 72 404 934
Commercial papers and bonds 1 057 799 - - - - 1 057 799
Financial derivatives 469 830 - 447 3 061 - 473 338
Shares, interests and primary capital certificates 1 071 681 - - - (1 071 681) -
Other assets 529 679 833 555 374 903 2 007 209 291 778 4 037 123
Total assets 42 877 710 13 770 889 13 465 818 13 236 771 (779 902) 82 571 285
-
Debt to credit institutions 11 173 332 5 158 712 9 840 730 8 382 276 8 354 34 563 403
Deposits from customers 7 938 999 3 467 625 194 416 -
11 601 040
Financial derivatives 174 802 - 1 522 3 393
179 717
Debt issued by securities 12 149 788 4 586 323 3 004 060 2 932 652
22 672 822
Other liabilities 4 294 142 459 262 234 185 421 677 (32 668) 5 376 597
Allocated capital 7 146 648 98 966 190 906 1 496 774 (755 588) 8 177 706
Total liabilities and equity 42 877 710 13 770 889 13 465 818 13 236 771 (779 902) 82 571 285
31 December 2013
All amounts in thousands of NOK Norway Sweden Denmark Finland Eliminations Total Group
Net interest income 1 628 560 345 716 423 511 626 248 (710) 3 023 326
Net commission income and income from banking services 73 598 44 331 30 087 35 725 - 183 742
Value change and gain/loss on foreign exchange
and securities (29 857) 5 012 14 014 (24) (463) (11 317)
Oher operating income 18 961 8 007 1 751 10 472 - 39 191
Operating expences, salaries, depreciation 670 602 192 385 145 206 320 780 - 1 328 972
Losses on loans, guarantees etc 303 262 67 991 88 903 53 312 - 513 469
Operating result 717 399 142 690 235 255 298 329 (1 173) 1 392 500
Total tax 257 770 32 042 - 86 646 - 376 458
Profit after tax 459 629 110 649 235 255 211 683 (1 173) 1 016 042

Santander Consumer Bank
2014 Interim Report First Quarter - unaudited
Cash and receivables on central banks 995 650 - - -
995 650
Deposits with and loans to financial institutions 2 863 836 970 964 543 144 530 882 - 4 908 825
Net loans 36 427 758 12 028 460 12 021 201 10 260 346 - 70 737 764
Commercial papers and bonds - - - - - -
Financial derivatives 845 759 - 11 209 5 183 - 862 151
Shares, interests and primary capital certificates 1 085 701 - - - (1 085 701) -
Other assets 451 105 673 655 326 853 1 943 012 315 699 3 710 324
Total assets 42 669 810 13 673 079 12 902 407 12 739 422 (770 003) 81 214 715
Debt to credit institutions 11 710 177 6 497 552 9 104 144 7 140 451 8 354 34 460 678
Deposits from customers 6 822 170 2 393 872 - -
9 216 043
Financial derivatives 282 608 - 12 451 5 936
300 995
Debt issued by securities 13 036 902 4 478 977 3 476 112 3 714 521
24 706 513
Other liabilities 4 233 901 249 725 187 331 430 095 (24 462) 5 076 590
Allocated capital 6 584 050 52 952 122 369 1 448 419 (753 894) 7 453 896
Total liabilities and equity 42 669 810 13 673 079 12 902 407 12 739 422 (770 003) 81 214 715
Santander Consumer Bank AS:
First quarter 2014
All amounts in thousands of NOK Norway Sweden Denmark Eliminations Total Group
Net interest income 370 591 94 513 115 681 - 580 786
Net commission income and income from banking services 35 379 18 516 15 265 - 69 160
Value change and gain/loss on foreign exchange
and securities 10 518 (1 019) 1 928 - 11 427
Oher operating income 5 573 2 145 (1 000) - 6 718
Operating expences, salaries, depreciation 181 512 55 104 45 293 - 281 908
Losses on loans, guarantees etc 105 654 11 831 16 354 - 133 839
Operating result 134 896 47 220 70 229 - 252 344
Total tax 68 991 - - - 68 991
Profit after tax 65 904 47 220 70 229 - 183 353
Cash and receivables on central banks 50 059 - - - 50 059
Deposits with and loans to financial institutions 1 738 355 802 145 390 521 - 2 931 022
Net loans 37 345 207 11 898 981 12 537 826 - 61 782 014
Commercial papers and bonds 4 319 981 934 092 1 986 549 - 7 240 623
Financial derivatives 143 368 - - - 143 368
Shares, interests and primary capital certificates 1 071 681 - - - 1 071 681
Other assets 580 090 832 690 375 734 (32 668) 1 755 846
Total assets 45 248 739 14 467 909 15 290 631 (32 668) 74 974 611
Debt to credit institutions 24 071 649 10 444 650 14 670 499 - 49 186 799
Deposits from customers 7 938 999 3 467 625 194 416 - 11 601 040
Financial derivatives 107 920 - 1 522 - 109 441
Debt issued by securities 1 655 000 - - - 1 655 000
Other liabilities 4 288 458 456 683 233 296 (32 668) 4 945 769
Allocated capital 7 186 713 98 950 190 898 - 7 476 561
Total liabilities and equity 45 248 739 14 467 909 15 290 631 (32 668) 74 974 611
Santander Consumer Bank
2014 Interim Report First Quarter - unaudited
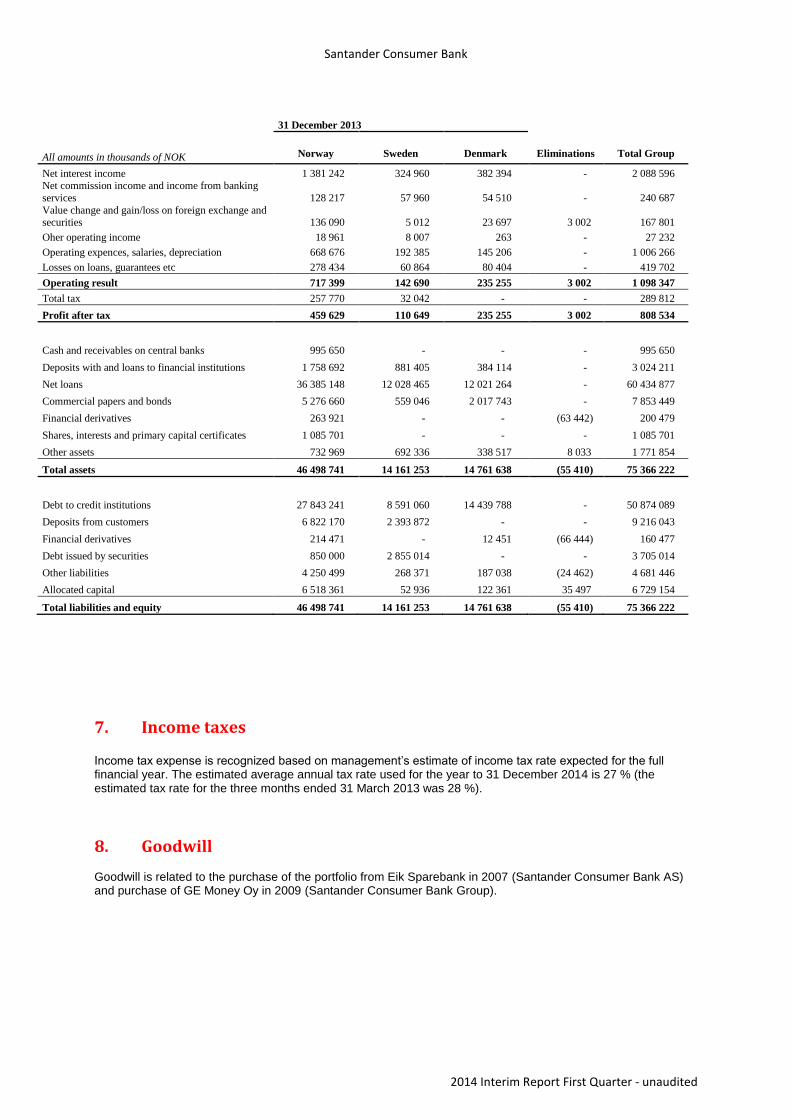
31 December 2013
All amounts in thousands of NOK Norway Sweden Denmark Eliminations Total Group
Net interest income 1 381 242 324 960 382 394 - 2 088 596 Net commission income and income from banking
services 128 217 57 960 54 510 - 240 687
Value change and gain/loss on foreign exchange and securities 136 090 5 012 23 697 3 002 167 801
Oher operating income 18 961 8 007 263 - 27 232
Operating expences, salaries, depreciation 668 676 192 385 145 206 - 1 006 266
Losses on loans, guarantees etc 278 434 60 864 80 404 - 419 702
Operating result 717 399 142 690 235 255 3 002 1 098 347
Total tax 257 770 32 042 - - 289 812
Profit after tax 459 629 110 649 235 255 3 002 808 534
Cash and receivables on central banks 995 650 - - - 995 650
Deposits with and loans to financial institutions 1 758 692 881 405 384 114 - 3 024 211
Net loans 36 385 148 12 028 465 12 021 264 - 60 434 877
Commercial papers and bonds 5 276 660 559 046 2 017 743 - 7 853 449
Financial derivatives 263 921 - - (63 442) 200 479
Shares, interests and primary capital certificates 1 085 701 - - - 1 085 701
Other assets 732 969 692 336 338 517 8 033 1 771 854
Total assets 46 498 741 14 161 253 14 761 638 (55 410) 75 366 222
Debt to credit institutions 27 843 241 8 591 060 14 439 788 - 50 874 089
Deposits from customers 6 822 170 2 393 872 - - 9 216 043
Financial derivatives 214 471 - 12 451 (66 444) 160 477
Debt issued by securities 850 000 2 855 014 - - 3 705 014
Other liabilities 4 250 499 268 371 187 038 (24 462) 4 681 446
Allocated capital 6 518 361 52 936 122 361 35 497 6 729 154
Total liabilities and equity 46 498 741 14 161 253 14 761 638 (55 410) 75 366 222
7. Income taxes Income tax expense is recognized based on management’s estimate of income tax rate expected for the full financial year. The estimated average annual tax rate used for the year to 31 December 2014 is 27 % (the estimated tax rate for the three months ended 31 March 2013 was 28 %).
8. Goodwill Goodwill is related to the purchase of the portfolio from Eik Sparebank in 2007 (Santander Consumer Bank AS) and purchase of GE Money Oy in 2009 (Santander Consumer Bank Group).

Santander Consumer Bank
2014 Interim Report First Quarter - unaudited
9. Losses and write-downs Write-downs calculated separately for each business unit, using internal parameters. Individual write-downs calculated by arrears following portfolio ageing and specific assessment of the exposure. Group write-downs calculated by arrears, including incurred but not reported impaired loans following portfolio ageing. Write-downs held in balance fully cover 12 months of expected losses arising from impaired loans and incurred but not reported.
Group:
Loan losses expenses
All amounts in thousands of NOK 1Q 2014 1Q 2013 Full year
2013
Write-downs at the end of the period 1 167 792 1 021 248 1 153 298
+/ - Rate adjustment opening balance 7 207 -11 230 -57 793
- Write-downs at the beginning of the period 1 153 298 1 023 444 1 023 444
+ Total recognised losses 161 764 170 570 607 695
- Recoveries on recognised losses 17 110 12 592 166 287
= Loan losses 166 355 144 552 513 469
Individual- and group write-downs
All amounts in thousands of NOK 1Q 2014 1Q 2013 Full year
2013
Individual write-downs at the beginning of the period 92 045 110 802 110 802
+/ - Rate adjustment opening balance 1 919 2 062 12 611
Reclassification from individual to group write-downs 0 0 -32 634
- Recognised losses covered by earlier write-downs 0 0 0
- Reversal of earlier individual write-downs 0 0 0
+ Individual write-downs for the period 4 811 -12 694 1 266
= Individual write-downs at the end of the period 98 775 100 170 92 045
1Q 2014 1Q 2013 Full year
2013
Group write-downs at the beginning of the period 1 061 253 912 642 912 642
+/ - Rate adjustment opening balance -9 125 9 168 45 182
Reclassification from individual to group write-downs
0 32 634
+/ - Write-downs for the period 16 890 -731 70 795
= Group write-downs at the end of the period 1 069 017 921 079 1 061 253

Santander Consumer Bank
2014 Interim Report First Quarter - unaudited
Santander Consumer Bank AS:
Loan losses expenses
All amounts in thousands of NOK 1Q 2014 1Q 2013 Full year
2013
Write-downs at the end of the period 883 861 740 887 842 670
+/ - Rate adjustment opening balance 3 447 -4 956 -19 117
- Write-downs at the beginning of the period 842 670 734 232 734 232
+ Total recognised losses 102 908 124 044 414 415
- Recoveries on recognised losses 13 707 10 139 84 034
= Loan losses 133 839 115 604 419 702
Individual- and group write-downs
All amounts in thousands of NOK 1Q 2014 1Q 2013 Full year
2013
Individual write-downs at the beginning of the period 55 498 74 783 74 783
+/ - Rate adjustment opening balance -556 1 648 6 176
Reclassification from individual to group write-downs
0 -32 634
- Recognised losses covered by earlier write-downs
0 0
- Reversal of earlier individual write-downs
0 0
+ Individual write-downs for the period 6 027 -13 570 7 173
= Individual write-downs at the end of the period 60 969 62 861 55 498
1Q 2014 1Q 2013 Full year
2013
Group write-downs at the beginning of the period 787 172 659 449 659 449
+/ - Rate adjustment opening balance -2 891 3 308 12 941
Reclassification from individual to group write-downs
0 32 634
+/ - Write-downs for the period 38 610 15 269 82 149
= Group write-downs at the end of the period 822 892 678 026 787 172
10. Non-performing and loss exposed loans
Group:
All amounts in thousands of NOK 1Q 2014 1Q 2013
Full year
2013
Gross non-performing- and other loss exposed loans 1 153 277 1 060 992 1 190 238
Individual write-downs 98 775 110 105 92 045
Group write-downs 1 069 017 845 284 1 061 253
Net non-performing- and other loss exposed loans -14 515 105 603 36 940

Santander Consumer Bank
2014 Interim Report First Quarter - unaudited
Santander Consumer Bank AS:
All amounts in thousands of NOK 1Q 2014 1Q 2013
Full year
2013
Gross non-performing- and other loss exposed loans 1 048 392 944 626 1 063 538
Individual write-downs 60 969 72 302 55 498
Group write-downs 822 892 613 291 787 172
Net non-performing- and other loss exposed loans 164 531 259 033 220 868
11. Risk classification Santander Consumer Bank makes use of a risk classification system, which is based on objective valuation when granting/amending loans. The risk groups had a fairly stable development during the first three months of 2014. The development of the portfolio is under continuous surveillance.
Group:
1Q 2014
All amounts in thousands of
NOK Very good Good Medium Less good Default Total
Gross loans 69 560 156 4 220 306 874 844 255 530 1 153 277 76 064 113
Write downs 471 111 48 594 53 122 56 512 538 454 1 167 793
Net 31.03.14 69 089 045 4 171 712 821 722 199 018 614 823 74 896 320
1Q 2013
All amounts in thousands of
NOK Very good Good Medium Less good Default Total
Gross loans 56 722 549 5 319 227 1 057 944 242 530 1 061 293 64 403 543
Write downs 432 058 44 020 53 052 52 629 439 488 1 021 247
Net 31.03.13 56 290 491 5 275 207 1 004 892 189 901 621 805 63 382 296
Santander Consumer Bank AS:
1Q 2014
All amounts in thousands of
NOK Very good Good Medium Less good Default Total
Gross loans 58 456 381 3 235 189 592 129 201 949 1 048 392 63 534 039
Write downs 302 904 32 490 34 561 47 153 466 755 883 862
Net 31.03.14 58 153 477 3 202 699 557 568 154 796 581 637 62 650 177
1Q 2013
All amounts in thousands of
NOK Very good Good Medium Less good Default Total
Gross loans 48 341 077 4 399 010 789 782 198 753 945 325 54 673 947
Write downs 261 426 31 005 37 804 43 476 367 174 740 885
Net 31.03.13 48 079 651 4 368 005 751 978 155 277 578 151 53 933 062

Santander Consumer Bank
2014 Interim Report First Quarter - unaudited
12. Receivables and liabilities to group companies
Group:
All amounts in thousands of NOK Interest
31.03.14 1Q 2014 1Q 2013
Full year
2013
Loans from credit institutions 168 610 34 322 479 40 614 377 34 452 324
Of which:
Banco Santander
Santander Benelux 24 773 413 32 466 871 26 027 611
Santander Consumer Finance S.A. 9 549 066 8 147 506 8 230 438
Accrued interest / other debt 85 968 116 430 -
Hybrid capital 31 543 2 250 000 - 2 250 000
Subordinated loan capital 47 150 575 183 655 183 575 183
Of which:
Banco Santander 180 000 180 000 180 000
Santander Benelux 210 000 210 000 210 000
Santander Consumer Finance S.A. 185 183 265 183 185 183
Accrued interest / other debt 35 842 4 386 33 278
Subordinated loan capital 1Q 2014 1Q 2013 Full year
2013
MNOK 180, maturity September 2016, 3 month NIBOR + 0,55 % 180 000 180 000 180 000
MNOK 80, maturity October 2017, 3 month NIBOR + 1,00 % 80 000 80 000 80 000
MNOK 80, maturity September 2018, 3 month NIBOR + 2,41 % - 80 000 -
MNOK 210, maturity June 2019, 6 month NIBOR + 3,43 % 210 000 210 000 210 000
MNOK 105, maturity December 2020, 12 month EURIBOR + 3,20% 105 183 105 183 105 183
Total subordinated loan capital 575 183 655 183 575 183

Santander Consumer Bank
2014 Interim Report First Quarter - unaudited
Santander Consumer Bank AS:
All amounts in thousands of NOK Interest
31.03.14 1Q 2014 1Q 2013
Full year
2013
Loans from credit institutions 137 024 26 243 017 33 518 753 27 130 096
Of which:
Santander Benelux 25 076 227 32 411 400 26 027 611
Santander Consumer Finance S.A. 1 166 791 1 107 353 1 086 363
Accrued interest / other debt 67 757 95 227 -
Hybrid capital 31 543 2 250 000 - 2 250 000
Subordinated loan capital 51 746 575 183 655 183 575 183
Of which:
Banco Santander 180 000 180 000 180 000
Santander Benelux 210 000 210 000 210 000
Santander Consumer Finance S.A. 185 183 265 183 185 183
Accrued interest / other debt - 4 386 33 278
Subordinated loan capital 1Q 2014 1Q 2013 Full year
2013
MNOK 180, maturity September 2016, 3 month NIBOR + 0,55 % 180 000 180 000 180 000
MNOK 80, maturity October 2017, 3 month NIBOR + 1,00 % 80 000 80 000 80 000
MNOK 80, maturity September 2018, 3 month NIBOR + 2,41 % - 80 000 -
MNOK 210, maturity June 2019, 6 month NIBOR + 3,43 % 210 000 210 000 210 000
MNOK 105, maturity December 2020, 12 month EURIBOR + 3,20% 105 183 105 183 105 183
Total subordinated loan capital 575 183 655 183 575 183
13. Capital adequacy
Group:
All amounts in thousands of NOK Q1 2014 Q1 2013 2013
Core capital 9 229 716 5 310 937 8 728 439
Eligible supplementary capital 435 170 559 656 431 732
Total primary capital 9 664 886 5 870 593 9 160 170
Minimum capital requirement (pilar I)
Credit risk 5 085 592 3 808 633 4 976 025
Market risk 49 394 0 28 276
Operational risk 426 744 291 198 426 744
Deductions in capital requirement -85 521 -54 242 -84 900
Total minimum capital requirement (pilar I) 5 476 208 4 045 589 5 346 144
Capital ratio 14,12 % 11,61 % 13,71 %
Core capital ratio 13,48 % 10,50 % 13,06 %

Santander Consumer Bank
2014 Interim Report First Quarter - unaudited
Santander Consumer Bank AS:
All amounts in thousands of NOK Q1 2014 Q1 2013 2013
Core capital 9 055 041 5 310 937 8 485 357
Eligible supplementary capital 435 170 559 656 431 732
Total primary capital 9 490 211 5 870 593 8 917 089
Minimum capital requirement (pilar I)
Credit risk 4 414 216 4 277 965 4 364 152
Market risk 20 615 18 322 11 911
Operational risk 335 150 379 136 335 150
Deductions in capital requirement -65 831 -73 686 -62 974
Total minimum capital requirement (pilar I) 4 704 150 4 601 737 4 648 240
Capital ratio 16,14 % 10,21 % 15,35 %
Core capital ratio 15,40 % 9,23 % 14,60 %
Financial information in accordance with the capital requirement regulation is published at www.santander.no.
Information according to Pillar 3 will be published at www.santander.no.
Santander Consumer Bank
2014 Interim Report First Quarter - unaudited
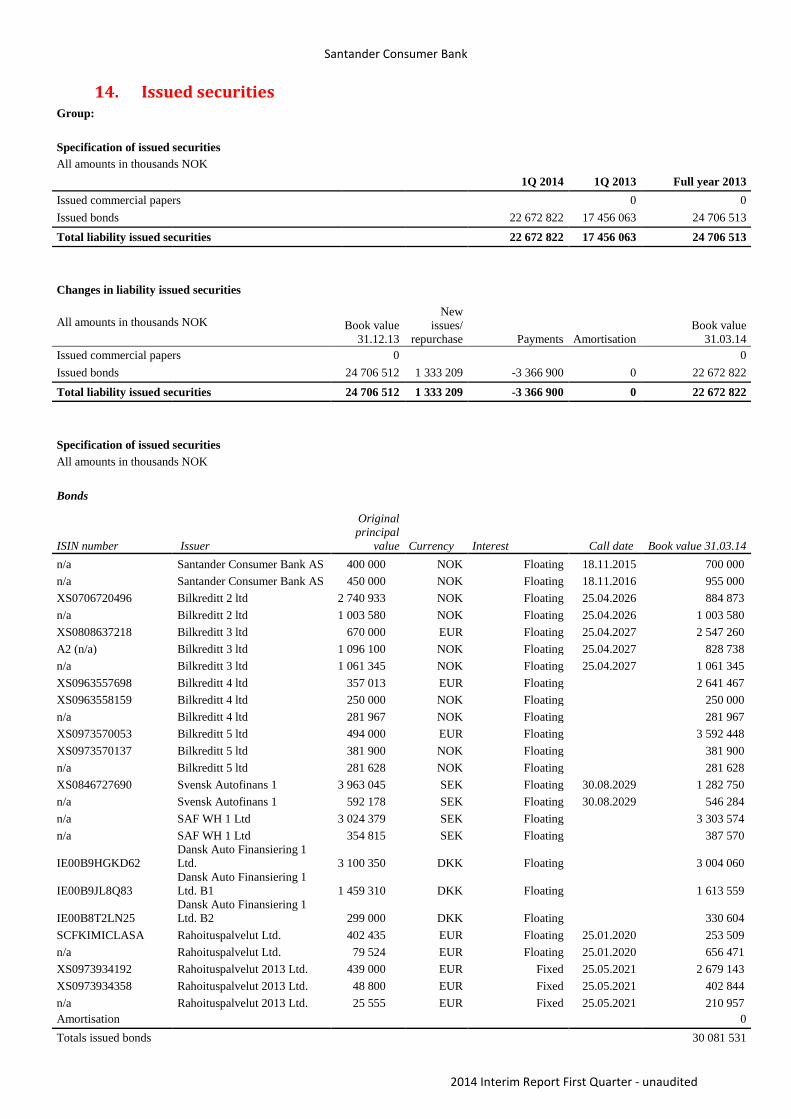
14. Issued securities Group:
Specification of issued securities
All amounts in thousands NOK
1Q 2014 1Q 2013 Full year 2013
Issued commercial papers 0 0
Issued bonds 22 672 822 17 456 063 24 706 513
Total liability issued securities 22 672 822 17 456 063 24 706 513
Changes in liability issued securities
All amounts in thousands NOK Book value
31.12.13
New
issues/
repurchase Payments Amortisation
Book value
31.03.14
Issued commercial papers 0
0
Issued bonds 24 706 512 1 333 209 -3 366 900 0 22 672 822
Total liability issued securities 24 706 512 1 333 209 -3 366 900 0 22 672 822
Specification of issued securities
All amounts in thousands NOK
Bonds
ISIN number Issuer
Original
principal
value Currency Interest Call date Book value 31.03.14
n/a Santander Consumer Bank AS 400 000 NOK Floating 18.11.2015 700 000
n/a Santander Consumer Bank AS 450 000 NOK Floating 18.11.2016 955 000
XS0706720496 Bilkreditt 2 ltd 2 740 933 NOK Floating 25.04.2026 884 873
n/a Bilkreditt 2 ltd 1 003 580 NOK Floating 25.04.2026 1 003 580
XS0808637218 Bilkreditt 3 ltd 670 000 EUR Floating 25.04.2027 2 547 260
A2 (n/a) Bilkreditt 3 ltd 1 096 100 NOK Floating 25.04.2027 828 738
n/a Bilkreditt 3 ltd 1 061 345 NOK Floating 25.04.2027 1 061 345
XS0963557698 Bilkreditt 4 ltd 357 013 EUR Floating
2 641 467
XS0963558159 Bilkreditt 4 ltd 250 000 NOK Floating
250 000
n/a Bilkreditt 4 ltd 281 967 NOK Floating
281 967
XS0973570053 Bilkreditt 5 ltd 494 000 EUR Floating
3 592 448
XS0973570137 Bilkreditt 5 ltd 381 900 NOK Floating
381 900
n/a Bilkreditt 5 ltd 281 628 NOK Floating
281 628
XS0846727690 Svensk Autofinans 1 3 963 045 SEK Floating 30.08.2029 1 282 750
n/a Svensk Autofinans 1 592 178 SEK Floating 30.08.2029 546 284
n/a SAF WH 1 Ltd 3 024 379 SEK Floating
3 303 574
n/a SAF WH 1 Ltd 354 815 SEK Floating
387 570
IE00B9HGKD62
Dansk Auto Finansiering 1
Ltd. 3 100 350 DKK Floating
3 004 060
IE00B9JL8Q83
Dansk Auto Finansiering 1
Ltd. B1 1 459 310 DKK Floating
1 613 559
IE00B8T2LN25
Dansk Auto Finansiering 1
Ltd. B2 299 000 DKK Floating
330 604
SCFKIMICLASA Rahoituspalvelut Ltd. 402 435 EUR Floating 25.01.2020 253 509
n/a Rahoituspalvelut Ltd. 79 524 EUR Floating 25.01.2020 656 471
XS0973934192 Rahoituspalvelut 2013 Ltd. 439 000 EUR Fixed 25.05.2021 2 679 143
XS0973934358 Rahoituspalvelut 2013 Ltd. 48 800 EUR Fixed 25.05.2021 402 844
n/a Rahoituspalvelut 2013 Ltd. 25 555 EUR Fixed 25.05.2021 210 957
Amortisation 0
Totals issued bonds 30 081 531

Santander Consumer Bank
2014 Interim Report First Quarter - unaudited
Repurchase
Repurchased own issued bonds 7 408 709
Total repurchased own securities 7 408 709
Total issued securities 22 672 822
Santander Consumer Bank AS:
Specification of issued securities
All amounts in thousands NOK
1Q 2014 1Q 2013 Full year 2013
Issued commercial papers 0 0
Issued bonds 1 655 000 4 481 873 850 000
Total liability issued securities 1 655 000 4 481 873 850 000
Changes in liability issued securities
All amounts in thousands NOK Book
value
31.12.13
New
issues/
repurchase Payments Amortisation
Book value
31.03.14
Issued commercial papers 0 0 0 0 0
Issued bonds 850 000 805 000
1 655 000
Total liability issued securities 249 854 805 000 0 0 1 655 000
Specification of issued securities
All amounts in thousands NOK
Bonds
ISIN number Issuer
Original
principal
value Currency Interest Call date Book value 31.03.14
n/a Santander Consumer Bank AS 400 000 NOK Floating 18.11.2015 700 000
n/a Santander Consumer Bank AS 450 000 NOK Floating 18.11.2016 955 000
Amortisation
Totals issued bonds 1 655 000
Repurchase
Repurchased own issued bonds 0
Total repurchased own securities 0
Total issued securities 1 655 000

Santander Consumer Bank
2014 Interim Report First Quarter - unaudited
15. Securitization Group:
The Group securitizes auto loans by selling portfolios of eligible auto loans to a SPV, which finances the purchase by issuing bonds in the market with security in the assets. All securitized assets are transferred to related parties, as all the SPV's buying the assets are consolidated into the group accounts. There are not transfers of securitized assets to unrelated parties. Santander Consumer Bank AS:
The company securitizes auto loan to customers by selling the loans to a special purpose company, which funds
the purchase by issuing bonds with security in the assets. The portfolio of auto loans consists of financing of
motor vehicles (including but not limited to cars, light commercial vehicles, motor homes, motorcycles) and the
related collateral. At 31.03.2013, Santander Consumer Bank AS has sold auto loan portfolio to eight different
SPV's.
According to IAS 39, no derecognition of these sold assets is done in the company, as the company retains
basically all the risk and reward of the transferred assets. The risk is retained through the company’s ownership in
the most subordinated tranche of the issued notes. Through the priority of payments, these notes take on all the
losses before the prioritized notes. The reward is retained as the company receives all cash that is left from the
month after all the note holder and service providers have been paid. This payment represents the net interest
income from customers, as the company would have owned the loans.
As the company continues to recognize the transferred assets on the balance sheet, a liability to transfer the
future cash flows from the customers arises. This liability is initially booked at the consideration received.
The table below shows the amount of un-derecognised securitized loans as of 31.03.2013 and the size of the
liability in relation to securitization:
All amounts in thousands of NOK 1Q 2014 1Q 2013 Full year 2013
Derecognized 0 0 0
Retained in the balance sheet 23 097 265 21 592 091 26 743 861
Related liabilities -22 281 547 -15 587 976 -23 743 993
Total liability issued securities 815 717 6 004 115 2 999 868

Santander Consumer Bank
2014 Interim Report First Quarter - unaudited
About Santander Consumer Bank Santander Consumer Bank AS is owned by Santander Consumer Finance, which is part of Grupo Santander, one of the world’s largest banks. Santander Consumer Finance is among the leaders in Europe within car- and consumer finance. The division is present in 14 countries across Europe and the USA. The Nordic region is considered a key growth area. Based on a business model that focuses on retail banking products and services for private customers, SMEs, and companies, the Santander Group currently serves more than 100 million customers through a global network of 14,400 branches, the largest in the international banking sector. It has 1.388 billion euros in managed funds in all customer segments, more than 3.3 million shareholders, and 187,000 employees. Santander Consumer Bank AS provides financing in the areas of car finance, credit cards and consumer loans. The bank is market leader in Norway within car finance, and has business in Sweden, Finland and Denmark and has a vision to be one of the leading players in the Nordic region. The bank has 650 employees throughout the region and total assets of NOK 82.6 billons.