First Quarter 2015 QUARTERLY MARKET UPDATE Quarter 2015 QUARTERLY MARKET UPDATE 1. MARKET SUMMARY 3....
59
First Quarter 2015 QUARTERLY MARKET UPDATE
Transcript of First Quarter 2015 QUARTERLY MARKET UPDATE Quarter 2015 QUARTERLY MARKET UPDATE 1. MARKET SUMMARY 3....

First Quarter 2015 QUARTERLY MARKET UPDATE
ECONOMY/MACRO BACKDROP 2.
Table of Contents
Firs
t Qua
rter 2
015
QU
ARTE
RLY
MAR
KET
UPD
ATE
MARKET SUMMARY 1.
THEME: IMPACT OF GLOBAL DISINFLATION 3.
U.S. EQUITY MARKETS 4.
INTERNATIONAL EQUITY MARKETS & GLOBAL ASSETS 5.
FIXED INCOME MARKETS 6.
ASSET ALLOCATION THEMES 7.
This report is a product of Fidelity’s Asset Allocation Research Team (AART) with contributions from throughout Fidelity’s asset management organization. AART conducts economic, fundamental, and quantitative research to develop asset allocation recommendations for Fidelity’s portfolio managers and investment teams. AART is responsible for analyzing and synthesizing investment perspectives across Fidelity’s asset management unit to generate insights on macroeconomic and financial market trends and their implications for asset allocation.
Lisa Emsbo-Mattingly Director of Asset Allocation Research
Dirk Hofschire, CFA SVP, Asset Allocation Research
PRIMARY CONTRIBUTORS
Austin Litvak Senior Analyst, Asset Allocation Research
Jake Weinstein, CFA Senior Analyst, Asset Allocation Research
Caitlin Dourney Analyst, Asset Allocation Research
Market Summary
Firs
t Qua
rter 2
015
QU
ARTE
RLY
MAR
KET
UPD
ATE
S
UM
MA
RY
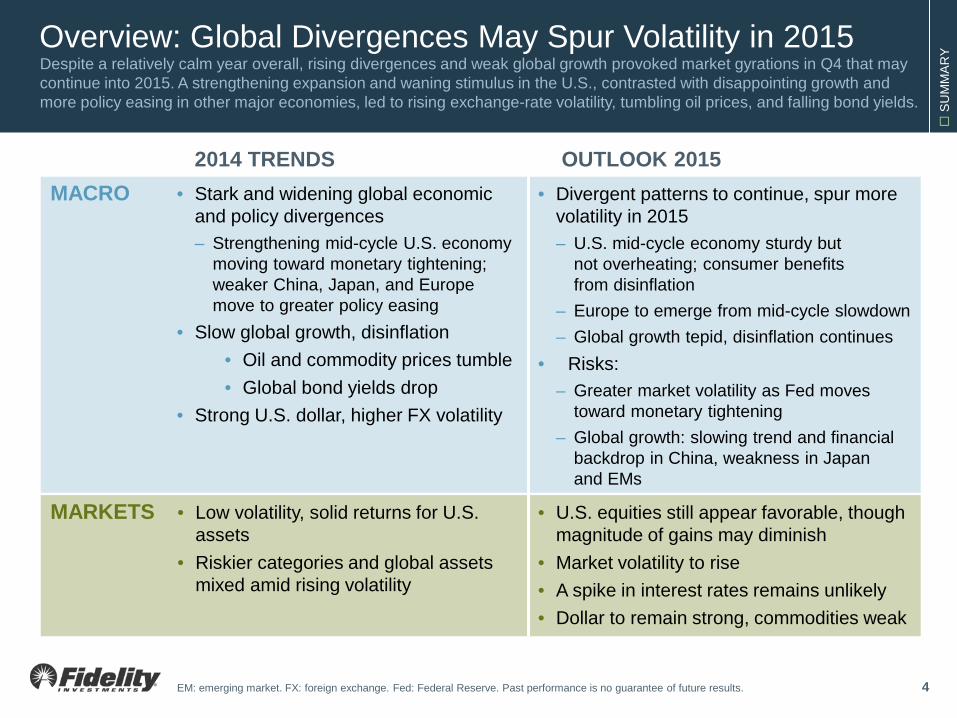
Overview: Global Divergences May Spur Volatility in 2015 Despite a relatively calm year overall, rising divergences and weak global growth provoked market gyrations in Q4 that may continue into 2015. A strengthening expansion and waning stimulus in the U.S., contrasted with disappointing growth and more policy easing in other major economies, led to rising exchange-rate volatility, tumbling oil prices, and falling bond yields.
EM: emerging market. FX: foreign exchange. Fed: Federal Reserve. Past performance is no guarantee of future results.
• Stark and widening global economic and policy divergences – Strengthening mid-cycle U.S. economy
moving toward monetary tightening; weaker China, Japan, and Europe move to greater policy easing
• Slow global growth, disinflation • Oil and commodity prices tumble • Global bond yields drop
• Strong U.S. dollar, higher FX volatility
• Divergent patterns to continue, spur more volatility in 2015 – U.S. mid-cycle economy sturdy but
not overheating; consumer benefits from disinflation
– Europe to emerge from mid-cycle slowdown – Global growth tepid, disinflation continues
• Risks: – Greater market volatility as Fed moves
toward monetary tightening – Global growth: slowing trend and financial
backdrop in China, weakness in Japan and EMs
2014 TRENDS OUTLOOK 2015 MACRO
MARKETS
4
• Low volatility, solid returns for U.S. assets
• Riskier categories and global assets mixed amid rising volatility
• U.S. equities still appear favorable, though magnitude of gains may diminish
• Market volatility to rise • A spike in interest rates remains unlikely • Dollar to remain strong, commodities weak
S
UM
MA
RY
-60
-40
-20
0
20
40
2008
2002
2000
2001
1990
2011
2007
1993
1992
2005
1986
1987
1994
2004
2014
2010
1988
1985
2006
2012
1991
1989
1998
1995
1996
1999
1997
2003
2009
2013
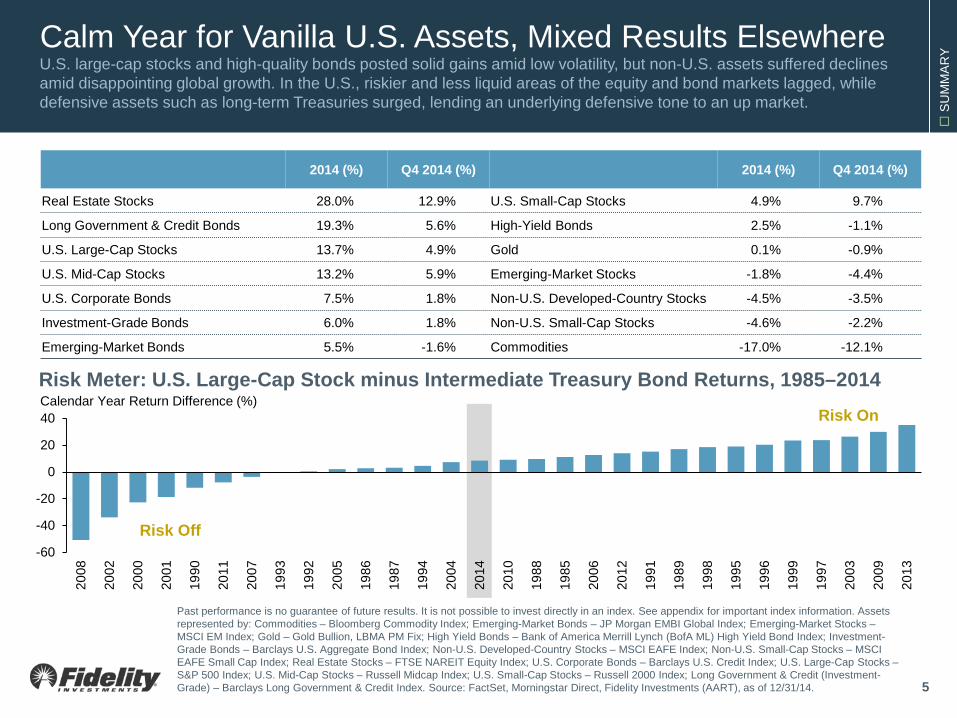
Calm Year for Vanilla U.S. Assets, Mixed Results Elsewhere U.S. large-cap stocks and high-quality bonds posted solid gains amid low volatility, but non-U.S. assets suffered declines amid disappointing global growth. In the U.S., riskier and less liquid areas of the equity and bond markets lagged, while defensive assets such as long-term Treasuries surged, lending an underlying defensive tone to an up market.
Past performance is no guarantee of future results. It is not possible to invest directly in an index. See appendix for important index information. Assets represented by: Commodities – Bloomberg Commodity Index; Emerging-Market Bonds – JP Morgan EMBI Global Index; Emerging-Market Stocks – MSCI EM Index; Gold – Gold Bullion, LBMA PM Fix; High Yield Bonds – Bank of America Merrill Lynch (BofA ML) High Yield Bond Index; Investment-Grade Bonds – Barclays U.S. Aggregate Bond Index; Non-U.S. Developed-Country Stocks – MSCI EAFE Index; Non-U.S. Small-Cap Stocks – MSCI EAFE Small Cap Index; Real Estate Stocks – FTSE NAREIT Equity Index; U.S. Corporate Bonds – Barclays U.S. Credit Index; U.S. Large-Cap Stocks – S&P 500 Index; U.S. Mid-Cap Stocks – Russell Midcap Index; U.S. Small-Cap Stocks – Russell 2000 Index; Long Government & Credit (Investment-Grade) – Barclays Long Government & Credit Index. Source: FactSet, Morningstar Direct, Fidelity Investments (AART), as of 12/31/14. 5
2014 (%) Q4 2014 (%) 2014 (%) Q4 2014 (%)
Real Estate Stocks 28.0% 12.9% U.S. Small-Cap Stocks 4.9% 9.7%
Long Government & Credit Bonds 19.3% 5.6% High-Yield Bonds 2.5% -1.1%
U.S. Large-Cap Stocks 13.7% 4.9% Gold 0.1% -0.9%
U.S. Mid-Cap Stocks 13.2% 5.9% Emerging-Market Stocks -1.8% -4.4%
U.S. Corporate Bonds 7.5% 1.8% Non-U.S. Developed-Country Stocks -4.5% -3.5%
Investment-Grade Bonds 6.0% 1.8% Non-U.S. Small-Cap Stocks -4.6% -2.2%
Emerging-Market Bonds 5.5% -1.6% Commodities -17.0% -12.1%
Risk Meter: U.S. Large-Cap Stock minus Intermediate Treasury Bond Returns, 1985–2014 Calendar Year Return Difference (%)
Risk On
Risk Off
S
UM
MA
RY
0%
10%
20%
30%
40%
50%
60%
<-10 -10-5 -5-0 0-5 5-10 10-15 15-20 20-25 25-30 >30
1-Year Return 5-Year Return 20-Year Return
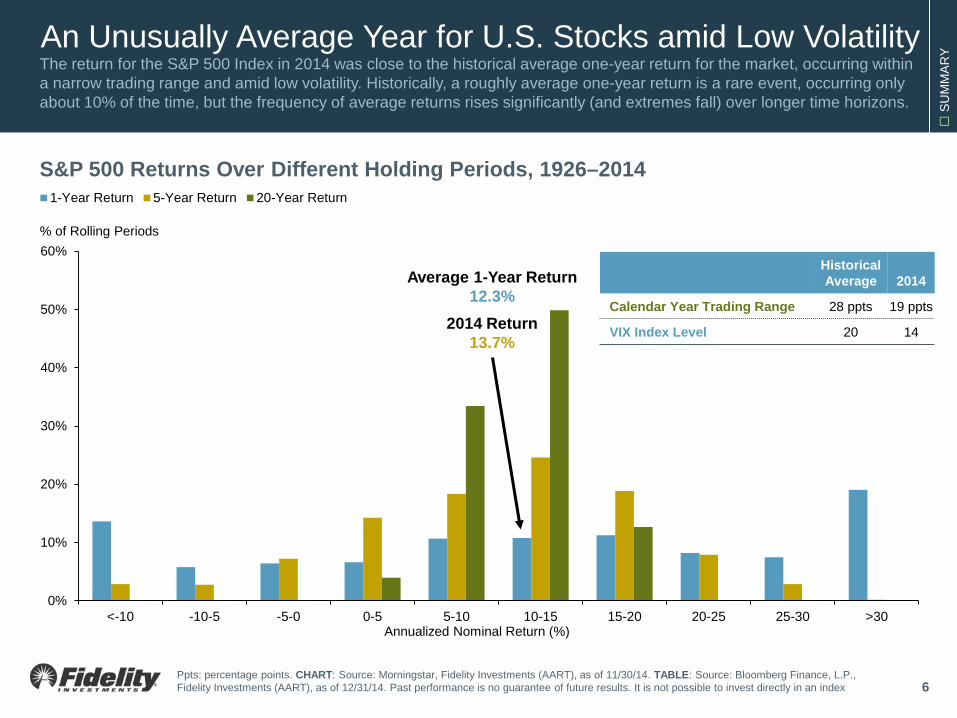
An Unusually Average Year for U.S. Stocks amid Low Volatility The return for the S&P 500 Index in 2014 was close to the historical average one-year return for the market, occurring within a narrow trading range and amid low volatility. Historically, a roughly average one-year return is a rare event, occurring only about 10% of the time, but the frequency of average returns rises significantly (and extremes fall) over longer time horizons.
6 Ppts: percentage points. CHART: Source: Morningstar, Fidelity Investments (AART), as of 11/30/14. TABLE: Source: Bloomberg Finance, L.P., Fidelity Investments (AART), as of 12/31/14. Past performance is no guarantee of future results. It is not possible to invest directly in an index
S&P 500 Returns Over Different Holding Periods, 1926–2014
Historical Average 2014
Calendar Year Trading Range 28 ppts 19 ppts
VIX Index Level 20 14
% of Rolling Periods
Average 1-Year Return 12.3%
2014 Return 13.7%
Annualized Nominal Return (%)
S
UM
MA
RY
-30
-25
-20
-15
-10
-5
0
Indo
nesi
an R
upia
h
Indi
an R
upee
Chi
nese
Ren
min
bi
Per
uvia
n N
ew S
ol
UK
Pou
nd
Turk
ish
Lira
Aus
tralia
n D
olla
r
Can
adia
n D
olla
r
Sou
th A
frica
n R
and
Sw
iss
Fran
c
Bra
zilia
n R
eal
Mex
ican
Pes
o
Eur
o
Japa
nese
Yen
Rus
sian
Rub
le
Ukr
aini
an H
ryvn
ia
2014 Q4 2014
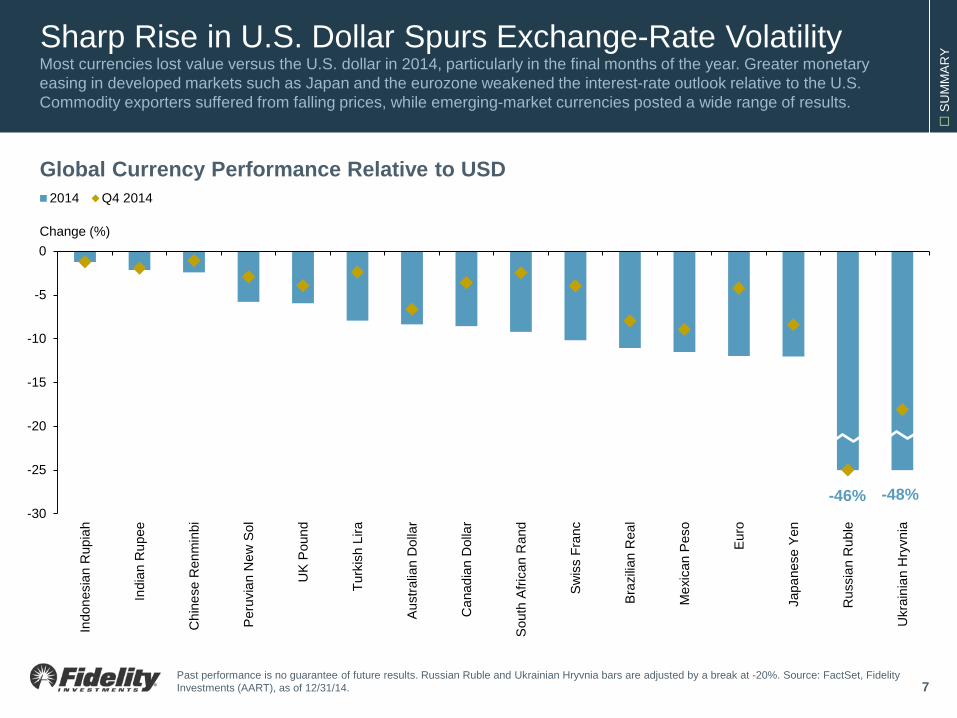
Sharp Rise in U.S. Dollar Spurs Exchange-Rate Volatility Most currencies lost value versus the U.S. dollar in 2014, particularly in the final months of the year. Greater monetary easing in developed markets such as Japan and the eurozone weakened the interest-rate outlook relative to the U.S. Commodity exporters suffered from falling prices, while emerging-market currencies posted a wide range of results.
7
-46%
Past performance is no guarantee of future results. Russian Ruble and Ukrainian Hryvnia bars are adjusted by a break at -20%. Source: FactSet, Fidelity Investments (AART), as of 12/31/14.
Global Currency Performance Relative to USD
-48%
Change (%)
S
UM
MA
RY
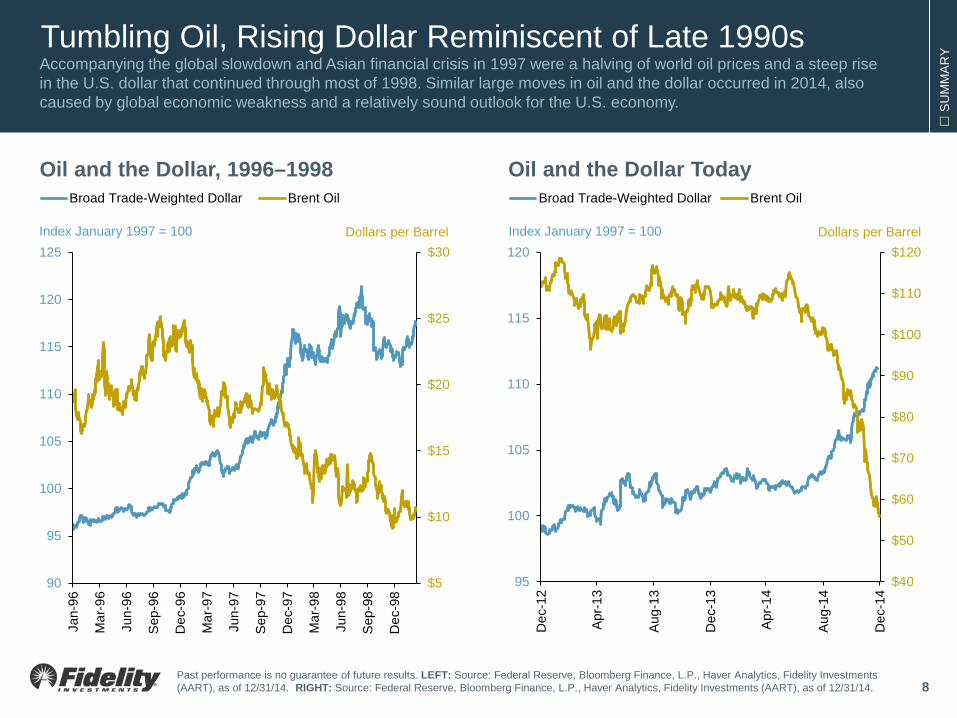
Tumbling Oil, Rising Dollar Reminiscent of Late 1990s Accompanying the global slowdown and Asian financial crisis in 1997 were a halving of world oil prices and a steep rise in the U.S. dollar that continued through most of 1998. Similar large moves in oil and the dollar occurred in 2014, also caused by global economic weakness and a relatively sound outlook for the U.S. economy.
8
$5
$10
$15
$20
$25
$30
90
95
100
105
110
115
120
125
Jan-
96
Mar
-96
Jun-
96
Sep
-96
Dec
-96
Mar
-97
Jun-
97
Sep
-97
Dec
-97
Mar
-98
Jun-
98
Sep
-98
Dec
-98
Broad Trade-Weighted Dollar Brent Oil
Past performance is no guarantee of future results. LEFT: Source: Federal Reserve, Bloomberg Finance, L.P., Haver Analytics, Fidelity Investments (AART), as of 12/31/14. RIGHT: Source: Federal Reserve, Bloomberg Finance, L.P., Haver Analytics, Fidelity Investments (AART), as of 12/31/14.
Oil and the Dollar Today Oil and the Dollar, 1996–1998
$40
$50
$60
$70
$80
$90
$100
$110
$120
95
100
105
110
115
120
Dec
-12
Apr
-13
Aug
-13
Dec
-13
Apr
-14
Aug
-14
Dec
-14
Broad Trade-Weighted Dollar Brent Oil
Index January 1997 = 100 Dollars per Barrel Index January 1997 = 100 Dollars per Barrel
S
UM
MA
RY
0
2
4
6
8
10
12
14
16
18
20
0.00
0.05
0.10
0.15
0.20
0.25
0.30
0.35
0.40
0.45
0.50
Dec
-91
Jun-
92D
ec-9
2Ju
n-93
Dec
-93
Jun-
94D
ec-9
4Ju
n-95
Dec
-95
Jun-
96D
ec-9
6Ju
n-97
Dec
-97
Jun-
98D
ec-9
8Ju
n-99
Dec
-99
Jun-
00D
ec-0
0Ju
n-01
Dec
-01
Jun-
02D
ec-0
2Ju
n-03
Dec
-03
Jun-
04D
ec-0
4Ju
n-05
Dec
-05
Jun-
06D
ec-0
6Ju
n-07
Dec
-07
Jun-
08D
ec-0
8Ju
n-09
Dec
-09
Jun-
10D
ec-1
0Ju
n-11
Dec
-11
Jun-
12D
ec-1
2Ju
n-13
Dec
-13
Jun-
14D
ec-1
4
Equity Correlations # Factors Explaining 50% of Return Variation
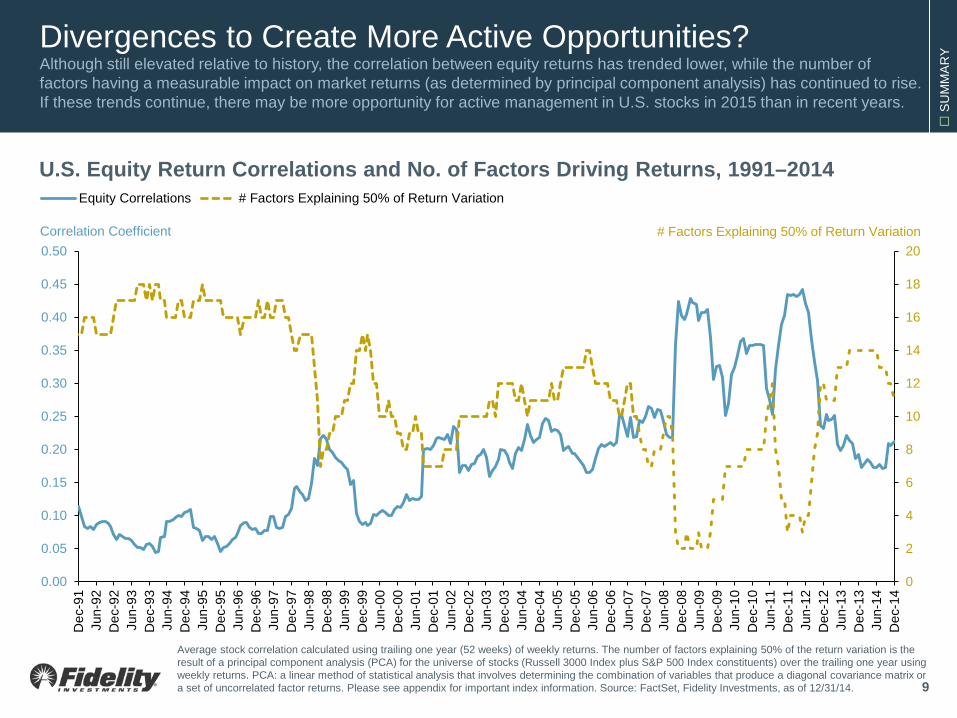
Divergences to Create More Active Opportunities? Although still elevated relative to history, the correlation between equity returns has trended lower, while the number of factors having a measurable impact on market returns (as determined by principal component analysis) has continued to rise. If these trends continue, there may be more opportunity for active management in U.S. stocks in 2015 than in recent years.
9
U.S. Equity Return Correlations and No. of Factors Driving Returns, 1991–2014
Average stock correlation calculated using trailing one year (52 weeks) of weekly returns. The number of factors explaining 50% of the return variation is the result of a principal component analysis (PCA) for the universe of stocks (Russell 3000 Index plus S&P 500 Index constituents) over the trailing one year using weekly returns. PCA: a linear method of statistical analysis that involves determining the combination of variables that produce a diagonal covariance matrix or a set of uncorrelated factor returns. Please see appendix for important index information. Source: FactSet, Fidelity Investments, as of 12/31/14.
# Factors Explaining 50% of Return Variation Correlation Coefficient
Firs
t Qua
rter 2
015
QU
ARTE
RLY
MAR
KET
UPD
ATE
Economy/Macro Backdrop
E
CO
NO
MY Global Business Cycle: Slow Growth, Major Divergences
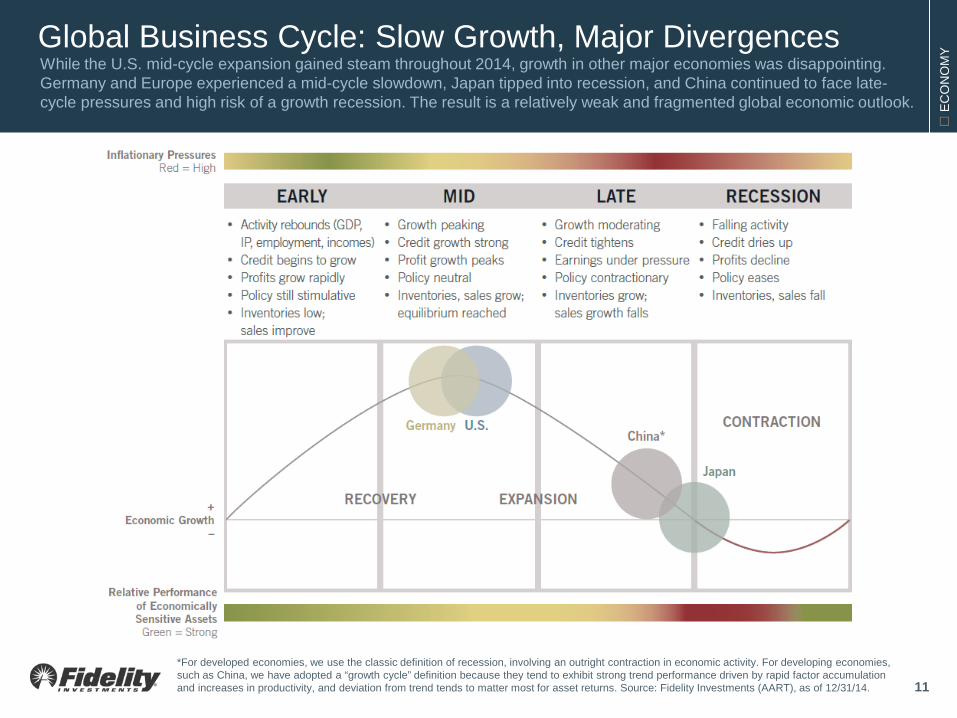
While the U.S. mid-cycle expansion gained steam throughout 2014, growth in other major economies was disappointing. Germany and Europe experienced a mid-cycle slowdown, Japan tipped into recession, and China continued to face late-cycle pressures and high risk of a growth recession. The result is a relatively weak and fragmented global economic outlook.
*For developed economies, we use the classic definition of recession, involving an outright contraction in economic activity. For developing economies, such as China, we have adopted a “growth cycle” definition because they tend to exhibit strong trend performance driven by rapid factor accumulation and increases in productivity, and deviation from trend tends to matter most for asset returns. Source: Fidelity Investments (AART), as of 12/31/14. 11
E
CO
NO
MY
Russia Brazil
S. Africa
India
U.K. U.S.
Canada
Australia
Mexico
S. Korea
China
Europe Japan
Q4 2014 Current
Divergences
Tightening
Neutral
Easing
Extraordinary Easing
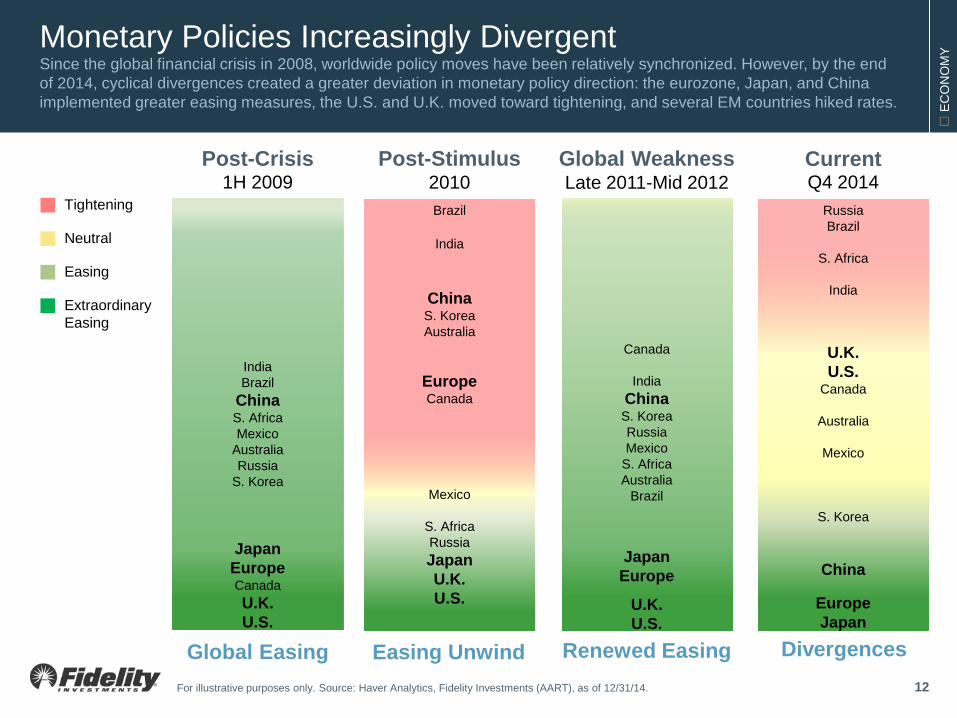
Monetary Policies Increasingly Divergent Since the global financial crisis in 2008, worldwide policy moves have been relatively synchronized. However, by the end of 2014, cyclical divergences created a greater deviation in monetary policy direction: the eurozone, Japan, and China implemented greater easing measures, the U.S. and U.K. moved toward tightening, and several EM countries hiked rates.
12
India Brazil
China S. Africa Mexico
Australia Russia
S. Korea
Japan Europe Canada U.K. U.S.
1H 2009 Post-Crisis
Global Easing
Canada
India
China S. Korea Russia Mexico
S. Africa Australia
Brazil
Japan Europe
U.K. U.S.
Late 2011-Mid 2012 Global Weakness
Renewed Easing
Brazil
India
China S. Korea Australia
Europe Canada
Mexico
S. Africa Russia Japan U.K. U.S.
2010 Post-Stimulus
Easing Unwind For illustrative purposes only. Source: Haver Analytics, Fidelity Investments (AART), as of 12/31/14.
E
CO
NO
MY Europe Likely to Emerge from Mid-Cycle Slowdown
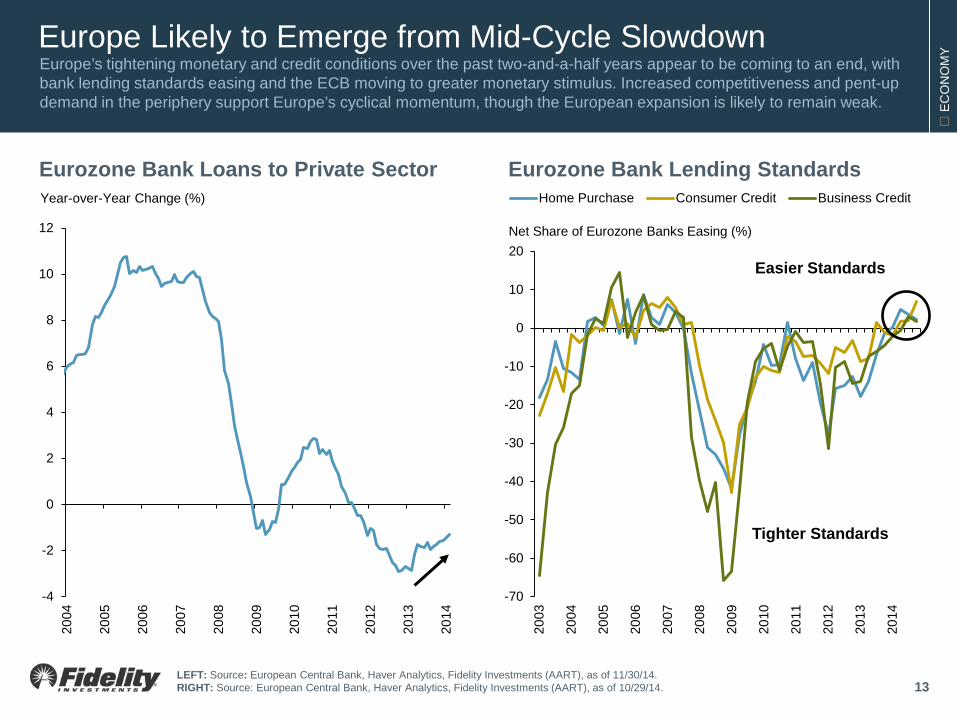
Europe’s tightening monetary and credit conditions over the past two-and-a-half years appear to be coming to an end, with bank lending standards easing and the ECB moving to greater monetary stimulus. Increased competitiveness and pent-up demand in the periphery support Europe’s cyclical momentum, though the European expansion is likely to remain weak.
13
Eurozone Bank Loans to Private Sector
LEFT: Source: European Central Bank, Haver Analytics, Fidelity Investments (AART), as of 11/30/14. RIGHT: Source: European Central Bank, Haver Analytics, Fidelity Investments (AART), as of 10/29/14.
-70
-60
-50
-40
-30
-20
-10
0
10
20
2003
2004
2005
2006
2007
2008
2009
2010
2011
2012
2013
2014
Home Purchase Consumer Credit Business Credit
Eurozone Bank Lending Standards
Net Share of Eurozone Banks Easing (%)
Year-over-Year Change (%)
Easier Standards
Tighter Standards
-4
-2
0
2
4
6
8
10
12
2004
2005
2006
2007
2008
2009
2010
2011
2012
2013
2014
E
CO
NO
MY
-15
-10
-5
0
5
10
15
20
-9
-6
-3
0
3
6
9
12
2004
2005
2006
2007
2008
2009
2010
2011
2012
2013
2014
Total Social Financing Producer Prices
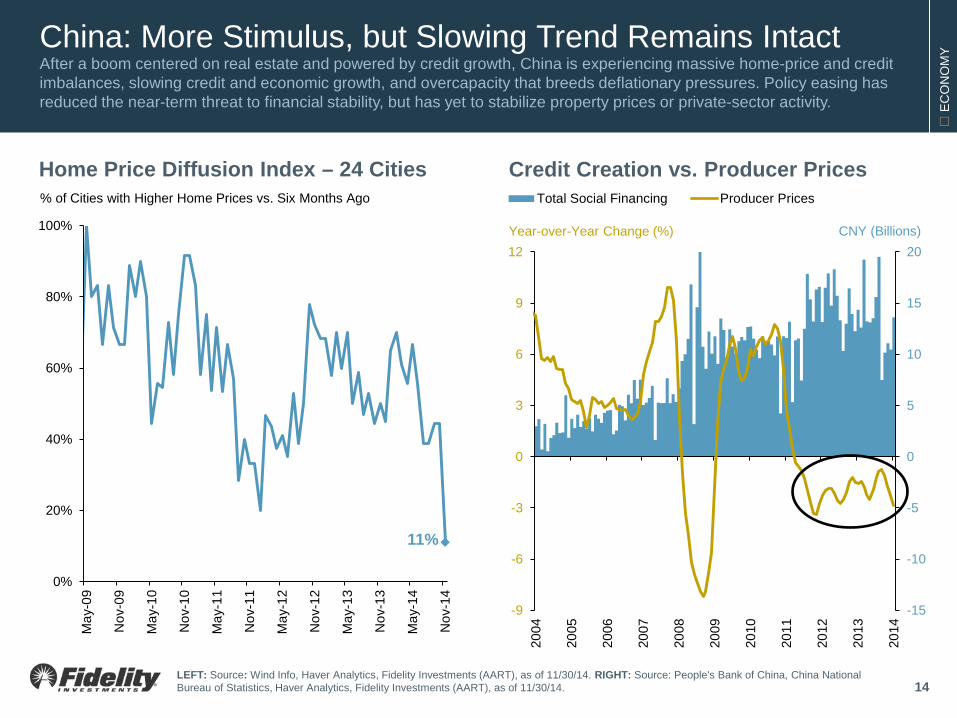
China: More Stimulus, but Slowing Trend Remains Intact After a boom centered on real estate and powered by credit growth, China is experiencing massive home-price and credit imbalances, slowing credit and economic growth, and overcapacity that breeds deflationary pressures. Policy easing has reduced the near-term threat to financial stability, but has yet to stabilize property prices or private-sector activity.
14
Credit Creation vs. Producer Prices Home Price Diffusion Index – 24 Cities
11%
0%
20%
40%
60%
80%
100%
May
-09
Nov
-09
May
-10
Nov
-10
May
-11
Nov
-11
May
-12
Nov
-12
May
-13
Nov
-13
May
-14
Nov
-14
% of Cities with Higher Home Prices vs. Six Months Ago
Year-over-Year Change (%) CNY (Billions)
LEFT: Source: Wind Info, Haver Analytics, Fidelity Investments (AART), as of 11/30/14. RIGHT: Source: People's Bank of China, China National Bureau of Statistics, Haver Analytics, Fidelity Investments (AART), as of 11/30/14.
E
CO
NO
MY Japan Counters Recession with Easing; Outlook Difficult
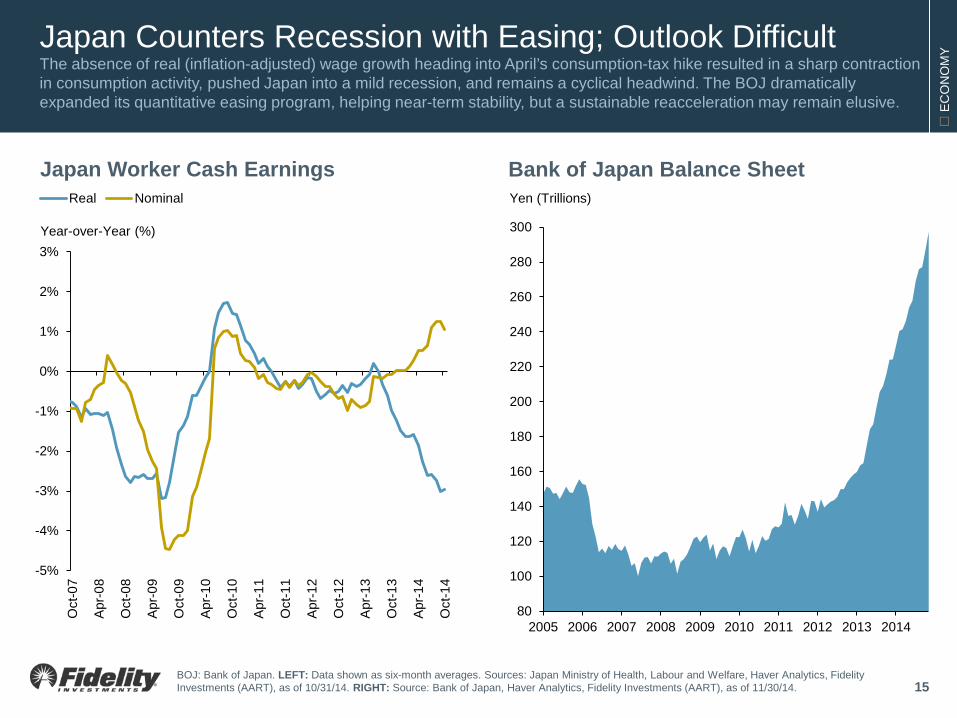
The absence of real (inflation-adjusted) wage growth heading into April’s consumption-tax hike resulted in a sharp contraction in consumption activity, pushed Japan into a mild recession, and remains a cyclical headwind. The BOJ dramatically expanded its quantitative easing program, helping near-term stability, but a sustainable reacceleration may remain elusive.
15
Japan Worker Cash Earnings
-5%
-4%
-3%
-2%
-1%
0%
1%
2%
3%
Oct
-07
Apr
-08
Oct
-08
Apr
-09
Oct
-09
Apr
-10
Oct
-10
Apr
-11
Oct
-11
Apr
-12
Oct
-12
Apr
-13
Oct
-13
Apr
-14
Oct
-14
Real Nominal
BOJ: Bank of Japan. LEFT: Data shown as six-month averages. Sources: Japan Ministry of Health, Labour and Welfare, Haver Analytics, Fidelity Investments (AART), as of 10/31/14. RIGHT: Source: Bank of Japan, Haver Analytics, Fidelity Investments (AART), as of 11/30/14.
Bank of Japan Balance Sheet
80
100
120
140
160
180
200
220
240
260
280
300
2005 2006 2007 2008 2009 2010 2011 2012 2013 2014
Year-over-Year (%)
Yen (Trillions)
E
CO
NO
MY
-30%
-20%
-10%
0%
10%
20%
30%
-30
-20
-10
0
10
20
30
Jan-
07Ju
n-07
Nov
-07
Apr
-08
Sep
-08
Feb-
09Ju
l-09
Dec
-09
May
-10
Oct
-10
Mar
-11
Aug
-11
Jan-
12Ju
n-12
Nov
-12
Apr
-13
Sep
-13
Feb-
14Ju
l-14
Dec
-14
Manufacturing BullwhipDurable Goods Shipments ex-Defense and Aircraft
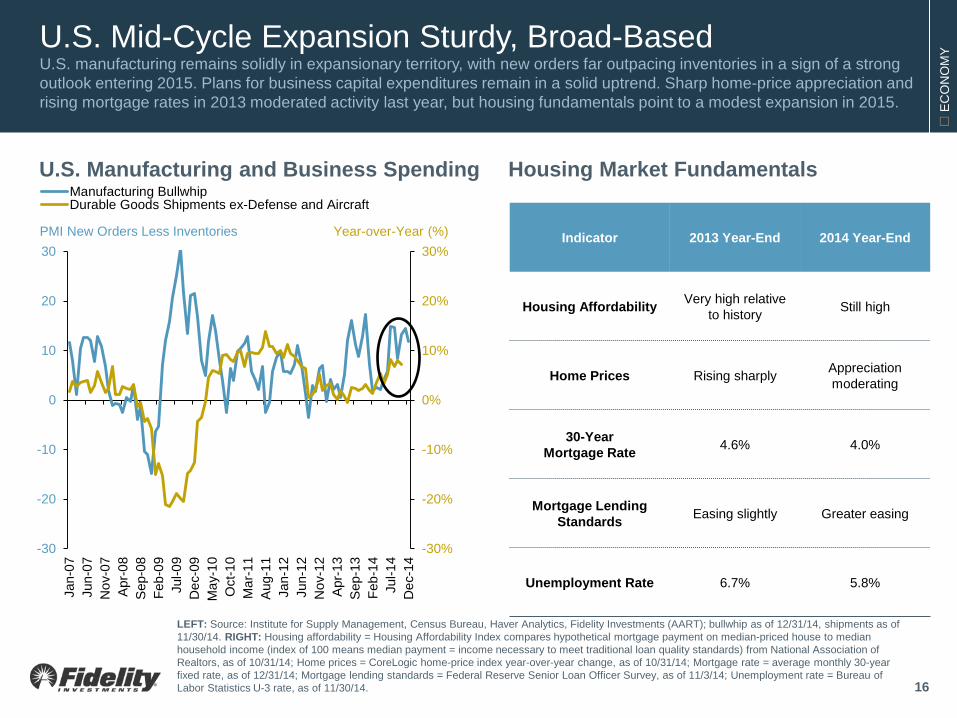
U.S. Mid-Cycle Expansion Sturdy, Broad-Based U.S. manufacturing remains solidly in expansionary territory, with new orders far outpacing inventories in a sign of a strong outlook entering 2015. Plans for business capital expenditures remain in a solid uptrend. Sharp home-price appreciation and rising mortgage rates in 2013 moderated activity last year, but housing fundamentals point to a modest expansion in 2015.
16
PMI New Orders Less Inventories Year-over-Year (%)
U.S. Manufacturing and Business Spending Housing Market Fundamentals
Indicator 2013 Year-End 2014 Year-End
Housing Affordability Very high relative to history Still high
Home Prices Rising sharply Appreciation moderating
30-Year Mortgage Rate 4.6% 4.0%
Mortgage Lending Standards Easing slightly Greater easing
Unemployment Rate 6.7% 5.8%
LEFT: Source: Institute for Supply Management, Census Bureau, Haver Analytics, Fidelity Investments (AART); bullwhip as of 12/31/14, shipments as of 11/30/14. RIGHT: Housing affordability = Housing Affordability Index compares hypothetical mortgage payment on median-priced house to median household income (index of 100 means median payment = income necessary to meet traditional loan quality standards) from National Association of Realtors, as of 10/31/14; Home prices = CoreLogic home-price index year-over-year change, as of 10/31/14; Mortgage rate = average monthly 30-year fixed rate, as of 12/31/14; Mortgage lending standards = Federal Reserve Senior Loan Officer Survey, as of 11/3/14; Unemployment rate = Bureau of Labor Statistics U-3 rate, as of 11/30/14.
E
CO
NO
MY
1.0
1.2
1.4
1.6
1.8
2.0
-8
-6
-4
-2
0
2
4
6
1981
1984
1987
1990
1993
1996
1999
2002
2005
2008
2011
2014
2017
Working Age Pop. GrowthProjectionPayroll Empt. Growth Less Pop. Growth
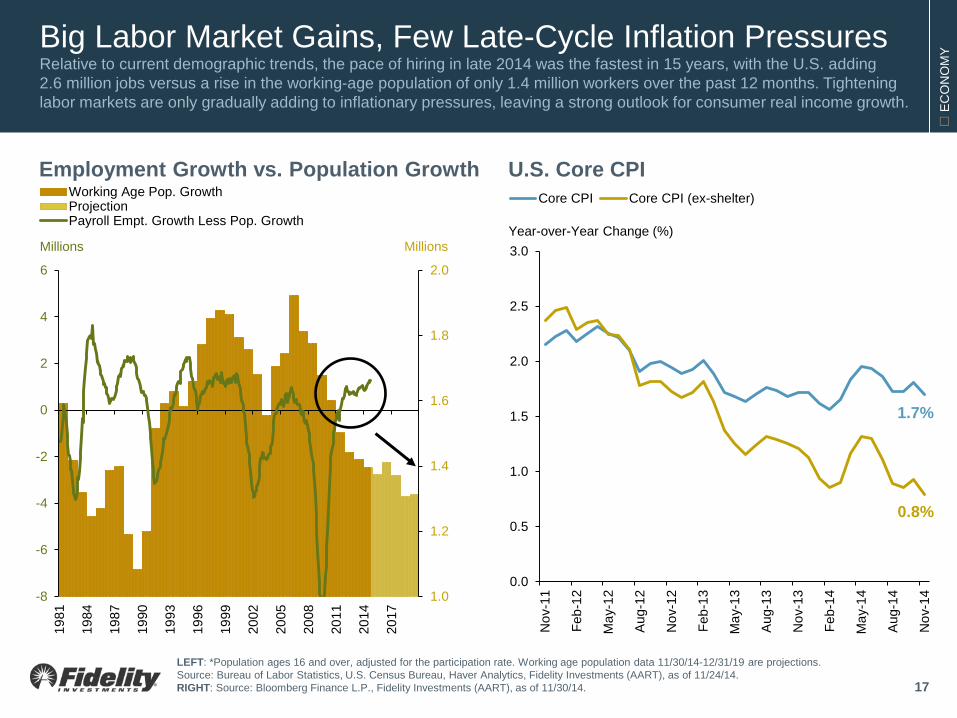
Big Labor Market Gains, Few Late-Cycle Inflation Pressures Relative to current demographic trends, the pace of hiring in late 2014 was the fastest in 15 years, with the U.S. adding 2.6 million jobs versus a rise in the working-age population of only 1.4 million workers over the past 12 months. Tightening labor markets are only gradually adding to inflationary pressures, leaving a strong outlook for consumer real income growth.
17
LEFT: *Population ages 16 and over, adjusted for the participation rate. Working age population data 11/30/14-12/31/19 are projections. Source: Bureau of Labor Statistics, U.S. Census Bureau, Haver Analytics, Fidelity Investments (AART), as of 11/24/14. RIGHT: Source: Bloomberg Finance L.P., Fidelity Investments (AART), as of 11/30/14.
Employment Growth vs. Population Growth
Millions Millions
1.7%
0.8%
0.0
0.5
1.0
1.5
2.0
2.5
3.0
Nov
-11
Feb-
12
May
-12
Aug
-12
Nov
-12
Feb-
13
May
-13
Aug
-13
Nov
-13
Feb-
14
May
-14
Aug
-14
Nov
-14
Core CPI Core CPI (ex-shelter)
Year-over-Year Change (%)
U.S. Core CPI
E
CO
NO
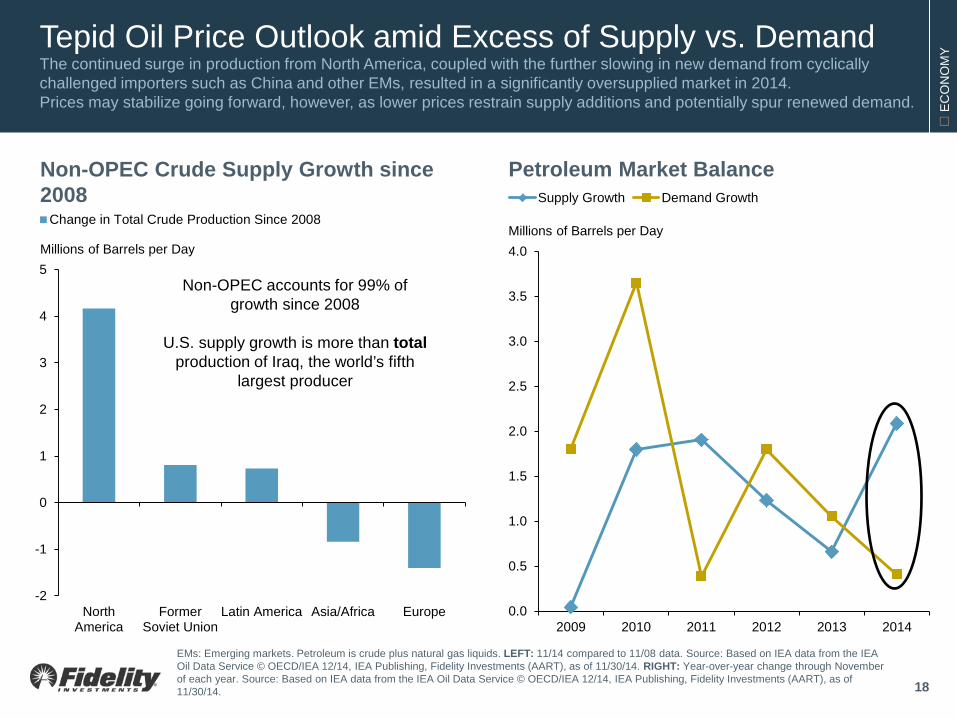
MY Tepid Oil Price Outlook amid Excess of Supply vs. Demand
The continued surge in production from North America, coupled with the further slowing in new demand from cyclically challenged importers such as China and other EMs, resulted in a significantly oversupplied market in 2014. Prices may stabilize going forward, however, as lower prices restrain supply additions and potentially spur renewed demand.
18
0.0
0.5
1.0
1.5
2.0
2.5
3.0
3.5
4.0
2009 2010 2011 2012 2013 2014
Supply Growth Demand Growth
EMs: Emerging markets. Petroleum is crude plus natural gas liquids. LEFT: 11/14 compared to 11/08 data. Source: Based on IEA data from the IEA Oil Data Service © OECD/IEA 12/14, IEA Publishing, Fidelity Investments (AART), as of 11/30/14. RIGHT: Year-over-year change through November of each year. Source: Based on IEA data from the IEA Oil Data Service © OECD/IEA 12/14, IEA Publishing, Fidelity Investments (AART), as of 11/30/14.
Petroleum Market Balance Non-OPEC Crude Supply Growth since 2008
-2
-1
0
1
2
3
4
5
NorthAmerica
FormerSoviet Union
Latin America Asia/Africa Europe
Change in Total Crude Production Since 2008
Non-OPEC accounts for 99% of growth since 2008
U.S. supply growth is more than total
production of Iraq, the world’s fifth largest producer
Millions of Barrels per Day Millions of Barrels per Day
E
CO
NO
MY
Nominal: not inflation-adjusted. Real: inflation-adjusted. LEFT: Real Treasury yield represented by the constant maturity 10-Year Treasury Inflation-Protected Security. Nominal yield represented by the constant maturity 10-Year Treasury bond. Expected inflation calculated as the difference between the nominal and real yields. Source: Bloomberg Finance L.P., Fidelity Investments (AART), as of 12/31/14. RIGHT: Source: Bloomberg Finance LP, Fidelity Investments (AART), as of 12/31/14.
-1
0
1
2
3
4
Dec
-11
Mar
-11
Jun-
11
Sep
-11
Dec
-11
Mar
-12
Jun-
12
Sep
-12
Dec
-12
Mar
-13
Jun-
13
Sep
-13
Dec
-13
Mar
-14
Jun-
14
Sep
-14
Dec
-14
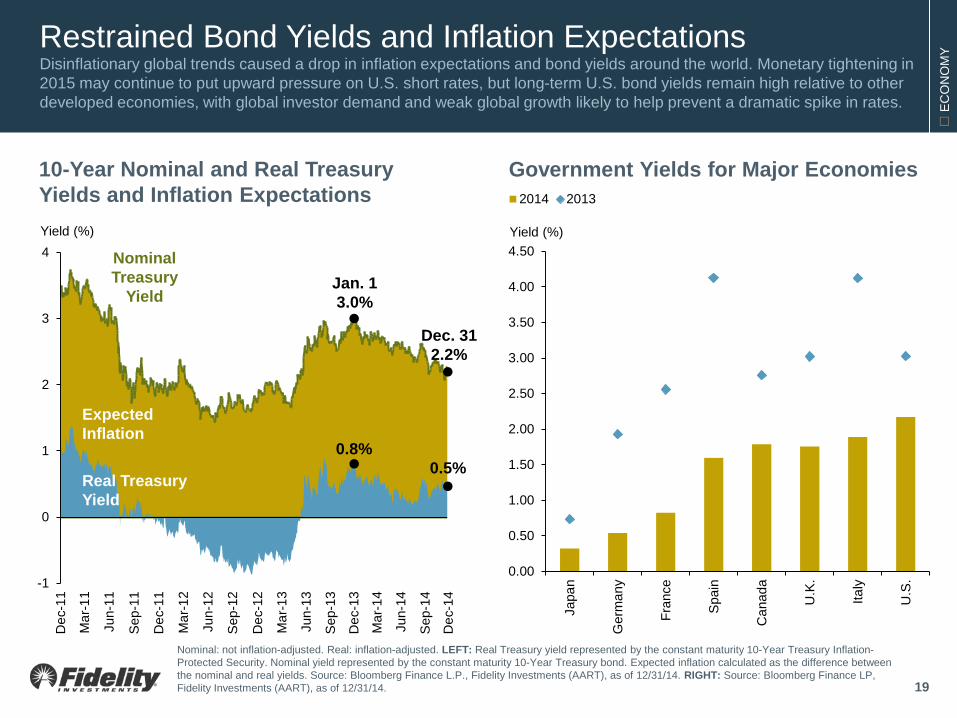
Restrained Bond Yields and Inflation Expectations Disinflationary global trends caused a drop in inflation expectations and bond yields around the world. Monetary tightening in 2015 may continue to put upward pressure on U.S. short rates, but long-term U.S. bond yields remain high relative to other developed economies, with global investor demand and weak global growth likely to help prevent a dramatic spike in rates.
19
Government Yields for Major Economies 10-Year Nominal and Real Treasury Yields and Inflation Expectations
Jan. 1 3.0%
0.8%
Yield (%)
Nominal Treasury
Yield
Real Treasury Yield
Expected Inflation
0.5%
Dec. 31 2.2%
0.00
0.50
1.00
1.50
2.00
2.50
3.00
3.50
4.00
4.50
Japa
n
Ger
man
y
Fran
ce
Spa
in
Can
ada
U.K
.
Italy
U.S
.
2014 2013
Yield (%)
E
CO
NO
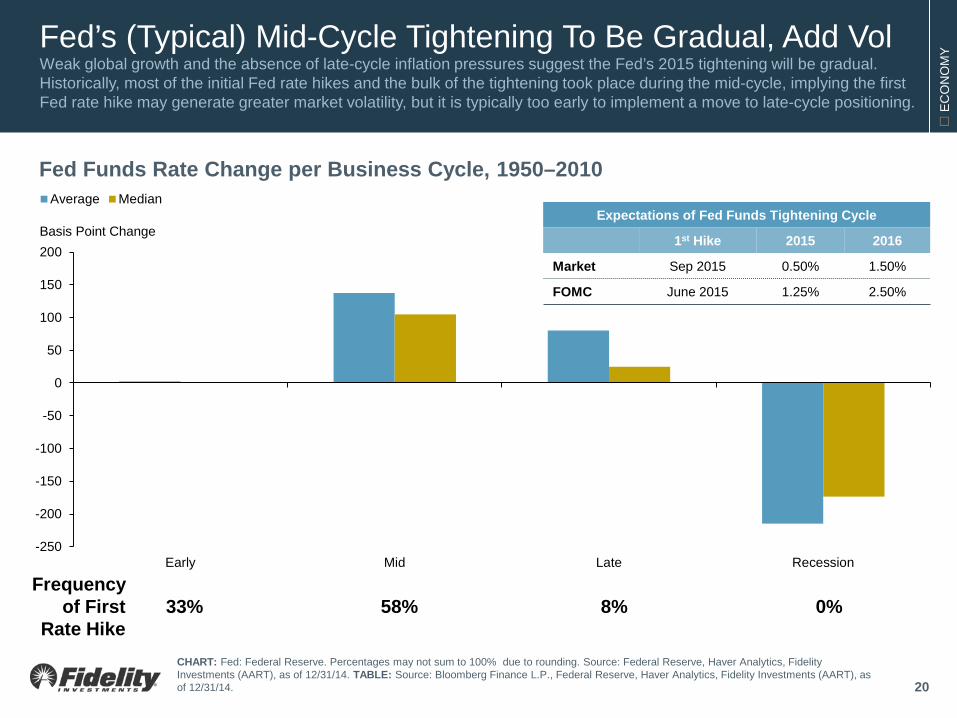
MY Fed’s (Typical) Mid-Cycle Tightening To Be Gradual, Add Vol
Weak global growth and the absence of late-cycle inflation pressures suggest the Fed’s 2015 tightening will be gradual. Historically, most of the initial Fed rate hikes and the bulk of the tightening took place during the mid-cycle, implying the first Fed rate hike may generate greater market volatility, but it is typically too early to implement a move to late-cycle positioning.
20
-250
-200
-150
-100
-50
0
50
100
150
200
Early Mid Late Recession
Average Median
Fed Funds Rate Change per Business Cycle, 1950–2010
Frequency of First
Rate Hike 33% 58% 8% 0%
CHART: Fed: Federal Reserve. Percentages may not sum to 100% due to rounding. Source: Federal Reserve, Haver Analytics, Fidelity Investments (AART), as of 12/31/14. TABLE: Source: Bloomberg Finance L.P., Federal Reserve, Haver Analytics, Fidelity Investments (AART), as of 12/31/14.
Basis Point Change Expectations of Fed Funds Tightening Cycle
1st Hike 2015 2016
Market Sep 2015 0.50% 1.50%
FOMC June 2015 1.25% 2.50%
E
CO
NO
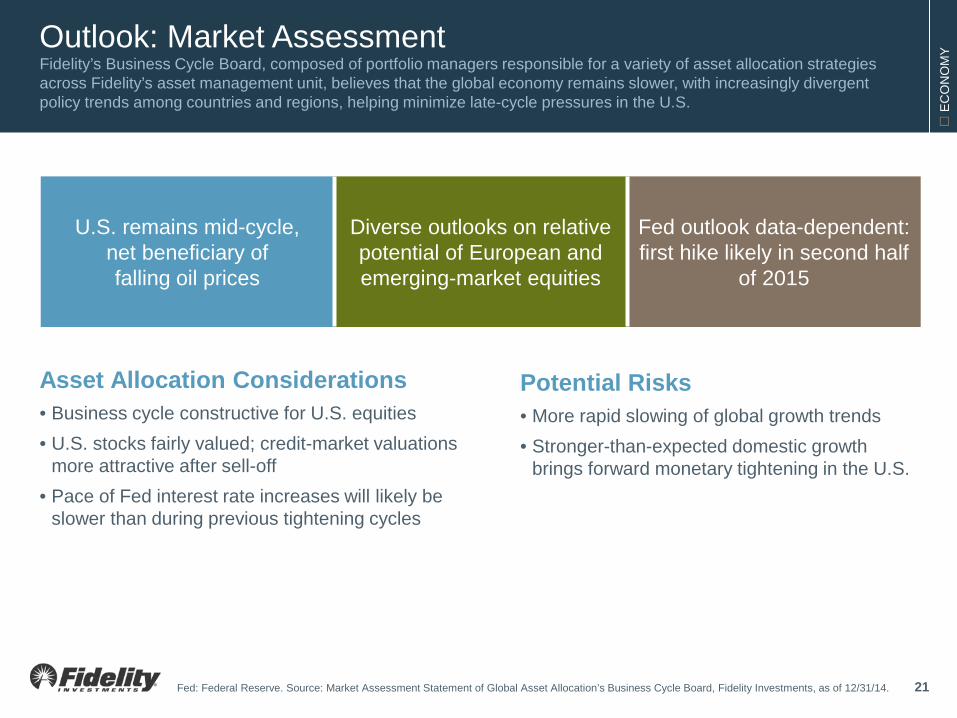
MY Outlook: Market Assessment
Fidelity’s Business Cycle Board, composed of portfolio managers responsible for a variety of asset allocation strategies across Fidelity’s asset management unit, believes that the global economy remains slower, with increasingly divergent policy trends among countries and regions, helping minimize late-cycle pressures in the U.S.
Potential Risks • More rapid slowing of global growth trends • Stronger-than-expected domestic growth
brings forward monetary tightening in the U.S.
Asset Allocation Considerations • Business cycle constructive for U.S. equities • U.S. stocks fairly valued; credit-market valuations
more attractive after sell-off • Pace of Fed interest rate increases will likely be
slower than during previous tightening cycles
U.S. remains mid-cycle, net beneficiary of falling oil prices
Diverse outlooks on relative potential of European and emerging-market equities
Fed outlook data-dependent: first hike likely in second half
of 2015
Fed: Federal Reserve. Source: Market Assessment Statement of Global Asset Allocation’s Business Cycle Board, Fidelity Investments, as of 12/31/14. 21
Firs
t Qua
rter 2
015
QU
ARTE
RLY
MAR
KET
UPD
ATE
Theme: Impact of Global Disinflation
T
HE
ME
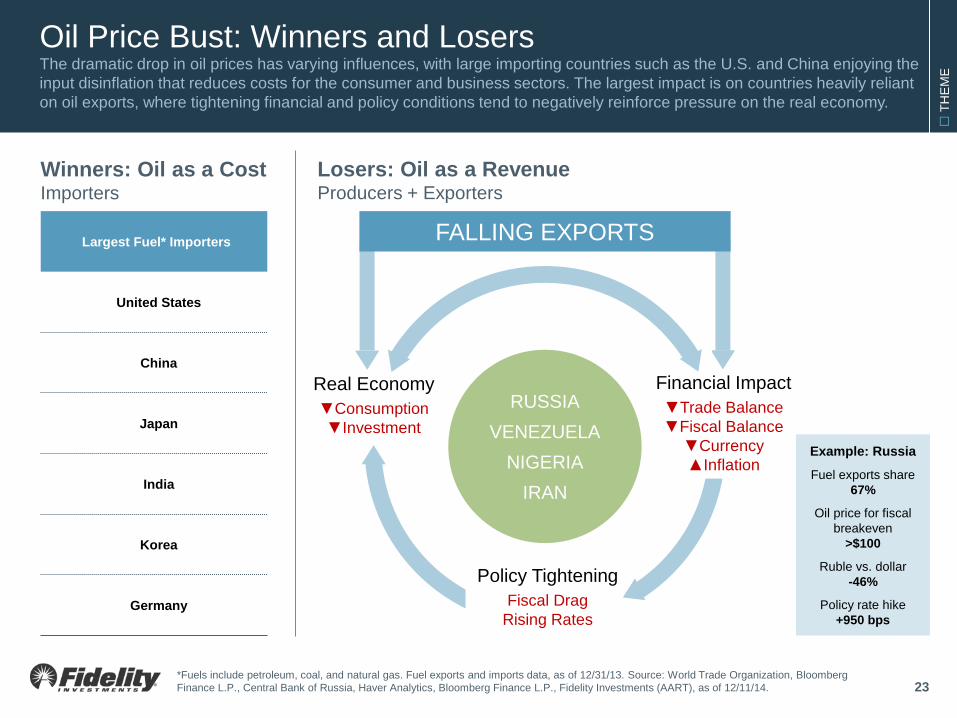
Oil Price Bust: Winners and Losers The dramatic drop in oil prices has varying influences, with large importing countries such as the U.S. and China enjoying the input disinflation that reduces costs for the consumer and business sectors. The largest impact is on countries heavily reliant on oil exports, where tightening financial and policy conditions tend to negatively reinforce pressure on the real economy.
23 *Fuels include petroleum, coal, and natural gas. Fuel exports and imports data, as of 12/31/13. Source: World Trade Organization, Bloomberg Finance L.P., Central Bank of Russia, Haver Analytics, Bloomberg Finance L.P., Fidelity Investments (AART), as of 12/11/14.
Real Economy ▼Consumption ▼Investment
RUSSIA VENEZUELA
NIGERIA IRAN
Financial Impact ▼Trade Balance ▼Fiscal Balance
▼Currency ▲Inflation
Policy Tightening Fiscal Drag
Rising Rates
FALLING EXPORTS
Losers: Oil as a Revenue Producers + Exporters
Winners: Oil as a Cost Importers
Largest Fuel* Importers
United States
China
Japan
India
Korea
Germany
Example: Russia
Fuel exports share 67%
Oil price for fiscal breakeven
>$100
Ruble vs. dollar -46%
Policy rate hike +950 bps
T
HE
ME
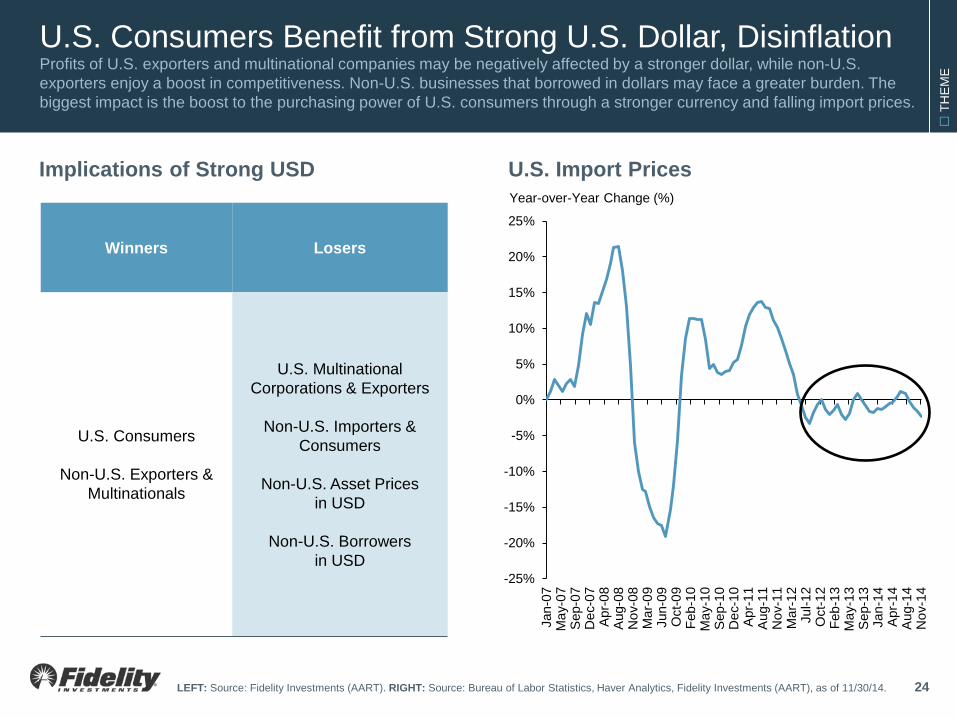
U.S. Consumers Benefit from Strong U.S. Dollar, Disinflation Profits of U.S. exporters and multinational companies may be negatively affected by a stronger dollar, while non-U.S. exporters enjoy a boost in competitiveness. Non-U.S. businesses that borrowed in dollars may face a greater burden. The biggest impact is the boost to the purchasing power of U.S. consumers through a stronger currency and falling import prices.
24 LEFT: Source: Fidelity Investments (AART). RIGHT: Source: Bureau of Labor Statistics, Haver Analytics, Fidelity Investments (AART), as of 11/30/14.
-25%
-20%
-15%
-10%
-5%
0%
5%
10%
15%
20%
25%
Jan-
07M
ay-0
7S
ep-0
7D
ec-0
7A
pr-0
8A
ug-0
8N
ov-0
8M
ar-0
9Ju
n-09
Oct
-09
Feb-
10M
ay-1
0S
ep-1
0D
ec-1
0A
pr-1
1A
ug-1
1N
ov-1
1M
ar-1
2Ju
l-12
Oct
-12
Feb-
13M
ay-1
3S
ep-1
3Ja
n-14
Apr
-14
Aug
-14
Nov
-14
Winners Losers
U.S. Consumers
Non-U.S. Exporters & Multinationals
U.S. Multinational Corporations & Exporters
Non-U.S. Importers &
Consumers
Non-U.S. Asset Prices in USD
Non-U.S. Borrowers
in USD
Year-over-Year Change (%)
U.S. Import Prices Implications of Strong USD
T
HE
ME
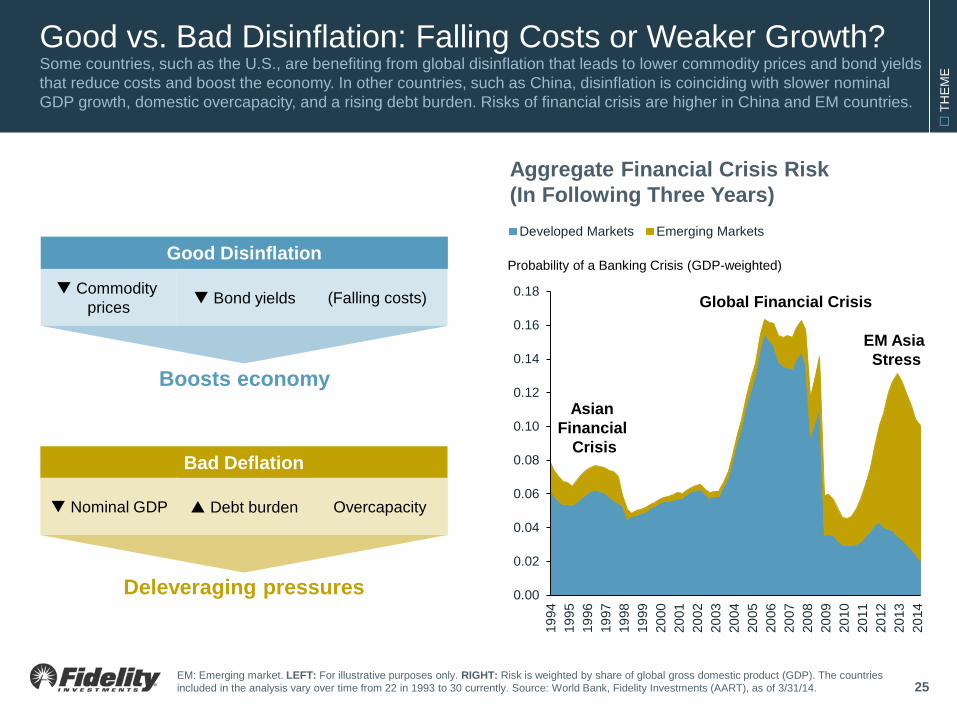
Good vs. Bad Disinflation: Falling Costs or Weaker Growth? Some countries, such as the U.S., are benefiting from global disinflation that leads to lower commodity prices and bond yields that reduce costs and boost the economy. In other countries, such as China, disinflation is coinciding with slower nominal GDP growth, domestic overcapacity, and a rising debt burden. Risks of financial crisis are higher in China and EM countries.
25 EM: Emerging market. LEFT: For illustrative purposes only. RIGHT: Risk is weighted by share of global gross domestic product (GDP). The countries included in the analysis vary over time from 22 in 1993 to 30 currently. Source: World Bank, Fidelity Investments (AART), as of 3/31/14.
Aggregate Financial Crisis Risk (In Following Three Years)
0.00
0.02
0.04
0.06
0.08
0.10
0.12
0.14
0.16
0.18
1994
1995
1996
1997
1998
1999
2000
2001
2002
2003
2004
2005
2006
2007
2008
2009
2010
2011
2012
2013
2014
Developed Markets Emerging Markets
Probability of a Banking Crisis (GDP-weighted)
Asian Financial
Crisis
Global Financial Crisis
EM Asia Stress
Commodity prices
Boosts economy
(Falling costs) Bond yields
Good Disinflation
Bad Deflation
Nominal GDP
Deleveraging pressures
Overcapacity Debt burden
T
HE
ME
Brazil China
Euro Area
India
Indonesia
Japan
S. Korea
Malaysia
Mexico Poland
Russia
South Africa
Thailand Turkey
U.K. U.S.
-16%
-12%
-8%
-4%
0%
4%
-25% -20% -15% -10% -5% 0% 5% 10% 15% 20% 25% 30% 35% 40% 45%
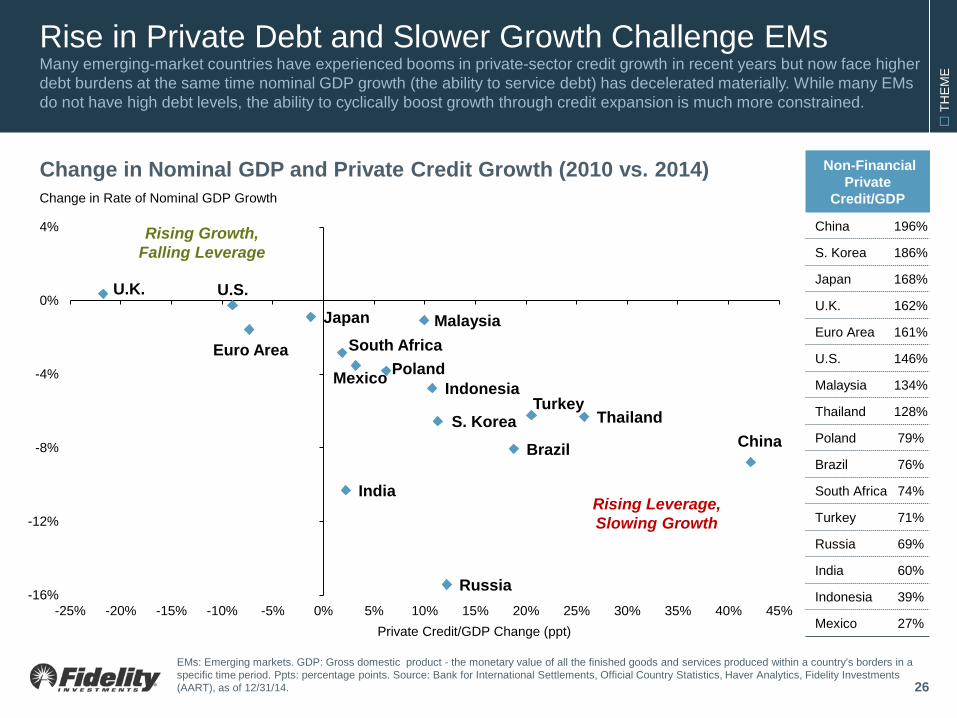
Rise in Private Debt and Slower Growth Challenge EMs Many emerging-market countries have experienced booms in private-sector credit growth in recent years but now face higher debt burdens at the same time nominal GDP growth (the ability to service debt) has decelerated materially. While many EMs do not have high debt levels, the ability to cyclically boost growth through credit expansion is much more constrained.
26
Change in Nominal GDP and Private Credit Growth (2010 vs. 2014) Non-Financial Private
Credit/GDP
China 196%
S. Korea 186%
Japan 168%
U.K. 162%
Euro Area 161%
U.S. 146%
Malaysia 134%
Thailand 128%
Poland 79%
Brazil 76%
South Africa 74%
Turkey 71%
Russia 69%
India 60%
Indonesia 39%
Mexico 27%
Rising Leverage, Slowing Growth
Rising Growth, Falling Leverage
EMs: Emerging markets. GDP: Gross domestic product - the monetary value of all the finished goods and services produced within a country's borders in a specific time period. Ppts: percentage points. Source: Bank for International Settlements, Official Country Statistics, Haver Analytics, Fidelity Investments (AART), as of 12/31/14.
Change in Rate of Nominal GDP Growth
Private Credit/GDP Change (ppt)
T
HE
ME
France
France
Germany
Germany Italy
Italy
Japan
Japan Spain Spain
U.K.
U.K. U.S.
U.S.
Ireland
Ireland
Portugal Portugal
-3
-2
-1
0
1
2
3
4
5
6
0 1 2 3 4 5 6
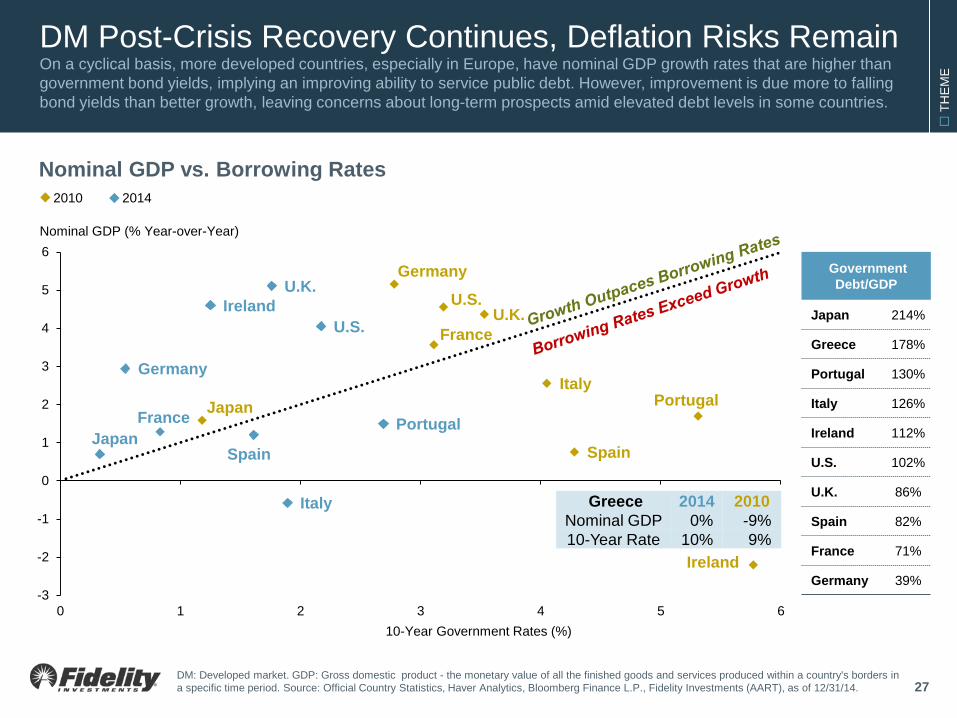
DM Post-Crisis Recovery Continues, Deflation Risks Remain On a cyclical basis, more developed countries, especially in Europe, have nominal GDP growth rates that are higher than government bond yields, implying an improving ability to service public debt. However, improvement is due more to falling bond yields than better growth, leaving concerns about long-term prospects amid elevated debt levels in some countries.
27
Nominal GDP vs. Borrowing Rates
DM: Developed market. GDP: Gross domestic product - the monetary value of all the finished goods and services produced within a country's borders in a specific time period. Source: Official Country Statistics, Haver Analytics, Bloomberg Finance L.P., Fidelity Investments (AART), as of 12/31/14.
2010 2014
Nominal GDP (% Year-over-Year)
10-Year Government Rates (%)
Government Debt/GDP
Japan 214%
Greece 178%
Portugal 130%
Italy 126%
Ireland 112%
U.S. 102%
U.K. 86%
Spain 82%
France 71%
Germany 39%
Greece 2014 2010 Nominal GDP 0% -9% 10-Year Rate 10% 9%
Firs
t Qua
rter 2
015
QU
ARTE
RLY
MAR
KET
UPD
ATE
U.S. Equity Markets
U
.S. E
QU
ITY Broad-Based Gains across Equities, Small Caps Lag
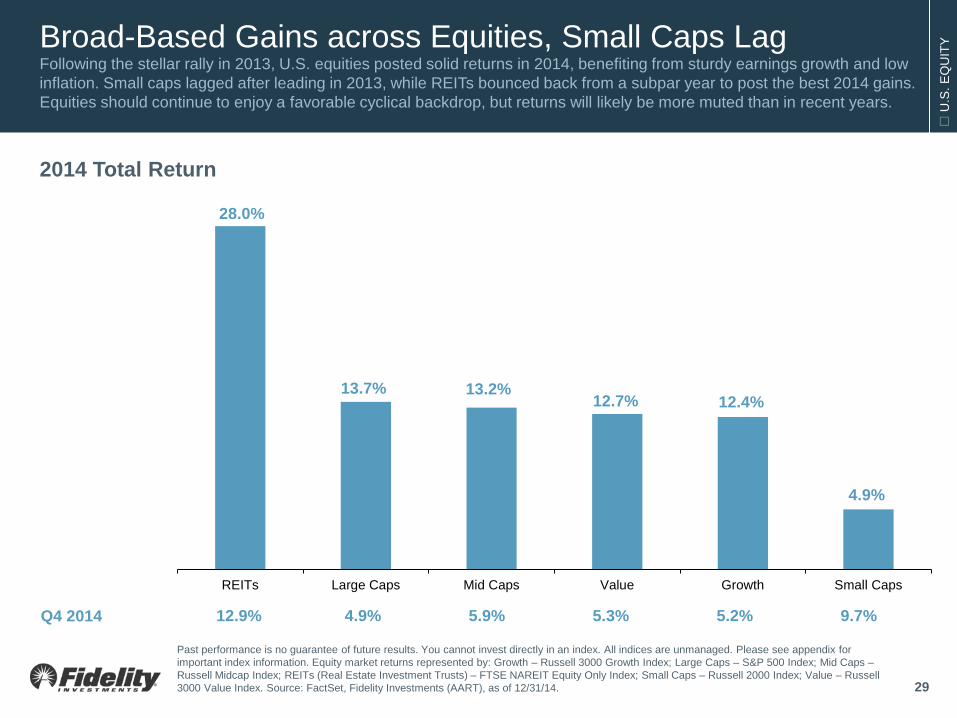
Following the stellar rally in 2013, U.S. equities posted solid returns in 2014, benefiting from sturdy earnings growth and low inflation. Small caps lagged after leading in 2013, while REITs bounced back from a subpar year to post the best 2014 gains. Equities should continue to enjoy a favorable cyclical backdrop, but returns will likely be more muted than in recent years.
2014 Total Return
Q4 2014 12.9% 4.9% 5.9% 5.3% 5.2% 9.7%
28.0%
13.7% 13.2% 12.7% 12.4%
4.9%
REITs Large Caps Mid Caps Value Growth Small Caps
Past performance is no guarantee of future results. You cannot invest directly in an index. All indices are unmanaged. Please see appendix for important index information. Equity market returns represented by: Growth – Russell 3000 Growth Index; Large Caps – S&P 500 Index; Mid Caps – Russell Midcap Index; REITs (Real Estate Investment Trusts) – FTSE NAREIT Equity Only Index; Small Caps – Russell 2000 Index; Value – Russell 3000 Value Index. Source: FactSet, Fidelity Investments (AART), as of 12/31/14. 29
U
.S. E
QU
ITY
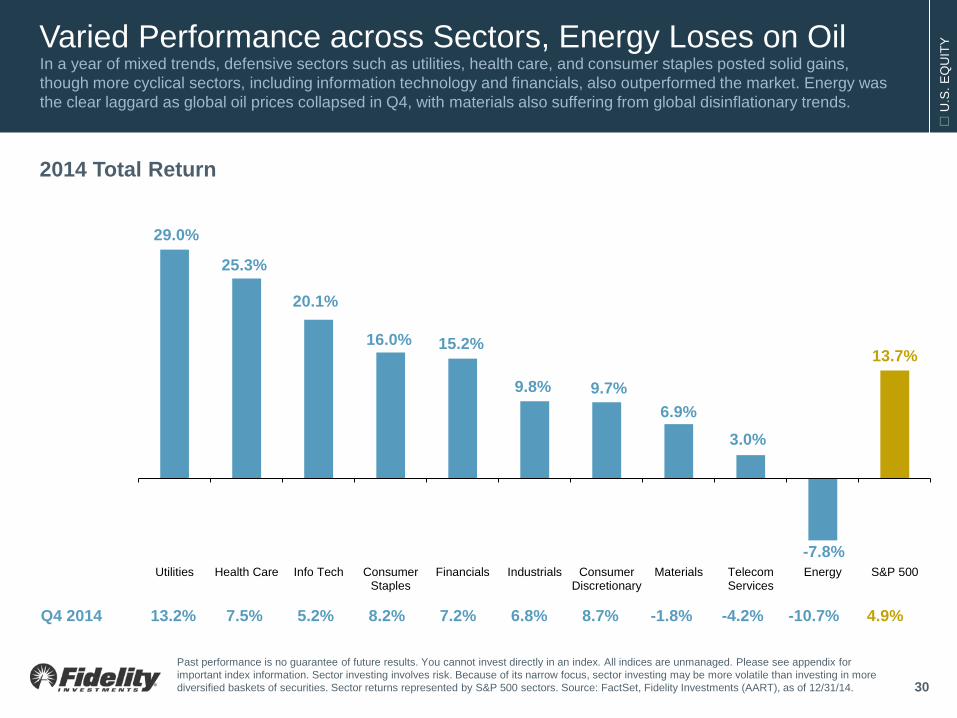
Q4 2014 13.2% 7.5% 5.2% 8.2% 7.2% 6.8% 8.7% -1.8% -4.2% -10.7% 4.9%
Varied Performance across Sectors, Energy Loses on Oil In a year of mixed trends, defensive sectors such as utilities, health care, and consumer staples posted solid gains, though more cyclical sectors, including information technology and financials, also outperformed the market. Energy was the clear laggard as global oil prices collapsed in Q4, with materials also suffering from global disinflationary trends.
2014 Total Return
29.0%
25.3%
20.1%
16.0% 15.2%
9.8% 9.7% 6.9%
3.0%
-7.8%
13.7%
Utilities Health Care Info Tech ConsumerStaples
Financials Industrials ConsumerDiscretionary
Materials TelecomServices
Energy S&P 500
Past performance is no guarantee of future results. You cannot invest directly in an index. All indices are unmanaged. Please see appendix for important index information. Sector investing involves risk. Because of its narrow focus, sector investing may be more volatile than investing in more diversified baskets of securities. Sector returns represented by S&P 500 sectors. Source: FactSet, Fidelity Investments (AART), as of 12/31/14. 30
U
.S. E
QU
ITY
8%
12%
-10%
-5%
0%
5%
10%
15%
20%
25%
2011
-Q1
2011
-Q2
2011
-Q3
2011
-Q4
2012
-Q1
2012
-Q2
2012
-Q3
2012
-Q4
2013
-Q1
2013
-Q2
2013
-Q3
2013
-Q4
2014
-Q1
2014
-Q2
2014
-Q3
2014
-Q4E
2015
E
Share Count Margin Revenue
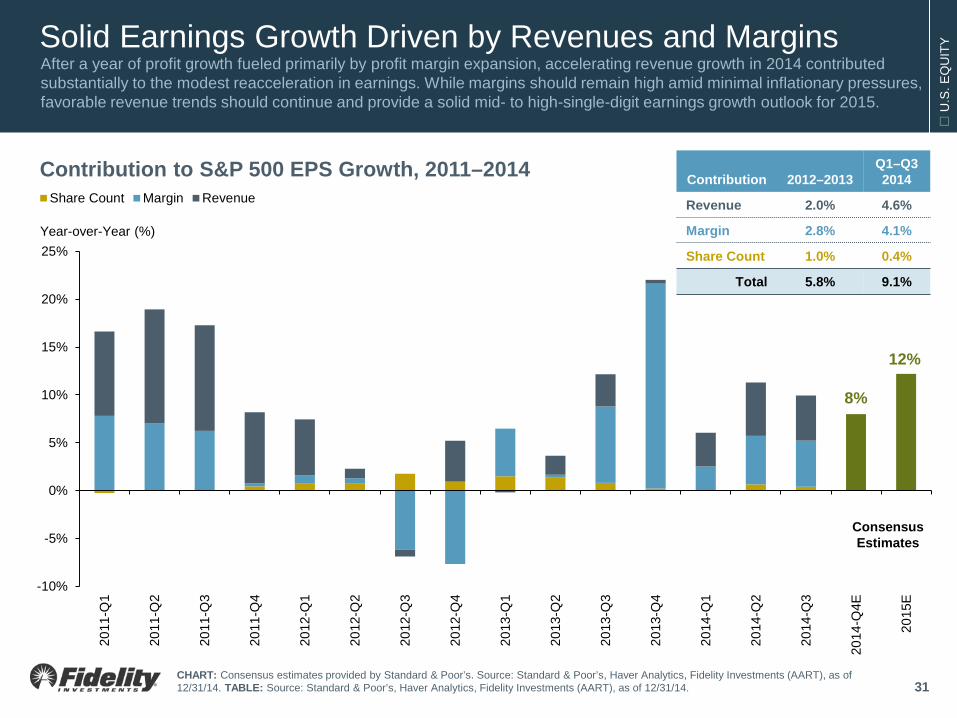
Solid Earnings Growth Driven by Revenues and Margins After a year of profit growth fueled primarily by profit margin expansion, accelerating revenue growth in 2014 contributed substantially to the modest reacceleration in earnings. While margins should remain high amid minimal inflationary pressures, favorable revenue trends should continue and provide a solid mid- to high-single-digit earnings growth outlook for 2015.
31 CHART: Consensus estimates provided by Standard & Poor’s. Source: Standard & Poor’s, Haver Analytics, Fidelity Investments (AART), as of 12/31/14. TABLE: Source: Standard & Poor’s, Haver Analytics, Fidelity Investments (AART), as of 12/31/14.
Contribution to S&P 500 EPS Growth, 2011–2014
Year-over-Year (%)
Contribution 2012–2013 Q1–Q3 2014
Revenue 2.0% 4.6%
Margin 2.8% 4.1%
Share Count 1.0% 0.4%
Total 5.8% 9.1%
Consensus Estimates
U
.S. E
QU
ITY
10x
12x
14x
16x
18x
20x
22x
24x
26x
28x
30x
1994
1996
1998
2000
2002
2004
2006
2008
2010
2012
2014
Price-to-Earnings (P/E) Average P/E since 1926
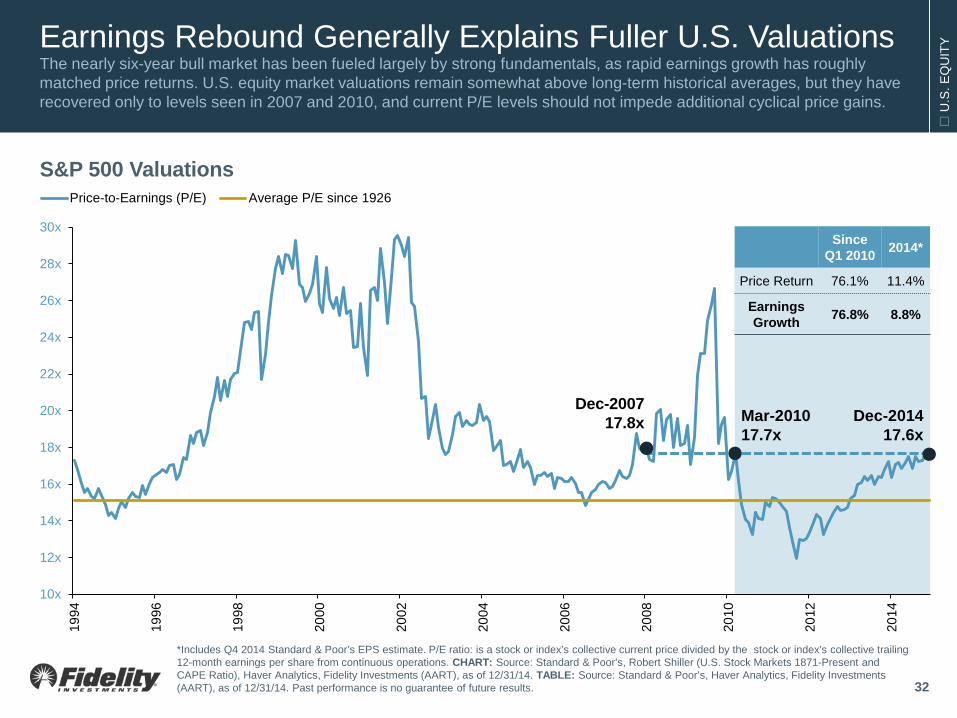
Earnings Rebound Generally Explains Fuller U.S. Valuations The nearly six-year bull market has been fueled largely by strong fundamentals, as rapid earnings growth has roughly matched price returns. U.S. equity market valuations remain somewhat above long-term historical averages, but they have recovered only to levels seen in 2007 and 2010, and current P/E levels should not impede additional cyclical price gains.
32
*Includes Q4 2014 Standard & Poor’s EPS estimate. P/E ratio: is a stock or index’s collective current price divided by the stock or index’s collective trailing 12-month earnings per share from continuous operations. CHART: Source: Standard & Poor’s, Robert Shiller (U.S. Stock Markets 1871-Present and CAPE Ratio), Haver Analytics, Fidelity Investments (AART), as of 12/31/14. TABLE: Source: Standard & Poor’s, Haver Analytics, Fidelity Investments (AART), as of 12/31/14. Past performance is no guarantee of future results.
S&P 500 Valuations
Since Q1 2010 2014*
Price Return 76.1% 11.4%
Earnings Growth 76.8% 8.8%
Dec-2007 17.8x Mar-2010
17.7x Dec-2014
17.6x
U
.S. E
QU
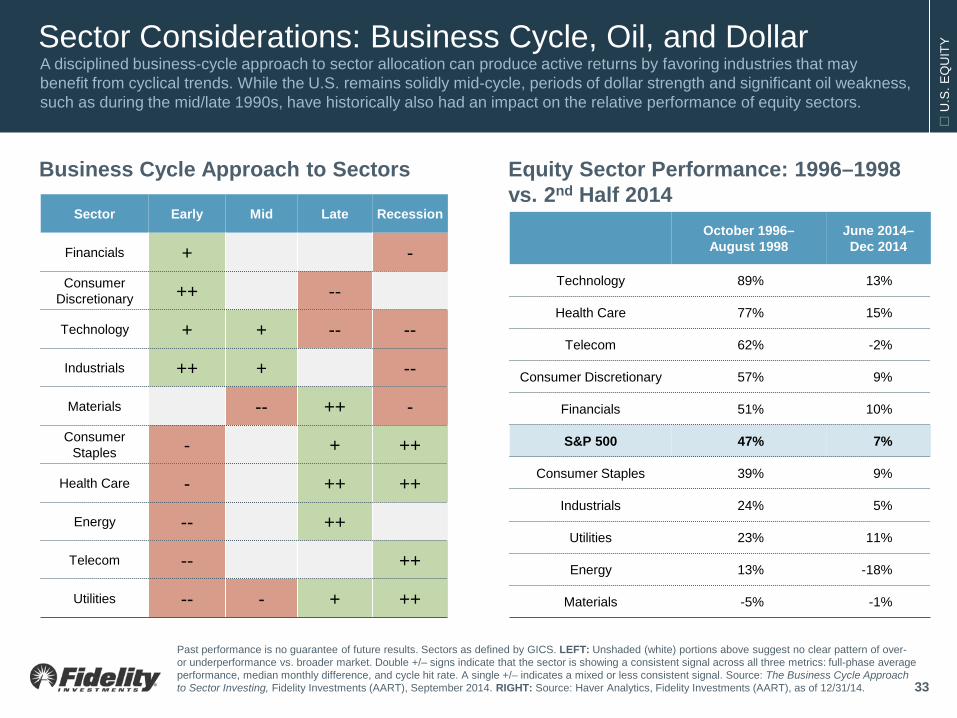
ITY Sector Considerations: Business Cycle, Oil, and Dollar
A disciplined business-cycle approach to sector allocation can produce active returns by favoring industries that may benefit from cyclical trends. While the U.S. remains solidly mid-cycle, periods of dollar strength and significant oil weakness, such as during the mid/late 1990s, have historically also had an impact on the relative performance of equity sectors.
Business Cycle Approach to Sectors
Past performance is no guarantee of future results. Sectors as defined by GICS. LEFT: Unshaded (white) portions above suggest no clear pattern of over- or underperformance vs. broader market. Double +/– signs indicate that the sector is showing a consistent signal across all three metrics: full-phase average performance, median monthly difference, and cycle hit rate. A single +/– indicates a mixed or less consistent signal. Source: The Business Cycle Approach to Sector Investing, Fidelity Investments (AART), September 2014. RIGHT: Source: Haver Analytics, Fidelity Investments (AART), as of 12/31/14. 33
Sector Early Mid Late Recession
Financials + - Consumer
Discretionary ++ --
Technology + + -- --
Industrials ++ + --
Materials -- ++ - Consumer
Staples - + ++
Health Care - ++ ++
Energy -- ++
Telecom -- ++
Utilities -- - + ++
October 1996–August 1998
June 2014–Dec 2014
Technology 89% 13%
Health Care 77% 15%
Telecom 62% -2%
Consumer Discretionary 57% 9%
Financials 51% 10%
S&P 500 47% 7%
Consumer Staples 39% 9%
Industrials 24% 5%
Utilities 23% 11%
Energy 13% -18%
Materials -5% -1%
Equity Sector Performance: 1996–1998 vs. 2nd Half 2014
U
.S. E
QU
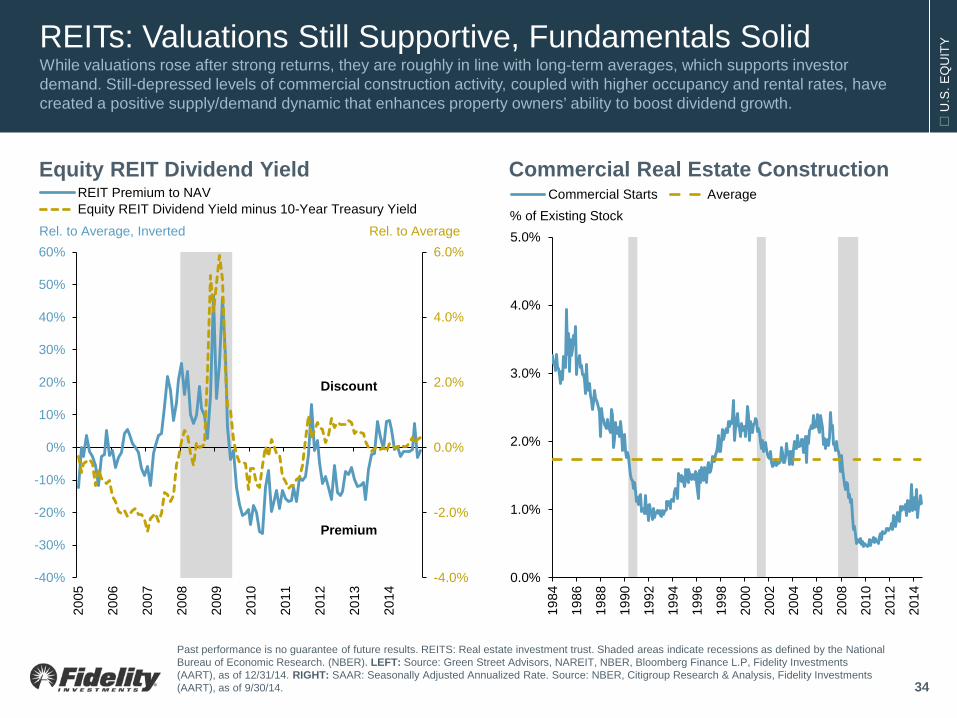
ITY REITs: Valuations Still Supportive, Fundamentals Solid
While valuations rose after strong returns, they are roughly in line with long-term averages, which supports investor demand. Still-depressed levels of commercial construction activity, coupled with higher occupancy and rental rates, have created a positive supply/demand dynamic that enhances property owners’ ability to boost dividend growth.
34
0.0%
1.0%
2.0%
3.0%
4.0%
5.0%
1984
1986
1988
1990
1992
1994
1996
1998
2000
2002
2004
2006
2008
2010
2012
2014
Commercial Starts Average
Commercial Real Estate Construction
% of Existing Stock
Past performance is no guarantee of future results. REITS: Real estate investment trust. Shaded areas indicate recessions as defined by the National Bureau of Economic Research. (NBER). LEFT: Source: Green Street Advisors, NAREIT, NBER, Bloomberg Finance L.P, Fidelity Investments (AART), as of 12/31/14. RIGHT: SAAR: Seasonally Adjusted Annualized Rate. Source: NBER, Citigroup Research & Analysis, Fidelity Investments (AART), as of 9/30/14.
-4.0%
-2.0%
0.0%
2.0%
4.0%
6.0%
-40%
-30%
-20%
-10%
0%
10%
20%
30%
40%
50%
60%
2005
2006
2007
2008
2009
2010
2011
2012
2013
2014
REIT Premium to NAVEquity REIT Dividend Yield minus 10-Year Treasury Yield
Discount
Premium
Equity REIT Dividend Yield
Rel. to Average, Inverted Rel. to Average
Firs
t Qua
rter 2
015
QU
ARTE
RLY
MAR
KET
UPD
ATE
International Equity Markets & Global Assets
IN
TER
NA
TIO
NA
L
2.2%
-3.7% -4.5% -4.6%
-5.7%
5.3%
-1.8%
-12.0%
-14.7%
0.1%
-17.0% Canada Japan EAFE EAFE
Small CapEurope EM Asia Emerging
MarketsLatin
AmericaEMEA Gold Commodities
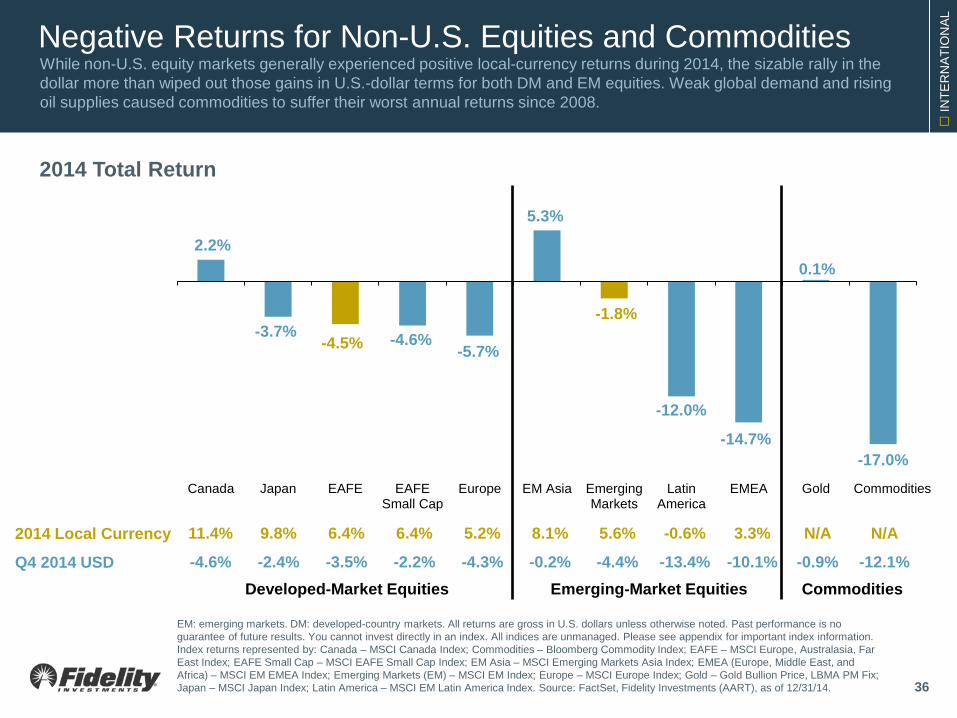
Negative Returns for Non-U.S. Equities and Commodities While non-U.S. equity markets generally experienced positive local-currency returns during 2014, the sizable rally in the dollar more than wiped out those gains in U.S.-dollar terms for both DM and EM equities. Weak global demand and rising oil supplies caused commodities to suffer their worst annual returns since 2008.
2014 Total Return
2014 Local Currency 11.4% 9.8% 6.4% 6.4% 5.2% 8.1% 5.6% -0.6% 3.3% N/A N/A
Q4 2014 USD -4.6% -2.4% -3.5% -2.2% -4.3% -0.2% -4.4% -13.4% -10.1% -0.9% -12.1%
EM: emerging markets. DM: developed-country markets. All returns are gross in U.S. dollars unless otherwise noted. Past performance is no guarantee of future results. You cannot invest directly in an index. All indices are unmanaged. Please see appendix for important index information. Index returns represented by: Canada – MSCI Canada Index; Commodities – Bloomberg Commodity Index; EAFE – MSCI Europe, Australasia, Far East Index; EAFE Small Cap – MSCI EAFE Small Cap Index; EM Asia – MSCI Emerging Markets Asia Index; EMEA (Europe, Middle East, and Africa) – MSCI EM EMEA Index; Emerging Markets (EM) – MSCI EM Index; Europe – MSCI Europe Index; Gold – Gold Bullion Price, LBMA PM Fix; Japan – MSCI Japan Index; Latin America – MSCI EM Latin America Index. Source: FactSet, Fidelity Investments (AART), as of 12/31/14.
Developed-Market Equities Emerging-Market Equities Commodities
36
IN
TER
NA
TIO
NA
L
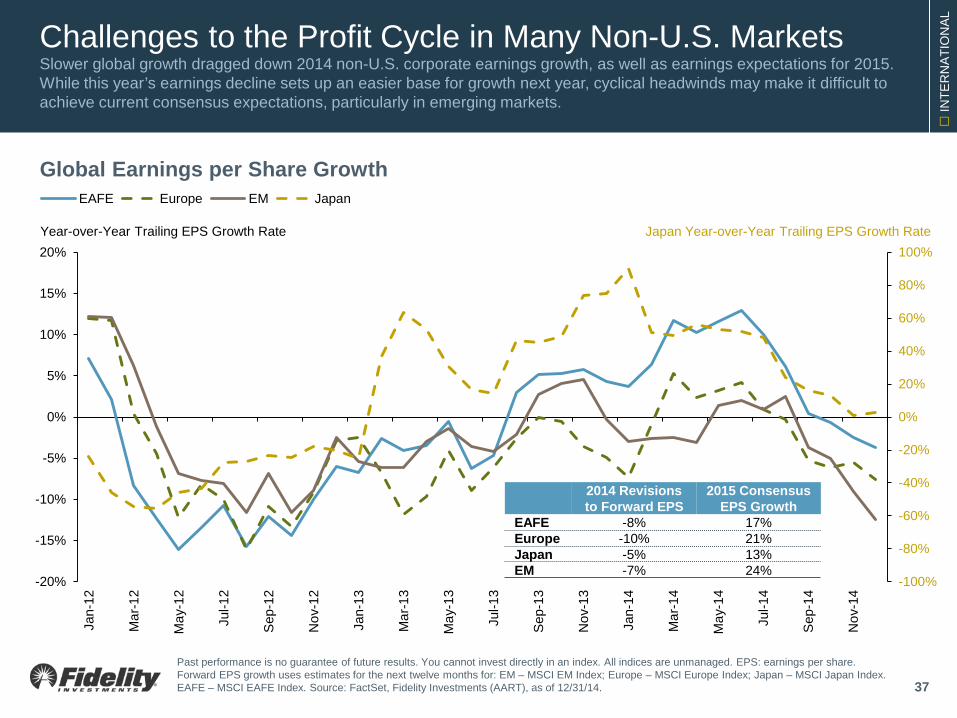
Challenges to the Profit Cycle in Many Non-U.S. Markets Slower global growth dragged down 2014 non-U.S. corporate earnings growth, as well as earnings expectations for 2015. While this year’s earnings decline sets up an easier base for growth next year, cyclical headwinds may make it difficult to achieve current consensus expectations, particularly in emerging markets.
37
-100%
-80%
-60%
-40%
-20%
0%
20%
40%
60%
80%
100%
-20%
-15%
-10%
-5%
0%
5%
10%
15%
20%
Jan-
12
Mar
-12
May
-12
Jul-1
2
Sep
-12
Nov
-12
Jan-
13
Mar
-13
May
-13
Jul-1
3
Sep
-13
Nov
-13
Jan-
14
Mar
-14
May
-14
Jul-1
4
Sep
-14
Nov
-14
EAFE Europe EM Japan
Global Earnings per Share Growth
Past performance is no guarantee of future results. You cannot invest directly in an index. All indices are unmanaged. EPS: earnings per share. Forward EPS growth uses estimates for the next twelve months for: EM – MSCI EM Index; Europe – MSCI Europe Index; Japan – MSCI Japan Index. EAFE – MSCI EAFE Index. Source: FactSet, Fidelity Investments (AART), as of 12/31/14.
Year-over-Year Trailing EPS Growth Rate
2014 Revisions to Forward EPS
2015 Consensus EPS Growth
EAFE -8% 17% Europe -10% 21% Japan -5% 13% EM -7% 24%
Japan Year-over-Year Trailing EPS Growth Rate
IN
TER
NA
TIO
NA
L
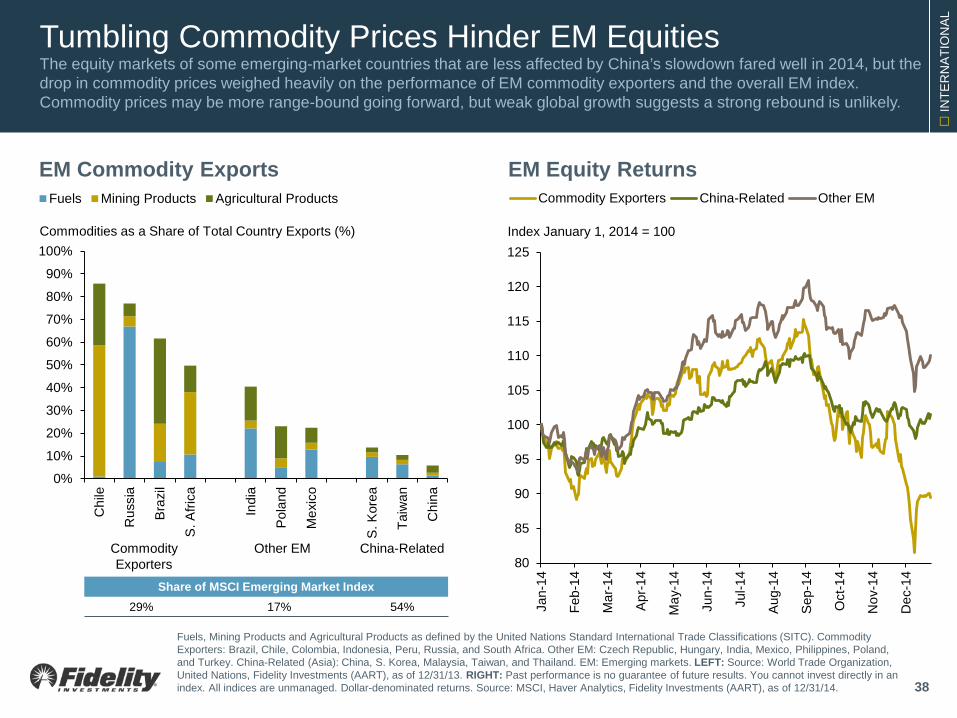
Tumbling Commodity Prices Hinder EM Equities The equity markets of some emerging-market countries that are less affected by China’s slowdown fared well in 2014, but the drop in commodity prices weighed heavily on the performance of EM commodity exporters and the overall EM index. Commodity prices may be more range-bound going forward, but weak global growth suggests a strong rebound is unlikely.
38
0%
10%
20%
30%
40%
50%
60%
70%
80%
90%
100%
Chi
le
Rus
sia
Bra
zil
S. A
frica
Indi
a
Pol
and
Mex
ico
S. K
orea
Taiw
an
Chi
na
Fuels Mining Products Agricultural Products
Fuels, Mining Products and Agricultural Products as defined by the United Nations Standard International Trade Classifications (SITC). Commodity Exporters: Brazil, Chile, Colombia, Indonesia, Peru, Russia, and South Africa. Other EM: Czech Republic, Hungary, India, Mexico, Philippines, Poland, and Turkey. China-Related (Asia): China, S. Korea, Malaysia, Taiwan, and Thailand. EM: Emerging markets. LEFT: Source: World Trade Organization, United Nations, Fidelity Investments (AART), as of 12/31/13. RIGHT: Past performance is no guarantee of future results. You cannot invest directly in an index. All indices are unmanaged. Dollar-denominated returns. Source: MSCI, Haver Analytics, Fidelity Investments (AART), as of 12/31/14.
EM Commodity Exports
80
85
90
95
100
105
110
115
120
125
Jan-
14
Feb-
14
Mar
-14
Apr
-14
May
-14
Jun-
14
Jul-1
4
Aug
-14
Sep
-14
Oct
-14
Nov
-14
Dec
-14
Commodity Exporters China-Related Other EM
EM Equity Returns
Share of MSCI Emerging Market Index 29% 17% 54%
Commodities as a Share of Total Country Exports (%)
Commodity Exporters
China-Related Other EM
Index January 1, 2014 = 100
IN
TER
NA
TIO
NA
L
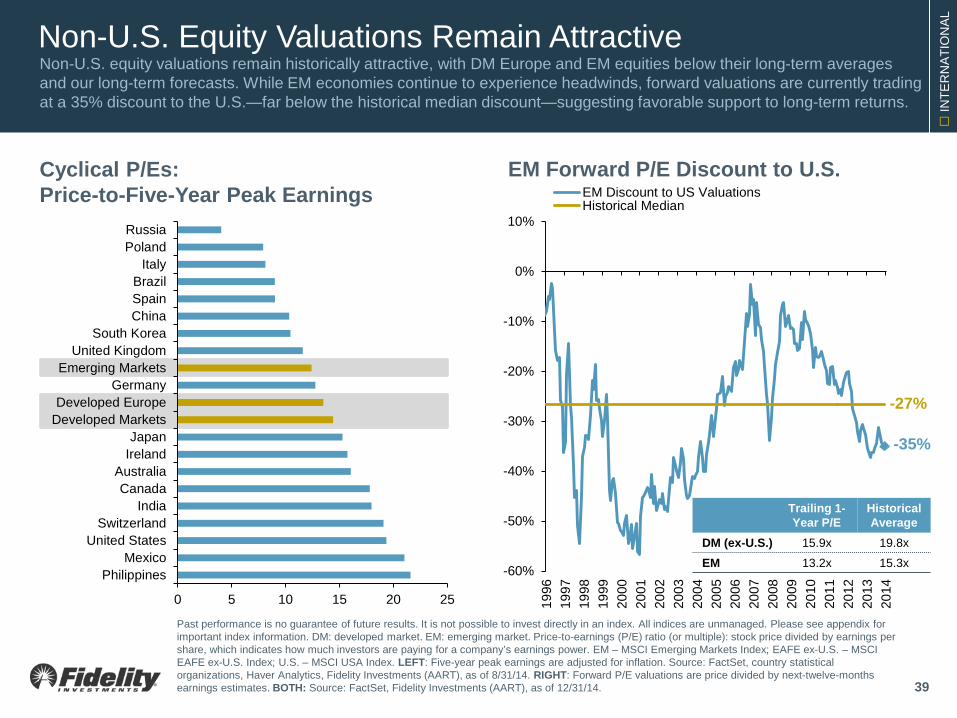
Non-U.S. Equity Valuations Remain Attractive Non-U.S. equity valuations remain historically attractive, with DM Europe and EM equities below their long-term averages and our long-term forecasts. While EM economies continue to experience headwinds, forward valuations are currently trading at a 35% discount to the U.S.—far below the historical median discount—suggesting favorable support to long-term returns.
39
EM Forward P/E Discount to U.S.
-35%
-27%
-60%
-50%
-40%
-30%
-20%
-10%
0%
10%
1996
1997
1998
1999
2000
2001
2002
2003
2004
2005
2006
2007
2008
2009
2010
2011
2012
2013
2014
EM Discount to US ValuationsHistorical Median
Cyclical P/Es: Price-to-Five-Year Peak Earnings
0 5 10 15 20 25
PhilippinesMexico
United StatesSwitzerland
IndiaCanada
AustraliaIrelandJapan
Developed MarketsDeveloped Europe
GermanyEmerging Markets
United KingdomSouth Korea
ChinaSpainBrazil
ItalyPolandRussia
Past performance is no guarantee of future results. It is not possible to invest directly in an index. All indices are unmanaged. Please see appendix for important index information. DM: developed market. EM: emerging market. Price-to-earnings (P/E) ratio (or multiple): stock price divided by earnings per share, which indicates how much investors are paying for a company’s earnings power. EM – MSCI Emerging Markets Index; EAFE ex-U.S. – MSCI EAFE ex-U.S. Index; U.S. – MSCI USA Index. LEFT: Five-year peak earnings are adjusted for inflation. Source: FactSet, country statistical organizations, Haver Analytics, Fidelity Investments (AART), as of 8/31/14. RIGHT: Forward P/E valuations are price divided by next-twelve-months earnings estimates. BOTH: Source: FactSet, Fidelity Investments (AART), as of 12/31/14.
Trailing 1-Year P/E
Historical Average
DM (ex-U.S.) 15.9x 19.8x
EM 13.2x 15.3x
IN
TER
NA
TIO
NA
L
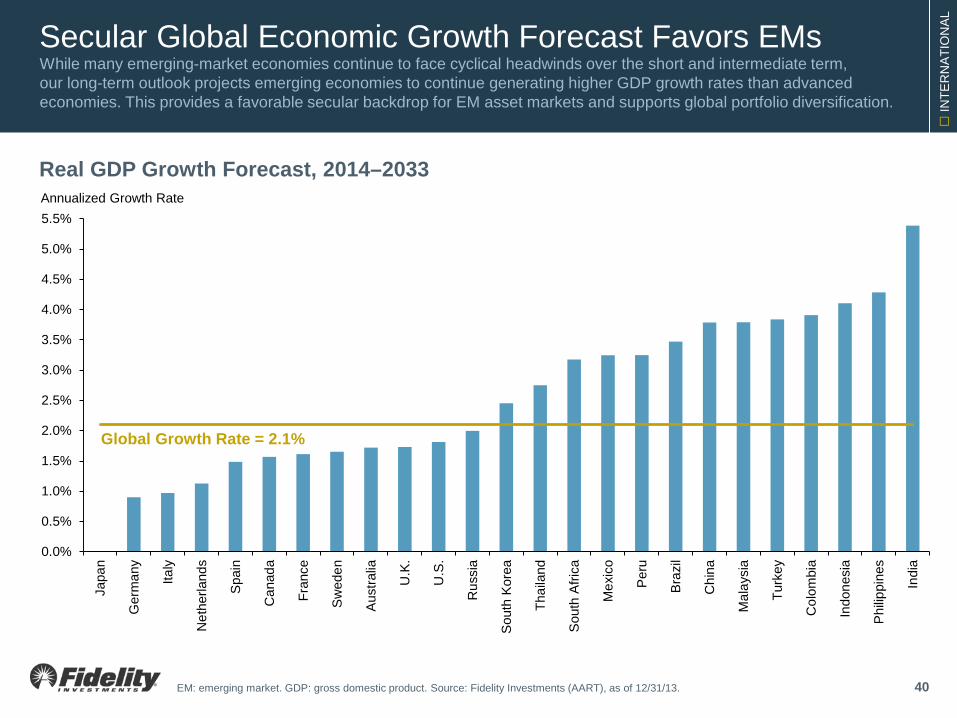
Secular Global Economic Growth Forecast Favors EMs While many emerging-market economies continue to face cyclical headwinds over the short and intermediate term, our long-term outlook projects emerging economies to continue generating higher GDP growth rates than advanced economies. This provides a favorable secular backdrop for EM asset markets and supports global portfolio diversification.
40
0.0%
0.5%
1.0%
1.5%
2.0%
2.5%
3.0%
3.5%
4.0%
4.5%
5.0%
5.5%
Japa
n
Ger
man
y
Italy
Net
herla
nds
Spa
in
Can
ada
Fran
ce
Sw
eden
Aus
tralia
U.K
.
U.S
.
Rus
sia
Sou
th K
orea
Thai
land
Sou
th A
frica
Mex
ico
Per
u
Bra
zil
Chi
na
Mal
aysi
a
Turk
ey
Col
ombi
a
Indo
nesi
a
Phi
lippi
nes
Indi
a
Global Growth Rate = 2.1%
Real GDP Growth Forecast, 2014–2033 Annualized Growth Rate
EM: emerging market. GDP: gross domestic product. Source: Fidelity Investments (AART), as of 12/31/13.
IN
TER
NA
TIO
NA
L
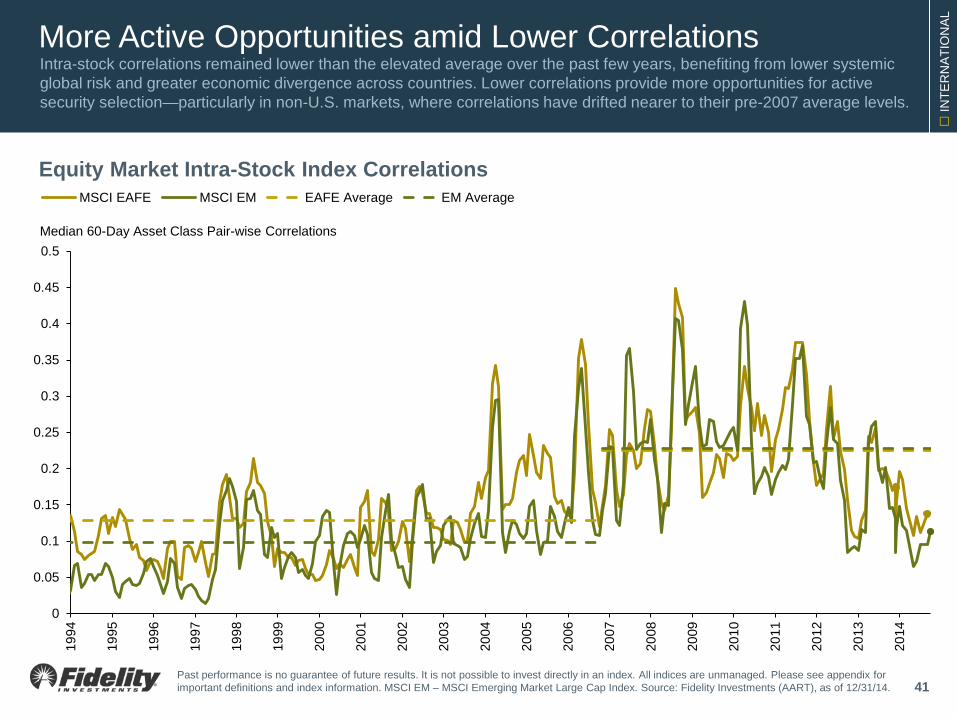
More Active Opportunities amid Lower Correlations Intra-stock correlations remained lower than the elevated average over the past few years, benefiting from lower systemic global risk and greater economic divergence across countries. Lower correlations provide more opportunities for active security selection—particularly in non-U.S. markets, where correlations have drifted nearer to their pre-2007 average levels.
41
Equity Market Intra-Stock Index Correlations
Median 60-Day Asset Class Pair-wise Correlations
0
0.05
0.1
0.15
0.2
0.25
0.3
0.35
0.4
0.45
0.5
1994
1995
1996
1997
1998
1999
2000
2001
2002
2003
2004
2005
2006
2007
2008
2009
2010
2011
2012
2013
2014
MSCI EAFE MSCI EM EAFE Average EM Average
Past performance is no guarantee of future results. It is not possible to invest directly in an index. All indices are unmanaged. Please see appendix for important definitions and index information. MSCI EM – MSCI Emerging Market Large Cap Index. Source: Fidelity Investments (AART), as of 12/31/14.
Firs
t Qua
rter 2
015
QU
ARTE
RLY
MAR
KET
UPD
ATE
Fixed Income Markets
F
IXE
D IN
CO
ME
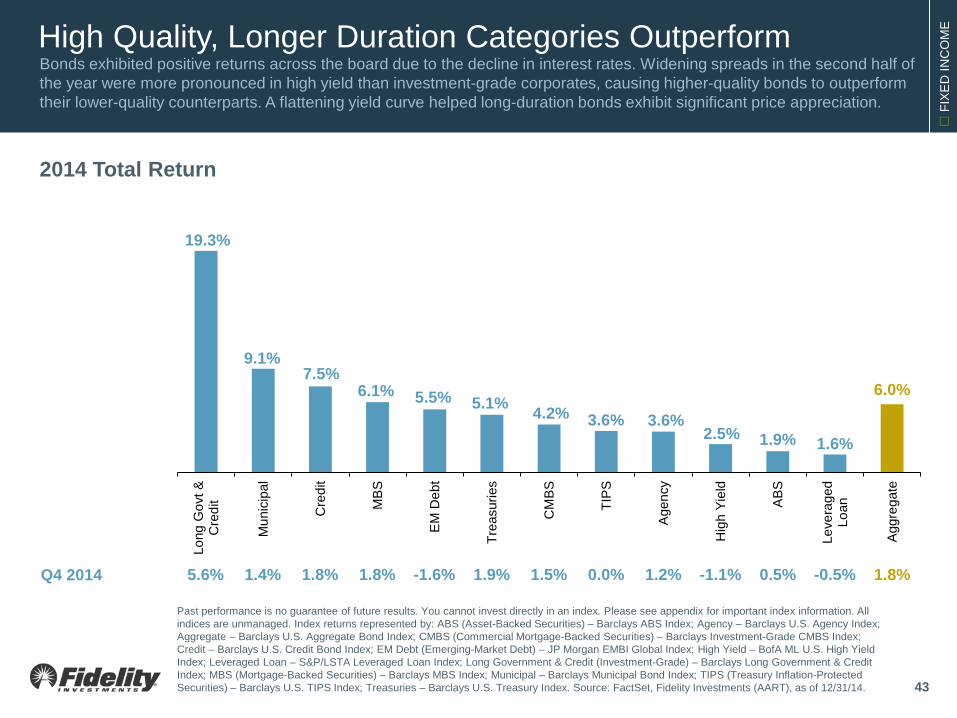
High Quality, Longer Duration Categories Outperform Bonds exhibited positive returns across the board due to the decline in interest rates. Widening spreads in the second half of the year were more pronounced in high yield than investment-grade corporates, causing higher-quality bonds to outperform their lower-quality counterparts. A flattening yield curve helped long-duration bonds exhibit significant price appreciation.
2014 Total Return
Q4 2014 5.6% 1.4% 1.8% 1.8% -1.6% 1.9% 1.5% 0.0% 1.2% -1.1% 0.5% -0.5% 1.8%
19.3%
9.1% 7.5%
6.1% 5.5% 5.1% 4.2% 3.6% 3.6% 2.5% 1.9% 1.6%
6.0%
Long
Gov
t &C
redi
t
Mun
icip
al
Cre
dit
MB
S
EM
Deb
t
Trea
surie
s
CM
BS
TIP
S
Age
ncy
Hig
h Yi
eld
ABS
Leve
rage
dLo
an
Agg
rega
te
Past performance is no guarantee of future results. You cannot invest directly in an index. Please see appendix for important index information. All indices are unmanaged. Index returns represented by: ABS (Asset-Backed Securities) – Barclays ABS Index; Agency – Barclays U.S. Agency Index; Aggregate – Barclays U.S. Aggregate Bond Index; CMBS (Commercial Mortgage-Backed Securities) – Barclays Investment-Grade CMBS Index; Credit – Barclays U.S. Credit Bond Index; EM Debt (Emerging-Market Debt) – JP Morgan EMBI Global Index; High Yield – BofA ML U.S. High Yield Index; Leveraged Loan – S&P/LSTA Leveraged Loan Index; Long Government & Credit (Investment-Grade) – Barclays Long Government & Credit Index; MBS (Mortgage-Backed Securities) – Barclays MBS Index; Municipal – Barclays Municipal Bond Index; TIPS (Treasury Inflation-Protected Securities) – Barclays U.S. TIPS Index; Treasuries – Barclays U.S. Treasury Index. Source: FactSet, Fidelity Investments (AART), as of 12/31/14. 43
F
IXE
D IN
CO
ME
0.0
0.5
1.0
1.5
2.0
2.5
3.0
3.5
4.0
4.5
1-M
onth
1-Y
ear
2-Y
ear
3-Y
ear
5-ye
ar
7-Y
ear
10-Y
ear
20-Y
ear
30-Y
ear
Dec 2013
Dec 2014
Dec 2010
0.7% 1.1%
1.7% 2.0% 2.2% 0.9%
1.2%
1.4%
1.0% 0.6%
0.0
0.1
0.2
0.3
0.4
0.5
0.6
0.7
0.8
0.9
0.0%
0.5%
1.0%
1.5%
2.0%
2.5%
3.0%
3.5%
1 Yr. 2 Yr. 3 Yr. 5 Yr. 7 Yr. 10 Yr.
Yield Roll Return Duration-Adjusted Return
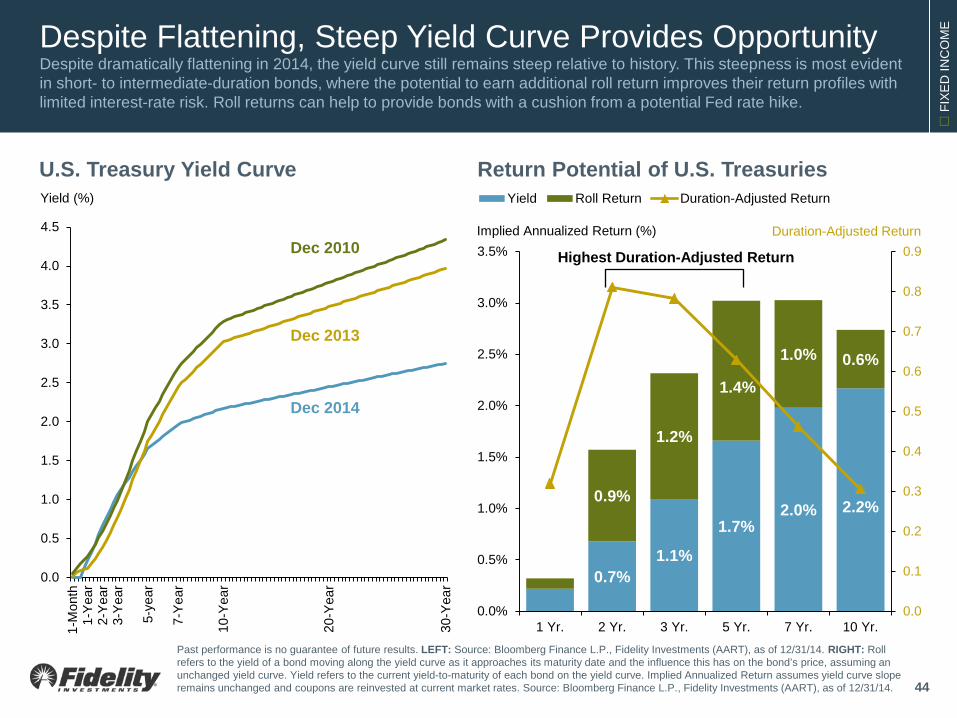
Past performance is no guarantee of future results. LEFT: Source: Bloomberg Finance L.P., Fidelity Investments (AART), as of 12/31/14. RIGHT: Roll refers to the yield of a bond moving along the yield curve as it approaches its maturity date and the influence this has on the bond’s price, assuming an unchanged yield curve. Yield refers to the current yield-to-maturity of each bond on the yield curve. Implied Annualized Return assumes yield curve slope remains unchanged and coupons are reinvested at current market rates. Source: Bloomberg Finance L.P., Fidelity Investments (AART), as of 12/31/14.
Despite Flattening, Steep Yield Curve Provides Opportunity Despite dramatically flattening in 2014, the yield curve still remains steep relative to history. This steepness is most evident in short- to intermediate-duration bonds, where the potential to earn additional roll return improves their return profiles with limited interest-rate risk. Roll returns can help to provide bonds with a cushion from a potential Fed rate hike.
U.S. Treasury Yield Curve Yield (%)
44
Implied Annualized Return (%)
Return Potential of U.S. Treasuries
Duration-Adjusted Return
Highest Duration-Adjusted Return
F
IXE
D IN
CO
ME
13
9
14 12 15 23
30
9
33 37 42
65
0
10
20
30
40
50
60
70
80
90
100
0
1
2
3
4
5
6
7
U.S. AggregateBond
MBS CMBS CorporateInvestment Grade
CorporateHigh Yield
Emerging-MarketDebt
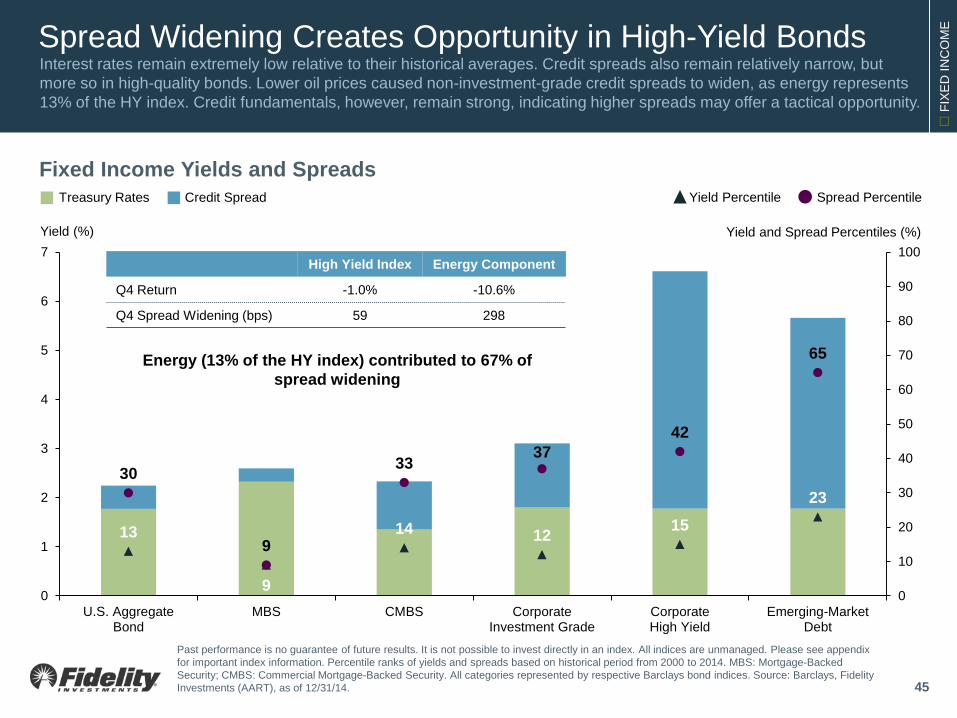
Spread Widening Creates Opportunity in High-Yield Bonds Interest rates remain extremely low relative to their historical averages. Credit spreads also remain relatively narrow, but more so in high-quality bonds. Lower oil prices caused non-investment-grade credit spreads to widen, as energy represents 13% of the HY index. Credit fundamentals, however, remain strong, indicating higher spreads may offer a tactical opportunity.
Past performance is no guarantee of future results. It is not possible to invest directly in an index. All indices are unmanaged. Please see appendix for important index information. Percentile ranks of yields and spreads based on historical period from 2000 to 2014. MBS: Mortgage-Backed Security; CMBS: Commercial Mortgage-Backed Security. All categories represented by respective Barclays bond indices. Source: Barclays, Fidelity Investments (AART), as of 12/31/14.
Fixed Income Yields and Spreads
Yield (%) Yield and Spread Percentiles (%)
Credit Spread Treasury Rates Spread Percentile Yield Percentile
45
High Yield Index Energy Component
Q4 Return -1.0% -10.6%
Q4 Spread Widening (bps) 59 298
Energy (13% of the HY index) contributed to 67% of spread widening
F
IXE
D IN
CO
ME
-1.0
-0.8
-0.6
-0.4
-0.2
0.0
0.2
0.4
0.6
0.8
1.0
1966
1970
1974
1978
1982
1986
1990
1994
1998
2002
2006
2010
2014
Stocks and Intermediate U.S. Treasury BondsStocks and High Yield Bonds
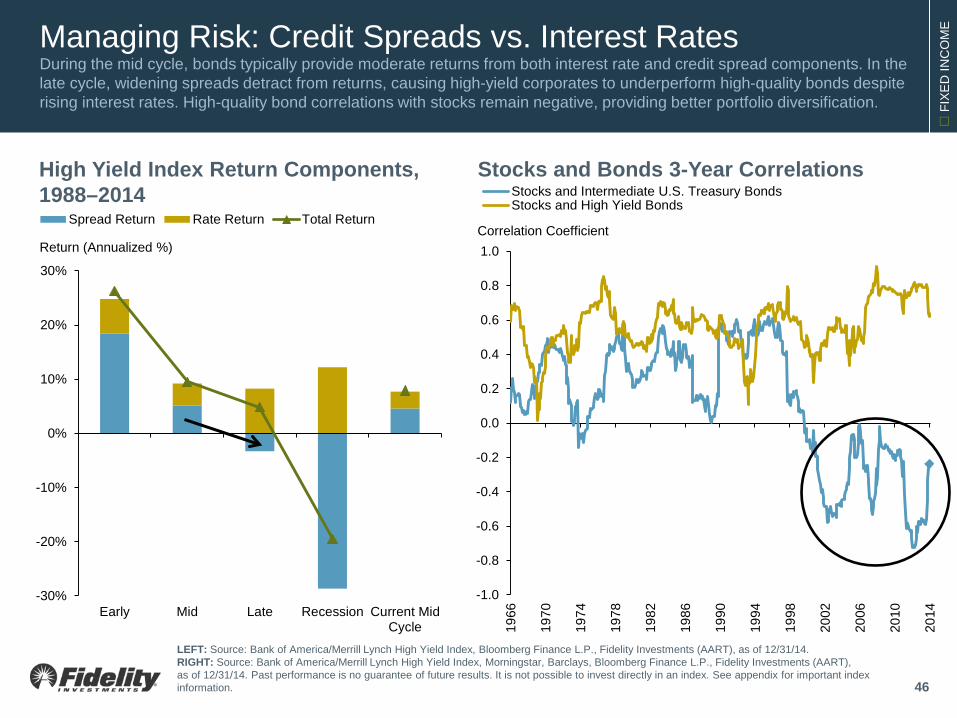
Managing Risk: Credit Spreads vs. Interest Rates During the mid cycle, bonds typically provide moderate returns from both interest rate and credit spread components. In the late cycle, widening spreads detract from returns, causing high-yield corporates to underperform high-quality bonds despite rising interest rates. High-quality bond correlations with stocks remain negative, providing better portfolio diversification.
46
High Yield Index Return Components, 1988–2014
Correlation Coefficient
LEFT: Source: Bank of America/Merrill Lynch High Yield Index, Bloomberg Finance L.P., Fidelity Investments (AART), as of 12/31/14. RIGHT: Source: Bank of America/Merrill Lynch High Yield Index, Morningstar, Barclays, Bloomberg Finance L.P., Fidelity Investments (AART), as of 12/31/14. Past performance is no guarantee of future results. It is not possible to invest directly in an index. See appendix for important index information.
Stocks and Bonds 3-Year Correlations
-30%
-20%
-10%
0%
10%
20%
30%
Early Mid Late Recession Current MidCycle
Spread Return Rate Return Total Return
Return (Annualized %)
F
IXE
D IN
CO
ME
-200
0
200
400
600
800
1,000
1,200
1,400
1,600
1,800
2,000
2,200
2004 2005 2006 2007 2008 2009 2010 2011 2012 2013 2014***
Government Issuance (Post-Fed)* Spread Product Issuance Coupon Reinvestment Demand
Reinvestment Demand Near Supply
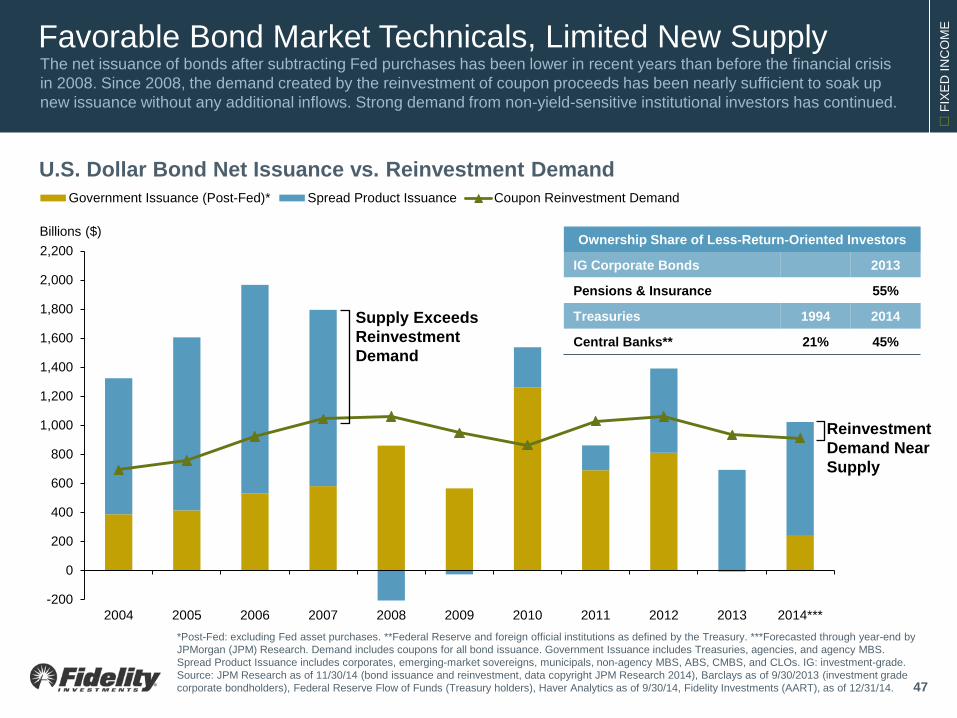
Favorable Bond Market Technicals, Limited New Supply The net issuance of bonds after subtracting Fed purchases has been lower in recent years than before the financial crisis in 2008. Since 2008, the demand created by the reinvestment of coupon proceeds has been nearly sufficient to soak up new issuance without any additional inflows. Strong demand from non-yield-sensitive institutional investors has continued.
Billions ($)
U.S. Dollar Bond Net Issuance vs. Reinvestment Demand
*Post-Fed: excluding Fed asset purchases. **Federal Reserve and foreign official institutions as defined by the Treasury. ***Forecasted through year-end by JPMorgan (JPM) Research. Demand includes coupons for all bond issuance. Government Issuance includes Treasuries, agencies, and agency MBS. Spread Product Issuance includes corporates, emerging-market sovereigns, municipals, non-agency MBS, ABS, CMBS, and CLOs. IG: investment-grade. Source: JPM Research as of 11/30/14 (bond issuance and reinvestment, data copyright JPM Research 2014), Barclays as of 9/30/2013 (investment grade corporate bondholders), Federal Reserve Flow of Funds (Treasury holders), Haver Analytics as of 9/30/14, Fidelity Investments (AART), as of 12/31/14.
Ownership Share of Less-Return-Oriented Investors
IG Corporate Bonds 2013
Pensions & Insurance 55%
Treasuries 1994 2014
Central Banks** 21% 45%
Supply Exceeds Reinvestment Demand
47
F
IXE
D IN
CO
ME
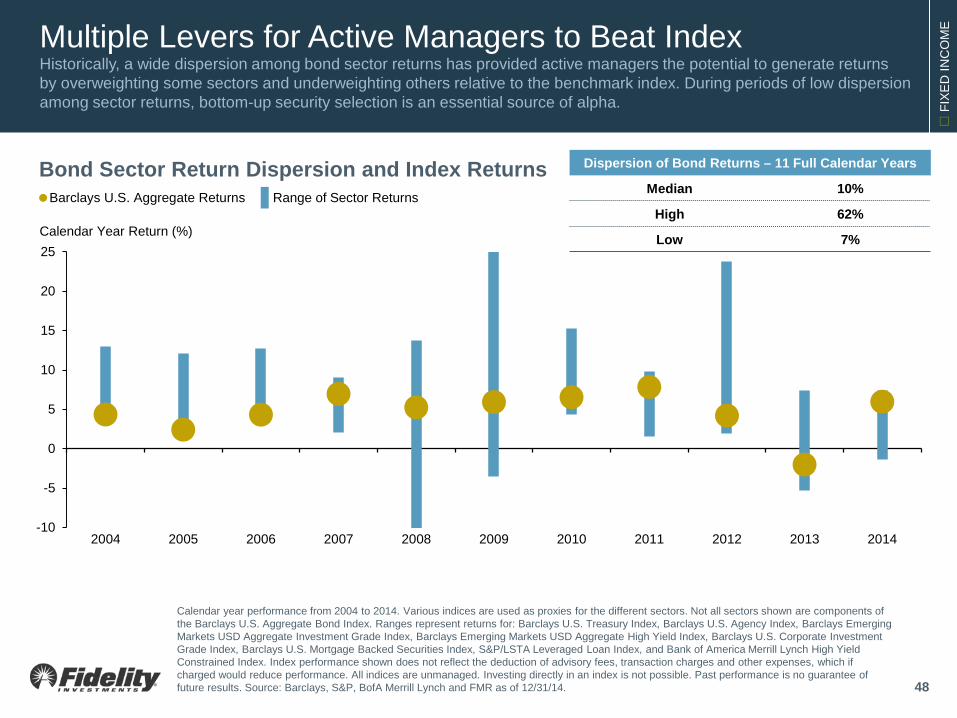
Multiple Levers for Active Managers to Beat Index Historically, a wide dispersion among bond sector returns has provided active managers the potential to generate returns by overweighting some sectors and underweighting others relative to the benchmark index. During periods of low dispersion among sector returns, bottom-up security selection is an essential source of alpha.
48
-10
-5
0
5
10
15
20
25
2004 2005 2006 2007 2008 2009 2010 2011 2012 2013 2014
Barclays U.S. Aggregate Returns
Dispersion of Bond Returns – 11 Full Calendar Years
Median 10%
High 62%
Low 7%
Calendar year performance from 2004 to 2014. Various indices are used as proxies for the different sectors. Not all sectors shown are components of the Barclays U.S. Aggregate Bond Index. Ranges represent returns for: Barclays U.S. Treasury Index, Barclays U.S. Agency Index, Barclays Emerging Markets USD Aggregate Investment Grade Index, Barclays Emerging Markets USD Aggregate High Yield Index, Barclays U.S. Corporate Investment Grade Index, Barclays U.S. Mortgage Backed Securities Index, S&P/LSTA Leveraged Loan Index, and Bank of America Merrill Lynch High Yield Constrained Index. Index performance shown does not reflect the deduction of advisory fees, transaction charges and other expenses, which if charged would reduce performance. All indices are unmanaged. Investing directly in an index is not possible. Past performance is no guarantee of future results. Source: Barclays, S&P, BofA Merrill Lynch and FMR as of 12/31/14.
Bond Sector Return Dispersion and Index Returns
Calendar Year Return (%)
Range of Sector Returns
Firs
t Qua
rter 2
015
QU
ARTE
RLY
MAR
KET
UPD
ATE
Asset Allocation Themes
A
SS
ET
ALL
OC
ATI
ON
0.2
0.3
0.4
0.5
0.6
0.7
0.8
Dec
-06
Jun-
07
Dec
-07
Jun-
08
Dec
-08
Jun-
09
Dec
-09
Jun-
10
Dec
-10
Jun-
11
Dec
-11
Jun-
12
Dec
-12
Jun-
13
Dec
-13
Jun-
14
Dec
-14
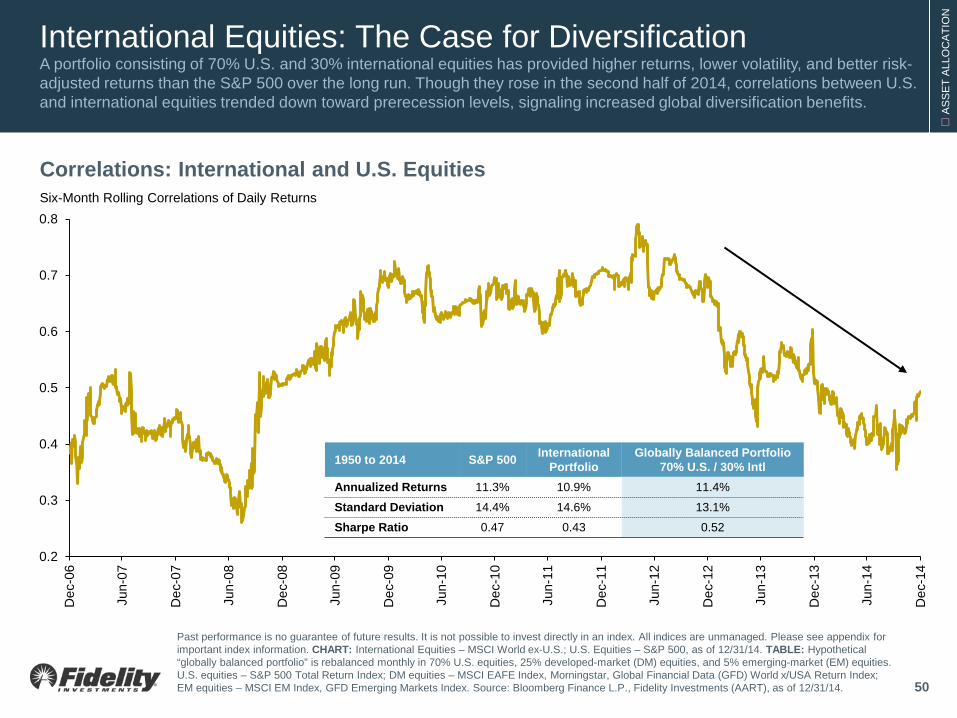
International Equities: The Case for Diversification A portfolio consisting of 70% U.S. and 30% international equities has provided higher returns, lower volatility, and better risk-adjusted returns than the S&P 500 over the long run. Though they rose in the second half of 2014, correlations between U.S. and international equities trended down toward prerecession levels, signaling increased global diversification benefits.
50
Past performance is no guarantee of future results. It is not possible to invest directly in an index. All indices are unmanaged. Please see appendix for important index information. CHART: International Equities – MSCI World ex-U.S.; U.S. Equities – S&P 500, as of 12/31/14. TABLE: Hypothetical “globally balanced portfolio” is rebalanced monthly in 70% U.S. equities, 25% developed-market (DM) equities, and 5% emerging-market (EM) equities. U.S. equities – S&P 500 Total Return Index; DM equities – MSCI EAFE Index, Morningstar, Global Financial Data (GFD) World x/USA Return Index; EM equities – MSCI EM Index, GFD Emerging Markets Index. Source: Bloomberg Finance L.P., Fidelity Investments (AART), as of 12/31/14.
1950 to 2014 S&P 500 International Portfolio
Globally Balanced Portfolio 70% U.S. / 30% Intl
Annualized Returns 11.3% 10.9% 11.4%
Standard Deviation 14.4% 14.6% 13.1%
Sharpe Ratio 0.47 0.43 0.52
Correlations: International and U.S. Equities Six-Month Rolling Correlations of Daily Returns
A
SS
ET
ALL
OC
ATI
ON
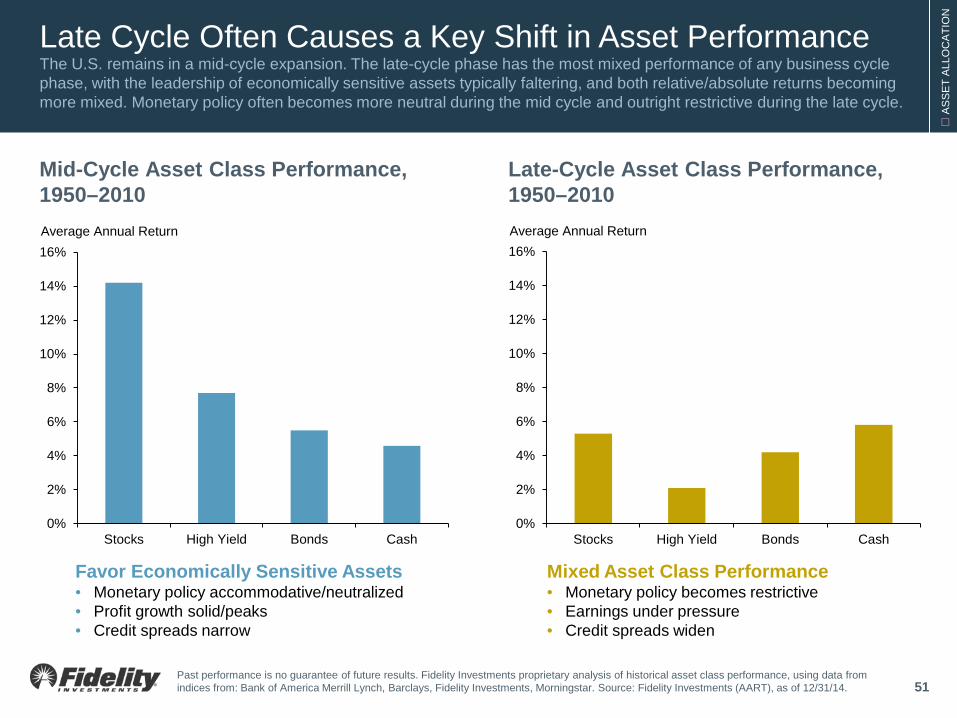
Late Cycle Often Causes a Key Shift in Asset Performance The U.S. remains in a mid-cycle expansion. The late-cycle phase has the most mixed performance of any business cycle phase, with the leadership of economically sensitive assets typically faltering, and both relative/absolute returns becoming more mixed. Monetary policy often becomes more neutral during the mid cycle and outright restrictive during the late cycle.
51
0%
2%
4%
6%
8%
10%
12%
14%
16%
Stocks High Yield Bonds Cash
Mid-Cycle Asset Class Performance, 1950–2010 Average Annual Return
Favor Economically Sensitive Assets • Monetary policy accommodative/neutralized • Profit growth solid/peaks • Credit spreads narrow
0%
2%
4%
6%
8%
10%
12%
14%
16%
Stocks High Yield Bonds Cash
Late-Cycle Asset Class Performance, 1950–2010
Mixed Asset Class Performance • Monetary policy becomes restrictive • Earnings under pressure • Credit spreads widen
Past performance is no guarantee of future results. Fidelity Investments proprietary analysis of historical asset class performance, using data from indices from: Bank of America Merrill Lynch, Barclays, Fidelity Investments, Morningstar. Source: Fidelity Investments (AART), as of 12/31/14.
Average Annual Return
A
SS
ET
ALL
OC
ATI
ON
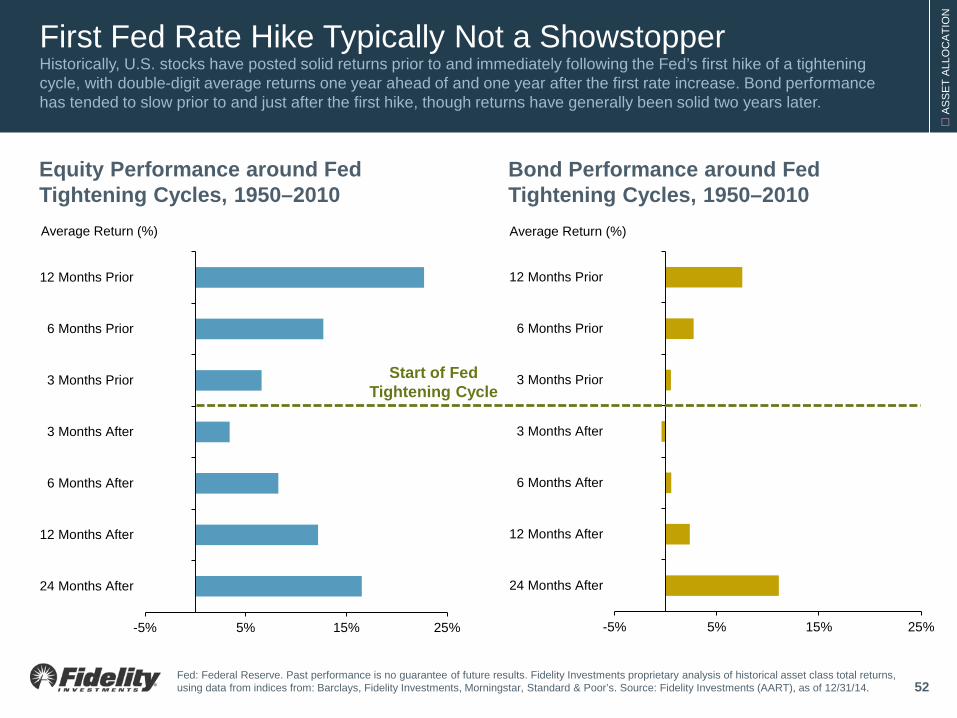
First Fed Rate Hike Typically Not a Showstopper Historically, U.S. stocks have posted solid returns prior to and immediately following the Fed’s first hike of a tightening cycle, with double-digit average returns one year ahead of and one year after the first rate increase. Bond performance has tended to slow prior to and just after the first hike, though returns have generally been solid two years later.
52
Equity Performance around Fed Tightening Cycles, 1950–2010
Fed: Federal Reserve. Past performance is no guarantee of future results. Fidelity Investments proprietary analysis of historical asset class total returns, using data from indices from: Barclays, Fidelity Investments, Morningstar, Standard & Poor’s. Source: Fidelity Investments (AART), as of 12/31/14.
-5% 5% 15% 25%
24 Months After
12 Months After
6 Months After
3 Months After
3 Months Prior
6 Months Prior
12 Months Prior
Average Return (%)
-5% 5% 15% 25%
24 Months After
12 Months After
6 Months After
3 Months After
3 Months Prior
6 Months Prior
12 Months Prior
Bond Performance around Fed Tightening Cycles, 1950–2010
Start of Fed Tightening Cycle
Average Return (%)
A
SS
ET
ALL
OC
ATI
ON
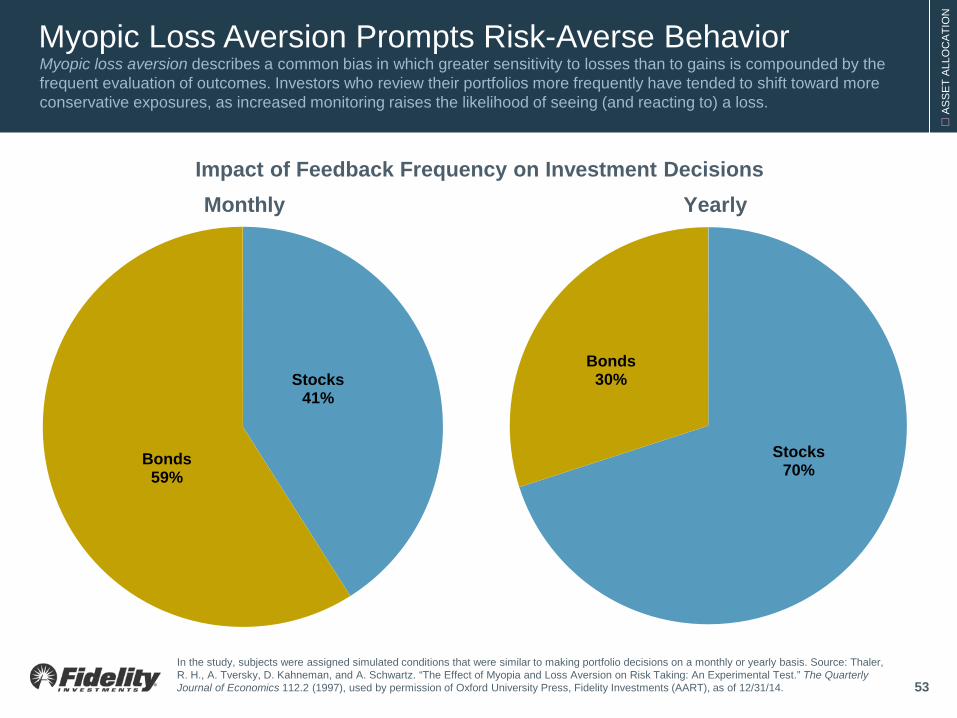
Myopic Loss Aversion Prompts Risk-Averse Behavior Myopic loss aversion describes a common bias in which greater sensitivity to losses than to gains is compounded by the frequent evaluation of outcomes. Investors who review their portfolios more frequently have tended to shift toward more conservative exposures, as increased monitoring raises the likelihood of seeing (and reacting to) a loss.
53
Impact of Feedback Frequency on Investment Decisions Monthly Yearly
Stocks 70%
Bonds 30%
In the study, subjects were assigned simulated conditions that were similar to making portfolio decisions on a monthly or yearly basis. Source: Thaler, R. H., A. Tversky, D. Kahneman, and A. Schwartz. “The Effect of Myopia and Loss Aversion on Risk Taking: An Experimental Test.” The Quarterly Journal of Economics 112.2 (1997), used by permission of Oxford University Press, Fidelity Investments (AART), as of 12/31/14.
Stocks 41%
Bonds 59%
A
SS
ET
ALL
OC
ATI
ON
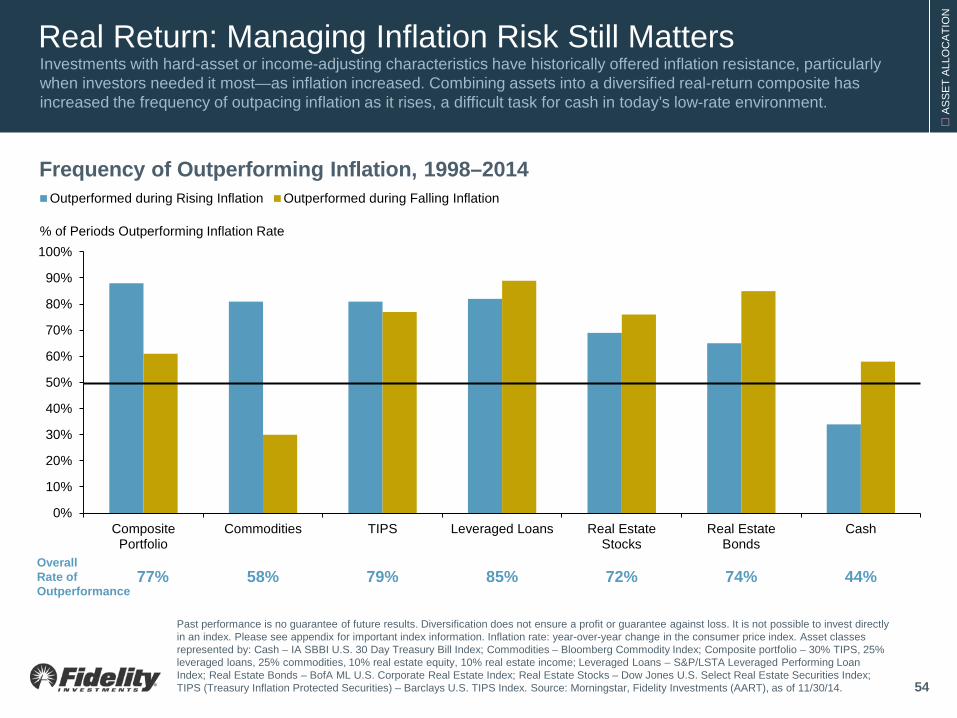
Real Return: Managing Inflation Risk Still Matters Investments with hard-asset or income-adjusting characteristics have historically offered inflation resistance, particularly when investors needed it most—as inflation increased. Combining assets into a diversified real-return composite has increased the frequency of outpacing inflation as it rises, a difficult task for cash in today’s low-rate environment.
Frequency of Outperforming Inflation, 1998–2014
0%
10%
20%
30%
40%
50%
60%
70%
80%
90%
100%
CompositePortfolio
Commodities TIPS Leveraged Loans Real EstateStocks
Real EstateBonds
Cash
Outperformed during Rising Inflation Outperformed during Falling Inflation
Overall Rate of Outperformance
77% 58% 79% 85% 72% 74% 44%
% of Periods Outperforming Inflation Rate
Past performance is no guarantee of future results. Diversification does not ensure a profit or guarantee against loss. It is not possible to invest directly in an index. Please see appendix for important index information. Inflation rate: year-over-year change in the consumer price index. Asset classes represented by: Cash – IA SBBI U.S. 30 Day Treasury Bill Index; Commodities – Bloomberg Commodity Index; Composite portfolio – 30% TIPS, 25% leveraged loans, 25% commodities, 10% real estate equity, 10% real estate income; Leveraged Loans – S&P/LSTA Leveraged Performing Loan Index; Real Estate Bonds – BofA ML U.S. Corporate Real Estate Index; Real Estate Stocks – Dow Jones U.S. Select Real Estate Securities Index; TIPS (Treasury Inflation Protected Securities) – Barclays U.S. TIPS Index. Source: Morningstar, Fidelity Investments (AART), as of 11/30/14. 54
A
SS
ET
ALL
OC
ATI
ON
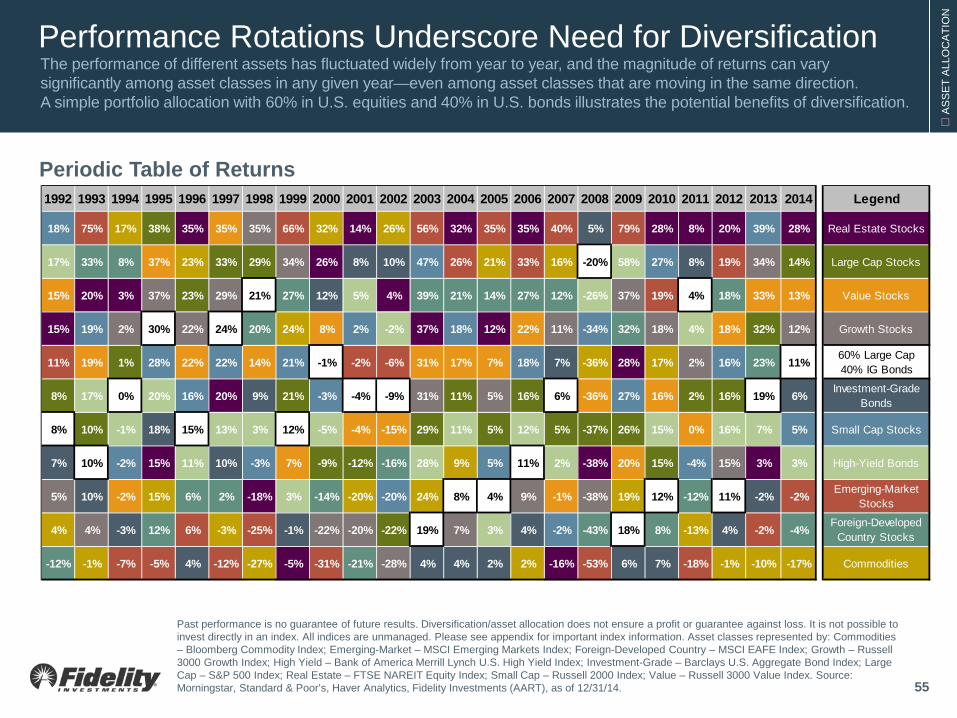
Performance Rotations Underscore Need for Diversification The performance of different assets has fluctuated widely from year to year, and the magnitude of returns can vary significantly among asset classes in any given year—even among asset classes that are moving in the same direction. A simple portfolio allocation with 60% in U.S. equities and 40% in U.S. bonds illustrates the potential benefits of diversification.
Periodic Table of Returns
Past performance is no guarantee of future results. Diversification/asset allocation does not ensure a profit or guarantee against loss. It is not possible to invest directly in an index. All indices are unmanaged. Please see appendix for important index information. Asset classes represented by: Commodities – Bloomberg Commodity Index; Emerging-Market – MSCI Emerging Markets Index; Foreign-Developed Country – MSCI EAFE Index; Growth – Russell 3000 Growth Index; High Yield – Bank of America Merrill Lynch U.S. High Yield Index; Investment-Grade – Barclays U.S. Aggregate Bond Index; Large Cap – S&P 500 Index; Real Estate – FTSE NAREIT Equity Index; Small Cap – Russell 2000 Index; Value – Russell 3000 Value Index. Source: Morningstar, Standard & Poor’s, Haver Analytics, Fidelity Investments (AART), as of 12/31/14. 55
1992 1993 1994 1995 1996 1997 1998 1999 2000 2001 2002 2003 2004 2005 2006 2007 2008 2009 2010 2011 2012 2013 2014 Legend
18% 75% 17% 38% 35% 35% 35% 66% 32% 14% 26% 56% 32% 35% 35% 40% 5% 79% 28% 8% 20% 39% 28% Real Estate Stocks
17% 33% 8% 37% 23% 33% 29% 34% 26% 8% 10% 47% 26% 21% 33% 16% -20% 58% 27% 8% 19% 34% 14% Large Cap Stocks
15% 20% 3% 37% 23% 29% 21% 27% 12% 5% 4% 39% 21% 14% 27% 12% -26% 37% 19% 4% 18% 33% 13% Value Stocks
15% 19% 2% 30% 22% 24% 20% 24% 8% 2% -2% 37% 18% 12% 22% 11% -34% 32% 18% 4% 18% 32% 12% Growth Stocks
11% 19% 1% 28% 22% 22% 14% 21% -1% -2% -6% 31% 17% 7% 18% 7% -36% 28% 17% 2% 16% 23% 11% 60% Large Cap40% IG Bonds
8% 17% 0% 20% 16% 20% 9% 21% -3% -4% -9% 31% 11% 5% 16% 6% -36% 27% 16% 2% 16% 19% 6% Investment-Grade Bonds
8% 10% -1% 18% 15% 13% 3% 12% -5% -4% -15% 29% 11% 5% 12% 5% -37% 26% 15% 0% 16% 7% 5% Small Cap Stocks
7% 10% -2% 15% 11% 10% -3% 7% -9% -12% -16% 28% 9% 5% 11% 2% -38% 20% 15% -4% 15% 3% 3% High-Yield Bonds
5% 10% -2% 15% 6% 2% -18% 3% -14% -20% -20% 24% 8% 4% 9% -1% -38% 19% 12% -12% 11% -2% -2% Emerging-Market Stocks
4% 4% -3% 12% 6% -3% -25% -1% -22% -20% -22% 19% 7% 3% 4% -2% -43% 18% 8% -13% 4% -2% -4% Foreign-Developed Country Stocks
-12% -1% -7% -5% 4% -12% -27% -5% -31% -21% -28% 4% 4% 2% 2% -16% -53% 6% 7% -18% -1% -10% -17% Commodities

Appendix: Important Information Views expressed are as of the date indicated, based on the information available at that time, and may change based on market and other conditions. Unless otherwise noted, the opinions provided are those of the authors and not necessarily those of Fidelity Investments or its affiliates. Fidelity does not assume any duty to update any of the information.
Investment decisions should be based on an individual’s own goals, time horizon, and tolerance for risk.
These materials are provided for informational purposes only and should not be used or construed as a recommendation of any security, sector, or investment strategy.
Fidelity does not provide legal or tax advice and the information provided herein is general in nature and should not be considered legal or tax advice. Consult with an attorney or a tax professional regarding your specific legal or tax situation.
Past performance and dividend rates are historical and do not guarantee future results.
Investing involves risk, including risk of loss.
Diversification does not ensure a profit or guarantee against loss.
All indices are unmanaged, and performance of the indices includes reinvestment of dividends and interest income and, unless otherwise noted, is not illustrative of any particular investment. An investment cannot be made in any index.
Although bonds generally present less short-term risk and volatility than stocks, bonds do contain interest rate risk (as interest rates rise, bond prices usually fall, and vice versa) and the risk of default, or the risk that an issuer will be unable to make income or principal payments. Additionally, bonds and short-term investments entail greater inflation risk—or the risk that the return of an investment will not keep up with increases in the prices of goods and services—than stocks. Increases in real interest rates can cause the price of inflation-protected debt securities to decrease.
Stock markets, especially non-U.S. markets, are volatile and can decline significantly in response to adverse issuer, political, regulatory, market, or economic developments. Foreign securities are subject to interest rate, currency exchange rate, economic, and political risks, all of which are magnified in emerging markets.
The securities of smaller, less well-known companies can be more volatile than those of larger companies.
Growth stocks can perform differently from the market as a whole and from other types of stocks, and can be more volatile than other types of stocks. Value stocks can perform differently from other types of stocks and can continue to be undervalued by the market for long periods of time.
Lower-quality debt securities generally offer higher yields but also involve greater risk of default or price changes due to potential changes in the credit quality of the issuer. Any fixed income security sold or redeemed prior to maturity may be subject to loss.
Floating-rate loans generally are subject to restrictions on resale, and sometimes trade infrequently in the secondary market; as a result, they may be more difficult to value, buy, or sell. A floating-rate loan may not be fully collateralized and therefore may decline significantly in value.
The municipal market can be affected by adverse tax, legislative, or political changes, and by the financial condition of the issuers of municipal securities. Interest income generated by municipal bonds is generally expected to be exempt from federal income taxes and, if the bonds are held by an investor resident in the state of issuance, from state and local income taxes. Such interest income may be subject to federal and/or state alternative minimum taxes. Investing in municipal bonds for the purpose of generating tax-exempt income may not be appropriate for investors in all tax brackets. Generally, tax-exempt municipal securities are not appropriate holdings for tax-advantaged accounts such as IRAs and 401(k)s.
The commodities industry can be significantly affected by commodity prices, world events, import controls, worldwide competition, government regulations, and economic conditions.
The gold industry can be significantly affected by international monetary and political developments, such as currency devaluations or revaluations, central bank movements, economic and social conditions within a country, trade imbalances, or trade or currency restrictions between countries.
Changes in real estate values or economic downturns can have a significant negative effect on issuers in the real estate industry.
Leverage can magnify the impact that adverse issuer, political, regulatory, market, or economic developments have on a company. In the event of bankruptcy, a company’s creditors take precedence over the company’s stockholders.
Market Indices
BofA ML Corporate Real Estate Index, a subset of BofA ML U.S. Corporate Index, is a market capitalization-weighted index of U.S. dollar-denominated investment-grade corporate debt publicly issued in the U.S. domestic market by real estate issuers. Qualifying securities must have an investment-grade rating (based on an average of Moody’s, S&P, and Fitch). In addition, qualifying securities must have at least one year remaining to final maturity, a fixed coupon schedule, and a minimum amount outstanding of $250 million. BofA ML U.S. Real Estate Index is a subset of the BofA ML Real Estate Corporate Index; qualifying securities must have an investment grade rating and an investment grade-rated country of risk. BofA ML U.S. High Yield Bond Index is a market capitalization-weighted index of U.S. dollar denominated below investment grade corporate debt publicly issued in the U.S. domestic market.
56

Appendix: Important Information
57
Market Indices (continued)
Barclays U.S. 1-3 (1-5) Year Government Credit Index includes all publicly issued U.S. government and corporate securities that have a remaining maturity between one and three (five) years and are rated investment grade. Barclays U.S. 1-5 Year Credit Index is designed to cover publicly issued U.S. corporate and specified non-U.S. debentures and secured notes with a maturity between one and five years and meet the specified liquidity and quality requirements; bonds must be SEC-registered to qualify. Barclays U.S. 1-5 Year Municipal Index covers the one- to five-year maturity, U.S. dollar-denominated, tax-exempt bond market with four main sectors: state and local general obligation bonds, revenue bonds, insured bonds, and pre-refunded bonds.
Barclays ABS Index is a market value-weighted index that covers fixed-rate asset-backed securities with average lives greater than or equal to one year and that are part of a public deal; the index covers the following collateral types: credit cards, autos, home equity loans, stranded-cost utility (rate-reduction bonds), and manufactured housing. Barclays CMBS Index is designed to mirror commercial mortgage-backed securities of investment-grade quality (Baa3/BBB-/BBB- or above) using Moody’s, S&P, and Fitch, respectively, with maturities of at least one year. Barclays Emerging Market Bond Index is an unmanaged index that tracks total returns for external-currency-denominated debt instruments of the emerging markets. Barclays Long U.S. Government Credit Index includes all publicly issued U.S. government and corporate securities that have a remaining maturity of 10 or more years, are rated investment grade, and have $250 million or more of outstanding face value. Barclays U.S. MBS Index is a market value-weighted index of fixed-rate securities that represent interests in pools of mortgage loans, including balloon mortgages, with original terms of 15 and 30 years that are issued by the Government National Mortgage Association (GNMA), the Federal National Mortgage Association (FNMA), and the Federal Home Loan Mortgage Corp. (FHLMC). Barclays U.S. Agency Bond Index is a market value-weighted index of U.S. Agency government and investment-grade corporate fixed-rate debt issues. Barclays U.S. Aggregate Bond is a broad-based, market-value-weighted benchmark that measures the performance of the investment grade, U.S. dollar-denominated, fixed-rate taxable bond market. Barclays U.S. Corporate High Yield Bond Index is a market value-weighted index that covers the universe of dollar-denominated, fixed-rate, non-investment grade debt. Barclays U.S. Credit Bond Index is a market value-weighted index of investment-grade corporate fixed-rate debt issues with maturities of one year or more. Barclays U.S. Government Index is a market value-weighted index of U.S. Government fixed-rate debt issues with maturities of one year or more. Barclays Municipal Bond Index is a market value-weighted index of investment-grade municipal bonds with maturities of one year or more. Barclays U.S. Treasury Inflation-Protected Securities (TIPS) Index (Series-L) is a market value-weighted index that measures the performance of inflation-protected securities issued by the U.S. Treasury. Barclays U.S. Treasury Bond Index is a market value-weighted index of public obligations of the U.S. Treasury with maturities of one year or more.
Bloomberg Commodity Index measures the performance of the commodities market. It consists of exchange-traded futures contracts on physical commodities that are weighted to account for the economic significance and market liquidity of each commodity.
The Citigroup G7 Equal Weighted Index is designed to measure the unhedged performance of the government bond markets of Japan, Germany, France, Britain, Italy, and Canada. The index is equal weighted by country. Issues included in the index have fixed-rate coupons and maturities of one year or more.
Dow Jones U.S. Select Real Estate Securities Index is a float-adjusted, market capitalization-weighted index of publicly traded real estate securities, such as real estate investment trusts (REITs) and real estate operating companies (REOCs).
FTSE 100 Index is a market capitalization-weighted index of the 100 most highly capitalized blue chip companies listed on the London Stock Exchange. FTSE National Association of Real Estate Investment Trusts (NAREIT) All REITs Index is a market capitalization-weighted index that is designed to measure the performance of all tax-qualified REITs listed on the NYSE, the American Stock Exchange, or the NASDAQ National Market List. FTSE NAREIT Equity REIT Index is an unmanaged market value-weighted index based on the last closing price of the month for tax-qualified REITs listed on the New York Stock Exchange (NYSE).
The Global Financial Data (GFD) World x/USA Return Index is a multi-country composite index with constituents weighted by relative GDP and stock market capitalizations; it is designed to approximate continuous and comparable world ex-U.S. equity returns from 1919 to 1969. GFD Emerging Markets Index is a composite of various regional EM indices in use before 1987 using a qualitatively selected weighting of constituent countries; it is designed to approximate continuous and comparable EM equity returns from 1920 to 1987.
The IA SBBI U.S. Small Stock Index is a custom index designed to measure the performance of small capitalization U.S. stocks. IA SBBI U.S. Intermediate-Term Government Bond Index is an unweighted index that measures the performance of five-year maturity U.S. Treasury bonds. Each year, a one-bond portfolio containing the shortest non-callable bond having a maturity of not less than five years is constructed. IA SBBI U.S. Long-Term Corporate Bond Index is a custom index designed to measure the performance of long-term U.S. corporate bonds. IA SBBI U.S. 30-Day Treasury Bill Index is an unweighted index that measures the performance of 30-day maturity U.S. Treasury bills.
JPM® EMBI Global Index, and its country sub-indices, total returns for the U.S. dollar-denominated debt instruments issued by Emerging Market sovereign and quasi-sovereign entities, such as Brady bonds, loans, and Eurobonds. JPM® EMBI Global Investment Grade Index, and its country sub-indices, tracks total returns for traded external debt instruments issued by emerging-market sovereign and quasi-sovereign entities rated investment grade. JPM® EMBI Global Investment Grade Index, and its country sub-indices, tracks total returns for traded external debt instruments issued by emerging-market sovereign and quasi-sovereign entities rated speculative grade.

Market Indices (continued)
MSCI® All Country (AC) Europe Index is a market capitalization-weighted index that is designed to measure the equity market performance of Europe; it consists of the following developed and emerging-market country indices: Austria, Belgium, Czech Republic, Denmark, Finland, France, Germany, Greece, Hungary, Ireland, Italy, Netherlands, Norway, Poland, Portugal, Russia, Spain, Sweden, Switzerland, Turkey, and United Kingdom. MSCI All Country World Index (ACWI) is a market capitalization-weighted index that is designed to measure the investable equity market performance for global investors of developed and emerging markets. MSCI Europe Index is a market capitalization-weighted index that is designed to measure the investable equity market performance for global investors of the developed markets in Europe. MSCI North America Index is a market capitalization-weighted index designed to measure the performance of large and mid cap segments of the U.S. and Canada markets. MSCI Pacific ex Japan Index is a market capitalization-weighted index that is designed to measure the equity market performance of four of the five developed market countries in the Pacific region including Australia, Hong Kong, New Zealand and Singapore. MSCI World Index is a market capitalization weighted index that is designed to measure the investable equity market performance for global investors of developed markets. MSCI World ex USA Index is a market capitalization-weighted index designed to measure the equity market performance of developed markets excluding the U.S.
MSCI Emerging Markets (EM) Index is a market capitalization-weighted index that is designed to measure the investable equity market performance for global investors in emerging markets. MSCI EM Asia Index is a market capitalization-weighted index designed to measure equity market performance in Asia. MSCI EM Europe, Middle East, and Africa (EMEA) Index is a market capitalization-weighted index that is designed to measure the investable equity market performance for global investors in the emerging market countries of Europe, the Middle East & Africa. MSCI EM Latin America Index is a market capitalization-weighted index that is designed to measure the investable equity market performance for global investors in the emerging market countries of Latin America. MSCI EM Large Cap Index is composed of those securities in the MSCI EM Index that are defined as large-capitalization stocks.
MSCI Europe, Australasia, Far East Index (EAFE) is a market capitalization-weighted index that is designed to measure the investable equity market performance for global investors in developed markets, excluding the U.S. & Canada. MSCI EAFE Small Cap Index is a market capitalization-weighted index that is designed to measure the investable equity market performance of small cap stocks for global investors in developed markets, excluding the U.S. and Canada.
MSCI Canada Index is a market capitalization-weighted index designed to measure equity market performance in Canada. MSCI China Index is a market capitalization-weighted index designed to measure equity market performance in China. MSCI Japan Index is a market capitalization-weighted index designed to measure equity market performance in Japan. MSCI USA Index is a market capitalization-weighted index designed to measure the equity market performance of the U.S.
MSCI REIT Preferred Index is a preferred stock market capitalization-weighted total return index of certain exchange-traded perpetual preferred securities issued by U.S. Equity and U.S. Hybrid REITs.
Russell 2000® Index is a market capitalization-weighted index designed to measure the performance of the small-cap segment of the U.S. equity market. It includes approximately 2,000 of the smallest securities in the Russell 3000 Index. Russell 3000® Index is a market capitalization-weighted index designed to measure the performance of the 3,000 largest companies in the U.S. equity market. Russell 3000 Growth Index is a market capitalization-weighted index designed to measure the performance of the broad growth segment of the U.S. equity market. It includes those Russell 3000 Index companies with higher price-to-book ratios and higher forecasted growth rates. Russell 3000 Value Index Russell 2500 Value Index is a market capitalization-weighted index designed to measure the performance of the small to mid-cap value segment of the U.S. equity market. It includes those Russell 2500 Index companies with lower price-to-book ratios and lower forecasted growth rates. Russell Midcap® Index is a market capitalization-weighted index designed to measure the performance of the mid-cap segment of the U.S. equity market. It contains approximately 800 of the smallest securities in the Russell 1000 Index.
The S&P 500® Index is a market capitalization-weighted index of 500 common stocks chosen for market size, liquidity, and industry group representation to represent U.S. equity performance. S&P 500 is a registered service mark of The McGraw-Hill Companies, Inc., and has been licensed for use by Fidelity Distributors Corporation and its affiliates. The S&P 500 Total Return Index represents the price changes and reinvested dividends of the S&P 500® Index. The S&P SmallCap 600 is a market capitalization-weighted index of 600 small-capitalization stocks.
Sectors and industries defined by Global Industry Classification Standards (GICS®), except where noted otherwise. S&P 500 sectors are defined as follows: Consumer Discretionary – companies that tend to be the most sensitive to economic cycles. Consumer Staples – companies whose businesses are less sensitive to economic cycles. Energy – companies whose businesses are dominated by either of the following activities: the construction or provision of oil rigs, drilling equipment, and other energy-related services and equipment, including seismic data collection; or the exploration, production, marketing, refining, and/or transportation of oil and gas products, coal, and consumable fuels. Financials – companies involved in activities such as banking, consumer finance, investment banking and brokerage, asset management, insurance and investments, and real estate, including REITs. Health Care – companies in two main industry groups: health care equipment suppliers, manufacturers, and providers of health care services; and companies involved in research, development, production, and marketing of pharmaceuticals and biotechnology products. Industrials – companies whose businesses manufacture and distribute capital goods, provide commercial services and supplies, or provide transportation services. Information Technology – companies in technology software & services and technology hardware & equipment. Materials – companies that are engaged in a wide range of commodity-related manufacturing. Telecommunication Services – companies that provide communications services primarily through fixed-line, cellular, wireless, high bandwidth, and/or fiber-optic cable networks. Utilities – companies considered electric, gas, or water utilities, or companies that operate as independent producers and/or distributors of power.
Appendix: Important Information
58
Market Indices (continued)
Standard & Poor’s/Loan Syndications and Trading Association (S&P/LSTA) Leveraged Performing Loan Index is a market value-weighted index designed to represent the performance of U.S. dollar-denominated institutional leveraged performing loan portfolios (excluding loans in payment default) using current market weightings, spreads and interest payments.
VIX® is the Chicago Board Options Exchange Volatility Index®, a weighted average of prices on S&P 500 Index options with a constant maturity of 30 days to expiration. It is designed to measure the market’s expectation of near-term stock market volatility.
Other Indices
The London Bullion Market Association (LBMA) publishes the international benchmark price of gold in USD, twice daily. A purchasing managers’ index (PMI) is a survey of purchasing managers in a certain economic sector. A PMI over 50 represents expansion of the sector compared to the previous month, while a reading under 50 represents a contraction, and a reading of 50 indicates no change. The Institute for Supply Management ® reports the U.S. manufacturing PMI ®. Markit compiles non-U.S. PMIs. The Core Consumer Price Index (CPI) is a monthly inflationary indicator that measures the change in the cost of a fixed basket of products and services, excluding food and energy prices. The CoreLogic Home Price Index provides a multi-tier market evaluation based on price, time between sales, property type, loan type (conforming vs. nonconforming), and distressed sales. The CoreLogic HPI is a repeat-sales index that tracks increases and decreases in sales prices for the same homes over time, which provides a more accurate "constant-quality” view of pricing trends than basing analysis on all home sales. CoreLogic distressed sales include short sales and REOs. A short sale is typically a sale of real estate in which the sale proceeds fall short of the balance owed on the property’s loan. REO (Real Estate Owned) is property in the possession of a lender usually obtained through a foreclosure. The National Association of REALTORS® Housing Affordability Index is based on the relationship between median home price, median family income and average mortgage interest rate.
Definitions
Correlation coefficient measures the interdependencies of two random variables that range in value from −1 to +1, indicating perfect negative correlation at −1, absence of correlation at 0, and perfect positive correlation at +1.
The Price-to-Earnings (P/E) ratio is the ratio of a company’s current share price to its current earnings, typically trailing 12-months earnings per share. A Forward P/E calculation will typically use an average of analysts’ published estimates of earnings for the next 12 months in the denominator.
Sharpe ratio compares portfolio returns above the risk-free rate relative to overall portfolio volatility. A higher Sharpe ratio implies better risk-adjusted returns.
Standard deviation shows how much variation there is from the average (mean or expected value). A low standard deviation indicates that the data points tend to be very close to the mean, whereas a high standard deviation indicates that the data points are spread out over a large range of values. A higher standard deviation represents greater relative risk.
---
Third-party marks are the property of their respective owners; all other marks are the property of FMR LLC.
If receiving this piece through your relationship with Fidelity Financial Advisor Solutions (FFAS), this publication is provided to investment professionals, plan sponsors, institutional investors, and individual investors by Fidelity Investments Institutional Services Company, Inc.
If receiving this piece through your relationship with Fidelity Personal & Workplace Investing (PWI), Fidelity Family Office Services (FFOS), or Fidelity Institutional Wealth Services (IWS), this publication is provided through Fidelity Brokerage Services LLC, Member NYSE.
If receiving this piece through your relationship with National Financial or Fidelity Capital Markets, this publication is FOR INSTITUTIONAL INVESTOR USE ONLY. Clearing and custody services are provided through National Financial Services LLC, Member NYSE, SIPC.
711110.1.0
© 2015 FMR LLC. All rights reserved.
Appendix: Important Information
59