TK Q3 2011: Teekay Corporation Third Quarter 2011 Earnings Presentation

1
2011 Analyst MeetingFirst Quarter 2011Earnings Conference Call and WebcastApril 28, 2011
David RosenthalVice President Investor Relations & Secretary

2
Cautionary StatementForward-Looking Statements. Outlooks, projections, estimates, targets, business plans, and other statements of future events or conditions in this presentation or the subsequent discussion period are forward-looking statements. Actual future results, including demand growth and mix; ExxonMobil’s own production growth and mix; the amount and mix of capital expenditures; resource additions and recoveries; finding and development costs; project plans, timing, costs, and capacities; revenue enhancements and cost efficiencies; industry margins; margin enhancements and integration benefits; product mix; and the impact of technology could differ materially due to a number of factors. These include changes in long-term oil or gas prices or other market conditions affecting the oil, gas, and petrochemical industries; reservoir performance; timely completion of development projects; war and other political or security disturbances; changes in law or government regulation; the outcome of commercial negotiations; the actions of competitors; unexpected technological developments; the occurrence and duration of economic recessions; unforeseen technical difficulties; and other factors discussed here and under the heading "Factors Affecting Future Results" in the Investors section of our Web site at exxonmobil.com. See also Item 1A of ExxonMobil’s 2010 Form 10-K. Forward-looking statements are based on management’s knowledge and reasonable expectations on the date hereof, and we assume no duty to update these statements as of any future date.
Frequently Used Terms. References to resources, resource base, recoverable resources, and similar terms include quantities of oil and gas that are not yet classified as proved reserves but that we believe will likely be moved into the proved reserves category and produced in the future. For definitions of, and information regarding, reserves, return on average capital employed, normalized earnings, cash flow from operations and asset sales, and other terms used in this presentation, including information required by SEC Regulation G, see the "Frequently Used Terms" posted on the Investors section of our Web site. The Financial and Operating Review on our Web site also shows ExxonMobil's net interest in specific projects.

3
Business EnvironmentGlobal economy and energy markets influenced by political unrest and economic uncertainty
Global economic recovery impacted by sovereign debt concerns, inflationary pressures, and Japan
Energy markets experiencing uncertainty with political unrest
Significantly higher oil prices; increased natural gas prices outside U.S.
Improved refining margins in the U.S. and Asia Pacific
Stronger chemical margins, especially commodities in U.S. and Europe

4
1Q11 Financial ResultsDelivered superior results and demonstrated financial capacity by funding investment plan and distributing cash to shareholders
Billions of dollars unless specified otherwise
$18.2 Cash Flow from Operations
$15.9 Debt
$13.2 Cash Balance
$7.8 CAPEX
$7.2 Shareholder Distributions
$2.14Earnings Per Share – Diluted (dollars)
$10.7Earnings (effective tax rate of 47%)
Note: earnings exclude special items, if applicable. See IR supplement for Non-GAAP reconciliations.Note: cash flow from operations includes asset sales of $1.3B.Note: cash balance includes restricted cash of $401M.

5
1Q11 Sources and Uses of Cash
$Billion
$0.8Additional Financing / Other
($7.2)Shareholder Distributions
$1.3Asset Sales
$13.2 Ending Cash Balance
($7.1)Additions to PP&E
$2.4Working Capital / Other
$3.8Depreciation
$10.7Earnings
$8.5 Beginning Cash Balance
Superior cash generation provides ability to fund robust projects, return cash to shareholders, and maintain financial flexibility
Note: earnings exclude special items, if applicable. See IR supplement for Non-GAAP reconciliations.Note: beginning and ending cash balances include restricted cash of $628M and $401M, respectively.
$18.2B
6
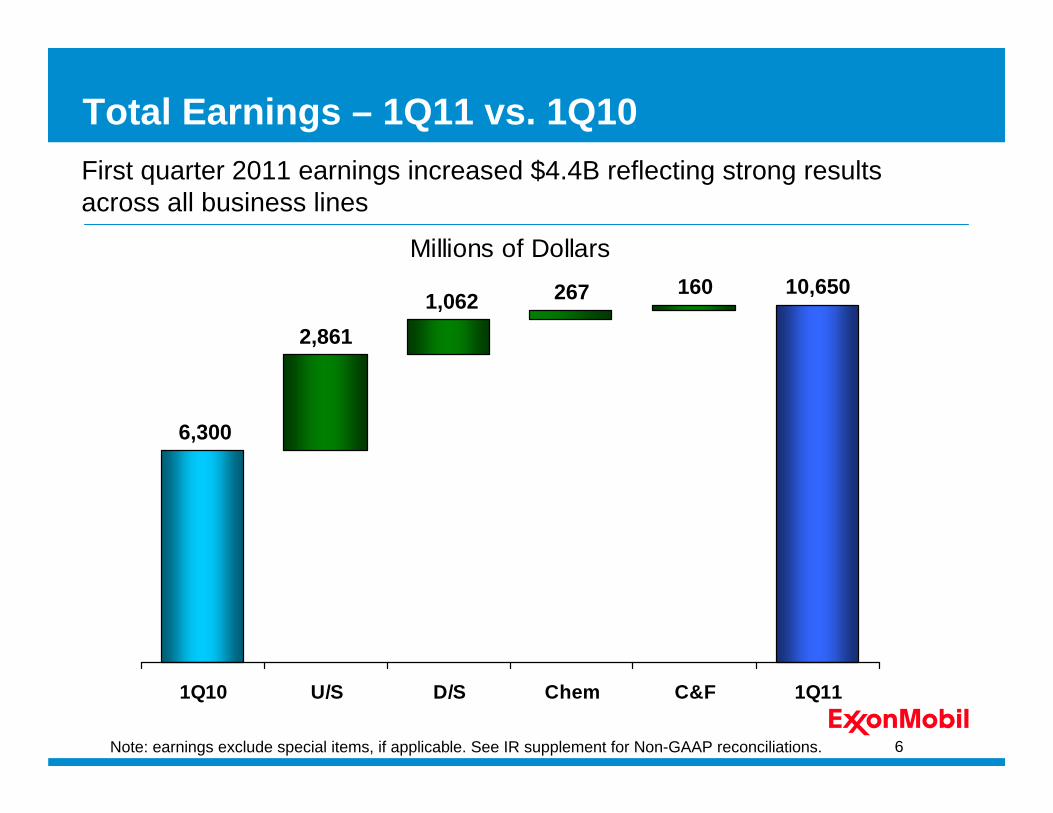
Total Earnings – 1Q11 vs. 1Q10First quarter 2011 earnings increased $4.4B reflecting strong results across all business lines
Millions of Dollars
1Q10 U/S D/S Chem C&F 1Q11
6,300
10,650
2,861
2671,062 160
Note: earnings exclude special items, if applicable. See IR supplement for Non-GAAP reconciliations.

7
Total Earnings – 1Q11 vs. 4Q10Sequential earnings remain robust, increasing $1.4B, reflecting stronger prices and chemical margins
Millions of Dollars
4Q10 U/S D/S Chem C&F 1Q11
9,250
10,6501,195 449(51) (193)
Note: earnings exclude special items, if applicable. See IR supplement for Non-GAAP reconciliations.

8
Iraq West Qurna I
Current production about 320 kbd gross
Day-to-day operations transferred to Field Operating Division• Staffed by ExxonMobil and
South Oil Company
Three rigs currently drilling
Achieved improved production target, increasing volumes ten percent above initial field production
West Qurna Phase I Drilling Rig
Upstream

9
Deepwater
ExxonMobil commenced drilling within several days of receiving permit approval
Evaluation of Hadrian North oil complex is ongoing
MWCC initial system operational; membership has grown to ten
Awarded 3 new production licenses
Hadrian-5 exploration well commenced drilling; awarded 3 new production licenses in Norway
Maersk Developer Drilling Rig
Upstream
U.S. Gulf of Mexico
Norway

10
Indonesia
Kedung Keris well discovered second onshore oil field on Cepu block• Close proximity to Banyu Urip
development
Evaluating Barito Basin coal bed methane gas resource
Confirming resource potential with conventional by-the-bit oil discovery and coal bed methane evaluation drilling
Rig drilling Kedung Keris well
Upstream

11
Earnings – 1Q11 vs. 1Q10Earnings increased $2.9B with stronger crude oil and natural gasrealizations. Upstream earnings per barrel were $20.
Millions of Dollars
1Q10 Realization Vol/Mix Other 1Q11
5,814
8,6752,550 (160) 470
Note: earnings exclude special items, if applicable. See IR supplement for Non-GAAP reconciliations.
Upstream

12
Volumes – 1Q11 vs. 1Q10Volumes increased 10.5%: liquids -15 KBD, natural gas +2,836 MCFD
KOEBD
1Q10 Entitlements Quotas Divestments Net Growth 1Q11
4,3624,820
(65) 29 (35)529
Upstream

13
Earnings – 1Q11 vs. 4Q10Sequential earnings increased $1.2B driven primarily by stronger crude oil and natural gas realizations
Millions of Dollars
4Q10 Realization Vol/Mix Other 1Q11
7,480
8,6751,310 410
Note: earnings exclude special items, if applicable. See IR supplement for Non-GAAP reconciliations.
Upstream
(520)

14
Volumes – 1Q11 vs. 4Q10Volumes decreased 3%: liquids -127 KBD, natural gas -127 MCFD
KOEBD
4Q10 Entitlements Quotas Divestments Net Growth 1Q11
4,968 4,820(91) 16 (25) (48)
Upstream

15
Mobil 1 Technology Partnership
Continue to provide Mobil 1 lubricant technology and engineering to Formula 1 racing
Enhance Mobil 1 leading-edge performance and apply learnings from use in extreme conditions
Supply a range of specialized lubricant products for use at the McLaren Technology Center
New agreement with Vodafone McLaren Mercedes maintains longest, continuous oil company sponsorship of a Grand Prix race team
Downstream
New Photo Needed

16
Earnings – 1Q11 vs. 1Q10
Millions of Dollars
1Q10 Margin Vol/Mix Other 1Q11
37
1,099
470
350
240
Earnings increased $1.1B with improved industry refining margins, refining optimization, and favorable foreign exchange effects
Note: earnings exclude special items, if applicable. See IR supplement for Non-GAAP reconciliations.
Downstream

17
Earnings – 1Q11 vs. 4Q10Sequential earnings were essentially flat as higher industry refining margins were offset by higher turnaround maintenance effects
Millions of Dollars
4Q10 Margin Vol/Mix Other 1Q11
1,1501,099
160 (270)
60
Note: earnings exclude special items, if applicable. See IR supplement for Non-GAAP reconciliations.
Downstream

18
New 220,000 ft2 facility equipped with 200+ processing machines and analytical instruments
STC has 22 development-scale and 16 commercial-scale product processing machines
China is largest petrochemical market, representing 1/3 of global growth through 2020
Opened world-class Shanghai Technology Center (STC), supporting the growing needs of ExxonMobil customers
Supporting Asia GrowthChemical
Shanghai Technology Center

19
Saudi Elastomers Project
JV elastomers project has moved into front end engineering and design
Project will supply 400 KTA of synthetic rubber, thermoplastic specialty polymers, and carbon black to international markets
Jubail Industrial City selected as project site
Continuing long history of investment in Saudi Arabia and building on strong relationship with SABIC
KEMYA JV Chemical Plant
Chemical

20
Earnings – 1Q11 vs. 1Q10Record quarterly earnings of $1.5B, an increase of $267M from 1Q10, driven by strong chemicals margins and feedstock advantage
Millions of Dollars
1Q10 Margin Vol/Mix Other 1Q11
1,249
1,516
470 0 (200)
Note: earnings exclude special items, if applicable. See IR supplement for Non-GAAP reconciliations.
Chemical

21
Earnings – 1Q11 vs. 4Q10Earnings increased $449M due to higher commodity chemicals margins and lower planned maintenance expense
Millions of Dollars
4Q10 Margin Vol/Mix Other 1Q11
1,067
1,516340 10
100
Note: earnings exclude special items, if applicable. See IR supplement for Non-GAAP reconciliations.
Chemical

22
Downstream & Chemical Earnings – 1Q11 vs. 1Q10Strong Downstream and Chemical earnings, reflecting competitive advantages and strength of integrated business model
Millions of Dollars
1Q10 Margin Vol/Mix Other 1Q11
1,286
2,615
940
350 40
Note: earnings exclude special items, if applicable. See IR supplement for Non-GAAP reconciliations.
Integration

23
SummaryExxonMobil’s strong financial and operating performance reflects value of integrated business model and competitive advantages
ExxonMobil possesses unique competitive advantages that create long-term shareholder value
• Operational excellence
• Disciplined investing
• Unparalleled portfolio quality
• High-impact technologies
• Global integration
$7.2 BillionShareholder Distributions
$18.2 BillionCash Flow from Ops
+10.5% growth (vs.
1Q10)
Upstream Volume Growth
$10.7 BillionEarnings
Note: earnings exclude special items, if applicable. See IR supplement for Non-GAAP reconciliations.Note: cash flow from operations includes asset sales of $1.3B.

24
Questions and AnswersQuestions and Answers