First Order Draft (FOD) IPCC WG III AR5 · This chapter has been allocated 40 template pages,...
100
First Order Draft (FOD) IPCC WG III AR5 Do Not Cite, Quote or Distribute 1 of 100 Chapter 8 WGIII_AR5_Draft1_Ch08_final2.doc 19 July 2012 Chapter: 8 Title: Transport (Sub)Section: All Author(s): CLAs: Ralph Sims, Roberto Schaeffer LAs: Felix Creutzig, Xochitl Cruz‐Núñez, Marcio D’Agosto, Delia Dimitriu, Maria Josefina Figueroa, Lew Fulton, Mariajo Meza, Shigeki Kobayashi, Alan McKinnon, Peter Newman, Minggao Ouyang, Jamie Schauer, Koba Shige, Dan Sperling, Geetam Tiwari CAs: Adjo Amekudzi, Bruno Borba, Helena Chum, Phillippe LeRouic Crist, Han Hao, Oliver Lah, Richard Plevin, Steve Plotkin, Robert Sausen Remarks: First Order Draft (FOD) Version: 1 File name: WGIII_AR5_Draft1_Ch08 Date: 19 July 2012 Template Version: 3 1 2 Table of changes No Date Version Place Description Editor 1 1.7.12 01 Compiled from the separate sections. Zotero references not complete Ralph 3 4 5 6 7 8 Comment on text by TSU to reviewers This chapter has been allocated 40 template pages, currently it counts 65 pages (excluding this page and the bibliography), so it is 25 pages over target. Reviewers are kindly asked to indicate where the chapter could be shortened. Colour code used Turquoise highlights are inserted comments from Authors or TSU i.e. [AUTHORS/TSU: ….] 9
Transcript of First Order Draft (FOD) IPCC WG III AR5 · This chapter has been allocated 40 template pages,...

First Order Draft (FOD) IPCC WG III AR5
Do Not Cite, Quote or Distribute 1 of 100 Chapter 8 WGIII_AR5_Draft1_Ch08_final2.doc 19 July 2012
Chapter: 8
Title: Transport
(Sub)Section: All
Author(s): CLAs: Ralph Sims, Roberto Schaeffer
LAs: Felix Creutzig, Xochitl Cruz‐Núñez, Marcio D’Agosto, Delia Dimitriu, Maria Josefina Figueroa, Lew Fulton, Mariajo Meza, Shigeki Kobayashi, Alan McKinnon, Peter Newman, Minggao Ouyang, Jamie Schauer, Koba Shige, Dan Sperling, Geetam Tiwari
CAs: Adjo Amekudzi, Bruno Borba, Helena Chum, Phillippe LeRouic Crist, Han Hao, Oliver Lah, Richard Plevin, Steve Plotkin, Robert Sausen
Remarks: First Order Draft (FOD)
Version: 1
File name: WGIII_AR5_Draft1_Ch08
Date: 19 July 2012 Template Version: 3
1
2 Table of changes
No Date Version Place Description Editor
1 1.7.12 01 Compiled from the separate sections.
Zotero references not complete
Ralph
3
4
5 6 7
8
Comment on text by TSU to reviewers
This chapter has been allocated 40 template pages, currently it counts 65 pages (excluding this page and the bibliography), so it is 25 pages over target. Reviewers are kindly asked to indicate where the chapter could be shortened.
Colour code used
Turquoise highlights are inserted comments from Authors or TSU i.e. [AUTHORS/TSU: ….] 9
First Order Draft (FOD) IPCC WG III AR5
Do Not Cite, Quote or Distribute 2 of 100 Chapter 8 WGIII_AR5_Draft1_Ch08_final2.doc 19 July 2012
Chapter 8: Transport 1
2
3
4
5
6
7
8
9
10
11
12
13
14
15
16
17
18
19
20
21
22
23
24
25
26
27
28
29
30
31
32
33
Contents
Chapter 8: Transport...............................................................................................................................2
Executive Summary.............................................................................................................................5
8.1 Freight and passenger transport (land, air, sea and water) .........................................................8
8.1.1 Context...................................................................................................................................8
8.1.2 Passenger and freight transport energy demand by mode.................................................11
8.1.3 Direct and indirect GHG emissions by mode .......................................................................12
8.2 New developments in emission trends and drivers....................................................................13
8.2.1 CO2 emissions.......................................................................................................................13
8.2.1.1 Drivers ...........................................................................................................................13
8.2.1.2 Trends by transport sector............................................................................................15
8.2.2 Non‐CO2 greenhouse gases, black carbon and aerosols......................................................15
8.2.2.1 Drivers ...........................................................................................................................16
8.2.2.2 Trends by Sector ...........................................................................................................16
8.3 Mitigation technology options, practices and behavioural aspects ...........................................17
8.3.1 Incremental vehicle technologies ........................................................................................17
8.3.1.1 LDV drive‐trains.............................................................................................................17
8.3.1.2 LDV load reduction........................................................................................................17
8.3.1.3 Medium and heavy‐duty vehicles .................................................................................18
8.3.1.4 Rail.................................................................................................................................18
8.3.1.5 Shipping.........................................................................................................................19
8.3.1.6 Air..................................................................................................................................19
8.3.2 New propulsion systems......................................................................................................20
8.3.2.1 Electric‐drive road vehicles ...........................................................................................20
8.3.2.2 Fuel cell vehicles ...........................................................................................................21
8.3.2.3 Advanced propulsion technologies for rail, ships and aircraft .....................................21
8.3.3 Fuel options..........................................................................................................................22
8.3.3.1 Natural gas and LPG......................................................................................................22
8.3.3.2 Electricity.......................................................................................................................22
8.3.3.3 Hydrogen....................................................................................................................... 23
8.3.3.4 Biofuels..........................................................................................................................23
8.3.4 Comparative analysis ...........................................................................................................24
First Order Draft (FOD) IPCC WG III AR5
Do Not Cite, Quote or Distribute 3 of 100 Chapter 8 WGIII_AR5_Draft1_Ch08_final2.doc 19 July 2012
8.3.5 Behavioural aspects .............................................................................................................25 1
2
3
4
5
6
7
8
9
10
11
12
13
14
15
16
17
18
19
20
21
22
23
24
25
26
27
28
29
30
31
32
33
34
35
8.4 Infrastructure and systemic perspectives...................................................................................27
8.4.1 Path dependencies of transport infrastructures .................................................................27
8.4.1.1 Globalization, infrastructure and structural change.....................................................27
8.4.1.2 GHG emissions impacts of transport infrastructure .....................................................27
8.4.1.3 Infrastructure and system management in aviation and shipping...............................28
8.4.2 Path dependencies of urban form and mobility ..................................................................28
8.4.2.1 Automobile dependence and automobility ..................................................................29
8.4.2.2 Urban form and GHG emissions ...................................................................................29
8.4.2.3 Modal shift opportunities for passengers.....................................................................30
8.4.2.4 Modal shift opportunities for freight............................................................................31
8.5 Climate change feedback and interaction with adaptation........................................................33
8.5.1 Accessibility and feasibility of transport routes...................................................................33
8.5.2 Relocation of production, international trade and global supply chains ............................34
8.5.3 Urban form and infrastructure ............................................................................................34
8.5.4 Fuel combustion and technologies ......................................................................................35
8.6 Costs and potentials....................................................................................................................35
8.6.1 Activity effect component – demand reduction..................................................................35
8.6.2 Structure effect component – modal shift ..........................................................................36
8.6.3 Energy intensity effect component......................................................................................37
8.6.4 Carbon intensity effect component .....................................................................................39
8.7 Co‐benefits, risks and spill‐overs ................................................................................................40
8.7.1 Socio economic effects ........................................................................................................40
8.7.1.1 Congestion ....................................................................................................................41
8.7.1.2 Public health .................................................................................................................41
8.7.1.3 Traffic accidents ............................................................................................................41
8.7.1.4 Public space and barrier‐free movement .....................................................................41
8.7.2 Climate change mitigation as a co‐benefit ..........................................................................42
8.7.3 Environmental and health effects........................................................................................42
8.7.4 Technological risks ...............................................................................................................42
8.7.5 Public perceptions................................................................................................................43
8.8 Barriers and opportunities..........................................................................................................44
8.8.1 Barriers and opportunities to reduce GHGs by technologies and practices........................44
8.8.2 Financing low carbon transport ...........................................................................................51
8.8.3 Institutional, cultural and legal aspects of low carbon transport........................................51

First Order Draft (FOD) IPCC WG III AR5
Do Not Cite, Quote or Distribute 4 of 100 Chapter 8 WGIII_AR5_Draft1_Ch08_final2.doc 19 July 2012
8.9 Sectoral implication of transformation pathways and sustainable development......................52 1
2
3
4
5
6 7
8
9
10
11
12
13
14
15
16
17
8.9.1 Sectoral transformations and the long term stabilization goals..........................................52
8.9.2 Sectoral transformational pathways‐ implications from a bottom up perspective ............55
8.9.2.1 Technologies, fuels and infrastructures........................................................................55
8.9.2.2 Transformational possibilities.......................................................................................56
8.9.3 Sustainable development, and regional and national implications for developing countries............................................................................................................................................57
8.10 Sectoral policies ........................................................................................................................58
8.10.1 Road transport ...................................................................................................................59
8.10.2 Rail transport .....................................................................................................................61
8.10.3 Marine transport................................................................................................................62
8.10.4 Aviation ..............................................................................................................................62
8.10.5 Infrastructure and urban planning.....................................................................................62
8.10.6 Mobility access and sustainable development ..................................................................63
8.11 Gaps in knowledge and data.....................................................................................................66
8.12 Frequently asked questions ......................................................................................................66
References ........................................................................................................................................67

First Order Draft (FOD) IPCC WG III AR5
Do Not Cite, Quote or Distribute 5 of 100 Chapter 8 WGIII_AR5_Draft1_Ch08_final2.doc 19 July 2012
Executive Summary 1
2 3 4
5 6 7 8 9
10 11 12 13
14
1516 17
1819 20
21
32 33 34 35
36 37 38 39 40 41
42 43 44
45 46 47
Transport’s 6.4 Gt CO2 of direct emissions in 2010 could double by 2035 at continued current rates of growth to then represent a significantly higher share of global energy‐related CO2 emissions. [High agreement; robust evidence].
Transport has continued to increase its total annual GHG emissions in spite of new and improved technologies becoming available and more policies being deployed since the 2007 IPCC 4th Assessment Report (AR4). The road, rail, marine and aviation transport sub‐sectors that move both freight and passengers, together, contributed over 22% of global energy‐related CO2 emissions in 2010, and were also major emitters of black carbon and aerosols. [8.1]
Demand for mobility is expected to continue to increase under business as usual in all regions. In many OECD countries, increases in transport demand and related GHG emissions can potentially be slowed and reversed, whereas in many developing countries improving transport accessibility is essential for sustainable development.
Transport mitigation measures for both freight and passenger transport can be achieved by:
a) deploying new technologies for low‐carbon fuels, gaining energy efficiency improvements from vehicle and engine designs, and improving the overall performance of the transport sub‐sector systems, and
b) making behavioural and structural changes (including urban form) leading to modal shift and the reduced need for motorized transport relative to a reference case. [High agreement; robust evidence]
Transport mitigation options for reducing energy‐related CO2‐eq emissions can be categorized into: a) Supply‐side ‐ reducing carbon intensity of the fuels (CO2‐eq/MJ) as well as lowering energy 22 intensity (MJ/km) by enhancing vehicle and system performance and infrastructure. Fuel switching 23 (such as to compressed natural gas (CNG)) can also help reduce emissions. New technologies, 24 supported by appropriate policies [8.10], are capable of cutting energy demand, and hence related 25 CO2 and other emissions, across all transport sub‐sectors. Reduced energy intensity can result from 26 improved designs of internal combustion engines, power trains and vehicles, including the use of 27 new lightweight materials and better aerodynamics. In the longer‐term, new propulsion systems 28 (such as battery electric and hydrogen fuel cell drive‐trains) coupled with low‐CO2 energy carriers 29 (electricity, methane and hydrogen produced from low GHG sources), are likely to play an increasing 30 role. 31
Conventional and advanced biofuels (including “drop‐in” fuels such as iso‐butanol) could gain an increased share of transport fuels, particularly for aircraft and ships, but variations in their mitigation potentials exist, as shown by life‐cycle analyses that include sustainable production and land use change issues. [8.3]
b) Demand‐side ‐ increasing the shares of less‐carbon intensive modes (structure), such as cycling, walking and mass transit, as well as rail or waterways for freight, and reducing travel activity (number of journeys (km or t‐km)). Such behavioural changes can possibly be achieved through price signals but since costs of transport tend to be relatively inelastic, regulations and/or education (including modal choice, convenience, time savings and journey avoidance opportunities) may also be needed. [8.3, 8.9]
Short term and cost effective mitigation strategies from the transport sector include fuel economy measures, reduction of black carbon emissions, and changes in other short‐lived climate forcing agents. [Medium agreement; medium evidence]
The potential is substantial for reducing GHG emissions in the transport sector, in both short and long terms, and at relatively low mitigation costs ($/t CO2). Incremental developments can lower total transport energy demand as well as reduce local and global atmospheric emissions in a cost

First Order Draft (FOD) IPCC WG III AR5
Do Not Cite, Quote or Distribute 6 of 100 Chapter 8 WGIII_AR5_Draft1_Ch08_final2.doc 19 July 2012
effective manner and without compromising economic development. In the near‐term, technology improvements to reduce energy intensity tend to be cost‐effective and will likely dominate mitigation actions in all regions. [8.6]
1 2 3
4 5 6 7 8 9
10 11 12 13 14 15
16 17 18 19 20
21 22 23 24 25
26 27 28 29 30 31 32
33 34 35 36 37 38
39 40 41 42 43
44 45 46 47
Non‐CO2 transport emissions can produce both positive and negative forcings, leading to several mitigation pathways that focus on reduction of emissions and/or pollutants. Short term reduction of positive climate forcing agents is primarily associated with the reduction of black carbon emissions through engine retrofits and improved maintenance. Methane and nitrous oxide vehicle tailpipe emissions reductions are technically possible and high‐altitude emissions from aviation can be reduced, including ozone and moisture. [8.2]
Developing innovative and improved transport technologies will require RD&D investment but also expenditure on infrastructure, such as high‐speed rail networks, public recharging points for electric vehicles, cycle lanes and bus rapid transport systems. [8.4] In addition to the investment costs for innovative technological options, the full pathway‐related costs should be accounted for. [8.6] Technologies may be advantaged where they provide transitional steps. For example, plug‐in hybrid electric vehicles can be an interim step towards full electrification of urban road transport. [8.3]
World regions with existing and mature transport infrastructures in place may find mitigation options through improving technologies easier to implement than changing travel patterns, whereas regions with rapidly developing infrastructures are more dynamic in terms of travel demand and modal choice and hence may have greater flexibility in their mitigation opportunities. [Medium agreement; medium evidence]
Accounting for GHG emission reductions from modal choice, system operation and behaviour can be applied to all modes of transport in all regions. The potential contribution from behavioural change is difficult to quantify since it is likely to vary significantly between regions and could be constrained by lack of social acceptance. There are also major regional differences in available technologies and fuel mixes. [8.3]
The interaction between transport in built‐environments and land‐use can evolve over medium‐ and long‐term time scales with opportunities existing to reduce the GHG intensity from infrastructural developments. Intelligent land‐use policies (such as facilitation of growth in city centres rather than urban fringes) may be as important as technological developments. However, there are regional differences. Generalised transport costs, oil price trends relative to average income, and price instruments on GHG emissions from transport activities could shape transport demand growth, modal shares and urban form in cities at both the local and global scales. [8.4]
Transport could be impacted by climate change feedbacks, both positively and negatively. Positive mode transport change (e.g. from private vehicles to light‐rail) could be facilitated in some regions. Elsewhere, reliable transport of freight and people according to scheduled timetables could become more challenging. Adaptation can also have both positive and negative effects, such as shorter shipping routes due to reduced Arctic ice resulting in lower fuel demand but at the same time producing local air pollutants in Polar regions. [8.5]
Optimal mitigation packages, and barriers to their implementation in the short to medium terms, differ between world regions due to variations in local transport demand depending upon the stage of economic development, the modal choices available, types and age of vehicle fleets, available fuels, existing infrastructure and investment constraints. [High agreement; medium evidence]
A long‐term transformational pathway for the global transport sector should meet multiple objectives for climate and sustainable development. However, separate transformative trajectories need to be explored for OECD countries, economies in transition and non‐OECD countries due to their distinct differences between GHG mitigation, mobility and accessibility objectives. [8.9]

First Order Draft (FOD) IPCC WG III AR5
Do Not Cite, Quote or Distribute 7 of 100 Chapter 8 WGIII_AR5_Draft1_Ch08_final2.doc 19 July 2012
Barriers to the deployment of improved technologies and practices exist. However, these can be overcome to provide opportunities for those regions, nations and cities willing to make low‐carbon transport a priority. Increasing demand for mobility has historically been associated with increasing wealth of a nation. However, the early signs of decoupling fossil fuel‐based mobility from economic development may be appearing in some OECD countries. Significantly lower increases in road travel demand are also occurring in several non‐OECD countries that have put less emphasis on mobility as they develop. [8.8]
1 2 3 4 5 6 7
8 9
10
11 12 13 14 15 16 17
18 19 20 21
The co‐benefits arising from mitigation actions in the transport sector may exceed the costs of implementing those actions, as well as significantly contributing to sustainable development. [High agreement; robust evidence]
Reducing GHG emissions can often be achieved as a co‐benefit when addressing other non‐climate policies such as travel cost savings, travel safety, improved health, reduced traffic congestion, local air pollution, healthy cities and energy security. The risks of technology failure in the transport sector due to technical and social factors, as well as the potential for environmental degradation, need to be included in any analysis of the potential for mitigation strategies and their viability. Technology and non‐technology mitigation choices are often based on the optimisation of risk and uncertainty with potential benefits resulting from both short‐ and long‐term measures. [8.7]
Many examples exist of transport policies at the international, national, state, regional and local levels that have successfully reduced fuel demand and related GHG emissions. Several policies have also been implemented to primarily meet other objectives such as avoiding road traffic congestion or minimising local air pollution, with climate change mitigation seen as a co‐benefit. [8.10]

First Order Draft (FOD) IPCC WG III AR5
Do Not Cite, Quote or Distribute 8 of 100 Chapter 8 WGIII_AR5_Draft1_Ch08_final2.doc 19 July 2012
8.1 Freight and passenger transport (land, air, sea and water) 1
Human welfare, food supplies, trade, and economic development all rely on the transport sector. As world population increases and standards of living improve, the demand for reliable, safe and affordable transport services continues to increase, with associated problems of local air pollution, increased dependence on oil products, traffic congestion, and higher greenhouse gas (GHG) emissions. The movement of an item of freight or a person from a starting location to a new place can involve one or more transport modes including walking, cycling, road vehicles, trains, boats and aircraft. Each requires energy inputs that usually result in GHG emissions.
2 3 4 5 6 7 8
9 10 11 12 13 14 15 16 17
19 20 21 22 23
The transport sector has the potential to improve end‐use efficiencies, infrastructure and to decarbonize its energy supply at relatively low mitigation costs and with significant co‐benefits. Mitigation can also be achieved by reducing demands for specific journeys or movement of freight, although the projected world growth in transport will make the transition to a low‐carbon economy more challenging and may strongly influence the overall costs of the transition. Most integrated assessments predict mitigation of the sector may prove challenging without stringent strategies being put in place that consider social acceptability and behavioural impacts. Depending upon technology developments, future transport end‐use demands could overlap to a greater extent with electricity supply systems.
8.1.1 Context 18 The energy demand of the global transport sector in 2009 was 95.9 EJ, approximately 27.4% of total final energy consumption, compared to a 25.0% share in 1990 (IEA, 2011a). This is less than the buildings sector but similar to industry. Direct emissions from the transport sector were 6.4 Gt CO2, about 14% of total GHG emissions (Chapter 5), 22% of total global energy‐related CO2 emissions (IEA, 2011a), but with wide regional variations (Figs. 8.1.1.a and 8.1.1.b).
24
25 26 27
Figure 8.1.1.a. Transport sector shares of total energy-related CO2 emissions by region tended to increase during the period 1971-1998 as GDP / capita increased. Adapted from: (Schäfer et al., 2009; Bongardt et al., 2011).

First Order Draft (FOD) IPCC WG III AR5
Do Not Cite, Quote or Distribute 9 of 100 Chapter 8 WGIII_AR5_Draft1_Ch08_final2.doc 19 July 2012
1
2
3 4 5 6
Figure 8.1.1.b. GHG emissions from transport sub-sectors by region in 1970, 1990 and 2008.
Chapter 5 of the IPCC 4th Assessment Report (AR4) “Mitigation for Climate Change” (IPCC, 2007) showed that GHG emissions from transport had increased at a faster rate than any other energy end‐use sector, with about three quarters of these emissions coming from road vehicles (Fig. 8.1.2.a).
7
8
9
Figure 8.1.2.a. Global transport GHG emissions by sub-sector from 1970 – 2008.
“Other” = international shipping (6.8% of total) and international aviation (8.2% of total).

First Order Draft (FOD) IPCC WG III AR5
Do Not Cite, Quote or Distribute 10 of 100 Chapter 8 WGIII_AR5_Draft1_Ch08_final2.doc 19 July 2012
Freight transport had grown more rapidly than passenger transport, mainly through the use of heavy duty vehicles (HDVs) in urban regions and ships for international movement of freight. The AR4 concluded that major technological advances and strong policies will be required to achieve a significant overall reduction in transport GHG emissions as demand was projected to continue to grow strongly. It also stated that local, national and regional conditions vary widely which can influence by how much public transport systems, related infrastructure, shifting to lower energy intensive transport modes, and acceptance of non‐motorised transport options, can contribute to GHG mitigation.
1 2 3 4 5 6 7 8
9 10 11 12 13 14 15 16 17 18 19
20 21 22 23 24 25
26 27 28 29 30 31 32 33 34 35
36 37 38 39 40 41 42 43 44 45 46 47 48 49
Sustainable transport arises from the concept of sustainable development, thereby creating a sectoral reference necessary for practical implementation and assessment. A sustainable mobility system allows accessibility to basic daily needs consistent with human and ecosystem health, decouples dependence on oil, constrains GHG emissions, and attends to the affordability, equity and efficiency of the system with fairness between and within generations (CST, 2002; ECMT, 2004; Bongardt et al., 2011; E C Environment, 2011). Mobility can be seen as a throughput cost whereas accessibility is a benefit obtained through mobility (Geurs & van Wee, 2004; (Zegras, 2011). Diminishing the capital depletion implied by mobility can be achieved by making the best use of transport technologies to achieve efficiency objectives, demand‐side management through pricing and regulations, integrated land use and transport planning, and targeting personal information for public awareness and acceptance (Banister, 2008).
Many countries and cities use a broad range of indicators to measure performance and assessing progress toward the goals of transport sustainability and climate mitigation (WBCSD, 2004); (Hall, 2006) (Dalkmann and Brannigan, 2007) (Joumard and Gudmundsson, 2010) (Kane, 2010)(Litman, 2007) (Ramani et al., 2011). Systemic goals for sustainable mobility, climate and energy security (see Section 8.7) can help operationalize the more general sustainability principles into a concrete set of interconnected goals (Khan Ribeiro, S. et al., 2012)
A system‐based framework of indicators for sustainable mobility is part of a cross cutting effort within the AR5 to help guide the identification of drivers for change at different levels of decision making including future energy supply security, climate change mitigation, synergistic interactions between policy components, performance and objectives, and co‐benefits such as improved air quality and health (8.2). This chapter then identifies technological and behavioural mitigation options (8.3) along with infrastructure perspectives (8.4 linked with Chapter 12) and climate change feedback and adaptation (8.5). Costs and potentials (8.6), co‐benefits, risks and social acceptability (8.7), barriers and opportunities (8.8), transformation pathways (8.9) and policies (8.10) are also discussed. This chapter distinguishes between mitigation options arising from a focused, often technological perspective, and those arising explicitly from a sustainable transport perspective.
GHG emissions for each mode of transport can be decomposed into the three main factors, carbon intensity (CO2eq/MJ), energy intensity (MJ/km), and activity (km/capita) (Fig. 8.1.2.b) (see, for example, (Bongardt et al., 2011; Creutzig et al., 2011). Energy intensity and activity level are directly related to modal choice. Different transport fuels (energy carriers) have varying carbon intensities that often impact on energy intensity and sometimes even on activity. Mitigation options therefore include the reduction of carbon intensity for specific fuels, fuel switching, decreasing the energy intensity of specific modes, and switching to more energy efficient modes, thereby reducing the shares of less efficient modes. Technological options mostly focus on carbon intensity and energy intensity whereas sustainable transport options, including behaviour, tend to focus more on activity and structure. Indirect GHG emissions, (not shown in Fig. 8.1.2.b) such as those upstream associated with the production of fuels as well as the effects of infrastructure, are also discussed in this chapter in order to give a comprehensive picture. Interactions between the three emission factors (such as the deployment of electric vehicles impacting on behaviour) and regional differences are also included in this assessment.

First Order Draft (FOD) IPCC WG III AR5
Do Not Cite, Quote or Distribute 11 of 100 Chapter 8 WGIII_AR5_Draft1_Ch08_final2.doc 19 July 2012
1
2 3 4 5 6
8 9
10 11 12 13
Figure 8.1.2.b. Direct GHG emissions in the transport sector for each modal choice and fuel type can be decomposed into Activity (number and distance of passenger journeys or freight movements); Structure (shares of total travel by each mode); Intensity (specific energy input /km for each mode and vehicle choice); and Fuel carbon intensity (specific for each fuel and including non-CO2 GHG emissions).
8.1.2 Passenger and freight transport energy demand by mode 7 Over 60% of global primary oil consumption in 2009 was used to meet 94% of total transport energy use, with biofuels supplying approximately 2%, electricity 1%, and natural gas and other fuels 3%. Light duty vehicles (LDVs) had a 42% share of total transport energy demand, with HDVs 23%, aviation 11% and transport via rail, marine, other road options and pipelines, plus agriculture and construction machinery, the remaining 25% (IEA, 2010a). Passenger shares of total transport demand are greater than for freight (Fig 8.1.3).
14
15 16 17
18 19 20 21 22
23 24 25 26 27 28 29 30
Figure 8.1.3 Indicative shares of total transport energy demand for freight and passenger by mode. (Based on (ITF, 2005, 2011; IMO, 2009; UNCTAD, 2010; Newman and Kenworthy, 2011; UIC, 2011;(IEA, 2010a) ICAO, 2010).
Although data are uncertain, freight movement is dominated by road transport, currently carrying around 5,100 bn t‐km per year (ITF, 2011) with rail moving around 350 bn t‐km annually (UIC, 2011) and air ~140 bn t‐km (ICAO, 2010). International and coastal shipping transported around 7.8 bn t in 2009 but over unknown average distances (UNCTAD, 2010) and a further 1‐2 bn t was transported on inland waterways (IMO, 2009)1. Pipelines carry about 10% of the global freight t‐km (ITF, 2005).
Total world LDV stock increased from around 250 million in 1970 to 980 million in 2009. LDV ownership in 2009 was around 828 vehicles/1000 people in the USA and 583 vehicles/1000 people in Western Europe. It was much lower in non‐OECD countries with China at 46 vehicles/1000 people and Africa 25 vehicles/1000 people in 2009 (Davis et al., 2010). However, the number of road vehicles in these countries is beginning to rise more rapidly than in OECD countries. Petroleum product consumption for all transport demands in 2009 ranged from 52 GJ /capita in North America to less than 4 GJ /capita in Africa and India where transport for many poor people is limited to walking and cycling. Some cities in the USA consumed over 100 GJ/capita whereas many cities in
1 Note that some freight is carried by more than one mode during its journey from supplier to consumer.

First Order Draft (FOD) IPCC WG III AR5
Do Not Cite, Quote or Distribute 12 of 100 Chapter 8 WGIII_AR5_Draft1_Ch08_final2.doc 19 July 2012
India and China used less than 2 GJ /capita (Kenworthy and Laube, 2001; Newman and Kenworthy, 2011a).
1 2
3 4 5 6 7 8
10 11 12 13
14 15 16 17 18 19
20 21 22
23 24 25 26 27 28
Approximately 65% of total aviation fuels in 2009 were consumed in OECD countries (Graham, P. et al., 2011) (ITF/OECD, 2010). Of the other 35%, China reached a 7 percentage point share, other Asian countries 11 percentage points, and other non‐OECD countries the remaining 17 percentage points. Shipping consumed around 333 Mt (~13.5 EJ) in 2007 of which 83% was used in international ships above 100 gross tonnage (GT) and 17% was used in domestic shipping and fishing vessels (IMO,
2009) .
8.1.3 Direct and indirect GHG emissions by mode 9
GHG emissions emanate from indirect upstream “well‐to‐tank” activities (Chapter 7), direct vehicle tailpipe “tank‐to‐wheel” emissions from fuel combustion, as well as indirectly during the manufacture of road vehicles, boats, planes (Chapter 10) and construction of roads, ports and airports (Chapter 12).
Direct vehicle emissions vary with the fuel type and the vehicle propulsion system leading to a wide range of GHG emissions per kilometre travelled. Of the total transport direct GHG emissions, LDVs currently produce approximately 45%, with HDVs 25%, air transport 10%, shipping 15% and rail 5% (WBCSD, 2004; IMO, 2009). However, the data are uncertain and do not include short‐lived climate forcers such as black carbon (particulates produced by the incomplete combustion of fossil fuels or biomass), and aerosols (8.2).
Non‐CO2 gases and F‐gases (fluorinated halocarbons) were responsible for about 5–10% of direct transport GHG emissions. Around 10,000 t/yr of F‐gases result from refrigerants leaked from vehicle air conditioners and refrigerated transport carriers of perishable foods (IMO, 2009) .
Freight transport emits around 45% of total transport GHG emissions. International shipping in 2007 (for ships above 100 GT excluding naval vessels), produced around 13% of the world’s total energy‐related CO2 emissions (843 Mt CO2). Domestic shipping and fishing vessels emitted an additional 176 Mt CO2 /yr (IMO, 2009) although small boat data are particularly difficult to assess and therefore uncertain. For freight in general, comparisons can be made in terms of emissions / tonne kilometre (Fig. 8.1.4).
29
30 31
32 33
34 35 36 37 38 39 40
Figure 8.1.4. Typical direct CO2 emissions range from marine freight carriers compared with freight moved by road and rail (IMO, 2009) .
“Shipping” includes vessels carrying oil, LNG, LPG, chemicals, bulk, containers, car ferries, general cargo. ““Road” includes small vans and HDVs.
The trends and drivers for reducing both long‐lived GHGs and short‐lived climate forcing emissions from the transport sector are outlined in the following sections. Transport is a small contributor to total long‐lived methane and nitrous oxide emissions (Fuglestvedt et al., 2008), but produces a significant share of short‐lived climate forcers such as stratospheric and tropospheric ozone, aerosols, and over 20% of total black carbon emissions (Bond et al., 2004). .Nitrogen oxides and volatile organic gases emitted from vehicle engines increase the lifetime of atmospheric methane due to tropospheric photochemistry and greatly influence regional concentrations of ozone in the

First Order Draft (FOD) IPCC WG III AR5
Do Not Cite, Quote or Distribute 13 of 100 Chapter 8 WGIII_AR5_Draft1_Ch08_final2.doc 19 July 2012
troposphere (from road, ships and rail) and stratosphere (from aircraft) (Koffi et al., 2010; Lee et al., 2010). Reducing these emissions can play an important role in mitigating cooling in the stratosphere and heating in the troposphere. Due to the complex non‐linear chemistry of ozone formation, the potential for mitigation of anthropogenic ozone is highly location specific and cannot be fully assessed using the decomposition approach (Unger et al., 2009).
1 2 3 4 5
7 8 9
10 11
13 14 15 16 17 18 19 20 21 22 23
25 26
27 28 29 30 31 32 33 34 35
36 37 38 39 40 41 42 43 44 45 46 47
8.2 New developments in emission trends and drivers 6
Future assessments of transport CO2 emissions require a comprehensive regional understanding of trends, and overall macroscopic observations sufficient to develop pathways for reducing emissions. Transport of goods and people vary considerably across nations in terms of direct CO2 emissions per capita and the shares of emissions associated with the transport sector (IEA, 2009; Millard‐Ball and Schipper, 2011; Salter and Newman, 2011; Schäfer et al., 2009).
8.2.1 CO2 emissions 12
From 2000 to 2006, the increase in CO2 emissions from non‐OECD nations grew at a rate of 4.3% as compared to 1.2% from OECD nations (IEA, 2009). The growth rates varied considerably across transport sub‐sectors. For OECD countries, the largest growth was in international marine transport (2.5%), followed by rail (2.3%), road (1.4%) and international aviation (1.2%), but domestic navigation and domestic aviation decreased by 1.0% and 0.3% respectively (IEA, 2009). For non‐OECD countries, the largest growth was also in international marine transport (5.4%), followed by international aviation (4.7%), road (4.2%), domestic navigation (4.0%), domestic aviation (3.0%), and rail (2.3%), with no sectors having negative growth (IEA, 2009). Data suggesting declines in LDV use in OECD cities since 2005 raise the possibility of a significant turning point in transport in developed countries (Goodwin, 2012; Millard‐Ball and Schipper, 2011; Schipper, 2011), but this is not expected to off‐set growth in developing countries.
8.2.1.1 Drivers 24
The three major drivers that affect transport trends are costs and prices, travel time budgets, and economic, social, and cultural factors (OECD, 2006; ITF, 2011)
Costs and prices. Capital costs of infrastructure development options are particularly hard to stem in developing countries but this can be eased by multilateral banks and financing where a focus on transport is necessary (Kopp, 2012a). New techniques of using public private partnerships and land value capture are enabling capital costs to be shared more creatively especially with mass transit options (Rolon, 2008). Costs and prices shape the use of transport systems. The relative decline of LDV transport costs as a share of personal income has been the major driver of LDV use in OECD countries in the last century and still is in non‐OECD countries. Specifically, the price of fuel is a major factor in determining the mix and level of use by cars versus public transport versus bicycling/walking (Hughes et al., 2006).
A rising fuel price combined with stagnating incomes can force people to abandon their LDVs. (Newman and Kenworthy, 2011b) suggested that increased fuel costs have led to the major shift from LDVs in developed countries. The fuel price also impacts on the competition between road and rail freight, which shows that the extra costs of HDVs increases dramatically when fuel costs go up (Dinwoodie, 2006). (Rubin and Tal, 2008) estimated that the cost of transporting a single unit container from Shanghai to Columbus, Ohio, increased by 265 %, from USD3,000 to USD8,000, when oil rose from USD20 to USD130 per barrel. Increased fuel costs have also promulgated the designs of more fuel efficient engines, boat hulls, propellers and aircraft, with continuing pressures to further increase fuel efficiency that originally began in the 1960s (IEA, 2009). Due to the average life of aircraft and marine engines being two to three decades, fleet turnover is slower than for road vehicles and small boats. However, given that fuel costs are a relatively high share of total aviation costs, improving fuel efficiency makes good economic reasons (IEA, 2009).

First Order Draft (FOD) IPCC WG III AR5
Do Not Cite, Quote or Distribute 14 of 100 Chapter 8 WGIII_AR5_Draft1_Ch08_final2.doc 19 July 2012
Travel time budget. Transport structures the urban and regional economy through the time that people and goods can be moved around. Travel time budgets have been shaping cities and causing competitive advantage in regional freight movements for as long as human settlements have existed. Urban travel time budgets averaging around 1.0 hour per person per day or 1.1 – 1.3 hours per traveller per day (Zahavi and Talvitie, 1980; van Wee et al., 2006) have been found to occur in all cities where data is available, including developed and developing economies (Marchetti, 1994; Mokhtarian and Chen, 2004). The distribution is a bell shaped curve with most people clustering around 1 hour for their commute between work and home. Hence, a city is typically only 1 hour wide. Its infrastructure whether for walking, mass transit or LDVs, is usually built up so that destinations can be reached in half an hour on average and land use is adapted to enable this average time to be maintained (Newman and Kenworthy, 1999). Cities vary in the proportion of people using different transport modes and have adapted land uses to fit these modes at speeds of around 5 km/hr for walking, 20‐30 km/hr for transit and 40‐50 km/hr for LDVs. Road infrastructure construction has reduced car travel time dramatically worldwide, and hence encouraged an increase in the use of road transport. Travel times can be increased by traffic congestion, transit congestion or walking/bicycling congestion, with the problem being eased by infrastructure development, but with the land use quickly adapting so that a similar travel time resumes (Mokhtarian and Chen, 2004). The basis of this phenomenon is seen to be a biological or psychological need for some gap between work and home, but if it extends too much into work or family/recreation time then ‘road rage’ (or its equivalent in other modes) sets in (Marchetti, 1994). Regional freight movements do not have the same fixed time demand but are based more on the need to remain competitive and a reasonable proportion of the total costs of the goods (Schiller et al. 2010). Travel time will need to remain within budget in any decarbonised transport system of the future.
1 2 3 4 5 6 7 8 9
10 11 12 13 14 15 16 17 18 19 20 21 22 23
24 25 26 27 28 29
30 31 32 33 34 35 36 37 38 39 40 41 42 43 44 45 46 47 48 49 50 51
Economic, social and cultural drivers. Structural change in economies has led to increased specialization of jobs and an increased female share in the work force. Both trends tend to produce more and longer commutes (Levinson, 1999). Additionally, as shopping becomes more concentrated (allowing for more products in one location), travel distance to the shops tends to increase (Weltevreden, 2007). Similarly, economic globalisation, associated with global specialization, drives the volume of global freight travel (Henstra, D., Ruijgrokand, C., Tavasszy, 2007).
At the household level, once a motorized vehicle becomes affordable even in relatively poor households in many developed countries, then it becomes a major item of individual consumption, second to expenditure on housing, and one that has so far proved popular with each new generation (Trubka et al., 2010). Motorized two, three and four‐wheelers, can provide transport services to their owners, such as speed, convenient access and flexibility. They also provide important symbolic and affective functions that significantly contribute to the positive utility of driving (Mokhtarian and Salomon, 2001; Steg, 2005; Urry, 2007). Different social groups value the symbolic and affective aspects of owning and driving a car differently (Steg, 2005). In some societies, obtaining a driver license and learning to drive a LDV and have become a sign of status and create a basis of sociability and networking through their various sign‐values speed, home, safety, sexual success, career achievement, freedom, family, masculinity and even of women emancipation (Miller, 2001; Carrabine and Longhurst, 2002; Sheller, 2004; Urry, 2007; Bamberg et al., 2011). Affective motives, such as feeling of power and sensation of superiority associated with owning and using a car, influence travel behaviour like speeding, with consequences on traffic safety, energy consumption, noise and emissions (Bamberg et al., 2011). In short, modal choices are sometimes driven by social factors that are above and beyond the time, cost and price drivers. Some people in some cities do not prefer transit and walking due to safety and security issues. At the same time, there is evidence of younger people choosing mass transit over car use as they prefer the opportunity to use their social media devices (smart phones and computers) (Parkany, E., Gallagher, R., Viveiros, 2004). Lifestyle and behavioural factors in transport are important for any assessment of potential change to low carbon options and the evidence that people are prepared to change is growing (Ashton‐Graham, 2008).
First Order Draft (FOD) IPCC WG III AR5
Do Not Cite, Quote or Distribute 15 of 100 Chapter 8 WGIII_AR5_Draft1_Ch08_final2.doc 19 July 2012
As a result of these trends, and as economies shift from agricultural to industrial to service, not only the absolute emissions of transport but also the emission share of transport, in comparison to other sectors, rises considerably (Fig. 8.1.1). As people become richer, absolute CO2 emissions from transport rise, as well as their relative share of total emissions (Schäfer et al., 2009).
1 2 3 4
6 7 8 9
10 11 12 13 14 15 16 17
18 19 20 21 22 23
25 26 27 28
29 30 31 32 33 34
35 36 37 38 39
40 41 42 43 44 45 46 47 48
8.2.1.2 Trends by transport sector 5
As international trade expands the cost of transport relative to disposable income continues to decrease (Blijenberg, 1993), and the demand for transport of goods and people is still increasing worldwide. In rapidly developing nations, increased demand for transport is being met by expansion of public transport (both bus and rail) and by expansion of roadways and increased LDV ownership. Fuelled by the growth in developing countries, LDV ownership is expected to expand to 2 billion in the next few decades from the current 780 million (IEA, 2009), with two‐thirds of this growth expected in non‐OECD countries. There is some evidence, however, that vehicle ownership and vehicle transport has begun to plateau in developed countries, as observed in Japan, Sweden, Australia, the United Kingdom and possibly the United States (IEA, 2009). Similar trends have not been observed for air transport, especially in the US, Canada and Australia where the demand has continued to rise. Conversely, in Europe and Japan, demand for regional air travel has decreased, which has been attributed to improvements in high speed rail (Millard‐Ball and Schipper, 2011).
Although there is significant diversity on the modal distribution of urban and inter‐urban transport in different regions of the world, there is limited evidence that changes in carbon intensity, energy intensity or activity have made significant reductions in GHG emissions. Recent trends suggest that current economic, social, or cultural changes alone will not be sufficient to mitigate global increases in atmospheric CO2 concentrations, and policy instruments, incentives, or interventions will be needed to reduce global CO2 emissions (IEA 2009).
8.2.2 Non‐CO2 greenhouse gases, black carbon and aerosols 24
Methane emissions are largely associated with leakage from the production and filling of natural gas powered vehicles. Methane and nitrous oxide are also emitted during agricultural processes used to produce biofuels. Total transport‐related F‐gas emissions are responsible for around 350 Mt CO2‐eq as estimated for 2010 (EPA 2006).
Black carbon emissions have significant positive forcing. Black carbon and non‐absorbing aerosols have short lifetimes in the atmosphere of only days to weeks but still have direct and indirect radiative forcing effects (IPCC, AR5 WGI). In North America, South America and Europe, over half of black carbon emissions are due to the use of diesel and heavier distillate fuels in transport (Bond et al., 2004). Black carbon emissions are also significant in parts of Asia, but mainly stem from biomass and coal combustion and not from transport (Bond et al. 2004).
Transport is also a significant contributor of primary aerosols that do not absorb light, and gases that undergo chemical reactions to produce secondary aerosols. Primary and secondary organic aerosols, secondary sulphate aerosols formed from sulphur dioxide emissions, and secondary nitrate aerosol from nitrogen oxide emissions from ships, aircraft and road vehicles can have strong local regional forcing impacts (IPCC, AR5 Working Group I).
Relative contributions of different pollutants to radiative forcing in 2020 have been compared with perpetual constant emissions from 2000 (Fig. 8.2.1). Although this study does not provide realistic projection for current and future emissions, the analysis does provide a qualitative comparison of the short‐term and long‐term impacts of different pollutants from the transport sector. Relative to CO2, major impacts stem from black carbon, indirect effects of aerosols, ozone, aerosols from on‐road and off‐road vehicles, and aerosols and methane associated with ship and aircraft emissions. Due to the longer atmospheric lifetime of CO2, these relative impacts will be greatly reduced when integrated from the present time to 2100 (Unger et al., 2010). (Lee et al., 2010) suggested that the impact of aviation is even larger and could have a positive forcing as high as 0.05 W m‐2.

First Order Draft (FOD) IPCC WG III AR5
Do Not Cite, Quote or Distribute 16 of 100 Chapter 8 WGIII_AR5_Draft1_Ch08_final2.doc 19 July 2012
1
2 3
4 5 6 7 8 9
10 11
12 13 14 15
17 18 19 20 21 22 23 24
26 27 28 29 30
Figure 8.2.1. Impact of global transport sector emissions that were produced continuously since 2000 on radiative forcing in 2020 and 2100. Source: (Unger et al., 2010).
Although emissions of non‐CO2 GHGs and aerosols are impacted by the same carbon intensity, energy intensity and activity, as characterized in section 8.1, drivers as for CO2, the emissions of non‐CO2 gases can be significantly changed by technologies that prevent formation or lead to the destruction of these pollutants using after‐treatments. Some of these technology and emissions control devices, such as diesel particulate filters (DPF) and selective catalytic reduction (SCR) have fuel efficiency penalties (Tourlonias and Koltsakis, 2011). These can lead to an increase in CO2 emissions but the human health benefits from emissions reductions and the co‐benefits of climate change mitigation have largely offset these penalties.
Although long‐term cuts in CO2 emissions are also clearly needed for climate mitigation, short term mitigation strategies that focus on other climate relevant gases and aerosols can play an important role in developing pathways for climate mitigation. Policies are already in place for reducing emissions of F‐gases, which are expected to continue to decrease with time (Prinn et al., 2000).
8.2.2.1 Drivers 16 Drivers impacting on non‐CO2 emissions from road and shipping activity have historically been driven by local air quality regulations that seek to protect human health by reducing ozone, particulate matter, sulphur dioxide and toxic components or aerosols, including vanadium, nickel, and polycyclic aromatic hydrocarbons (Verma et al. 2011). Due to the importance of regional climate change in the context of mitigation, there has been growing awareness of the climate impact of these emissions and more efforts are being directed at potential programmes to accelerate control measures to reduce emissions of black carbon, ozone precursors, aerosols, and aerosol precursors (B. Lin & C. Lin 2006).
8.2.2.2 Trends by Sector 25 Due to safety and strict regulatory requirements, non‐CO2 GHGs and aerosol emissions continue to decrease due to co‐benefits of protecting human health from air pollution, but in some locations the implementation of these controls could potentially be accelerated with drivers to mitigate climate change. Given the emerging understand of the climate forcing of aviation, additional pressures to reduce emissions are expected.

First Order Draft (FOD) IPCC WG III AR5
Do Not Cite, Quote or Distribute 17 of 100 Chapter 8 WGIII_AR5_Draft1_Ch08_final2.doc 19 July 2012
8.3 Mitigation technology options, practices and behavioural aspects 1
Climate change mitigation in the transport sector can be achieved by technological developments and practices, but human preferences and behaviours are also key components. This section addresses these issues as they relate to light duty vehicles (LDVs), high duty vehicles (HDVs), boats, trains and aeroplanes.
2 3 4 5
7 8 9
10 11 12 13
15 16 17 18 19 20 21 22 23 24
25 26 27 28
29 30 31 32 33
35 36 37
38 39 40
41
42
43
44
8.3.1 Incremental vehicle technologies 6
Recent advances in LDVs in response to strong regulatory efforts in Japan, Europe and the US have demonstrated that there is substantial potential for improvement in internal combustion engine (ICE)‐based road vehicles with both conventional and hybrid drive‐trains. Recent estimates suggest substantial additional potentials (still unrealized), exist with up to 40‐50% reductions in energy intensity (GJ/km) compared to a 2010 base vehicle (Bandivadekar,, 2008)(Greene and Plotkin, 2011). Similar potential exists for other types of vehicles, including trucks, ships and aircraft as outlined in the following sections.
8.3.1.1 LDV drive‐trains 14
As of 2011, leading‐edge LDVs in Europe, Japan and elsewhere have drive‐trains with down‐sized direct injection gasoline or diesel engines (many with turbochargers) and a range of sophisticated components, coupled with automated manual or automatic transmissions with 6 or more speeds (SAE International, 2011). Advanced features of these drive‐trains include full control of valve timing and lift, fuel injection capable of multiple injections per stroke, high energy ignitions with (for gasoline) multiple ignition capability, demand‐driven fuel pumps and other accessories, and stop‐start capability. There are many recent examples of drive‐train redesigns yielding substantial reductions of fuel consumption and GHG emissions of 25% or more. In EU27, for example, average CO2 emissions of new model LDVs in 2010 were 140 g CO2/km, compared to 160 g CO2/km in 2005 (EEA, 2011).
Electric hybrid drive‐trains, including both engine and electric motor with battery storage, have become a mainstream technology but have only achieved a few percent of sales in most countries over the last decade. However recent sales have risen rapidly in Japan and have reached 20% market share (Hybridcars.com).
Over the next two decades, there is substantial potential for further advances in drive‐train technology, design and operation, including heat recapture and the use of more efficient thermodynamic cycles such as homogeneous charge compression ignition (HCCI), and some potential for basic redesigns of engine architecture, e.g. opposed‐piston, opposed‐cylinder engines capable of strong increases in efficiency (SAE International).
8.3.1.2 LDV load reduction 34
Lower LDV fuel consumption can be achieved by reducing all the loads that the vehicle must overcome, from aerodynamic forces to auxiliary components (including lighting and air conditioners) to losses from rolling resistance.
Weight reduction is critical: if vehicle performance is held constant, reducing vehicle weight by 10% would allow a fuel economy improvement of about 7% (EEA, 2006). There are three basic approaches to weight reduction (NRC, 2011):
1. Incremental redesign, e.g. removing material from structural body parts (where safety
evaluation allows), combining parts, redesigning interior elements such as seats.
2. Substitution by lighter materials. Currently, leading‐edge vehicles have higher proportions
of very high strength steels and/or use significant amounts of aluminum and other

First Order Draft (FOD) IPCC WG III AR5
Do Not Cite, Quote or Distribute 18 of 100 Chapter 8 WGIII_AR5_Draft1_Ch08_final2.doc 19 July 2012
lightweight materials. Some automakers are beginning to use small amounts of carbon
fibre, but this material will need substantial cost reduction before it can play a major role.
1
2
4
5
6
7
8
9 10 11 12 13 14 15 16
17 18 19 20 21 22 23
25 26 27 28 29
30 31 32 33 34 35 36 37 38
39 40 41 42
44 45 46
3. Fundamental redesign of the vehicle structure. For sport utility vehicles (SUVs), shifting from 3
ladder and frame structures to uni‐body construction has yielded significant weight savings.
More radically, for all LDVs, shifting from conventional uni‐body construction to space frame
or monocoque/tubular frame construction with a glass composite body has the potential to
reduce vehicle weight by 40% or more (ICCT, 2010).
Other changes that reduce loads include more efficient air conditioners, heaters, and lighting; improved aerodynamics, and lower rolling‐resistance tyres. Together, these changes offer potential reductions of 25% or more in vehicle energy or more if there are breakthroughs in weight reduction technologies. Combined with improved engines and drive‐train systems, overall LDV fuel consumption per kilometre for new vehicles could be reduced by up to half by 2025 compared to 2005 (NRC, 2009); (Bandivadekar,, 2008). This is consistent with the Global Fuel Economy Initiative target of 30% reduction in global average new LDV fuel use per kilometre in 2020 and 50% in 2030 compared to 2005 (Eads, 2010).
Overall test fuel economy and CO2 emission reductions by the LDV fleet will depend on multiple factors, including the extent to which automakers focus on efficiency and CO2 emissions versus vehicle performance and other features; the size distribution of vehicles chosen by consumers; and their preference for the most efficient vehicles among those offered. Policies can help to encourage production and sales of the most efficient models (8.10). Actual in‐use fuel economy will also depend on a range of factors, such as driving conditions (congestions, highway speeds, etc) driving practices, and vehicle maintenance (see Section 8.3.5).
8.3.1.3 Medium and heavy‐duty vehicles 24
Modern medium and HDVs already have efficient diesel engines (up to 45% thermal efficiency), and long‐haul trucks often have streamlined spoilers on their cabs to reduce drag. The U.S. Department of Energy’s 2013 efficiency goal for heavy‐duty engines is 55% (DOE, 2008).There remain potential improvements in turbo‐charging and supercharging, improved thermal management, and waste heat recovery (National Research Council, 2010).
The aerodynamic drag coefficients (CD) of heavy tractor trailers can be reduced by about 25% by improving cab shaping, replacing mirrors with cameras, closing the gap between cab and trailer, and adding a short boat‐tailed rear (Cooper, 2000). These improvements can reduce fuel use by approximately 12% at 100 km/h. The U.S. National Research Council (National Research Council, 2010) concluded that medium and heavy‐duty trucks can achieve a reduction in energy intensity (fuel consumption per km) of 30‐50% by 2020 by using a range of technology and operational improvements, including power‐train, aerodynamics, auxiliary loads, rolling resistance, mass (weight) reduction, idle reduction, and intelligent vehicle systems. The largest tractor‐trailers could achieve around a 50% reduction.
Trucks and buses that operate largely in urban areas with a lot of congested stop‐and‐go travel, can achieve substantial benefits from electric hybrid or hydraulic hybrid drive‐trains. New York City Transit has obtained about 30% reduction in fuel consumption (l/100km) as well as improved acceleration and reduced brake wear by using electric hybrid buses (Chandler et al., 2006).
8.3.1.4 Rail 43
Many technologies for energy efficiency improvement include both drive‐train efficiency and load‐reduction aspects. In Japan, the high‐speed “Shinkansen” train has achieved 40% reduction of energy consumption by optimizing the length and shape of the lead nose, reducing weight and using

First Order Draft (FOD) IPCC WG III AR5
Do Not Cite, Quote or Distribute 19 of 100 Chapter 8 WGIII_AR5_Draft1_Ch08_final2.doc 19 July 2012
efficient power electronics (UIC, 2011). In US, the use of regenerative braking systems has enabled the rail company Amtrak to reduce energy consumption by 8% (UIC, 2011).
1 2
3 4 5 6 7 8
10 11 12
13 14 15 16 17 18 19 20 21
22 23 24 25 26 27
29 30 31 32 33 34 35 36 37 38 39 40
41 42 43 44
45 46 47
The railway sector has set ambitious long‐term targets for CO2 reduction. For example European rail operators have set targets of 30% by 2020, 50% by 2030 and carbon‐free travel by 2050 (UIC, 2011) . However, since railway systems are already relatively efficient in terms of energy intensity, the biggest contribution of CO2 reduction would come from a significant modal shift from road to rail – though the benefits will depend heavily on factors such as the types of freight or passenger travel shifted and the load factors involved (IEA, 2009).
8.3.1.5 Shipping 9
Shipping is a comparatively efficient mode of freight and passenger ferry transport. Demand is increasing rapidly and marine GHG emissions from ships are projected to increase by 50% or more to 2050 (IEA, 2010b).
From a technology and design perspective, efficiency of ships can be improved through engine and transmission technologies, auxiliary power systems, propulsion systems and propellers, and the aerodynamics of the hull structure (“Chapter 4 ‐ Ship Structures,” 2008). As examples, electronically controlled engine systems allow slower and more fuel efficient speeds than conventional engines, improved coatings can reduce drag, and weight reduction can further reduce energy consumption of vessels (Notteboom and Vernimmen, 2009). These measures can increase the efficiency of new built vessels by 5‐30%, retrofit and maintenance measures can provide additional efficiency gains of 4‐20%, and combined technical and operational measures have been estimated to potentially reduce CO2 emissions by up to 43% per t‐km by 2020 and by up to 63% per t‐km by 2050 (Crist, 2009).
Retrofits and operational changes to save fuel are possible for existing ships (WSC, 2011). Speed reduction is one of the most effective adjustments that vessel operators can make to rapidly reduce energy consumption (Corbett et al., 2009; Lindstad et al., 2011). Such “slow steaming” was widely applied in early 2008 when oil prices went above $140 (Pierre, 2011). The resulting fuel savings were reported to compensate for the costs of a running an increased number of ships on certain routes employed to maintain capacity (Meng and Wang, 2011).
8.3.1.6 Air 28
Substantial efficiency improvements in aircraft technology and design have been made over the past decades (ITF, 2009). There are a number of technology and design options for further efficiency gains for aircraft, such as weight reduction, aerodynamic and engine performance improvements focusing on the propulsion system, materials and systems design (Gohardani et al., 2011). An average aircraft efficiency improvement potential of 40‐50% has been estimated to be possible in the 2030‐2050 time frame, compared to average new aircraft in 2005 (IEA, 2009) . The rate of introduction of major efficiency concepts, such as the “flying wing” and hybrid design aircraft, appears likely to be slow without major new policy incentives or regulations (Lee, 2010). Many older planes may benefit from engine upgrades (Gohardani et al., 2011). Not only technology and design itself, but also the aircraft choice of operators, affect the efficiency of the sector (Givoni and Rietveld, 2010). The use of larger airplanes (and hence less flight frequency) has the potential to reduce CO2 emissions significantly (Morell, 2009).
Due to long aircraft life and resulting slow turnover rates of aircraft fleets, operational measures and maintenance provide the best potential for short‐term emission reductions (Peck Jr. et al., 1998; Lee, 2010). In the short term, technology improvements to reduce fuel consumption are limited to a few retrofit opportunities (such as adding “winglets”) (Marks, 2009).
The improvement of air traffic management also provides significant potential for emission reductions through more direct routings and flying at optimum altitudes and speeds (Pyrialakou et al.) (Dell’Olmo and Lulli, 2003). Additional operational measures, such as aircraft ground and flight

First Order Draft (FOD) IPCC WG III AR5
Do Not Cite, Quote or Distribute 20 of 100 Chapter 8 WGIII_AR5_Draft1_Ch08_final2.doc 19 July 2012
operations, and efficiency improvements of ground service equipment and auxiliary power units, can provide further GHG mitigation options (Pyrialakou et al.) .
1 2
4 5 6 7
9 10 11 12 13 14 15
16 17 18 19 20 21 22
23 24 25 26 27 28
29 30 31 32 33 34 35 36 37 38 39
40 41
42 43
44
8.3.2 New propulsion systems 3 At present, road vehicles are powered mainly by ICEs and use petroleum‐based fuels (gasoline or diesel), with small shares (on a global basis) of alternative fuels like compressed natural gas (CH4) and biofuels (though shares in a few countries have reached 30% or even higher as in the case of LDVs in Brazil).
8.3.2.1 Electric‐drive road vehicles 8 Electrification of road vehicles has attracted increasing attention in recent years given its potential for very low vehicle and fuel‐production emissions using low‐carbon electricity (Kromer and Heywood, 2007). EVs include plug‐in battery electric vehicles (BEVs) and plug‐in hybrid electric vehicles (PHEVs) that are hybrids with expanded battery storage that enables driving after each charge using primarily electricity2 for typically 20 to 50km, and the capability of charging from the grid. Hydrogen FCVs could also be hybrids that plug in (8.3.2.2). PHEVs do not have the range restrictions of BEVs, and thus have lower public infrastructure requirements.
BEVs operate at a drive‐train efficiency of around 80% compared with about 20‐30% for conventional vehicles, but commercially available BEVs typically have a limited driving range of about 100‐160km, long recharge times of 8 hours or more, and high battery costs leading to high retail prices (Greene and Plotkin, 2011). Future success and wide penetration of BEVs will depend on improvements in battery technology (as reflected in battery cost reductions, reduced vehicle costs, improved performance and extended life), and the corresponding rollout of supporting infrastructure.
The electric range of PHEVs is heavily dependent on the size of battery, design architectures, and control strategies for the operation of each mode (Plotkin et al., 2001). Since these systems allow a high share of driving on electricity for daily commuter driving patterns, they could provide a major shift to electricity with relatively small battery capacity compared to a dedicated BEV (Plotkin et al., 2001). They appear likely to be less expensive than BEVs unless battery costs drop significantly (IEA, 2012).
Batteries are thus a key component for vehicle electrification. Lithium‐ion batteries are currently most often chosen to power EVs due to their high energy density and long cycle life (Kromer and Heywood, 2007). Under aggressive R&D, the performance of lithium‐ion batteries has been significantly improved in the past decade, and this is expected to continue. The typical energy density is currently 80‐100Wh/kg and is targeted to reach 200‐250Wh/kg in 2020 (NEDO, 2010). Improving vehicle energy efficiency contributes to allowing reduced battery weight and/or extending driving range. Battery lifespan is a major factor affecting cost. The cycle life of a lithium‐ion battery is about 1000 charges under 80% depth of discharge, typically enough for 5~6 years of driving (NEDO, 2010). This lifespan is targeted to double by 2020. The cost of lithium‐ion batteries in early high‐volume production (e.g. 2012‐2013) is expected to be about USD500‐700/kWh but is targeted to drop to USD300/kWh or below in the 2015‐ 2020 time frame (IEA, 2010b).
The CO2 emissions intensity of power grids directly affects BEV CO2 emissions. For electricity from coal‐based power plants with energy efficiency of about 34%, the GHG intensity is about 1000 g CO2‐
eq/kWh (at the outlet) (Wang, 2012). For a BEV with efficiency of 200 Wh/km, this would give about 200 g CO2‐eq/km, far higher than efficient ICE vehicles and hybrids, which can reach well below 150
g/km. However, when using electricity from renewable energy, BEVs can achieve near‐zero life‐
2 The engine may occasionally be needed to assist the battery and motor(s) during brief periods of high load.

First Order Draft (FOD) IPCC WG III AR5
Do Not Cite, Quote or Distribute 21 of 100 Chapter 8 WGIII_AR5_Draft1_Ch08_final2.doc 19 July 2012
cycle GHG emissions. The GHG emissions of PHEVs depend heavily on the liquid or gaseous fuel used, GHG intensity of the electricity, and efficiency of the vehicle design.
1 2
3 4 5 6 7 8 9
11 12 13 14 15
16 17 18 19
20 21 22 23 24 25
26 27 28 29 30 31 32 33
35 36 37 38 39 40 41
42 43 44 45 46
Currently, about 1000 electric transit buses are operating in Chinese cities and being demonstrated elsewhere such as Adelaide where solar electricity is used for recharging (IEA, 2009). Electric two‐wheelers are a mature technology with lower requirements for battery and motor capacities and widespread acceptance, especially in developing countries (Weinert et al.,2008). There were over 120 million electric two‐wheelers in China by the end of 2010 (Wu et al., 2011), implying an ownership of around one machine per ten people. The typical battery capacity for an electric two‐wheeler is 576 Wh (20V‐12Ah), which can support a range of about 60 km per‐charge.
8.3.2.2 Fuel cell vehicles 10
Fuel cell vehicles (FCVs) can be used as single power units as well as in hybrid and plug‐in hybrid drive‐trains. Most current demonstration FCVs are equipped with a proton exchange membrane (PEM) fuel cell using compressed or liquid hydrogen as its fuel. Worldwide, there are estimated to be only a few hundred FCV LDVs and a similar number of fuel cell buses, with around 250 hydrogen refuelling stations operating under demonstration programmes (Fuel Cells 2011).
When using hydrogen derived from natural gas reforming, the well‐to‐tank efficiency is about 65‐80%; for use in a fuel cell vehicle with efficiency of 54‐61%, the life cycle efficiency of FCVs is about 35‐49% (JHFC, 2011). Since hydrogen can be produced from low carbon sources such as via electrolysis using near‐zero carbon wind power, FCVs can reach very low life‐cycle CO2 emissions.
Over the past decade, the cost of PEM fuel cells suitable for LDVs has decreased from about USD275/kW to under USD100/kW, with the possibility to reach USD50/kW by 2015 under conditions of large‐scale production (DOE, 2011a). At this cost, an 80 kW fuel–cell system would cost around USD 4,000, and be almost competitive with a gasoline ICE of similar output. However, other higher estimates include (Schoots et al., 2010) who quote minimum fuel cell system material costs of USD 150/kW without assembly.
The estimated durability of current fuel cell systems is about 2500 hours (equivalent to around 125,000 km life assuming an average speed of 50 km/h), whereas a life span of 5000 hours is targeted (DOE, 2011a). Compressed hydrogen storage on‐board the vehicle is commercially available, and offers a driving range similar to today’s gasoline/diesel LDVs but with a high cost increment. New storage technologies such as chemical storage are under development but need further improvement to reach deployment phase. Overall it could take another 5‐10 years for all the key components of FCVs to achieve commercial readiness based on current oil and LDV purchase prices (IEA, 2012).
8.3.2.3 Advanced propulsion technologies for rail, ships and aircraft 34
Rail systems tend to be very efficient, but improvements are possible. Diesel hybrid locomotives have been demonstrated in the UK and advanced types of hybrid are under development in the US and Japan. Such systems could save 10‐20% compared to conventional diesel locomotives with a possible 60% reduction of NOx and particulate matter (JR East, 2011). An eventual shift to full electrification may be attractive for many systems to reach very low CO2 emissions, at least where electricity generation has been deeply decarbonized. This has already occurred in several European countries (IEA, 2012).
For shipping, full electrification is unlikely given the energy storage requirements for long‐range operations, although on‐board solar power generation systems could be used to provide auxiliary power. Fuel cell systems could be used, along with on‐board reformers and liquid fuel storage (in the form of LNG, alcohol or ammonia), though the cost of such systems would be relatively high. Use of wind energy as a supplementary propulsion source is possible by using a hard sail, rotor sail (Flettner

First Order Draft (FOD) IPCC WG III AR5
Do Not Cite, Quote or Distribute 22 of 100 Chapter 8 WGIII_AR5_Draft1_Ch08_final2.doc 19 July 2012
ship) or kite. However, it appears likely that most ocean‐going ships will continue to use diesel
engines for the foreseeable future, given their reliability and low cost (Crist, 2009). 1
2
3 4 5
7 8 9
10 11 12
14 15 16 17 18 19 20
21 22 23 24
25 26
27 28 29 30
32 33 34 35 36 37 38 39 40 41 42 43 44 45
46 47
In aviation, no serious alternative to jet engines for propulsion has been identified, though fuel switching options are possible. Aircraft auxiliary power could be provided by batteries recharged at the airport gate, or by fuel cell systems.
8.3.3 Fuel options 6
There are relatively few low‐carbon fuel options for transport applications. Natural gas and its products (methanol, DME) can provide 20‐30% reductions in CO2 intensity compared to gasoline or diesel fuels used in similar engines (EUCAR/CONCAWE/JRC, 2008); (JHFC, 2011). Electricity, hydrogen and biofuels (including biomethane, DME, ethanol and methanol), all could provide operation with very low life‐cycle CO2 emissions, but this depends on their feedstocks and conversion processes (see 8.3.3.4).
8.3.3.1 Natural gas and LPG 13
Natural gas (primarily methane) and liquefied petroleum gas (LPG, primarily propane) commonly replaces gasoline in Otto‐cycle, spark ignition, vehicle engines after slight modifications to fuel systems, along with on‐board compressed or liquefied storage of gas. These fuels can also be used in diesel‐fuelled, compression ignition engines but significant modifications are needed. Though the energy efficiency of driving on methane or LPG is typically similar to that for gasoline or diesel in similar vehicles, a reduction of up to 25% in tailpipe CO2/km can be achieved. Natural gas systems also could provide a bridge to lower carbon bio‐methane systems (IEA, 2009).
Issues associated with use of LPG and natural gas vehicles (NGVs) include the need for a gas distribution and refueling infrastructure, vehicle conversion cost, relatively long refuelling times, possible loss of driving range and loss of on‐board storage space (and payload on trucks) due to fuel storage tanks (IEA, 2010c).
Uptake of natural gas vehicles has had considerable success in Pakistan (with the most NGVs in the world in 2010 (IEA, 2010c), India, Australia, Argentina, Brazil, and Italy, amongst others. There are
around 30 million natural gas and LPG vehicles operating today (IEA, 2010c), most being conversions. In most countries, few original‐equipment light‐duty vehicle models are available. OEM CNG buses are more available and have been gaining market share in many cities around the world. These now account for 20% of the US urban bus fleet (IEA, 2010c).
8.3.3.2 Electricity 31 At least until a very large number of EVs are on the road, the use of off‐peak (typically night‐time) charging would enable existing power plant capacity to meet increased electricity demand in most countries (EUCAR/CONCAWE/JRC, 2008). For home charging only a low voltage charger unit is needed, but charging rates will be fairly slow. The use of 220‐240 V supply can cut charging times in half compared to 110‐120 V systems. Fast charging systems at much higher voltages are being installed at an increasing number of public locations such as offices and commercial areas.. These can provide a full recharge in under an hour, and a useful “top up” in as little as 15 minutes. In apartment blocks and other situations where no home recharging is possible, public charging could become important. Some surveys suggest that many users with home recharging facilities use public recharging opportunities infrequently (Axsen and Kurani, 2012). Public fast‐charging units are expensive to install so are likely to be deployed only in locations where demand for recharging is high enough to justify the investment. An alternative model could be to have all EV users in a region subscribe to fast‐charging “insurance” to spread the costs of seldom used (but still valuable) public charging stations.
As mentioned above, the introduction of EVs in countries with high CO2 electricity intensity could lead to an increase in CO2 emissions compared to similar ICE vehicles. However, the numbers of EVs

First Order Draft (FOD) IPCC WG III AR5
Do Not Cite, Quote or Distribute 23 of 100 Chapter 8 WGIII_AR5_Draft1_Ch08_final2.doc 19 July 2012
in any country are unlikely to reach levels that significantly affect national electricity demand for at least one or two decades, during which time electricity grids could be decarbonised (IEA, 2012).
1 2
3 4 5 6 7 8 9
11 12 13 14 15 16
17 18
19 20 21 22 23
24
25 26 27 28 29 30 31 32 33 34 35 36 37 38
40 41 42 43 44 45
46 47 48
BEVs and PHEVs benefit from already well developed electricity systems in most countries, though they require locations to plug in which can require significant new charging infrastructure and related investments. New metering systems, the possibility of time‐of‐day controlled charging and vehicle‐to‐grid (V2G) storage continue to evolve. EV recharging can yield the benefits of "peak shaving" and "valley filling" (charging from grid when under low grid load). Upgrading the grid to include smart meters could manage flexible charging schedules and added load from EVs (Sims et al., 2011).
8.3.3.3 Hydrogen 10
Hydrogen used in FCVs and modified ICEs can be produced using diverse resources, including reforming of coal, natural gas and biomass or using electricity from a range of sources for electrolysis. Biological processes are also possible. Steam methane reforming of hydrogen is well‐established in commercial plants. Electrolysis is commercial but relatively expensive. Advanced, high‐temperature and photo‐electrochemical technologies are in early stages of R&D and could eventually become viable pathways (IEA, 2012).
Deployment of FCVs (8.3.2.2) needs to be accompanied by large, focused, risky investments into hydrogen distribution and vehicle refueling infrastructure, though the costs can be reduced by
starting with specific locations (“lighthouse cities”) (Ogden and Lorraine, 2011). A high degree of coordination between fuel suppliers, vehicle manufacturers and policy makers is needed. The cost of a fully developed hydrogen system, to support hundreds of millions of fuel cell vehicles around the world, is estimated to be on the order of USD 1‐2 trillion over several decades. Though large, this is less than 1% of projected total spending on transport (vehicles, fuels, infrastructure) over this time
frame (IEA, 2012).
The current cost of hydrogen production and delivery to vehicles is quite high compared with gasoline or diesel fuel, with steam reforming at point of use estimated to be about USD 1 per litre gasoline equivalent, and electrolysis at point of use about USD 1.50 per lge (IEA, 2012). However, projected costs for high‐volume, centralised hydrogen production via reforming coupled with low natural gas prices could see a drop to as low as USD 0.50/lge that would likely be competitive with future gasoline costs (DOE, 2011b). Decentralised hydrogen production may be the best choice for an initial market uptake period when vehicles are few and demand volumes are small, though building markets to the point where centralised production becomes viable appears an important objective (IEA, 2012). In selected locations, hydrogen available as a by‐product from industrial processes could be used to fuel a sizable number of FCVs if hydrogen purification becomes cost efficient (Deng et al.,2010). Centrally produced hydrogen could initially be trucked to refueling stations, and only when large regional markets are established would hydrogen pipelines be justified. The existence of natural gas pipelines may not help deliver hydrogen, given the specific requirements for transporting hydrogen in pipelines (IEA, 2012).
8.3.3.4 Biofuels 39
A variety of finished fuels can be produced from biomass using a range of conversion pathways with different characteristics and costs) (IEA, 2012). Biofuels met nearly 3% of world road‐transport fuel consumption in 2011, a share that has risen fairly rapidly in recent years (IEA, 2012) . However, production in 2012 grew little compared to 2011 possibly due to concerns regarding sustainability of feedstock production along with the slower than projected development of advanced biofuels, which are still in the development stage (IEA, 2012).
In contrast to electricity and hydrogen, liquid biofuels are relatively energy‐dense and are compatible with all types of vehicles, including for aviation and freight. Most liquid biofuels can be blended with petroleum transport fuels (gasoline or diesel) for use in ICE vehicles, though slight
First Order Draft (FOD) IPCC WG III AR5
Do Not Cite, Quote or Distribute 24 of 100 Chapter 8 WGIII_AR5_Draft1_Ch08_final2.doc 19 July 2012
engine modifications of typical vehicles on the road today may be needed to go above limits of around 10% to 15% ethanol blended with gasoline, or 10 to20% biodiesel blended with diesel fuel. ICE engines can be easily and cheaply modified to accommodate much higher blends as exemplified by “flex‐fuel” gasoline engines when the ethanol share can go to 100%, as is the case for almost all new cars being sold in Brazil as of 2012 (ANFAVEA, 2012). Like natural gas, bio‐methane (from suitably purified biogas or landfill gas), can also be used in current ICEs with minor fuel system modifications. Creating an entire global fleet of vehicles capable of operating on high biofuel blends would take time (given slow vehicle stock turnover rates), but would not be difficult to accomplish if the policies to do it were put in place.
1 2 3 4 5 6 7 8 9
10 11 12 13 14
15 16 17 18 19 20
21 22 23 24 25 26 27 28 29 30
31 32 33 34 35
36 37 38 39 40 41 42 43 44
46 47 48
In terms of infrastructure, ethanol and biodiesel fuels typically use a dedicated production and bulk transport system, and are then blended at a terminal with gasoline (Sims et al., 2011). The introduction of a biofuel production/distribution infrastructure has already taken place in Brazil, USA, EU, Thailand, India and elsewhere. There are relatively low transitional challenges in terms of infrastructural changes or coordination between actors.
Long‐haul HDVs, ships and aircraft all require very energy dense fuels, so synthetic “drop‐in” biofuels that are very similar to diesel or jet fuels are most suitable. In particular, bio‐jet fuels derived from a number of possible feedstocks and conversion processes (such as the hydro‐treatment of vegetable oils or the Fischer‐Tropsch conversion of biomass‐derived synthesis gas) already have been shown to meet aircraft technical requirements. The primary concerns would be the same as for other biofuels – the ability to produce large volumes cost‐effectively and sustainably (Sims et al., 2011) .
Some biofuels have estimated fuel cycle GHG ratings that are 30‐90% lower than the ratings for petroleum‐based fuels, when emissions from land use change are excluded (Wang et al., 2011). However, this difference in ratings does not accurately portray the climate change mitigation benefits of biofuels, since land‐use change effects can dramatically alter the comparison and change the sign of whether particular biofuels pathways provide net reductions or cause increases in GHGs compared to gasoline and diesel fuel. As a result, the net effect on climate of expanding biofuel production is a contentious topic, with little agreement on methods or quantitative results (Liska and Perrin, 2009; Delucchi, 2010, 2011; Malça and Freire, 2010; van der Voet et al., 2010; Cherubini and Strˉmman, 2011; McKone et al., 2011; Mullins et al., 2011; Wang et al., 2011; Njakou Djomo and Ceulemans, 2012) (Taheripour et al., 2011) (Johnson et al., 2011)).
All land‐competitive biofuels potentially induce emissions from indirect land‐use change, though the magnitude of this effect is quite uncertain (Lapola et al., 2010; Plevin et al., 2010; Dumortier et al., 2011; Gawel and Ludwig, 2011; Havlík et al., 2011; Njakou Djomo and Ceulemans, 2012; Wicke et al., 2012). The production of land‐competitive biofuels can also have negative direct and indirect impacts on biodiversity, water and food availability (see Bioenergy section in Chapter 7).
Advanced biofuels from ligno‐cellulose crops (e.g. grasses, short‐rotation trees) and algae, along with sugar‐cane ethanol, offer potentially lower life‐cycle emissions than grain‐based or oil‐seed‐based biofuels, with better opportunities to avoid large direct and indirect land‐use change impacts. The use of agricultural and forestry wastes and residues can also result in very low net GHG emissions (Blottnitz and Curran, 2007). However, the alternative fate of wastes and residues must also be considered: net emissions can rise if waste diversion releases carbon that would otherwise be flared, sequestered, or utilized for energy (Chester and Martin, 2009). In addition, the use of slowly‐decaying residues can result in a reduction in forest carbon stocks (Repo et al., 2011; Zanchi et al., 2011).
8.3.4 Comparative analysis 45
The wide range of vehicle and power‐train technologies available for reducing fuel consumption and CO2 emissions, are not necessarily additive when combined and their overall potential should therefore be evaluated as an integrated vehicle system. Further integration with on‐road factors,

First Order Draft (FOD) IPCC WG III AR5
Do Not Cite, Quote or Distribute 25 of 100 Chapter 8 WGIII_AR5_Draft1_Ch08_final2.doc 19 July 2012
fuel characteristics, and passenger load comparisons are needed to gain a full view of the relative GHG characteristics of different vehicles and fuels, and across modes, to give valid conclusions regarding the optimal design of transport systems.
1 2 3
4 5 6 7 8 9
10
Estimates of future improvement potential for LDV fuel economy from a 2012 baseline gasoline engine out to2030 are summarized in Figure 8.3.1. Conventional gasoline ICE vehicle fuel economy can be improved by up to 50% by 2030 using a range of incremental technologies. Further improvements can be expected via hybrids, PHEVs, BEVs and FCVs, but several hurdles must be overcome for their wide market penetration. Any vehicle cost increases due to new technologies could affect potential market penetration, although they would be offset by fuel cost savings.
11 12 13
14
15 16 17 18 19
21 22 23 24
25 26 27
2829 30 31
Figure 8.3.1. Fuel consumption reduction potential (%) for a range of LDV technology types in 2012 and 2030, compared with a base 2012 gasoline ICE vehicle.
Source: Based on (Kobayashi et al., 2009) (Plotkin et al., 2009); IEA, 2009)
Energy intensity (efficiency) estimates of different vehicle propulsion systems can be combined with carbon intensity (fuel cycle emission) estimates to produce vehicle life cycle “well‐to‐wheel” comparisons and hence provide a broad comparison of GHG emissions across various vehicle/fuel options A suitable comparison capturing all contingencies (including LUC for biofuels) has not yet been satisfactorily achieved and further analysis is required.
8.3.5 Behavioural aspects 20
Behavioural change and its potential impacts on travel choices, modal mix, and uptake of new types of vehicles and fuels is complex. Some behavioural concepts are introduced here, mainly based on linkages to light‐duty vehicles. Broader relationships between modal choice, modal shares and their potential impacts on GHG emissions are covered in later sections.
There are a range of behavioural aspects related to the successful uptake of more efficient vehicles, new vehicle technologies and fuels; and the use of these vehicles in “real life” conditions. Brief summaries of several of these are provided below:
Purchase behaviour: It has been widely shown (Greene, 2010a) that consumers do not minimize the life‐cycle costs of vehicle ownership. The characteristic of transport sector leads to a considerable imbalance of individual costs and economy wide benefits. Individuals apply discount rates of 20% or more, which means that most car buyers do not account for
First Order Draft (FOD) IPCC WG III AR5
Do Not Cite, Quote or Distribute 26 of 100 Chapter 8 WGIII_AR5_Draft1_Ch08_final2.doc 19 July 2012
cost savings from fuel efficiency beyond 2‐3 years. Hence, only a fraction of the economy wide benefits are taken into account when individuals are making a purchase decision. This affects the economy wide benefits and costs over the roughly 15 years potential lifetime of the vehicle (Kagawa et al., 2011). There is often a lack of interest in purchasing the more fuel efficient vehicles available on the market (Wozny and Allcott, 2010),. Explanations include credit constraints, imperfect information, information overload in decision making and consumer’s uncertainty about future fuel prices and the duration of their vehicle holdings (Small, 2012)(Anderson et al., 2011). This suggests that in order to promote the most efficient models, policies like fuel economy standards, sliding‐scale vehicle tax systems or “feebate” systems (with tax variable based on fuel economy or CO2 emissions) may be needed (Gallagher and Muehlegger, 2011).
1 2 3 4 5 6 7 8 9
10 11
1213 14 15 16 17 18 19
2021 22 23 24 25 26 27 28 29
3031 32
33 34
3536
37 38 39 40 41 42 43 44
4546 47 48
New technologies/fuels: Lack of willingness to purchase new types of vehicles with significantly different attributes (e.g. smaller size, shorter range, longer refuelling or recharging time, higher cost) is a potential barrier to introducing new propulsion systems and fuels (Brozović and Ando, 2009). This may relate simply to the perceived quality of various attributes or to risk aversion and uncertainty (e.g. “range anxiety”) (Wenzel and Ross, 2005). The extent to which policies must compensate by providing incentives varies but may be substantial; the recent slow market introduction of electric vehicles even in countries with generous incentives suggests this is the case (Gallagher and Muehlegger, 2011)
On‐road fuel economy: The tested fuel economy of a new vehicle can be up to 30% better than that actually achieved by an average driver on the road (IEA, 2009). This reflects a combination of factors including inadequacies in the test procedure, real‐world driving conditions (e.g. traffic, road surface, weather conditions), driver behaviour, and vehicle age and maintenance. Some countries attempt to adjust for these differences in their vehicle fuel economy information. Various studies (e.g. (IEA, 2009) suggest that a 5‐10% improvement in on‐road fuel economy can be achieved through efforts to promote “ecodriving”; another 5‐10% maybe be achievable by an “integrated approach” including better traffic management, intelligent transport systems, better vehicle and road maintenance, etc.
Driving behaviour with new types of vehicles, e.g. frequency of use of public recharging systems, day/night recharging patterns, etc. will affect how much these vehicles are driven, when and where they are driven, and potentially their GHG emissions impacts (e.g. based on
time‐of‐day charging) (Axsen and Kurani, 2012). Research in this area is still immature and is on‐going.
Driving rebound effects: Changes in driving in reaction to changes in the fuel cost of travel, e.g. due to fuel efficiency increases or shifts to cheaper fuel, is commonly called the (direct)
“rebound effect” (Greene et al., 1999). In North America this has been found to be in the range of a ‐0.05 to ‐0.30 fuel cost elasticity (e.g. a 50% cut in the fuel cost of driving results in a 2.5% to 15% increase in driving) with some studies finding it is declining and recently may be at the low end of this range (Hughes et al., 2006; Small and Van Dender, 2007). This may generally be higher in countries with more modal choice options, or where price sensitivity is higher, but research is poor for most countries and regions outside OECD. The rebound reduces fuel savings, but can be addressed for example by fuel taxes or road pricing that offsets the lower travel cost created by efficiency improvements.
Oil market response: Changes in fuel demand in one region can cause a change in world oil prices (Greene, 2010b). Cutting demand (e.g. via efficiency or increasing the use of alternative fuels) could lower oil prices, resulting in more total fuel use. The extent of this effect depends on many factors, such as those that affect supply and demand elasticities
First Order Draft (FOD) IPCC WG III AR5
Do Not Cite, Quote or Distribute 27 of 100 Chapter 8 WGIII_AR5_Draft1_Ch08_final2.doc 19 July 2012
(Hochman et al., 2010; Rajagopal et al., 2011; Chen and Khanna, 2012). (See Chapter 7 for for further discussion on Bioenergy.)
1 2
5 6 7 8
10 11 12 13 14 15 16 17 18 19 20 21 22 23 24 25 26 27
29 30 31 32 33 34 35 36 37 38
39 40 41 42 43 44 45 46 47
8.4 Infrastructure and systemic perspectives 3
8.4.1 Path dependencies of transport infrastructures 4
Transport modes and their infrastructures form a system that has evolved technologically over decades into the current stage of maturity. Technological change in vehicles and fuels, changes in spatial settlement patterns and behavioural change in the systemic use of infrastructures will need to either adapt to the existing system or seek to create and sustain an alternative.
8.4.1.1 Globalization, infrastructure and structural change 9
Transport infrastructure development is closely related to average income and economic growth patterns (Estache and Fay, 2007). With rising income, personal (e.g. car‐oriented) transport tends to increase in absolute terms and modal share. As economies shift from agricultural to industrial to service economies, the emission share of transport, in comparison to other sectors, tends to rise as well (Schäfer, 2009). Growing transport use is not only a key outcome of income growth but also is a driver of economic growth (Aschauer, 1989)(Straub, 2011) (Fernald, 1999), with the highest productivity gains coming in the intermediate stages of road and rail infrastructure build‐up (Romp and de Haan, 2007) (Hurlin, 2006). Development of transport infrastructure for freight is closely related to growth in international trade and globalization, nurturing the rapidly increasing integration of the global world economy. The volume of international trade and global freight movements tends to increase faster than the rate of economic growth (United Nations Conference on Trade and Development, 2010). This is driven by increasing geographic diversity in supply chains and economic centralisation (Behrens and Picard, 2011). Reduced transport costs enable economies of scale in production favouring spatial regional agglomerations (Fujita et al., 1999) as exemplified by the rapid economic development along the Chinese coast (World Bank, 2009). Infrastructure investments shape intraregional agglomeration dynamics, causing centralization or decentralization of economic activities (e.g. (Puga, 2002); (Dall’erba and Hewings, 2003), partially determining GHG emissions of freight and passenger transport.
8.4.1.2 GHG emissions impacts of transport infrastructure 28
The construction, operation, maintenance and eventual disposal of transport infrastructure (e.g. rail tracks, highways, airports) all result in GHG emissions. Full life‐cycle emissions accounting for transport requires these infrastructure‐related emissions to be included, as well as those for vehicles and fuels (8.3.5).Life‐cycle GHG emissions from vehicle manufacture, infrastructure provision, and fuel supply chains in the U.S. can contribute nearly as much as emissions from vehicle operation for rail, around one third for road, and one quarter for aircraft (Fig. 8.4.1) (Chester and Horvath, 2009), but variability of these estimates across vehicles, manufacturing, systems, and regions is probably large. The infrastructure component dominates the total emissions of rail systems, its absolute magnitude being comparable to that of road infrastructure on a per passenger volume basis.
As is the case for vehicle emissions per passenger kilometre, life‐cycle emissions savings depend critically on vehicle occupancy (Chester and Horvath, 2010). A case‐study of the Californian high‐speed railway indicated that 80% of infrastructure emissions were derived from material production, and 16% from the transport of construction material (Chang and Kendall, 2011). Tunneling and aerial structures accounted for only 15% of the route’s length, but were responsible for 60% of emissions. Life‐cycle emissions from construction could be recuperated within two years of use (Chang and Kendall, 2011). Life‐cycle emissions for rail can be reduced by the increased deployment of low‐carbon materials and recycling of rail track materials at their end‐of‐life (Network Rail, 2009). If rail systems achieve modal shift from road vehicles, life‐cycle emissions from rail infrastructure may be
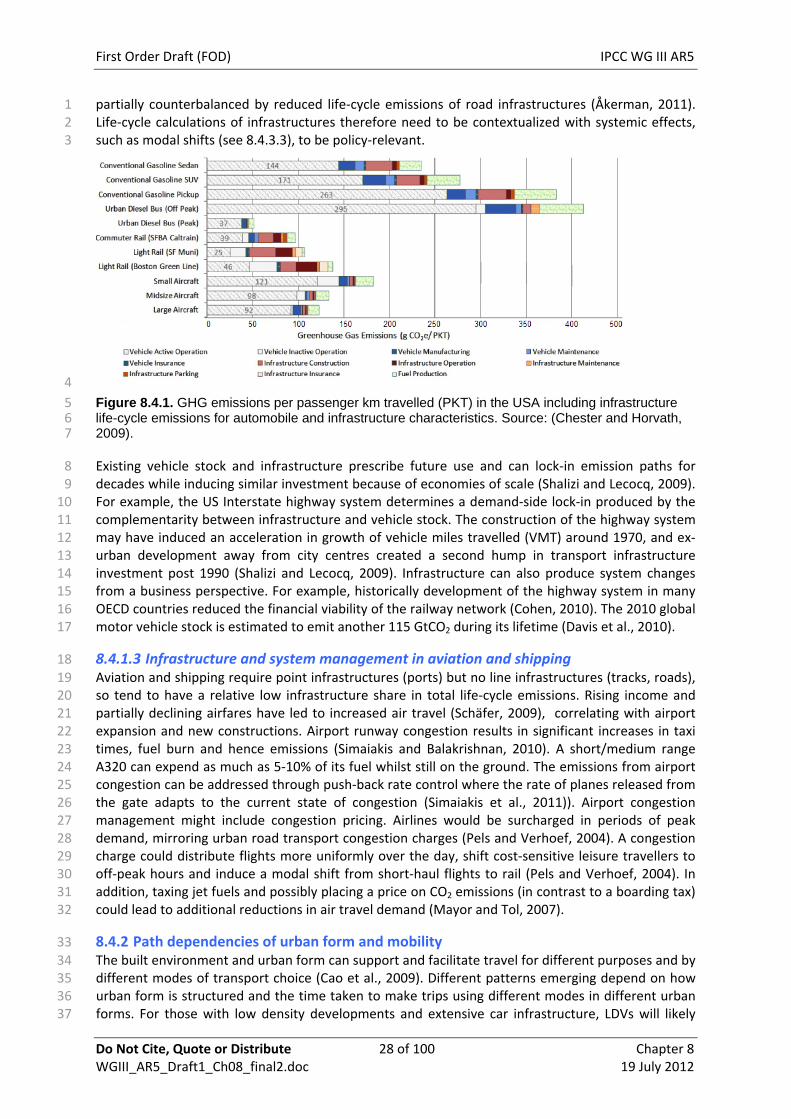
First Order Draft (FOD) IPCC WG III AR5
Do Not Cite, Quote or Distribute 28 of 100 Chapter 8 WGIII_AR5_Draft1_Ch08_final2.doc 19 July 2012
partially counterbalanced by reduced life‐cycle emissions of road infrastructures (Åkerman, 2011). Life‐cycle calculations of infrastructures therefore need to be contextualized with systemic effects, such as modal shifts (see 8.4.3.3), to be policy‐relevant.
1 2 3
4
5 6 7
8 9
10 11 12 13 14 15 16 17
19 20 21 22 23 24 25 26 27 28 29 30 31 32
34 35 36 37
Figure 8.4.1. GHG emissions per passenger km travelled (PKT) in the USA including infrastructure life-cycle emissions for automobile and infrastructure characteristics. Source: (Chester and Horvath, 2009).
Existing vehicle stock and infrastructure prescribe future use and can lock‐in emission paths for decades while inducing similar investment because of economies of scale (Shalizi and Lecocq, 2009). For example, the US Interstate highway system determines a demand‐side lock‐in produced by the complementarity between infrastructure and vehicle stock. The construction of the highway system may have induced an acceleration in growth of vehicle miles travelled (VMT) around 1970, and ex‐urban development away from city centres created a second hump in transport infrastructure investment post 1990 (Shalizi and Lecocq, 2009). Infrastructure can also produce system changes from a business perspective. For example, historically development of the highway system in many OECD countries reduced the financial viability of the railway network (Cohen, 2010). The 2010 global motor vehicle stock is estimated to emit another 115 GtCO2 during its lifetime (Davis et al., 2010).
8.4.1.3 Infrastructure and system management in aviation and shipping 18
Aviation and shipping require point infrastructures (ports) but no line infrastructures (tracks, roads), so tend to have a relative low infrastructure share in total life‐cycle emissions. Rising income and partially declining airfares have led to increased air travel (Schäfer, 2009), correlating with airport expansion and new constructions. Airport runway congestion results in significant increases in taxi times, fuel burn and hence emissions (Simaiakis and Balakrishnan, 2010). A short/medium range A320 can expend as much as 5‐10% of its fuel whilst still on the ground. The emissions from airport congestion can be addressed through push‐back rate control where the rate of planes released from the gate adapts to the current state of congestion (Simaiakis et al., 2011)). Airport congestion management might include congestion pricing. Airlines would be surcharged in periods of peak demand, mirroring urban road transport congestion charges (Pels and Verhoef, 2004). A congestion charge could distribute flights more uniformly over the day, shift cost‐sensitive leisure travellers to off‐peak hours and induce a modal shift from short‐haul flights to rail (Pels and Verhoef, 2004). In addition, taxing jet fuels and possibly placing a price on CO2 emissions (in contrast to a boarding tax) could lead to additional reductions in air travel demand (Mayor and Tol, 2007).
8.4.2 Path dependencies of urban form and mobility 33
The built environment and urban form can support and facilitate travel for different purposes and by different modes of transport choice (Cao et al., 2009). Different patterns emerging depend on how urban form is structured and the time taken to make trips using different modes in different urban forms. For those with low density developments and extensive car infrastructure, LDVs will likely

First Order Draft (FOD) IPCC WG III AR5
Do Not Cite, Quote or Distribute 29 of 100 Chapter 8 WGIII_AR5_Draft1_Ch08_final2.doc 19 July 2012
dominate mode choice for most types of trips. Walking and cycling can be made easier and safer, where high accessibility to a variety of activities are located within relative short distances (Ewing and Cervero, 2010). Conversely the stress and physical efforts of cycling and walking can be greater in cities that consistently prioritize suburban housing developments leading to distances that accommodate the high‐speed movement and volume of cars (Naess, 2006). Suburban residents drive more and walk less than residents living in inner city neighbourhoods (Cao et al., 2009). Similarly, public transit systems are difficult to deploy successfully in suburbs with low densities (Frank and Pivo, 1994).
1 2 3 4 5 6 7 8
10 11 12 13 14 15
16 17 18 19 20 21 22 23 24 25 26 27 28 29 30 31
33 34 35 36 37 38 39 40 41 42 43 44 45 46 47 48
8.4.2.1 Automobile dependence and automobility 9
Automobile dependence is a condition where there is little choice for inhabitants to reach most destinations other than to drive (Newman and Kenworthy, 1999). To reduce dependence on LDVs in cities, given the interacting factors of transport, economic and cultural priorities, could require a combination of changes in urban form, transport pricing, and transport infrastructure as well as changes to vehicle and fuel technologies. Data from OECD cities demonstrate a saturation and even small decline in vehicle km travelled (Newman and Kenworthy, 2011b).
Automobility is a self‐reproducing system which is composed of the car as a manufactured object; the car as an item of individual consumption and status; the complexity constituted by inter‐linkages to other industries, such as oil, infrastructure construction, urban and land‐use planning, suburban housing and building construction, and land‐use planning; the quasi‐private nature of the automobile, framing life‐style and putting constraints on leisure, family and work life; a culture sustaining discourses of appropriate citizenship with respect to mobility; and impacts on climate change, the environment and resources (Urry, 2007). Automobility produces new movements that differ from public rail‐based transport due to its boundless flexibility. It unbundles home, work, leisure and business and spatially necessitates car use to accommodate different activities, and hence, changes the way of social interaction. Increasing returns to scale in automobile production, infrastructure provision and self‐reinforcing customs enabled mass adoption but also produced lock‐in of automobility (Unruh, 2000). For example, public institutions focus on automobile infrastructures (e.g., highway engineering), which rely on their own “rule of thumbs”, rarely accommodating for climate change mitigation or sustainability perspectives (Unruh, 2000). In turn, a transformation towards a sustainable transport system requires simultaneous changes in non‐transport domains, e.g. in relevant public institutions (Unruh, 2000).
8.4.2.2 Urban form and GHG emissions 32 Urban population density correlates with GHG emissions from land transport (Newman and Kenworthy, 1996; Kennedy et al., 2011; Rickwood et al., 2011). Urban density is closely linked with transport energy demand as it enables non‐car modes to be viable (Newman and Kenworthy, 2006). Both aggregated and disaggregated studies that analyse individual transport use confirm the relationship between land‐use and travel (Weisz and Steinberger, 2010; Kahn Ribeiro et al., 2012). Land use, employment density, street design and connectivity, and high transit accessibility also contribute to reducing car dependence and use (Handy et al., 2002; Ewing, 2008; Cervero and Murakami, 2010; Olaru et al., 2011). The autonomous role that residential choice has relative to the role of urban form is not easy to determine quantitatively (Brownstone, 2008). The main line of research supports evidence of the impact of the built environment on travel behaviour and residential choice (Naess, 2006; Ewing and Cervero, 2010). Both self‐selection and the built environment can explain travel behaviour with slightly more emphasis on the latter (Cao et al., 2009). Self‐selection causes under‐estimation of the role of the built environment (Ewing and Cervero, 2010). In some American studies population density and job density had surprisingly little effect on vehicle miles travelled (VMT) once controlled for accessibility of destinations and street network design (Ewing and Cervero, 2010). There exists a non‐linear relationship between urban density and

First Order Draft (FOD) IPCC WG III AR5
Do Not Cite, Quote or Distribute 30 of 100 Chapter 8 WGIII_AR5_Draft1_Ch08_final2.doc 19 July 2012
modal choice. Above critical threshold values in population and employment density, walking and mass transit begins to systematically substitute for car travel (Frank and Pivo, 1994).
1 2
3 4 5 6 7
9 10 11 12 13 14 15 16 17
18 19 20 21 22 23 24 25 26 27 28 29 30 31 32
33 34 35 36 37 38 39 40 41 42 43 44 45 46
Land use diversity, intersection density, and the number of destinations within walking distance are identified variables for walking modal choice. In the US, public transport use is equally related to proximity to transit and street network design variables, with land use diversity a secondary factor (Ewing and Cervero, 2010) but these results cannot be directly translated to other world regions. Mitigation policies related to urban form are discussed in 8.10.
8.4.2.3 Modal shift opportunities for passengers 8 A shift of travel from cars and aviation to more efficient modes such as public transport (bus and rail), walking and cycling would provide significant GHG reduction benefits as well as various other economic, social and environmental benefits (Creutzig and He, 2009)(Rabl and de Nazelle, 2012). The CO2 benefits depend on the relative efficiency of the modes, measured in energy per passenger km. Given relatively slow rates of improvement in average carbon intensity of car and air modes, a 25% reduction in car and air travel by 2050 (relative to baseline growth), with half the travel shifted to rail, bus, and non‐motorised travel and half the travel eliminated through better urban planning and telematic substitution, results in an estimated 20% reduction in transport energy use and CO2 emissions (IEA, 2009; (Cuenot et al., 2012).
Urban transport is particularly susceptible to modal shift as it is subject to a prisoner’s dilemma: an individual’s rational choice of private car (non‐cooperative behaviour) leads to CO2 emissions, congestion, air pollution and noise, whereas the use of public transport and non‐motorized transport (co‐operative behaviour) is comparably socially advantageous (Camagni et al., 2002) (Creutzig and He, 2009) see also 8.7). A modal shift away from cars also reduces land use. In Paris the private car accounted for 33% of trips and uses 94% of road space, whereas the bus accounts for 19% of trips but uses only 2.3% of road space space (Servant, 1996). To stay within an average daily travel time budget of 60 to 70 minutes a day (Zahavi and Talvitie, 1980; Newman and Kenworthy, 1999; Schäfer, 2000), transit requires a fast service networked to serve the majority of the city. Compact settlement structures support fast transit by reducing distances and increasing accessibility, and by increasing competitiveness of other modes (Camagni et al., 2002) (Zahavi and Talvitie, 1980; Newman and Kenworthy, 1999; Schäfer, 2000). Public transit modal share increases with a decline in the relative trip time compared with the car. Walking and cycling infrastructure are complementary to public transit and can help foster it (Newman and Kenworthy, 2006). Along with time saving, travel costs, safety and quality of services equally impact modal shift.
With rising income and urbanization, there will likely be a strong pull toward increasing car ownership and use in many countries. However, public transit mode shares have been preserved at fairly high levels in cities that have achieved high population densities and that have invested heavily in high quality transit systems (Cervero, 1998). Investments into mass rapid transit timed with income increases and population size/density increases has been successful in some Asian megacities (Acharya and Morichi, 2007). As traffic congestion grows and freeway infrastructure reaches physical, political and economic limits, the modal share of public transit has increased in some OECD countries (Newman and Kenworthy, 2011b). In cities with quality mass transit infrastructure there is likely to be substantial modal share of public transit (Cervero, 1998). Bus rapid transit (BRT) systems can offer similar benefits as metro systems at much lower costs (Deng and Nelson, 2011). In Delhi, India, a transition to a bus‐system would result in a decrease in energy use of 31% and a transition to metro‐rail based system would result in a decrease of 61% (Khanna et al., 2011). While metro‐based systems could have lower CO2 emissions and higher capacity than BRT and light rail capital costs are higher (Table 8.4.1).
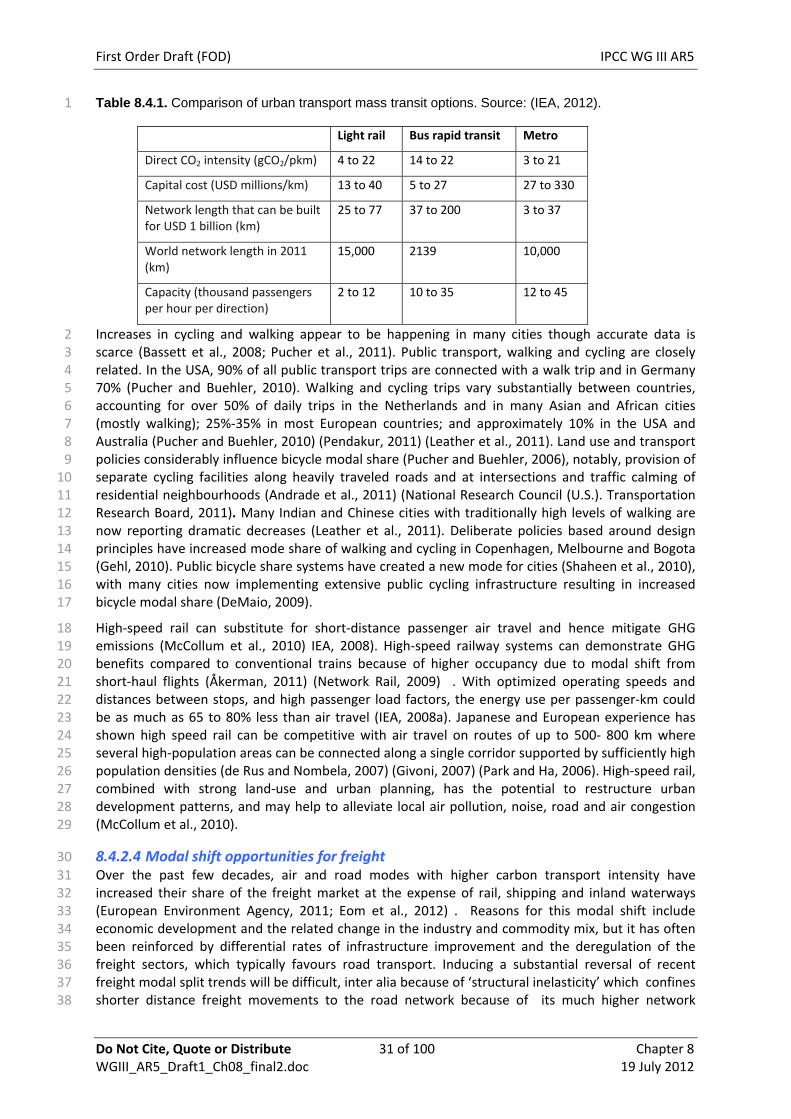
First Order Draft (FOD) IPCC WG III AR5
Do Not Cite, Quote or Distribute 31 of 100 Chapter 8 WGIII_AR5_Draft1_Ch08_final2.doc 19 July 2012
Table 8.4.1. Comparison of urban transport mass transit options. Source: (IEA, 2012). 1
Light rail Bus rapid transit Metro
Direct CO2 intensity (gCO2/pkm) 4 to 22 14 to 22 3 to 21
Capital cost (USD millions/km) 13 to 40 5 to 27 27 to 330
Network length that can be built for USD 1 billion (km)
25 to 77 37 to 200 3 to 37
World network length in 2011 (km)
15,000 2139 10,000
Capacity (thousand passengers per hour per direction)
2 to 12 10 to 35 12 to 45
Increases in cycling and walking appear to be happening in many cities though accurate data is scarce (Bassett et al., 2008; Pucher et al., 2011). Public transport, walking and cycling are closely related. In the USA, 90% of all public transport trips are connected with a walk trip and in Germany 70% (Pucher and Buehler, 2010). Walking and cycling trips vary substantially between countries, accounting for over 50% of daily trips in the Netherlands and in many Asian and African cities (mostly walking); 25%‐35% in most European countries; and approximately 10% in the USA and Australia (Pucher and Buehler, 2010) (Pendakur, 2011) (Leather et al., 2011). Land use and transport policies considerably influence bicycle modal share (Pucher and Buehler, 2006), notably, provision of separate cycling facilities along heavily traveled roads and at intersections and traffic calming of residential neighbourhoods (Andrade et al., 2011) (National Research Council (U.S.). Transportation Research Board, 2011). Many Indian and Chinese cities with traditionally high levels of walking are now reporting dramatic decreases (Leather et al., 2011). Deliberate policies based around design principles have increased mode share of walking and cycling in Copenhagen, Melbourne and Bogota (Gehl, 2010). Public bicycle share systems have created a new mode for cities (Shaheen et al., 2010), with many cities now implementing extensive public cycling infrastructure resulting in increased bicycle modal share (DeMaio, 2009).
2 3 4 5 6 7 8 9
10 11 12 13 14 15 16 17
18 19 20 21 22 23 24 25 26 27 28 29
31 32 33 34 35 36 37 38
High‐speed rail can substitute for short‐distance passenger air travel and hence mitigate GHG emissions (McCollum et al., 2010) IEA, 2008). High‐speed railway systems can demonstrate GHG benefits compared to conventional trains because of higher occupancy due to modal shift from short‐haul flights (Åkerman, 2011) (Network Rail, 2009) . With optimized operating speeds and distances between stops, and high passenger load factors, the energy use per passenger‐km could be as much as 65 to 80% less than air travel (IEA, 2008a). Japanese and European experience has shown high speed rail can be competitive with air travel on routes of up to 500‐ 800 km where several high‐population areas can be connected along a single corridor supported by sufficiently high population densities (de Rus and Nombela, 2007) (Givoni, 2007) (Park and Ha, 2006). High‐speed rail, combined with strong land‐use and urban planning, has the potential to restructure urban development patterns, and may help to alleviate local air pollution, noise, road and air congestion (McCollum et al., 2010).
8.4.2.4 Modal shift opportunities for freight 30
Over the past few decades, air and road modes with higher carbon transport intensity have increased their share of the freight market at the expense of rail, shipping and inland waterways (European Environment Agency, 2011; Eom et al., 2012) . Reasons for this modal shift include economic development and the related change in the industry and commodity mix, but it has often been reinforced by differential rates of infrastructure improvement and the deregulation of the freight sectors, which typically favours road transport. Inducing a substantial reversal of recent freight modal split trends will be difficult, inter alia because of ‘structural inelasticity’ which confines shorter distance freight movements to the road network because of its much higher network

First Order Draft (FOD) IPCC WG III AR5
Do Not Cite, Quote or Distribute 32 of 100 Chapter 8 WGIII_AR5_Draft1_Ch08_final2.doc 19 July 2012
density (Rich et al., 2011). If growth in global truck travel between 2010 and 2050 could be cut by half from the projected 70% and shifted to expanded rail systems, about a 20% reduction in fuel demand and CO2 could be achieved with only about a fifth of this savings offset by increased rail energy use (IEA, 2009). The European Commission set an ambitious target of having all freight movements over distances greater than 300km to use rail or water‐borne modes by 2030 leading to major changes in modal shares (Fig. 8.4.2) (Tavasszy and Meijeren, 2011).
1 2 3 4 5 6
7
8 9
10 11 12 13 14 15 16 17 18 19
20 21 22 23 24 25
26 27 28 29 30 31 32 33 34 35 36
Figure 8.4.2. Projected freight modal split in the EU 25 in 2030: business-as-usual trend and assuming EU White Paper modal split target is achieved (Tavasszy and Meijeren, 2011).
The capacity of the European rail network would have to at least double to handle this huge increase in freight traffic and the forecast growth in rail passenger volumes, even after allowance is made for the planned lengthening of trains and a reduction in proportion of railway rolling stock running empty (CE Delft, 2011). Longer term transformations need to take account of the differential rates at which low‐carbon technologies could impact on the future carbon intensity of freight modes. Applying current average intensity values (8.3.3) may result in over‐estimates of the potential carbon benefits of the modal shift option. The rate of carbon‐related technical innovation, including energy efficiency improvements, has been faster in HDV than rail freight and the vehicle replacement rate is typically much shorter ensuring a more rapid uptake of new technological uptake.
Rail and water modes are likely to benefit from the projected lengthening of freight hauls as their comparative advantage lies in the movement of freight over longer distance. Rail and water command much larger shares of the freight market in countries such as the US and Russia where they are able to exploit their long‐haul advantage. The economic integration of regional economic trading blocks, such as the EU and Mercosur, will promote greater use of these long haul modes, but it will also increase the freight transport intensity of these economies.
The potential for shifting passengers to greener modes is particularly high in urban area. The opposite is the case for freight. While examples can be found of intra‐urban rail freight movements (e.g. (Maes and Vanelslander, 2011), city logistical systems are almost totally reliant on road vehicles and likely to remain so. The greater the length of haul for freight, the more competitive the lower carbon surface modes become. Within cities, the concept of modal split needs to be redefined and related to the interaction between personal and freight movement. Currently large amounts of freight on the so‐called ‘last mile’ to the home are carried in LDVs and public transport vehicles. With the rapid growth of online retailing much of this car‐borne freight, which seldom appears in freight transport statistics, is transferred to vans. Comparative analyses of conventional and online retailing suggest that substituting a van delivery to the home for personal shopping trip by car can yield a significant carbon saving (Edwards et al., 2010).

First Order Draft (FOD) IPCC WG III AR5
Do Not Cite, Quote or Distribute 33 of 100 Chapter 8 WGIII_AR5_Draft1_Ch08_final2.doc 19 July 2012
At a global level, opportunities for switching freight from air to shipping services are limited. The two markets are relatively discrete and the products they handle have widely differing monetary values and time‐sensitivity. The deceleration of deep‐sea container vessels in recent years in accordance with the ‘slow steaming’ policies of the shipping lines has further widened the transit time gap between sea and air services. Future increases in the cost of fuel may, however, encourage businesses to economize on their use of airfreight, possibly switching to sea‐air services in which products are airfreight for only part of the way. This merger of sea and air transport offers substantial cost and CO2 savings for companies whose global supply chains are less time‐critical.
1 2 3 4 5 6 7 8
10 11 12 13 14 15 16 17 18 19 20
22 23 24 25 26 27 28 29 30 31 32 33 34 35 36 37 38 39 40 41 42 43 44 45 46 47
8.5 Climate change feedback and interaction with adaptation 9
Transport is impacted by climate change both positively and negatively. Data and literature on the feedbacks between climate change mitigation and adaptation are relatively limited. A number of interactions provide a better understanding of the direct and indirect impacts of climate change on transport activity, modal choice and technological aspects. Impacts are very dependent on regional climate change and the nature of local transport infrastructure and systems. Such impacts have not been well studied and sufficient information does not exist to determine their net positive or negative forcing impacts on many feedback scenarios. The principal drivers that lead to climate change feedbacks throughout the transport sector include factors such as the accessibility of transport routes, interrelations of mitigation and adaptation efforts in urban areas, the impacts of extreme weather events on infrastructure cost and transport operations, and changes in emissions due to environmental conditions that impact on fossil fuel combustion systems.
8.5.1 Accessibility and feasibility of transport routes 21
The usual transport routes of people and goods in the northern hemisphere could be changed by climate change impacts due to changes in ice cover in polar regions and the Great Lakes region of North America (Prowse and Brown, 2010). Decreases in the spatial and temporal extent of ice cover in these regions have opened the potential for new and shorter shipping routes and may allow shipping routes to remain open for longer periods during the calendar year (Drobot et al., 2009; Stephenson et al., 2011). The expanded use of these new shipping routes could lead to reduced GHG emissions due to the greater efficiencies of these marine transport modes compared with alternative air and land shipping modes to the same destinations. For example, the Northern Sea Route (NSR) between Shanghai and Rotterdam is approximately 2,500 nautical miles (about 40%) shorter than the route via the Suez canal. The NSR passage takes 18‐20 days compared to 28‐30 days via the southern route (Verny and Grigentin, 2009; McKinnon and Kreie, 2010). Actual time saving may be less as ice‐free conditions may not necessarily mean optimal navigation conditions. Climate change will not only affect ice coverage but may also increase the frequency and severity of northern hemisphere blizzards and arctic cyclones (Wassmann, 2011; Liu et al., 2012). It is estimated that the transport of oil and gas through the NSR could increase from 5.5 Mt in 2010 to 12.8 Mt by 2020 (Ho, 2010). The passage may also become a viable option for other bulk carriers and container shipping in the near future (Verny & Grigentin, 2009; Schøyen & Bråthen, 2011), even though estimates of the likely overall demand on the NSR and other potential sea routes are rare. In addition to the shorter trip distances the NSR provides a safer passage for ships by avoiding the Strait of Malacca and the Gulf of Aden, both associated with a high risk of piracy (B.Guha and A. S. Guha 2011). The economic viability of the NSR is still uncertain with assessments of potentially profitable operation through the NSR (Liu and Kronbak, 2010) and other more pessimistic prospects for the trans‐arctic corridors (Econ, 2007). While opening of previously frozen waterways may shorten trip distances, the increase in shipping through these sensitive ecosystems could lead to an increase in local environmental and climate change impacts unless additional emissions controls are implemented for these shipping routes (Wassmann, 2011).

First Order Draft (FOD) IPCC WG III AR5
Do Not Cite, Quote or Distribute 34 of 100 Chapter 8 WGIII_AR5_Draft1_Ch08_final2.doc 19 July 2012
Of specific concern are the emissions of black carbon and the precursors of photochemical smog in the Polar Regions that could lead to additional local positive regional climate forcing (Corbett et al., 2010). Changes in climate are also likely to affect northern inland waterways (Millerd, 2011). In summer these effects are likely to adversely impact on inland shipping where reductions in water levels result from climate change. (Jonkeren et al., 2007) examined the economic impact of lower water levels in the River Rhine, which is an example of the potential impact of warming on inland waterways during summer (Jonkeren et al., 2007) . In winter, however, lower incidence of freezing events is likely to increase use of inland waterways. Both effects are likely to affect in turn modal choice for freight transport positively and negatively (Jonkeren et al., 2011), with the net effect of this still remaining uncertain.
1 2 3 4 5 6 7 8 9
10
12 13 14 15 16 17 18 19 20
21 22 23 24
26 27 28 29 30 31 32 33
34 35 36 37 38 39 40 41 42 43 44 45 46 47 48
8.5.2 Relocation of production, international trade and global supply chains 11
Agricultural production is particularly vulnerable to the impacts of climate change (Ericksen et al., 2009; Hanjra and Qureshi, 2010; Nielsen and Vigh, 2012; Teixeira et al., 2012; Vermeulen et al., 2012) (Tirado et al. 2010). These changes are likely to affect global trade and, with that, freight transport patterns, even though the scale and regional distribution are uncertain (Vermeulen et al., 2012). A number of scenarios indicate crop yield production capacity is affected by climate change, which indicates that Africa and parts of Asia are particularly vulnerable and likely to relocate food production within the region or further away (Nielsen and Vigh, 2012; Teixeira et al., 2012). Biofuel production can be adversely affected due to the vulnerability of agriculture to climate change (de Lucena et al., 2009).
Globally Interconnected supply chains and modern logistics are particularly vulnerable due to the integration of geographically dispersed networks of production and just‐in‐time delivery, which yield for a high level of efficiency but may affect production when supply or transport facilities are affected by extreme weather events (Henstra, D., Ruijgrokand, C., Tavasszy, 2007; Love et al., 2010).
8.5.3 Urban form and infrastructure 25
Population density on urban areas can support transport efficiency (8.4) but also foster mitigation efforts in other energy end‐use sectors, in particular buildings (cf. 9.3). However, density may also increase the exposure of a larger number of people to extreme weather events triggered by climate change (IPCC, 2012). The integration of mitigation and adaptation objectives in urban planning is vital to manage GHG emissions in cities without increasing vulnerability (Romero‐Lankao and Dodman, 2011). Climate change is likely to multiply existing pressures in urban areas, such as access to clean water, but also social inequalities in the exposures to risks (Tschakert, 2007; Eakin and Wehbe, 2009; Ziervogel and Zermoglio, 2009; O’Brien et al., 2009).
Adaptation efforts are likely to increase transport infrastructure costs (Hamin & Gurran, 2009), which may impact on the selection of infrastructure projects. Climate change impacts will also affect maintenance costs of transport infrastructure (Jollands et al., 2007; Larsen et al., 2008). This is likely to affect all modes at varying degrees, although to what extent remains uncertain. More extreme weather events are likely to affect transport operations (Taylor and Philp, 2010) and may also affect individual travel behaviour. For example, extreme weather events may increase trip lengths as routes become impassable or modal shifts become necessary (Jollands et al., 2007). The effects on transport operations very much depend on the vulnerability of the transport mode. For aviation, for example, the impact of climate change may translate into a greater number and longevity of weather‐related delays of flights with extreme weather possibly occurring more frequently and more severely, thereby bringing further disruptions (Eurocontrol, 2008). Similar disruptions are likely for maritime transport (Becker et al., 2012). The potential impacts on land transport infrastructure are well documented (Hunt & Watkiss, 2011). However, the extent to which one land transport mode may be more vulnerable than another greatly varies from country to country (Koetse and Rietveld, 2009).
First Order Draft (FOD) IPCC WG III AR5
Do Not Cite, Quote or Distribute 35 of 100 Chapter 8 WGIII_AR5_Draft1_Ch08_final2.doc 19 July 2012
8.5.4 Fuel combustion and technologies 1
Increased ambient temperatures and changed moisture content is likely to affect nitrogen oxide, carbon monoxide, methane and particulate matter emissions from diesel engines and may also affect spark ignition engines using gasoline or biofuels and marine engines using heavy fuel oils (STUMP et al., 1989; Rakopoulos, 1991; Cooper and Ekstrom, 2005; Motallebi et al., 2008) (Lin and Jeng, 1996; McCormick et al., 1997; Pidolal. 2012) Higher temperature will lead to higher evaporative emissions of volatile organic compound emissions (VOCs) (Roustan et al., 2011) and are expected to lead to higher ozone levels with increasing temperatures (Bell et al., 2007). Given the complexity of regional climate change and the sensitivity of combustion systems to environmental conditions (Motallebi et al., 2008; Wei et al., 2011), it is difficult to predict the temporal and spatial distribution of these feedbacks on regional climate forcing. Whether the overall effects are positive or negative, feedbacks need to be considered but are a major uncertainty in regional climate response (Ramanathan & Carmichael, 2008).
2 3 4 5 6 7 8 9
10 11 12 13
14 15 16 17 18 19
21 22 23 24 25 26
28 29 30 31 32 33 34 35 36 37 38 39 40 41
42 43 44 45 46 47 48
As global average temperatures increase, the demand for on‐board air‐conditioning will also increase, which will yield to decreases in vehicle fuel efficiencies. The use of air conditioning in a passenger LDV can lead to a decrease in fuel efficiency of around 3‐5% (Farrington and Rugh, 2000; IEA, 2009a). The increased demand for air conditioning may also affect public transport, which could negatively affect the fuel consumption of buses and trains and may also extend to cooling entire stations (Koetse and Rietveld, 2009).
8.6 Costs and potentials 20
The potential for reducing GHG emissions from the transport sector, as well as the associated costs, will vary widely across countries and regions, as will the appropriate polices and measures that can accomplish such reductions (8.10) (Kahn Ribeiro et al., 2007; Li, 2011). Potentials and costs are a function of the stringency of climate goals and their respective GHG concentration stabilization levels (Fischedick et al., 2011). This section discusses potentials and costs according to activity, structure, energy intensity and carbon intensity effect components (Fig. 8.1.2).
8.6.1 Activity effect component – demand reduction 27
Climate change constitutes only a relatively small part of numerous negative transport externalities comprising also congestion, local air pollution, noise, accidents, loss in quality of life, public health costs and under‐priced space consumption (see also 8.8)(Calthrop and Proost, 1998; Delucchi and McCubbin, 2011; Friedrich and Quinet, 2011;(Proost, 2011). Most negative transport externalities occur in cities, particularly those dominated by individual motorized transport (Maibach et al., 2007; Button, 2010). Reducing car usage in cities can be a reasonable goal but the cost‐benefit evaluation depends on many local factors including population density, modal share, urban form and local climate (Proost, 2011). Transport activity produces also positive externalities such as reduced labour market frictions linked to enhanced economic activity. Optimally, transport should be priced, as any other commodity, at the opportunity costs (Calthrop and Proost, 1998). This price will include all the externalities, so that the cost of for example pollution or traffic accidents will be internalized if the social costs were known (Pigou, 1920). Transport externalities are most commonly priced indirectly by parking fees, city tolls, vehicles registration, fuel use tax, carbon taxes etc. (Delucchi and McCubbin, 2011) (Small and Verhoef, 2007) .
Cost‐benefit evaluations of congestion charges, a policy used in Singapore, London and Stockholm, have demonstrated negative costs (i.e. benefits) from activity reduction (TFL, 2007; Eliasson, 2008). Taking quantifiable externalities into account, a case study of Beijing suggests that about a 30% over‐provision of car transport exists there (Creutzig and He, 2009). Optimising the congestion level would correspond to a reduction of 8 Mt CO2 /yr. Such an activity reduction produces social benefits from saved time and improved public health. Costs relate only to the measure of activity reduction such as implementing a congestion charge, which can still be substantial (Prud’homme and Bocarejo,

First Order Draft (FOD) IPCC WG III AR5
Do Not Cite, Quote or Distribute 36 of 100 Chapter 8 WGIII_AR5_Draft1_Ch08_final2.doc 19 July 2012
2005)Prud’homme and Bocarejo, 2005). Depending on the specific city, a reduction in urban transport activity may range between 0‐30% (TFL, 2007; Eliasson, 2008; Creutzig and He, 2009). An alternative to road pricing, but complementary, could be to provide street space for pedestrians, cyclists and public transit (Gehl, 2010).
1 2 3 4
5 6 7 8 9
10 11 12 13 14 15 16 17 18 19 20
22 23 24 25
26 27 28 29 30 31 32 33 34 35 36 37 38
39 40 41 42 43 44 45
46 47 48 49
Significant potential exists for climate change mitigation by urban planning that includes policies targeting seven “Ds”: Density, Destinations‐accessibility, Distance to transit, Diversity‐ mixed use , Design‐quality, and Demand Management (Ewing and Cervero, 2010) This potential could be exploited in cities and metropolitan areas around the world that have followed low‐density and car oriented patterns of urban development similar to the ones observed in the US and Australia. In addition to physical planning, other strategies such as the inclusion of ICT to provide new and more efficient mobility services (and mobility substitution), incentives and pricing schemes for less‐GHG‐intensive travel, and more efficient locational policies between businesses, residences, and services so as to reduce vehicle travel (Lutsey and Sperling, 2009). Estimates for the US suggest that densifying urban development over about half a century could reduce annual CO2 emissions from gasoline vehicle fuels by 9–16% (Ewing, 2007). By densifying automobile‐dependent suburbs, driving could be reduced by 20‐40% compared to baseline development, as compact neighbourhoods use cars a third as much as automobile‐oriented suburbs (Ewing, 2007). Reducing urban sprawl and densifying US cities could reduce emissions by at least 10Gt CO2 during the period 2005‐2054 (Marshall, 2011). Car use in Australian cities could be reduced 50% if polycentric city policies were to be implemented (Newman et al., 2009).
8.6.2 Structure effect component – modal shift 21
Typical modal shifts include urban car trips shifting to cycling and walking (Ogilvie et al., 2004), or bus/rail transit (Ewing and Cervero, 2010); inter‐urban car trips shifting to rail or bus (Cantos‐Sánchez et al., 2009); and short‐medium haul air trips shifting to rail, particularly high‐speed rail including in China (Åkerman, 2011).
The costs associated with such modal shifts include the change in capital cost of providing the infrastructure and vehicles to accommodate the changes and the operating/maintenance/energy costs of providing the alternative transport service (translating into marginal costs to travellers and infrastructure costs to taxpayers), plus, sometimes, a cost from increased travel time. Costs can be very low, e.g. when streets are reassigned to cyclists or highways lanes are dedicated to inter‐urban bus transport (Sælensminde, 2004) (Wang, 2011); (Gotschi, 2011). Any change in benefits associated with modal shifts must also be factored in. An Australian study showed redevelopment around transit and walking reduced GHG emissions by 4.4 t CO2‐eq per household per year compared with developing a car dependent suburb (Trubka et al., 2010) . Cost savings for each new transit‐oriented household were for infrastructure savings (non‐transport), USD85,000; for public and private transport savings, USD250,000 over 50 years; for GHG emissions, USD2,900 assuming USD25/tCO2‐eq or USD24,990 at USD 215/tCO2‐eq (social cost); for health savings, USD4230 from reduced obesity; plus USD34,450 from increased productivity due to increased walking.
Modal shifts are associated with strong social net benefits, particularly where new travel options are provided that did not previously exist and that can increase utility for travellers at modest cost increases, or even a net cost decrease (8.7). Conceptually, this could include new or improved bus or rail urban transit systems non‐motorized transport (NMT) facilities, and rail, including high‐speed systems. Fulton and Agarwal (2012) estimated that widespread provision of bus rapid transit systems in India could have a net negative cost per tCO2 avoided, taking into account all direct system costs and travel benefits, giving a net benefit result for travellers and society.
Taking into account the total societal cost of vehicles, fuels and infrastructure, a significant cost reduction could occur from a shift away from growth in car and air travel and toward mass transit and non‐motorised travel, along with changes in urban form and increased use of ICT (IEA, 2009). Globally, a 25% reduction in road and air travel in 2050 relative to baseline growth, yields an

First Order Draft (FOD) IPCC WG III AR5
Do Not Cite, Quote or Distribute 37 of 100 Chapter 8 WGIII_AR5_Draft1_Ch08_final2.doc 19 July 2012
estimated 20% reduction in both fuel use and related CO2 emissions. The net change in infrastructure, vehicle and fuel costs associated with this scenario is on the order of a 10% reduction (USD 50 trillion lower than the USD 500 trillion baseline expenditure on vehicles, fuels and infrastructure world‐wide between 2010 and 2050) (IEA, 2012). This study did not attempt to estimate the private or external benefits (or disbenefits) of this scenario, so was only a partial analysis.
1 2 3 4 5 6
7 8 9
10 11 12 13 14 15 16 17 18 19 20 21 22 23
24 25 26 27 28 29 30 31 32 33
34 35 36 37 38
40 41
42 43 44 45 46 47 48 49
Modal choices and daily travel patterns are imbedded in frameworks and hierarchies of decisions (Ben‐Akiva and Lerman, 1985, p. ‐). Short term decisions related to car use such as driving style, speed, vehicle operation, and maintenance are frequently targeted with policies for eco‐driving (8.3). Medium and long term decisions affecting modal choice and travel behaviour can be connected to work and residential location decisions (Mokhtarian and Cao, 2008; Ewing and Cervero, 2010), but also to more individual considerations perceptions and attitudes (Steg, 2005) (Anable, 2005); emotions, aspirations (Sheller, 2004; Handy et al., 2005; Urry, 2007) and to lifestyle (Lanzendorf, 2002). Policies related to use of information technology, travel demand management and eco‐driving are considered the most effective to address these factors. The important role play by habits (Bamberg et al., 2011), context and socialization (Haustein et al., 2009) in forming individual attitudes and behavioural choices can affect how people may react to transport mitigation policy measures targeting car use (Gärling and Schuitema, 2007; Bamberg et al., 2011). Policies to internalize the external costs of transportation (e.g., congestion pricing), manage travel demand and incentivize smarter behaviours will be important in the shorter and medium terms in several urban areas. In addition, broad public and institutional education initiatives that cultivate a culture of sustainability (i.e., promote lifestyle changes that are more sustainable) are a critical part of the package of approaches needed.
For freight transport, a number of operational measures, such as improved logistics and just‐in‐time routing, are increasingly being implemented (Russo and Comi, 2010). Their potential has still not been fully exploited, despite their cost‐effectiveness (Henstra, D., Ruijgrokand, C., Tavasszy, 2007; McKinnon, 2010). By integrating transport modes, warehousing and inventory, the improved logistics can enable more efficient and seamless flows of goods in a globalised economy (Russo and Comi, 2011). Integrated supply chain management concepts can optimise vehicle utilization, energy efficiency and modal choice (McKinnon, 2010). Just‐in‐time delivery reduces the need for warehousing, but increases the energy intensity of freight movement by favouring road freight over rail or maritime transport and affects the resilience of the supply chain (Kamakaté and Schipper, 2009).
A challenge related to estimating the activity (8.6.1) and modal share potential of mitigation is that crucial dimensions, such as accessibility, are insufficiently and not systematically quantified. A comprehensive evaluation of urban form and land‐use policies, addressing accessibility improvements, could further change the overall potential of mitigation options (Ewing and Cervero, 2010).
8.6.3 Energy intensity effect component 39
Since road transport accounts for around three quarters of total energy consumption and related GHG emissions in the transport sector (Fig. 8.1.3) this section focuses primarily on this sub‐sector.
Several studies have examined the impact of vehicle technologies on passenger vehicle fuel efficiency over the timeline of 2010–2050 and also the associated increase in vehicle retail price (EUCAR/CONCAWE/JRC, 2008); (Bandivadekar,, 2008); IEA, 2008). Due to variations in assumptions about the employment of technologies and their impact on efficiency, differences among the studies are large but general assessments can be made. Conventional ICE vehicles could be continuously improved up to 2050 for a moderate price increase, to achieve close to a 50% increase in energy efficiency (Fig. 8.6.1). Incremental improvements in LDV and engine designs (8.3.1.1 and 8.3.1.2) have a cost effectiveness in new vehicles between US$‐20 to ‐102 /tCO2eq (Lutsey and Sperling,

First Order Draft (FOD) IPCC WG III AR5
Do Not Cite, Quote or Distribute 38 of 100 Chapter 8 WGIII_AR5_Draft1_Ch08_final2.doc 19 July 2012
2009). Additional increases in efficiency may be possible with the development of advanced engine and vehicle designs of BEVs, PHEVs and FCVs. Since these vehicle options tend to have higher purchase prices than those with conventional ICE engines, government support is needed to encourage the wide and rapid deployment in the market (NRC, 2010a). Improvement of traffic flow, driving practices (eco‐driving) in urban areas and other behavioural changes can also be a very cost‐effective means of reducing overall fuel consumption (8.3.5).
1 2 3 4 5 6
7
8 9
10 11
12 13
14
Figure 8.6.1 Additional vehicle costs above the current design of gasoline LDV (baseline “REF”) due to new technologies for various gasoline(G), Diesel(D), and advanced vehicles (BEV, PHEV, FCV) as a function of energy efficiency improvements based on three scenario models (EUCAR-2010+, MIT-2035, and IEA-ETP-2050).
(adv = advanced; BEV = battery electric vehicle; HEV = hybrid electric vehicle; DHEV = Diesel hybrid vehicle; PHEV = plug-in hybrid electric vehicle; FCV = fuel cell vehicle.
Source: (EUCAR/CONCAWE/JRC, 2008)(Bandivadekar,, 2008)IEA, 2008
[Note for reviewers. $ USD to be amended to standard IPCC year ‐ $2010] 15
16 17 18 19 20 21 22 23 24
25 26 27 28 29 30
Net CO2‐eq mitigation costs for advanced ICEs and ICE‐hybrids are close to USD0 /tCO2‐eq in the near term, and negative in the case of spark‐ignition ICE hybrids and advanced spark‐ignition ICEs in the long term (IEA, 2010d). PHEVs can deliver GHG savings at a cost between USD 140/tCO2‐eq and USD 210 /tCO2‐eq in the short term, reducing to USD 20/tCO2‐eq in the best case (electricity from cheap hydropower), and up to USD 50/tCO2‐eq using more expensive electricity (e.g. from bioenergy or solar PV) in the long term. In regions with low‐carbon renewable power generation, EVs with 150 km range could reach USD 80/tCO2‐eq, to USD 120/tCO2‐eq. In the same timeframe, FCV hybrids could achieve values close to USD 100/tCO2‐eq if they use hydrogen produced from low‐cost, low‐carbon electricity, with a high cost of USD 190/tCO2‐eq for more expensive hydrogen.
In the US, medium and HDVs can achieve a reduction in fuel consumption per km of 38‐51% by 2020 (NRC, 2010b). The largest tractor‐trailers could achieve around 50% reductions from a set of drive‐train and vehicle technologies and logistical changes for about USD85,000 per truck. For diesel fuel at USD0.66/l, a 3 year simple payback period results. However, potential fuel consumption reductions, capital costs, and breakeven diesel fuel prices vary for a range of truck types (Table 8.6.1).

First Order Draft (FOD) IPCC WG III AR5
Do Not Cite, Quote or Distribute 39 of 100 Chapter 8 WGIII_AR5_Draft1_Ch08_final2.doc 19 July 2012
1 2
3 4
5 6 7 8 9
11 12 13 14
15 16 17 18 19 20 21 22 23
24 25 26 27 28
29 30 31 32 33 34
35
Table 8.6.2: Fuel consumption reduction potential and cost-effectiveness estimates for five medium- and HDV types in 2015-2020 (NRC, 2010b)
*Assuming a 7% discount rate, a 10-year life, and excluding incremental operating and maintenance costs associated with the technologies.
For aviation, the improvement of aircraft and engine performance as well as improved air traffic management and more efficient operations will reduce fuel consumption of individual flights but globally this will be offset by expected growth in air traffic. In 2009, the ICAO set a goal of 2% annual fuel efficiency improvement through to 2050, but this is much lower than the expected growth rate (4.8% per year) of passenger traffic (ICAO, 2010a).
8.6.4 Carbon intensity effect component 10
Efforts to reduce the carbon intensity of transport fuels have been largely unsuccessful (Millard‐Ball and Schipper, 2011), despite the fact that diesel, with slightly lower CO2 emissions per unit of transport service compared with gasoline, has been increasingly introduced in different markets and displaced the total fuel share of gasoline3.
Low‐carbon biofuels and biomethane, coupled with renewable‐ and non‐renewable‐electricity based EVs for private use or public transport, are increasingly being deployed and future growth is expected (IEA, 2009a, 2010d; Fischedick et al., 2011)(IEA, 2010d). Around 20% of liquid transport fuel demand by 2050 could be met by biofuels (IEA, 2010d). This scenario is consistent with several of the current policy directions and assessments in the transport sector (Murphy et al., 2011).However, GHG emission offsets from some biofuels may be compromised by increasing emissions from land use changes (8.3.3.4 and Chapter 7) and competition for food and water (Koh and Ghazoul, 2008). the wide adoption of biofuels could affect the price of oil and also global oil demand with implications for net changes in GHG emissions (Rajagopal et al., 2011).
The cost associated to biofuel production varies across regions and raw materials. According to The annual average cost of substituting gasoline with ethanol in Thailand was USD25 ‐ 195 /tCO2eq (Amatayakul and Berndes, 2007). The cost of producing advanced biofuels tends to be higher than first generation biofuels even though delivered cellulosic feedstocks costs are usually lower than that of conventional feedstocks (Timilsina and Shrestha, 2011).
If the share of low‐grade, carbon intensive transport fuels from non‐conventional heavy oils, tar sands and coal‐to‐liquids increases over time, average carbon intensity could increase (Jaramillo et al., 2009). Emissions from EVs vary widely depending on electricity source (Holdway et al., 2010). Where electricity grids have high carbon intensities, EVs can result in higher operating carbon intensities than similar ICE‐based vehicles (Doucette and McCulloch, 2011a); (Doucette and McCulloch, 2011b).
A summary of mitigation costs is provided (Table 8.6.2).
3 Although the carbon content of diesel fuel per unit of energy (gC/MJ) is slightly higher than that for gasoline, the greater thermodynamic efficiency of a diesel engine than an Otto engine results in lower carbon intensity in terms of tC /passenger‐km (Szklo and Schaeffer, 2006). However, black carbon emissions from diesel need consideration (8.2.2).
Fuel ConsumptionReduction Capital Cost Breakeven Fuel
Price* Gross weight% US$ $/ liter ton
Class 8 Tractor- trailer 51 84,600 0.29 15.0- 36.2Class 8 Refuse truck 38 50,800 0.71 15.0- 36.2Class 6 box truck 47 43,120 1.11 8.8- 11.8Class 6 bucket truck 50 49,870 1.43 8.8- 11.8Class 2b pickup 45 14,710 1.27 3.9- 4.5
Vehicle Class

First Order Draft (FOD) IPCC WG III AR5
Do Not Cite, Quote or Distribute 40 of 100 Chapter 8 WGIII_AR5_Draft1_Ch08_final2.doc 19 July 2012
[NOTE TO REVIEWERS: This Table will be further developed for the Second Order Draft] 1
2 Table 8.6.2 Summary of costs and potentials for the transport sector.
3
6 7 8 9
10 11 12 13 14 15 16
17 18
8.7 Co‐benefits, risks and spill‐overs 4
8.7.1 Socio economic effects 5 The acceptance of new transport measures to mitigate both long and short life climate forcers emissions and to improve air quality, mobility, safety, etc., should be supported by clear reasons for wishing to change existing habits and by an information campaign to convince stakeholders of the benefits of a new measure, for instance, individuals are encouraged to significantly adapt their lifestyles and transport behaviour which can impact on their perceived quality of life (Miola, 2008). The use of non‐motorized transport such as cycling, has been a traditional practice in developing societies especially Asian, for it is not difficult to implement such “new” programmes. For example, in Changwun City, South Korea, cycling was preceded by an intense campaign of information and adequate resources were invested to provide infrastructure safety and convenience. On the other side, developed societies such as Europe, return to cycling is perceived as an attitude of consciousness.
Road transport often produces high environmental and social externalities that may dominate climate change costs by an order of magnitude (Schipper et al., 2010). Externalities include

First Order Draft (FOD) IPCC WG III AR5
Do Not Cite, Quote or Distribute 41 of 100 Chapter 8 WGIII_AR5_Draft1_Ch08_final2.doc 19 July 2012
congestion (including time lost in public transit by bus patrons and at airports), accidents, air pollution, noise, public health impacts and fuel insecurity.
1 2
4 5 6 7 8 9
10
12 13 14 15 16 17 18 19 20 21 22 23 24 25 26 27 28 29 30 31 32
34 35 36 37 38 39 40 41
43 44 45 46 47
8.7.1.1 Congestion 3 Specific costs from traffic congestion can be significantly higher in cities, particularly those rapidly urbanizing in developing countries. Time lost in traffic amounted to around 0.7% of GDP in the US in 2000 (Federal Highway Administration, 2000); 1.2% of GDP in the UK (Goodwin, 2004) and Toronto, Canada; 3.4% for Dakar, Senegal; 4% for Manila, Philippines (Carisma and Lowder, 2007); 3.3% to 5.3% for Beijing, China (Creutzig and He, 2009); 1% to 6% for Bangkok, Thailand (World Bank, 2002) and up to 10% for Lima, Peru where people living within the city spent around four hours on average in daily travel (JICA, 2005; Kunieda and Gauthier, 2007) .
8.7.1.2 Public health 11
Human health is put under risk by the pollution, noise and vibration caused by transport. Exposure to vehicle exhaust emissions mostly in the form of sulphur oxides (SOx), nitrous oxides (NOx), carbon monoxide (CO), hydrocarbons (HC), volatile organic compounds (VOC), toxic metals, lead particles and particulate matter (PM) that includes black carbon, can cause cardiovascular, pulmonary and respiratory diseases. Such emissions can also lead to increased blood pressure, liver and kidney damage, impairment of fertility, comas, convulsions and even death (WHO, 2008). Additional effects are seen in children, including reductions in IQ and attention span, learning disabilities, hyperactivity, impaired physical and mental development and loss of hearing. Noise and vibration from rail, aviation and road transport can contribute to sleep disturbance, which in turn can lead to increased blood pressure and heart attacks (WHO, 2009). In Beijing, the social costs of air pollution are as high as those from congestion (Creutzig and He, 2009). Monetary social cost estimates of public health are contested, and some authors prefer to present them as disability=adjusted life years (DALYs). In Delhi and London, a reduction in CO2 emissions through an increase in active travel and less use of ICE vehicles had larger health benefits per million population (7332 DALYs in London, and 12 516 in Delhi in one year) than from the increased use of lower‐emission vehicles (160 DALYs in London, and 1696 in Delhi) (Woodcock et al., 2009). A combination of active travel and lower‐emission vehicles would give the largest benefits (7439 DALYs in London, 12 995 in Delhi), notably from a reduction in the number of years of life lost from ischaemic heart disease (10–19% in London, 11–25% in Delhi) (Woodcock et al., 2009)(Woodcock et al., 2009)(Woodcock et al., 2009) . In the same way reduced car use in Australian cities has been shown to reduce health costs and improve productivity due to greater walking (Trubka et al., 2010).
8.7.1.3 Traffic accidents 33
The increase in motorised traffic in most countries places an increasing incidence of road accidents with 1.27 million people killed each year, of which 91% occur in low and middle income countries. A further 20 to 50 million people suffer non‐fatal injuries (WHO, 2011). Road traffic injuries currently kill more people in the world than diabetes, malaria and hyper‐intensive heart disease. By 2030, it is estimated that road traffic injuries will constitute the 5th biggest reason for premature deaths (WHO, 2008). Roughly half of those killed in road accidents are the most vulnerable pedestrians, cyclists and motorcyclists. The annual costs of traffic accidents worldwide a decade ago were estimated at USD518 billion, representing 1 to 2% of global GDP (Jacobs et al., 2000).
8.7.1.4 Public space and barrier‐free movement 42 The emphasis on keeping road traffic moving results in cities being literally cut apart by highways and ring roads with little consideration given for safety and lifestyles of residents. They act as physical and psychological barriers that divide communities, and reduce pedestrian and cycling access to jobs, markets and essential facilities (such as hospitals and schools), particularly for the poorest and most vulnerable members of society who do not have access to a car (Bayor, 1988).

First Order Draft (FOD) IPCC WG III AR5
Do Not Cite, Quote or Distribute 42 of 100 Chapter 8 WGIII_AR5_Draft1_Ch08_final2.doc 19 July 2012
Other factors are hard to measure and therefore commonly ignored. For example, parking areas can use a lot of valuable land. On the other hand, having transport systems that are affordable for everyone promotes exchange of ideas and has high positive externalities, not only economically but also socially und culturally. The assessment of social costs and benefits is hampered by data uncertainties. Even more fundamental is the epistemological uncertainty we attribute to different social costs. As a result, estimates often focus on only a few dimensions, and even then the range of plausible social costs can be large, in Beijing being between 7.5% to 15% of GDP (Creutzig and He, 2009).
1 2 3 4 5 6 7 8
10 11 12 13 14 15 16 17 18 19 20 21
23 24 25 26 27 28 29 30 31
32 33 34
35 36 37 38
40 41 42 43 44 45 46
8.7.2 Climate change mitigation as a co‐benefit 9
Some policies that aim to tackle the high social costs of urban transport can also result in climate change mitigation being a co‐benefit. Air pollution and noise can be reduced by technological advances (such as vehicle building materials) and regulations for vehicles (Section 8.11) but such measures rarely have influence on climate change mitigation. Measures that reduce transport demand or shift demand from individual motorized transport to public transport or bicycles tend to produce co‐benefits for climate change mitigation. The introduction of congestion charges simultaneously reduced GHG emissions by the order of 10‐20% in London, Stockholm and Milan, and by the order of 50% in Singapore and Durham (Mehrotra et al., 2011). Beyond time saving, the highest benefits occurred in public health improvement due to better air quality and in more walking and hence less obesity and related illnesses (Creutzig and He, 2009; Woodcock et al., 2009). In the same way reduced car use in Australian cities has been shown to reduce health costs and improve human productivity due to greater walking (Trubka et al., 2010).
8.7.3 Environmental and health effects 22
Developing countries are usually concerned more about mobility access, local air pollution, traffic congestion, and health problems before attempting to deal with climate change and sustainable transport issues. The lack of planning policies has often led to worsening transport problems. Unplanned city growth can lead to a poor transport network where people have to travel relatively long distances, often in their own two‐, three‐ or four‐wheeled vehicles, often old and poorly maintained. Strategies that target the mitigation of local air pollution also show potential to reduce GHG (Yedla et al., 2005) and black carbon emissions. In designing mitigation measures to reduce specific pollutants GHG emissions reductions can also occur. For example, measures to reduce PM25 particulates to reduce air pollution also reduce emissions of black carbon.
Advantages of city‐scale assessments are likely to be strengthened as a number of potentially significant climate change impacts are either unique to urban areas or exacerbated in them (Lindley et al., 2006).
To evaluate the risks and uncertainties of transport biofuels, four criteria to establish a tool to ensure a degree of sustainability in their production and use are being developed. They concern life‐cycle GHG efficiency, environmental impacts (biodiversity, soil issues, and water resources), social impacts (mainly food supply security (FAO, 2011), and implementation (Larsen et al., 2009).
8.7.4 Technological risks 39
Improving vehicle efficiency is compromised by worsening congestion (Hook, 2008). Technological solutions, improved fuel efficiency, reduction in noise levels, may improve environmental quality but mobility problems (Steg and Gifford, 2005). Liquid biofuels deployment can have adverse impact on food security, water availability, soil quality and biodiversity (Chum et al., 2011); see Chapter 11). Regulations and sustainability criteria try to ensure that these adverse impacts are avoided (Larsen et al., 2009). Certification approaches have been scrutinized and challenged on the basis of a lack of legitimacy in their design and a deficient on‐the‐ground implementation (Franco et al., 2010) .

First Order Draft (FOD) IPCC WG III AR5
Do Not Cite, Quote or Distribute 43 of 100 Chapter 8 WGIII_AR5_Draft1_Ch08_final2.doc 19 July 2012
8.7.5 Public perceptions 1
Few global citizens engaged in high GHG emitting behaviour are engaged in mitigation behaviour. Structural barriers, such as a climate‐averse infrastructure, are one reason for this. Psychological barriers impede behavioural choices that would facilitate mitigation, adaptation, and environmental sustainability. Although many individuals are engaged in some ameliorative action, most could do more, but they are hindered by seven categories of psychological barriers: limited cognition about the problem; ideological worldviews that tend to preclude pro‐environmental attitudes and behaviour; comparisons with other key people; sunk costs and behavioural momentum; discredence toward experts and authorities; perceived risks of change; and positive but inadequate behavioural change (Gifford, 2011).
2 3 4 5 6 7 8 9
10
11 12 13 14 15 16 17
There are various “public views” as to which transport systems are socially acceptable. Distinct groups, well‐defined by age, gender, socio‐economics, car ownership, and region can have widely divergent views on such factors as government investment in rail or road (Goodwin and Lyons, 2010). The public acceptance process tends to go through a pattern of stages (Fig. 8.7.1). Basic issues regarding acceptance of sustainable measures for the transport system include pricing measures, most typically road pricing; alternatives to investments for car‐based passenger transport; and new technologies and fuels (Pridmore and Miola, 2011).
18
19 20
21 22 23 24 25 26 27 28 29 30
31 32 33 34 35 36
Figure 8.7.1 Typical stages of public acceptance of a transport investment project with public support varying as the project proceeds. (Pridmore and Miola, 2011)
The continuing growth of the aviation and shipping sectors (Miola et al., 2011) implies these sectors will probably become key areas of future public acceptability. Already proposals to build new airports are often controversial. Research is needed that considers modal shift to lower carbon travel options; avoiding business travel by the use of tele‐ or video‐conferencing; and changing consumption patterns to reduce holiday travel demands and requirements for air freight. For shipping, the focus will be on freight logistics. Development of new technologies and fuels are relevant to both modes. Understanding attitudes to, and acceptability of, measures to facilitate changes, for example pricing mechanisms or broader societal changes, will be key (Pridmore and Miola, 2011). (Morton et al., 2011) suggest that the unfamiliar characteristics of EVs may make them more difficult to implement
Cities are reliant on food brought in from surrounding rural areas, national production and imported from other countries. Transport links may support both daily commuter flows from surrounding areas as well as inter‐continental movements of personnel and goods. Therefore, climate change impacts on agricultural production or transport infrastructure will have knock‐on effects on city populations (FAO, 2011). Similarly, transport decisions by cities can have effects that extend far beyond municipal borders (Hunt and Watkiss, 2011).

First Order Draft (FOD) IPCC WG III AR5
Do Not Cite, Quote or Distribute 44 of 100 Chapter 8 WGIII_AR5_Draft1_Ch08_final2.doc 19 July 2012
2 3 4 5 6 7 8 9
10 11 12
14 15 16 17 18
8.8 Barriers and opportunities 1
Reducing transport GHG is inherently complex as increasing mobility with LDVs, HDVs and planes has been associated with increasing wealth for the past century of industrialisation (Meyer et al., 1965; Glaeser, 2011). The first signs of decoupling fossil fuel‐based mobility from wealth generation may be appearing in OECD countries, with significantly less increases in non‐OECD countries as they develop with less emphasis on mobility (Newman and Kenworthy, 2011b; Millard‐Ball and Schipper, 2011). To reduce GHG emissions, a range of technologies and practices likely to be developed in the short‐ and long‐terms have been identified (8.3), but barriers to their deployment exist as well as opportunities for those nations, cities and regions willing to make low carbon transport a priority. There are many barriers to implementing a significantly lower carbon transport system, but these can be turned into opportunities if sufficient consideration is given and best‐practice examples are followed.
8.8.1 Barriers and opportunities to reduce GHGs by technologies and practices 13 The key transport‐related technologies and practices garnered from previous sections are set out in terms of their impact on fuel efficiency, improved efficiency of technologies, system infrastructure efficiency, and transport demand reduction. Each has varying short‐ and long‐term potentials to reduce transport GHGs which are then assessed in terms of their barriers and opportunities (Table 8.8.1). (Details of policies follow in Section 8.10).

First Order Draft (FOD) IPCC WG III AR5
Do Not Cite, Quote or Distribute 45 of 100 Chapter 8 WGIII_AR5_Draft1_Ch08_final2.doc 19 July 2012
Table 8.8.1 Transport technologies and practices with potential for both short- and long-term GHG reduction and barriers and opportunities in terms of the policy arenas of carbon intensity, energy intensity, structure and activity.
1 2
Transport technology or practice
Short‐term possibilities Long‐term possibilities Barriers Opportunities References
Fuel carbon intensity: (Fuel switching) BF – Biofuels BEV – Battery electric vehicle; PHEV – Plug‐in hybrid electric vehicle CNG – Compressed natural gas; LNG – Liquefied natural gas
1. BEVs and PHEVs based on renewable electricity.
Rapid increase in use likely over next decade from a small base, so only a small impact likely in short‐term
Significant replacement of ICE power LDVs.
EV and battery costs reducing but still high.
Lack of infrastructure, and recharging standards not uniform.
Vehicle range perceptions between recharging.
Universal standards adopted for rechargers. Demonstration green city areas with plug‐in infrastructure.
Smart grids based on renewables.
EV subsidies.
Beck, 2009;
EPRI 2008;
Graham‐Rowe et al., 2012;
IEA 2011;
Leurent and Windisch, 2011;
Simpson, 2011.
2. CNG and LNG displacing diesel in HDVs.
Infrastructure available in some cities can allow a quick ramp–up of CNG and LNG vehicles.
Significant replacement of HDV diesel use depends on ease pof engine conversion, fuel prices and extent of infrastructure.
Insufficient government programmes, conversion subsidies and local gas infrastructure and markets.
Demonstration gas conversion programmes that show benefits over costs, especially health co‐benefits.
Alvarez, 2012;
Barter, 2011a;
IEA 2007;
Milligan, 2011.

First Order Draft (FOD) IPCC WG III AR5
3. BFs displacing gasoline, diesel and jet fuel.
Niche markets continue for first generation biofuels (2% of liquid fuel market, small biogas niche markets).
Advanced and drop‐in biofuels likely to be significantly adopted around 2020, mainly for aviation.
Some biofuels can be relatively expensive and environmentally poor.
Drop‐in fuels attractive for all vehicles.
New BF options need to be further tested, particularly for aviation applications.
Creutzig et al., 2012;
IEA 2010;
Fargione et al 2010;
Ogden 2004;
Milligan, 2011;
Plevin et al 2010.
Intensity: Energy efficiency of technologies FEV – Fuel efficient vehicles
4. Improved ICE vehicle engine technology and on‐board information and communication technologies in FEV.
Continuing fuel efficiency improvements across new vehicles of all types can show large, low‐cost, near‐term reductions in fuel demand.
Likely to be a significant source of reduction.
Behavioural issues (e.g Jevons rebound effect) and consumer choices can reduce vehicle efficiency gains.
Insufficient regulatory support for vehicle emissions standards.
Creative regulations that enable quick changes to occur without excessive cost on emissions standards; eg. China and most OECD countries have implemented standards.
Reduced registration tax can be implemented for low CO2e‐based vehicles
Fuglestvedt et al 2009;
Mikler, J, 2010;
Milligan, 2011;
Ogden, 2004;
Sperling and Gordon 2009;
Timilsina and Dulal (2009).
Structure: System infrastructure efficiency MS – Modal shift UP – Urban planning SO – System optimization
Do Not Cite, Quote or Distribute 46 of 100 Chapter 8 WGIII_AR5_Draft1_Ch08_final2.doc 19 July 2012

First Order Draft (FOD) IPCC WG III AR5
5. MS by public transport displacing private motor vehicle use .
Rapid short‐term growth already happening.
Significant displacement only where quality system infrastructure and services are provided.
Availability of light rail, bus, ferry and other quality transit options.
Investment in quality transit infrastructure and services using innovative financing.
Barter, 2011a; Buehler and Pucher, 2011; Kenworthy, 2008; McIntosh and Newman 2012; Millard Ball and Schipper, 2011; Newman and Kenworthy, 2011; Newman and Salter, 2011.
6. MS by cycling displacing private motor vehicle use.
Rapid short term growth already happening in many cities.
Significant displacement only where quality system infrastructure is provided.
Cultural barriers and lack of safe cycling infrastructure.
Demonstrations of quality cycling infrastructure including cultural programmes.
Bassett et al 2008; Garrard et al 2008; Moore, 2011; Pucher and Buehler, 2012; Sugiyama et al., 2012.
7. MS by walking displacing private motor vehicle use.
Some growth but depends on urban planning and design policies being implemented.
Significant displacement where large scale adoption of polycentric city policies and walkable urban designs are implemented.
Planning and design policies can work against walkability of a city.
Large scale adoption of polycentric city policies and walkable urban designs.
Gehl, 2010; Hojer et al 2011; Leather et al 2011; Matan 2011; Salter, 2011d.
Do Not Cite, Quote or Distribute 47 of 100 Chapter 8 WGIII_AR5_Draft1_Ch08_final2.doc 19 July 2012

First Order Draft (FOD) IPCC WG III AR5
8. UP by reducing the distances to travel within urban areas.
Immediate impacts where dense transit‐oriented, development (TOD) centres are built.
Significant reductions where widespread polycentric city policies are implemented.
Urban development does not always favour dense TOD centres being built.
Widespread polycentric city policies implemented with green TODs.
Bachels and Newman, 2011; Cervero and Murakami 2009, 2010; Cervero, 2011; Curtis et al 2009; Dittmar and Ohland 2004; Ewing et al 2008; Naess 2006; Salter, 2011c.
9. UP by reducing private motor vehicle use through parking and traffic restraint.
Immediate impacts on traffic density observed.
Significant reductions only where quality transport alternatives are available.
Political barriers due to perceived public opposition to increased costs, traffic and parking restrictions.
Demonstrations of better transport outcomes from combinations of traffic restraint, parking and new infrastructure investment.
Barter, 2011b; Creutzig et al 2011; Gwilliam, 2003; Shoup, 2005.
10. MS by displacing plane trips through fast‐rail alternatives.
Immediate impacts after building rail infrastructure.
Continued growth but only short‐medium distance trips suitable.
High‐speed rail infrastructure expensive; Safety issues.
Demonstrations of how to build quality fast‐rail using innovative finance.
Akerman 2011; Gilbert and Perl 2006; Park and Ha, 2006; Salter, 2011a.
11. MS of freight by displacing HDV demand through rail.
Suitable immediately for medium and long distance freight and port traffic. (Could reach around 40% of total freight by rail if modal interchange centres built.)
Significant displacement only where large rail infrastructure improvements made.
Lack of rail infrastructure to deliver freight rail options.
Demonstrations of large freight rail infrastructure improvements and road/rail integration.
Salter, 2011b;
Schiller et al., 2010.
Do Not Cite, Quote or Distribute 48 of 100 Chapter 8 WGIII_AR5_Draft1_Ch08_final2.doc 19 July 2012

First Order Draft (FOD) IPCC WG III AR5
12. MS by displacing truck and car use through water transport.
Niche options already available.
Unlikely to develop beyond current niches.
Lack of vision for water transport options and land‐locked population centres.
Demonstrations of quality water transport that can be faster and with lower‐carbon emissions than alternatives.
Salter, 2011e; Fuglestvedt et al 2009.
13. SO by improved freight logistics and efficiency in operations at airports and ports; to reduce delays on runways and improve logistics of truck movements.
Continuing improvements showing immediate impacts.
Insufficient in long term to significantly reduce carbon emissions without changes in mode, reduced mobility or fuel changes.
Insufficient regulatory support and knowledge performance indicators (KPIs) on logistics and efficiency.
Creative regulations and KPIs that enable change to occur rapidly without excessive costs.
Fuglestvedt et al 2009; Kaluza 2010; McKinnon 2010; Pels and Verhoef, 2004; Salter, 2011b; Simaiakis and Balakrishnan, 2010; Zhang and Zhang 2006.
Activity: demand reduction BC – Behaviour change MSS – Mobility service substitution
14. MSS by reducing the need to travel through enhanced communications.
Niche markets growing and ICTs improving in quality and reliability.
Significant reductions after faster broadband and quality images available.
Technological barriers due to insufficient broadband in some regions.
Demonstrations of improved video‐conferencing system quality.
Choo et al 2005; Golob and Regan, 2001; Salter, 2011c; Wang and Law, 2007; Yi and Thomas, 2007; Zhen et al 2009.
15. BC from reducing private motor vehicle use through pricing policies, eg network charges and parking fees.
Immediate impacts on traffic density observed.
Significant reductions only where quality transport alternatives are available.
Political barriers due to perceived public opposition to increased pricing costs.
Demonstrations of better transport outcomes from combinations of pricing, traffic restraint, parking and new infrastructure investment from the revenue.
Bachels and Salter, 2011;
Burgess and Salter, 2011;
Creitzig et al., 2011; Litman, 2005; 2006.
Do Not Cite, Quote or Distribute 49 of 100 Chapter 8 WGIII_AR5_Draft1_Ch08_final2.doc 19 July 2012

First Order Draft (FOD) IPCC WG III AR5
Do Not Cite, Quote or Distribute 50 of 100 Chapter 8 WGIII_AR5_Draft1_Ch08_final2.doc 19 July 2012
16. BC from education to change behaviour giving benefits of less motor vehicle use.
Immediate impacts of 10‐15% reduction of use.
Significant reductions only where quality transport alternatives are available.
Lack of belief by politicians and professionals in the value of educational behaviour change programmes.
Demonstrations of ‘travel smart’ programmes linked to improvements in sustainable transport infrastructure.
Ashton‐Graham et al., 2011; Goodwood and Lyons, 2010; Hojer et al 2011; Pandey 2006; Salter, 2011c; Taylor and Philp 2010.
. 1

First Order Draft (FOD) IPCC WG III AR5
Do Not Cite, Quote or Distribute 51 of 100 Chapter 8 WGIII_AR5_Draft1_Ch08_final2.doc 19 July 2012
The range of barriers to the ready adoption of the above technologies and practices were outlined in previous sections and are set out above along with the opportunities in each area.
1 2
3 4 5 6 7 8 9
10
12 13 14 15 16 17 18 19 20 21 22 23 24
25 26 27 28 29 30
31 32 33
35 36 37 38 39 40 41
42 43 44 45 46 47 48
The difficulties involved in each of the 16 elements in Table 8.8.1 depend on the politics of a region attempting these changes. In most places, the carbon intensity and energy intensity areas are likely to be easier as they are technology‐based, though this can hit capital barriers in developing regions and may be insufficient in the long term. On the other hand, system infrastructure efficiency and transport demand reduction require human interventions and social change as well as public investment. Although these may not require as much capital, they still require public acceptance of the transport policy option. These rise and fall as its implementation approaches, thus usually requiring political support at critical times (Pridmore and Miola, 2011).
8.8.2 Financing low carbon transport 11
Transport is a foundation for any economy as it structures cities and enables people to be linked and goods to be exchanged (Glaeser, 2011). It is critical for poverty reduction and growth in the plans of most regions, nations and cities. Thus, it is a key area for development funding in OECD and non‐OECD places. Transport is a major contributor to GHG globally but in recent decades the amount of funding going to transport through various low‐carbon mechanisms has been very low. Only 3 CDM projects out of 220 have been in transport (Kopp, 2012b), the Global Environment Facility (GEF) have approved only 28 projects in 20 years, and the World Bank’s Clean Technology Fund has funded less than 17% of its total projects in transport. If funding does not begin to change, then transport could move from being 22% of energy‐related GHGs in 2009 to 46% in 2035 and 80% by 2050 (ADB, 2012a). In response, the global financing system has proposed a new type of financing, National Appropriate Mitigation Measures (NAMAS) that will possibly be mostly to seek low carbon financing in the transport area for the developing world and at Rio+20 ADB and eight other big banks pledged to invest $175billion for the creation of sustainable transport worldwide.
In addition, there are new mechanisms being developed to assist cities in all parts of the world tackle their need for significant capital investment to support mass transit. The idea of land value capture is now being applied to assist create a revenue stream that can be hypothecated by governments to assist with the raising of capital. Revenue can be generated from land‐based taxes and rates that are seen to rise by 20‐25% in areas around a rail system compared to areas not adjacent to such an accessible facility (McIntosh and Newman, 2012).
The ability to fully outline the costs and benefits of low‐carbon transport projects will be critical to accessing these new funding opportunities. R&D barriers and opportunities exist for all of these agendas in transport.
8.8.3 Institutional, cultural and legal aspects of low carbon transport 34
Institutional barriers to low‐carbon transport include such factors as standards that are required for new EV infrastructure and vehicles to enable recharging; the pricing of parking; educational programmes for modal shift; and polycentric planning policies that require the necessary institutional structures (OECD, 2012). Cultural barriers underlie every aspect of transport, for example, automobile dependence can be built into a culture. Legal barriers exist to building dense, mixed use centres that reduce car dependence are often subject to planning law barriers. Overall, there are political barriers which combine most of the above (Pridmore and Miola, 2011).
At the same time, there are opportunities. The new world economy known as the Sixth Wave (Hargroves and Smith, 2008) or Green Growth (OECD, 2011) aims to be based around low‐carbon technologies and practices. The transport elements (Table 8.8.1) are likely to be the basis of this changing economy because transport shapes cities and creates wealth (Newman and Kenworthy, 1999; Glaeser, 2011). Those nations, cities, businesses and communities that grasp the opportunities to demonstrate these changes are likely to be the ones that benefit most in the future (OECD, 2012). The process of decoupling economic growth from fossil fuels is a major feature of the next economy
First Order Draft (FOD) IPCC WG III AR5
Do Not Cite, Quote or Distribute 52 of 100 Chapter 8 WGIII_AR5_Draft1_Ch08_final2.doc 19 July 2012
(ADB, 2012a) with sustainable transport one of four key approaches. The barriers to, and opportunities for, each technology and practice (Table 8.8.1) show that each of these can contribute to a more sustainable transport system. All of them are equally needed to enable the opportunities to be grasped fully from the technological and social changes that underlie the green economy.
1 2 3 4
6
7 8 9
10 11 12 13 14
16 17 18 19 20 21 22 23 24 25 26
27
8.9 Sectoral implication of transformation pathways and sustainable 5
development
Diverse transformational pathways for a low‐carbon global transport system can be envisioned through new and existing technologies for fuels and vehicles, and a progressive reconfiguration of structural components within cities for the efficient interconnection of activities infrastructure and information and communication services provision (8.9.1). Building on technical developments and spatial restructuring, the long‐term economic, environmental and social impacts of these transitions need to be addressed systemically and communicated to the appropriate stakeholders (8.9.2). Any possible transition is subject to institutional and social acceptability, which is a function of their time evolution, comparative costs and regional context variations (8.9.3).
8.9.1 Sectoral transformations and the long term stabilization goals 15
Building on results from the scenario database on transformation pathways assessed in Chapter 6, global energy‐economy and integrated assessment models were used to estimate ranges for total final energy use and mix of fuel energy carriers (Chapter 6.7 and Fig. 8.9.1).. Projections for global transport sector CO2 emissions vary greatly depending on future actions taken. If current trends in travel demand continue and technological (8.3), infrastructural, educational and other systemic opportunities (8.4) are not seized, then transport‐related carbon emissions could increase by almost fourfold by the end of this century. If, however, polices are implemented (e.g. 8.10) that utilise feasible emission reduction options (8.6), the sector could be practically decarbonised by 2070. However, the calculated ranges in the scenarios are substantial, demonstrating high uncertainty. Despite the uncertainties, top‐down scenarios analysis demonstrates that a transformational pathway to achieve a stabilisation at 2 degrees Celsius relies heavily on transport sector mitigation.
Building on results from the scenario database on transformation pathways assessed in Chapter 6,

First Order Draft (FOD) IPCC WG III AR5
Do Not Cite, Quote or Distribute 53 of 100 Chapter 8 WGIII_AR5_Draft1_Ch08_final2.doc 19 July 2012
1 2 3
4 5
6 7 8 9
Figure 8.9.1. Ranges of direct global CO2 emissions from transport based on a comparison of several scenarios that give different levels of radiative forcing by 2100.
Note: Light colours show the full range of scenarios; dark colours the range of results between 25th and 75th percentiles.
In contrast to the possible scenarios outcomes for overall global CO2 emissions of the transport sector, the ranges of variations in the selected scenarios for passenger travel demand are substantially smaller. All scenarios project substantial increases in kilometres travelled by 2011 (Fig. 8.9.2).
10 11 12
13 14
15
Figure 8.9.2: Global passenger travel demand projections out to 2100 in scenarios with various levels of radiative forcing.
Note: Light colours show the full range of scenarios; dark colours the range of results between 25th and 75th percentiles.

First Order Draft (FOD) IPCC WG III AR5
Do Not Cite, Quote or Distribute 54 of 100 Chapter 8 WGIII_AR5_Draft1_Ch08_final2.doc 19 July 2012
The demand for travel increases further, mostly within road transport and aviation, driven inter alia by income (8.2), and demonstrating the inertia of the roadway and related transport infrastructure system (IEA, 2009; Schuckmann et al., 2012 Kahn Ribeiro et al., 2012; (IEA, 2012). This highlights the importance of fast deployment of advanced fuel and vehicle technologies such as efficiency improvements, electricity, hydrogen and advanced biofuels in order to achieve a reduction of GHG emissions below the 2 oC climate target (Figure 8.9.3). The need for accelerating innovation includes all areas of passenger and freight transport service provision and infrastructural solutions.
1 2 3 4 5 6
7
0
50
100
150
200
250
EJ/yr
Hydrogen
Bio liquids
Fossil liquids
Electricity
Coal
Gas
Oil Products
0
50
100
150
200
250
EJ/yr
Hydrogen
Bio liquids
Fossil liquids
Electricity
Coal
Gas
Oil Products0
50
100
150
200
250
EJ/yr
Oil Products Gas Electricity Fossil liquids Bio liquids Hydrogen
GEA-Supply GEA-Mix GEA-Efficiency
8
9 10 11
12
13 14 15 16 17 18 19
20 21 22 23 24 25 26 27 28 29 30 31 32 33
Figure 8.9.3 Global fuel use mix in the transport sector in three pathways to achieve 2oC climate target: “GEA Supply” strong emphasis on technologies; “GEA Efficiency” strong emphasis on regulations, efficiency and reduced demand, and “GEA Mix” combination of the other two.
Source: (GEA, 2012)
Uncertainty matters in all the pathways considered (Bastani et al., 2012; Wang et al., 2012). The long‐term mix of fuels and technologies are difficult to foresee, especially within road transport. One of the most difficult parts of the long term assessment is how to interpret the evolution of rapid growing developing countries like China (Huo et al., 2007; Huo and Wang, 2012). A key question is whether their rapid growth of transport energy use per capita will stabilize at a level closer to high‐income countries such as US levels (1,78Ktoe/cap) or Japan’s (0,6Ktoe/cap) at the point in which they will attain a similar levels of economic development.
Both top‐down and bottom up studies mostly focus on the road transport subsector because it accounts for larger share ‐three quarters‐ of the global transport emissions (8.1). While the results between the top‐down and bottom‐up global scenario studies may differ significantly, the pattern that emerges is clear in all scenarios: reaching climate mitigation targets is possible by changes in technology and fuel choice and travel model and improvements in all transport vehicle energy efficiency (Fig. 8.9.4). Changing the fuel supply infrastructure requires time, especially if this means switching on a massive scale from liquid fuels to gaseous fuels or electricity. Therefore, the scenarios pathway suggesting that total travel volumes may be affected only marginally, makes a strong case for policies that give attention to the potential contribution that reducing the growth rate in travel demand and influencing the modal used have for climate mitigation and sustainability (GEA, 2012; ETP 2012). Sectoral analysis suggests that up to 20% of transport demand can be reduced by more compact cities, modal shift and behavioural change (Fig. 8.9.4; (IEA, 2009). Such measures are usually not represented in global climate stabilization models. A consideration of these measures might shift the travel demand and energy estimates (Fig. 8.9.2) further downwards.

First Order Draft (FOD) IPCC WG III AR5
Do Not Cite, Quote or Distribute 55 of 100 Chapter 8 WGIII_AR5_Draft1_Ch08_final2.doc 19 July 2012
1
2 3
4 5 6 7 8 9
10
13 14 15 16 17 18 19 20 21 22 23
24 25 26 27 28 29 30 31 32 33
34 35 36 37
Figure 8.9.4 Energy demand in the transport sector by mode from several stabilization scenarios out to 2030 and 2050. Source: (IEA, 2012)
Achieving a 2oC stabilisation level will require major mitigation contributions to come from the transport sector over the next two decades (IEA, 2012). At the country level, for example in the US, it has been estimated that the combination of travel demand management, biofuels, PEVs and FCVs could result in up to an 80% reduction from 1990 levels in 2050 (McCollum and Yang, 2009). All regions and countries will require strong measures implementation because even the benefits of current policies can be quickly offset with the expected global growth of travel (McCollum and Yang, 2009; Huo et al., 2011; Girod et al., 2012).
8.9.2 Sectoral transformational pathways‐ implications from a bottom up perspective 11
8.9.2.1 Technologies, fuels and infrastructures 12 Some technological mitigation options that can contribute to low‐carbon transport future (8.3) are already viable today and can contribute positively to energy efficiency in the transport sector (IEA, 2009). However, a number of technology options, such as second‐generation biofuels, electric‐ and hydrogen‐ powered vehicles will still require time to make substantial contributions to climate change mitigation efforts in the transport sector (Salter and Newman, 2011). A transition to new fuel supply chains will require close coordination among fuel suppliers, vehicle manufacturers, and policymakers, as well from consumers (Graham‐Rowe et al., 2012). Historical analysis suggests that it takes 30‐70 years to fully implement new infrastructures (Ausubel, 1989) (Estache and Fay, 2007), but changes can occur quicker in specific regions and markets (Wang et al., 2012). It can take 25‐60 years from the start of research and development until an innovation achieves wide spread use, such as in the road vehicle fleet (Kromer and Heywood, 2007).
Electric and hydrogen technologies can currently not compete with ICEs due to economies of scale (DOE, 2008). Existing fuel production, delivery infrastructures and compatible vehicles represent large sunk investments, and typically provide highly competitive mobility (Bandivadekar et al., 2008). This path dependence produces a technology and carbon lock‐in effect and severely disadvantages new fuels requiring new delivery systems and new types of compatible vehicles, such as electric and hydrogen technologies (8.4). The 15‐20 year lifetimes of passenger vehicles result in a low annual turn‐over rate and contributes to the decades‐long time frame needed for a full transition (Sims et al., 2011). Other system dynamic effects created as the purchase of new vehicles lead to the increased availability of used vehicles that in turn affect the market for new vehicles is a key area for policy assessment (Stepp et al., 2009)
Since new technologies may need to reach large cumulative production volumes in order to reduce costs and achieve competitive positions, and since this can take decades, it can also contribute to very slow transitions (Baptista et al., 2010; Eppstein et al., 2011). It is likely to take the introduction of 5‐10 million vehicles over 15‐20 years for both BEVs and FCVs to break even in costs with ICEs

First Order Draft (FOD) IPCC WG III AR5
Do Not Cite, Quote or Distribute 56 of 100 Chapter 8 WGIII_AR5_Draft1_Ch08_final2.doc 19 July 2012
(IEA, 2011a). On the other hand, the total costs of building a new fuel infrastructure may not be high compared to the overall costs associated with transport systems. For example, a transition to hydrogen fuel networks in the US has been estimated in the range of tens to a few hundred billion dollars over a few decades compared to around USD 1 trillion required for oil infrastructure cost in the same period (Ogden and Lorraine, 2011).
1 2 3 4 5
6 7 8 9
10 11 12 13 14 15 16 17
18 19 20 21 22 23 24 25 26 27 28 29 30 31
32 33 34 35 36 37 38 39 40 41
43 44 45 46 47 48 49
Additional infrastructure is required to increase capacities to not only hold the modal share in an environment with increasing travel demand, but to increase the contribution of more efficient transport modes to the overall transport task (ITF, 2009). The lead time for transport infrastructure development is considerable (Short and Kopp, 2005), which makes swift changes in the capacity of for example, public transport hard to achieve. However, some emerging countries show transformative process in the development of public transport infrastructure. In just over one decade the city of Shanghai, for example, has built the world’s biggest Metro after the previous decade was dedicated to accommodating the car (ADB, 2012b). Large‐scale metro construction began in the early 1990s and the first line opened in 1995. The total passengers per day rose to around 8 million at the end of 2010 and 80% of the developed area of the city is now within 400 m of a Metro line. There are now 82 Metros being built in Chinese cities and 14 in Indian cities (ADB, 2012b; Newman and Matan, 2012).
Another dynamic development in public transport is driven by the Bus Rapid Transport, which mimics a metro system, can deliver a full urban network, and can be implemented much faster and at a cost affordable to many cities (Deng and Nelson, 2011). Several cities including Ankara, Istanbul, Abidjan and Lagos have implemented promising BRT systems, and several others are evaluating the feasibility of BRT. The “Transmilenio” in Bogota has been successful by several standards; e.g. with its enclosed stations and dedicated lanes, the system resemble in many ways more a metro system than a conventional bus system (Wright, 2011). BRT is not always the right solution, but because of its low cost it can function well as an intermediate technology that can later be upgraded to other solutions (Light Rail, elevated rail, or underground metros) as cities financial conditions improve (Allport, 2011; Wright, 2011). The experience from cities that have developed sustainably in important respects is that there is no simple “best practice” that can be used as prescription to turn other cities around (Allport, 2011), from a mitigation perspective, if more travel is served by the most efficient modes (mass transit, walking and cycling), a significant cut to energy use and CO2 can be realized (ETP 2012).
The success of public transport systems as climate change mitigation measure depends on the directions of the modal shift, for example if bicycle trips and bus trips are shifting to metro, then greenhouse gas emissions may increase. It is also important that alternatives are assessed in the context of broader multiple objectives of sustainable development (e.g., social quality of life – health, equity, etc., the economy, etc.) incorporating the most critical priorities and constraints in different socioeconomic contexts (Amekudzi et al., 2009). The relative marginal socioeconomic costs and benefits of various alternatives can be context sensitive with respect to sustainable development (Amekudzi, 2011). Developing the capacity (analytical and data) for multi‐objective evaluation is an important part of the process of cultivating sustainability and climate mitigation thinking and culture in the long term.
8.9.2.2 Transformational possibilities 42
Transformation of a transport system will require both a capacity to work from a systems perspective in all fronts designing policies for both demand and supply sides of the market as well as policies supporting critical and structural/cultural change (McCollum and Yang, 2009; Kahn Ribeiro et al., 2012) ETP 2012). From a system perspective, the integration of the energy supply system with all the energy consuming sectors e.g., transport, building, services, industry needs to be resolved. Issues like the electrification of the transport sector (particularly rail and LDVs) can only be effectively met when low carbon fuels and renewable sources are used in power generation and, when a flexible

First Order Draft (FOD) IPCC WG III AR5
Do Not Cite, Quote or Distribute 57 of 100 Chapter 8 WGIII_AR5_Draft1_Ch08_final2.doc 19 July 2012
interaction between the supply and demand sides of the system can functionally interact and work together (ETP 2012). An integration of the transport system is expected to lead to a more efficient system and better service to users, particularly when combined with a willingness to allocate resources to better services (Givoni and Banister, 2010).
1 2 3 4
5 6 7 8 9
10 11 12 13 14 15 16 17
18 19 20 21 22 23 24 25 26 27 28 29 30 31 32 33 34 35
37 38 39 40 41 42 43
44 45 46 47 48 49
Since mitigation policies in transport will ultimately be aimed at either changing travel behaviour directly, or at changing the attributes of products that a consumer purchase, or at changing the physical environment and public transport technologies where they live, assessing the factors and feedbacks related to consumer’s decision making is important (Stepp et al., 2009). This involves a closer and systemic linkage between land use and transportation decisions (treating transportation as a means to an end) through institutional and policy reform; expanding usage of non‐motorized modes of transport; a willingness to embrace non‐physical infrastructural solutions formally in transport (and land use) planning; courage to internalize or make explicit the environmental and social costs of transport to incentivize sustainable choices; a willingness to replace forecasting with backcasting paradigms in thinking and planning for development; a willingness to formally consider alternatives that subsidize the future with the goal of improving the social quality of life in the longer term; and an increasing commitment to using education (general public and institutional) as a tool to cultivate more sustainable lifestyles (Amekudzi et al., 2011; Kahn Ribeiro et al., 2012)
The signs that change is possible can be gleaned from recent analysis in both developed and developing countries. Developed cities in OECD countries have tended to show a reversal of the trend to increasing car use and decreasing public transport; a phenomenon called ‘peak car use’ (Millard‐Ball and Schipper, 2011; Newman and Kenworthy, 2011b). For example, a detailed survey in the US has shown this phenomenon to be as much a cultural change as the result of rising fuel prices (David et al., 2010). In Asian cities increased GHG reduction trends are likely to more than offset the benefits from car use reductions in the developed world. Projections of massive GHG increases have been shown if Chinese and Indian cities are to reach the current levels of GHG emissions from equivalent US cities. However, the likelihood of this happening is low as the developed nations of Asia have currently stabilized their GHG emissions per capita at a level half that of the US in total and even lower for transport‐related GHG emissions (ADB, 2012b). Furthermore, the Environmental Kuznets Curve (that predicts the levels of wealth at which environmental reforms begin to occur) shows a much faster transition to reduced GHG emissions and other environmental benefits (ADB, 2012b). Worldwide, individualised approaches to travel demand management have been delivered to approximately five million people (Ashton‐Graham et al., 2011). When delivered in association with new or improved public transport services TravelSmart adds 40% more patronage than occurs with new services alone. And on average, each program participant produces 225 kg less carbon dioxide from their travel each year (Ashton‐Graham et al., 2011).
8.9.3 Sustainable development, and regional and national implications for developing 36
countries The relationship between decarbonisation pathways for the transport sector and sustainable development more generally is diverse and includes the potential for a number of co‐benefits, but also trade‐offs (Zusman et al., 2012). Behavioural changes resulting in more environmentally sustainable lifestyles without compromising human quality of life and economic competitiveness (in both developed and developing countries) is a critical transformational opportunity and arguably indispensable to global sustainable development in the long term.
Major aspects concerning market progression of alternative fuels, the commercialization and operational aspects of new vehicles, and relationships between countries in a transformative pathway to a low‐carbon system will require integrated attention to economic and socio‐cultural influences, adjustment of economic policies, reforms of national energy policy, development of clear frameworks for assessing the sustainability of industry, pollution prevention and ecological conservation, capacity building, international cooperation and public participation and increasing

First Order Draft (FOD) IPCC WG III AR5
Do Not Cite, Quote or Distribute 58 of 100 Chapter 8 WGIII_AR5_Draft1_Ch08_final2.doc 19 July 2012
capacity to credibly account for societal and environmental (as well as economic) capital, as well as capital transformations and transfers (De Kruijf and Van Vuuren, 1998; Zhang and Wen, 2008; Amekudzi, 2011).
1 2 3
4 5 6 7 8 9
10 11
12 13 14 15 16 17 18 19
20 21 22 23 24 25 26 27 28 29 30 31
32 33 34 35 36 37
38 39 40
42 43 44 45 46
Urban areas where 70% of the population will leave in 2050 have a central role to play in global efforts for climate mitigation and many in non‐OECD countries are facing great mobility and sustainability challenges. The combined fast speed of urbanization and motorization that many non‐OECD countries are undergoing is taking place under complicated and difficult realities where road and public transport systems are in dire conditions, countries are facing constraints of technical and financial resources, there is a dearth of infrastructure governance capacity, and the gap between the pace of growth of detrimental impacts of motorization and effective action is only widening (Kane, 2010; Dimitriou and Gakenheimer, 2011; Li, 2011).
Over a billion people in the world, in rural areas, have no adequate access to a transport system and only 13% of roads in low‐income countries are paved, compared to 91.8% in high income countries (World Bank, 2010)(Santos et al., 2010). Improving road conditions and investments into road, rail, and public transport networks are key factors for developing countries to improve conditions for trade and economic growth, as they can reduce transport cost and help facilitate trading volumes (Frankel and Romer, 1999). Improved accessibility to services can also mean a reduction of time spent travelling by the urban poor, better access to basic education and health services. Availability of financial resources can be limiting particularly in low‐income countries (World Bank, 2010).
There are contrasts between the goals and policy recommendations for sustainable transport and climate mitigation applicable to non‐OECD countries. A pressing argument is built for redressing transport as an agent of sustained urban development that prioritizes goals for urbanization and equity and emphasizes delivering accessibility, traffic safety and time savings to the poor with minimal detriment to the environment and human health (Vasconcellos, 2001; Tiwari, 2002; Amekudzi et al., 2011; Li, 2011). The energy and climate argument requires decoupling transport services demand from fossil fuels use and GHG emissions, thereby cutting through issues of efficiency, technology, fuel resource use and availability (Millard‐Ball and Schipper, 2011). Strategies need to be found to acknowledge and take action in both, with policies emphasizing the efficiency and technologically innovative aspects of the transport system that follows a clear political vision and agenda that supports poverty alleviation, that enhances mobility opportunities and basic access; and services delivery to support economic growth (Kane, 2010; Li, 2011; Kahn Ribeiro et al., 2012).
The problems are interrelated and the policies to support them may also have impact in several problem dimensions if policy packages are implemented simultaneously. Under‐resourced local governments, technical and financial resource scarcity, and the difficulties of representing highly complex and changing context with limited data and information are limiting factors that create a difficult ground for transport sustainability and climate mitigation in non‐OECD countries (Vasconcellos, 2001; Dimitriou, 2006; Kane, 2010; Dimitriou and Gakenheimer, 2011).
The efforts for building and reinforcing regional networks and links to disseminate the various strategies, policies and issues in the formulation of a sustainable transport and climate strategic vision remain of paramount importance.
8.10 Sectoral policies 41
Without policy intervention, projected incremental improvements in fuel, vehicle and system efficiencies will be surpassed by annual growth in transport demand. The best choice of policy options will emphasize the synergies and co‐benefits of GHG mitigation alongside other transport priorities (Kahn Ribeiro et al., 2012), particularly those affecting rapid and sustainable growth in developing economies, improving local air pollution and energy security. Policy choice will vary
First Order Draft (FOD) IPCC WG III AR5
Do Not Cite, Quote or Distribute 59 of 100 Chapter 8 WGIII_AR5_Draft1_Ch08_final2.doc 19 July 2012
across regions because economic activity, geography, population density and culture all influence political feasibility, policy effectiveness and desirability.
1 2
3 4 5 6 7 8 9
10 11 12
13 14 15 16 17 18
20 21 22 23
24 25 26 27 28 29 30
31 32 33 34 35 36
37 38 39 40 41 42
Emission trading or a carbon tax for the transport sector would incentivize all mitigation options in the transport sector simultaneously (Flachsland et al., 2011). However, end‐use transport demand reacts only weakly to price signals (‘energy paradox’) (Creutzig et al., 2011; Yeh and McCollum, 2011). Market‐based instruments can be efficient to reduce emissions on the supply side whereas end‐use transport emissions can be addressed by complementary vehicle efficiency standards, low carbon fuel standards (LCFS), R&D programmes advancing technologies, and infrastructure investments (Creutzig et al., 2011; Yeh and McCollum, 2011). Policies, such as LCFS, may be relatively efficient at meeting the nominal reduction target (Holland, 2012), but whether they achieve most economically efficient real reductions is not clear (Stephen P. Holland et al., 2009)(Sperling and Yeh, 2010) (Chen and Khanna, 2012).
In addition, urban planning, investments into non‐motorised transport (NMT) and public transport (PT) together with behavioural change policies could significantly reduce vehicle km traveled. Specific transport policies can be categorized into reducing transport demand for freight and passengers, encouraging modal shift, improving energy intensity through fuel efficiency (MJ/km) and reducing GHG intensity of the fuel (gCO2e/MJ) (McCollum and Yang, 2009; Creutzig et al., 2011). Travel demand reduction measures related to urban form are discussed in 8.5.
8.10.1 Road transport 19
A wide range of policies are available to help reduce GHG emissions from road vehicles. National policies are common for LDVs, including support for biofuels, but are only recently appearing for HDVs. Policies that support EV deployment, that also reduce local urban air pollution, are starting to appear.
Demand reduction. Pricing policies seeking to reduce the amount of travel by impacting on travel behaviour, or seeking to reduce levels of motorization, can be politically difficult to implement, but could gain support if integration of services is possible (Santos et al., 2010). Some Chinese cities have implemented regulations limiting the ownership and use of LDVs, producing significant co‐benefits from LDV travel reduction. Beijing and Shanghai, for example, set a cap on the number of newly registered passenger vehicles by limiting the issue of license plates. Since 2008, Beijing has forbidden each vehicle to be used for one specific day each week (Hao et al., 2011).
Fuel taxes can help to incentivize reduced travel demand but with varying success due to the level of fuel taxation being very different across world economies (GIZ, 2011; Kahn Ribeiro et al., 2012). Pricing instruments such as congestion charges, vehicle registration fees, road tolls and parking management (Litman, 2006) can effectively reduce LDV travel by inducing modal shift and appealing to economic rather than societal incentives. They can be accompanied by targeted behavioural shift programmes.
Energy intensity. Fuel economy and carbon emissions standards are already widely used effectively in several OECD countries (Figure 8.10.1) but can be compromised by the direct rebound effect in that fuel efficient vehicles may encourage people to drive more (Small and van Dender, 2007); (Hymel et al., 2010); (Flachsland et al., 2011). Hence fuel economy measures should be complemented by additional measures to address modal shift, urban form and overall travel demand (Creutzig et al., 2011; Salter and Newman, 2011; Holland, 2012).

First Order Draft (FOD) IPCC WG III AR5
Do Not Cite, Quote or Distribute 60 of 100 Chapter 8 WGIII_AR5_Draft1_Ch08_final2.doc 19 July 2012
1
2 3 4
Figure 8.10.1. LDV GHG emissions targets in selected countries and the European Union, adjusted to provide a comparison using the same test driving cycle. Source: (An et al., 2007; Creutzig et al., 2011)
[Note to Reviewers: will be updated to incorporate new standards, e.g. U.S. 2016-2025 standards.] 5
6 7 8 9
10 11 12 13 14 15
16 17 18 19 20 21
22 23 24 25 26 27 28 29
30 31 32
Feebates (basically a combination of rebates awarded to purchasers of low carbon emission technologies and fees charged to purchasers of less efficient technologies) support fuel efficiency standards but can have limited additional effects. In France however, the Bonus/Malus feebate scheme produced an immediate new vehicle fleet‐wide reduction of 7 gCO2 /km by awarding purchase rebates up to €1000 for LDVs with emissions of less than 130 gCO2/km and charging fees up to €2 600 for LDVs with emissions exceeding 160 gCO2/km (Greene and Plotkin, 2011). Annual registration fees can have similar effects if linked directly with carbon emissions or with related vehicle attributes such as engine displacement, engine power or vehicle weight (CARB, 2010). As of April 2010, 17 European countries had implemented passenger car taxes wholly or partially related to CO2 emissions (ACEA, 2011).
GHG accounting practices which better account for emissions timing and improvements in vehicle technology contribute to shifting a greater portion of life cycle GHG emissions away from vehicle use towards vehicle production (Kendall and Price, 2012). Policies that encourage the early scrapping of vehicles and restrict imports of older vehicles can help decrease the average fleet age, and hence carbon intensity (g CO2/km). Conversely, extending the life of a vehicle can help reduce its life cycle emissions (Kagawa et al., 2011).
For HDVs, China implemented fuel consumption limits in July 2012 (CATARC, 2011); Japan has set fuel efficiency standards (Atabani et al., 2011); California requires compulsory retrofits to reduce aerodynamic drag and rolling resistance (Atabani et al., 2011) the USA has announced standards for new trucks and buses manufactured from 2014 through till 2018 (Greene and Plotkin, 2011); and the European Union intends to set similar options including performance standards and fuel efficiency labelling by 2014 and also a possible reduction of existing speed limits (Kojima and Ryan, 2010). European, Japanese and US air pollution standards have had an impact on the efficiency of HDVs since the 1990s leading to a 7% to 10% lower fuel economy (IEA, 2009).
GHG intensity. Policies to support liquid biofuels production and blending have been largely successful. They include low‐carbon fuel standards, fuel quality standards, subsidies, production tax and fuel tax exemptions, as well as blending mandates (IEA, 2011b). Blending mandates that ignore
First Order Draft (FOD) IPCC WG III AR5
Do Not Cite, Quote or Distribute 61 of 100 Chapter 8 WGIII_AR5_Draft1_Ch08_final2.doc 19 July 2012
carbon life‐cycle emissions of biofuels are not usually effective in reducing GHG emissions (Lange, 2011). The Californian LCFS (Sperling, D. and Nichols, M., 2012) , the US renewable fuel standard, and the European fuel quality directive, all aim to reduce GHG intensity and increase the share of low‐carbon biofuels, electricity, and hydrogen (Yeh and Sperling, 2010; Creutzig et al., 2011). Emissions from land‐use change pose a challenge to such regulations (Melillo et al., 2009); see also Chapter 7). Intensity‐based instruments could result in rebound effects (Chen and Khanna, 2012), but these could be counteracted domestically with taxes on fuel end‐use (Holland, 2012).
1 2 3 4 5 6 7
8 9
10 11 12 13 14 15 16 17 18 19
20 21 22 23 24 25
26 27 28 29 30 31
33 34 35 36 37 38 39 40 41
42 43 44 45 46 47
Limiting emissions of short‐lived GHG species can play an important role in reducing GHG intensity (Jackson, 2009; Penner et al., 2010). Introducing clean diesel technologies can reduce black carbon emissions from road transport very quickly, and produce considerable co‐benefits for public health (Liu et al., 2008; Biswas et al., 2009; US EPA, 2012) . Vehicle emission standards to reduce local air pollution can lead to fuel penalties that can lead to increases in CO2 emissions (Tourlonias and Koltsakis, 2011) but these fuel penalties are generally small compared to the potential to reduce CO2 emissions from vehicles and can led to reduction in climate forcing due to the decrease in non‐CO2 emissions (Maclean and Lave, 2000). Vehicle inspections as a device for reducing emissions can be cost‐effective but if not properly designed will result in only small environmental benefits (Eisinger, 2005). Regulations for reducing particulate matter (PM) and ozone emissions decrease non‐CO2 pollutants that may have both positive and negative forcings, which overall should have a positive regional benefit of reducing regional forcing (IPCC AR5 Working Group I).
Two and three‐wheel motor vehicles can give high local air pollution impacts. Policy effort has therefore focused on reducing emissions such as in large Indian cities that have shifted from heavy fuel oil to CNG for their three‐wheelers in recent years as a result of a high court intervention (Salter et al 2010). Kathmandu, Nepal, shifted from diesel three‐wheelers to electric ones in the early 2000s as a result of government policies that waived import taxes and annual fees for these EVs (Dhakal S, 2003).
For HDVs, reduction of local air pollutants, in particular NOx and PM emissions, has been a key policy focus. To improve local air quality, several cities have introduced truck routing systems, which, if planned properly, can potentially lower both fuel consumption and local pollutant emissions (Suzuki, 2011). Some European countries have forbidden HDVs with high PM emissions to enter urban areas. However, depending on their design, these measures may increase trip length and hence overall GHG emissions (Bektaş and Laporte, 2011).
8.10.2 Rail transport 32 To attract passengers, rail journeys needs to be faster than driving road vehicles on the same routes, thereby encouraging policies that support high‐speed trains and grade‐separated intersections with roads (Camagni et al., 2002). Integration of transit modes, timetables, ticketing and information provision enable a passenger to easily use two or three modes of travel between departure point and destination. Light‐rail and buses can have dedicated lanes and priority traffic signals to achieve the desired speed advantage and avoided long waiting times. Mass transit systems can maintain a consistent speed advantage over use of road vehicles if governments refrain from building more roads and shift investments to other modes. This may increase road traffic congestion in the short term but could eventually encourage road vehicle users to switch to transit services.
Energy intensity. Education and training policies have enabled the rail freight industry to improve its fuel efficiency. The German Railways, in 2002, reached their aim of reducing energy consumption by 25% of the 1990 level three years ahead of schedule due to encouraging train drivers to drive in a more energy‐efficient way. Rail is the leading freight transport mode in the US with a market share of 40% of total freight movement. Fuel efficiency was improved by more than 60% between 1980 and 2001 (Sagevik, 2006).

First Order Draft (FOD) IPCC WG III AR5
Do Not Cite, Quote or Distribute 62 of 100 Chapter 8 WGIII_AR5_Draft1_Ch08_final2.doc 19 July 2012
System efficiency. China has invested USD 300 billion in high‐speed rail infrastructure (Kuhn, 2011), but few other similar government policies exist. Promoting a good image for mass transit needs to be made in ways that maintain the system as affordable and accessible to all users (Siemiatycki, 2006; Figueroa, 2010).
1 2 3 4
6 7 8
9 10 11 12
13 14 15 16 17 18
20 21 22 23 24 25 26 27 28
29 30 31 32 33 34 35
36 37 38 39
41 42 43 44 45
46 47
8.10.3 Marine transport 5
The International Maritime Organization has adopted mandatory measures to reduce GHG emissions from international shipping, representing the first mandatory GHG reduction regime for an international industry sector (IMO, 2011).
Energy intensity. The European Commission is considering possible independent action in 2012 because sulphur emissions from shipping are projected to exceed all land‐based sources in the EU by 2020 (E C Environment, 2011). A directive already limits the maximum sulphur content of marine fuels to 1.5% for ships in the Baltic Sea, North Sea and English Channel.
The energy efficiency design index (EEDI) sets technical standards for improving the energy efficiency of certain categories of new ships which will, in turn, lead to less CO2 emissions. The Ship Energy Efficiency Management Plan (SEEMP) becomes mandatory from 2015 (IMO, 2011) when a minimum energy efficiency level for different ship types and sizes is expected to cover as much as 70% of emissions from new ships and achieve approximately 25‐30% reductions by 2030 compared with business‐as‐usual (IISD, 2011).
8.10.4 Aviation 19
Energy intensity. Standards for age and condition of aircraft are usually set for safety as well as for minimising air pollutants (Kahn Ribeiro S, et al., 2007). National standards can be set but, unlike other transport modes, aviation has an international approach towards climate change mitigation including the introduction of global fuel‐efficiency standards (ICAO‐CAEP, 2010). In the EU, air traffic data and fuel consumption are recorded and measures implemented to reduce GHG emissions (IATA, 2011). Member states are working together with the industry towards improving technologies, efficient use of airport infrastructure, efficient operation of aircraft and adoption of appropriate economic measures such as voluntary actions, charges and taxes, and emissions offsetting (ICAO, 2007, 2010b).
GHG intensity. In 2010, the 190 contracting states to the International Civil Aviation Organisation (ICAO) agreed on a non‐binding, global aviation strategy to continuously improve fuel efficiency by an average of 1.5% per annum from 2009 until 2020; to achieve carbon neutral growth from 2020; and to reduce carbon emissions by 50% by 2050 compared to 2005 levels (ICAO, 2010c). A global CO2 standard for aircraft is under development for 2013 aiming to slow demand growth and hence avoid additional emissions of 190Mt CO2 annually (ICAO‐CAEP, 2010).It was triggered by inclusion of aviation in the EU‐ETS (IATA, 2011).
Europe is the most advanced region to adopt market‐based measures with an emission reduction target of 20% below 1990 levels by 2020 rising to 80‐95% below by 2050 (European Climate Foundation, 2011). To achieve this, aviation has been integrated into the EU Emissions Trading Scheme (EU‐ETS), now capturing 35% of global aviation emissions (Preston et al., 2012).
8.10.5 Infrastructure and urban planning 40
Policies relating to improving system efficiencies can be set at all government levels. Traditionally, transport planners have tried to relieve congestion by building more roads, airports and other infrastructure to improve system efficiency. However, this additional capacity can induce demand for transport and, over time, lead to even greater congestion. An increase in road infrastructure can increase distance traveled proportionally (Duranton and Turner, 2011).
Local governments are usually responsible for land use, local transport and infrastructure (Chapter 12) and thus can employ policy mechanisms to reduce related GHG emissions. Local policies can aim

First Order Draft (FOD) IPCC WG III AR5
Do Not Cite, Quote or Distribute 63 of 100 Chapter 8 WGIII_AR5_Draft1_Ch08_final2.doc 19 July 2012
to concentrate land use in focussed centres suitable for NMT and PT, or they can widely scatter urban property development so that only LDVs are a suitable mode.
1 2
3 4
6 7 8
10 11 12 13 14 15 16 17 18 19 20 21 22 23 24 25 26 27 28 29 30 31 32 33 34 35 36
37 38 39 40
42 43 44 45 46 47 48 49 50
Pricing and physical restrictions can be key policies to induce a shift from LDVs to more environmentally‐friendly transport modes or to reduce demand.
Road traffic demand on freeways can be reduced by 20‐30% as a result of introducing tolls of 5 USD 0.07‐0.14 per vehicle‐km although this may not reduce the number of journeys if other routes are available. Several toll projects have failed to achieve projected reductions in traffic volumes and hence revenue.
Improved parking management is the simplest form of pricing with relatively modest 9 implementation costs since most cities already have parking meter systems which can act as a cost‐effective congestion reduction strategy (Barter et al., 2003; Litman, 2006). Dedicated bus lanes on city roads, possibly in combination with a vehicle access charge, can be a major instrument to achieving rapid public transit whilst reducing inefficient individual motorized transport (Creutzig and He, 2009). Although local governments are often limited financially, a transport levy could be used to finance the building of a mass transit system.
Since the 1960s, many cities have instigated supportive policies and infrastructure that have resulted in a stable growth in cycling (Hook, 2003; TFL, 2007); Servaas, 2000; NYC, 2011). In London, UK, the present 2% cycle share of travel modes is targeted to be increased to 5% in 2026 as a result of implementing a range of policies (TFL, 2010). By comparison, in Surabaya, Indonesia, 40% of total trips between 1 ‐ 3 km are already by walking (30%) and cycling (10%, including rickshaws) in spite of unsupportive infrastructure and policies (Hook, 2003). Transit oriented development (TOD) strategies integrate moderate to high density property development located within easy walking distance of a major public transport node, featuring a mix of residential, employment and shopping opportunities for pedestrians and cyclists but without excluding cars, with the dual objectives of reducing car dependence and preventing urban sprawl (Newman and Kenworthy, 1996; Cervero, 2004; Olaru et al., 2011). If inner area‐type development were to be preferred to fringe area‐type development there could be an annual savings of around 4.4 tCO2‐eq per household (Trubka et al., 2010) and co‐benefits of health, productivity and social opportunity (Newman et al., 2009; Ewing and Cervero, 2010; Höjer et al., 2011) suggested that LDV trips in compact neighbourhoods can be reduced 20‐40% compared with low‐density suburbs. LDV use in cities could be reduced significantly if polycentric city and comprehensive smart‐growth policies were implemented (Dierkers et al., 2008). Sprawling cities are more susceptible to fuel price increases (Gusdorf and Hallegatte, 2007). Hence, urban densification can provide resilience to fuel price increases reduces infrastructure costs and improve health (Trubka et al., 2010).
Medium‐size cities in developing countries have the opportunity to invest in infrastructure after learning from best urban planning experiences elsewhere in order to accommodate their expected population growth with minimal expansion of their built urban environment (Schlomo et al., 2005; Kahn Ribeiro et al., 2012) .
8.10.6 Mobility access and sustainable development 41
Sustainable transport policies will not only improve local transport and the quality of environment and urban living but will have a positive effect on climate mitigation and energy security aspects as well (WBCSD, 2004); WBCSD, 2007; (ECMT, 2004) (World Bank, 2006); IEA, 2009; (Banister, 2008) (Bongardt et al., 2011); Khan Ribeiro et al.,2011; (Ramani et al., 2011). Equity and road safety are appropriate policy targets for sustainable transport, particularly in developing countries (Vasconcellos, 2001) (Kane, 2010). Prioritizing safety is a goal supported by evidence presented in major studies showing that developing countries are disproportionately affected by the problem, as over 90% of road‐related deaths occur in low‐ and middle‐income countries (WHO, 2009). A series of well‐integrated policies is a pre‐condition for a shift to sustainable modes (Ogilvie et al., 2004).

First Order Draft (FOD) IPCC WG III AR5
Do Not Cite, Quote or Distribute 64 of 100 Chapter 8 WGIII_AR5_Draft1_Ch08_final2.doc 19 July 2012
The mobility needs, complex choices and priority setting issues raised by the rapid growth of transport demand taking place in non‐OECD countries highlights the importance of placing climate‐related transport policies in the context of goals for sustainable urban development (Bongardt et al., 2011; Kahn Ribeiro et al., 2012) ) (8.9).
1 2 3 4
5 6 7 8 9
10
11 12 13 14 15 16
17 18 19 20 21 22
23 24 25
Diverse attempts have been made by transport agencies in OECD countries to define and measure policy performance toward sustainable transport (CST, 2002) (OECD, 2000) (Banister, 2008) (Ramani et al., 2011). The type of policies, their timing and potential success of implementation are context dependent (Santos et al., 2010). Local history and social culture relate to the specific problem context and can shape the policy aspirations which determine what will ultimately become acceptable solutions (Vasconcellos, 2001) (Kane, 2010) (Dimitriou, 2006) (Verma et al., 2011).
Policy and decision making for transport development in non‐OECD countries are instrumental to meet urban sustainability and climate goals (Kahn Ribeiro et al., 2012). The unprecedented scale of urban growth and sizeable redistribution of rural population to urban areas are expected to continue during the coming decades. This implies a huge potential for increase in demand for urban infrastructure and spatial development of medium‐size cities where motorized transport may not yet have reached unmanageable levels (Grubler et al., 2011).
Opportunities exist in countries and regions with low levels of car ownership (<10 cars/1000 people) for local and national governments to manage rising vehicle demand (Wright and Fulton, 2005; IEA, 2009a), promote transport development that supports economic growth (Kane, 2010) and recognize the social benefits of sustainable transport (Kato,H. and Jimbo, K, 2005). Policy prioritisation can consider economic development strategies in relation to improving living standards and social welfare (Dimitriou, 2006; Li, 2011; Verma et al., 2011) (Dimitriou, 2006) (Verma et al., 2011).
Policy instruments for sustainable transport and climate change mitigation can span land use planning, regulatory, economic instruments, information and technological instruments and their integration (Table 8.10.1).

First Order Draft (FOD) IPCC WG III AR5
Do Not Cite, Quote or Distribute 65 of 100 Chapter 8 WGIII_AR5_Draft1_Ch08_final2.doc 19 July 2012
Table 8.10.1 Summary of sustainable transport measures, level of implementation and type of integration supporting measures
1 2
3
4 Source: Modified from (Preston, 2010) (GEA, 2011).

First Order Draft (FOD) IPCC WG III AR5
Do Not Cite, Quote or Distribute 66 of 100 Chapter 8 WGIII_AR5_Draft1_Ch08_final2.doc 19 July 2012
8.11 Gaps in knowledge and data 1
A much better knowledge of traveler and consumer behaviour is needed, particularly for aviation. There is little understanding of how and when people will choose to buy and use new types of low‐carbon vehicles (electric, neighbourhood/city scale) and use new types of mobility services (such as demand responsive transit or car sharing).
2 3 4 5
6 7 8 9
10 11
12 13 14 15 16 17
19
20
21 22 23 24 25 26 27 28
29
30
31 32 33 34 35 36 37 38 39
40
41 42 43 44
In a broader sense, we have a poor understanding of how travelers will respond to combinations of strategies (mixes of land use, transit, vehicle options), which is especially important for fast‐growing, developing countries where alternative modes to the car‐centric development path could be deployed.
For freight, data and understanding relating to freight movement and logistical systems are poor as are their economic implications. As a result it is difficult to design new low‐carbon freight policies.
Understanding how low‐carbon transport and energy technologies will evolve (via experience curves and innovation processes) is not well developed. In addition, the rate of acceptance of new concepts such as LDV road convoys and driverless cars (both currently being demonstrated) is difficult to predict as is level of related infrastructure investments needed. Recent rapid developments in metro systems in some cities, such as Shanghai, illustrate how quickly new transport systems can occur when the demand, policies and investments are put in place.
8.12 Frequently asked questions 18
FAQ 8.1 How much does the transport sector contribute to GHG emissions and how is this
changing?
The aviation, marine, rail and road transport subsectors for moving freight and passengers currently constitute about one quarter of total global energy‐related CO2 emissions and also significantly contribute to black carbon and aerosol emissions. As demand for transport services is expected to increase into the future, if no mitigation options are implemented the transport sector´s CO2 emissions could double by 2035 at continued current rates of growth, to then represent a significantly higher share of global energy‐related CO2 emissions.
FAQ 8.2 What are the main mitigation options in the transport sector and what is the potential
for reducing GHG emissions?
The main mitigation options for freight and passenger transport includes both technologies for low‐carbon fuels/energy carriers and efficiency gains for new and improved vehicles and engines, and behavioral and structural changes (including urban form) leading to modal shift and the reduced need for motorized transport relative to a reference case. However, these mitigation options, and barriers to their implementation, differ both geographically and temporally between world regions, and the short, medium and long terms, due to variations in stages of economic development, modal choices available, types and age of vehicle fleets, fuels available, existing infrastructure and investment constraints.
FAQ 8.3 Are there any co‐benefits associated with mitigation actions in the transport sector?
Yes, there are many co‐benefits associated with mitigation actions in the transport sector, such as travel cost savings, improved health and reduced local air pollution, and these co‐benefits may even exceed the costs of implementing these actions.

First Order Draft (FOD) IPCC WG III AR5
Do Not Cite, Quote or Distribute 67 of 100 Chapter 8 WGIII_AR5_Draft1_Ch08_final2.doc 19 July 2012
References 1
2 3
4 5
6
7
8 9
10 11
12 13 14 15
16 17 18 19
20 21 22
23 24 25 26
27 28 29 30
31 32
33 34 35 36
37 38 39
ACEA (2011). ACEA Tax Guide 2011 Highlights. Available at: http://www.acea.be/news/news_detail/acea_tax_guide_2011/.
Acharya S., and S. Morichi (2007). Motorization and Role of Mass Rapid Transit in East Asian Megacities. IATSS Research 31, 6–16.
ADB (2012a). Sustainable Transport Initiative. Asian Development Bank, Manila.
ADB (2012b). Toward Green Urbanization in Asia and the Pacific. Asian Development Bank, Manila.
Åkerman J. (2011). The role of high‐speed rail in mitigating climate change – The Swedish case Europabanan from a life cycle perspective. Transportation Research Part D: Transport and Environment 16, 208–217. (DOI: 10.1016/j.trd.2010.12.004). Available at: http://www.sciencedirect.com/science/article/pii/S1361920910001689.
Allport R. (2011). Rail Rapid Transit Advances. In: Urban transport in the developing world, Dimitriou, H. and Gakenheimer, R. (eds). Edward Elgar, Cheltenham, Glos, U.K.; Northampton, Mass. pp.456–488, (ISBN: 9781847202055). Available at: http://trid.trb.org.globalproxy.cvt.dk/view.aspx?id=1116823.
Amatayakul W., and G. Berndes (2007). Fuel ethanol program in Thailand: energy, agricultural, and environmental trade‐offs and prospects for CO2 abatement. Energy for Sustainable Development 11, 51–66. (DOI: 10.1016/S0973‐0826(08)60577‐3). Available at: http://www.sciencedirect.com/science/article/pii/S0973082608605773.
Amekudzi A. (2011). Placing carbon reduction in the context of sustainable development priorities: a global perspective. Carbon Management 2, 413–423. (DOI: 10.4155/cmt.11.43). Available at: http://www.future‐science.com/doi/abs/10.4155/cmt.11.43.
Amekudzi A.A., C. Jotin Khisty, and M. Khayesi (2009). Using the sustainability footprint model to assess development impacts of transportation systems. Transportation Research Part A: Policy and Practice 43, 339–348. (DOI: 10.1016/j.tra.2008.11.002). Available at: http://www.sciencedirect.com/science/article/pii/S096585640800205X.
Amekudzi A.A., A. Ramaswami, E. Chan, K. Lam, W. Hon Meng, and D. Zhu (2011). Contextualizing carbon reduction initiatives: how should carbon mitigation be addressed by various cities worldwide? Carbon Management 2, 363–365. (DOI: 10.4155/cmt.11.40). Available at: http://dx.doi.org/10.4155/cmt.11.40.
An F., D. Gordon, H. He, D. Kodjak, and D. Rutherford (2007). Passenger Vehicle Greenhouse Gas and Fuel Economy Standards: A Global Update. ICCT.
Anable J. (2005). “Complacent Car Addicts” or “Aspiring Environmentalists”? Identifying travel behaviour segments using attitude theory. Transport Policy 12, 65–78. (DOI: 10.1016/j.tranpol.2004.11.004). Available at: http://linkinghub.elsevier.com/retrieve/pii/S0967070X0400054X.
Anderson S.T., R. Kellogg, and J.M. Sallee (2011). What Do Consumers Believe About Future Gasoline Prices? National Bureau of Economic Research Working Paper Series No. 16974. Available at: http://www.nber.org/papers/w16974.

First Order Draft (FOD) IPCC WG III AR5
Do Not Cite, Quote or Distribute 68 of 100 Chapter 8 WGIII_AR5_Draft1_Ch08_final2.doc 19 July 2012
Andrade V., O.B. Jensen, H. Harder, and J.C.O. Madsen (2011). Bike Infrastructures and Design Qualities: Enhancing Cycling. Tidsskrift for Kortlægning og Arealforvaltning; Vol 46, No 1 (2011). Available at: http://ojs.statsbiblioteket.dk/index.php/tka/article/view/5734.
1 2 3
4
5 6 7
8 9
10 11 12
13 14 15 16
17 18 19
20 21
22 23 24
25 26 27 28
29 30 31
32
33 34 35
36 37
ANFAVEA (2012). Carta da Anfavea June/2012.
Aschauer D.A. (1989). Is public expenditure productive? Journal of Monetary Economics 23, 177–200. (DOI: doi: 10.1016/0304‐3932(89)90047‐0). Available at: http://www.sciencedirect.com/science/article/pii/0304393289900470.
Ashton‐Graham C. (2008). Behavioural responses to peak oil and carbon pricing: Save 70 cents a litre by driving less. Planning and Transport Research Centre.
Ashton‐Graham C., M. Burgess, O.V.D. Vandersteen, and R. Salter (2011). Influencing Travel Choices. TNA Guidebook Series. In: Technologies for Climate Change Mitigation – Transport. UNEP Riso Centre for Energy, Climate and Sustainable Development, .
Atabani A.E., I.A. Badruddin, S. Mekhilef, and A.S. Silitonga (2011). A review on global fuel economy standards, labels and technologies in the transportation sector. Renewable and Sustainable Energy Reviews 15, 4586–4610. (DOI: 10.1016/j.rser.2011.07.092). Available at: http://www.sciencedirect.com/science/article/pii/S1364032111003376.
Ausubel J.H. (1989). Regularities in Technological Development: An Environmental View. In: Technology and Environment. J.H. Ausubel, H.E. Sladovich, (eds.), The National Academies Press, (ISBN: 9780309044264). Available at: http://www.nap.edu/openbook.php?record_id=1407.
Axsen J., and K.S. Kurani (2012). Characterizing Residential Recharge Potential for Plug‐in Electric Vehicles. Transportation Research Board. Available at: http://trid.trb.org/view.aspx?id=1129899.
Bamberg S., S. Fujii, M. Friman, and T. Gärling (2011). Behaviour theory and soft transport policy measures. Transport Policy 18, 228–235. (DOI: 10.1016/j.tranpol.2010.08.006). Available at: http://www.sciencedirect.com/science/article/pii/S0967070X10001034.
Bandivadekar A., L. Cheah, C. Evans, T. Groode, J. Heywood, E. Kasseris, M. Kromer, and M. Weiss (2008). Reducing the fuel use and greenhouse gas emissions of the US vehicle fleet. Energy Policy 36, 2754–2760. (DOI: 10.1016/j.enpol.2008.03.029). Available at: http://www.sciencedirect.com/science/article/pii/S0301421508001651.
Bandivadekar, A. (2008). On the Road in 2035: Reducing Transportation’s Petroleum Consumption and GHG Emissions. Massachusetts Institute of Technology, Laboratory for Energy and the Environment Report LFEE.
Banister D. (2008). The Sustainable Mobility Paradigm. Transport Policy 15, 73–80.
Baptista P., M. Tomás, and C. Silva (2010). Plug‐in hybrid fuel cell vehicles market penetration scenarios. International Journal of Hydrogen Energy 35, 10024–10030. (DOI: 10.1016/j.ijhydene.2010.01.086).
Barter P., J. Kenworthy, and F. Laube (2003). Lessons from Asia on Sustainable Urban Transport. In: Making Urban Transport Sustainable. Palgrave‐ Macmillan, Basingstoke UK.
First Order Draft (FOD) IPCC WG III AR5
Do Not Cite, Quote or Distribute 69 of 100 Chapter 8 WGIII_AR5_Draft1_Ch08_final2.doc 19 July 2012
Bassett D., J. Pucher, R. Buehler, D. Thompson, and S. Crouter (2008). Walking, cycling, and obesity rates in Europe, North America, and Australia. J Phys Act Health 5, 795–814. Available at: http://ukpmc.ac.uk/abstract/MED/19164816.
1 2 3
4 5 6 7
8 9
10 11 12
13 14 15
16 17 18
19 20 21
22 23
24 25 26 27
28 29 30
31 32 33
34 35 36
37 38 39
Bastani P., J.B. Heywood, and C. Hope (2012). The effect of uncertainty on US transport‐related GHG emissions and fuel consumption out to 2050. Transportation Research Part A: Policy and Practice 46, 517–548. (DOI: 10.1016/j.tra.2011.11.011). Available at: http://www.sciencedirect.com/science/article/pii/S0965856411001807.
Bayor R.H. (1988). Roads to Racial Segregation. Journal of Urban History 15, 3–21. Available at: http://juh.sagepub.com/content/15/1/3.short.
Becker A., S. Inoue, M. Fischer, and B. Schwegler (2012). Climate change impacts on international seaports: knowledge, perceptions, and planning efforts among port administrators. Climatic Change 110, 5–29. Available at: http://dx.doi.org/10.1007/s10584‐011‐0043‐7.
Behrens K., and P.M. Picard (2011). Transportation, freight rates, and economic geography. Journal of International Economics. (DOI: doi: 10.1016/j.jinteco.2011.06.003). Available at: http://www.sciencedirect.com/science/article/pii/S0022199611000742.
Bektaş T., and G. Laporte (2011). The Pollution‐Routing Problem. Transportation Research Part B: Methodological 45, 1232–1250. (DOI: 10.1016/j.trb.2011.02.004). Available at: http://www.sciencedirect.com/science/article/pii/S019126151100018X.
Bell M.L., R. Goldberg, C. Hogrefe, P.L. Kinney, K. Knowlton, B. Lynn, J. Rosenthal, C. Rosenzweig, and J.A. Patz (2007). Climate change, ambient ozone, and health in 50 US cities. Climatic Change 82, 61–76. (DOI: 10.1007/s10584‐006‐9166‐7).
Ben‐Akiva M.E., and S.R. Lerman (1985). Discrete Choice Analysis: Theory and Application to Travel Demand. MIT Press, 424 pp., (ISBN: 9780262022170).
Biswas S., V. Verma, J.J. Schauer, and C. Sioutas (2009). Chemical speciation of PM emissions from heavy‐duty diesel vehicles equipped with diesel particulate filter (DPF) and selective catalytic reduction (SCR) retrofits. Atmospheric Environment 43, 1917–1925. (DOI: 10.1016/j.atmosenv.2008.12.040).
Blijenberg A. (1993). The Driving Forces for Transportation Growth and the Implications for Policy. The European Commission of Ministers of Transport. 37–50 pp. Available at: http://pubs.acs.org/doi/abs/10.1021/es104221b.
Blottnitz H., and M.A. Curran (2007). A review of assessments conducted on bio‐ethanol as a transportation fuel from a net energy, greenhouse gas, and environmental life cycle perspective. Journal of Cleaner Production 15, 607–619. Available at: about:blank.
Bond T., D. Streets, K. Yarber, S. Nelson, J. Woo, and Z. Klimont (2004). A technology‐based global inventory of black and organic carbon emissions from combustion. JOURNAL OF GEOPHYSICAL RESEARCH‐ATMOSPHERES 109. (DOI: 10.1029/2003JD003697).
Bongardt D., D. Scmid, C. Huizenga, and T. Litman (2011). Sustainable Transport Evaluation: Developing Practical Tools for Evaluation in the Context of the CSD Process. Partnership on Sustainable low Carbon Transport, Eschborn, Germany.

First Order Draft (FOD) IPCC WG III AR5
Do Not Cite, Quote or Distribute 70 of 100 Chapter 8 WGIII_AR5_Draft1_Ch08_final2.doc 19 July 2012
Brownstone D. (2008). Key Relationships Between The Built Environment and VMT. Special Report 298 Prepared for the Committe on the Relationship Among Develoment Patterns, Vehicles Miles Traveled and Energy Consumption. Transportation Research Board and the Division on Engineering and Physical Sciences.
1 2 3 4
5 6 7 8
9 10
11 12 13
14 15 16 17
18 19 20 21 22
23 24
25 26 27
28 29
30 31 32 33
34 35 36
37
38 39
Brozović N., and A.W. Ando (2009). Defensive purchasing, the safety (dis)advantage of light trucks, and motor‐vehicle policy effectiveness. Transportation Research Part B: Methodological 43, 477–493. (DOI: 10.1016/j.trb.2008.09.002). Available at: http://www.sciencedirect.com/science/article/pii/S0191261508001070.
Button K. (2010). The external Costs of Transport. In: Transport Economics. Edward Elgar Publishing, (ISBN: 9781840641899).
Calthrop E., and S. Proost (1998). Road Transport Externalities. Environmental and Resource Economics 11, 335–348. (DOI: 10.1023/A:1008267917001). Available at: http://www.springerlink.com.globalproxy.cvt.dk/content/q7t3kn7348r721t6/abstract/.
Camagni R., M.C. Gibelli, and P. Rigamonti (2002). Urban mobility and urban form: the social and environmental costs of different patterns of urban expansion. Ecological Economics 40, 199–216. (DOI: 10.1016/S0921‐8009(01)00254‐3). Available at: http://www.sciencedirect.com/science/article/pii/S0921800901002543.
Cantos‐Sánchez P., R. Moner‐Colonques, J.J. Sempere‐Monerris, and Ó. Álvarez‐SanJaime (2009). Alternative pricing regimes in interurban passenger transport with externalities and modal competition. Regional Science and Urban Economics 39, 128–137. (DOI: 10.1016/j.regsciurbeco.2008.06.006). Available at: http://www.sciencedirect.com/science/article/pii/S0166046208000690.
Cao X., P.L. Mokhtarian, and S. Handy (2009). Examining the impacts of residential self‐selection on travel behaviour: A focus on empirical findings. Transport Reviews 29, 359–395.
CARB (2010). Sub‐chapter 10. Climate Change, Article 4. Regulations to Achieve Greenhouse Gas Emission Reductions, Sub‐article 7. Low Carbon Fuel Standard. California Air Resources Board, Sacramento, California.
Carisma B., and S. Lowder (2007). Estimating the Economic Costs of Traffic Congestion: A Review of Literature on Various Cities & Countries.
Carrabine E., and B. Longhurst (2002). Consuming the car: anticipation, use and meaning in contemporary youth culture. The Sociological Review 50, 181–196. (DOI: 10.1111/1467‐954X.00362). Available at: http://onlinelibrary.wiley.com.globalproxy.cvt.dk/doi/10.1111/1467‐954X.00362/abstract.
CE Delft (2011). Potential of modal shift to rail transport. Available at: http://www.cedelft.eu/publicatie/potential_of_modal_shift_to_rail_transport/1163?PHPSESSID=85969a496d79705462017a60f30353cc.
Cervero R. (1998). The transit metropolis: A global inquiry. Island Press, (ISBN: 978‐1559635912).
Cervero R. (2004). Transit‐oriented development in the United States: experiences, challenges and prospects. Transportation Research Board.

First Order Draft (FOD) IPCC WG III AR5
Do Not Cite, Quote or Distribute 71 of 100 Chapter 8 WGIII_AR5_Draft1_Ch08_final2.doc 19 July 2012
Cervero R., and J. Murakami (2010). Effects of built environments on vehicle miles traveled: evidence from 370 US urbanized areas. Environment and Planning A 42, 400–418. Available at: http://www.envplan.com/abstract.cgi?id=a4236.
1 2 3
4 5 6
7 8 9
10
11 12 13
14 15
16 17 18 19
20 21 22
23 24 25 26
27 28 29
30 31 32 33
34 35 36
37
38 39 40
Chandler K., E. Eberts, and L. Eudy (2006). New York City Transit Hybrid and CNG Transit Buses: Interim Evaluation Results. National Renewable Energy Lab, Golden CO, Washington D C, USA. 64 pp. Available at: http://www.afdc.energy.gov/afdc/progs/view_citation.php?9499/CNG.
Chang B., and A. Kendall (2011). Life cycle greenhouse gas assessment of infrastructure construction for California’s high‐speed rail system. Transportation Research Part D: Transport and Environment 16, 429–434. (DOI: 10.1016/j.trd.2011.04.004). Available at: http://www.sciencedirect.com/science/article/pii/S1361920911000484.
Chapter 4 ‐ Ship Structures (2008). In: The Maritime Engineering Reference Book. Butterworth‐Heinemann, Oxford pp.116–180, (ISBN: 978‐0‐7506‐8987‐8). Available at: http://www.sciencedirect.com/science/article/pii/B9780750689878000044.
Chen X., and M. Khanna (2012). The Market‐Mediated Effects of Low Carbon Fuel Policies. AgBioForum 15, 1–17. Available at: http://www.agbioforum.org/v15n1/v15n1a11‐khanna.htm.
Cherubini F., and A.H. Strˉmman (2011). Life Cycle Assessment of bioenergy systems: State of the art and future challenges. Bioresource Technology In Press, Accepted Manuscript. Available at: http://www.sciencedirect.com/science/article/B6V24‐50PVFWS‐C/2/1befb67b04eb3722c71b4caa53be50a8.
Chester M.V., and A. Horvath (2009). Environmental assessment of passenger transportation should include infrastructure and supply chains. Environmental Research Letters 4, 024008. Available at: http://stacks.iop.org/1748‐9326/4/i=2/a=024008.
Chester M., and A. Horvath (2010). Life‐cycle assessment of high‐speed rail: the case of California. Environmental Research Letters 5, 014003. (DOI: 10.1088/1748‐9326/5/1/014003). Available at: http://stacks.iop.org/1748‐9326/5/i=1/a=014003?key=crossref.4b62cd6078ca9f8a4e47bf6165463b0d.
Chester M., and E. Martin (2009). Cellulosic Ethanol from Municipal Solid Waste: A Case Study of the Economic, Energy, and Greenhouse Gas Impacts in California. Environmental Science & Technology 43, 5183–5189. Available at: http://dx.doi.org/10.1021/es802788z.
Chum H., A. Faaij, J. Moreira, G. Berndes, P. Dhamija, H. Dong, B. Gabrielle, A. Goss, W. Lucht, M. Mapako, O. Masera Cerutti, T. McIntyre, T. Minowa, and K. Pingoud (2011). Bioenergy. In: IPCC Special Report on Renewable Energy Sources and Climate Change Mitigation. Cambridge University press, .
Cohen J. (2010). Private capital, public credit and the decline of American railways, 18401940. The Journal of Transport History 31, 42–68. Available at: http://www.ingentaconnect.com/content/manup/jtth/2010/00000031/00000001/art00003.
Cooper K. (2000). Truck Aerodynamics and Its Future‐An Opinion. U.S. Department of Energy.
Cooper D.A., and M. Ekstrom (2005). Applicability of the PEMS technique for simplified NOX monitoring on board ships. Atmospheric Environment 39, 127–137. (DOI: 10.1016/j.atmosenv.2004.09.019).

First Order Draft (FOD) IPCC WG III AR5
Do Not Cite, Quote or Distribute 72 of 100 Chapter 8 WGIII_AR5_Draft1_Ch08_final2.doc 19 July 2012
Corbett J.J., D.A. Lack, J.J. Winebrake, S. Harder, J.A. Silberman, and M. Gold (2010). Arctic shipping emissions inventories and future scenarios. ATMOSPHERIC CHEMISTRY AND PHYSICS 10, 9689–9704. (DOI: 10.5194/acp‐10‐9689‐2010).
1 2 3
4 5 6 7
8 9
10 11
12 13 14
15 16 17
18 19
20 21 22 23
24 25
26 27
28 29 30
31 32 33 34
35 36 37
38 39 40
Corbett J.J., H. Wang, and J.J. Winebrake (2009). The effectiveness and costs of speed reductions on emissions from international shipping. Transportation Research Part D: Transport and Environment 14, 593–598. (DOI: 10.1016/j.trd.2009.08.005). Available at: http://www.sciencedirect.com/science/article/pii/S1361920909001072.
Creutzig F., and D. He (2009). Climate change mitigation and co‐benefits of feasible transport demand policies in Beijing. Transportation Research Part D: Transport and Environment 14, 120–131. (DOI: doi: 10.1016/j.trd.2008.11.007). Available at: http://www.sciencedirect.com/science/article/pii/S1361920908001478.
Creutzig F., E. McGlynn, J. Minx, and O. Edenhofer (2011). Climate policies for road transport revisited (I): Evaluation of the current framework. Energy Policy 39, 2396–2406. Available at: http://www.user.tu‐berlin.de/creutzig/sust.html.
Crist P. (2009). Greenhouse Gas Emissions Reduction Potential from International Shipping. JTRC Discussion Paper. Available at: http://www.internationaltransportforum.org/jtrc/discussionpapers/DP200911.pdf.
CST (2002). Definition and Vision of Sustainable Transport. The Center for Sustainable Transportation, Ontario, Canada.
Cuenot F., L. Fulton, and J. Staub (2012). The prospect for modal shifts in passenger transport worldwide and impacts on energy use and CO2. Energy Policy 41, 98–106. (DOI: 10.1016/j.enpol.2010.07.017). Available at: http://www.sciencedirect.com/science/article/pii/S0301421510005471.
Dalkmann H., and C. Brannigan (2007). Transport and climate change. A Sourcebook for Policy‐Makers in Developing Cities: Module 5e. Gesellschaft für Technische Zusammenarbeit–GTZ Eschborn.
Dall’erba S., and J.D. Hewings (2003). Cumulative process of deindustrialization in an open region: the case of Southern Italy.
Davis S.J., K. Caldeira, and H.D. Matthews (2010). Future CO2 Emissions and Climate Change from Existing Energy Infrastructure. Science 329, 1330–1333. Available at: http://www.sciencemag.org/content/329/5997/1330.abstract.
Dell’Olmo P., and G. Lulli (2003). A new hierarchical architecture for Air Traffic Management: Optimisation of airway capacity in a Free Flight scenario. European Journal of Operational Research 144, 179–193. (DOI: 10.1016/S0377‐2217(01)00394‐0). Available at: http://www.sciencedirect.com/science/article/pii/S0377221701003940.
Delucchi M.A. (2010). Impacts of biofuels on climate change, water use, and land use. Annals of the New York Academy of Sciences 1195, 28–45. (DOI: 10.1111/j.1749‐6632.2010.05457.x). Available at: http://dx.doi.org/10.1111/j.1749‐6632.2010.05457.x.
Delucchi M.A. (2011). Beyond Lifecycle Analysis: Developing a Better Tool for Simulating Policy Impacts. In: Sustainable Transportation Energy Pathways. J.M. Ogden, L. Anderson, (eds.), Institute of Transportation Studies, University of California, Davis, pp.pp. 278–295, .

First Order Draft (FOD) IPCC WG III AR5
Do Not Cite, Quote or Distribute 73 of 100 Chapter 8 WGIII_AR5_Draft1_Ch08_final2.doc 19 July 2012
Delucchi M.A., and D. McCubbin (2011). External Cost of Transport in the United States. In: A handbook of transport economics. A. De Palma, R. Lindsey, E. Quinet, R. Vickerman, (eds.), Edward Elgar, Cheltenham, Glos, U.K.; Northampton, Mass. pp.341–368, (ISBN: 9781847202031 1847202039).
1 2 3 4
5 6
7 8 9
10 11 12
13 14 15
16 17 18 19
20 21 22
23 24 25
26 27
28 29
30 31
32 33 34
35 36 37
38 39 40
DeMaio P. (2009). Bike‐sharing: History, Impacts, Models of Provision, and Future. Journal of Public Transportation 12, 41–56. Available at: http://www.nctr.usf.edu/jpt/pdf/JPT12‐4DeMaio.pdf.
Deng T., and J.D. Nelson (2011). Recent Developments in Bus Rapid Transit: A Review of the Literature. Transport Reviews 31, 69–96. (DOI: 10.1080/01441647.2010.492455). Available at: http://www.tandfonline.com/doi/abs/10.1080/01441647.2010.492455.
Dhakal S (2003). Role of government, private sector and civic society in promoting battery operated electric three‐wheelers in Kathmandu, Nepal. Institute for Global Environmental Strategies (IGES),, Japan.
Dierkers G., E. Silsbe, S. Stott, S. Winkelman, and M. Wubben (2008). CCAP Transportation Emissions Guidebook. Part One: Land Use, Transit & Travel Demand Management. Center for Clean Air Policy, Washington DC, USA.
Dimitriou H.T. (2006). Towards a generic sustainable urban transport strategy for middle‐sized cities in Asia: Lessons from Ningbo, Kanpur and Solo. Habitat International 30, 1082–1099. (DOI: 10.1016/j.habitatint.2006.02.001). Available at: http://www.sciencedirect.com/science/article/pii/S0197397506000166.
Dimitriou H.T., and R.A. Gakenheimer (2011). Urban transport in the developing world : a handbook of policy and practice. Edward Elgar, Cheltenham, UK; Northhampton, MA, (ISBN: 9781847202055 1847202055).
Dinwoodie J. (2006). Rail freight and sustainable urban distribution: Potential and practice. Journal of Transport Geography 14, 309–320. (DOI: 10.1016/j.jtrangeo.2005.06.001). Available at: http://www.sciencedirect.com/science/article/pii/S0966692305000426.
DOE (2008). Progress Report for Advanced Combustion Engine Technologies.Office of Vehicle Technologies. U.S. Department of Energy, Washington, D.C.
DOE (2011a). Progress and Accomplishments in Hydrogen and Fuel Cells, Office of Energy Efficiency and Renewable Energy. US Department of Energy.
DOE (2011b). Pathways to Commercial Success: Technologies and Products Supported by the Fuel Cell Technologies Program. US Department of Energy.
Doucette R.T., and M.D. McCulloch (2011a). Modeling the CO2 emissions from battery electric vehicles given the power generation mixes of different countries. Energy Polciy 39, 803–811. (DOI: 10.1016/j.enpol.2010.10.054).
Doucette R.T., and M.D. McCulloch (2011b). Modeling the prospects of plug‐in hybrid electric vehicles to reduce CO2 emissions. Applied Energy 88, 2315–2323. (DOI: 10.1016/j.apenergy.2011.01.045).
Drobot S.D., J.A. Maslanik, and M.R. Anderson (2009). Interannual variations in the opening date of the Prudhoe Bay shipping season: links to atmospheric and surface conditions. INTERNATIONAL JOURNAL OF CLIMATOLOGY 29, 197–203. (DOI: 10.1002/joc.1725).
First Order Draft (FOD) IPCC WG III AR5
Do Not Cite, Quote or Distribute 74 of 100 Chapter 8 WGIII_AR5_Draft1_Ch08_final2.doc 19 July 2012
Dumortier J., D.J. Hayes, M. Carriquiry, F. Dong, X. Du, A. Elobeid, J.F. Fabiosa, and S. Tokgoz (2011). Sensitivity of Carbon Emission Estimates from Indirect Land‐Use Change. Applied Economic Perspectives and Policy 33, 428–448. (DOI: 10.1093/aepp/ppr015). Available at: http://aepp.oxfordjournals.org/content/33/3/428.abstract.
1 2 3 4
5 6 7
8 9
10 11 12
13 14 15
16 17
18 19
20 21 22 23
24 25
26 27
28 29
30 31 32
33 34 35 36
37 38 39
Duranton G., and M.A. Turner (2011). The Fundamental Law of Road Congestion: Evidence from US Cities. The American Economic Review 101, 2616–2652. (DOI: 10.1257/aer.101.6.2616). Available at: http://www.ingentaconnect.com/content/aea/aer/2011/00000101/00000006/art00012.
E C Environment (2011). Emissions from maritime transport. European Commission Transport and Environment,. Available at: http://ec.europa.eu/environment/air/transport/ships.htm.
Eads G. (2010). 50by50 Prospects and Progress Report for Global Fuel Economy Initiative. Global Fuel Economy Initiative (GFEI). Available at: http://www.globalfueleconomy.org/Documents/Publications/prospects_and_progress_lr.pdf.
Eakin H., and M. Wehbe (2009). Linking local vulnerability to system sustainability in a resilience framework: two cases from Latin America. Climatic Change 93, 355–377. Available at: http://dx.doi.org/10.1007/s10584‐008‐9514‐x.
ECMT (2004). Assessment and Decision Making for Sustainable Transport. Organization of Economic Co‐operation and Development, Paris. Available at: http://www.oecd.org.
Econ (2007). Arctic Shipping 2030: from Russia with Oil, stormy passage or Arctic great game? Commissioned by Norshipping, Oslo.
Edwards J.B., A.C. McKinnon, and S.L. Cullinane (2010). Comparative analysis of the carbon footprints of conventional and online retailing: A “last mile” perspective. International Journal of Physical Distribution & Logistics Management 40, 103–123. (DOI: 10.1108/09600031011018055). Available at: http://www.emeraldinsight.com/10.1108/09600031011018055.
EEA (2006). Technology to Improve the Fuel Economy of Light Trucks to 2015.Report to the Department of Energy and Department of Transportation. Enery and Environmental Analysis Inc.
EEA (2011). Monitoring the CO2 emissions from new passenger cars in the EU: summary of data for 2010,. European Environment Agency, Copenhagen.
Eisinger D.S. (2005). Evaluating inspection and maintenance programs: A policy‐making framework. Journal of the Air & Waste Management Association 55, 147–162.
Eliasson J. (2008). Lessons from the Stockholm congestion charging trial. Transport Policy 15, 395–404. (DOI: 10.1016/j.tranpol.2008.12.004). Available at: http://www.sciencedirect.com/science/article/pii/S0967070X0800053X.
Eom J., L. Schipper, and L. Thompson (2012). We keep on truckin’: Trends in freight energy use and carbon emissions in 11 IEA countries. Energy Policy 45, 327–341. (DOI: 10.1016/j.enpol.2012.02.040). Available at: http://www.sciencedirect.com/science/article/pii/S0301421512001577.
EPA (2006). World’s First Full Hybraulic Hybrid in a Delivery Truck, Fact sheet, EPA420‐F‐054. Environmetal Protection Agency. Available at: http://www.epa.gov/OMS/technology/420f06054.htm.

First Order Draft (FOD) IPCC WG III AR5
Do Not Cite, Quote or Distribute 75 of 100 Chapter 8 WGIII_AR5_Draft1_Ch08_final2.doc 19 July 2012
Eppstein M.J., D.K. Grover, J.S. Marshall, and D.M. Rizzo (2011). An agent‐based model to study market penetration of plug‐in hybrid electric vehicles. Energy Policy 39, 3789–3802. (DOI: 10.1016/j.enpol.2011.04.007).
1 2 3
4 5 6 7
8
9 10 11
12 13 14
15 16
17 18 19
20 21
22 23
24 25
26 27
28 29
30 31
32 33
34 35
36 37
Ericksen P.J., J.S.I. Ingram, and D.M. Liverman (2009). Food security and global environmental change: emerging challenges. Environmental Science & Policy 12, 373–377. (DOI: 10.1016/j.envsci.2009.04.007). Available at: http://www.sciencedirect.com/science/article/pii/S1462901109000653.
Estache A., and M. Fay (2007). Current Debates on Infrastructure Policy. The World Bank.
EUCAR/CONCAWE/JRC (2008). Well‐to‐Wheels Analysis of FutureAutomotive Fuels and Powertrains in the European Context. Institute for Environment and Sustainability of the EU Commission’s Joint Research Centre.
Eurocontrol (2008). The challenges of growth, Air Traffic Statistics and Forecasts, The European Organisation for the Safety of Air Navigation. Eurocontrol. Available at: http://www.eurocontrol.int/statfor.
European Climate Foundation (2011). Roadmap 2050: A Practical Guide to a Prosperous Low Carbon Europe. Available at: http://www.roadmap2050.eu/attachments/files/Volume2_Policy.pdf.
European Environment Agency (2011). Laying the foundations for greener transport : TERM 2011 : transport indicators tracking progress towards environmental targets in Europe. Publications Office of the European Union, Luxembourg, (ISBN: 9789292132309 929213230X).
Ewing R. (2007). Growing Cooler:The Evidence on Urban Development and Climate Change. Urban Land Institute, Chicago, 2007.
Ewing R. (2008). Urban Ecology. Springer US, pp.519–535, (ISBN: 978‐0‐387‐73412‐5). Available at: http://dx.doi.org/10.1007/978‐0‐387‐73412‐5_34.
Ewing R., and R. Cervero (2010). Travel and the Built Environment. Journal of the American Planning Association 76, 265–294. (DOI: 10.1080/01944361003766766).
FAO (2011). Energy‐smart food for people and climate. UN Food and Agricultural Organization, Rome. 54 pp. Available at: http://www.fao.org/docrep/014/i2454e/i2454e00.pdf.
Farrington R., and J. Rugh (2000). Impact of Vehicle Air‐Conditioning on Fuel Economy, Tailpipe Emissionsm and Electric Vehicle Range. National Renewable Energy Laboratory, Golden, Colorado.
Federal Highway Administration (2000). Operations Story. Available at: http://www.ops.fhwa.dot.gov/aboutus/opstory.htm.
Fernald J.G. (1999). Roads to Prosperity? Assessing the Link between Public Capital and Productivity. The American Economic Review 89, 619–38.
Figueroa M. (2010). Linking Mobiity, Democracy and Sustainability. In: A New Agenda for Sustainability. Ashgate, England pp.271–288, .
Fischedick M., R. Schaeffer, A. Adedoyin, M. Akai, T. Bruckner, L. Clarke, V. Krey, S. Savolainen, S. Teske, D. Ürge‐Vorsatz, and R. Wright (2011). Mitigation Potential and Costs. In: IPCC Special Report

First Order Draft (FOD) IPCC WG III AR5
Do Not Cite, Quote or Distribute 76 of 100 Chapter 8 WGIII_AR5_Draft1_Ch08_final2.doc 19 July 2012
on Renewable Energy Sources and Climate Change Mitigation. Cambridge University Press, Cambridge and New York.
1 2
3 4 5 6
7 8 9
10 11 12
13
14 15 16
17 18 19
20 21 22 23
24 25 26 27
28 29 30
31
32
33 34 35 36
37 38
Flachsland C., S. Brunner, O. Edenhofer, and F. Creutzig (2011). Climate policies for road transport revisited (II): Closing the policy gap with cap‐and‐trade. Energy Policy 39, 2100–2110. (DOI: 10.1016/j.enpol.2011.01.053). Available at: http://www.sciencedirect.com/science/article/pii/S0301421511000644.
Franco J., L. Levidow, D. Fig, L. Goldfarb, M. Honicke, and L. Mendonça (2010). Assumptions in the European Union biofuels policy: frictions with experiences in Germany, Brazil and Mozambique. Journal of Peasant Studies 37, 661–698.
Frank L.D., and G. Pivo (1994). Impacts of mixed use and density on utilization of three modes of travel: Single occupant vehi‐ cle, transit, and walking. Transportation Research Record: Journal of the Transportation Research Board 1466, 44–52.
Frankel J.A., and D. Romer (1999). Does trade cause growth? American Economic Review, 379–399.
Fuglestvedt J., T. Berntsen, G. Myhre, K. Rypdal, and R.B. Skeie (2008). Climate forcing from the transport sectors. PROCEEDINGS OF THE NATIONAL ACADEMY OF SCIENCES OF THE UNITED STATES OF AMERICA 105, 454–458. (DOI: 10.1073/pnas.0702958104).
Fujita M., P.R. Krugman, and A. Venables (1999). The spatial economy cities, regions and international trade. MIT Press, Cambridge, Mass., (ISBN: 0585070172 9780585070179 9780262062046 0262062046). Available at: http://site.ebrary.com/id/10225300.
Gallagher K.S., and E. Muehlegger (2011). Giving green to get green? Incentives and consumer adoption of hybrid vehicle technology. Journal of Environmental Economics and Management 61, 1–15. (DOI: 10.1016/j.jeem.2010.05.004). Available at: http://www.sciencedirect.com/science/article/pii/S0095069610000768.
Gärling T., and G. Schuitema (2007). Travel Demand Management Targeting Reduced Private Car Use: Effectiveness, Public Acceptability and Political Feasibility. Journal of Social Issues 63, 139–153. (DOI: 10.1111/j.1540‐4560.2007.00500.x). Available at: http://onlinelibrary.wiley.com.globalproxy.cvt.dk/doi/10.1111/j.1540‐4560.2007.00500.x/abstract.
Gawel E., and G. Ludwig (2011). The iLUC dilemma: How to deal with indirect land use changes when governing energy crops? Land Use Policy 28, 846–856. Available at: http://dx.doi.org/10.1016/j.landusepol.2011.03.003.
GEA (2011). Energy Use in Transportation. Cambridge University Press.
Gehl J. (2010). Cities for people. Island Press, Washington DC, USA.
Geurs K.T., and B. van Wee (2004). Accessibility evaluation of land‐use and transport strategies: review and research directions. Journal of Transport Geography 12, 127–140. (DOI: 10.1016/j.jtrangeo.2003.10.005). Available at: http://www.sciencedirect.com/science/article/pii/S0966692303000607.
Gifford R. (2011). The Dragons of Inaction: Psychological Barriers That Limit Climate Change Mitigation and Adaptation. American Psychologist 66, 290–302.

First Order Draft (FOD) IPCC WG III AR5
Do Not Cite, Quote or Distribute 77 of 100 Chapter 8 WGIII_AR5_Draft1_Ch08_final2.doc 19 July 2012
Girod B., D.P. van Vuuren, and S. Deetman (2012). Global travel within the 2 °C climate target. Energy Policy 45, 152–166. (DOI: 10.1016/j.enpol.2012.02.008). Available at: http://www.sciencedirect.com/science/article/pii/S0301421512001127.
1 2 3
4 5 6 7
8 9
10
11 12 13
14 15
16 17
18 19 20 21
22 23
24
25 26 27
28 29 30
31 32 33 34
35 36 37 38 39
Givoni M. (2007). Environmental Benefits from Mode Substitution: Comparison of the Environmental Impact from Aircraft and High‐Speed Train Operations. International Journal of Sustainable Transportation 1, 209–230. (DOI: 10.1080/15568310601060044). Available at: http://www.tandfonline.com/doi/abs/10.1080/15568310601060044.
Givoni M., and D. Banister (2010). Integrated Transport: From Policy to Practice. Routledge, (ISBN: 13:978‐0‐415‐54893‐9). Available at: http://www.taylorandfrancis.com/books/details/9780415548939/.
Givoni M., and P. Rietveld (2010). The environmental implications of airlines’ choice of aircraft size. Journal of Air Transport Management 16, 159–167. (DOI: 10.1016/j.jairtraman.2009.07.010). Available at: http://www.sciencedirect.com/science/article/pii/S0969699709000519.
GIZ (2011). International fuel prices. Available at: http://www.gtz.de/de/dokumente/giz2011‐international‐fuel‐prices‐2010‐2011‐data‐preview.pdf.
Glaeser E. (2011). The Triumph of the City. Pan Macmillan, London, (ISBN: 0230709397 9780230709393 9780230709386 0230709389).
Gohardani A.S., G. Doulgeris, and R. Singh (2011). Challenges of future aircraft propulsion: A review of distributed propulsion technology and its potential application for the all electric commercial aircraft. Progress in Aerospace Sciences 47, 369–391. (DOI: 10.1016/j.paerosci.2010.09.001). Available at: http://www.sciencedirect.com/science/article/pii/S0376042110000497.
Goodwin P. (2004). The economic costs of road traffic congestion. UCL (University College London), The Rail Freight Group, London, UK.
Goodwin P. (2012). Three Views on Peak Car. World Transport Policy and Practice 17.
Goodwin P., and G. Lyons (2010). Public attitudes to transport: Interpreting the evidenc. Transportation Planning and Technology 33, 3–17. Available at: http://dx.doi.org/10.1080/03081060903429264.
Gotschi T. (2011). Costs and benefits of bicycling investments in Portland, Oregon. Journal of physical activity & health 8 Suppl 1, S49–58. Available at: http://www.ncbi.nlm.nih.gov/pubmed/21350262.
Graham, P., Reedman, L., Rodriguez, L., Raison, J., Braid, A., Haritos, V., Brinsmead, T., Hayward, J., Taylor, J., and O’Connell, D. (2011). Sustainable Aviation Fuels Road Map: Data assumptions and modelling. CSIRO Energy Transformed Flagship, 95 pp. Available at: http://www.csiro.au/Outcomes/Energy/Powering‐Transport/Sustainable‐Aviation‐Fuels.aspx.
Graham‐Rowe E., B. Gardner, C. Abraham, S. Skippon, H. Dittmar, R. Hutchins, and J. Stannard (2012). Mainstream consumers driving plug‐in battery‐electric and plug‐in hybrid electric cars: A qualitative analysis of responses and evaluations. Transportation Research Part A: Policy and Practice 46, 140–153. (DOI: 10.1016/j.tra.2011.09.008). Available at: http://www.sciencedirect.com/science/article/pii/S0965856411001418.

First Order Draft (FOD) IPCC WG III AR5
Do Not Cite, Quote or Distribute 78 of 100 Chapter 8 WGIII_AR5_Draft1_Ch08_final2.doc 19 July 2012
Greene D.L. (2010a). How Consumers Value Fuel Economy: A Literature Review. Available at: http://trid.trb.org.globalproxy.cvt.dk/view.aspx?id=920593.
1 2
3 4 5
6 7 8
9 10
11 12 13 14
15 16 17
18 19
20 21 22
23 24 25 26
27 28 29 30
31 32 33
34 35 36
37 38 39 40
Greene D.L. (2010b). Measuring energy security: Can the United States achieve oil independence? Energy Policy 38, 1614–1621. (DOI: 10.1016/j.enpol.2009.01.041). Available at: http://www.sciencedirect.com/science/article/pii/S0301421509000755.
Greene D.L., J.R. Kahn, and R.C. Gibson (1999). Fuel Economy Rebound Effect for U.S. Household Vehicles. The Energy Journal. Available at: http://ideas.repec.org/a/aen/journl/1999v20‐03‐a01.html.
Greene D.L., and S.E. Plotkin (2011). Reducing greenhouse gas emissions from U.S. transportation,. Pew Center on Global Climate Change.
Grubler A., X. Bai, T. Buettner, S. Dhakal, D. Fisk, T. Ichinose, J. Keristead, G. Sammer, D. Satterthwaite, N. Schulz, N. Shah, J. Steinberger, and H. Weiz (2011). GEA‐Urbanization. In: Global Energy Assessment. Cambridge University Press, Cambridge, United Kingdom and New York, NY, USA.
Guha B., and A.S. Guha (2011). Pirates and traders: Some economics of pirate‐infested seas. Economics Letters 111, 147–150. (DOI: 10.1016/j.econlet.2011.01.030). Available at: http://www.sciencedirect.com/science/article/pii/S0165176511000498.
Gusdorf F., and S. Hallegatte (2007). Compact or spread‐out cities: Urban planning, taxation, and the vulnerability to transportation shocks. Energy Policy 35, 4826–4838.
Hall R. (2006). Understanding and Applying the Concept of Sustainable Development to Transportation Planning and Decision Making in the United States. Massachusetts Institute of Technology, Massachusetts. Available at: http://hdl.handle.net/1721.1/34555.
Hamin E.M., and N. Gurran (2009). Urban form and climate change: Balancing adaptation and mitigation in the U.S. and Australia. Habitat International 33, 238–245. (DOI: 10.1016/j.habitatint.2008.10.005). Available at: http://www.sciencedirect.com/science/article/pii/S0197397508000659.
Handy S., M.G. Boarnet, R. Ewing, and R.E. Killingsworth (2002). How the built environment affects physical activity: Views from urban planning. American Journal of Preventive Medicine 23, 64–73. (DOI: doi: 10.1016/S0749‐3797(02)00475‐0). Available at: http://www.sciencedirect.com/science/article/pii/S0749379702004750.
Handy S., L. Weston, and P.L. Mokhtarian (2005). Driving by choice or necessity? Transportation Research Part A: Policy and Practice 39, 183–203. (DOI: 10.1016/j.tra.2004.09.002). Available at: http://linkinghub.elsevier.com/retrieve/pii/S0965856404000941.
Hanjra M.A., and M.E. Qureshi (2010). Global water crisis and future food security in an era of climate change. Food Policy 35, 365–377. (DOI: 10.1016/j.foodpol.2010.05.006). Available at: http://www.sciencedirect.com/science/article/pii/S030691921000059X.
Hao H., H. Wang, and M. Ouyang (2011). Comparison of policies on vehicle ownership and use between Beijing and Shanghai and their impacts on fuel consumption by passenger vehicles. Energy Policy 39, 1016–1021. (DOI: 10.1016/j.enpol.2010.11.039). Available at: http://www.sciencedirect.com/science/article/pii/S0301421510008633.

First Order Draft (FOD) IPCC WG III AR5
Do Not Cite, Quote or Distribute 79 of 100 Chapter 8 WGIII_AR5_Draft1_Ch08_final2.doc 19 July 2012
Hargroves C., and M. Smith (2008). The Natural Advantage of Nations. Earthscan, London, UK. 1
2 3 4 5
6 7 8 9
10 11
12 13 14
15 16
17 18 19 20
21 22 23
24 25 26 27
28 29
30 31
32 33 34
35 36 37
38 39 40
Haustein S., C.A. Klöckner, and A. Blöbaum (2009). Car use of young adults: The role of travel socialization. Transportation Research Part F: Traffic Psychology and Behaviour 12, 168–178. (DOI: 10.1016/j.trf.2008.10.003). Available at: http://linkinghub.elsevier.com/retrieve/pii/S1369847808000909.
Havlík P., U.A. Schneider, E. Schmid, H. Böttcher, S. Fritz, R. Skalský, K. Aoki, S. De Cara, G. Kindermann, F. Kraxner, S. Leduc, I. McCallum, A. Mosnier, T. Sauer, and M. Obersteiner (2011). Global land‐use implications of first and second generation biofuel targets. Energy Policy 39, 5690–5702. Available at: http://dx.doi.org/10.1016/j.enpol.2010.03.030.
Henstra, D., Ruijgrokand, C., Tavasszy L. (2007). Globalized trade, logistics and intermodality: European perspectives. Globalized Freight Transport, 135–163.
Ho J. (2010). The implications of Arctic sea ice decline on shipping. Marine Policy 34, 713–715. (DOI: 10.1016/j.marpol.2009.10.009). Available at: http://www.sciencedirect.com/science/article/pii/S0308597X09001717.
Hochman G., D. Rajagopal, and D. Zilberman (2010). The effect of biofuels on crude oil markets. AgBioForum 13, 112–118. Available at: http://www.agbioforum.org/v13n2/v13n2a03‐hochman.htm.
Höjer M., K.H. Dreborg, R. Engström, U. Gunnarsson‐Östling, and Å. Svenfelt (2011). Experiences of the development and use of scenarios for evaluating Swedish environmental quality objectives. Futures 43, 498–512. (DOI: 10.1016/j.futures.2011.02.003). Available at: http://www.sciencedirect.com/science/article/pii/S0016328711000139.
Holdway A.R., A.R. Williams, O.R. Inderwildi, and D.A. King (2010). Indirect emissions from electric vehicles: emissions from electricity generation. Energy & Environmental Science 3, 1825–1832. (DOI: 10.1039/C0EE00031K).
Holland S.P. (2012). Emissions taxes versus intensity standards: Second‐best environmental policies with incomplete regulation. Journal of Environmental Economics and Management 63, 375–387. (DOI: 10.1016/j.jeem.2011.12.002). Available at: http://www.sciencedirect.com/science/article/pii/S0095069612000046.
Hook W. (2003). Preserving and expanding the role of non‐motorised transport. GTZ Transport and Mobility Group.
Hook W. (2008). Mitigating the Risk of Climate Change by Reducing Travel by Light Duty Vehicles. OECD/ITF.
Hughes J.E., C.R. Knittel, and D. Sperling (2006). Evidence of a Shift in the Short‐Run Price Elasticity of Gasoline Demand. National Bureau of Economic Research. Available at: http://www.nber.org/papers/w12530.
Hunt A., and P. Watkiss (2011). Climate change impacts and adaptation in cities: a review of the literature. Climatic Change 104, 13–49. Available at: http://opus.bath.ac.uk/22301/2/Hunt_ClimateChange_2011_104_1_13.doc.
Huo H., and M. Wang (2012). Modeling future vehicle sales and stock in China. Energy Policy 43, 17–29. (DOI: 10.1016/j.enpol.2011.09.063). Available at: http://www.sciencedirect.com/science/article/pii/S0301421511007774.

First Order Draft (FOD) IPCC WG III AR5
Do Not Cite, Quote or Distribute 80 of 100 Chapter 8 WGIII_AR5_Draft1_Ch08_final2.doc 19 July 2012
Huo H., M. Wang, L. Johnson, and D. He (2007). Projection of Chinese Motor Vehicle Growth, Oil Demand, and CO2 Emissions Through 2050. Transportation Research Record 2038, 69–77. (DOI: 10.3141/2038‐09). Available at: http://trb.metapress.com/openurl.asp?genre=article&id=doi:10.3141/2038‐09.
1 2 3 4
5 6 7 8
9 10
11 12
13 14 15 16
17 18
19
20 21
22
23 24
25 26
27 28 29
30 31
32 33 34
35
36 37
Huo H., Q. Zhang, K. He, Z. Yao, X. Wang, B. Zheng, D.G. Streets, Q. Wang, and Y. Ding (2011). Modeling vehicle emissions in different types of Chinese cities: Importance of vehicle fleet and local features. Environmental Pollution 159, 2954–2960. (DOI: 10.1016/j.envpol.2011.04.025). Available at: http://www.sciencedirect.com/science/article/pii/S0269749111002338.
Hurlin C. (2006). Network Effects of the Productivity of Infrastructure in Developing Countries. The World Bank, Washington, D.C.
Hybridcars.com Hybrids Top Japan’s Best‐Selling Car List | Hybrid Cars. Available at: http://www.hybridcars.com/news/hybrids‐top‐japan%E2%80%99s‐best‐selling‐car‐list‐42354.html.
Hymel K.M., K.A. Small, and K.V. Dender (2010). Induced demand and rebound effects in road transport. Transportation Research Part B: Methodological 44, 1220–1241. Available at: http://www.scopus.com/inward/record.url?eid=2‐s2.0‐77957222659&partnerID=40&md5=e29523dc6b1df23769315214f348243b.
IATA (2011). Preparing for emission trading in Europe. Available at: http://www.iata.org/whatwedo/environment/pages/emissions‐europe.aspx.
ICAO (2007). Outlook for Air Transport to the year 2025. International Civil Aviation Organization.
ICAO (2010a). ICAO Environmental Report 2010. Montreal. Available at: http://www.icao.int/icao/en/env2010/environmentreport_2010.pdf.
ICAO (2010b). Annual Report of the Council. International Civil Aviation Organization, Quebec.
ICAO (2010c). Consolidated statement of continuing ICAO policies and practices related to environmental protection‐ Climate change. International Civil Aviation Organization.
ICAO‐CAEP (2010). Eighth Meeting of the Committee on Aviation Environmental Protection (CAEP/8). International Civil Aviation Organization, Montreal.
ICCT (2010). An Assessment of Mass Reduction Opportunities for a 2017‐2020 Model Year Vehicle Program, prepared by Lotus Engineering. International Council on Clean Transportation. Available at: http://www.theicct.org/documents/0000/1430/Mass_reduction_final_2010.pdf.
IEA (2008a). Energy Technology Perspectives ‐ Scenarios & Strategies to 2050. International Energy Agency, Paris. 650 pp.
IEA (2008b). From 1st to 2nd Generation Biofuels Technologies. An Overview of Current Industry and RD&D Activities. International Energy Agency, Paris. 124 pp. Available at: http://www.iea.org/papers/2008/2nd_biofuel_gen.pdf.
IEA (2009a). Transport, Energy and CO2. International Energy Agency.
IEA I.E.A. (2009b). Transport, Energy and CO2: Moving toward Sustainability. International Energy Agency, Paris.

First Order Draft (FOD) IPCC WG III AR5
Do Not Cite, Quote or Distribute 81 of 100 Chapter 8 WGIII_AR5_Draft1_Ch08_final2.doc 19 July 2012
IEA (2010a). World Energy Outlook 2010. International Energy Agency, OECD/IEA. Available at: www.iea.org.
1 2
3 4 5
6 7
8 9
10 11
12 13
14
15 16 17
18 19
20 21 22
23 24 25
26 27 28 29 30
31 32
33 34
35 36
37 38
IEA (2010b). Sustainable Production of Second‐Generation Biofuels: Potential and Perspectives in Major Economies and Developing Countries. International Energy Agency, Paris. Available at: http://www.mozilla.com/en‐US/firefox/3.6.13/whatsnew/.
IEA (2010c). The Contribution of Natural Gas Vehicles to Sustainable Transport. International Energy Agency, Paris. Available at: http://www.iea.org/publications/free_new_Desc.asp?PUBS_ID=2304.
IEA (2010d). Energy Technology Perspectives ‐ Scenarios & Strategies to 2050. International Energy Agency, Paris. 710 pp.
IEA (2011a). World Energy Outlook 2011. International Energy Agency, OECD/IEA, Paris, 659 pp., (ISBN: 978 92 64 12413 4).
IEA (2011b). Renewable Energy: Policy Considerations for Deploying Renewables. International Energy Agency, Paris. 76 pp. Available at: http://www.iea.org/papers/2011/Renew_Policies.pdf.
IEA (2012). Energy Technology Perspectives 2012. International Energy Agency, Paris. 690 pp.
IISD (2011). IMO environment committee adopts mandatory GHG emission reduction measures. International Institute for Sustainable Development,. Available at: http://climate‐l.iisd.org/news/imo‐environment‐committee‐adopts‐mandatory‐ghg‐reduction‐measures/.
IMO (2009). Second IMO GHG Study 2009. International Maritime Organization, 4 Albert Embankment, London SE1 7SR.
IMO (2011). Mandatory energy efficiency measures for international shipping adopted at IMO Environmental meeting. International Maritime Organization. Available at: http://www.imo.org/MediaCentre/PressBriefings/Pages/42‐mepc‐ghg.aspx.
IPCC (2007). Climate Change 2007‐ Mitigation for Climate Change, 4th Assessment Report. Intergovernmental Panel on Climate Change, Working Group III. Cambridge University Press. Available at: http://www.ipcc.ch/publications_and_data/ar4/wg3/en/contents.html.
IPCC (2012). Intergovernmental Panel on Climate Change Special Report on Managing the Risks of Extreme Events and Disasters to Advance Climate Change Adaptation [Field, C. B., Barros, V., Stocker, T.F., Qin, D., Dokken, D., Ebi, K.L., Mastrandrea, M. D., Mach, K. J., Plattner, G.‐K., Allen, S. K., Tignor, M. and P. M. Midgley (eds.)]. In: Summary for Policymakers. Cambridge University Press, Cambridge, United Kingdom and New York, NY, USA.
ITF (2005). OECD in figures ‐ 2005 edition. Statlink; International Traffic Safety Data and Analysis Group, International Transport Forum, Paris. Available at: http://dx.doi.org/10.1787/353365538624.
ITF (2009). Reducing Transport GHG Emissions: Opportunities and Costs. International Transport Forum. Available at: http://www.internationaltransportforum.org/Pub/pdf/09GHGsum.pdf.
ITF (2011). Trends in the transport sector. Annual Transport Statistics, International Transport Forum, OECD/ITF, Paris. Available at: www.internationaltransportforum.org/statistics/index.html.
ITF/OECD (2010). Reducing transport greenhouse gas emissions: trends & data 2010. OECD, 94 pp. Available at: http://www.internationaltransportforum.org/Pub/pdf/10GHGTrends.pdf.

First Order Draft (FOD) IPCC WG III AR5
Do Not Cite, Quote or Distribute 82 of 100 Chapter 8 WGIII_AR5_Draft1_Ch08_final2.doc 19 July 2012
Jackson S.C. (2009). Parallel Pursuit of Near‐Term and Long‐Term Climate Mitigation. Science 326, 526–527. (DOI: 10.1126/science.1177042).
1 2
3 4
5 6 7
8 9
10 11 12
13 14 15 16
17 18 19
20 21 22 23 24
25 26 27
28 29
30 31
32 33 34
35 36 37 38
Jacobs G., A. Aeron‐Thomas, and A. Astrop, (2000). Estimating global road fatalities. Transportation research laboratory, Crowthorne.
Jaramillo P., C. Samaras, H. Wakeley, and K. Meisterling (2009). Greenhouse gas implications of using coal for transportation: lifecycle assessment of coal‐to‐liquids, plug‐in hybrids, and hydrogen pathways. Energy Policy 37, 2689–2695. (DOI: 10.1016/j.enpol.2009.03.001).
JHFC (2011). JHFC Phase 2 Final Report. The Japan Hydrogen & Fuel Cell Demonstration Project. Japan Hydrogen & Fuel Cell Demonstration Project.
JICA (2005). The Master Plan for Lima and Callo Metropolitan Area Urban Transportation in the Republic of Peru; Chapter 6, Traffic Control and Management Conditions. Transport Council of Lima and Callo, ministry of Transportation and Communications of the republic of Peru.
Johnson D.R., H.H. Willis, A.E. Curtright, C. Samaras, and T. Skone (2011). Incorporating uncertainty analysis into life cycle estimates of greenhouse gas emissions from biomass production. Biomass and Bioenergy 35, 2619–2626. Available at: http://www.sciencedirect.com/science/article/B6V22‐52HHP5V‐3/2/98c9ce38577f7645853c29cdaa15bf13.
Jollands N., M. Ruth, C. Bernier, and N. Golubiewski (2007). The climate’s long‐term impact on New Zealand infrastructure (CLINZI) project—A case study of Hamilton City, New Zealand. Journal of Environmental Management 83, 460–477. (DOI: 10.1016/j.jenvman.2006.09.022).
Jonkeren O., B. Jourquin, and P. Rietveld (2011). Modal‐split effects of climate change: The effect of low water levels on the competitive position of inland waterway transport in the river Rhine area. Transportation Research Part A: Policy and Practice 45, 1007–1019. (DOI: 10.1016/j.tra.2009.01.004). Available at: http://www.sciencedirect.com/science/article/pii/S0965856409000135.
Jonkeren O., P. Rietveld, and J. van Ommeren (2007). Climate change and inland waterway transport ‐ Welfare effects of low water levels on the river Rhine. JOURNAL OF TRANSPORT ECONOMICS AND POLICY 41, 387–411.
Joumard R., and H. Gudmundsson (2010). Indicators of environmental sustainability in transport: an interdisciplinary approach to methods. European Commission Bron, France.
JR East (2011). JR East Group Sustainability Report 2011. East Japanese Railway Company, Tokio, Japan.
Kagawa S., K. Nansai, Y. Kondo, K. Hubacek, S. Suh, J. Minx, Y. Kudoh, T. Tasaki, and S. Nakamura (2011). Role of Motor Vehicle Lifetime Extension in Climate Change Policy. Environ. Sci. Technol. 45, 1184–1191. (DOI: doi: 10.1021/es1034552). Available at: http://dx.doi.org/10.1021/es1034552.
Kahn Ribeiro S., F. Creutzig, M.J. Figueroa, C. Dubeux, and J. Hupe (2012). Energy End‐Use: Transportation. In: Global Energy Assessment: Toward a Sustainable Future. L. Gomez‐ 24 Echeverri, T.B. Johansson, N. Nakicenovic, A. Patwardhan, (eds.)IIASA, Laxenburg, Austria and 25 Cambridge University Press, Cambridge, United Kingdom and New York, NY, USA.
First Order Draft (FOD) IPCC WG III AR5
Do Not Cite, Quote or Distribute 83 of 100 Chapter 8 WGIII_AR5_Draft1_Ch08_final2.doc 19 July 2012
Kahn Ribeiro S., M. Kobayashi, M. Beuthe, J. Gasca, D. Greene, D.S. Lee, Y. Muromachi, P.J. Newton, S. Plotkin, D. Sperling, R. Wit, and P.J. Zhou (2007). Transport and its Infrastruture. In: Climate Change Mitigation. Cambridge University Press, Cambridge and New York.
1 2 3
4 5 6 7
8 9
10 11
12 13
14 15
16 17 18
19 20 21 22
23 24
25 26 27 28
29 30 31 32
33 34
35 36 37 38
39 40 41
Kahn Ribeiro S, K.S., G.J. Beuthe M,, L.D.S. Greene D,, N.P.J. Muromachi Y,, S.D. Plotkin S,, and Z.P.J. Wit R, (2007). Transport and its infrastructure. In: Climate Change 2007: Mitigation. Contribution of Working Group III to the Fourth Assessment. Cambridge University Press, Cambridge, United Kingdom and New York, USA.
Kamakaté F., and L. Schipper (2009). Trends in truck freight energy use and carbon emissions in selected OECD countries from 1973 to 2005. Energy Policy 37, 3743–3751. (DOI: 10.1016/j.enpol.2009.07.029). Available at: http://www.sciencedirect.com/science/article/pii/S0301421509005217.
Kane L. (2010). Sustainable transport indicators for Cape Town, South Africa: Advocacy, negotiation and partnership in transport planning practice. Natural Resources Forum 34, 289–302.
Kato,H. H. Y., and Jimbo, K (2005). A Framework for Benchmarking Environmental Sustainability in Asian Mega Cities. Journal of the Eastern Asian Society for Transportation Studies 6, 3214–3249.
Kendall A., and L. Price (2012). Incorporating Time‐Corrected Life Cycle Greenhouse Gas Emissions in Vehicle Regulations. Environmental Science & Technology 46, 2557–2563. (DOI: 10.1021/es203098j). Available at: http://dx.doi.org/10.1021/es203098j.
Kennedy C., J. Steinberger, B. Gasson, Y. Hansen, T. Hillman, M. Havránek, D. Pataki, A. Phdungsilp, A. Ramaswami, and G.V. Mendez (2011). Greenhouse Gas Emissions from Global Cities. Environ. Sci. Technol. 43, 7297–7302. (DOI: doi: 10.1021/es900213p). Available at: http://dx.doi.org/10.1021/es900213p.
Kenworthy J., and F. Laube (2001). The Millennium Cities database for sustainable transport. International Union of Public Transport (UITP), Brussels.
Khan Ribeiro, S. F.C., S.K. M. J. Figueroa, and J.H. C. Dubeux (2012). Energy End‐Use: Transportation. In: The Global Energy Assessment: Toward a more Sustainable Future. IIASA, Laxenburg, Austria and Cambridge University Press, United Kingdom and New York, NY, 25 USA., pp.93, .
Khanna M., C.L. Crago, and M. Black (2011). Can biofuels be a solution to climate change? The implications of land use change‐related emissions for policy. Interface Focus 1, 233–247. (DOI: 10.1098/rsfs.2010.0016). Available at: http://rsfs.royalsocietypublishing.org/content/1/2/233.abstract.
Kobayashi S., S. Plotkin, and S. Kahn Ribeiro (2009). Energy efficiency technologies for road vehicles. Energy Efficiency 2, 125–137.
Koetse M.J., and P. Rietveld (2009). The impact of climate change and weather on transport: An overview of empirical findings. Transportation Research Part D: Transport and Environment 14, 205–221. (DOI: 10.1016/j.trd.2008.12.004). Available at: http://www.sciencedirect.com/science/article/pii/S136192090800165X.
Koffi B., S. Szopa, A. Cozic, D. Hauglustaine, and P. van Velthoven (2010). Present and future impact of aircraft, road traffic and shipping emissions on global tropospheric ozone. ATMOSPHERIC CHEMISTRY AND PHYSICS 10, 11681–11705. (DOI: 10.5194/acp‐10‐11681‐2010).

First Order Draft (FOD) IPCC WG III AR5
Do Not Cite, Quote or Distribute 84 of 100 Chapter 8 WGIII_AR5_Draft1_Ch08_final2.doc 19 July 2012
Koh L.P., and J. Ghazoul (2008). Biofuels, biodiversity, and people: Understanding the conflicts and finding opportunities. Biological Conservation 141, 2450–2460. (DOI: 10.1016/j.biocon.2008.08.005). Available at: http://www.sciencedirect.com/science/article/pii/S0006320708002954.
1 2 3
4 5 6 7 8 9
10
11 12
13 14
15 16 17
18 19 20 21
22 23
24 25 26
27 28 29
30 31 32 33
34 35 36
37 38
39 40
Kojima K., and L. Ryan (2010). Transport Energy Efficiency ‐ Implementation of IEA Recommendations since 2009 and next steps. Paris. Available at: http://www.google.com/url?sa=t&rct=j&q=european%20union%20intends%20to%20set%20similar%20options%20including%20performance%20standards%20and%20fuel%20efficiency%20labelling%20heavy%20vehicles&source=web&cd=1&ved=0CEoQFjAA&url=http%3A%2F%2Fwww.iea.org%2Fpapers%2F2010%2Ftransport_energy_efficiency.pdf&ei=EG3xT5W_C_HY4QSd‐pTiAw&usg=AFQjCNHLimfDMeUlZxO67twctLOCo6rs‐Q&sig2=3gS29hiNyHNkiwmW4iKp1Q.
Kopp A. (2012a). Transport costs, trade and climate change. In: Maritime Transporta nd the Climate Change Challenge. pp.42–58, .
Kopp A. (2012b). Turning the Right Corner: Ensuring Development Through A Low‐Carbon Transport Sector. World Bank, Washington DC.
Kromer M.A., and J.B. Heywood (2007). Electric Powertrains: Opportunities and Challenges in the U.S. Light‐Duty Vehicle Fleet. Massachusetts Institute of Technology. Available at: http://web.mit.edu/sloan‐auto‐lab/research/beforeh2/files/kromer_electric_powertrains.pdf.
De Kruijf H.A., and D.P. Van Vuuren (1998). Following sustainable development in relation to the north‐south dialogue: ecosystem health and sustainability indicators. Ecotoxicology and Environmental Safety 40, 4–14. (DOI: 10.1006/eesa.1998.1635). Available at: http://www.ncbi.nlm.nih.gov/pubmed/9626529.
Kunieda M., and A. Gauthier (2007). Gender and Urban Transport: Smart and Affordable ‐ Module 7a. Sustainable Transport: A Sourcebook for Policy‐makers in Developing Cities. GTZ. 50 pp.
Lange M. (2011). The GHG balance of biofuels taking into account land use change. Energy Policy 39, 2373–2385. (DOI: 10.1016/j.enpol.2011.01.057). Available at: http://www.sciencedirect.com/science/article/pii/S0301421511000681.
Lanzendorf M. (2002). Mobility Styles and Travel Behavior: Application of a Lifestyle Approach to Leisure Travel. Transportation Research Record 1807, 163–173. (DOI: 10.3141/1807‐20). Available at: http://trb.metapress.com/openurl.asp?genre=article&id=doi:10.3141/1807‐20.
Lapola D.M., R. Schaldach, J. Alcamo, A. Bondeau, J. Koch, C. Koelking, and J.A. Priess (2010). Indirect land‐use changes can overcome carbon savings from biofuels in Brazil. Proceedings of the National Academy of Sciences 107, 3388–3393. (DOI: 10.1073/pnas.0907318107). Available at: http://www.pnas.org/content/107/8/3388.abstract.
Larsen P.H., S. Goldsmith, O. Smith, M.L. Wilson, K. Strzepek, P. Chinowsky, and B. Saylor (2008). Estimating future costs for Alaska public infrastructure at risk from climate change. Global Environmental Change 18, 442–457. (DOI: 10.1016/j.gloenvcha.2008.03.005).
Larsen U., T. Johansen, and J. Schramm (2009). Ethanol as a fuel for road transportation. International Energy Agency, Technical University of Denmark,, Denmark. 115 pp.
Leather J., H. Fabian, S. Gota, and A. Mejia (2011). Walkability and Pedestrian Facilities in Asian Cities State and Issues. Asian Development Bank.

First Order Draft (FOD) IPCC WG III AR5
Do Not Cite, Quote or Distribute 85 of 100 Chapter 8 WGIII_AR5_Draft1_Ch08_final2.doc 19 July 2012
Lee J.J. (2010). Can we accelerate the improvement of energy efficiency in aircraft systems? Energy Conversion and Management 51, 189–196. (DOI: 10.1016/j.enconman.2009.09.011). Available at: http://www.sciencedirect.com/science/article/pii/S0196890409003525.
1 2 3
4 5 6 7
8 9
10
11 12
13 14 15
16 17 18 19
20 21 22
23 24
25 26 27
28 29 30
31 32 33 34
35 36 37 38
39 40
Lee D.S., G. Pitari, V. Grewe, K. Gierens, J.E. Penner, A. Petzold, M.J. Prather, U. Schumann, A. Bais, T. Berntsen, D. Iachetti, L.L. Lim, and R. Sausen (2010). Transport impacts on atmosphere and climate: Aviation. ATMOSPHERIC ENVIRONMENT 44, 4678–4734. (DOI: 10.1016/j.atmosenv.2009.06.005).
Levinson D.M. (1999). Space, money, life‐stage, and the allocation of time. Transportation 26, 141–171. Available at: http://www.ingentaconnect.com/content/klu/port/1999/00000026/00000002/00203969.
Li J. (2011). Decoupling urban transport from GHG emissions in Indian Cities – A critical review and perspectives. Energy Policy 39, 3503–3514.
Lindley S.J., J.F. Handley, N. Theuray, E. Peet, and D. Mcevoy (2006). Adaptation Strategies for Climate Change in the Urban Environment: Assessing Climate Change Related Risk in UK Urban Areas. Journal of Risk Research 9, 543–568. (DOI: http://dx.doi.org/10.1080/13669870600798020).
Lindstad H., B.E. Asbjørnslett, and A.H. Strømman (2011). Reductions in greenhouse gas emissions and cost by shipping at lower speeds. Energy Policy 39, 3456–3464. (DOI: 10.1016/j.enpol.2011.03.044). Available at: http://www.sciencedirect.com/science/article/pii/S0301421511002242.
Liska A.J., and R.K. Perrin (2009). Indirect land use emissions in the life cycle of biofuels: regulations vs science. Biofuels, Bioproducts and Biorefining 3, 318–328. Available at: http://dx.doi.org/10.1002/bbb.153.
Litman T. (2006). Parking Management: Strategies, Evaluation and Planning. Victoria Transport Policy Institute.
Litman T. (2007). Developing Indicators for Comprehensive and Sustainable Transport Planning. Transportation Research Record: Journal of the Transportation Research Board 2017, 10–15. (DOI: 10.3141/2017‐02). Available at: http://dx.doi.org/10.3141/2017‐02.
Liu Z.G., D.R. Berg, T.A. Swor, and J.J. Schauer (2008). Comparative analysis on the effects of diesel particulate filter and selective catalytic reduction systems on a wide spectrum of chemical species emissions. Environmental Science & Technology 42, 6080–6085. (DOI: 10.1021/es8004046).
Liu J., J.A. Curry, H. Wang, M. Song, and R.M. Horton (2012). Impact of declining Arctic sea ice on winter snowfall. Proceedings of the National Academy of Sciences of the United States of America 109, 4074–4079. Available at: http://www.scopus.com/inward/record.url?eid=2‐s2.0‐84858201934&partnerID=40&md5=8e288b6bd87bb7e500850ca6efb67f9e.
Liu M., and J. Kronbak (2010). The potential economic viability of using the Northern Sea Route (NSR) as an alternative route between Asia and Europe. Journal of Transport Geography 18, 434–444. (DOI: 10.1016/j.jtrangeo.2009.08.004). Available at: http://www.sciencedirect.com/science/article/pii/S0966692309001252.
de Lucena A.F.P., A.S. Szklo, R. Schaeffer, R.R. de Souza, B.S.M.C. Borba, I.V.L. da Costa, A.O.P. Júnior, and S.H.F. da Cunha (2009). The vulnerability of renewable energy to climate change in

First Order Draft (FOD) IPCC WG III AR5
Do Not Cite, Quote or Distribute 86 of 100 Chapter 8 WGIII_AR5_Draft1_Ch08_final2.doc 19 July 2012
Brazil. Energy Policy 37, 879–889. (DOI: 10.1016/j.enpol.2008.10.029). Available at: http://www.sciencedirect.com/science/article/pii/S0301421508006058.
1 2
3 4 5 6
7 8 9
10 11 12
13 14 15
16 17
18 19 20
21 22 23
24 25
26 27 28
29 30 31
32 33 34 35
36 37
38 39
Lutsey N., and D. Sperling (2009). Greenhouse gas mitigation supply curve for the United States for transport versus other sectors. Transportation Research Part D: Transport and Environment 14, 222–229. (DOI: 10.1016/j.trd.2008.12.002). Available at: http://www.sciencedirect.com/science/article/pii/S1361920908001533.
Maclean H.L., and L.B. Lave (2000). Environmental implications of alternative‐fueled automobiles: Air quality and greenhouse gas tradeoffs. Environmental Science & Technology 34, 225–231. (DOI: 10.1021/es9905290).
Maes J., and T. Vanelslander (2011). The Use of Rail Transport as Part of the Supply Chain in an Urban Logistics Context. In: City Logistics and Urban Freight Transport: Multiple Perspectives. Edward Elgar Publishers, London.
Maibach M., C. Schreyer, D. Sutter, H.P. van Essen, and B.H. Boon (2007). Handbook on Estimation of External Cost in the Transport Sector – Internalisation Measures and Policies for All External Costs of Transport. CE Delft, Delft.
Malça J., and F. Freire (2010). Uncertainty Analysis in Biofuel Systems. Journal of Industrial Ecology 14, 322–334. Available at: http://dx.doi.org/10.1111/j.1530‐9290.2010.00227.x.
Marchetti C. (1994). Anthropological invariants in travel behavior. Technological Forecasting and Social Change 47, 75–88. (DOI: 10.1016/0040‐1625(94)90041‐8). Available at: http://www.sciencedirect.com/science/article/pii/0040162594900418.
Marks P. (2009). “Morphing” winglets to boost aircraft efficiency. The New Scientist 201, 22–23. (DOI: 10.1016/S0262‐4079(09)60208‐6). Available at: http://www.sciencedirect.com/science/article/pii/S0262407909602086.
Marshall J.D. (2011). Energy‐Efficient Urban Form. Environ. Sci. Technol. 42, 3133–3137. (DOI: doi: 10.1021/es087047l). Available at: http://dx.doi.org/10.1021/es087047l.
Mayor K., and R.S.J. Tol (2007). The impact of the UK aviation tax on carbon dioxide emissions and visitor numbers. Transport Policy 14, 507–513. (DOI: 10.1016/j.tranpol.2007.07.002). Available at: http://www.sciencedirect.com/science/article/pii/S0967070X0700056X.
McCollum D.L., G. Gould, and D.L. Greene (2010). Greenhouse Gas Emissions from Aviation and Marine Transportation: Mitigation Potential and Policies. Available at: http://www.escholarship.org/uc/item/5nz642qb.
McCollum D., and C. Yang (2009). Achieving deep reductions in US transport greenhouse gas emissions: Scenario analysis and policy implications. Energy Policy 37, 5580–5596. (DOI: 10.1016/j.enpol.2009.08.038). Available at: http://www.sciencedirect.com/science/article/pii/S0301421509006089.
McIntosh J., and P. Newman (2012). Value Capture: Financing the Next Rail Revolution. In: World Transport Policy and Practice.
McKinnon A. (2010). Green Logistics: the Carbon Agenda. Electronic Scientific Journal of Logistics 6. Available at: http://www.logistics.pl/pliki/McKinnon.pdf.

First Order Draft (FOD) IPCC WG III AR5
Do Not Cite, Quote or Distribute 87 of 100 Chapter 8 WGIII_AR5_Draft1_Ch08_final2.doc 19 July 2012
McKinnon A.C., and A. Kreie (2010). Adaptive logistics: preparing logistical systems for climate change. In: Proceedings of the Annual Logistics Research Network Conference 2010. Chartered Institute of Logistics and Transport / University of Leeds, Leeds.
1 2 3
4 5 6 7 8
9 10 11 12
13 14 15
16 17 18
19 20
21 22 23
24 25 26 27
28
29 30
31 32 33
34 35 36
37 38 39 40
McKone T.E., W.W. Nazaroff, P. Berck, M. Auffhammer, T. Lipman, M.S. Torn, E. Masanet, A. Lobscheid, N. Santero, U. Mishra, A. Barrett, M. Bomberg, K. Fingerman, C. Scown, B. Strogen, and A. Horvath (2011). Grand Challenges for Life‐Cycle Assessment of Biofuels. Environmental Science & Technology 45, 1751–1756. (DOI: 10.1021/es103579c). Available at: http://dx.doi.org/10.1021/es103579c.
Mehrotra S., B. Lefevre, R. Zimmerman, H. Gercek, K. Jacob, and S. Srinivasan (2011). Climate change and urban transportation systems. In: Climate Change and Cities: First Assessment Report of the Urban Climate Change Research Network, C. Rosenzweig, W.D. Solecki, S.A. Hammer, S. Mehrotra (eds).Cambridge, UK pp.145–177, .
Melillo J.M., J.M. Reilly, D.W. Kicklighter, A.C. Gurgel, T.W. Cronin, S. Paltsev, B.S. Felzer, X. Wang, A.P. Sokolov, and C.A. Schlosser (2009). Indirect Emissions from Biofuels: How Important? Science 326, 1397–1399. Available at: http://www.sciencemag.org/cgi/content/abstract/1180251v1.
Meng Q., and S. Wang (2011). Optimal operating strategy for a long‐haul liner service route. European Journal of Operational Research 215, 105–114. (DOI: 10.1016/j.ejor.2011.05.057). Available at: http://www.sciencedirect.com/science/article/pii/S0377221711005054.
Meyer J.R., J.F. Kain, and M. Wohl (1965). The urban transportation problem. Harvard Univ. Press, Cambridge, Mass., (ISBN: 0674931211 9780674931213).
Millard‐Ball A., and L. Schipper (2011). Are We Reaching Peak Travel? Trends in Passenger Transport in Eight Industrialized Countries. TRANSPORT REVIEWS 31, 357–378. (DOI: 10.1080/01441647.2010.518291).
Millard‐Ball A., and L. Schipper (2011). Are We Reaching Peak Travel? Trends in Passenger Transport in Eight Industrialized Countries. Transport Reviews 31, 357–378. (DOI: 10.1080/01441647.2010.518291). Available at: http://www.tandfonline.com/doi/abs/10.1080/01441647.2010.518291.
Miller D. (2001). Car cultures. Available at: http://discovery.ucl.ac.uk/117850/.
Millerd F. (2011). The potential impact of climate change on Great Lakes international shipping. CLIMATIC CHANGE 104, 629–652. (DOI: 10.1007/s10584‐010‐9872‐z).
Miola A. (2008). Backcasting approach for sustainable mobility. Institute for Environment and Sustainability. Available at: http://publications.jrc.ec.europa.eu/repository/handle/111111111/7659.
Miola A., M. Marra, and B. Ciuffo (2011). Designing a climate change for the international maritime transport sector: Market‐based measures and technological options for global and regional policy actions. Energy Policy 39, 5490–5498.
Mokhtarian P.L., and X. Cao (2008). Examining the impacts of residential self‐selection on travel behavior: A focus on methodologies. Transportation Research Part B: Methodological 42, 204–228. (DOI: doi: 10.1016/j.trb.2007.07.006). Available at: http://www.sciencedirect.com/science/article/pii/S0191261507000744.

First Order Draft (FOD) IPCC WG III AR5
Do Not Cite, Quote or Distribute 88 of 100 Chapter 8 WGIII_AR5_Draft1_Ch08_final2.doc 19 July 2012
Mokhtarian P.L., and C. Chen (2004). TTB or not TTB, that is the question: a review and analysis of the empirical literature on travel time (and money) budgets. Transportation Research Part A: Policy and Practice 38, 643–675. (DOI: 10.1016/j.tra.2003.12.004). Available at: http://www.sciencedirect.com/science/article/pii/S0965856404000680.
1 2 3 4
5 6 7 8
9 10 11
12 13
14 15 16
17 18 19
20 21 22 23
24 25
26 27 28
29 30
31 32
33 34 35 36
37 38
Mokhtarian P.L., and I. Salomon (2001). How derived is the demand for travel? Some conceptual and measurement considerations. Transportation Research Part A: Policy and Practice 35, 695–719. (DOI: 10.1016/S0965‐8564(00)00013‐6). Available at: http://www.sciencedirect.com/science/article/pii/S0965856400000136.
Morell P. (2009). The potential for European aviation CO2 emissions reduction through the use of larger jet aircraft. Journal of Air Transport Management 15, 151–157. Available at: http://www.sciencedirect.com.helicon.vuw.ac.nz/science/article/pii/S0969699708001178.
Morton C., G. Schuitema, and J. Anable (2011). Electric vehicles: will consumers get charged up? Open University, Milton Keynes.
Motallebi N., M. Sogutlugil, E. McCauley, and J. Taylor (2008). Climate change impact on California on‐road mobile source emissions. Climatic Change 87, S293–S308. (DOI: 10.1007/s10584‐007‐9354‐0).
Mullins K.A., W.M. Griffin, and H.S. Matthews (2011). Policy Implications of Uncertainty in Modeled Life‐Cycle Greenhouse Gas Emissions of Biofuels. Environmental Science & Technology 45, 132–138. (DOI: 10.1021/es1024993). Available at: http://dx.doi.org/10.1021/es1024993.
Murphy R., J. Woods, M. Black, and M. McManus (2011). Global developments in the competition for land from biofuels. Food Policy 36, Supplement 1, S52–S61. (DOI: 10.1016/j.foodpol.2010.11.014). Available at: http://www.sciencedirect.com/science/article/pii/S0306919210001284.
Naess P. (2006). Urban Structure Matters: Residential Location, Car Dependence and Travel Behaviour. Routledge, Oxfordshire, UK.
National Research Council (2010). Technologies and Approaches to Reducing the Fuel Consumption of Medium‐ and Heavy‐Duty Vehicles. National Academies Press, Washington, D.C. 250 pp. Available at: http://www.nap.edu/catalog.php?record_id=12845.
National Research Council (U.S.). Transportation Research Board (2011). Bicycles 2011. Transportation Research Board, Washington, D.C., (ISBN: 9780309167673 0309167671).
NEDO (2010). R&D roadmap for lithium‐ion batteries. New Energy and Industrial Technology Development Organization.
Network Rail (2009). Comparing environmental impact of conventional and high speed rail. New Lines Rail. Available at: http://www.networkrail.co.uk/documents/About%20us/New%20Lines%20Programme/5878_Comparing%20environmental%20impact%20of%20conventional%20and%20high%20speed%20rail.pdf.
Newman P., T. Beatley, and H. Boyer (2009). Resilient cities: responding to peak oil and climate change. Island Press, Washington, DC.

First Order Draft (FOD) IPCC WG III AR5
Do Not Cite, Quote or Distribute 89 of 100 Chapter 8 WGIII_AR5_Draft1_Ch08_final2.doc 19 July 2012
Newman P., and J. Kenworthy (1996). The land use‐‐transport connection : An overview. Land Use Policy 13, 1–22. (DOI: doi: 10.1016/0264‐8377(95)00027‐5). Available at: http://www.sciencedirect.com/science/article/pii/0264837795000275.
1 2 3
4
5 6
7 8 9
10 11 12
13
14 15 16
17 18 19
20 21 22 23
24 25 26
27 28
29 30
31 32
33 34 35 36
37 38
Newman P., and J. Kenworthy (1999). Sustainability and Cities. Island Press, Washington, D.C.
Newman P., and J. Kenworthy (2006). Urban Design to Reduce Automobile Dependence. Opolis 2, 35–52.
Newman P., and J. Kenworthy (2011a). Evaluating the transport sector’s contribution to greenhouse gas emissions and energy consumption. UNEP Risø Centre on Energy, Climate and Sustainable Development, Denmark, 230 pp., (ISBN: ISBN: 978‐87‐550‐3901‐8).
Newman P., and J. Kenworthy (2011b). Peak car use – understanding the demise of automobile dependence. World Transport Policy and Practice 17, 31–42. Available at: http://www.eco‐logica.co.uk/pdf/wtpp17.2.pdf.
Newman P., and A. Matan (2012). Green Urbanism in Asia. World Scientific, Singapore.
Nielsen J.Ø., and H. Vigh (2012). Adaptive lives. Navigating the global food crisis in a changing climate. Global Environmental Change. (DOI: 10.1016/j.gloenvcha.2012.03.010). Available at: http://www.sciencedirect.com/science/article/pii/S0959378012000349.
Njakou Djomo S., and R. Ceulemans (2012). A comparative analysis of the carbon intensity of biofuels caused by land use changes. GCB Bioenergy 4, 392–407. (DOI: 10.1111/j.1757‐1707.2012.01176.x). Available at: http://dx.doi.org/10.1111/j.1757‐1707.2012.01176.x.
Notteboom T.E., and B. Vernimmen (2009). The effect of high fuel costs on liner service configuration in container shipping. Journal of Transport Geography 17, 325–337. (DOI: 10.1016/j.jtrangeo.2008.05.003). Available at: http://www.sciencedirect.com/science/article/pii/S0966692308000410.
NRC (2009). America’s Energy Future Panel on Energy Efficiency Technologies, RealProspects for Energy Efficiency in the United States, the National Academies Press. US National Research Council, Washington, D.C.
NRC (2010a). Review of the Research Program of the FreedomCAR and Fuel Partnership: Third Report. US National Research Council, Washington, D.C. 228 pp.
NRC (2010b). Technologies and Approaches to Reducing the Fuel Consumption of Medium‐ and Heavy‐Duty Vehicles. US National Research Council, Washington, D.C. 250 pp.
NRC (2011). Assessment of Fuel Economy Technologies for Light‐Duty Vehicles. US National Research Council, Washington, D.C.
O’Brien K., T. Quinlan, and G. Ziervogel (2009). Vulnerability interventions in the context of multiple stressors: lessons from the Southern Africa Vulnerability Initiative (SAVI). Environmental Science & Policy 12, 23–32. (DOI: 10.1016/j.envsci.2008.10.008). Available at: http://www.sciencedirect.com/science/article/pii/S1462901108001226.
OECD O. for E.C. and D. (2000). Environmentally Sustainable Transport: Future, Strategies and Best Practice. Organization of Economic Co‐operation and Development, Paris.
First Order Draft (FOD) IPCC WG III AR5
Do Not Cite, Quote or Distribute 90 of 100 Chapter 8 WGIII_AR5_Draft1_Ch08_final2.doc 19 July 2012
OECD (2006). Decoupling the Environmental Impacts of Transport from Economic Growth. Paris, 113 pp.
1 2
3
4
5 6 7 8 9
10 11 12
13 14 15 16
17 18 19 20
21 22 23 24
25 26 27 28
29 30 31
32 33
34 35
36 37 38 39
OECD (2011). Green growth indicators. OECD Publishing, Paris.
OECD (2012). Compact City Policies: A Comparative Assessment. OECD Publishing, Paris.
Ogden J., and A. Lorraine (Eds.) (2011). Sustainable Transprotation Energy Pathways A research summary for decision makers. Institute of Transportation Studies, University of California, Davis, California. Available at: http://scholar.google.dk.globalproxy.cvt.dk/scholar?q=Sustainable+Transprotation+Energy+Pathways+A+research+summary+for+decision+makers&btnG=&hl=da&as_sdt=0.
Ogilvie D., M. Egan, V. Hamilton, and M. Petticrew (2004). Promoting walking and cycling as an alternative to using cars: systematic review. BMJ 329, 763. Available at: http://www.bmj.com/content/329/7469/763.abstract.
Olaru D., B. Smith, and J.H.E. Taplin (2011). Residential location and transit‐oriented development in a new rail corridor. Transportation Research Part A: Policy and Practice 45, 219–237. (DOI: doi: 10.1016/j.tra.2010.12.007). Available at: http://www.sciencedirect.com/science/article/pii/S0965856410001655.
Park Y., and H.‐K. Ha (2006). Analysis of the impact of high‐speed railroad service on air transport demand. Transportation Research Part E: Logistics and Transportation Review 42, 95–104. (DOI: 10.1016/j.tre.2005.09.003). Available at: http://www.sciencedirect.com/science/article/pii/S1366554505000748.
Parkany, E., Gallagher, R., Viveiros P. (2004). Are attitudes important in travel choice? Transportation Research Record, 127–139. Available at: http://www.scopus.com/inward/record.url?eid=2‐s2.0‐19944381891&partnerID=40&md5=d7f2e80c556b74b7e95e62227c5092cb.
Peck Jr. M.W., C.A. Scheraga*, and R.P. Boisjoly (1998). Assessing the relative efficiency of aircraft maintenance technologies: an application of data envelopment analysis. Transportation Research Part A: Policy and Practice 32, 261–269. (DOI: 10.1016/S0965‐8564(97)00013‐X). Available at: http://www.sciencedirect.com/science/article/pii/S096585649700013X.
Pels E., and E.T. Verhoef (2004). The economics of airport congestion pricing. Journal of Urban Economics 55, 257–277. (DOI: doi: 10.1016/j.jue.2003.10.003). Available at: http://www.sciencedirect.com/science/article/pii/S0094119003001219.
Pendakur V. (2011). Non‐motorized urban transport as neglected modes. In: Urban transport in the developing world, Dimitriou, H. and Gakenheimer, R. (eds). Edward Elgar, Cheltenham, UK.
Penner J.E., M.J. Prather, I.S.A. Isaksen, J.S. Fuglestvedt, Z. Klimont, and D.S. Stevenson (2010). Short‐lived uncertainty? Nature Geoscience 3, 587–588. (DOI: 10.1038/ngeo932).
Pidol L., B. Lecointe, L. Starck, and N. Jeuland (2012). Ethanol–biodiesel–Diesel fuel blends: Performances and emissions in conventional Diesel and advanced Low Temperature Combustions. Fuel 93, 329–338. (DOI: 10.1016/j.fuel.2011.09.008). Available at: http://www.sciencedirect.com/science/article/pii/S0016236111005485.

First Order Draft (FOD) IPCC WG III AR5
Do Not Cite, Quote or Distribute 91 of 100 Chapter 8 WGIII_AR5_Draft1_Ch08_final2.doc 19 July 2012
Pierre C. (2011). Is slow steaming a sustainable means of reducing CO2 emissions from container shipping? Transportation Research Part D: Transport and Environment 16, 260–264. (DOI: 10.1016/j.trd.2010.12.005). Available at: http://www.sciencedirect.com/science/article/pii/S1361920910001690.
1 2 3 4
5
6 7 8 9
10 11 12
13 14 15
16 17 18
19 20 21 22
23 24 25
26 27 28 29 30
31 32 33
34 35 36
37 38 39
Pigou A.C. (1920). Wealth and Welfare. MacMillan, London.
Plevin R.J., M. O’Hare, A.D. Jones, M.S. Torn, and H.K. Gibbs (2010). Greenhouse Gas Emissions from Biofuels: Indirect Land Use Change Are Uncertain but May Be Much Greater than Previously Estimated. Environmental Science & Technology 44, 8015–8021. (DOI: 10.1021/es101946t). Available at: http://dx.doi.org/10.1021/es101946t.
Plotkin S., D. Santini, A. Vyas, J. Anderson, M. Wang, J. He, and D. Bharathan (2001). Hybrid Electric Vehicle Technology Assessment: Methodology, Analytical Issues, and Interim Results. Argonne National Laboratory. Available at: http://www.transportation.anl.gov/pdfs/TA/244.pdf.
Plotkin S.E., M.K. Singh, and Ornl (2009). Multi‐path transportation futures study : vehicle characterization and scenario analyses. Available at: http://www.osti.gov/servlets/purl/968962‐2I2Sit/.
Preston J. (2010). What is so funny about peace, love and transport integration? Research in Transportation Economics 29, 329–338. (DOI: 10.1016/j.retrec.2010.07.042). Available at: http://www.sciencedirect.com/science/article/pii/S0739885910000727.
Preston H., D.S. Lee, and P.D. Hooper (2012). The inclusion of the aviation sector within the European Union’s Emissions Trading Scheme: What are the prospects for a more sustainable aviation industry? Environmental Development 2, 48–56. (DOI: 10.1016/j.envdev.2012.03.008). Available at: http://www.sciencedirect.com/science/article/pii/S2211464512000474.
Pridmore A., and A. Miola (2011). Public Acceptability of Sustainable Transport Measures: A Review of the Literature Discussion Paper No. 2011‐20. OECD. Available at: http://www.internationaltransportforum.org/jtrc/DiscussionPapers/DP201120.pdf.
Prinn R., R. Weiss, P. Fraser, P. Simmonds, D. Cunnold, F. Alyea, S. O’Doherty, P. Salameh, B. Miller, J. Huang, R. Wang, D. Hartley, C. Harth, L. Steele, G. Sturrock, P. Midgley, and A. McCulloch (2000). A history of chemically and radiatively important gases in air deduced from ALE/GAGE/AGAGE. JOURNAL OF GEOPHYSICAL RESEARCH‐ATMOSPHERES 105, 17751–17792. (DOI: 10.1029/2000JD900141).
Proost S. (2011). Theory of external cost. In: A handbook of transport economics. A. De Palma, R. Lindsey, E. Quinet, R. Vickerman, (eds.), Edward Elgar, Cheltenham, Glos, U.K.; Northampton, Mass. pp.319–340, (ISBN: 9781847202031 1847202039).
Prowse T., and K. Brown (2010). Hydro‐ecological effects of changing Arctic river and lake ice covers: a review. Hydrology Research 41, 454–461. Available at: http://www.iwaponline.com/nh/041/nh0410454.htm.
Prud’homme R., and J.P. Bocarejo (2005). The London congestion charge: a tentative economic appraisal. Transport Policy 12, 279–287. (DOI: 10.1016/j.tranpol.2005.03.001). Available at: http://www.sciencedirect.com/science/article/pii/S0967070X05000296.
First Order Draft (FOD) IPCC WG III AR5
Do Not Cite, Quote or Distribute 92 of 100 Chapter 8 WGIII_AR5_Draft1_Ch08_final2.doc 19 July 2012
Pucher J., and R. Buehler (2006). Why Canadians cycle more than Americans: A comparative analysis of bicycling trends and policies. Transport Policy 13, 265–279. (DOI: 10.1016/j.tranpol.2005.11.001). Available at: http://www.sciencedirect.com/science/article/pii/S0967070X05001381.
1 2 3
4 5 6
7 8 9
10
11 12
13 14 15 16
17 18 19
20 21 22
23 24 25 26
27 28 29
30 31 32
33 34 35
36 37 38 39
Pucher J., and R. Buehler (2010). Walking and Cycling for Healthy Cities. Built Environment 36, 391–414. (DOI: 10.2148/benv.36.4.391). Available at: http://www.ingentaconnect.com/content/alex/benv/2010/00000036/00000004/art00002.
Pucher J., R. Buehler, and M. Seinen (2011). Bicycling renaissance in North America? An update and re‐appraisal of cycling trends and policies. Transportation Research Part A: Policy and Practice 45, 451–475. (DOI: 10.1016/j.tra.2011.03.001). Available at: http://www.sciencedirect.com/science/article/pii/S0965856411000474.
Puga D. (2002). European regional policies in light of recent location theories. Journal of Economic Geography 2, 373–406. Available at: http://joeg.oxfordjournals.org/content/2/4/373.abstract.
Pyrialakou V.D., M.G. Karlaftis, and P.G. Michaelides Assessing operational efficiency of airports with high levels of low‐cost carrier traffic. Journal of Air Transport Management. (DOI: 10.1016/j.jairtraman.2012.05.005). Available at: http://www.sciencedirect.com/science/article/pii/S0969699712000907.
Rabl A., and A. de Nazelle (2012). Benefits of shift from car to active transport. Transport Policy 19, 121–131. (DOI: 10.1016/j.tranpol.2011.09.008). Available at: http://www.sciencedirect.com/science/article/pii/S0967070X11001119.
Rajagopal D., G. Hochman, and D. Zilberman (2011). Indirect fuel use change (IFUC) and the lifecycle environmental impact of biofuel policies. Energy Policy 39, 228–233. Available at: http://dx.doi.org/10.1016/j.enpol.2010.09.035.
Rakopoulos C. (1991). INFLUENCE OF AMBIENT‐TEMPERATURE AND HUMIDITY ON THE PERFORMANCE AND EMISSIONS OF NITRIC‐OXIDE AND SMOKE OF HIGH‐SPEED DIESEL‐ENGINES IN THE ATHENS GREECE REGION. Energy Conversion and Management 31, 447–458. (DOI: 10.1016/0196‐8904(91)90026‐F).
Ramanathan V., and G. CaRmiChael (2008). Global and regional climate changes due to black carbon. Nature Geoscience 4, 221–227. Available at: http://www.nature.com/ngeo/journal/v1/n4/abs/ngeo156.html.
Ramani T., J. Zietsman, H. Gudmundsson, R. Hall, and G. Marsden (2011). A Generally Applicable Sustainability Assessment Framework for Transportation Agencies. Transportation Research Record: Journal of the Transportation Research Board forthcoming.
Repo A., M. Tuomi, and J. Liski (2011). Indirect carbon dioxide emissions from producing bioenergy from forest harvest residues. GCB Bioenergy 3, 107–115. (DOI: 10.1111/j.1757‐1707.2010.01065.x). Available at: http://dx.doi.org/10.1111/j.1757‐1707.2010.01065.x.
Rich J., O. Kveiborg, and C.O. Hansen (2011). On structural inelasticity of modal substitution in freight transport. Journal of Transport Geography 19, 134–146. (DOI: 10.1016/j.jtrangeo.2009.09.012). Available at: http://www.sciencedirect.com/science/article/pii/S0966692309001513.

First Order Draft (FOD) IPCC WG III AR5
Do Not Cite, Quote or Distribute 93 of 100 Chapter 8 WGIII_AR5_Draft1_Ch08_final2.doc 19 July 2012
Rickwood P., G. Glazebrook, and G. Searle (2011). Urban Structure and Energy—A Review. Urban Policy and Research 26, 57–81. (DOI: doi: 10.1080/08111140701629886). Available at: http://dx.doi.org/10.1080/08111140701629886.
1 2 3
4 5 6 7
8 9
10 11
12 13
14 15 16
17
18 19 20
21 22
23 24
25 26
27 28 29 30
31 32 33
34 35
36 37 38
Rolon A. (2008). Evaluation of Value Capture Mechanisms from Linkage Capture to Special Assessment Districts. Transportation Research Record: Journal of the Transportation Research Board 2079, 127–135. (DOI: 10.3141/2079‐16). Available at: http://trb.metapress.com/openurl.asp?genre=article&id=doi:10.3141/2079‐16.
Romero‐Lankao P., and D. Dodman (2011). Cities in transition: transforming urban centers from hotbeds of GHG emissions and vulnerability to seedbeds of sustainability and resilience: Introduction and Editorial overview. Current Opinion in Environmental Sustainability 3, 113–120. (DOI: 10.1016/j.cosust.2011.02.002).
Romp W., and J. de Haan (2007). Public Capital and Economic Growth: A Critical Survey. Perspektiven der Wirtschaftspolitik 8, 6–52.
Roustan Y., M. Pausader, and C. Seigneur (2011). Estimating the effect of on‐road vehicle emission controls on future air quality in Paris, France. Atmospheric Environment 45, 6828–6836. (DOI: 10.1016/j.atmosenv.2010.10.010).
Rubin J., and B. Tal (2008). Will Soaring Transport Costs Reverse. Globalization? StrategEcon.
de Rus G., and G. Nombela (2007). Is Investment in High Speed Rail Socially Profitable? Journal of Transport Economics and Policy 41, 3–23. Available at: http://EconPapers.repec.org/RePEc:tpe:jtecpo:v:41:y:2007:i:1:p:3‐23.
Russo F., and A. Comi (2010). A classification of city logistics measures and connected impacts. Procedia ‐ Social and Behavioral Sciences 2, 6355–6365. (DOI: 10.1016/j.sbspro.2010.04.044).
SAE International (2011). Automotive Engineering International Online. Available at: http://www.sae.org/mags/aei/.
SAE International Super‐efficient, unconventional ICEs take aim at Otto and Diesel. Available at: http://www.sae.org/mags/sve/10958/.
Sælensminde K. (2004). Cost–benefit analyses of walking and cycling track networks taking into account insecurity, health effects and external costs of motorized traffic. Transportation Research Part A: Policy and Practice 38, 593–606. (DOI: 10.1016/j.tra.2004.04.003). Available at: http://www.sciencedirect.com/science/article/pii/S0965856404000539.
Sagevik (2006). Transport and climate change. International Union of Railways (UIC). Available at: http://www.rtcc.org/2007/html/soc_transport_uic.htmlhttp://www.rtcc.org/2007/html/soc_transport_uic.html.
Salter R., and P. Newman (2011). Technologies for Climate Change Mitigation – Transport. UNEP Riso Centre for Energy, Climate and Sustainable Development., Denmark.
Santos G., H. Behrendt, and A. Teytelboym (2010). Part II: Policy instruments for sustainable road transport. Research in Transportation Economics 28, 46–91. (DOI: 10.1016/j.retrec.2010.03.002). Available at: http://www.sciencedirect.com/science/article/pii/S0739885910000223.

First Order Draft (FOD) IPCC WG III AR5
Do Not Cite, Quote or Distribute 94 of 100 Chapter 8 WGIII_AR5_Draft1_Ch08_final2.doc 19 July 2012
Schäfer A. (2000). Regularities in Travel Demand: An International Perspective. Journal of Transportation and Statistics 3, 1–31.
1 2
3 4
5 6
7 8 9
10 11 12
13 14
15 16 17 18
19 20 21
22 23 24 25
26
27 28 29
30 31
32 33 34
35 36 37
38 39
Schäfer A. (2009). Transportation in a climate‐constrained world. MIT Press, Cambridge, Mass., (ISBN: 9780262012676 0262012677 9780262512343 0262512343).
Schäfer A., J.B. Heywood, H.D. Jacoby, and I. Waitz (2009). Transportation in a Climate‐Constrained World. MIT Press, (ISBN: 978‐0‐262‐51234‐3).
Schipper L. (2011). Automobile use, fuel economy and CO(2) emissions in industrialized countries: Encouraging trends through 2008? TRANSPORT POLICY 18, 358–372. (DOI: 10.1016/j.tranpol.2010.10.011).
Schipper L., E. Deakin, and C. McAndrews (2010). Carbon Dioxide Emissions from Road Transport in Latin America. In: Climate and Transportation Solutions. Sperling, D. and Cannon, J. (eds) Institute of Transportation Studies, UC Davis, (ISBN: 9781452864952).
Schlomo A., S. Sheppard, and D. Civco (2005). The dynamics of global urban expansion. World Bank, Washington DC, USA.
Schoots K., G.J. Kramer, and B.C.C. van der Zwaan (2010). Technology learning for fuel cells: An assessment of past and potential cost reductions. Energy Policy 38, 2887–2897. (DOI: 10.1016/j.enpol.2010.01.022). Available at: http://www.sciencedirect.com/science/article/pii/S0301421510000285.
Schøyen H., and S. Bråthen (2011). The Northern Sea Route versus the Suez Canal: cases from bulk shipping. Journal of Transport Geography 19, 977–983. (DOI: 10.1016/j.jtrangeo.2011.03.003). Available at: http://www.sciencedirect.com/science/article/pii/S096669231100024X.
Schuckmann S.W., T. Gnatzy, I.‐L. Darkow, and H.A. von der Gracht (2012). Analysis of factors influencing the development of transport infrastructure until the year 2030 — A Delphi based scenario study. Technological Forecasting and Social Change. (DOI: 10.1016/j.techfore.2012.05.008). Available at: http://www.sciencedirect.com/science/article/pii/S0040162512001382.
Servant L. (1996). L’automobile dans la ville. Cahiers du IAURIF.
Shaheen S., S. Guzman, and H. Zhang (2010). Bikesharing in Europe, the Americas, and Asia ‐ Past, Present, and Future. Transportation Research Record: Journal of the Transportation Research Board 2143, 159–167.
Shalizi Z., and F. Lecocq (2009). Climate Change and the Economics of Targeted Mitigation in Sectors with Long‐Lived Capital Stock. SSRN eLibrary. Available at: http://ssrn.com/paper=1478816.
Sheller M. (2004). Automotive Emotions Feeling the Car. Theory, Culture & Society 21, 221–242. (DOI: 10.1177/0263276404046068). Available at: http://tcs.sagepub.com.globalproxy.cvt.dk/content/21/4‐5/221.
Short J., and A. Kopp (2005). Transport infrastructure: Investment and planning. Policy and research aspects. Transport Policy 12, 360–367. (DOI: 10.1016/j.tranpol.2005.04.003). Available at: http://www.sciencedirect.com/science/article/pii/S0967070X05000508.
Siemiatycki M. (2006). Message in a Metro: Building Urban Rail Infrastructure and Image in Delhi, India. International Journal of Urban and Regional Research 30, 277–292. (DOI: 10.1111/j.1468‐

First Order Draft (FOD) IPCC WG III AR5
Do Not Cite, Quote or Distribute 95 of 100 Chapter 8 WGIII_AR5_Draft1_Ch08_final2.doc 19 July 2012
2427.2006.00664.x). Available at: http://onlinelibrary.wiley.com.globalproxy.cvt.dk/doi/10.1111/j.1468‐2427.2006.00664.x/abstract.
1 2
3 4 5
6 7 8
9 10 11 12 13 14
15 16 17
18 19
20 21
22 23
24 25 26
27 28
29 30 31
32 33
34 35 36
37 38
Simaiakis I., and H. Balakrishnan (2010). Impact of Congestion on Taxi Times, Fuel Burn, and Emissions at Major Airports. Transportation Research Record: Journal of the Transportation Research Board 2184, 22–30. (DOI: 10.3141/2184‐03). Available at: http://dx.doi.org/10.3141/2184‐03.
Simaiakis I., H. Khalidkar, H. Balakrishnan, T. Reynolds, R. Hansman, B. Reilly, and S. Urlass (2011). Demonstration of reduced airport congestion through pushback rate control. In Proceedings: Eighth USA/Europe Air Traffic Management Research and Development Seminar (ATM2011).2011, .
Sims R., P. Mercado, W. Krewitt, G. Bhuyan, D. Flynn, H. Holttinen, G. Jannuzzi, S. Khennas, Y. Liu, M. O’Malley, L.J. Nilsson, J. Ogden, K. Ogimoto, H. Outhred, Ø. Ullberg, and F. van Hulle (2011). Integration of Renewable Energy into Present and Future Energy Systems. In: IPCC Special Report on Renewable Energy Sources and Climate Change Mitigation. O. Edenhofer, R. Pichs‐Madruga, Y. Sokona, K. Seyboth, P. Mathoss, S. Kadner, T. Zwickel, P. Eickemeier, G. Hansen, S. Schlömer, C. v. Stechow, (eds.), IPCC, Cambridge, United Kingdom and New York, NY, USA.
Small K.A. (2012). Energy policies for passenger motor vehicles. Transportation Research Part A: Policy and Practice 46, 874–889. (DOI: 10.1016/j.tra.2012.02.017). Available at: http://linkinghub.elsevier.com/retrieve/pii/S0965856412000353.
Small K., and K. van Dender (2007). Fuel Efficiency and Motor Vehicle Travel: The Declining Rebound Effect. Energy Journal 28, 25–51.
Small K., and Van Dender (2007). Fuel Efficiency and motor vehicle travel: the declining rebound effect. Energy Journal 28, 25–51.
Small K.A., and E.T. Verhoef (2007). The economics of urban transportation. Routledge, New York, (ISBN: 9780415285155 0415285151 9780415285148 0415285143 9780203642306 0203642309).
Sperling D., and S. Yeh (2010). Toward a global low carbon fuel standard. Transport Policy 17, 47–49. (DOI: 10.1016/j.tranpol.2009.08.009). Available at: http://www.sciencedirect.com/science/article/pii/S0967070X09000997.
Sperling, D., and Nichols, M. (2012). California’s Pioneering Transportation Strategy. Issues in Science and Technology. Available at: http://pubs.its.ucdavis.edu/publication_detail.php?id=1539.
Steg L. (2005). Car use: lust and must. Instrumental, symbolic and affective motives for car use. Transportation Research Part A: Policy and Practice 39, 147–162. (DOI: 10.1016/j.tra.2004.07.001). Available at: http://www.sciencedirect.com/science/article/pii/S0965856404001016.
Steg L., and R. Gifford (2005). Sustainable transportation and quality of life. Journal of Transport Geography 13, 59–69.
Stephen P. Holland, Jonathan E. Hughes, and Christopher R. Knittel (2009). Greenhouse Gas Reductions under Low Carbon Fuel Standards? American Economic Journal: Economic Policy 1, 106–46.
Stephenson S.R., L.C. Smith, and J.A. Agnew (2011). Divergent long‐term trajectories of human access to the Arctic. NATURE CLIMATE CHANGE 1, 156–160. (DOI: 10.1038/NCLIMATE1120).

First Order Draft (FOD) IPCC WG III AR5
Do Not Cite, Quote or Distribute 96 of 100 Chapter 8 WGIII_AR5_Draft1_Ch08_final2.doc 19 July 2012
Stepp M.D., J.J. Winebrake, J.S. Hawker, and S.J. Skerlos (2009). Greenhouse gas mitigation policies and the transportation sector: The role of feedback effects on policy effectiveness. Energy Policy 37, 2774–2787. (DOI: 10.1016/j.enpol.2009.03.013). Available at: http://www.sciencedirect.com/science/article/pii/S0301421509001621.
1 2 3 4
5 6 7
8 9
10 11
12 13 14 15
16 17 18
19 20 21 22
23 24
25 26 27 28
29
30
31 32 33
34 35
36 37 38
39 40
Straub S. (2011). Infrastructure and Development: A Critical Appraisal of the Macro‐level Literature. Journal of Development Studies 47, 683–708. (DOI: doi: 10.1080/00220388.2010.509785). Available at: http://dx.doi.org/10.1080/00220388.2010.509785.
STUMP F., S. TEJADA, W. RAY, D. DROPKIN, F. BLACK, W. CREWS, R. SNOW, P. SIUDAK, C. DAVIS, L. BAKER, and N. PERRY (1989). THE INFLUENCE OF AMBIENT‐TEMPERATURE ON TAILPIPE EMISSIONS FROM 1984‐1987 MODEL YEAR LIGHT‐DUTY GASOLINE MOTOR VEHICLES. Atmospheric Environment 23, 307–320. (DOI: 10.1016/0004‐6981(89)90579‐9).
Szklo A., and R. Schaeffer (2006). Alternative energy sources or integrated alternative energy systems? Oil as a modern lance of Peleus for the energy transition. Energy 31, 2513–2522. (DOI: 10.1016/j.energy.2005.11.001). Available at: http://www.sciencedirect.com/science/article/pii/S0360544205002409.
Taheripour F., W.E. Tyner, and M. Wang (2011). Global Land Use Changes due to the U.S. Cellulosic Biofuel Program Simulated with the GTAP Model. Purdue University and Argonne National Laboratory.
Tavasszy L.A., and J. van Meijeren (2011). Modal Shift Target for Freight Transport Above 300km: An Assessment. ACEA. Available at: http://www.acea.be/images/uploads/files/SAG_17_Modal_Shift_Target_for_Freight_Transport_Above_300km.pdf.
Taylor M.A.P., and M. Philp (2010). Adapting to climate change ‐ implications for transport infrastructure, transport systems and travel behaviour. ROAD & TRANSPORT RESEARCH 19, 66–79.
Teixeira E.I., G. Fischer, H. van Velthuizen, C. Walter, and F. Ewert (2012). Global hot‐spots of heat stress on agricultural crops due to climate change. Agricultural and Forest Meteorology. (DOI: 10.1016/j.agrformet.2011.09.002). Available at: http://www.sciencedirect.com/science/article/pii/S0168192311002784.
TFL (2007). Annual Report 2007. Transport for London. Available at: http://www.tfl.gov.uk/tfl.
TFL (2010). Analysis of cycling potential ‐ travel for London. Transport for London. 53 pp.
Timilsina G.R., and A. Shrestha (2011). How much hope should we have for biofuels? Energy 36, 2055–2069. (DOI: 10.1016/j.energy.2010.08.023). Available at: http://www.sciencedirect.com/science/article/pii/S0360544210004597.
Tiwari G. (2002). Urban Transport Priorities:: Meeting the Challenge of Socio‐economic Diversity in Cities, a Case Study of Delhi, India. Cities 19, 95–103.
Tourlonias P., and G. Koltsakis (2011). Model‐based comparative study of Euro 6 diesel aftertreatment concepts, focusing on fuel consumption. INTERNATIONAL JOURNAL OF ENGINE RESEARCH 12, 238–251. (DOI: 10.1177/1468087411405104).
Trubka R., P. Newman, and D. Bilsborough (2010). The Costs of Urban Sprawl – Predicting Transport Greenhouse Gases from Urban Form Parameters. Environment Design Guide GEN 84, 1–16.

First Order Draft (FOD) IPCC WG III AR5
Do Not Cite, Quote or Distribute 97 of 100 Chapter 8 WGIII_AR5_Draft1_Ch08_final2.doc 19 July 2012
Tschakert P. (2007). Views from the vulnerable: Understanding climatic and other stressors in the Sahel. Global Environmental Change 17, 381–396. (DOI: 10.1016/j.gloenvcha.2006.11.008). Available at: http://www.sciencedirect.com/science/article/pii/S0959378006000938.
1 2 3
4 5
6 7
8 9
10
11 12 13
14 15
16 17 18
19
20 21 22 23
24 25
26 27 28 29
30 31 32 33 34
35 36 37
38 39 40
UIC (2011). World rail statistics. International Union of Railways, Paris. Available at: http://www.uic.org/com/IMG/pdf/cp18_uic_stats_2010_en‐2.pdf.
UNCTAD (2010). Review of Maritime Transport. United Nations Conference on Trade and Development, New York. 192 pp. Available at: http://www.unctad.org/en/docs/rmt2010_en.pdf.
Unger N., T.C. Bond, J.S. Wang, D.M. Koch, S. Menon, D.T. Shindell, and S. Bauer (2010). Attribution of climate forcing to economic sectors. PROCEEDINGS OF THE NATIONAL ACADEMY OF SCIENCES OF THE UNITED STATES OF AMERICA 107, 3382–3387. (DOI: 10.1073/pnas.0906548107).
Unger N., D.T. Shindell, and J.S. Wang (2009). Climate forcing by the on‐road transportation and power generation sectors. ATMOSPHERIC ENVIRONMENT 43, 3077–3085. (DOI: 10.1016/j.atmosenv.2009.03.021).
United Nations Conference on Trade and Development (2010). Review of Maritime Transport. United Nations Conference on Trade and Development.
Unruh G.C. (2000). Understanding carbon lock‐in. Energy Policy 28, 817–830. (DOI: 10.1016/S0301‐4215(00)00070‐7). Available at: http://www.sciencedirect.com/science/article/pii/S0301421500000707.
Urry J. (2007). Mobilities. John Wiley & Sons, (ISBN: 978‐0745634197).
US EPA (2012). Black Carbon Report to Congress | EPA Advisory Council on Clean Air Compliance Analysis (COUNCIL) | US EPA. Available at: http://yosemite.epa.gov/sab/sabproduct.nsf/fedrgstr_activites/BC%20Report%20to%20Congress?OpenDocument.
Vasconcellos E. (2001). Urban transport, environment and equity: The case for developing countries. Earthscan, London.
Verma V., P. Pakbin, K.L. Cheung, A.K. Cho, J.J. Schauer, M.M. Shafer, M.T. Kleinman, and C. Sioutas (2011). Physicochemical and oxidative characteristics of semi‐volatile components of quasi‐ultrafine particles in an urban atmosphere. ATMOSPHERIC ENVIRONMENT 45, 1025–1033. (DOI: 10.1016/j.atmosenv.2010.10.044).
Vermeulen S.J., P.K. Aggarwal, A. Ainslie, C. Angelone, B.M. Campbell, A.J. Challinor, J.W. Hansen, J.S.I. Ingram, A. Jarvis, P. Kristjanson, C. Lau, G.C. Nelson, P.K. Thornton, and E. Wollenberg (2012). Options for support to agriculture and food security under climate change. Environmental Science & Policy 15, 136–144. (DOI: 10.1016/j.envsci.2011.09.003). Available at: http://www.sciencedirect.com/science/article/pii/S1462901111001456.
Verny J., and C. Grigentin (2009). Container shipping on the Northern Sea Route. International Journal of Production Economics 122, 107–117. (DOI: 10.1016/j.ijpe.2009.03.018). Available at: http://www.sciencedirect.com/science/article/pii/S0925527309001509.
van der Voet E., R.J. Lifset, and L. Luo (2010). Life‐cycle assessment of biofuels, convergence and divergence. Biofuels 1, 435–449. Available at: http://www.ingentaconnect.com/content/fs/bfs/2010/00000001/00000003/art00009.

First Order Draft (FOD) IPCC WG III AR5
Do Not Cite, Quote or Distribute 98 of 100 Chapter 8 WGIII_AR5_Draft1_Ch08_final2.doc 19 July 2012
Wang R. (2011). Autos, transit and bicycles: Comparing the costs in large Chinese cities. Transport Policy 18, 139–146. (DOI: 10.1016/j.tranpol.2010.07.003). Available at: http://www.sciencedirect.com/science/article/pii/S0967070X10000910.
1 2 3
4
5 6 7 8
9 10 11
12 13 14
15 16 17
18 19 20 21
22 23 24
25 26 27
28 29 30 31
32 33 34
35 36 37
38 39
40
Wang M. (2012). GREET1_2012 model. Argonne National Laboratory.
Wang M.Q., J. Han, Z. Haq, W.E. Tyner, M. Wu, and A. Elgowainy (2011). Energy and greenhouse gas emission effects of corn and cellulosic ethanol with technology improvements and land use changes. Biomass and Bioenergy 35, 1885–1896. Available at: http://dx.doi.org/10.1016/j.biombioe.2011.01.028.
Wang M., M. Wang, and S. Wang (2012). Optimal investment and uncertainty on China’s carbon emission abatement. Energy Policy 41, 871–877. (DOI: 10.1016/j.enpol.2011.11.077). Available at: http://www.sciencedirect.com/science/article/pii/S030142151100975X.
Wassmann P. (2011). Arctic marine ecosystems in an era of rapid climate change. Progress In Oceanography 90, 1–17. (DOI: 10.1016/j.pocean.2011.02.002). Available at: http://www.sciencedirect.com/science/article/pii/S0079661111000176.
WBCSD (2004). Mobility 2030: meeting the challenges to sustainability. World Business Council for Sustainable Development, London. 180 pp. Available at: http://www.wbcsd.org/web/publications/mobility/mobility‐full.pdf.
van Wee B., P. Rietveld, and H. Meurs (2006). Is average daily travel time expenditure constant? In search of explanations for an increase in average travel time. Journal of Transport Geography 14, 109–122. (DOI: 10.1016/j.jtrangeo.2005.06.003). Available at: http://www.sciencedirect.com/science/article/pii/S0966692305000402.
Wei W., S. Wang, J. Hao, and S. Cheng (2011). Projection of anthropogenic volatile organic compounds (VOCs) emissions in China for the period 2010‐2020. Atmospheric Environment 45, 6863–6871. (DOI: 10.1016/j.atmosenv.2011.01.013).
Weisz H., and J. Steinberger (2010). Reducing energy and material flows in cities. Current Opinion in Environmental Sustainability 2, 185–192. (DOI: doi: 10.1016/j.cosust.2010.05.010). Available at: http://www.sciencedirect.com/science/article/pii/S187734351000045X.
Weltevreden J.W.J. (2007). Substitution or complementarity? How the Internet changes city centre shopping. Journal of Retailing and Consumer Services 14, 192–207. Available at: http://www.scopus.com/inward/record.url?eid=2‐s2.0‐33846354929&partnerID=40&md5=c37a228bb6aac63469209e5e92ae624a.
Wenzel T.P., and M. Ross (2005). The effects of vehicle model and driver behavior on risk. Accident Analysis & Prevention 37, 479–494. (DOI: 10.1016/j.aap.2004.08.002). Available at: http://www.sciencedirect.com/science/article/pii/S0001457505000126.
WHO (2008). Economic valuation of transport related health effects Review of methods and development of practical approaches with a special focus on children. World Health Organization Regional Office for Europe. Available at: http://www.euro.who.int/Document/E92127.pdf.
WHO (2009). Night Noise Guideline for Europe. World Health Organization Regional Office for Europe. Available at: http://www.euro.who.int/document/e92845.pdf.
WHO (2011). Global Status Report on Road Safety. World Health Organization.

First Order Draft (FOD) IPCC WG III AR5
Do Not Cite, Quote or Distribute 99 of 100 Chapter 8 WGIII_AR5_Draft1_Ch08_final2.doc 19 July 2012
Wicke B., P. Verweij, H. van Meijl, D.P. van Vuuren, and A.P.C. Faaij (2012). Indirect land use change: review of existing models and strategies for mitigation. Biofuels 3, 87–100. (DOI: 10.4155/bfs.11.154). Available at: http://dx.doi.org/10.4155/bfs.11.154.
1 2 3
4 5 6 7 8 9
10 11
12 13 14
15 16
17
18 19
20 21 22 23
24 25 26
27 28 29 30 31 32
33 34 35 36
37 38 39
Woodcock J., P. Edwards, C. Tonne, B.G. Armstrong, O. Ashiru, D. Banister, S. Beevers, Z. Chalabi, Z. Chowdhury, A. Cohen, O.H. Franco, A. Haines, R. Hickman, G. Lindsay, I. Mittal, D. Mohan, G. Tiwari, A. Woodward, and I. Roberts (2009). Public health benefits of strategies to reduce greenhouse‐gas emissions: urban land transport. The Lancet 374, 1930–1943. (DOI: doi: 10.1016/S0140‐6736(09)61714‐1). Available at: http://www.sciencedirect.com/science/article/pii/S0140673609617141.
World Bank (2002). Cities on the move : a World Bank urban transport strategy review. The World Bank, Washington, D.C., (ISBN: 0821351486 9780821351482).
World Bank (2006). Promoting Global Environmental Priorities in the Urban Transport Sector: Experiences from the World Bank Group‐Global Environmental Facility Projects. The World Bank, Washington, DC.
World Bank (2009). World Development Report 2009: Reshaping Economic Geography. Washington, D.C.
World Bank (2010). World Development Indicators. The World Bank, Washington, DC.
Wozny N., and H. Allcott (2010). Gasoline Prices, Fuel Economy, and the Energy Paradox. Available at: http://dspace.mit.edu/handle/1721.1/54753.
Wright L. (2011). Bus Rapid Transit: A Review of Recent Advances. In: Urban transport in the developing world, Dimitriou, H. and Gakenheimer, R. (eds). Edward Elgar, Cheltenham, Glos, U.K.; Northampton, Mass. pp.421–455, (ISBN: 9781847202055). Available at: http://trid.trb.org.globalproxy.cvt.dk/view.aspx?id=1116823.
Wright L., and L. Fulton (2005). Climate Change Mitigation and Transport in Developing Nations. Transport Reviews 25, 691–717. (DOI: 10.1080/01441640500360951). Available at: http://www.tandfonline.com/doi/abs/10.1080/01441640500360951.
WSC (2011). Design and Implementation of the Vessel Efficiency Incentive Scheme (EIS). Tokyo. 16 pp. Available at: http://www.google.de/url?sa=t&rct=j&q=design%20and%20implementation%20of%20the%20vessel%20efficiency%20incentive%20scheme%20(eis)&source=web&cd=1&ved=0CFAQFjAA&url=http%3A%2F%2Fwww.worldshipping.org%2FFinal_Final__EIS_July_2011_for_Letter.pdf&ei=ggXsT4rZCNDP4QTM‐fiVBQ&usg=AFQjCNEvhebfk3O2wBE33eDctA3k9RLL_Q&cad=rja.
Wu C., L. Yao, and K. Zhang (2011). The red‐light running behavior of electric bike riders and cyclists at urban intersections in China: An observational study. Accident Analysis & Prevention. (DOI: 10.1016/j.aap.2011.06.001). Available at: http://linkinghub.elsevier.com/retrieve/pii/S0001457511001679.
Yedla S., R. Shrestha, and G. Anandarajah (2005). Environmentally sustainable urban transportation ‐ comparative analysis of local emission mitigation strategies vis‐a‐vis GHG mitigation strategies. Transport Policy 12, 245–254.

First Order Draft (FOD) IPCC WG III AR5
Do Not Cite, Quote or Distribute 100 of 100 Chapter 8 WGIII_AR5_Draft1_Ch08_final2.doc 19 July 2012
1 2 3
4 5 6
7 8
9 10 11 12
13 14 15 16
17 18 19
20 21 22
23 24 25 26
Yeh S., and D. McCollum (2011). Optimizing the transportation climate mitigation wedge. In: Sustainable Transport Energy Pathways. Institution of Transportation Studies, University of Davis, California. Available at: http://creativecommons.org/licences/by‐nc‐nd/3.0/.
Yeh S., and D. Sperling (2010). Low carbon fuel standards: Implementation scenarios and challenges. Energy Policy 38, 6955–6965. (DOI: 10.1016/j.enpol.2010.07.012). Available at: http://www.sciencedirect.com/science/article/pii/S0301421510005410.
Zahavi Y., and A. Talvitie (1980). Regularities in travel time and money expenditures. Transportation Research Record: Journal of the Transportation Research Board 750, 13–19.
Zanchi G., N. Pena, and N. Bird (2011). Is woody bioenergy carbon neutral? A comparative assessment of emissions from consumption of woody bioenergy and fossil fuel. GCB Bioenergy, n/a–n/a. (DOI: 10.1111/j.1757‐1707.2011.01149.x). Available at: http://dx.doi.org/10.1111/j.1757‐1707.2011.01149.x.
Zegras C. (2011). Mainstrreaming sustainable urban transport: puting the pieces together. In: Urban transport in the developing world : a handbook of policy and practice. H.T. Dimitriou, R.A. Gakenheimer, (eds.), Edward Elgar, Cheltenham, UK; Northhampton, MA pp.548–588, (ISBN: 9781847202055 1847202055).
Zhang K.‐M., and Z.‐G. Wen (2008). Review and challenges of policies of environmental protection and sustainable development in China. Journal of Environmental Management 88, 1249–1261. (DOI: 10.1016/j.jenvman.2007.06.019). Available at: http://www.ncbi.nlm.nih.gov/pubmed/17767999.
Ziervogel G., and F. Zermoglio (2009). Climate change scenarios and the development of adaptation strategies in Africa: challenges and opportunities. Climate Research 40, 133–146. (DOI: 10.3354/cr00804).
Zusman E., A. Srinivasan, and S. Dhakal (2012). Low carbon transport in Asia : strategies for optimizing co‐benefits. Earthscan ; Institute for Global Environmental Strategies, London; New York; [s.l.], (ISBN: 9781844079148 1844079147 9781844079155 1844079155 9780203153833 0203153839).