FIRST-HALF REPORT - Kering · 1 2015 First-Half Report ... 2015 Sport & Lifestyle Luxury 95% 4,132m...
74
FIRST-HALF REPORT 2015
Transcript of FIRST-HALF REPORT - Kering · 1 2015 First-Half Report ... 2015 Sport & Lifestyle Luxury 95% 4,132m...
FIRST-HALF
REPORT
2015


Table of contents
1 2015 First-Half Report – Kering
Chapter 1
Kering in the first half of 2015 – Key figures 3
Chapter 2
Financial information for first-half 2015 6
1. Activity report 6
2. Condensed consolidated interim financial statements 38
3. Statutory Auditors’ review report 69
4. Statement by the persons responsible for the interim financial report 70
This is a free translation into English of the 2015 First-Half report issued in French and is provided solely for the convenience of the English speaking users.

Kering in the first half of 2015 – Key figures 1
3 2015 First-Half Report – Kering
Kering in the first half of 2015
Key figures
Key consolidated figures
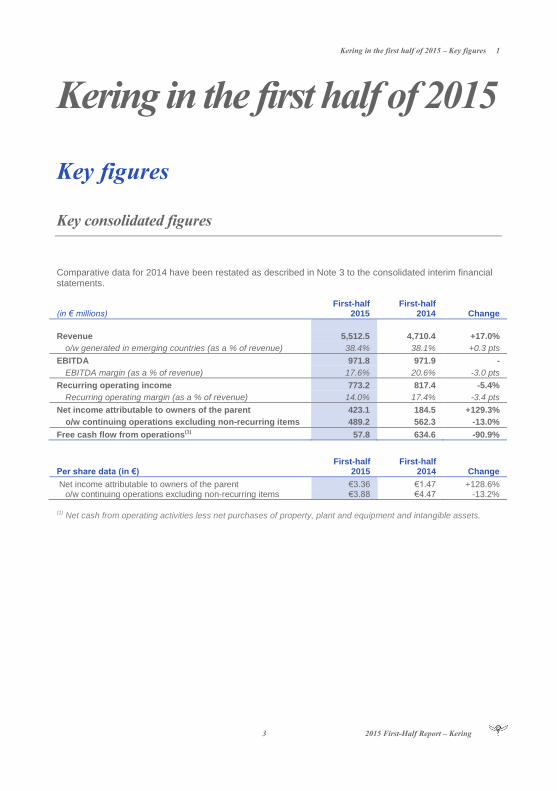
Comparative data for 2014 have been restated as described in Note 3 to the consolidated interim financial statements.
(in € millions) First-half
2015 First-half
2014 Change
Revenue 5,512.5 4,710.4 +17.0%
o/w generated in emerging countries (as a % of revenue) 38.4% 38.1% +0.3 pts
EBITDA 971.8 971.9 -
EBITDA margin (as a % of revenue) 17.6% 20.6% -3.0 pts
Recurring operating income 773.2 817.4 -5.4%
Recurring operating margin (as a % of revenue) 14.0% 17.4% -3.4 pts
Net income attributable to owners of the parent 423.1 184.5 +129.3%
o/w continuing operations excluding non-recurring items 489.2 562.3 -13.0%
Free cash flow from operations(1) 57.8 634.6 -90.9%
Per share data (in €) First-half
2015 First-half
2014 Change
Net income attributable to owners of the parent €3.36 €1.47 +128.6% o/w continuing operations excluding non-recurring items €3.88 €4.47 -13.2%
(1) Net cash from operating activities less net purchases of property, plant and equipment and intangible assets.

1 Kering in the first half of 2015 – Key figures
2015 First-Half Report – Kering 4
Breakdown of revenue by Division
Breakdown of revenue by region
* EEMEA: Eastern Europe, Middle East and Africa
Sport & Lifestyle
32%
Luxury 68%
First-half 2014
Sport & Lifestyle
32%
Luxury 68%
First-half 2015
Western Europe 32%
North America
Asia-Pacific 26%
EEMEA* 8%
South America 4%
Japan 9%
21%
First-half 2014
North America
Asia-Pacific 27%
EEMEA* 7%
South America 4%
Japan
23%
First-half 2015
Western Europe 30%
Japan Japan 9%
Kering in the first half of 2015 – Key figures 1
5 2015 First-Half Report – Kering
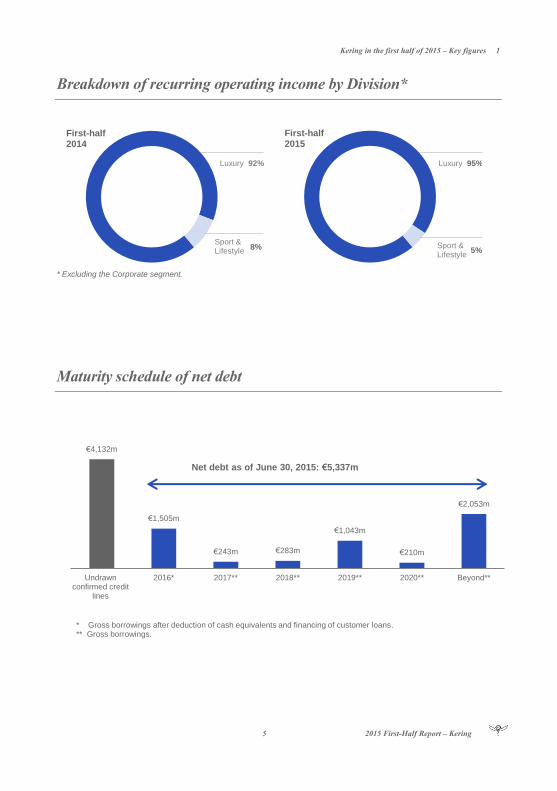
Breakdown of recurring operating income by Division*
* Excluding the Corporate segment.
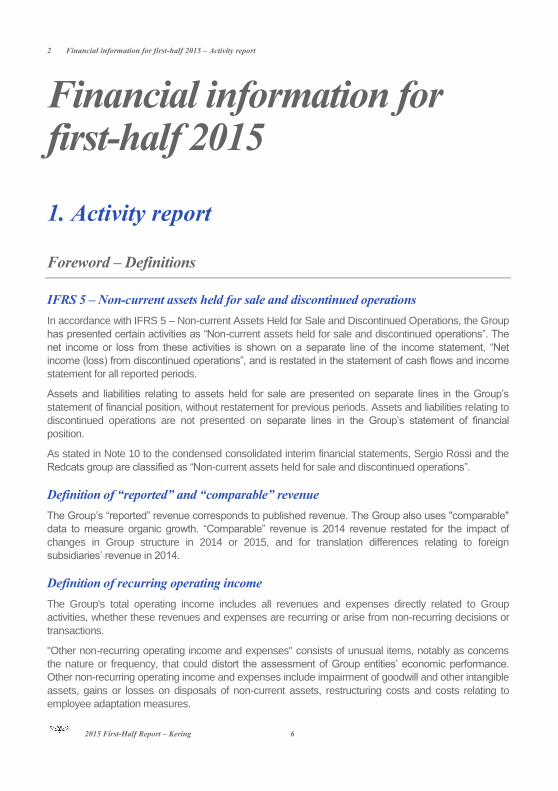
Maturity schedule of net debt
First-half 2014
Sport & Lifestyle
8%
Luxury 92%
First-half 2015
Sport & Lifestyle
5%
Luxury 95%
€4,132m
€1,505m
€243m €283m
€1,043m
€210m
€2,053m
Undrawnconfirmed credit
lines
2016* 2017** 2018** 2019** 2020** Beyond**
* Gross borrowings after deduction of cash equivalents and financing of customer loans. ** Gross borrowings.
Net debt as of June 30, 2015: €5,337m
2 Financial information for first-half 2015 – Activity report
2015 First-Half Report – Kering 6
Financial information for first-half 2015
1. Activity report
Foreword – Definitions
IFRS 5 – Non-current assets held for sale and discontinued operations
In accordance with IFRS 5 – Non-current Assets Held for Sale and Discontinued Operations, the Group
has presented certain activities as “Non-current assets held for sale and discontinued operations”. The
net income or loss from these activities is shown on a separate line of the income statement, “Net
income (loss) from discontinued operations”, and is restated in the statement of cash flows and income
statement for all reported periods.
Assets and liabilities relating to assets held for sale are presented on separate lines in the Group’s
statement of financial position, without restatement for previous periods. Assets and liabilities relating to
discontinued operations are not presented on separate lines in the Group’s statement of financial
position.
As stated in Note 10 to the condensed consolidated interim financial statements, Sergio Rossi and the
Redcats group are classified as “Non-current assets held for sale and discontinued operations”.
Definition of “reported” and “comparable” revenue
The Group’s “reported” revenue corresponds to published revenue. The Group also uses "comparable"
data to measure organic growth. “Comparable” revenue is 2014 revenue restated for the impact of
changes in Group structure in 2014 or 2015, and for translation differences relating to foreign
subsidiaries’ revenue in 2014.
Definition of recurring operating income
The Group's total operating income includes all revenues and expenses directly related to Group
activities, whether these revenues and expenses are recurring or arise from non-recurring decisions or
transactions.
"Other non-recurring operating income and expenses" consists of unusual items, notably as concerns
the nature or frequency, that could distort the assessment of Group entities’ economic performance.
Other non-recurring operating income and expenses include impairment of goodwill and other intangible
assets, gains or losses on disposals of non-current assets, restructuring costs and costs relating to
employee adaptation measures.
Financial information for first-half 2015 – Activity report 2
7 2015 First-Half Report – Kering
Consequently, Kering monitors its operating performance using “Recurring operating income”, defined
as the difference between total operating income and other non-recurring operating income and
expenses (see Note 6 to the condensed consolidated interim financial statements).
Recurring operating income is an intermediate line item intended to facilitate the understanding of the
entity's operating performance and which can be used as a way to estimate recurring performance. This
indicator is presented in a manner that is consistent and stable over the long-term in order to ensure the
continuity and relevance of financial information.
Recurring operating income at comparable exchange rates for 2014 takes into account the currency
impact on revenue and Group acquisitions, the effective portion of currency hedges and the impact of
changes in exchange rates on the translation of the recurring operating income of consolidated entities
located outside the eurozone.
Definition of EBITDA
The Group uses EBITDA to monitor its operating performance. This financial indicator corresponds to
recurring operating income plus net charges to depreciation, amortisation and provisions on non-current
operating assets recognised in recurring operating income.
EBITDA at comparable exchange rates is defined using the same principles as for recurring operating
income at comparable exchange rates.
Definition of free cash flow from operations and available cash flow
The Group also uses an intermediate line item, “Free cash flow from operations”, to monitor its financial
performance. This financial indicator measures net operating cash flow less net operating investments
(defined as purchases and sales of property, plant and equipment and intangible assets).
"Available cash flow" corresponds to free cash flow from operations plus interest and dividends received
less interest paid and equivalent.
Definition of net debt
As defined by CNC recommendation No. 2009-R-03 of July 2, 2009, net debt comprises gross
borrowings, including accrued interest, less net cash.
Net debt includes fair value hedging instruments recorded in the statement of financial position relating
to bank borrowings and bonds whose interest rate risk is fully or partly hedged as part of a fair value
relationship (see Note 18 to the condensed consolidated interim financial statements).
The financing of customer loans by fully-consolidated consumer credit businesses is presented in
borrowings. Group net debt excludes the financing of customer loans by consumer credit businesses.

2 Financial information for first-half 2015 – Activity report
2015 First-Half Report – Kering 8
Highlights of first-half 2015
Change in management and creative responsibility at Gucci
On January 21, 2015, Marco Bizzarri – Gucci's President and CEO who succeeded Patrizio di Marco
on January 1, 2015 – announced that Alessandro Michele had been appointed as the brand's new
Creative Director following the departure of his predecessor Frida Giannini.
Alessandro Michele has been given total creative responsibility for all of Gucci's collections and its
brand image. The first collection fully designed by Alessandro Michele was the 2016 Cruise collection,
which was unveiled in New York on June 4, 2015 and will be available in stores as from the end of the
third quarter of 2015.
Finalisation of the partnership with Safilo and launch of Kering Eyewear
In 2014, Kering announced its plan to invest in a dedicated entity specialised in luxury, high-end and
sport Eyewear, managed by a skilled team of experienced professionals under the direction of Roberto
Vedovotto. This innovative management model for the Group's Eyewear business will allow it to
leverage the full potential of its brands in this category.
As part of this strategic move, Kering and Safilo agreed to further their partnership and jointly intend to
terminate the current Gucci licence agreement two years in advance, i.e., by December 31, 2016, which
will result in total compensation of €90 million to be paid to Safilo. On January 12, 2015, Kering
announced that it had signed a partnership agreement with Safilo covering the development,
manufacture and supply of Gucci Eyewear products. The agreement will be effective as of fourth-
quarter 2015 in order to ensure a seamless transition for Gucci's Eyewear business.
On March 18, 2015, Kering announced the appointment of Roberto Vedovotto, CEO of Kering
Eyewear, as a new member of its Executive Committee. Kering Eyewear was officially launched on
June 30, 2015 when its first collection, "Collezione Uno" was presented at the Palazzo Grassi in Venice.
The overall €90 million in compensation due to Safilo has been recognised as an intangible asset in the
financial statements at June 30, 2015 and will be amortised as from January 1, 2017. The
compensation will be paid in three equal instalments, with the first payment on January 12, 2015 and
the following two in December 2016 and September 2018.
Other highlights
On January 15, 2015, Kering sold the assets of Movitex to the group's management team, after
recapitalising it in accordance with the preliminary agreement signed on December 3, 2014.
On March 20, 2015, Kering issued a €500 million, 0.875% fixed-rate bond maturing in seven years. Also
during the first half of 2015, Kering carried out two issues of notes in foreign currency – a
USD 150 million issue in March 2015 of five-year floating-rate notes, and a USD 150 million issue in
June 2015 of six-year fixed-rate notes with an annual coupon of 2.887%.
On March 25, 2015 Kering bought out the non-controlling interests in Sowind Group in accordance with
the shareholder agreements signed in June 2011. This acquisition did not have a material impact on the
Group's interim financial statements.
On June 30, 2015, PUMA announced that it had sold the intellectual property rights (including
trademark rights) of its subsidiary, Tretorn Group, to US-based Authentic Brands Group, LLC (ABG).
Tretorn – which is based in Helsingborg in Sweden and makes sport and leisure products – was
acquired by PUMA in 2002. This sale is in line with PUMA's strategy of refocusing on its core
businesses.
Financial information for first-half 2015 – Activity report 2
9 2015 First-Half Report – Kering
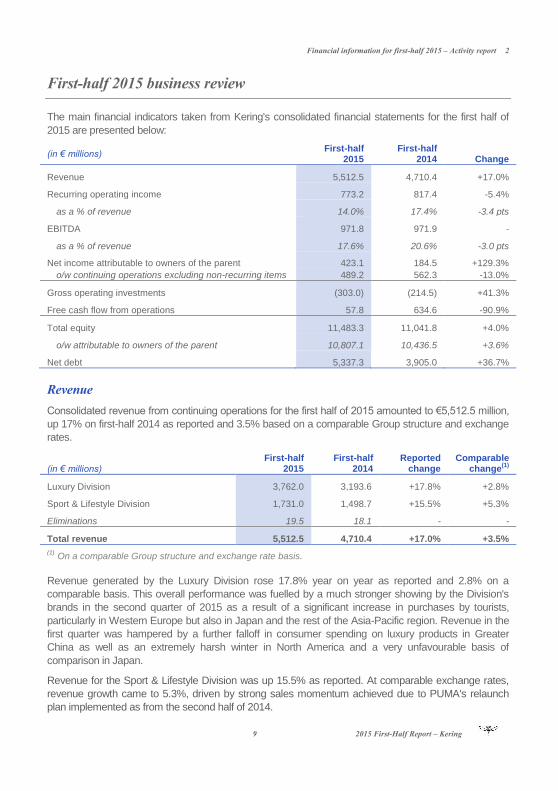
First-half 2015 business review
The main financial indicators taken from Kering's consolidated financial statements for the first half of
2015 are presented below:
(in € millions) First-half
2015 First-half
2014 Change
Revenue 5,512.5 4,710.4 +17.0%
Recurring operating income 773.2 817.4 -5.4%
as a % of revenue 14.0% 17.4% -3.4 pts
EBITDA 971.8 971.9 -
as a % of revenue 17.6% 20.6% -3.0 pts
Net income attributable to owners of the parent 423.1 184.5 +129.3%
o/w continuing operations excluding non-recurring items 489.2 562.3 -13.0%
Gross operating investments (303.0) (214.5) +41.3%
Free cash flow from operations 57.8 634.6 -90.9%
Total equity 11,483.3 11,041.8 +4.0%
o/w attributable to owners of the parent 10,807.1 10,436.5 +3.6%
Net debt 5,337.3 3,905.0 +36.7%
Revenue
Consolidated revenue from continuing operations for the first half of 2015 amounted to €5,512.5 million,
up 17% on first-half 2014 as reported and 3.5% based on a comparable Group structure and exchange
rates.
(in € millions)
First-half 2015
First-half 2014
Reported change
Comparable change
(1)
Luxury Division 3,762.0 3,193.6 +17.8% +2.8%
Sport & Lifestyle Division 1,731.0 1,498.7 +15.5% +5.3%
Eliminations 19.5 18.1 - -
Total revenue 5,512.5 4,710.4 +17.0% +3.5%
(1) On a comparable Group structure and exchange rate basis.
Revenue generated by the Luxury Division rose 17.8% year on year as reported and 2.8% on a
comparable basis. This overall performance was fuelled by a much stronger showing by the Division's
brands in the second quarter of 2015 as a result of a significant increase in purchases by tourists,
particularly in Western Europe but also in Japan and the rest of the Asia-Pacific region. Revenue in the
first quarter was hampered by a further falloff in consumer spending on luxury products in Greater
China as well as an extremely harsh winter in North America and a very unfavourable basis of
comparison in Japan.
Revenue for the Sport & Lifestyle Division was up 15.5% as reported. At comparable exchange rates,
revenue growth came to 5.3%, driven by strong sales momentum achieved due to PUMA's relaunch
plan implemented as from the second half of 2014.
2 Financial information for first-half 2015 – Activity report
2015 First-Half Report – Kering 10
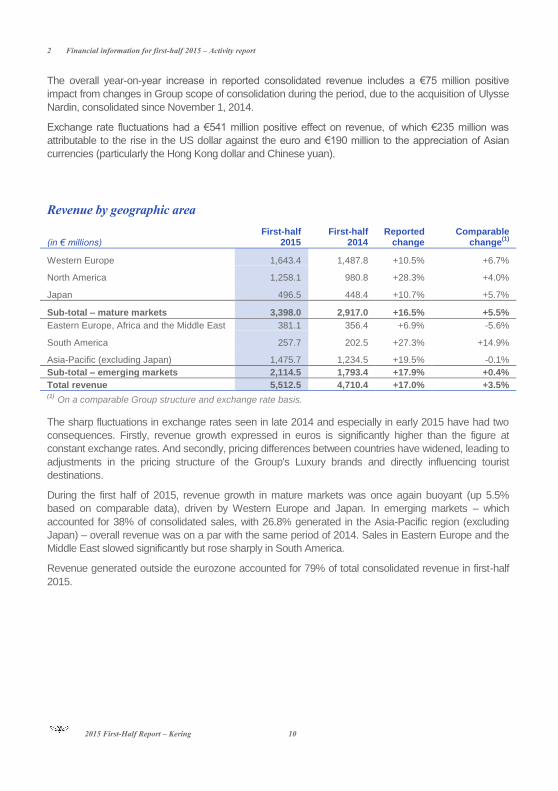
The overall year-on-year increase in reported consolidated revenue includes a €75 million positive
impact from changes in Group scope of consolidation during the period, due to the acquisition of Ulysse
Nardin, consolidated since November 1, 2014.
Exchange rate fluctuations had a €541 million positive effect on revenue, of which €235 million was
attributable to the rise in the US dollar against the euro and €190 million to the appreciation of Asian
currencies (particularly the Hong Kong dollar and Chinese yuan).
Revenue by geographic area
(in € millions)
First-half 2015
First-half 2014
Reported change
Comparable change
(1)
Western Europe 1,643.4 1,487.8 +10.5% +6.7%
North America 1,258.1 980.8 +28.3% +4.0%
Japan 496.5 448.4 +10.7% +5.7%
Sub-total – mature markets 3,398.0 2,917.0 +16.5% +5.5%
Eastern Europe, Africa and the Middle East 381.1 356.4 +6.9% -5.6%
South America 257.7 202.5 +27.3% +14.9%
Asia-Pacific (excluding Japan) 1,475.7 1,234.5 +19.5% -0.1%
Sub-total – emerging markets 2,114.5 1,793.4 +17.9% +0.4%
Total revenue 5,512.5 4,710.4 +17.0% +3.5% (1) On a comparable Group structure and exchange rate basis.
The sharp fluctuations in exchange rates seen in late 2014 and especially in early 2015 have had two
consequences. Firstly, revenue growth expressed in euros is significantly higher than the figure at
constant exchange rates. And secondly, pricing differences between countries have widened, leading to
adjustments in the pricing structure of the Group's Luxury brands and directly influencing tourist
destinations.
During the first half of 2015, revenue growth in mature markets was once again buoyant (up 5.5%
based on comparable data), driven by Western Europe and Japan. In emerging markets – which
accounted for 38% of consolidated sales, with 26.8% generated in the Asia-Pacific region (excluding
Japan) – overall revenue was on a par with the same period of 2014. Sales in Eastern Europe and the
Middle East slowed significantly but rose sharply in South America.
Revenue generated outside the eurozone accounted for 79% of total consolidated revenue in first-half
2015.
Financial information for first-half 2015 – Activity report 2
11 2015 First-Half Report – Kering
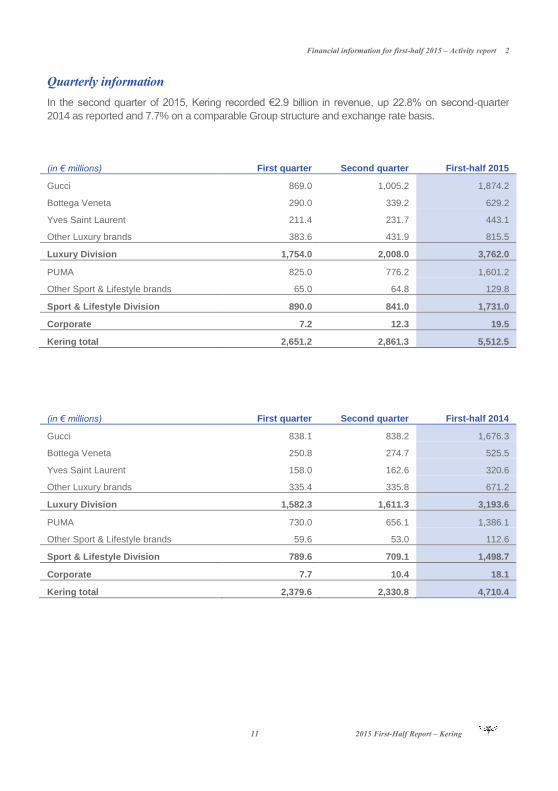
Quarterly information
In the second quarter of 2015, Kering recorded €2.9 billion in revenue, up 22.8% on second-quarter
2014 as reported and 7.7% on a comparable Group structure and exchange rate basis.
(in € millions) First quarter Second quarter First-half 2015
Gucci 869.0 1,005.2 1,874.2
Bottega Veneta 290.0 339.2 629.2
Yves Saint Laurent 211.4 231.7 443.1
Other Luxury brands 383.6 431.9 815.5
Luxury Division 1,754.0 2,008.0 3,762.0
PUMA 825.0 776.2 1,601.2
Other Sport & Lifestyle brands 65.0 64.8 129.8
Sport & Lifestyle Division 890.0 841.0 1,731.0
Corporate 7.2 12.3 19.5
Kering total 2,651.2 2,861.3 5,512.5
(in € millions) First quarter Second quarter First-half 2014
Gucci 838.1 838.2 1,676.3
Bottega Veneta 250.8 274.7 525.5
Yves Saint Laurent 158.0 162.6 320.6
Other Luxury brands 335.4 335.8 671.2
Luxury Division 1,582.3 1,611.3 3,193.6
PUMA 730.0 656.1 1,386.1
Other Sport & Lifestyle brands 59.6 53.0 112.6
Sport & Lifestyle Division 789.6 709.1 1,498.7
Corporate 7.7 10.4 18.1
Kering total 2,379.6 2,330.8 4,710.4
2 Financial information for first-half 2015 – Activity report
2015 First-Half Report – Kering 12
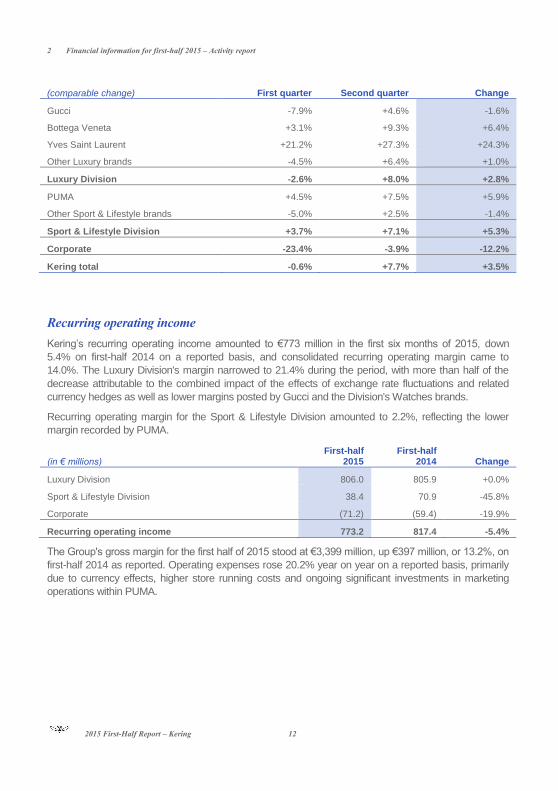
(comparable change) First quarter Second quarter Change
Gucci -7.9% +4.6% -1.6%
Bottega Veneta +3.1% +9.3% +6.4%
Yves Saint Laurent +21.2% +27.3% +24.3%
Other Luxury brands -4.5% +6.4% +1.0%
Luxury Division -2.6% +8.0% +2.8%
PUMA +4.5% +7.5% +5.9%
Other Sport & Lifestyle brands -5.0% +2.5% -1.4%
Sport & Lifestyle Division +3.7% +7.1% +5.3%
Corporate -23.4% -3.9% -12.2%
Kering total -0.6% +7.7% +3.5%
Recurring operating income
Kering’s recurring operating income amounted to €773 million in the first six months of 2015, down
5.4% on first-half 2014 on a reported basis, and consolidated recurring operating margin came to
14.0%. The Luxury Division's margin narrowed to 21.4% during the period, with more than half of the
decrease attributable to the combined impact of the effects of exchange rate fluctuations and related
currency hedges as well as lower margins posted by Gucci and the Division's Watches brands.
Recurring operating margin for the Sport & Lifestyle Division amounted to 2.2%, reflecting the lower
margin recorded by PUMA.
(in € millions)
First-half 2015
First-half 2014 Change
Luxury Division 806.0 805.9 +0.0%
Sport & Lifestyle Division 38.4 70.9 -45.8%
Corporate (71.2) (59.4) -19.9%
Recurring operating income 773.2 817.4 -5.4%
The Group's gross margin for the first half of 2015 stood at €3,399 million, up €397 million, or 13.2%, on
first-half 2014 as reported. Operating expenses rose 20.2% year on year on a reported basis, primarily
due to currency effects, higher store running costs and ongoing significant investments in marketing
operations within PUMA.

Financial information for first-half 2015 – Activity report 2
13 2015 First-Half Report – Kering
EBITDA
Consolidated EBITDA came to €972 million, on a par with the first-half 2014 figure as reported, and the
EBITDA margin narrowed by 3 points on a reported basis to 17.6%.
(in € millions)
First-half 2015
First-half 2014 Change
Luxury Division 960.7 925.4 +3.8%
Sport & Lifestyle Division 70.1 96.8 -27.6%
Corporate (59.0) (50.3) -17.3%
EBITDA 971.8 971.9 -
Other non-recurring operating income and expenses
Other non-recurring operating income and expenses consist of unusual items that could distort the
assessment of each brand's financial performance.
Other non-recurring operating income and expenses represented a net expense of €42 million in the six
months to June 30, 2015 and primarily included restructuring costs, asset impairment losses for Luxury
activities – particularly Gucci inventory write-downs in line with the brand's current period of transition –
and disposal gains, chiefly relating to the sale of the Tretorn brand and the capital gain arising on the
sale of a property complex.
In first-half 2014, this item represented a net gain of €1 million and primarily included (i) a net gain on
the disposal of a property complex and (ii) asset impairment losses, including €183 million charged
against the "Other Sport & Lifestyle brands" goodwill.
Further details on this item are provided in Note 6 to the consolidated interim financial statements.
Net finance costs
The Group’s net finance costs can be analysed as follows:
(in € millions)
First-half 2015
First-half 2014 Change
Cost of net debt (64.2) (86.0) -25.3%
Other financial income and expenses (72.0) (18.3) -
Finance costs, net (136.2) (104.3) +30.6%
The Group’s cost of net debt in first-half 2015 was 25% lower than in the same period of 2014, coming
in at just over €64 million.
Average outstanding net debt increased by 32% year on year, chiefly due to currency effects and
changes in Group structure (notably the recapitalisations of La Redoute, Relais Colis and Movitex).
However, this negative effect was partly offset by a decrease in Kering's average cost of borrowing,
particularly thanks to much lower interest rates on the Group's bond debt.
"Other financial income and expenses" represented a net expense that was €54 million higher than in
first-half 2014, mainly due to the application of IAS 39, and notably the adverse impact of the ineffective
portion of cash flow hedges.
2 Financial information for first-half 2015 – Activity report
2015 First-Half Report – Kering 14
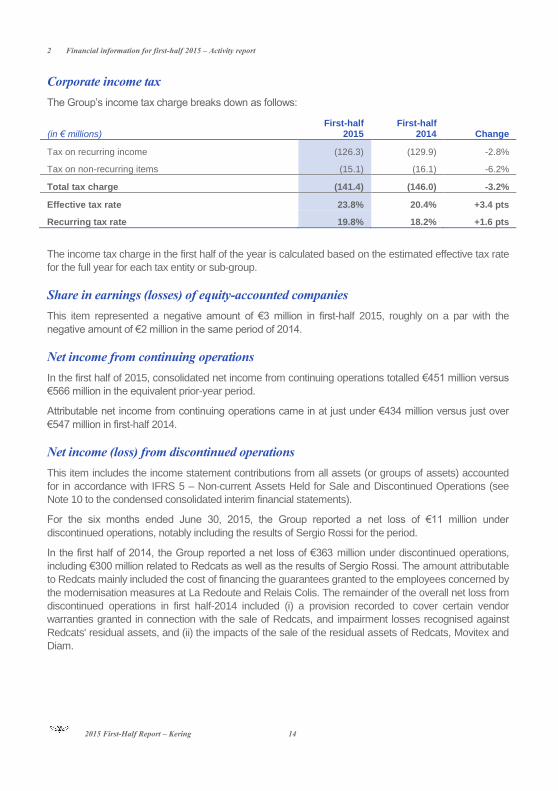
Corporate income tax
The Group’s income tax charge breaks down as follows:
(in € millions)
First-half 2015
First-half 2014 Change
Tax on recurring income (126.3) (129.9) -2.8%
Tax on non-recurring items (15.1) (16.1) -6.2%
Total tax charge (141.4) (146.0) -3.2%
Effective tax rate 23.8% 20.4% +3.4 pts
Recurring tax rate 19.8% 18.2% +1.6 pts
The income tax charge in the first half of the year is calculated based on the estimated effective tax rate
for the full year for each tax entity or sub-group.
Share in earnings (losses) of equity-accounted companies
This item represented a negative amount of €3 million in first-half 2015, roughly on a par with the
negative amount of €2 million in the same period of 2014.
Net income from continuing operations
In the first half of 2015, consolidated net income from continuing operations totalled €451 million versus
€566 million in the equivalent prior-year period.
Attributable net income from continuing operations came in at just under €434 million versus just over
€547 million in first-half 2014.
Net income (loss) from discontinued operations
This item includes the income statement contributions from all assets (or groups of assets) accounted
for in accordance with IFRS 5 – Non-current Assets Held for Sale and Discontinued Operations (see
Note 10 to the condensed consolidated interim financial statements).
For the six months ended June 30, 2015, the Group reported a net loss of €11 million under
discontinued operations, notably including the results of Sergio Rossi for the period.
In the first half of 2014, the Group reported a net loss of €363 million under discontinued operations,
including €300 million related to Redcats as well as the results of Sergio Rossi. The amount attributable
to Redcats mainly included the cost of financing the guarantees granted to the employees concerned by
the modernisation measures at La Redoute and Relais Colis. The remainder of the overall net loss from
discontinued operations in first half-2014 included (i) a provision recorded to cover certain vendor
warranties granted in connection with the sale of Redcats, and impairment losses recognised against
Redcats' residual assets, and (ii) the impacts of the sale of the residual assets of Redcats, Movitex and
Diam.
Financial information for first-half 2015 – Activity report 2
15 2015 First-Half Report – Kering
Net income attributable to non-controlling interests
Net income attributable to non-controlling interests totalled €17 million in first-half 2015 versus
€19 million in the six months ended June 30, 2014.
Net income attributable to owners of the parent
Net income attributable to owners of the parent came to €423 million for the first six months of 2015
versus €185 million for the same period of 2014.
Adjusted for non-recurring items net of tax, attributable net income from continuing operations
contracted 13% to €489 million from €562 million in first-half 2014.
Earnings per share
The weighted average number of Kering shares used to calculate earnings per share was 126 million in
the first half of 2015, on a par with the number used for the first six months of 2014 (see Note 11 to the
condensed consolidated interim financial statements).
Earnings per share amounted to €3.36 in the first half of 2015, up sharply on the first-half 2014 figure of
€1.47.
Earnings per share from continuing operations stood at €3.44, 21% lower than the first-half 2014 figure
of €4.35.
Excluding non-recurring items, earnings per share from continuing operations totalled €3.88, down 13%
on the €4.47 recorded for the first half of 2014.
The impact of dilutive instruments on the calculation of earnings per share was not material in first-half
2015.
2 Financial information for first-half 2015 – Activity report
2015 First-Half Report – Kering 16
Analysis of operating performances by brand
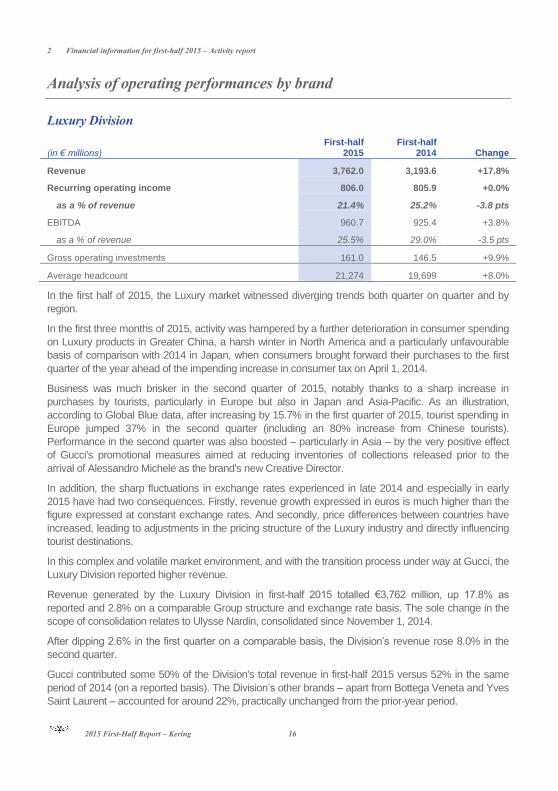
Luxury Division
(in € millions)
First-half 2015
First-half 2014 Change
Revenue 3,762.0 3,193.6 +17.8%
Recurring operating income 806.0 805.9 +0.0%
as a % of revenue 21.4% 25.2% -3.8 pts
EBITDA 960.7 925.4 +3.8%
as a % of revenue 25.5% 29.0% -3.5 pts
Gross operating investments 161.0 146.5 +9.9%
Average headcount 21,274 19,699 +8.0%
In the first half of 2015, the Luxury market witnessed diverging trends both quarter on quarter and by
region.
In the first three months of 2015, activity was hampered by a further deterioration in consumer spending
on Luxury products in Greater China, a harsh winter in North America and a particularly unfavourable
basis of comparison with 2014 in Japan, when consumers brought forward their purchases to the first
quarter of the year ahead of the impending increase in consumer tax on April 1, 2014.
Business was much brisker in the second quarter of 2015, notably thanks to a sharp increase in
purchases by tourists, particularly in Europe but also in Japan and Asia-Pacific. As an illustration,
according to Global Blue data, after increasing by 15.7% in the first quarter of 2015, tourist spending in
Europe jumped 37% in the second quarter (including an 80% increase from Chinese tourists).
Performance in the second quarter was also boosted – particularly in Asia – by the very positive effect
of Gucci's promotional measures aimed at reducing inventories of collections released prior to the
arrival of Alessandro Michele as the brand's new Creative Director.
In addition, the sharp fluctuations in exchange rates experienced in late 2014 and especially in early
2015 have had two consequences. Firstly, revenue growth expressed in euros is much higher than the
figure expressed at constant exchange rates. And secondly, price differences between countries have
increased, leading to adjustments in the pricing structure of the Luxury industry and directly influencing
tourist destinations.
In this complex and volatile market environment, and with the transition process under way at Gucci, the
Luxury Division reported higher revenue.
Revenue generated by the Luxury Division in first-half 2015 totalled €3,762 million, up 17.8% as
reported and 2.8% on a comparable Group structure and exchange rate basis. The sole change in the
scope of consolidation relates to Ulysse Nardin, consolidated since November 1, 2014.
After dipping 2.6% in the first quarter on a comparable basis, the Division’s revenue rose 8.0% in the
second quarter.
Gucci contributed some 50% of the Division's total revenue in first-half 2015 versus 52% in the same
period of 2014 (on a reported basis). The Division’s other brands – apart from Bottega Veneta and Yves
Saint Laurent – accounted for around 22%, practically unchanged from the prior-year period.
Financial information for first-half 2015 – Activity report 2
17 2015 First-Half Report – Kering
Retail sales in directly-operated stores and online rose 7.0% year on year (on a comparable basis) and
represented 71.5% of the Division's total revenue in first-half 2015 compared with 69.0% in the first six
months of 2014. This year-on-year increase reflects the strategy implemented by all of the Division's
brands to control their distribution more effectively and reinforce their exclusivity; it also reflects
measures taken to prudently manage the expansion of the directly-operated store network.
Wholesale sales were 7.3% lower than in first-half 2014 on a comparable basis, with the decrease
primarily attributable to Gucci. In view of the transition process under way within Gucci in terms of both
its creative vision and its organisational structure, the brand launched a new phase in a plan to
streamline the wholesale distribution network by drastically reducing exposure to multi-brand distributors
in Europe.
By product category, the Division's overall revenue is becoming increasingly balanced, reflecting the
complementarity of the brands in the portfolio, with the contributions of Leather Goods, Ready-to-Wear
and Shoes representing 54.2%, 15.7% and 12.1%, respectively. Watches and Jewellery sales
accounted for 9.7% of revenue. Apart from Watches – which were adversely affected by a lacklustre
market and the sharp appreciation of the Swiss franc – revenue was up in each of the Division's main
product categories.
Growth was highest in the Division's traditional, more mature markets, coming in at 7.3% on a
comparable basis overall and 13.4% for the directly-operated store network.
Western Europe (which made up 31.0% of the Division's revenue) posted a strong 9.5% increase,
driven by robust sales in eurozone countries (up 17.6%). These figures were achieved thanks to both
the sharp increase in tourist numbers in Europe – which began in the first quarter of 2015 and has
accelerated since – and steadily rising sales to local customers.
In North America (which contributed 20.1% of the Division's sales), revenue climbed 4.0% year on year,
fuelled by 6.0% growth in the second quarter following on from a less buoyant first three months when
performance was weighed down by bad weather conditions. The rise of the US dollar against many of
the world's other major currencies had an overall adverse impact on sales to tourists, however.
Revenue in Japan advanced 7.4% during first-half 2015, driven by increased tourism from Mainland
China and robust sales to the local clientele.
The Luxury Division's sales in emerging markets (which represented 39.1% of its total revenue) edged
back 3.5% on a comparable basis, with performance hampered by unfavourable market conditions in
Greater China and continued economic and political tension in Eastern Europe which had an indirect
effect on the spending of Russian tourists in Turkey and the Middle East.
In the Asia-Pacific region (excluding Japan), revenue declined 2.3% in first-half 2015, as an upturn in
spending by Chinese customers in certain countries within the region – such as South Korea, Taiwan
and Australia – did not offset the sales contraction in Hong Kong and Macao. Year-on-year revenue in
Mainland China remained stable.
Sales also decreased in the Division's other emerging markets, except for Latin America, which saw its
revenue jump.
The Luxury Division's recurring operating income amounted to €806 million for first-half 2015, stable
from first-half 2014.
Recurring operating margin came in at 21.4%, down 380 basis points as reported. More than half of this
decrease was due to the combined effects of exchange rate fluctuations and currency hedges, which
2 Financial information for first-half 2015 – Activity report
2015 First-Half Report – Kering 18
had a massive dilutive impact in the period. The remainder of the decline was attributable to the
contraction in recurring operating income posted by Gucci and weaker performance in Watches.
EBITDA rose 3.8% in first-half 2015 to €961 million, and the EBITDA margin stood at 25.5%. The year-
on-year change in EBITDA was more favourable than for EBIT, reflecting the growing weight of
depreciation and amortisation within operating income (up 29.5% on first-half 2014) as a result of the
Division’s capital expenditure strategy implemented over the past several years.
The Luxury Division's gross operating investments totalled €161 million for first-half 2015, 9.9% higher
than in the same period of 2014. The increase primarily stemmed from currency effects, as gross
operating investments at constant exchange rates were relatively stable compared with first-half 2014.
This reflects the Division’s focus on organic growth on a same-store basis and consolidating the
network of existing stores, while taking into consideration the more unsettled operating context for the
Luxury industry. At the same time, measures previously undertaken to reallocate capital expenditure
were pursued during the period, with a pronounced increase in the amount of financing assigned to
store refurbishments, extensions and relocations, particularly for Gucci.
As of June 30, 2015, the Luxury Division had a network of 1,201 directly-operated stores, including 745
(62%) in mature markets and 456 in emerging markets. Net store additions during the period totalled 15
(representing a 1.3% increase compared with December 31, 2014).
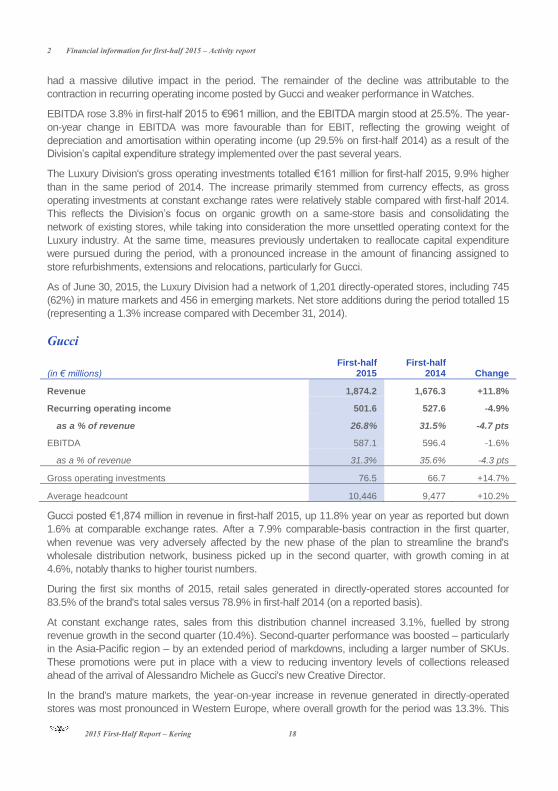
Gucci
(in € millions)
First-half 2015
First-half 2014 Change
Revenue 1,874.2 1,676.3 +11.8%
Recurring operating income 501.6 527.6 -4.9%
as a % of revenue 26.8% 31.5% -4.7 pts
EBITDA 587.1 596.4 -1.6%
as a % of revenue 31.3% 35.6% -4.3 pts
Gross operating investments 76.5 66.7 +14.7%
Average headcount 10,446 9,477 +10.2%
Gucci posted €1,874 million in revenue in first-half 2015, up 11.8% year on year as reported but down
1.6% at comparable exchange rates. After a 7.9% comparable-basis contraction in the first quarter,
when revenue was very adversely affected by the new phase of the plan to streamline the brand's
wholesale distribution network, business picked up in the second quarter, with growth coming in at
4.6%, notably thanks to higher tourist numbers.
During the first six months of 2015, retail sales generated in directly-operated stores accounted for
83.5% of the brand's total sales versus 78.9% in first-half 2014 (on a reported basis).
At constant exchange rates, sales from this distribution channel increased 3.1%, fuelled by strong
revenue growth in the second quarter (10.4%). Second-quarter performance was boosted – particularly
in the Asia-Pacific region – by an extended period of markdowns, including a larger number of SKUs.
These promotions were put in place with a view to reducing inventory levels of collections released
ahead of the arrival of Alessandro Michele as Gucci's new Creative Director.
In the brand's mature markets, the year-on-year increase in revenue generated in directly-operated
stores was most pronounced in Western Europe, where overall growth for the period was 13.3%. This
Financial information for first-half 2015 – Activity report 2
19 2015 First-Half Report – Kering
region saw a solid revenue rise of 6.3% on a comparable basis in the first quarter followed by a 19.8%
jump in the second, driven by high tourist numbers, particularly Chinese and American, as well as by
very positive trends in the domestic market which demonstrate the brand's enhanced customer appeal.
In North America, Gucci reported 5.8% comparable-basis revenue growth despite lower sales to tourists
due to the appreciation of the US dollar against many of the world's other major currencies.
In Japan, where the Gucci brand is well established and its repositioning has been completed, sales in
directly-operated stores were up 2.1% year on year on a comparable basis, with a 19.0% bounce in the
second quarter, powered by an increase in sales to tourists.
In emerging markets (which accounted for 46.8% of the brand's sales in directly-operated stores versus
47.2% in first-half 2014, as reported), sales moved back 1.8% on a comparable exchange rate basis,
primarily as a result of a 3.6% contraction in the Asia-Pacific region. This downward trend in Asia-Pacific
(excluding Japan) was entirely due to the ongoing decline in consumer spending in Hong Kong and
Macao, as sales in Mainland China were up year on year and South Korea and Australia reported a
very solid sales performance in line with the rise in tourist numbers. The brand's revenue in other
emerging markets was higher than in first-half 2014 overall despite flat sales in the Middle East.
By product category, Gucci's performance in directly-operated stores was similar to 2014 for Leather
Goods. Handbag sales in directly-operated stores were up significantly, but weaker performances were
seen once again for small leather goods and luggage – two categories that were partially revisited in
connection with Gucci’s strategy to render the brand more exclusive and as a result of the arrival of the
new Creative Director.
Leather Goods represented 57.8% of Gucci's total revenue during the period.
The brand's other main product categories (Shoes and Ready-to-Wear) also delivered growth in the first
six months of 2015, spurred by the upswing in sales of Women's Ready-to-Wear lines, which started to
be felt in 2014 and continued into the first half of 2015. Shoes and Ready-to-Wear represented 25.9%
of Gucci's total revenue during the period.
Wholesale sales dropped by 20.9% on a comparable basis in the first half of 2015, reflecting the new
phase in the plan to drastically streamline this distribution channel, particularly in the multi-brand
distributors segment. All product categories were affected by the additional reduction in volumes
distributed by wholesalers.
Overall, Gucci's performance in the first six months of 2015 was largely based on sales of collections
presented in 2014 and does not fully reflect the measures and initiatives put in place by Marco Bizzarri
since he joined the brand as its new President and CEO at the beginning of the year. The first collection
fully designed by Alessandro Michele – which was highly acclaimed when presented in New York in
June 2015 – was the 2016 Cruise collection, which will be available in stores as from the end of the third
quarter of 2015.
Gucci's recurring operating income for first-half 2015 came in at just under €502 million, down 4.9%
year on year as reported. The brand's recurring operating margin narrowed by 470 basis points to
26.8%. More than half of this decrease was due to the dilutive impact of currency hedges during the
period and the remainder was attributable to an increase in operating expenses, which primarily derived
from higher store running costs.
Gross margin was also down year on year on a reported basis but stable at constant exchange rates.
EBITDA amounted to €587 million in first-half 2015 and the EBITDA margin remained very high, at
31.3% of revenue.

2 Financial information for first-half 2015 – Activity report
2015 First-Half Report – Kering 20
As of June 30, 2015, Gucci operated 512 stores, including 211 in emerging markets. A net seven stores
were added during the period, including two in South Africa previously operated by a third party that
have been brought under direct management.
Gucci's gross operating investments amounted to €77 million in first-half 2015, up 14.7% on the same
period of 2014. This increase was due to differences in the phasing of investments compared to last
year, and to currency effects on investments outside the eurozone.
Bottega Veneta
(in € millions)
First-half 2015
First-half 2014 Change
Revenue 629.2 525.5 +19.7%
Recurring operating income 180.1 163.1 +10.4%
as a % of revenue 28.6% 31.0% -2.4 pts
EBITDA 198.6 177.7 +11.8%
as a % of revenue 31.6% 33.8% -2.2 pts
Gross operating investments 20.7 18.6 +11.3%
Average headcount 3,350 3,146 +6.5%
Bottega Veneta posted revenue of €629 million in first-half 2015, up 19.7% as reported and 6.4% at
comparable exchange rates. The brand's growth rate was higher in the second quarter, at 9.3% on a
comparable basis.
With a view to preserving its high-end positioning and exclusivity, Bottega Veneta's preferred distribution
channel is its directly-operated stores, and in the first six months of 2015 this distribution channel
accounted for 83.0% of the brand's total sales. Year-on-year revenue growth for directly-operated stores
amounted to 7.2% overall on a comparable basis. First-quarter growth was somewhat subdued, coming
in at just 1.9% based on comparable data, as it was weighed down by unfavourable market conditions
in the Asia-Pacific region as well as by widening price differences between geographic areas due to the
weakening of the euro against many of the world’s other major currencies. However, thanks to
corrective measures put in place by Bottega Veneta to effectively manage pricing differences, combined
with the sharp rise in tourist numbers in the main travel destinations, the brand's sales performance in
its directly-operated stores was far more robust in the second quarter, with revenue up 12.2% on a
comparable basis.
Sales generated in the wholesale network increased 2.4% in first-half 2015. However, this overall figure
masks contrasted trends: during the period Bottega Veneta focused on a small number of strategic
markets – such as North America, South Korea and the Middle East – where sales trends were very
strong, with growth hovering around or exceeding 10%.
Leather Goods once again formed the brand's core business, representing 88.4% of Bottega Veneta's
total sales during the six-month period and recording very solid year-on-year growth of 8.3%. This
strong performance demonstrates the success of the strategy underlying the brand's offering, which is
based on a controlled combination of iconic pieces, new seasonal designs and new leather goods
models whose design and pricing structure have been reviewed in order to more closely take into
account customers' expectations.
Financial information for first-half 2015 – Activity report 2
21 2015 First-Half Report – Kering
Unlike previous periods, Bottega Veneta's sales growth in first-half 2015 was very unevenly balanced
between its traditional and emerging markets, which recorded a 15.8% revenue rise and a 3.9%
contraction, respectively (at comparable exchange rates).
The Asia-Pacific region (excluding Japan) once again accounted for over 90% of Bottega Veneta's
business in emerging markets. Sales in this region dropped 4.3% year on year, weighed down by the
lacklustre Luxury goods market in Greater China during the period, despite the very positive trends
seen in South Korea, Taiwan and Australia, where purchases by Chinese tourists increased
significantly.
In Western Europe – which represents 28.4% of the brand's total revenue – sales surged 25.3% on a
comparable basis, driven by extremely high tourist numbers.
In Japan – which made up 15.0% of total sales – revenue advanced 13.0% at constant exchange rates,
powered by ongoing growth trends in the domestic market and high levels of purchases by Chinese
customers.
Sales in North America increased 2.1% overall on a comparable basis, reflecting the combined impact
of continued growth in revenue generated with department stores and a decrease in the number of
tourists due to the strengthening of the US dollar.
Bottega Veneta posted recurring operating income of €180 million for the six months ended
June 30, 2015, up 10.4% year on year. Recurring operating margin came in at 28.6%, down 240 basis
points as reported. However, adjusted for the currency effect and the impact of currency hedges,
profitability was roughly unchanged compared to the first half of 2014.
EBITDA climbed almost 12% to just under €199 million. This represents a higher rise than for recurring
operating income, due to an increase in depreciation and amortisation expenses resulting from the
brand's investments in recent years.
Bottega Veneta's network of directly-operated stores totalled 240 units as of June 30, 2015, including
100 in emerging markets. There were four net store additions during the first half.
Bottega Veneta's gross operating investments totalled nearly €21 million compared with €19 million in
first-half 2014. This slight year-on-year increase includes the automatic impact of currency effects on
investments outside the eurozone.
Yves Saint Laurent
(in € millions)
First-half 2015
First-half 2014 Change
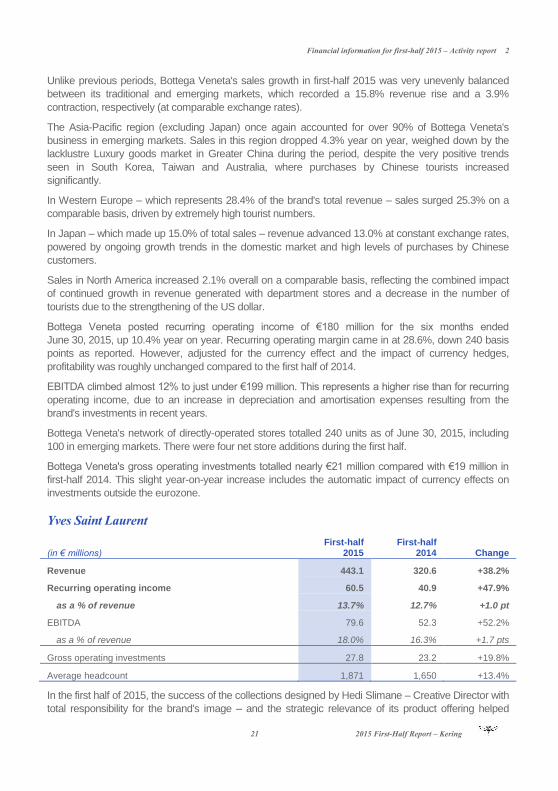
Revenue 443.1 320.6 +38.2%
Recurring operating income 60.5 40.9 +47.9%
as a % of revenue 13.7% 12.7% +1.0 pt
EBITDA 79.6 52.3 +52.2%
as a % of revenue 18.0% 16.3% +1.7 pts
Gross operating investments 27.8 23.2 +19.8%
Average headcount 1,871 1,650 +13.4%
In the first half of 2015, the success of the collections designed by Hedi Slimane – Creative Director with
total responsibility for the brand's image – and the strategic relevance of its product offering helped
2 Financial information for first-half 2015 – Activity report
2015 First-Half Report – Kering 22
further strengthen Yves Saint Laurent's brand appeal. This appeal – which was given an additional
boost by continued investments in the brand's stores and a 360° communication strategy – resulted in
very robust growth for Yves Saint Laurent during the period.
Yves Saint Laurent's revenue totalled €443 million for first-half 2015, a year-on-year surge of 38.2% as
reported and 24.3% based on comparable exchange rates. As for the Group's other Luxury brands, the
pace of growth accelerated in the second quarter, reaching 27.3% based on comparable data versus
21.2% in the first.
The investments undertaken for the directly-operated store network since 2012 have enabled
Yves Saint Laurent to increase the portion of sales generated through this exclusive distribution
channel, which accounted for around 64% of the brand’s total sales in first-half 2015. Revenue from
retail sales in directly-operated stores advanced by 25.7% during the period, driven by a sharp increase
in same-store sales.
Wholesale sales were up 21.9% based on comparable data, illustrating independent distributor
appreciation of the brand as a major growth driver for their business. This distribution channel also
remains strategically important for Yves Saint Laurent as it represents a perfect fit with its retail channel.
Following on from the upswing in the last quarter of 2014, revenue from royalties rose by 21.5% in the
first six months of 2015, compared with a relatively weak performance in first-half 2014.
All of Yves Saint Laurent's main product categories registered very strong sales growth during the
period.
The brand's Leather Goods offering continues to prove highly attractive, particularly as the price
structure has been partially revisited to reflect changes in exchange rates and market conditions in
certain regions. Sales posted by this category climbed by 22.6%.
Revenue from Ready-to-Wear sales jumped by 26.8% at constant exchange rates and this category
once again occupied an essential place in the brand's product offering, with well-balanced sales of
Women's and Men's collections.
Yves Saint Laurent notched up revenue increases across all of its geographic regions in the first six
months of 2015.
In emerging markets – which contributed 29.5% of the brand's total revenue for the period – sales grew
10.7%. The economic climate in Hong Kong and Mainland China weighed on the brand's performance
in Greater China, although revenue nonetheless climbed by 7.1% in this region based on comparable
data. Business was buoyant in other Asia-Pacific countries as well as in Latin America, but was less
brisk in the Middle East and Eastern Europe.
Sales in Yves Saint Laurent's traditional markets soared by 31.1% on a comparable basis, reflecting the
brand's renewed appeal both with local customers and with tourists from emerging markets. Revenue
growth reached extremely high levels across all of these regions, coming in at 34.2% in Japan, where
the brand was in remarkably high demand, 32.9% in North America, and 29.3% in Western Europe.
Yves Saint Laurent ended the first half of 2015 with recurring operating income of €61 million, versus
around €41 million in the corresponding prior-year period, representing a year-on-year increase of
47.9%. Recurring operating margin reached 13.7%, up by 100 basis points as reported. This rise was
even higher after stripping out the impacts of fluctuations in exchange rates and currency hedges. It was
led by a further increase in gross margin (excluding currency hedges) and a better absorption of fixed
costs, and was achieved despite the brand-development costs incurred to expand the store network
and implement an active brand marketing policy.
Financial information for first-half 2015 – Activity report 2
23 2015 First-Half Report – Kering
Given the growing weight of depreciation and amortisation, EBITDA rose at a faster pace than recurring
operating income, coming in at €80 million. The EBITDA margin was 18.0%, up 170 basis points on
first-half 2014.
As of June 30, 2015, the Yves Saint Laurent brand directly operated 132 stores, including 56 in
emerging markets. There were only four net store additions during the period, as operating investments
were focused more on extending, relocating and refurbishing existing stores.
Overall, the brand's gross operating investments came to nearly €28 million, representing a €5 million
increase on first-half 2014.
Other Luxury brands
(in € millions)
First-half 2015
First-half 2014 Change
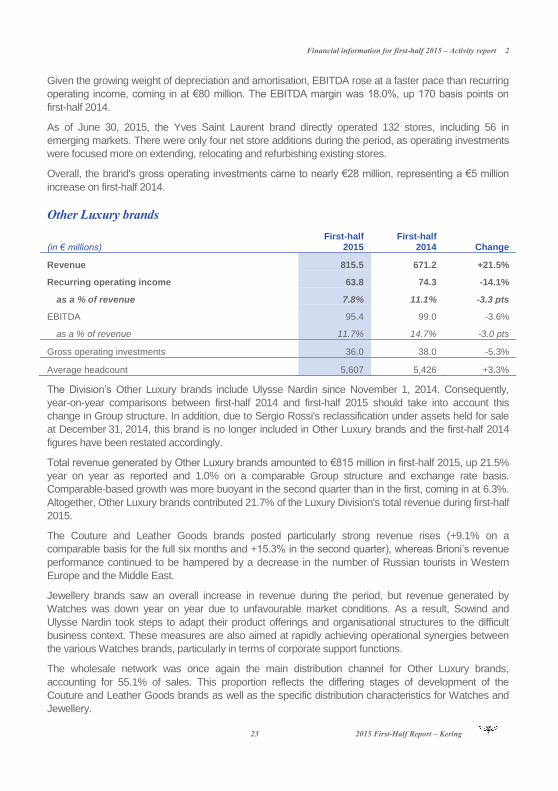
Revenue 815.5 671.2 +21.5%
Recurring operating income 63.8 74.3 -14.1%
as a % of revenue 7.8% 11.1% -3.3 pts
EBITDA 95.4 99.0 -3.6%
as a % of revenue 11.7% 14.7% -3.0 pts
Gross operating investments 36.0 38.0 -5.3%
Average headcount 5,607 5,426 +3.3%
The Division’s Other Luxury brands include Ulysse Nardin since November 1, 2014. Consequently,
year-on-year comparisons between first-half 2014 and first-half 2015 should take into account this
change in Group structure. In addition, due to Sergio Rossi's reclassification under assets held for sale
at December 31, 2014, this brand is no longer included in Other Luxury brands and the first-half 2014
figures have been restated accordingly.
Total revenue generated by Other Luxury brands amounted to €815 million in first-half 2015, up 21.5%
year on year as reported and 1.0% on a comparable Group structure and exchange rate basis.
Comparable-based growth was more buoyant in the second quarter than in the first, coming in at 6.3%.
Altogether, Other Luxury brands contributed 21.7% of the Luxury Division's total revenue during first-half
2015.
The Couture and Leather Goods brands posted particularly strong revenue rises (+9.1% on a
comparable basis for the full six months and +15.3% in the second quarter), whereas Brioni’s revenue
performance continued to be hampered by a decrease in the number of Russian tourists in Western
Europe and the Middle East.
Jewellery brands saw an overall increase in revenue during the period, but revenue generated by
Watches was down year on year due to unfavourable market conditions. As a result, Sowind and
Ulysse Nardin took steps to adapt their product offerings and organisational structures to the difficult
business context. These measures are also aimed at rapidly achieving operational synergies between
the various Watches brands, particularly in terms of corporate support functions.
The wholesale network was once again the main distribution channel for Other Luxury brands,
accounting for 55.1% of sales. This proportion reflects the differing stages of development of the
Couture and Leather Goods brands as well as the specific distribution characteristics for Watches and
Jewellery.

2 Financial information for first-half 2015 – Activity report
2015 First-Half Report – Kering 24
Sales generated in the wholesale network decreased 6.4% year on year on a comparable basis. A
contraction in wholesale sales of Watches, particularly in emerging markets, offset positive revenue
trends for the Couture, Leather Goods and Jewellery brands. In addition, due to the volatility of some of
the markets in which they operate, wholesalers remained generally prudent in the first half of 2015 in
terms of volumes purchased.
Conversely, retail sales in directly-operated stores advanced 13.1% based on comparable data. This
performance was led by the Couture and Leather Goods brands as a result of the successful, controlled
expansion of their exclusive distribution networks. Retails sales in directly-operated stores rose a brisk
8.0% in the first three months of the year and an even sharper 18.0% in the second quarter, boosted by
high tourist numbers.
Ready-to-Wear remained the best-selling product category, making up 30.9% of total Other Luxury
brands revenue, and reported year-on-year sales growth. Watches and Jewellery represented the
second largest revenue generator, accounting for 28.6% of the total, but this category saw contrasting
trends during the period between its two different segments (year-on-year growth for Jewellery and a
contraction for Watches). Leather Goods and Shoes posted the highest year-on-year increase in
revenue among Other Luxury brands for the six months ended June 30, 2015.
Revenue generated in mature markets rose 5.2% on a comparable basis in first-half 2015, whereas
business in emerging markets contracted by 8.9%.
This reflects the fact that the performance of some brands (particularly Brioni and Ulysse Nardin) was
weighed down by weak demand in Eastern Europe and the Middle East, as well as in Hong Kong in the
case of Watches. Sales of other brands continued their upward trend in the Asia-Pacific region,
however, with growth coming in at 2.6%, led by the strong performance of the Couture and Leather
Goods brands, whose revenue in the region advanced 16.1% on a comparable basis thanks to their
increasing appeal and renown in key Asian countries.
In mature markets – which accounted for 73.1% of total sales – Japan and Western Europe were once
again the main growth drivers, powered by an upswing in domestic consumer spending and a sharp
rise in tourism.
Recurring operating income for Other Luxury brands retreated 14.1% to €64 million in first-half 2015,
and recurring operating margin narrowed by 330 basis points to 7.8%, partly due to the adverse impact
of currency hedges. These overall figures also reflect the decrease in profitability reported by the
Watches brands, which suffered a steep drop in gross margin due to the sharp rise in the Swiss franc
and continued unsettled market conditions.
EBITDA came in at just over €95 million, down by a more contained 3.6% on first-half 2014 as reported.
The network of directly-operated stores owned by the Other Luxury brands totalled 317 units as of
June 30, 2015, unchanged from December 31, 2014. There were 16 store openings during the period,
offset by 16 closures. As of June 30, 2015, the network comprised 228 stores in mature markets and 89 in
emerging markets, including 58 in Greater China.
Despite a negative currency effect arising from the translation of foreign currency-denominated capital
expenditures, gross operating investments decreased year on year to €36 million. As in 2014, this
reflects the brands' highly selective and disciplined investment strategies.
Financial information for first-half 2015 – Activity report 2
25 2015 First-Half Report – Kering
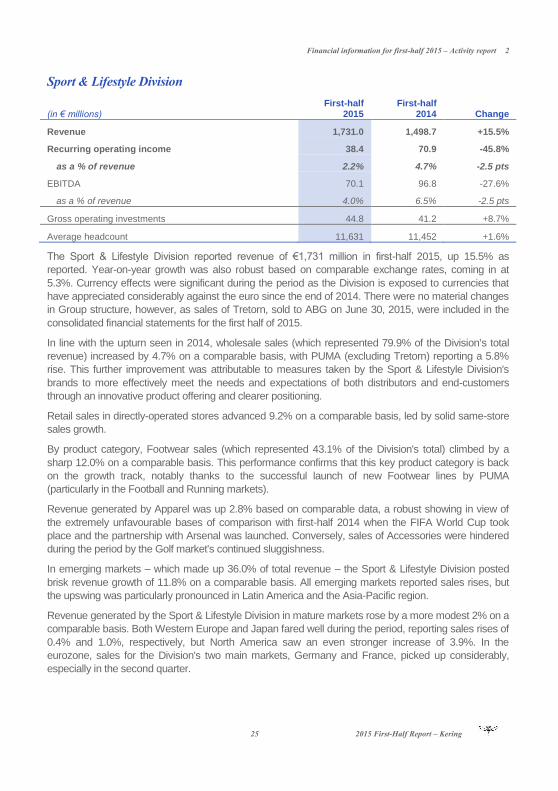
Sport & Lifestyle Division
(in € millions)
First-half 2015
First-half 2014 Change
Revenue 1,731.0 1,498.7 +15.5%
Recurring operating income 38.4 70.9 -45.8%
as a % of revenue 2.2% 4.7% -2.5 pts
EBITDA 70.1 96.8 -27.6%
as a % of revenue 4.0% 6.5% -2.5 pts
Gross operating investments 44.8 41.2 +8.7%
Average headcount 11,631 11,452 +1.6%
The Sport & Lifestyle Division reported revenue of €1,731 million in first-half 2015, up 15.5% as
reported. Year-on-year growth was also robust based on comparable exchange rates, coming in at
5.3%. Currency effects were significant during the period as the Division is exposed to currencies that
have appreciated considerably against the euro since the end of 2014. There were no material changes
in Group structure, however, as sales of Tretorn, sold to ABG on June 30, 2015, were included in the
consolidated financial statements for the first half of 2015.
In line with the upturn seen in 2014, wholesale sales (which represented 79.9% of the Division's total
revenue) increased by 4.7% on a comparable basis, with PUMA (excluding Tretorn) reporting a 5.8%
rise. This further improvement was attributable to measures taken by the Sport & Lifestyle Division's
brands to more effectively meet the needs and expectations of both distributors and end-customers
through an innovative product offering and clearer positioning.
Retail sales in directly-operated stores advanced 9.2% on a comparable basis, led by solid same-store
sales growth.
By product category, Footwear sales (which represented 43.1% of the Division's total) climbed by a
sharp 12.0% on a comparable basis. This performance confirms that this key product category is back
on the growth track, notably thanks to the successful launch of new Footwear lines by PUMA
(particularly in the Football and Running markets).
Revenue generated by Apparel was up 2.8% based on comparable data, a robust showing in view of
the extremely unfavourable bases of comparison with first-half 2014 when the FIFA World Cup took
place and the partnership with Arsenal was launched. Conversely, sales of Accessories were hindered
during the period by the Golf market's continued sluggishness.
In emerging markets – which made up 36.0% of total revenue – the Sport & Lifestyle Division posted
brisk revenue growth of 11.8% on a comparable basis. All emerging markets reported sales rises, but
the upswing was particularly pronounced in Latin America and the Asia-Pacific region.
Revenue generated by the Sport & Lifestyle Division in mature markets rose by a more modest 2% on a
comparable basis. Both Western Europe and Japan fared well during the period, reporting sales rises of
0.4% and 1.0%, respectively, but North America saw an even stronger increase of 3.9%. In the
eurozone, sales for the Division's two main markets, Germany and France, picked up considerably,
especially in the second quarter.
2 Financial information for first-half 2015 – Activity report
2015 First-Half Report – Kering 26
The Sport & Lifestyle Division ended the first half of 2015 with recurring operating income of €38 million,
compared with €71 million in the same period of 2014, and the recurring operating margin narrowed by
250 basis points to 2.2%. This fall in profitability mainly reflects the lower margin recorded by PUMA,
primarily due to higher cost of goods sold in light of the brand's significant exposure to the US dollar, as
well as to an expected increase in marketing and communications costs during the period.
EBITDA totalled around €70 million, representing a year-on-year decrease of 27.6%.
Gross operating investments were contained at €45 million in the first six months of 2015, with the year-
on-year rise primarily stemming from currency effects.
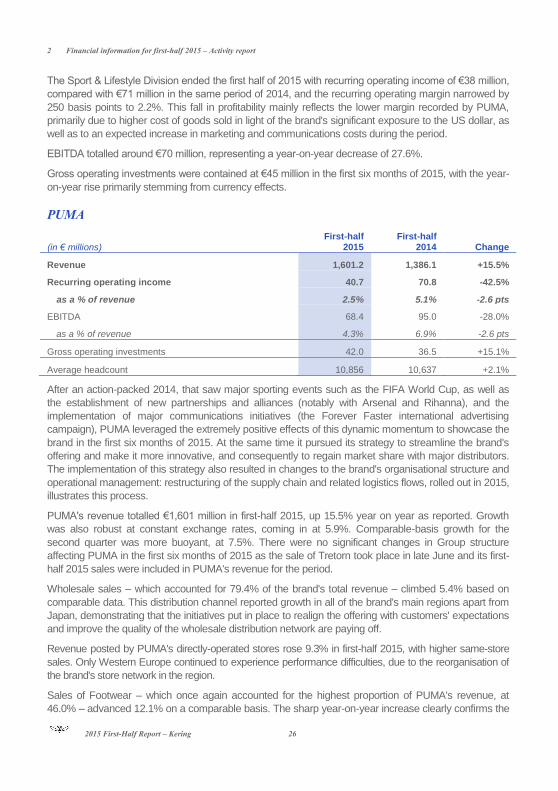
PUMA
(in € millions)
First-half 2015
First-half 2014 Change
Revenue 1,601.2 1,386.1 +15.5%
Recurring operating income 40.7 70.8 -42.5%
as a % of revenue 2.5% 5.1% -2.6 pts
EBITDA 68.4 95.0 -28.0%
as a % of revenue 4.3% 6.9% -2.6 pts
Gross operating investments 42.0 36.5 +15.1%
Average headcount 10,856 10,637 +2.1%
After an action-packed 2014, that saw major sporting events such as the FIFA World Cup, as well as
the establishment of new partnerships and alliances (notably with Arsenal and Rihanna), and the
implementation of major communications initiatives (the Forever Faster international advertising
campaign), PUMA leveraged the extremely positive effects of this dynamic momentum to showcase the
brand in the first six months of 2015. At the same time it pursued its strategy to streamline the brand's
offering and make it more innovative, and consequently to regain market share with major distributors.
The implementation of this strategy also resulted in changes to the brand's organisational structure and
operational management: restructuring of the supply chain and related logistics flows, rolled out in 2015,
illustrates this process.
PUMA's revenue totalled €1,601 million in first-half 2015, up 15.5% year on year as reported. Growth
was also robust at constant exchange rates, coming in at 5.9%. Comparable-basis growth for the
second quarter was more buoyant, at 7.5%. There were no significant changes in Group structure
affecting PUMA in the first six months of 2015 as the sale of Tretorn took place in late June and its first-
half 2015 sales were included in PUMA's revenue for the period.
Wholesale sales – which accounted for 79.4% of the brand's total revenue – climbed 5.4% based on
comparable data. This distribution channel reported growth in all of the brand's main regions apart from
Japan, demonstrating that the initiatives put in place to realign the offering with customers' expectations
and improve the quality of the wholesale distribution network are paying off.
Revenue posted by PUMA's directly-operated stores rose 9.3% in first-half 2015, with higher same-store
sales. Only Western Europe continued to experience performance difficulties, due to the reorganisation of
the brand's store network in the region.
Sales of Footwear – which once again accounted for the highest proportion of PUMA's revenue, at
46.0% – advanced 12.1% on a comparable basis. The sharp year-on-year increase clearly confirms the
Financial information for first-half 2015 – Activity report 2
27 2015 First-Half Report – Kering
brand's recovery in this key product category following the initial signs of a turnaround in the third
quarter of 2014. This improved performance was driven by the launch of new product ranges in the
Running, Training and Football categories, which proved very popular both with distributors and end-
customers. One of the most emblematic recent launches was Ignite – a running shoe available in
performance as well as lifestyle versions.
Apparel sales (33.9% of PUMA's total revenue for first-half 2015) climbed 3.0% on a comparable basis.
Growth for this category was once again very solid in all of the brand's regions, except for Europe due to
an extremely unfavourable base of comparison in first-half 2014 due to sales of replica football jerseys
during the FIFA World Cup.
Emerging markets made up 37.8% of PUMA's first-half 2015 revenue, versus 35.9% for the same
period of 2014 as reported. Sales in these markets advanced 12.0% on a comparable basis. PUMA's
revenue in Mainland China surged by 20.6%, reflecting the successful measures launched in 2013 to
reorganise the brand's distribution in the country. Sales trends were also extremely positive in the
brand's other major emerging markets, especially Latin America, India and Turkey.
In Western Europe, revenue edged up 0.6% based on comparable data, led by a more marked sales
recovery in eurozone countries, particularly Germany and France.
In North America, sales growth was once again brisk, up 5.3% on a comparable basis. The Footwear
category posted the highest year-on-year revenue rise in this region, a very encouraging sign.
In Japan, the brand returned to growth (up 1.0% on a comparable basis) despite ongoing tough
conditions in the Golf accessories market.
PUMA's contribution to the Group's recurring operating income amounted to €41 million in the first six
months of 2015 and the brand's recurring operating margin decreased by 260 basis points to 2.5%.
EBITDA contracted year on year to €68 million.
The €30 million decrease in recurring operating income in absolute terms chiefly stemmed from an
increase in operating expenses – primarily communication and marketing costs incurred as part of
PUMA's announced brand investment plan.
The lower recurring operating margin was partly attributable to adverse currency effects as the rise in
the US dollar pushed up supply costs and the brand’s currency hedges and targeted price increases
were not sufficient to offset the resulting negative impact on gross margin. Consequently, PUMA’s gross
margin narrowed by 100 basis points as reported, but at constant exchange rates it improved slightly
year on year. The decline in recurring operating margin was also due to higher marketing and
communication costs as a percentage of revenue.
As of June 30, 2015 PUMA's directly-operated retail network included 620 stores, down four from
December 31, 2014.
Gross operating investments amounted to €42 million, up 15.1% on first-half 2014, reflecting the
combined impact of the conversion into euros of investments undertaken outside the eurozone and the
brand's continuing measures to overhaul its supply chain and information systems.
2 Financial information for first-half 2015 – Activity report
2015 First-Half Report – Kering 28
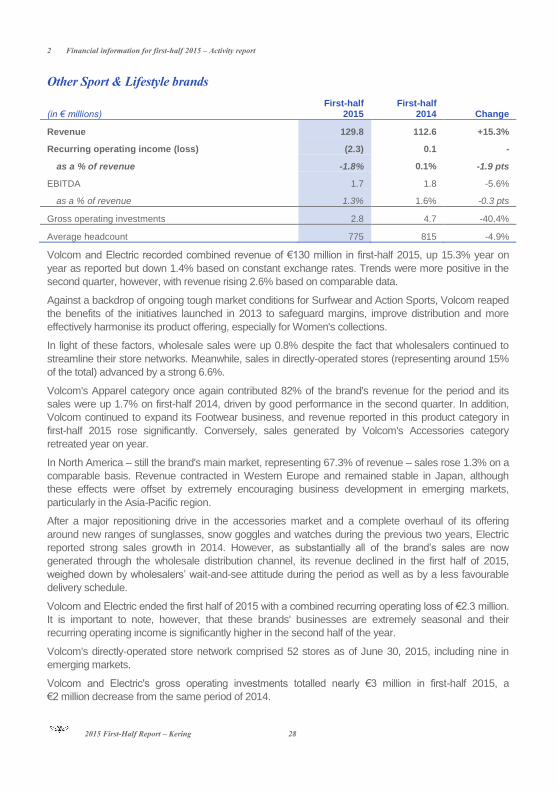
Other Sport & Lifestyle brands
(in € millions)
First-half 2015
First-half 2014 Change
Revenue 129.8 112.6 +15.3%
Recurring operating income (loss) (2.3) 0.1 -
as a % of revenue -1.8% 0.1% -1.9 pts
EBITDA 1.7 1.8 -5.6%
as a % of revenue 1.3% 1.6% -0.3 pts
Gross operating investments 2.8 4.7 -40.4%
Average headcount 775 815 -4.9%
Volcom and Electric recorded combined revenue of €130 million in first-half 2015, up 15.3% year on
year as reported but down 1.4% based on constant exchange rates. Trends were more positive in the
second quarter, however, with revenue rising 2.6% based on comparable data.
Against a backdrop of ongoing tough market conditions for Surfwear and Action Sports, Volcom reaped
the benefits of the initiatives launched in 2013 to safeguard margins, improve distribution and more
effectively harmonise its product offering, especially for Women's collections.
In light of these factors, wholesale sales were up 0.8% despite the fact that wholesalers continued to
streamline their store networks. Meanwhile, sales in directly-operated stores (representing around 15%
of the total) advanced by a strong 6.6%.
Volcom's Apparel category once again contributed 82% of the brand's revenue for the period and its
sales were up 1.7% on first-half 2014, driven by good performance in the second quarter. In addition,
Volcom continued to expand its Footwear business, and revenue reported in this product category in
first-half 2015 rose significantly. Conversely, sales generated by Volcom's Accessories category
retreated year on year.
In North America – still the brand's main market, representing 67.3% of revenue – sales rose 1.3% on a
comparable basis. Revenue contracted in Western Europe and remained stable in Japan, although
these effects were offset by extremely encouraging business development in emerging markets,
particularly in the Asia-Pacific region.
After a major repositioning drive in the accessories market and a complete overhaul of its offering
around new ranges of sunglasses, snow goggles and watches during the previous two years, Electric
reported strong sales growth in 2014. However, as substantially all of the brand’s sales are now
generated through the wholesale distribution channel, its revenue declined in the first half of 2015,
weighed down by wholesalers’ wait-and-see attitude during the period as well as by a less favourable
delivery schedule.
Volcom and Electric ended the first half of 2015 with a combined recurring operating loss of €2.3 million.
It is important to note, however, that these brands' businesses are extremely seasonal and their
recurring operating income is significantly higher in the second half of the year.
Volcom's directly-operated store network comprised 52 stores as of June 30, 2015, including nine in
emerging markets.
Volcom and Electric's gross operating investments totalled nearly €3 million in first-half 2015, a
€2 million decrease from the same period of 2014.
Financial information for first-half 2015 – Activity report 2
29 2015 First-Half Report – Kering
Corporate
The "Corporate" segment comprises (i) Kering's corporate departments and headquarters teams, (ii)
Shared Services, which provide services to the brands, (iii) the Kering Sustainability Department, which
is responsible for the sustainability initiative launched by Kering in 2011, and (iv) Kering's Sourcing
Department (KGS), a profit centre for services that it provides on behalf of non-Group brands, such as
companies from the former Redcats group.
It also incorporates Kering Eyewear, which leads the Group's project of bringing its Eyewear business
(sunglasses and frames) fully in-house.
Costs recorded by the Corporate segment for first-half 2015 totalled around €71 million, up by a
contained 20% year on year. This increase was due to the transfer to the Corporate entity of new
assignments and cross-business projects carried out on behalf of the Group's brands.
Comments on the Group's financial position
Kering’s consolidated statement of financial position as of June 30 partially reflects the impact of the
seasonal nature of the Group’s activities, notably in the Sport & Lifestyle Division:
(in € millions) June 30, 2015 June 30, 2014 Dec. 31, 2014
Goodwill, brands and other intangible assets, net 15,100.2 14,360.9 14,788.0
Other non-current assets (liabilities), net 502.7 4.3 310.0
Current assets, net 1,554.7 1,038.5 924.4
Provisions (365.0) (391.2) (394.0)
Capital employed 16,792.6 15,012.5 15,628.4
Net assets (liabilities) held for sale 28.0 (65.7) 24.6
Total equity 11,483.3 11,041.8 11,262.3
Net debt 5,337.3 3,905.0 4,390.7
Capital employed
As of June 30, 2015, capital employed was €1,164 million higher than as of December 31, 2014,
primarily reflecting recurring transactions during the period and the impact on the consolidated financial
statements of the depreciation of the euro against the other major currencies.
Goodwill, brands and other intangible assets, net
As of June 30, 2015, "Goodwill, brands and other intangible assets, net" represented 63% of total
assets (versus 64% as of December 31, 2014 and 65% as of June 30, 2014) and mainly comprised:
goodwill amounting to €3,826 million, of which €2,733 million related to the Luxury Division
and €1,093 million to the Sport & Lifestyle Division.
2 Financial information for first-half 2015 – Activity report
2015 First-Half Report – Kering 30
brands valued at €10,880 million, of which €6,960 million for the Luxury Division and
€3,920 million for the Sport & Lifestyle Division. The increase in this item between
December 31, 2014 and June 30, 2015 was primarily attributable to the amount recognised
for the Ulysse Nardin brand as part of the provisional purchase price allocation process.
Net of deferred tax liabilities relating to brands (which are recorded under "Other non-current assets
(liabilities), net", as shown below), this item came to €12,348 million as of June 30, 2015.
Other non-current assets, net
(in € millions) June 30, 2015 June 30, 2014 Dec. 31, 2014
Property, plant and equipment, net 2,003.1 1,683.4 1,887.2
Net deferred tax liabilities (2,035.2) (2,036.1) (2,033.8)
Investments in equity-accounted companies 21.6 19.1 23.2
Non-current financial assets, net 455.1 302.2 397.2
Other 58.1 35.7 36.2
Other non-current assets, net 502.7 4.3 310.0
"Property, plant and equipment, net" rose in first-half 2015 due to the impact of changes in Group
structure (notably the first-time consolidation of Ulysse Nardin as of November 1, 2014), recurring
transactions (acquisitions/disposals and depreciation), and exchange rate fluctuations.
Deferred tax liabilities chiefly relate to brands recognised on business combinations, notably Gucci and
PUMA.
As of June 30, 2015, investments in equity-accounted companies comprised shares in Tomas Maier,
Joseph Altuzarra and Wilderness.
Current assets, net
As of June 30, 2015, net current assets totalled €1,555 million, versus €1,038 million as of
June 30, 2014 and €924 million as of December 31, 2014. This item breaks down as follows:
(in € millions) June 30, 2015 June 30, 2014 Dec. 31, 2014
Inventories 2,474.0 2,079.7 2,234.7
Trade receivables 1,115.2 988.2 1,030.0
Trade payables (1,051.1) (929.8) (982.8)
Current tax receivables/payables (181.5) (271.5) (139.5)
Other current assets and liabilities (801.9) (828.1) (1,218.0)
Current assets, net 1,554.7 1,038.5 924.4
As of June 30, 2015, Kering's net current assets were €630 million higher than at December 31, 2014.
After stripping out the impact of fluctuations in exchange rates and changes in Group structure, changes
in working capital requirement led to a cash outflow of €428 million.
Financial information for first-half 2015 – Activity report 2
31 2015 First-Half Report – Kering
Changes in inventories (adjusted for the impact of fluctuations in exchange rates and changes in Group
structure) resulted in a cash outflow of €253 million during the first half of 2015. The increase in
inventories during the period reflects (i) changes in the Luxury Division's sales volumes and (ii) higher
volumes of purchases by PUMA in order to maintain sales levels and – to a lesser extent – phasing of
inventory build-up.
Excluding the impact of fluctuations in exchange rates and changes in Group structure, the increase in
trade receivables during first-half 2015 led to a €46 million cash outflow. However this impact was partly
offset by the rise in trade payables which generated a €34 million cash inflow.
The increase in the net liability recorded under "Other current assets and liabilities" gave rise to a
€151 million cash outflow in the first half of 2015, chiefly generated by the expenditure incurred for
Gucci's restructuring operations and the settlement of the first of three equal payments for the
aggregate €90 million in compensation owed to Safilo in early January 2015.
Provisions
(in € millions)
June 30, 2015
June 30, 2014
Dec. 31, 2014
Provisions for pensions and other post-employment benefits 136.5 102.3 119.1
Other provisions 228.5 288.9 274.9
Provisions 365.0 391.2 394.0
As of June 30, 2015, the portion of provisions for pensions and other post-employment benefits that will
not give rise to cash outflows in the coming 12 months (recorded under non-current liabilities) amounted
to €129 million, slightly higher than the December 31, 2014 figure as a result of the first-time
consolidation of Ulysse Nardin.
Other provisions decreased in first-half 2015 compared with year-end 2014, mainly reflecting the
reversal of a provision for tax risks as the risks concerned were extinguished during the period.
Net assets (liabilities) held for sale
This item results from applying IFRS 5 to operations that were discontinued or sold during the period, or
were in the process of being sold. As of June 30, 2015, these operations corresponded to the residual
assets of Sergio Rossi.
Equity
(in € millions) June 30, 2015 June 30, 2014 Dec. 31, 2014
Equity attributable to owners of the parent 10,807.1 10,436.5 10,634.1
Equity attributable to non-controlling interests 676.2 605.3 628.2
Total equity 11,483.3 11,041.8 11,262.3
As of June 30, 2015, Kering’s total equity was higher than the year-end 2014 figure, with equity
attributable to owners of the parent up by €173 million, mainly due to the combined impact of:
€423 million in net income attributable to owners of the parent for first-half 2015;
a €315 million cash dividend paid by Kering;
a €169 million positive effect from currency translation adjustments;
a €28 million negative effect from fair value remeasurements of cash flow hedges.

2 Financial information for first-half 2015 – Activity report
2015 First-Half Report – Kering 32
During the first half of 2015 the number of shares held in treasury increased by 6,061 shares. As of
June 30, 2015, Kering's share capital was made up of 126,279,322 shares with a par value of €4 each.
At that date, Kering held no treasury shares in connection with the liquidity agreement (nil as of
December 31, 2014). Excluding the liquidity agreement, Kering held 27,598 shares in treasury as of
June 30, 2015, compared with 21,537 as of December 31, 2014.
As of June 30, 2015, equity attributable to non-controlling interests mainly related to PUMA for a total of
€533 million (versus €539 million as of December 31, 2014), and the Luxury Division for €134 million
(€88 million as of December 31, 2014).
The amount of equity attributable to non-controlling interests was up slightly on the December 31, 2014
figure.
Net debt
The Group’s net debt is traditionally higher at the end of the first half of the fiscal year than at
December 31 due to the dividend payout date and, to some extent, to the seasonal nature of its
business. Kering's net debt stood at €5,337 million as of June 30, 2015, breaking down as follows:
(in € millions) June 30, 2015 June 30, 2014 Dec. 31, 2014
Bonds 3,453.9 2,893.4 3,390.4
Bank borrowings 316.9 298.0 264.0
Commercial paper 1,728.8 1,197.0 969.8
Other borrowings 760.6 742.4 856.4
Gross borrowings(1)
6,260.2 5,130.8 5,480.6
Fair value hedges (interest rate) - - -
Cash and cash equivalents (922.9) (1,225.8) (1,089.9)
Net debt 5,337.3 3,905.0 4,390.7
(1) Excluding the financing of customer loans.
As of June 30, 2015, the Group’s gross borrowings included €211 million concerning put options
granted to minority shareholders compared with €310 million as of December 31, 2014.
In the first half of 2015, Kering redeemed the €750 million worth of bonds that matured in April 2015.
These bonds comprised a first tranche issued in 2010 for €500 million which was topped up in 2012 by
a €250 million tranche, with a 3.75% coupon.
New borrowings during the period included an aggregate €818 million worth of bond debt, mainly
comprising (i) a €500 million issue of seven-year bonds with a fixed-rate annual coupon of 0.875%, and
(ii) two issues of notes in foreign currency – a USD 150 million issue in March 2015 of five-year floating-
rate notes, and a USD 150 million issue in June 2015 of six-year fixed-rate notes with an annual coupon
of 2.887%.
In the first half of 2014, Kering redeemed the remaining €550.1 million of the bond that was issued in
2009 and matured in April 2014. This bond was originally issued in two tranches representing an
aggregate €800 million, of which €249.9 million was redeemed in 2011. Also during the first six months
of 2014, the Group redeemed the €150 million bond issued in 2009.
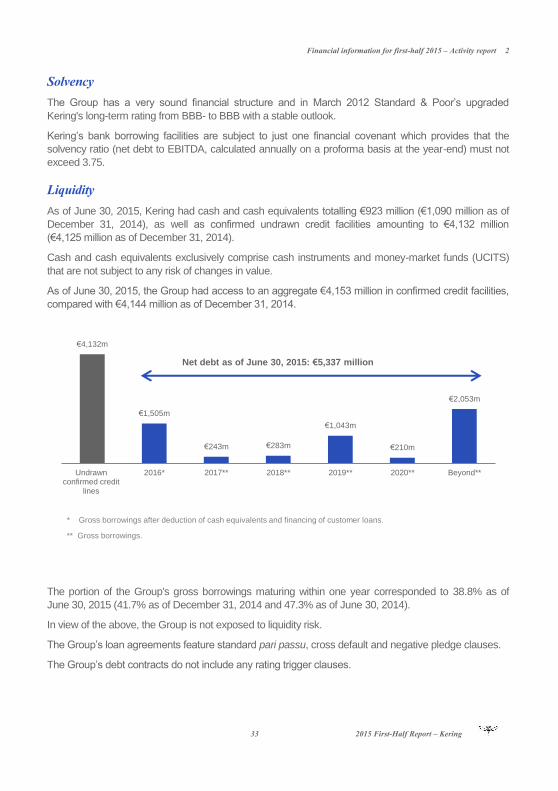
Financial information for first-half 2015 – Activity report 2
33 2015 First-Half Report – Kering
Solvency
The Group has a very sound financial structure and in March 2012 Standard & Poor’s upgraded
Kering's long-term rating from BBB- to BBB with a stable outlook.
Kering’s bank borrowing facilities are subject to just one financial covenant which provides that the
solvency ratio (net debt to EBITDA, calculated annually on a proforma basis at the year-end) must not
exceed 3.75.
Liquidity
As of June 30, 2015, Kering had cash and cash equivalents totalling €923 million (€1,090 million as of
December 31, 2014), as well as confirmed undrawn credit facilities amounting to €4,132 million
(€4,125 million as of December 31, 2014).
Cash and cash equivalents exclusively comprise cash instruments and money-market funds (UCITS)
that are not subject to any risk of changes in value.
As of June 30, 2015, the Group had access to an aggregate €4,153 million in confirmed credit facilities,
compared with €4,144 million as of December 31, 2014.
The portion of the Group's gross borrowings maturing within one year corresponded to 38.8% as of
June 30, 2015 (41.7% as of December 31, 2014 and 47.3% as of June 30, 2014).
In view of the above, the Group is not exposed to liquidity risk.
The Group’s loan agreements feature standard pari passu, cross default and negative pledge clauses.
The Group’s debt contracts do not include any rating trigger clauses.
€4,132m
€1,505m
€243m €283m
€1,043m
€210m
€2,053m
Undrawnconfirmed credit
lines
2016* 2017** 2018** 2019** 2020** Beyond**
* Gross borrowings after deduction of cash equivalents and financing of customer loans.
** Gross borrowings.
Net debt as of June 30, 2015: €5,337 million
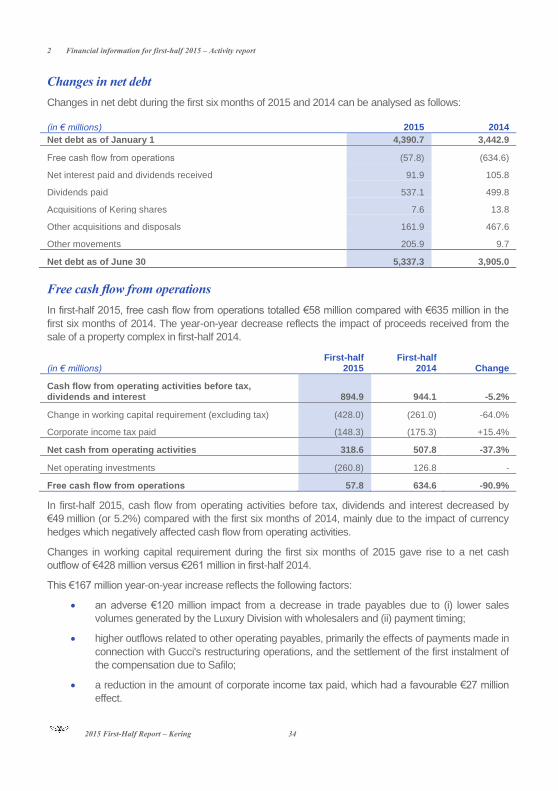
2 Financial information for first-half 2015 – Activity report
2015 First-Half Report – Kering 34
Changes in net debt
Changes in net debt during the first six months of 2015 and 2014 can be analysed as follows:
(in € millions) 2015 2014
Net debt as of January 1 4,390.7 3,442.9
Free cash flow from operations (57.8) (634.6)
Net interest paid and dividends received 91.9 105.8
Dividends paid 537.1 499.8
Acquisitions of Kering shares 7.6 13.8
Other acquisitions and disposals 161.9 467.6
Other movements 205.9 9.7
Net debt as of June 30 5,337.3 3,905.0
Free cash flow from operations
In first-half 2015, free cash flow from operations totalled €58 million compared with €635 million in the
first six months of 2014. The year-on-year decrease reflects the impact of proceeds received from the
sale of a property complex in first-half 2014.
(in € millions)
First-half 2015
First-half 2014 Change
Cash flow from operating activities before tax, dividends and interest 894.9 944.1 -5.2%
Change in working capital requirement (excluding tax) (428.0) (261.0) -64.0%
Corporate income tax paid (148.3) (175.3) +15.4%
Net cash from operating activities 318.6 507.8 -37.3%
Net operating investments (260.8) 126.8 -
Free cash flow from operations 57.8 634.6 -90.9%
In first-half 2015, cash flow from operating activities before tax, dividends and interest decreased by
€49 million (or 5.2%) compared with the first six months of 2014, mainly due to the impact of currency
hedges which negatively affected cash flow from operating activities.
Changes in working capital requirement during the first six months of 2015 gave rise to a net cash
outflow of €428 million versus €261 million in first-half 2014.
This €167 million year-on-year increase reflects the following factors:
an adverse €120 million impact from a decrease in trade payables due to (i) lower sales
volumes generated by the Luxury Division with wholesalers and (ii) payment timing;
higher outflows related to other operating payables, primarily the effects of payments made in
connection with Gucci's restructuring operations, and the settlement of the first instalment of
the compensation due to Safilo;
a reduction in the amount of corporate income tax paid, which had a favourable €27 million
effect.
Financial information for first-half 2015 – Activity report 2
35 2015 First-Half Report – Kering
The net cash outflow relating to net operating investments totalled €261 million in the first half of 2015.
The net cash inflow recorded for first-half 2014 relating to net operating investments included
€341 million in proceeds from disposals of property, plant and equipment and intangible assets
(primarily from the sale of a property complex).
In first-half 2015, gross operating investments amounted to €303 million, up 41.3% year on year.
However, adjusted for the first instalment paid in January 2015 of the compensation due to Safilo, they
rose by 27.3%.
They break down as follows:
(in € millions)
First-half 2015
First-half 2014 Change
Luxury Division 161.0 146.5 +9.9%
Sport & Lifestyle Division 44.8 41.2 +8.7%
Corporate 97.2 26.8 -
Gross operating investments 303.0 214.5 +41.3%
The 9.9% increase recorded by the Luxury Division was mainly attributable to currency effects. The
year-on-year stability at constant exchange rates reflects the Division's focus on organic growth on a
same-store basis and on consolidating its existing store network, amid a more unsettled operating
environment for the luxury industry. The increase reported by the Sport & Lifestyle Division was also
primarily due to currency effects. In the first six months of 2015, 43% of the Group’s gross operating
investments concerned the store network (versus 57% in first-half 2014).
The year-on-year increase in Corporate gross operating investments (excluding the Safilo settlement)
chiefly corresponds to investments in information systems and real-estate projects, notably in Milan and
Paris.
Available cash flow
Available cash flow for the period amounted to a negative €34 million, against a positive €529 million for
the six months ended June 30, 2014.
Net cash outflows relating to net finance costs were stable year on year and included €92 million in
interest paid and dividends received (versus €106 million in first-half 2014).
Adjusted for cash outflows relating to non-recurring items, available cash flow totalled €13 million
compared with €554 million in the first six months of 2014, when the total included the impact of
proceeds received from the sale of a property complex.
Dividends paid
Dividends paid in first-half 2015 included €32 million paid to minority shareholders of consolidated
subsidiaries (€27 million in first-half 2014), of which €26 million related to PUMA and its subsidiaries
(€16 million in first-half 2014). The cash dividend paid by Kering to its own shareholders in first-half 2015
amounted to €505 million (including the interim dividend paid on January 26, 2015).
Acquisitions and disposals
During the first six months of 2015 Kering did not purchase any PUMA shares and kept its interest in
the company at 85.81%, unchanged from year-end 2014.
2 Financial information for first-half 2015 – Activity report
2015 First-Half Report – Kering 36
The amount recorded under "Acquisitions of Kering shares” for the period corresponds to recurring cash
flows arising on purchases and sales of treasury shares under the liquidity agreement as well as the net
cash outflow generated by the purchase of 133,021 shares for the Group's stock option and free share
plans.
The impact of other acquisitions and disposals of securities during first-half 2015 mainly includes
(i) €74 million in financial investments made by the Group, primarily concerning real-estate entities,
(ii) €85 million in financial cash flows related to discontinued operations, including a payment recognised
for the transfer of the assets of the Redcats UK pension fund to an insurer, and (iii) the recapitalisation
of Movitex in January 2015.
In the first half of 2014, the impact of other acquisitions and disposals of securities mainly corresponded
to €394 million in financial cash flows related to discontinued operations (Redcats), notably including
cash outflows to finance the trust set up at the time of the sale of La Redoute.
Other movements
This item primarily includes the impact of (i) fluctuations in exchange rates, and (ii) fair value
remeasurements of financial instruments in accordance with IAS 32 and IAS 39. In first-half 2015 the
impact of fluctuations in exchange rates related to the balance sheet remeasurement of items
denominated in foreign currencies, notably the Swiss franc and the US dollar.
Results and share capital of the parent company
The parent company ended first-half 2015 with net income of €302 million, compared with €26 million
for the first six months of 2014.
The first-half 2015 net income figure includes €382 million in dividends received from subsidiaries
(versus €385 million one year earlier).
As of June 30, 2015, Kering’s share capital comprised 126,279,322 shares with a par value of €4 each.
Transactions with related parties
Transactions with related parties in the first half of 2015 are described in Note 21 to the condensed
consolidated interim financial statements.
Subsequent events
No significant event has occurred between June 30, 2015 and July 27, 2015, when the Board of
Directors approved the condensed consolidated interim financial statements.
Financial information for first-half 2015 – Activity report 2
37 2015 First-Half Report – Kering
Main risks and uncertainties for the remaining six months of the year
The main risks and uncertainties to which the Group could be exposed in the second half of 2015 are
described in the Risk Management chapter of the 2014 Reference Document, as well as in Note 30 to
the 2014 consolidated financial statements.
Outlook
Positioned in structurally high-growth markets, Kering has very solid fundamentals and a portfolio of
powerful brands with strong potential.
2015 will see the continuation of PUMA's relaunch plan as well as the rollout of dedicated action plans
for each of the Luxury Division's brands, focusing – as in 2014 – on achieving profitable organic growth.
In an economic environment that remains unsettled, the recent currency fluctuations are likely, at this
stage, to have a favourable impact on sales, but could ultimately have mixed effects on the Group's
results. In this context, Kering intends to pursue its brands’ strategy of rigorously managing and
allocating its resources to optimise operating performance and improve cash flow generation.
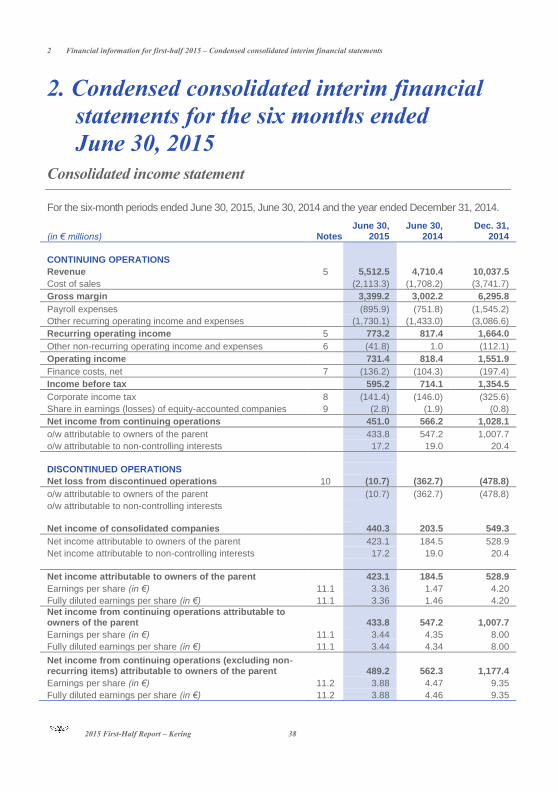
2 Financial information for first-half 2015 – Condensed consolidated interim financial statements
2015 First-Half Report – Kering 38
2. Condensed consolidated interim financial
statements for the six months ended
June 30, 2015
Consolidated income statement
For the six-month periods ended June 30, 2015, June 30, 2014 and the year ended December 31, 2014.
(in € millions) Notes June 30,
2015 June 30,
2014 Dec. 31,
2014
CONTINUING OPERATIONS
Revenue 5 5,512.5 4,710.4 10,037.5
Cost of sales
(2,113.3) (1,708.2) (3,741.7)
Gross margin 3,399.2 3,002.2 6,295.8
Payroll expenses
(895.9) (751.8) (1,545.2)
Other recurring operating income and expenses (1,730.1) (1,433.0) (3,086.6)
Recurring operating income 5 773.2 817.4 1,664.0
Other non-recurring operating income and expenses 6 (41.8) 1.0 (112.1)
Operating income
731.4 818.4 1,551.9
Finance costs, net 7 (136.2) (104.3) (197.4)
Income before tax
595.2 714.1 1,354.5
Corporate income tax 8 (141.4) (146.0) (325.6)
Share in earnings (losses) of equity-accounted companies 9 (2.8) (1.9) (0.8)
Net income from continuing operations
451.0 566.2 1,028.1
o/w attributable to owners of the parent 433.8 547.2 1,007.7
o/w attributable to non-controlling interests 17.2 19.0 20.4
DISCONTINUED OPERATIONS
Net loss from discontinued operations 10 (10.7) (362.7) (478.8)
o/w attributable to owners of the parent (10.7) (362.7) (478.8)
o/w attributable to non-controlling interests
Net income of consolidated companies 440.3 203.5 549.3
Net income attributable to owners of the parent
423.1 184.5 528.9
Net income attributable to non-controlling interests
17.2 19.0 20.4
Net income attributable to owners of the parent 423.1 184.5 528.9
Earnings per share (in €) 11.1 3.36 1.47 4.20
Fully diluted earnings per share (in €) 11.1 3.36 1.46 4.20
Net income from continuing operations attributable to owners of the parent 433.8 547.2 1,007.7
Earnings per share (in €) 11.1 3.44 4.35 8.00
Fully diluted earnings per share (in €) 11.1 3.44 4.34 8.00
Net income from continuing operations (excluding non-recurring items) attributable to owners of the parent 489.2 562.3 1,177.4
Earnings per share (in €) 11.2 3.88 4.47 9.35
Fully diluted earnings per share (in €) 11.2 3.88 4.46 9.35
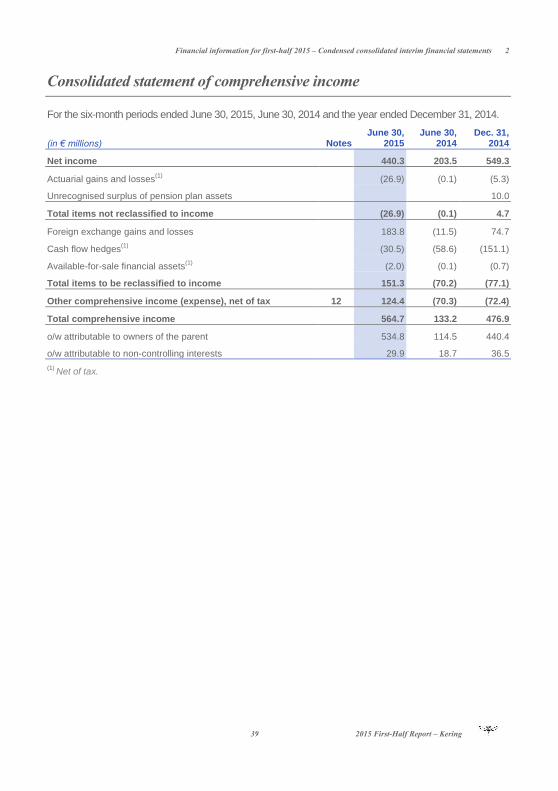
Financial information for first-half 2015 – Condensed consolidated interim financial statements 2
39 2015 First-Half Report – Kering
Consolidated statement of comprehensive income
For the six-month periods ended June 30, 2015, June 30, 2014 and the year ended December 31, 2014.
(in € millions) Notes June 30,
2015 June 30,
2014 Dec. 31,
2014
Net income
440.3 203.5 549.3
Actuarial gains and losses(1)
(26.9) (0.1) (5.3)
Unrecognised surplus of pension plan assets 10.0
Total items not reclassified to income
(26.9) (0.1) 4.7
Foreign exchange gains and losses 183.8 (11.5) 74.7
Cash flow hedges(1)
(30.5) (58.6) (151.1)
Available-for-sale financial assets(1)
(2.0) (0.1) (0.7)
Total items to be reclassified to income
151.3 (70.2) (77.1)
Other comprehensive income (expense), net of tax 12 124.4 (70.3) (72.4)
Total comprehensive income
564.7 133.2 476.9
o/w attributable to owners of the parent 534.8 114.5 440.4
o/w attributable to non-controlling interests 29.9 18.7 36.5
(1) Net of tax.
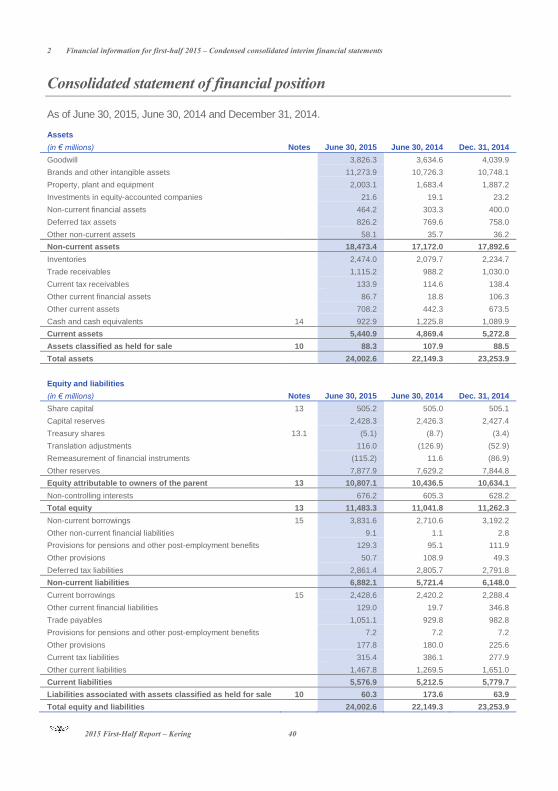
2 Financial information for first-half 2015 – Condensed consolidated interim financial statements
2015 First-Half Report – Kering 40
Consolidated statement of financial position
As of June 30, 2015, June 30, 2014 and December 31, 2014.
Assets
(in € millions) Notes June 30, 2015 June 30, 2014 Dec. 31, 2014
Goodwill
3,826.3 3,634.6 4,039.9
Brands and other intangible assets
11,273.9 10,726.3 10,748.1
Property, plant and equipment
2,003.1 1,683.4 1,887.2
Investments in equity-accounted companies
21.6 19.1 23.2
Non-current financial assets
464.2 303.3 400.0
Deferred tax assets
826.2 769.6 758.0
Other non-current assets 58.1 35.7 36.2
Non-current assets
18,473.4 17,172.0 17,892.6
Inventories 2,474.0 2,079.7 2,234.7
Trade receivables
1,115.2 988.2 1,030.0
Current tax receivables
133.9 114.6 138.4
Other current financial assets
86.7 18.8 106.3
Other current assets
708.2 442.3 673.5
Cash and cash equivalents 14 922.9 1,225.8 1,089.9
Current assets
5,440.9 4,869.4 5,272.8
Assets classified as held for sale 10 88.3 107.9 88.5
Total assets 24,002.6 22,149.3 23,253.9
Equity and liabilities
(in € millions) Notes June 30, 2015 June 30, 2014 Dec. 31, 2014
Share capital 13 505.2 505.0 505.1
Capital reserves
2,428.3 2,426.3 2,427.4
Treasury shares 13.1 (5.1) (8.7) (3.4)
Translation adjustments
116.0 (126.9) (52.9)
Remeasurement of financial instruments
(115.2) 11.6 (86.9)
Other reserves
7,877.9 7,629.2 7,844.8
Equity attributable to owners of the parent 13 10,807.1 10,436.5 10,634.1
Non-controlling interests
676.2 605.3 628.2
Total equity 13 11,483.3 11,041.8 11,262.3
Non-current borrowings 15 3,831.6 2,710.6 3,192.2
Other non-current financial liabilities
9.1 1.1 2.8
Provisions for pensions and other post-employment benefits
129.3 95.1 111.9
Other provisions
50.7 108.9 49.3
Deferred tax liabilities
2,861.4 2,805.7 2,791.8
Non-current liabilities 6,882.1 5,721.4 6,148.0
Current borrowings 15 2,428.6 2,420.2 2,288.4
Other current financial liabilities
129.0 19.7 346.8
Trade payables
1,051.1 929.8 982.8
Provisions for pensions and other post-employment benefits
7.2 7.2 7.2
Other provisions
177.8 180.0 225.6
Current tax liabilities
315.4 386.1 277.9
Other current liabilities
1,467.8 1,269.5 1,651.0
Current liabilities 5,576.9 5,212.5 5,779.7
Liabilities associated with assets classified as held for sale 10 60.3 173.6 63.9
Total equity and liabilities 24,002.6 22,149.3 23,253.9
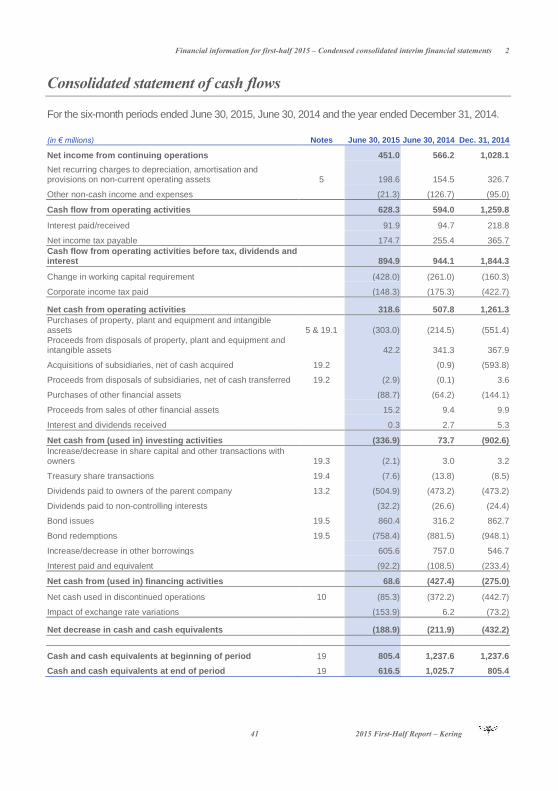
Financial information for first-half 2015 – Condensed consolidated interim financial statements 2
41 2015 First-Half Report – Kering
Consolidated statement of cash flows
For the six-month periods ended June 30, 2015, June 30, 2014 and the year ended December 31, 2014.
(in € millions) Notes June 30, 2015 June 30, 2014 Dec. 31, 2014
Net income from continuing operations
451.0 566.2 1,028.1
Net recurring charges to depreciation, amortisation and provisions on non-current operating assets 5 198.6 154.5 326.7
Other non-cash income and expenses
(21.3) (126.7) (95.0)
Cash flow from operating activities 628.3 594.0 1,259.8
Interest paid/received
91.9 94.7 218.8
Net income tax payable
174.7 255.4 365.7
Cash flow from operating activities before tax, dividends and interest 894.9 944.1 1,844.3
Change in working capital requirement
(428.0) (261.0) (160.3)
Corporate income tax paid
(148.3) (175.3) (422.7)
Net cash from operating activities 318.6 507.8 1,261.3
Purchases of property, plant and equipment and intangible assets 5 & 19.1 (303.0) (214.5) (551.4) Proceeds from disposals of property, plant and equipment and intangible assets
42.2 341.3 367.9
Acquisitions of subsidiaries, net of cash acquired 19.2 (0.9) (593.8)
Proceeds from disposals of subsidiaries, net of cash transferred 19.2 (2.9) (0.1) 3.6
Purchases of other financial assets
(88.7) (64.2) (144.1)
Proceeds from sales of other financial assets
15.2 9.4 9.9
Interest and dividends received
0.3 2.7 5.3
Net cash from (used in) investing activities (336.9) 73.7 (902.6)
Increase/decrease in share capital and other transactions with owners 19.3 (2.1) 3.0 3.2
Treasury share transactions 19.4 (7.6) (13.8) (8.5)
Dividends paid to owners of the parent company 13.2 (504.9) (473.2) (473.2)
Dividends paid to non-controlling interests
(32.2) (26.6) (24.4)
Bond issues 19.5 860.4 316.2 862.7
Bond redemptions 19.5 (758.4) (881.5) (948.1)
Increase/decrease in other borrowings
605.6 757.0 546.7
Interest paid and equivalent
(92.2) (108.5) (233.4)
Net cash from (used in) financing activities 68.6 (427.4) (275.0)
Net cash used in discontinued operations 10 (85.3) (372.2) (442.7)
Impact of exchange rate variations
(153.9) 6.2 (73.2)
Net decrease in cash and cash equivalents (188.9) (211.9) (432.2)
Cash and cash equivalents at beginning of period 19 805.4 1,237.6 1,237.6
Cash and cash equivalents at end of period 19 616.5 1,025.7 805.4
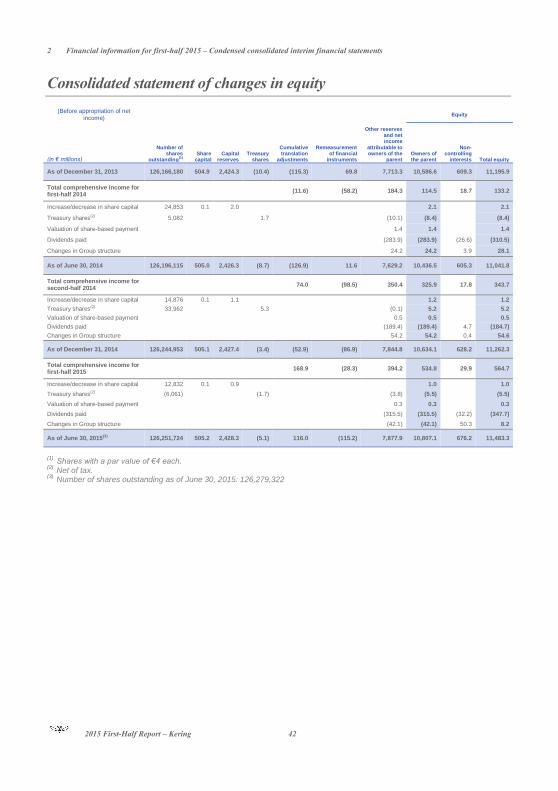
2 Financial information for first-half 2015 – Condensed consolidated interim financial statements
2015 First-Half Report – Kering 42
Consolidated statement of changes in equity
(Before appropriation of net income)
Number of shares
outstanding(1)
Share capital
Capital reserves
Treasury shares
Cumulative translation
adjustments
Remeasurement of financial
instruments
Other reserves and net income
attributable to owners of the
parent
Equity
(in € millions) Owners of the parent
Non-controlling
interests Total equity
As of December 31, 2013 126,166,180 504.9 2,424.3 (10.4) (115.3) 69.8 7,713.3 10,586.6 609.3 11,195.9
Total comprehensive income for first-half 2014
(11.6) (58.2) 184.3 114.5 18.7 133.2
Increase/decrease in share capital 24,853 0.1 2.0
2.1
2.1
Treasury shares(2) 5,082
1.7
(10.1) (8.4)
(8.4)
Valuation of share-based payment
1.4 1.4
1.4
Dividends paid
(283.9) (283.9) (26.6) (310.5)
Changes in Group structure
24.2 24.2 3.9 28.1
As of June 30, 2014 126,196,115 505.0 2,426.3 (8.7) (126.9) 11.6 7,629.2 10,436.5 605.3 11,041.8
Total comprehensive income for second-half 2014
74.0 (98.5) 350.4 325.9 17.8 343.7
Increase/decrease in share capital 14,876 0.1 1.1 1.2 1.2
Treasury shares(2) 33,962
5.3
(0.1) 5.2
5.2
Valuation of share-based payment
0.5 0.5
0.5
Dividends paid
(189.4) (189.4) 4.7 (184.7)
Changes in Group structure
54.2 54.2 0.4 54.6
As of December 31, 2014 126,244,953 505.1 2,427.4 (3.4) (52.9) (86.9) 7,844.8 10,634.1 628.2 11,262.3
Total comprehensive income for first-half 2015
168.9 (28.3) 394.2 534.8 29.9 564.7
Increase/decrease in share capital 12,832 0.1 0.9 1.0 1.0
Treasury shares(2) (6,061)
(1.7)
(3.8) (5.5)
(5.5)
Valuation of share-based payment
0.3 0.3
0.3
Dividends paid
(315.5) (315.5) (32.2) (347.7)
Changes in Group structure
(42.1) (42.1) 50.3 8.2
As of June 30, 2015(3) 126,251,724 505.2 2,428.3 (5.1) 116.0 (115.2) 7,877.9 10,807.1 676.2 11,483.3
(1) Shares with a par value of €4 each.
(2) Net of tax.
(3) Number of shares outstanding as of June 30, 2015: 126,279,322
Financial information for first-half 2015 – Condensed consolidated interim financial statements 2
43 2015 First-Half Report – Kering
Notes to the condensed consolidated interim financial
statements
Note 1 Introduction…………………………………………………………………………………44
Note 2 Accounting policies and methods………………………………………………………...44
Note 3 Restatement of comparative information………………………………………………...45
Note 4 Highlights…………………………………………………………………………………...48
Note 5 Operating segments……………………………………………………………………….49
Note 6 Other non-recurring operating income and expenses ………………………………….52
Note 7 Finance costs (net)………………………………………………………………………...53
Note 8 Income taxes……………………………………………………………………………….53
Note 9 Share in earnings (losses) of equity-accounted companies……………………………54
Note 10 Non-current assets held for sale and discontinued operations………………………...54
Note 11 Earnings per share………………………………………………………………………...56
Note 12 Other comprehensive income…………………………………………………………….58
Note 13 Equity…………………………………………………………………….....………………60
Note 14 Cash and cash equivalents……………………………………………………………….61
Note 15 Borrowings…………………………………………………………………………………62
Note 16 Derivative instruments at market value…………………………………………………. 63
Note 17 Accounting classification and market value of financial instruments…………………..64
Note 18 Net debt…………………………………………………………………………………….66
Note 19 Statement of cash flows……………………………………………………………......…....66
Note 20 Contingent liabilities, contractual commitments not recognised and other
contingencies
68
Note 21 Related parties controlling the Group…………………………………………………….68
Note 22 Subsequent events………………………………………………………………….………..68
2 Financial information for first-half 2015 – Condensed consolidated interim financial statements
2015 First-Half Report – Kering 44
Note 1 Introduction
Kering, the Group’s parent company, is a société anonyme (French joint-stock company) with a Board
of Directors, incorporated under French law, whose registered office is located at 10, avenue Hoche,
75008 Paris, France. It is registered with the Paris Trade and Companies Registry under reference
552 075 020 RCS Paris, and is listed on the Euronext Paris stock exchange.
The condensed consolidated interim financial statements for the six months ended June 30, 2015 reflect the
accounting position of Kering and its subsidiaries, together with its interests in associates and joint ventures.
On July 27, 2015, the Board of Directors approved and authorised for issue the condensed consolidated
interim financial statements for the six months ended June 30, 2015.
Note 2 Accounting policies and methods
2.1 General principles and statement of compliance
Pursuant to European Regulation No. 1606/2002 of July 19, 2002, the consolidated financial statements of the
Kering group for the year ended December 31, 2014 were prepared in accordance with applicable
international accounting standards adopted by the European Union and mandatorily applicable as of that date.
The condensed consolidated interim financial statements for the six months ended June 30, 2015 have
been prepared in accordance with IAS 34 – Interim Financial Reporting, as adopted by the European
Union, which allows entities to present selected explanatory notes.
The notes do not therefore include all of the disclosures required for a complete set of annual financial
statements, and should be read in conjunction with the consolidated financial statements for the year
ended December 31, 2014.
2.2 IFRS basis adopted
The interim financial statements have been prepared in accordance with the accounting principles and
methods applied by the Group for its 2014 annual financial statements, except for corporate income tax
and employee benefits, which are subject to specific valuation methods (Note 2.3), and the standards
and interpretations (listed below) that are applicable to the Group as of January 1, 2015.
The following interpretation and amendments are mandatorily applicable to financial periods beginning
on or after January 1, 2015:
IFRIC 21 – Levies;
the amendments contained in the Annual Improvements to IFRSs 2011-2013 Cycle
published in December 2013.
Their application did not have a material impact on the Group’s consolidated financial statements.
The Group has elected not to early adopt the standards, amendments and interpretations whose
application is not mandatory for financial periods beginning on or after January 1, 2015.
The other standards and amendments that have not yet been adopted by the European Union are
primarily as follows:
IFRS 9 – Financial Instruments, which sets out the requirements for recognising and
reporting financial assets and financial liabilities. This standard will ultimately supersede
IAS 39 – Financial Instruments;
IFRS 15 – Revenue from Contracts with Customers, which establishes principles for
recognising revenue and will ultimately replace IAS 18 – Revenue;
amendment to IAS 16 and IAS 38 – Clarification of Acceptable Methods of Depreciation and
Amortisation;
Financial information for first-half 2015 – Condensed consolidated interim financial statements 2
45 2015 First-Half Report – Kering
the various amendments to the standards on consolidation, IFRS 10 and IFRS 11.
2.3. Details specific to the preparation of interim financial statements
2.3.1. Corporate income tax
The income tax charge for the period (current and deferred) is calculated based on the estimated
effective tax rate for the full year, for each tax entity or sub-group, and is adjusted for transactions
specific to the first half of the year.
2.3.2. Employee benefits
Barring a specific event or material change in actuarial assumptions during the period, no actuarial
valuations are performed for the preparation of the condensed consolidated interim financial
statements. The charge for the first half of the year relating to post-employment benefits represents one
half of the net charge calculated for full-year 2015, based on the data and actuarial assumptions used
for the year ended December 31, 2014.
2.3.3. Seasonality of operations
Revenue, recurring operating income and all operating indicators (including working capital
requirement) are subject to strong seasonal fluctuations due to the high level of activity in the second
half of the calendar year. Consequently, the interim results for the six months ended June 30, 2015 are
not necessarily representative of those that may be expected for full-year 2015.
2.4. Use of estimates and judgement
The preparation of consolidated financial statements requires Group management to make estimates
and assumptions that can affect the carrying amounts of certain assets and liabilities, income and
expenses, and the disclosures in the accompanying notes. Group management reviews these
estimates and assumptions on a regular basis to ensure their pertinence with respect to past
experience and the current economic situation. Items in future financial statements may differ from
current estimates as a result of changes in these assumptions. The impact of changes in accounting
estimates is recognised during the period in which the change occurs and all affected future periods.
The main estimates made by management in the preparation of the financial statements concern the
valuations and useful lives of operating assets, property, plant and equipment, intangible assets and
goodwill, the amount of contingency provisions and other provisions relating to operations, and
assumptions underlying the calculation of obligations relating to employee benefits, share-based
payment, deferred tax balances and derivatives. The Group notably uses discount rate assumptions
based on market data to estimate the value of long-term assets and liabilities.
In addition to the use of estimates, Group management uses judgement to determine the appropriate
accounting treatment for certain transactions, pending the clarification of certain IFRS or where
prevailing standards do not cover the issue at hand. This is notably the case for put options granted to
non-controlling interests.
Note 3 Restatement of comparative information
For 2014, the Group has identified non-current assets held for sale and discontinued operations within
the meaning of IFRS 5 – Non-current Assets Held for Sale and Discontinued Operations. These
concern Sergio Rossi.
In accordance with IFRS 5, the income statement and statement of cash flows for comparative periods
have been restated. The impacts of restatements related to non-current assets held for sale and
discontinued operations are as follows:
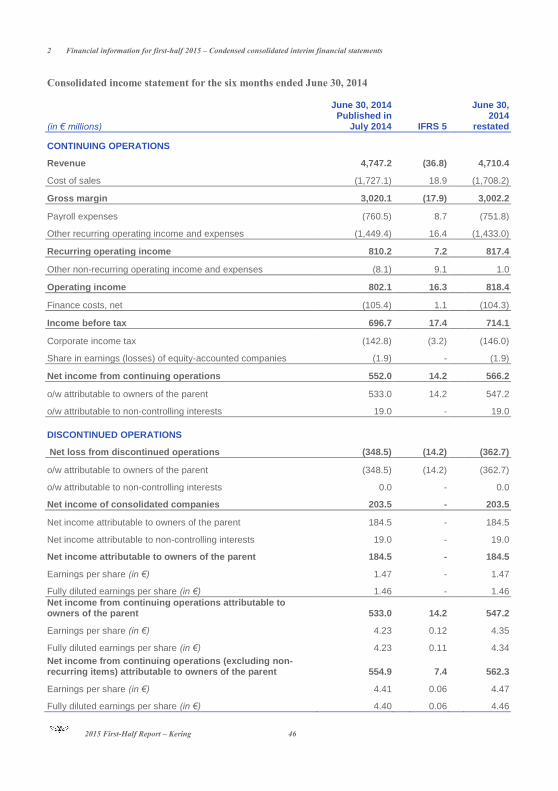
2 Financial information for first-half 2015 – Condensed consolidated interim financial statements
2015 First-Half Report – Kering 46
Consolidated income statement for the six months ended June 30, 2014
(in € millions)
June 30, 2014 Published in
July 2014 IFRS 5
June 30, 2014
restated
CONTINUING OPERATIONS
Revenue 4,747.2 (36.8) 4,710.4
Cost of sales (1,727.1) 18.9 (1,708.2)
Gross margin 3,020.1 (17.9) 3,002.2
Payroll expenses (760.5) 8.7 (751.8)
Other recurring operating income and expenses (1,449.4) 16.4 (1,433.0)
Recurring operating income 810.2 7.2 817.4
Other non-recurring operating income and expenses (8.1) 9.1 1.0
Operating income 802.1 16.3 818.4
Finance costs, net (105.4) 1.1 (104.3)
Income before tax 696.7 17.4 714.1
Corporate income tax (142.8) (3.2) (146.0)
Share in earnings (losses) of equity-accounted companies (1.9) - (1.9)
Net income from continuing operations 552.0 14.2 566.2
o/w attributable to owners of the parent 533.0 14.2 547.2
o/w attributable to non-controlling interests 19.0 - 19.0
DISCONTINUED OPERATIONS
Net loss from discontinued operations (348.5) (14.2) (362.7)
o/w attributable to owners of the parent (348.5) (14.2) (362.7)
o/w attributable to non-controlling interests 0.0 - 0.0
Net income of consolidated companies 203.5 - 203.5
Net income attributable to owners of the parent 184.5 - 184.5
Net income attributable to non-controlling interests 19.0 - 19.0
Net income attributable to owners of the parent 184.5 - 184.5
Earnings per share (in €) 1.47 - 1.47
Fully diluted earnings per share (in €) 1.46 - 1.46
Net income from continuing operations attributable to owners of the parent 533.0
14.2
547.2
Earnings per share (in €) 4.23 0.12 4.35
Fully diluted earnings per share (in €) 4.23 0.11 4.34
Net income from continuing operations (excluding non-recurring items) attributable to owners of the parent 554.9
7.4
562.3
Earnings per share (in €) 4.41 0.06 4.47
Fully diluted earnings per share (in €) 4.40 0.06 4.46
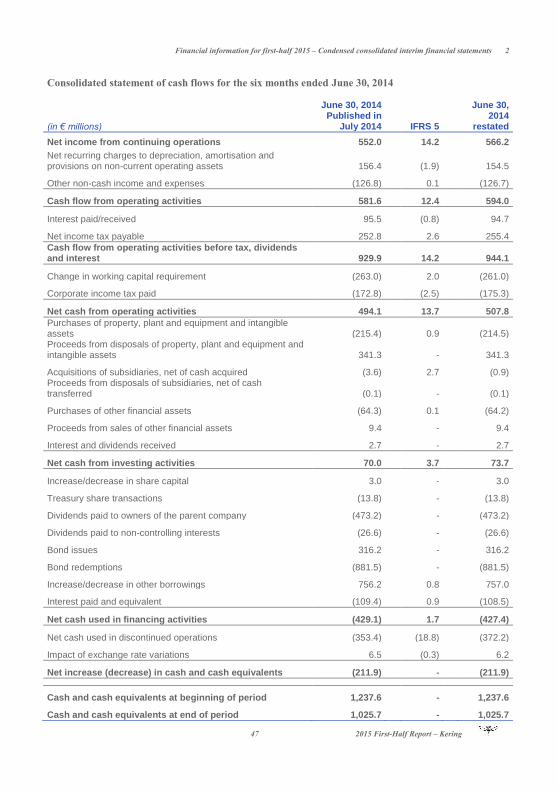
Financial information for first-half 2015 – Condensed consolidated interim financial statements 2
47 2015 First-Half Report – Kering
Consolidated statement of cash flows for the six months ended June 30, 2014
(in € millions)
June 30, 2014 Published in
July 2014 IFRS 5
June 30, 2014
restated
Net income from continuing operations 552.0 14.2
566.2
Net recurring charges to depreciation, amortisation and provisions on non-current operating assets 156.4 (1.9)
154.5
Other non-cash income and expenses (126.8) 0.1 (126.7)
Cash flow from operating activities 581.6 12.4 594.0
Interest paid/received 95.5 (0.8) 94.7
Net income tax payable 252.8 2.6 255.4
Cash flow from operating activities before tax, dividends and interest 929.9 14.2 944.1
Change in working capital requirement (263.0) 2.0 (261.0)
Corporate income tax paid (172.8) (2.5) (175.3)
Net cash from operating activities 494.1 13.7 507.8
Purchases of property, plant and equipment and intangible assets (215.4)
0.9
(214.5)
Proceeds from disposals of property, plant and equipment and intangible assets 341.3 - 341.3
Acquisitions of subsidiaries, net of cash acquired (3.6) 2.7 (0.9) Proceeds from disposals of subsidiaries, net of cash transferred (0.1) - (0.1)
Purchases of other financial assets (64.3) 0.1 (64.2)
Proceeds from sales of other financial assets 9.4 - 9.4
Interest and dividends received 2.7 - 2.7
Net cash from investing activities 70.0 3.7 73.7
Increase/decrease in share capital 3.0 - 3.0
Treasury share transactions (13.8) - (13.8)
Dividends paid to owners of the parent company (473.2) - (473.2)
Dividends paid to non-controlling interests (26.6) - (26.6)
Bond issues 316.2 - 316.2
Bond redemptions (881.5) - (881.5)
Increase/decrease in other borrowings 756.2 0.8 757.0
Interest paid and equivalent (109.4) 0.9 (108.5)
Net cash used in financing activities (429.1) 1.7 (427.4)
Net cash used in discontinued operations (353.4) (18.8) (372.2)
Impact of exchange rate variations 6.5 (0.3) 6.2
Net increase (decrease) in cash and cash equivalents (211.9) - (211.9)
Cash and cash equivalents at beginning of period 1,237.6 - 1,237.6
Cash and cash equivalents at end of period 1,025.7 - 1,025.7

2 Financial information for first-half 2015 – Condensed consolidated interim financial statements
2015 First-Half Report – Kering 48
Note 4 Highlights
Change in management and creative responsibility at Gucci
On January 21, 2015, Marco Bizzarri – Gucci's President and CEO who succeeded Patrizio di Marco
on January 1, 2015 – announced that Alessandro Michele had been appointed as the brand's new
Creative Director following the departure of his predecessor Frida Giannini.
Alessandro Michele has been given total creative responsibility for all of Gucci's collections and its
brand image. The first collection fully designed by Alessandro Michele was the 2016 Cruise collection,
which was unveiled in New York on June 4, 2015 and will be available in stores as from the end of the
third quarter of 2015.
Finalisation of the partnership with Safilo and launch of Kering Eyewear
In 2014, Kering announced its plan to invest in a dedicated entity specialised in luxury, high-end and
sport Eyewear, managed by a skilled team of experienced professionals under the direction of Roberto
Vedovotto. This innovative management model for the Group's Eyewear business will allow it to
leverage the full potential of its brands in this category.
As part of this strategic move, Kering and Safilo agreed to further their partnership and jointly intend to
terminate the current Gucci licence agreement two years in advance, i.e., by December 31, 2016, which
will result in total compensation of €90 million to be paid to Safilo. On January 12, 2015, Kering
announced that it had signed a partnership agreement with Safilo covering the development,
manufacture and supply of Gucci Eyewear products. The agreement will be effective as of fourth-
quarter 2015 in order to ensure a seamless transition for Gucci's Eyewear business.
On March 18, 2015, Kering announced that Roberto Vedovotto, CEO of Kering Eyewear, had been
appointed as a new member of the Group's Executive Committee. Kering Eyewear was officially
launched on June 30, 2015 when its first collection, "Collezione Uno" was presented at the Palazzo
Grassi in Venice.
The overall €90 million in compensation due to Safilo has been recognised as an intangible asset in the
financial statements at June 30, 2015 and will be amortised as from January 1, 2017. The
compensation will be paid in three equal instalments, with the first payment on January 12, 2015 and
the following two in December 2016 and September 2018.
Other highlights
On January 15, 2015, Kering sold the assets of Movitex to the group's management team, after
recapitalising it in accordance with the preliminary agreement signed on December 3, 2014.
On March 20, 2015, Kering issued a €500 million, 0.875% fixed-rate bond maturing in seven years. Also
during the first half of 2015, Kering carried out two issues of notes in foreign currency – a
USD 150 million issue in March 2015 of five-year floating-rate notes, and a USD 150 million issue in
June 2015 of six-year fixed-rate notes with an annual coupon of 2.887%.
On March 25, 2015 Kering bought out the non-controlling interests in Sowind Group in accordance with
the shareholder agreements signed in June 2011. This acquisition did not have a material impact on the
Group's interim financial statements.
Financial information for first-half 2015 – Condensed consolidated interim financial statements 2
49 2015 First-Half Report – Kering
On June 30, 2015, PUMA announced that it had sold the intellectual property rights (including
trademark rights) of its subsidiary, Tretorn Group, to US-based Authentic Brands Group, LLC (ABG).
Tretorn – which is based in Helsingborg in Sweden and makes sport and leisure products – was
acquired by PUMA in 2002. This sale is in line with PUMA's strategy of refocusing on its core
businesses.
Note 5 Operating segments
Information provided on operating segments is prepared in accordance with the same accounting rules
as in the consolidated financial statements and set out in Note 4 to the consolidated financial
statements in the 2014 Reference Document.
The performance of each operating segment is measured based on recurring operating income, which
is the method used by the Group’s chief operating decision maker.
Net recurring charges to depreciation, amortisation and provisions on non-current operating assets
reflect net charges to depreciation, amortisation and provisions on intangible assets and property, plant
and equipment recognised in recurring operating income.
Purchases of property, plant and equipment and intangible assets correspond to gross non-current
asset purchases, including cash timing differences but excluding purchases of assets under finance
leases.
Non-current segment assets comprise goodwill, brands and other intangible assets, property, plant and
equipment and other non-current assets.
Segment assets comprise non-current segment assets, inventories, trade receivables and other current
assets.
Segment liabilities comprise deferred tax liabilities on brands, trade payables and other current liabilities.
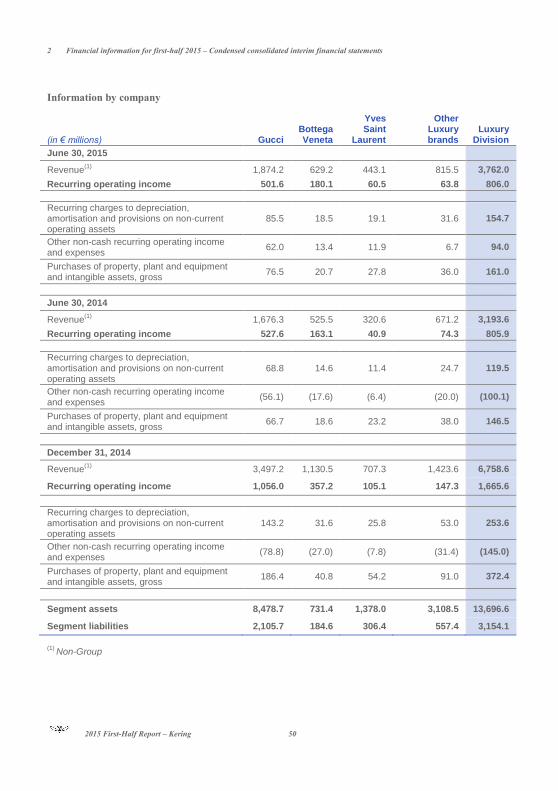
2 Financial information for first-half 2015 – Condensed consolidated interim financial statements
2015 First-Half Report – Kering 50
Information by company
(in € millions) Gucci Bottega Veneta
Yves Saint
Laurent
Other Luxury brands
Luxury Division
June 30, 2015
Revenue(1)
1,874.2 629.2 443.1 815.5 3,762.0
Recurring operating income 501.6 180.1 60.5 63.8 806.0
Recurring charges to depreciation, amortisation and provisions on non-current operating assets
85.5 18.5 19.1 31.6 154.7
Other non-cash recurring operating income and expenses
62.0 13.4 11.9 6.7 94.0
Purchases of property, plant and equipment and intangible assets, gross
76.5 20.7 27.8 36.0 161.0
June 30, 2014
Revenue(1)
1,676.3 525.5 320.6 671.2 3,193.6
Recurring operating income 527.6 163.1 40.9 74.3 805.9
Recurring charges to depreciation, amortisation and provisions on non-current operating assets
68.8 14.6 11.4 24.7 119.5
Other non-cash recurring operating income and expenses
(56.1) (17.6) (6.4) (20.0) (100.1)
Purchases of property, plant and equipment and intangible assets, gross
66.7 18.6 23.2 38.0 146.5
December 31, 2014
Revenue(1)
3,497.2 1,130.5 707.3 1,423.6 6,758.6
Recurring operating income 1,056.0 357.2 105.1 147.3 1,665.6
Recurring charges to depreciation, amortisation and provisions on non-current operating assets
143.2 31.6 25.8 53.0 253.6
Other non-cash recurring operating income and expenses
(78.8) (27.0) (7.8) (31.4) (145.0)
Purchases of property, plant and equipment and intangible assets, gross
186.4 40.8 54.2 91.0 372.4
Segment assets 8,478.7 731.4 1,378.0 3,108.5 13,696.6
Segment liabilities 2,105.7 184.6 306.4 557.4 3,154.1
(1) Non-Group
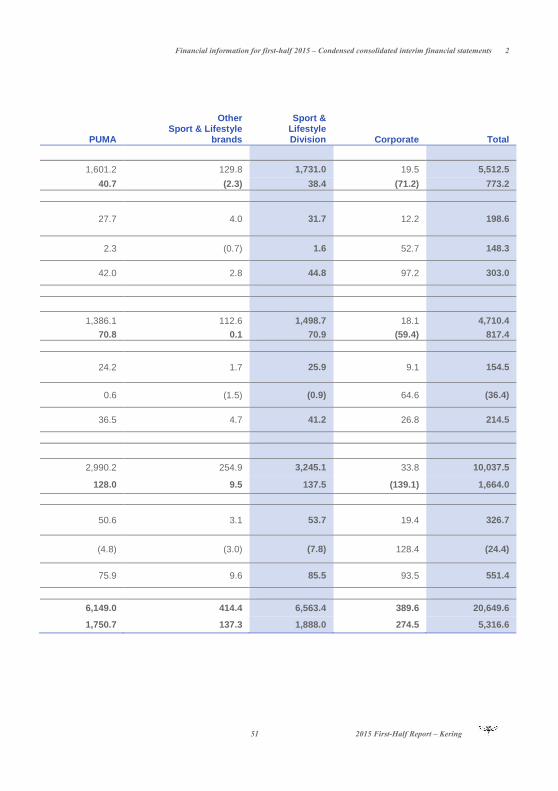
Financial information for first-half 2015 – Condensed consolidated interim financial statements 2
51 2015 First-Half Report – Kering
PUMA
Other Sport & Lifestyle
brands
Sport & Lifestyle Division Corporate Total
1,601.2 129.8 1,731.0 19.5 5,512.5
40.7 (2.3) 38.4 (71.2) 773.2
27.7 4.0 31.7 12.2 198.6
2.3 (0.7) 1.6 52.7 148.3
42.0 2.8 44.8 97.2 303.0
1,386.1 112.6 1,498.7 18.1 4,710.4
70.8 0.1 70.9 (59.4) 817.4
24.2 1.7 25.9 9.1 154.5
0.6 (1.5) (0.9) 64.6 (36.4)
36.5 4.7 41.2 26.8 214.5
2,990.2 254.9 3,245.1 33.8 10,037.5
128.0 9.5 137.5 (139.1) 1,664.0
50.6 3.1 53.7 19.4 326.7
(4.8) (3.0) (7.8) 128.4 (24.4)
75.9 9.6 85.5 93.5 551.4
6,149.0 414.4 6,563.4 389.6 20,649.6
1,750.7 137.3 1,888.0 274.5 5,316.6

2 Financial information for first-half 2015 – Condensed consolidated interim financial statements
2015 First-Half Report – Kering 52
Note 6 Other non-recurring operating income and expenses
(in € millions) June 30, 2015 June 30, 2014
Non-recurring operating expenses (192.7) (194.6)
Restructuring costs (9.9) (8.3)
Asset impairment (149.0) (186.2)
Capital losses on disposals - (0.1)
Other (33.8) -
Non-recurring operating income 150.9 195.6
Capital gains on disposals 148.1 186.2
Other 2.8 9.4
Total (41.8) 1.0
The Group’s other non-recurring operating income and expenses consist of unusual items that could
distort the assessment of each brand’s economic performance. The net balance of this caption was an
expense of €41.8 million in first-half 2015 and chiefly included restructuring costs and asset impairment
in the Luxury Division, particularly Gucci inventory write-downs in line with the brand's current period of
transition. Non-recurring operating income includes capital gains on the disposal of the Tretorn brand
and the capital gain arising on the sale of a property complex.
At June 30, 2014, this item represented net income of €1.0 million and mainly comprised €186.2 million
in asset write-downs (including an impairment loss against the goodwill of other Sport & Lifestyle brands
amounting to €183.2 million) and capital gains on disposals totalling €186.1 million, mainly including the
sale of a property complex.
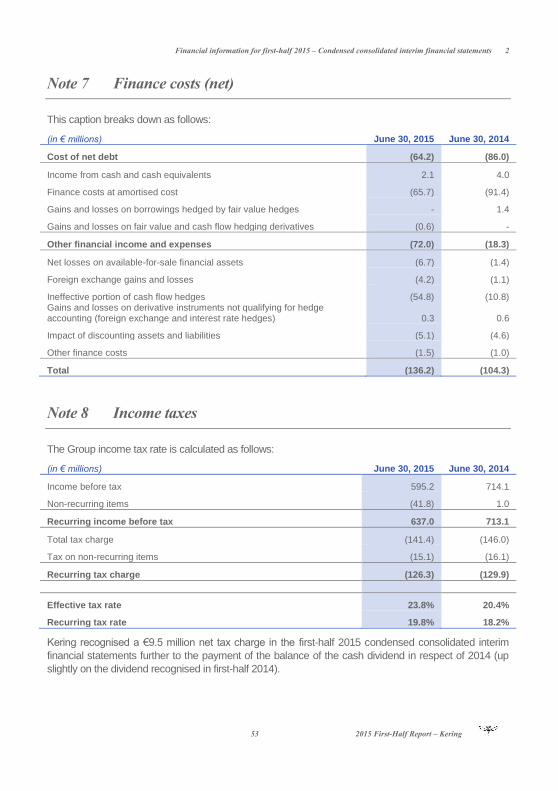
Financial information for first-half 2015 – Condensed consolidated interim financial statements 2
53 2015 First-Half Report – Kering
Note 7 Finance costs (net)
This caption breaks down as follows:
(in € millions) June 30, 2015 June 30, 2014
Cost of net debt (64.2) (86.0)
Income from cash and cash equivalents 2.1 4.0
Finance costs at amortised cost (65.7) (91.4)
Gains and losses on borrowings hedged by fair value hedges - 1.4
Gains and losses on fair value and cash flow hedging derivatives (0.6) -
Other financial income and expenses (72.0) (18.3)
Net losses on available-for-sale financial assets (6.7) (1.4)
Foreign exchange gains and losses (4.2) (1.1)
Ineffective portion of cash flow hedges (54.8) (10.8) Gains and losses on derivative instruments not qualifying for hedge accounting (foreign exchange and interest rate hedges) 0.3 0.6
Impact of discounting assets and liabilities (5.1) (4.6)
Other finance costs (1.5) (1.0)
Total (136.2) (104.3)
Note 8 Income taxes
The Group income tax rate is calculated as follows:
(in € millions) June 30, 2015 June 30, 2014
Income before tax 595.2 714.1
Non-recurring items (41.8) 1.0
Recurring income before tax 637.0 713.1
Total tax charge (141.4) (146.0)
Tax on non-recurring items (15.1) (16.1)
Recurring tax charge (126.3) (129.9)
Effective tax rate 23.8% 20.4%
Recurring tax rate 19.8% 18.2%
Kering recognised a €9.5 million net tax charge in the first-half 2015 condensed consolidated interim
financial statements further to the payment of the balance of the cash dividend in respect of 2014 (up
slightly on the dividend recognised in first-half 2014).
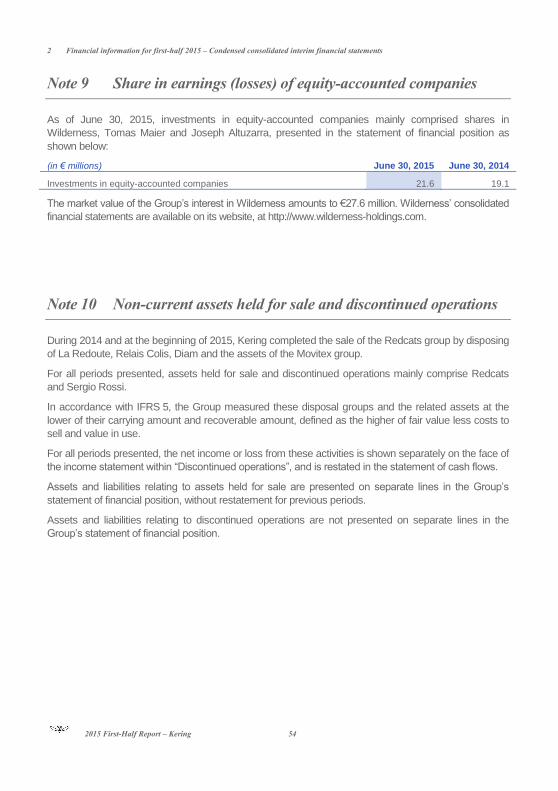
2 Financial information for first-half 2015 – Condensed consolidated interim financial statements
2015 First-Half Report – Kering 54
Note 9 Share in earnings (losses) of equity-accounted companies
As of June 30, 2015, investments in equity-accounted companies mainly comprised shares in
Wilderness, Tomas Maier and Joseph Altuzarra, presented in the statement of financial position as
shown below:
(in € millions) June 30, 2015 June 30, 2014
Investments in equity-accounted companies 21.6 19.1
The market value of the Group’s interest in Wilderness amounts to €27.6 million. Wilderness’ consolidated
financial statements are available on its website, at http://www.wilderness-holdings.com.
Note 10 Non-current assets held for sale and discontinued operations
During 2014 and at the beginning of 2015, Kering completed the sale of the Redcats group by disposing
of La Redoute, Relais Colis, Diam and the assets of the Movitex group.
For all periods presented, assets held for sale and discontinued operations mainly comprise Redcats
and Sergio Rossi.
In accordance with IFRS 5, the Group measured these disposal groups and the related assets at the
lower of their carrying amount and recoverable amount, defined as the higher of fair value less costs to
sell and value in use.
For all periods presented, the net income or loss from these activities is shown separately on the face of
the income statement within “Discontinued operations”, and is restated in the statement of cash flows.
Assets and liabilities relating to assets held for sale are presented on separate lines in the Group’s
statement of financial position, without restatement for previous periods.
Assets and liabilities relating to discontinued operations are not presented on separate lines in the
Group’s statement of financial position.
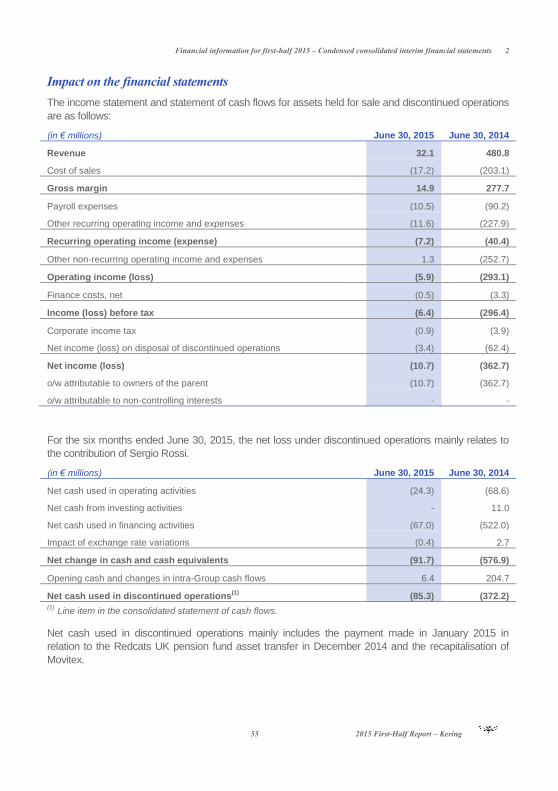
Financial information for first-half 2015 – Condensed consolidated interim financial statements 2
55 2015 First-Half Report – Kering
Impact on the financial statements
The income statement and statement of cash flows for assets held for sale and discontinued operations
are as follows:
(in € millions) June 30, 2015 June 30, 2014
Revenue 32.1 480.8
Cost of sales (17.2) (203.1)
Gross margin 14.9 277.7
Payroll expenses (10.5) (90.2)
Other recurring operating income and expenses (11.6) (227.9)
Recurring operating income (expense) (7.2) (40.4)
Other non-recurring operating income and expenses 1.3 (252.7)
Operating income (loss) (5.9) (293.1)
Finance costs, net (0.5) (3.3)
Income (loss) before tax (6.4) (296.4)
Corporate income tax (0.9) (3.9)
Net income (loss) on disposal of discontinued operations (3.4) (62.4)
Net income (loss) (10.7) (362.7)
o/w attributable to owners of the parent (10.7) (362.7)
o/w attributable to non-controlling interests - -
For the six months ended June 30, 2015, the net loss under discontinued operations mainly relates to
the contribution of Sergio Rossi.
(in € millions) June 30, 2015 June 30, 2014
Net cash used in operating activities (24.3) (68.6)
Net cash from investing activities - 11.0
Net cash used in financing activities (67.0) (522.0)
Impact of exchange rate variations (0.4) 2.7
Net change in cash and cash equivalents (91.7) (576.9)
Opening cash and changes in intra-Group cash flows 6.4 204.7
Net cash used in discontinued operations(1)
(85.3) (372.2) (1) Line item in the consolidated statement of cash flows.
Net cash used in discontinued operations mainly includes the payment made in January 2015 in
relation to the Redcats UK pension fund asset transfer in December 2014 and the recapitalisation of
Movitex.
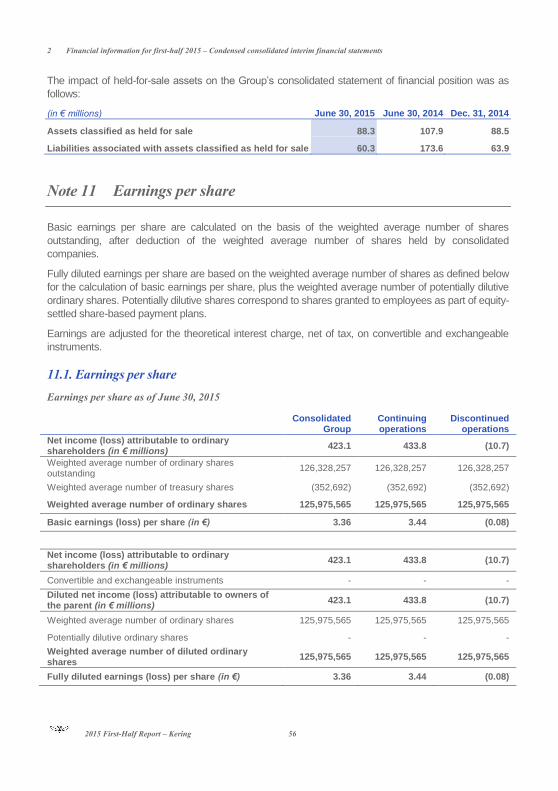
2 Financial information for first-half 2015 – Condensed consolidated interim financial statements
2015 First-Half Report – Kering 56
The impact of held-for-sale assets on the Group’s consolidated statement of financial position was as
follows:
(in € millions) June 30, 2015 June 30, 2014 Dec. 31, 2014
Assets classified as held for sale 88.3 107.9 88.5
Liabilities associated with assets classified as held for sale 60.3 173.6 63.9
Note 11 Earnings per share
Basic earnings per share are calculated on the basis of the weighted average number of shares
outstanding, after deduction of the weighted average number of shares held by consolidated
companies.
Fully diluted earnings per share are based on the weighted average number of shares as defined below
for the calculation of basic earnings per share, plus the weighted average number of potentially dilutive
ordinary shares. Potentially dilutive shares correspond to shares granted to employees as part of equity-
settled share-based payment plans.
Earnings are adjusted for the theoretical interest charge, net of tax, on convertible and exchangeable
instruments.
11.1. Earnings per share
Earnings per share as of June 30, 2015
Consolidated Group
Continuing operations
Discontinued operations
Net income (loss) attributable to ordinary shareholders (in € millions)
423.1 433.8 (10.7)
Weighted average number of ordinary shares outstanding
126,328,257 126,328,257 126,328,257
Weighted average number of treasury shares (352,692) (352,692) (352,692)
Weighted average number of ordinary shares 125,975,565 125,975,565 125,975,565
Basic earnings (loss) per share (in €) 3.36 3.44 (0.08)
Net income (loss) attributable to ordinary shareholders (in € millions)
423.1 433.8 (10.7)
Convertible and exchangeable instruments - - -
Diluted net income (loss) attributable to owners of the parent (in € millions)
423.1 433.8 (10.7)
Weighted average number of ordinary shares 125,975,565 125,975,565 125,975,565
Potentially dilutive ordinary shares - - -
Weighted average number of diluted ordinary shares
125,975,565 125,975,565 125,975,565
Fully diluted earnings (loss) per share (in €) 3.36 3.44 (0.08)
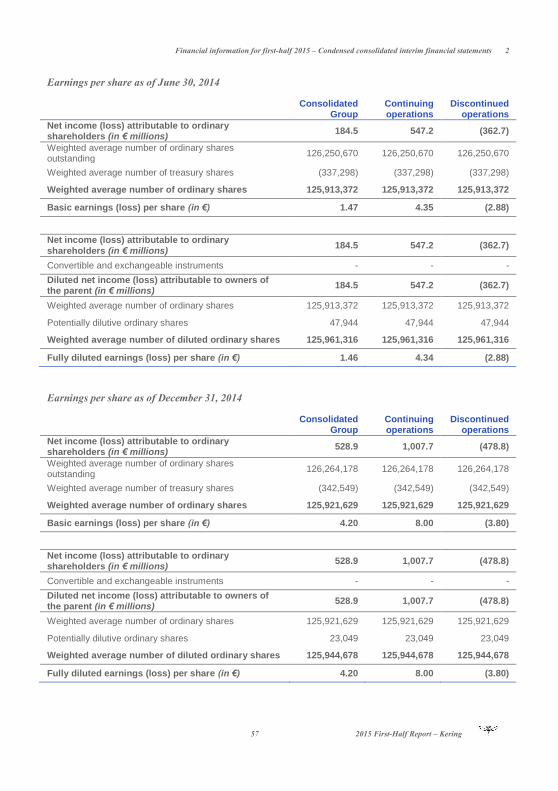
Financial information for first-half 2015 – Condensed consolidated interim financial statements 2
57 2015 First-Half Report – Kering
Earnings per share as of June 30, 2014
Consolidated Group
Continuing operations
Discontinued operations
Net income (loss) attributable to ordinary shareholders (in € millions)
184.5 547.2 (362.7)
Weighted average number of ordinary shares outstanding
126,250,670 126,250,670 126,250,670
Weighted average number of treasury shares (337,298) (337,298) (337,298)
Weighted average number of ordinary shares 125,913,372 125,913,372 125,913,372
Basic earnings (loss) per share (in €) 1.47 4.35 (2.88)
Net income (loss) attributable to ordinary
shareholders (in € millions) 184.5 547.2 (362.7)
Convertible and exchangeable instruments - - -
Diluted net income (loss) attributable to owners of the parent (in € millions)
184.5 547.2 (362.7)
Weighted average number of ordinary shares 125,913,372 125,913,372 125,913,372
Potentially dilutive ordinary shares 47,944 47,944 47,944
Weighted average number of diluted ordinary shares 125,961,316 125,961,316 125,961,316
Fully diluted earnings (loss) per share (in €) 1.46 4.34 (2.88)
Earnings per share as of December 31, 2014
Consolidated Group
Continuing operations
Discontinued operations
Net income (loss) attributable to ordinary shareholders (in € millions)
528.9 1,007.7 (478.8)
Weighted average number of ordinary shares outstanding
126,264,178 126,264,178 126,264,178
Weighted average number of treasury shares (342,549) (342,549) (342,549)
Weighted average number of ordinary shares 125,921,629 125,921,629 125,921,629
Basic earnings (loss) per share (in €) 4.20 8.00 (3.80)
Net income (loss) attributable to ordinary shareholders (in € millions)
528.9 1,007.7 (478.8)
Convertible and exchangeable instruments - - -
Diluted net income (loss) attributable to owners of the parent (in € millions)
528.9 1,007.7 (478.8)
Weighted average number of ordinary shares 125,921,629 125,921,629 125,921,629
Potentially dilutive ordinary shares 23,049 23,049 23,049
Weighted average number of diluted ordinary shares 125,944,678 125,944,678 125,944,678
Fully diluted earnings (loss) per share (in €) 4.20 8.00 (3.80)
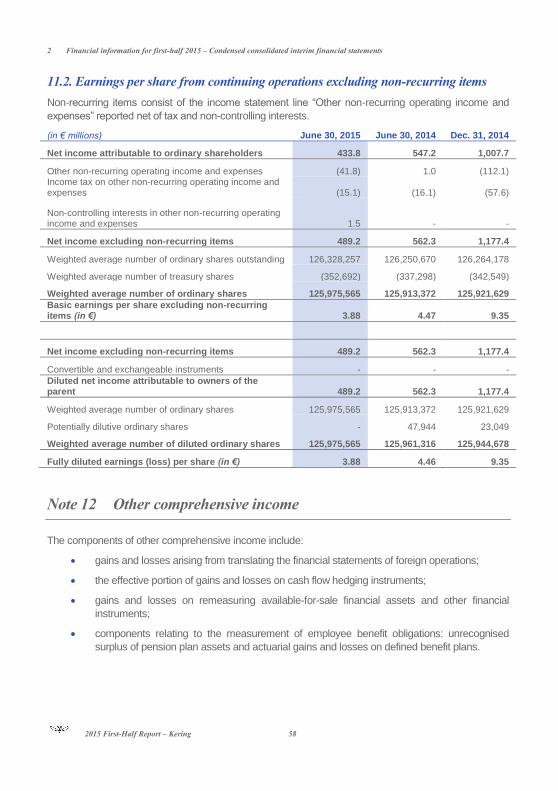
2 Financial information for first-half 2015 – Condensed consolidated interim financial statements
2015 First-Half Report – Kering 58
11.2. Earnings per share from continuing operations excluding non-recurring items
Non-recurring items consist of the income statement line “Other non-recurring operating income and
expenses” reported net of tax and non-controlling interests.
(in € millions) June 30, 2015 June 30, 2014 Dec. 31, 2014
Net income attributable to ordinary shareholders 433.8 547.2 1,007.7
Other non-recurring operating income and expenses (41.8) 1.0 (112.1) Income tax on other non-recurring operating income and expenses (15.1) (16.1) (57.6)
Non-controlling interests in other non-recurring operating income and expenses 1.5 - -
Net income excluding non-recurring items 489.2 562.3 1,177.4
Weighted average number of ordinary shares outstanding 126,328,257 126,250,670 126,264,178
Weighted average number of treasury shares (352,692) (337,298) (342,549)
Weighted average number of ordinary shares 125,975,565 125,913,372 125,921,629
Basic earnings per share excluding non-recurring items (in €) 3.88 4.47 9.35
Net income excluding non-recurring items 489.2 562.3 1,177.4
Convertible and exchangeable instruments - - -
Diluted net income attributable to owners of the parent 489.2 562.3 1,177.4
Weighted average number of ordinary shares 125,975,565 125,913,372 125,921,629
Potentially dilutive ordinary shares - 47,944 23,049
Weighted average number of diluted ordinary shares 125,975,565 125,961,316 125,944,678
Fully diluted earnings (loss) per share (in €) 3.88 4.46 9.35
Note 12 Other comprehensive income
The components of other comprehensive income include:
gains and losses arising from translating the financial statements of foreign operations;
the effective portion of gains and losses on cash flow hedging instruments;
gains and losses on remeasuring available-for-sale financial assets and other financial
instruments;
components relating to the measurement of employee benefit obligations: unrecognised
surplus of pension plan assets and actuarial gains and losses on defined benefit plans.
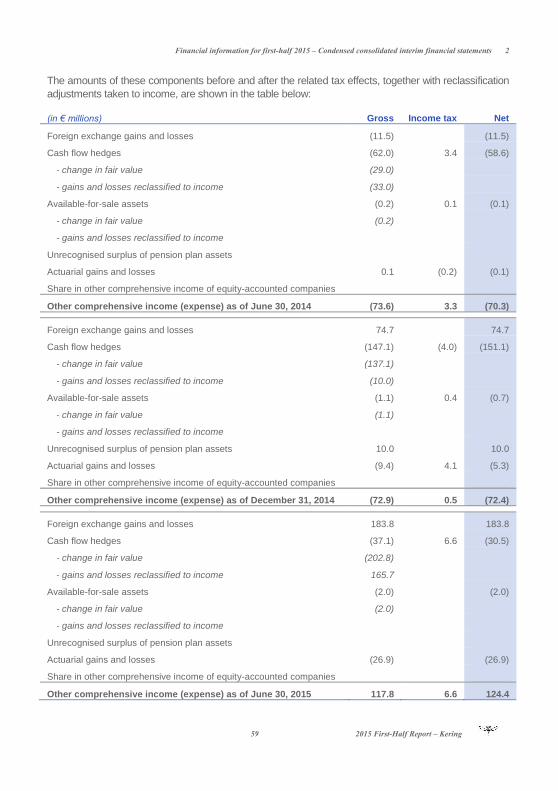
Financial information for first-half 2015 – Condensed consolidated interim financial statements 2
59 2015 First-Half Report – Kering
The amounts of these components before and after the related tax effects, together with reclassification
adjustments taken to income, are shown in the table below:
(in € millions) Gross Income tax Net
Foreign exchange gains and losses (11.5)
(11.5)
Cash flow hedges (62.0) 3.4 (58.6)
- change in fair value (29.0)
- gains and losses reclassified to income (33.0)
Available-for-sale assets (0.2) 0.1 (0.1)
- change in fair value (0.2)
- gains and losses reclassified to income
Unrecognised surplus of pension plan assets
Actuarial gains and losses 0.1 (0.2) (0.1)
Share in other comprehensive income of equity-accounted companies
Other comprehensive income (expense) as of June 30, 2014 (73.6) 3.3 (70.3)
Foreign exchange gains and losses 74.7 74.7
Cash flow hedges (147.1) (4.0) (151.1)
- change in fair value (137.1)
- gains and losses reclassified to income (10.0)
Available-for-sale assets (1.1) 0.4 (0.7)
- change in fair value (1.1)
- gains and losses reclassified to income
Unrecognised surplus of pension plan assets 10.0
10.0
Actuarial gains and losses (9.4) 4.1 (5.3)
Share in other comprehensive income of equity-accounted companies
Other comprehensive income (expense) as of December 31, 2014 (72.9) 0.5 (72.4)
Foreign exchange gains and losses 183.8
183.8
Cash flow hedges (37.1) 6.6 (30.5)
- change in fair value (202.8)
- gains and losses reclassified to income 165.7
Available-for-sale assets (2.0)
(2.0)
- change in fair value (2.0)
- gains and losses reclassified to income
Unrecognised surplus of pension plan assets
Actuarial gains and losses (26.9)
(26.9)
Share in other comprehensive income of equity-accounted companies
Other comprehensive income (expense) as of June 30, 2015 117.8 6.6 124.4
2 Financial information for first-half 2015 – Condensed consolidated interim financial statements
2015 First-Half Report – Kering 60
A negative amount on the “Gains and losses reclassified to income” line item corresponds to a gain
recognised in the income statement.
Gains and losses on cash flow hedging instruments reclassified to income are recognised under gross
margin.
Gains and losses on available-for-sale financial assets reclassified to income are recognised under net
finance costs.
Note 13 Equity
As of June 30, 2015, the share capital amounted to €505,117,288 comprising 126,279,322 fully paid-up
shares with a par value of €4 each (126,226,490 shares with a par value of €4 each as of
December 31, 2014).
13.1. Kering treasury shares and options on Kering shares
During the first half of 2015, the number of shares held in treasury increased by 6,061 as a result of the
following transactions:
the acquisition of 932,055 shares under the liquidity agreement;
the disposal of 932,055 shares under the liquidity agreement;
the acquisition of 8,021 Kering shares to be allotted to employees under the 2011 and 2012
free share plans;
the allotment of 8,090 shares to employees under the May 2011 free share plan;
the acquisition of 125,000 Kering shares to be allotted to employees under the 2007 stock
purchase option plan;
the disposal of 118,870 shares to employees under the 2007 stock purchase option plan.
As a result of the various stock subscription options exercised in the first half of 2015, the share capital
increased by 12,832 shares, bringing Kering’s share capital to 126,279,322 shares as of June 30, 2015.
On May 26, 2004, Kering signed an agreement with a financial broker in order to improve the liquidity of
the Group’s shares and ensure share price stability. This agreement complies with the Professional
Code of Conduct drawn up by the French financial markets association (Association française des
marchés financiers – AMAFI) and approved by the French financial markets authority (Autorité des
marchés financiers – AMF). The agreement was initially endowed with €40 million, half of which was
provided in cash and half in Kering shares. An additional €20 million in cash was allocated to the
agreement on September 3, 2004, and a further €30 million on December 18, 2007.
As of June 30, 2015, Kering did not hold any treasury shares in connection with the liquidity agreement
(no treasury shares were held under the agreement as of December 31, 2014). Outside the scope of
the liquidity agreement, Kering held 27,598 treasury shares (21,537 treasury shares held as of
December 31, 2014).

Financial information for first-half 2015 – Condensed consolidated interim financial statements 2
61 2015 First-Half Report – Kering
13.2. Dividends
At the Ordinary General Meeting of April 23, 2015, held to approve the financial statements for the year
ended December 31, 2014, Kering's shareholders decided to pay a dividend of €4.00 per share in
respect of 2014.
The balance of the cash dividend for 2014 of €2.50 per share was paid on April 30, 2015, following the
payment of an interim cash dividend of €1.50 per share on January 26, 2015.
The total dividend payout therefore amounted to €504.9 million after taking account of treasury shares.
Note 14 Cash and cash equivalents
Cash and cash equivalents break down as follows:
(in € millions) June 30, 2015 June 30, 2014 Dec. 31, 2014
Cash 860.0 1,172.3 1,033.3
Cash equivalents 62.9 53.5 56.6
Total 922.9 1,225.8 1,089.9
As of June 30, 2015, cash equivalents include money-market funds (UCITS), certificates of deposit and
term deposits with a maturity of less than three months.
The items classified by the Group as cash and cash equivalents strictly comply with the AMF’s position
published in 2008 and updated in 2011 and 2013. In particular, cash investments are reviewed on a
regular basis in accordance with Group procedures and in strict compliance with the eligibility criteria set
out in IAS 7 and the AMF’s recommendations. As of June 30, 2015, no reclassifications were made as
a result of these reviews.
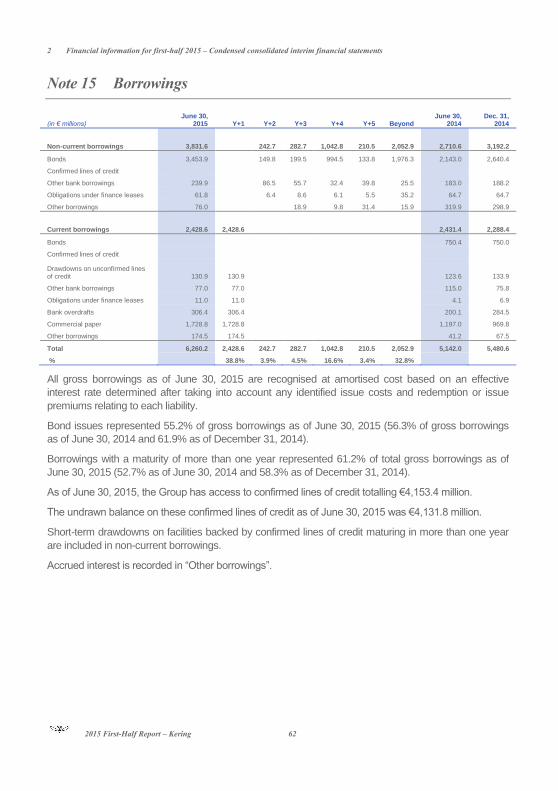
2 Financial information for first-half 2015 – Condensed consolidated interim financial statements
2015 First-Half Report – Kering 62
Note 15 Borrowings
(in € millions) June 30,
2015 Y+1 Y+2 Y+3 Y+4 Y+5 Beyond June 30,
2014 Dec. 31,
2014
Non-current borrowings 3,831.6
242.7 282.7 1,042.8 210.5 2,052.9 2,710.6 3,192.2
Bonds 3,453.9 149.8 199.5 994.5 133.8 1,976.3 2,143.0 2,640.4
Confirmed lines of credit
Other bank borrowings 239.9
86.5 55.7 32.4 39.8 25.5 183.0 188.2
Obligations under finance leases 61.8
6.4 8.6 6.1 5.5 35.2 64.7 64.7
Other borrowings 76.0
18.9 9.8 31.4 15.9 319.9 298.9
Current borrowings 2,428.6 2,428.6 2,431.4 2,288.4
Bonds 750.4 750.0
Confirmed lines of credit
Drawdowns on unconfirmed lines of credit 130.9 130.9
123.6 133.9
Other bank borrowings 77.0 77.0
115.0 75.8
Obligations under finance leases 11.0 11.0
4.1 6.9
Bank overdrafts 306.4 306.4
200.1 284.5
Commercial paper 1,728.8 1,728.8
1,197.0 969.8
Other borrowings 174.5 174.5 41.2 67.5
Total 6,260.2 2,428.6 242.7 282.7 1,042.8 210.5 2,052.9 5,142.0 5,480.6
% 38.8% 3.9% 4.5% 16.6% 3.4% 32.8%
All gross borrowings as of June 30, 2015 are recognised at amortised cost based on an effective
interest rate determined after taking into account any identified issue costs and redemption or issue
premiums relating to each liability.
Bond issues represented 55.2% of gross borrowings as of June 30, 2015 (56.3% of gross borrowings
as of June 30, 2014 and 61.9% as of December 31, 2014).
Borrowings with a maturity of more than one year represented 61.2% of total gross borrowings as of
June 30, 2015 (52.7% as of June 30, 2014 and 58.3% as of December 31, 2014).
As of June 30, 2015, the Group has access to confirmed lines of credit totalling €4,153.4 million.
The undrawn balance on these confirmed lines of credit as of June 30, 2015 was €4,131.8 million.
Short-term drawdowns on facilities backed by confirmed lines of credit maturing in more than one year
are included in non-current borrowings.
Accrued interest is recorded in “Other borrowings”.
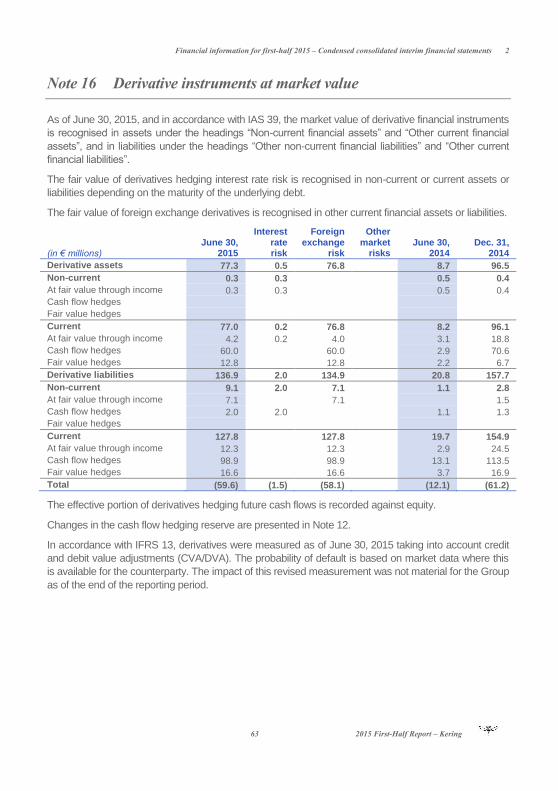
Financial information for first-half 2015 – Condensed consolidated interim financial statements 2
63 2015 First-Half Report – Kering
Note 16 Derivative instruments at market value
As of June 30, 2015, and in accordance with IAS 39, the market value of derivative financial instruments
is recognised in assets under the headings “Non-current financial assets” and “Other current financial
assets”, and in liabilities under the headings “Other non-current financial liabilities” and “Other current
financial liabilities”.
The fair value of derivatives hedging interest rate risk is recognised in non-current or current assets or
liabilities depending on the maturity of the underlying debt.
The fair value of foreign exchange derivatives is recognised in other current financial assets or liabilities.
(in € millions)
June 30, 2015
Interest
rate risk
Foreign
exchange risk
Other
market risks
June 30, 2014
Dec. 31, 2014
Derivative assets 77.3 0.5 76.8
8.7 96.5
Non-current 0.3 0.3 0.5 0.4
At fair value through income 0.3 0.3
0.5 0.4
Cash flow hedges
Fair value hedges
Current 77.0 0.2 76.8
8.2 96.1
At fair value through income 4.2 0.2 4.0
3.1 18.8
Cash flow hedges 60.0
60.0
2.9 70.6
Fair value hedges 12.8
12.8
2.2 6.7
Derivative liabilities 136.9 2.0 134.9 20.8 157.7
Non-current 9.1 2.0 7.1
1.1 2.8
At fair value through income 7.1
7.1
1.5
Cash flow hedges 2.0 2.0
1.1 1.3
Fair value hedges
Current 127.8 127.8 19.7 154.9
At fair value through income 12.3
12.3
2.9 24.5
Cash flow hedges 98.9
98.9
13.1 113.5
Fair value hedges 16.6 16.6 3.7 16.9
Total (59.6) (1.5) (58.1) (12.1) (61.2)
The effective portion of derivatives hedging future cash flows is recorded against equity.
Changes in the cash flow hedging reserve are presented in Note 12.
In accordance with IFRS 13, derivatives were measured as of June 30, 2015 taking into account credit
and debit value adjustments (CVA/DVA). The probability of default is based on market data where this
is available for the counterparty. The impact of this revised measurement was not material for the Group
as of the end of the reporting period.

2 Financial information for first-half 2015 – Condensed consolidated interim financial statements
2015 First-Half Report – Kering 64
Note 17 Accounting classification and market value of financial
instruments
The basis of measurement for financial instruments and the market value of these instruments as of
June 30, 2015 are presented below:
June 30, 2015
Breakdown by accounting classification
(in € millions)
Carrying amount
Market value
Fair value through income
Available-for-sale financial assets
Loans and receivables
Amortised cost
Non-current assets
Non-current financial assets 464.2 464.2
166.8
297.1
Current assets
Trade receivables 1,115.2 1,115.2
1,115.2
Other current financial assets 86.7 86.7
9.7
Cash and cash equivalents 922.9 922.9
62.9 860.0
Non-current liabilities
Non-current borrowings 3,831.6 3,978.1
3,831.6
Other non-current financial liabilities 9.1 9.1
Current liabilities
Current borrowings 2,428.6 2,428.6
2,428.6
Other current financial liabilities 129.0 129.0
1.2
Trade payables 1,051.1 1,051.1
1,051.1
As of June 30, 2015, the following methods were used to price financial instruments:
Financial instruments other than derivatives recorded in assets:
Carrying amounts are based on reasonable estimates of market value, with the exception of marketable
securities and investments in non-consolidated companies, whose market value was determined based
on the last known stock market price as of June 30, 2015 for listed securities.
Financial instruments other than derivatives recorded in liabilities:
The market value of listed bonds was determined on the basis of the last market price at the end of the
reporting period.
The market value of other borrowings was calculated using other valuation techniques such as
discounted future cash flows, taking into account the Group's credit risk and interest rate conditions as
of the end of the reporting period.

Financial information for first-half 2015 – Condensed consolidated interim financial statements 2
65 2015 First-Half Report – Kering
June 30, 2014
Dec. 31, 2014
Derivatives
qualifying for hedge
accounting
Derivatives not qualifying for
hedge accounting
Carrying amount
Market value
Carrying amount
Market value
0.3
303.3 303.3
400.0 400.0
988.2 988.2
1,030.0 1,030.0
72.8 4.2
18.8 18.8
106.3 106.3
1,225.8 1,225.8
1,089.9 1,089.9
2,710.6 2,881.4
3,192.2 3,424.9
2.0 7.1
1.1 1.1
2.8 2.8
2,431.4 2,449.9
2,288.4 2,292.2
115.5 12.3
19.7 19.7
346.8 346.8
929.8 929.8 982.8 982.8
Derivative financial instruments:
The market value of derivative financial instruments was provided by the financial institutions involved in
the transactions or calculated using standard valuation methods that factor in market conditions as of
the end of the reporting period.
The Group has identified three financial instrument categories based on the two valuation methods
used (listed prices and valuation techniques). In accordance with international accounting standards,
this classification is used as a basis for presenting the characteristics of financial instruments recognised
in the statement of financial position at fair value through income as of the end of the reporting period:
Level 1 category: financial instruments quoted on an active market;
Level 2 category: financial instruments whose fair value is determined using valuation techniques
drawing on observable market inputs;
Level 3 category: financial instruments whose fair value is determined using valuation techniques
drawing on non-observable inputs (inputs whose value does not result from the price of observable
market transactions for the same instrument or from observable market data available as of the end of
the reporting period) or inputs which are only partly observable.
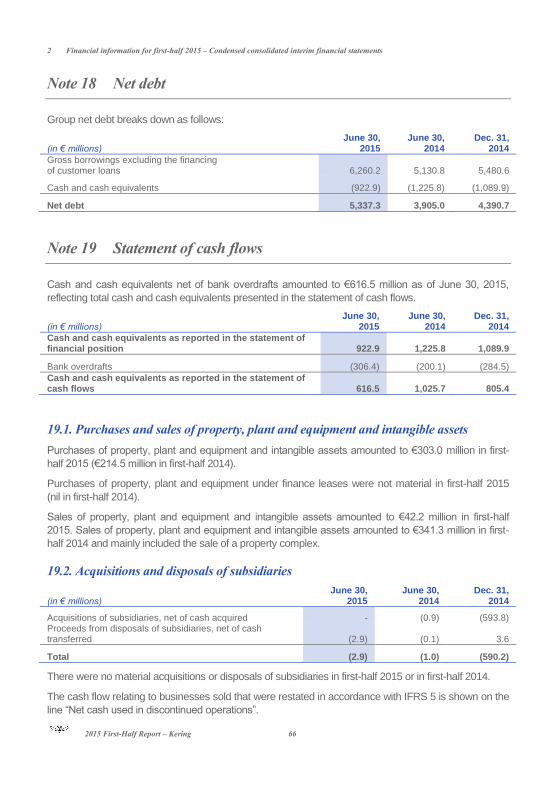
2 Financial information for first-half 2015 – Condensed consolidated interim financial statements
2015 First-Half Report – Kering 66
Note 18 Net debt
Group net debt breaks down as follows:
(in € millions)
June 30, 2015
June 30, 2014
Dec. 31, 2014
Gross borrowings excluding the financing of customer loans 6,260.2 5,130.8 5,480.6
Cash and cash equivalents (922.9) (1,225.8) (1,089.9)
Net debt 5,337.3 3,905.0 4,390.7
Note 19 Statement of cash flows
Cash and cash equivalents net of bank overdrafts amounted to €616.5 million as of June 30, 2015,
reflecting total cash and cash equivalents presented in the statement of cash flows.
(in € millions)
June 30, 2015
June 30, 2014
Dec. 31, 2014
Cash and cash equivalents as reported in the statement of financial position 922.9 1,225.8 1,089.9
Bank overdrafts (306.4) (200.1) (284.5)
Cash and cash equivalents as reported in the statement of cash flows 616.5 1,025.7 805.4
19.1. Purchases and sales of property, plant and equipment and intangible assets
Purchases of property, plant and equipment and intangible assets amounted to €303.0 million in first-
half 2015 (€214.5 million in first-half 2014).
Purchases of property, plant and equipment under finance leases were not material in first-half 2015
(nil in first-half 2014).
Sales of property, plant and equipment and intangible assets amounted to €42.2 million in first-half
2015. Sales of property, plant and equipment and intangible assets amounted to €341.3 million in first-
half 2014 and mainly included the sale of a property complex.
19.2. Acquisitions and disposals of subsidiaries
(in € millions)
June 30, 2015
June 30, 2014
Dec. 31, 2014
Acquisitions of subsidiaries, net of cash acquired - (0.9) (593.8) Proceeds from disposals of subsidiaries, net of cash transferred (2.9) (0.1) 3.6
Total (2.9) (1.0) (590.2)
There were no material acquisitions or disposals of subsidiaries in first-half 2015 or in first-half 2014.
The cash flow relating to businesses sold that were restated in accordance with IFRS 5 is shown on the
line “Net cash used in discontinued operations”.
Financial information for first-half 2015 – Condensed consolidated interim financial statements 2
67 2015 First-Half Report – Kering
19.3. Increase/decrease in share capital and other transactions with owners
In both first-half 2015 and first-half 2014, transactions with owners were not material.
19.4. Treasury share transactions
During the first half of 2015, the number of shares held in treasury increased by 6,061 as a result of the
following transactions:
the acquisition of 932,055 shares under the liquidity agreement;
the disposal of 932,055 shares under the liquidity agreement;
the acquisition of 8,021 Kering shares to be allotted to employees under the 2011
and 2012 free share plans;
the allotment of 8,090 shares to employees under the May 2011 free share plan;
the acquisition of 125,000 Kering shares to be allotted to employees under the
2007 stock purchase option plan;
the disposal of 118,870 shares to employees under the 2007 stock purchase
option plan.
During the first half of 2014, the impact of acquisitions and disposals of treasury shares resulted from:
the acquisition of 945,220 shares under the liquidity agreement;
the disposal of 922,470 shares under the liquidity agreement;
the acquisition of 55,000 Kering shares to be allotted to employees under the
2010 and 2012 free share plans;
the allotment of 59,206 shares to employees under the May 2010 and April 2012
free share plans;
the acquisition of 100,000 Kering shares to be allotted to employees under the
2006 and 2007 stock purchase option plans;
the disposal of 123,626 shares to employees under the 2006 and 2007 stock
purchase option plans.
19.5. Debt issues and redemptions
Kering redeemed the €750 million worth of bonds that matured in April 2015. These bonds comprised a
first tranche issued in 2010 for €500 million which was topped up in 2012 by a €250 million tranche
when the overall coupon was raised to 3.75%.
New borrowings during the period included the new bond financing put in place during the first half of
2015 for a total of €818 million, mainly comprising (i) a €500 million issue of seven-year bonds in
May 2015 with a fixed-rate annual coupon of 0.875%, and (ii) two issues of notes in foreign currency – a
USD 150 million issue in March 2015 of five-year floating-rate notes, and a USD 150 million issue in
June 2015 of six-year fixed-rate notes with an annual coupon of 2.887%.
Changes in other borrowings chiefly comprise issues and redemptions of Kering Finance commercial
paper.
2 Financial information for first-half 2015 – Condensed consolidated interim financial statements
2015 First-Half Report – Kering 68
Note 20 Contingent liabilities, contractual commitments not
recognised and other contingencies
20.1. Commitments given and received following asset disposals
Commitments given and received following asset disposals have not significantly changed compared
with the commitments described in Note 34 to the consolidated financial statements in the 2014
Reference Document.
20.2. Other changes
To the best of the Group’s knowledge, there were no other material developments regarding other
commitments given or received by the Group or contingent liabilities.
Note 21 Related parties controlling the Group
Kering is controlled by Artémis, which in turn is wholly owned by Société Financière Pinault. As of
June 30, 2015, the Artémis group held 41.2% of Kering’s share capital and 57.7% of its voting rights.
The main transactions carried out between Kering’s consolidated companies and Artémis in first-half
2015 are described below:
balancing payment of the dividend for 2014 of €130.1 million, further to the
payment of an interim dividend of €77.5 million in January 2015 (€193.6 million for
2013);
recognition in the first half of 2015 of fees totalling €1.4 million (€1.2 million paid in
respect of 2014) for (i) business development consulting services and complex
transaction support, and (ii) the supply of development opportunities, new
business and cost reduction solutions. These fees are governed by an agreement
reviewed by the Audit Committee and approved by the Board of Directors;
sale of an interest held by Kering Netherlands BV in Global Fashion Holding SA
(GFH) to Témaris SA (a subsidiary of Artémis) for a sale price of €12.8 million
based on the valuation of GFH established from a recent capital increase; this sale
was subject to a regulated agreement authorised in advance by the Board of
Directors.
Note 22 Subsequent events
No significant event has occurred between June 30, 2015 and July 27, 2015, when the Board of
Directors approved the condensed consolidated interim financial statements.
Statutory Auditors’ review report 2
69 2015 First-Half Report – Kering
3. Statutory Auditors’ review report on the
interim financial information For the six months ended June 30, 2015
This is a free translation into English of the Statutory Auditors’ review report issued in French and is provided solely
for the convenience of English speaking readers. This report should be read in conjunction with, and construed in
accordance with, French law and professional auditing standards applicable in France.
To the Shareholders,
In compliance with the assignment entrusted to us by your Annual General Meeting and in
accordance with the requirements of article L.451-1-2 III of the French Monetary and Financial
Code (Code monétaire et financier), we hereby report to you on:
the review of the accompanying condensed consolidated interim financial statements of
Kering for the six months ended June 30, 2015;
the verification of the information contained in the interim management report.
These condensed consolidated interim financial statements are the responsibility of the Board of
Directors. Our role is to express a conclusion on these financial statements based on our review.
1. Conclusion on the financial statements
We conducted our review in accordance with professional standards applicable in France. A review
of interim financial information consists of making inquiries, primarily of persons responsible for
financial and accounting matters, and applying analytical and other review procedures. A review is
substantially less in scope than an audit conducted in accordance with professional standards
applicable in France and consequently does not enable us to obtain assurance that we would
become aware of all significant matters that might be identified in an audit. Accordingly, we do not
express an audit opinion.
Based on our review, nothing has come to our attention that causes us to believe that the
accompanying condensed consolidated interim financial statements have not been prepared, in all
material respects, in accordance with IAS 34 – Interim Financial Reporting, as adopted by the
European Union.
2. Specific verification
We have also verified the information given in the interim management report on the condensed
consolidated interim financial statements subject to our review. We have no matters to report as to
its fair presentation and its consistency with the condensed consolidated interim financial
statements.
Paris La Défense and Neuilly-sur-Seine, July 27, 2015
The Statutory Auditors
KPMG Audit
A division of KPMG SA
Hervé Chopin
Deloitte & Associés
Frédéric Moulin
2 Statement by the persons responsible for the interim financial report
2015 First-Half Report – Kering 70
4. Statement by the persons responsible for
the interim financial report
We certify that, to our knowledge, the condensed consolidated interim financial statements for the
six months ended June 30, 2015 have been prepared in accordance with applicable accounting
standards and give a true and fair view of the assets, liabilities, financial position and results of the
Company and the undertakings included in the consolidation, and that the interim management
report gives a fair description of the material events that occurred in the first six months of the
financial year and their impact on the interim financial statements, as well as a description of the
principal risks and uncertainties for the remaining six months of the year, along with the principal
transactions with related parties.
Paris, July 27, 2015
Jean-François Palus, Group Managing Director
Jean-Marc Duplaix, Chief Financial Officer
French joint-stock company (société anonyme) with share capital of €505,065,960
Registered office: 10 avenue Hoche – 75381 Paris cedex 08
552 075 020 RCS Paris
Tel.: +33 (0)1 45 64 61 00
kering.com
This document was produced by an Imprim'Vert-certified eco-friendly printer
on PEFC-certified paper made from wood sourced from responsibly managed forests.