
First-half 2019 report
24
13.08.2019 1 First-half 2019 report Conference & webcast for investors, analysts & media Disclaimer This presentation contains certain forward-looking statements that reflect the current views of management. Such statements are subject to known and unknown risks, uncertainties and other factors that may cause actual results, performance or achievements of the Straumann Group to differ materially from those expressed or implied in this presentation. The Group is providing the information in this presentation as of this date and does not undertake any obligation to update any statements contained in it as a result of new information, future events or otherwise. The availability and indications/claims of the products illustrated and mentioned in this presentation may vary according to country. 2
Transcript of First-half 2019 report

13.08.2019
1
First-half 2019 reportConference & webcast for investors, analysts & media
Disclaimer
This presentation contains certain forward-looking statements that reflect the
current views of management. Such statements are subject to known and
unknown risks, uncertainties and other factors that may cause actual results,
performance or achievements of the Straumann Group to differ materially from
those expressed or implied in this presentation. The Group is providing the
information in this presentation as of this date and does not undertake any
obligation to update any statements contained in it as a result of new information,
future events or otherwise.
The availability and indications/claims of the products illustrated and mentioned in
this presentation may vary according to country.
2

13.08.2019
2
Agenda
First-half highlights
Business and regional review
Recent highlights – Executing our strategy
2019 Outlook
Q&A and upcoming events
Half-year highlightsMarco Gadola, CEO

13.08.2019
3
Strong H1 – solid fundamentals – FY guidance raised
REVENUE REVENUE GROWTH EBIT MARGIN
CHF 780m +16% organic27.5% core1
26.3% excl. exceptionals
FX headwind: CHF -16m
Acquisition effect: CHF +5m
Q2: +16% organic; +14% in CHF
Q1: +17% organic; +15% in CHF
Strong topline growth improves profitability
KEY LAUNCHES BUSINESS DEVELOPMENT OUTLOOK
BLX enters full market releaseFurther partnerships &
investmentsRaised
Next-generation fully-tapered implant
system launched in EMEA (Q2) & North
America (Q3)
Collaborations with leading DSO and scanner
companies; investments in lower-value
implant segment, 3D printing materials,
aligner design/planning, & new subsidiaries
Full-year organic revenue expected to grow
in the low-to-mid-teen percentage range
(previous guidance: low teens)
5
1 The Group is reporting alternative performance measures in accordance with a new SIX directive. These facilitate the assessment of the underlying business performance but may
differ from IFRS reported figures. The ‘core’ figures in this document exclude one-time M&A effects, exceptional pension-plan items, restructuring expenses, amortization and impairment
of goodwill and acquisition-related intangible assets. Please see reconciliation tables in slides 17, 43 and 44.
Revenue growth continues in the mid-teens
NAM
LATAM
Q1 2019 +17.4%
Q2 2019 +18.8%
Q1 2019 +19.7%
Q2 2019 +17.6%
Q1 2019 +14.4%
Q2 2019 +12.9%
Q1 2019 +22.1%
Q2 2019 +16.0%
Group
Q1 2019 +17.1%
Q2 2019 +15.6%
EMEA
APAC
(Organic revenue growth)
6

13.08.2019
4
Further value created for shareholders
Revenue growth in% excl. acquisition
and FX effects
Core EPS
665.6
780.0
H1 2018 H1 2019
+16%
organic
27.4 27.5
H1 2018 H1 2019
9.45
10.64
H1 2018 H1 2019
+10bps+80bps ex FX
+13%
Core EBIT
margin
7
9.1
13.1
15.7
18.9
16.3
2015 2016 2017 2018 H1 2019
27.6% 28.3%29.3% 29.6%
31.5%
0
100
200
300
400
2015 2016 2017 2018 H1 2019
EBITDA excl. exceptionals Exceptionals Underlying margin
5-year performance
5-year organic revenue growth 5-year EBITDA1 (in CHF m) and margin
Market
growth est. 4-5%
A v e r a g e + 1 5 % + 3 . 9 % - p o i n t s
81 Adjusted for non-recurring or exceptional effects if applicable.

13.08.2019
5
Business and regional reviewPeter Hackel, CFO
Continued double-digit growth across all regions
15.84.9
40.1
35.4
23.410.6
Revenues
H1 2018
FX effect M&A effect Adjusted
revenue
base
LATAM Revenues
H1 2019
APAC
670.6
North
America
EMEA
681.5
780.0
14.5%
CHF16.3% organic
Revenue development (in CHF m, rounded)
Change in organic growth
18.1% 18.5%13.6% 18.9% 37%
32%
21%
10% LatinAmerica
AsiaPacific
NorthAmerica
EMEA
Regional share of
organic growth
10

13.08.2019
6
Healthy growth in Group’s largest regions, EMEA &
North America
Strong Q2 (despite late Easter), lifted
by launches/roll-outs including BLX
Eastern Europe & Middle East fuel
growth
Excellent performances in Austria,
Belgium, France, Hungary, Norway,
Russia, South Africa and distributor
markets
Further customer gains in Q2; DSO
business expands
Strong demand for premium & non-
premium implants, and clear aligners
Biomaterials lifted by Emdogain, Jason
Membrane and cross-selling
opportunities
Revenue change (organic)
56%
North America
EMEA
43% of Group
30% of Group
12.9% 14.4%
19.3%
11.9%
17.0%
9.8%
Q2Q1 2019Q4Q3Q2Q1 2018
18.8% 17.4%
23.6%
19.5% 19.0% 17.2%
Q2Q1 2019Q4Q3Q2Q1 2018
11
APAC builds on exceptional prior year;
LATAM benefits from new businesses & improved environment
Q2: China continues dynamic
expansion, building on major rollouts in
prior year
Significant contributions to growth from
Australia &Thailand
Foothold strengthened in highly
competitive non-premium arena
Q2: double-digit growth throughout
region as economic environment
improves
Neodent & Straumann implants drive
performance, boosted by biomaterials,
with added lift from clear aligners
Implant and clear-aligner production
expansion project advances
Revenue change (organic)
56%
Latin America
APAC
19% of Group
9% of Group
17.6%19.7%
26.5%
13.0%
20.0%21.5%
Q2Q1 2019Q4Q3Q2Q1 2018
16.0%
22.1%21.2%
33.1%32.5%
25.0%
Q2Q1 2019Q4Q3Q2Q1 2018
12

13.08.2019
7
Dynamic clear-aligner and biomaterials business
Implants BiomaterialsRestorative &
Digital
13
Exceptional effects in H1 2019
The exclusion of one-time or exceptional items facilitates like-for-like comparisons and helps to
understand underlying performance. In line with the new SIX requirement and international practice
in the sector to disclose such Alternative Performance Measures (APM), the Group has started to
present its income statement on a ‘core’ basis. Core figures exclude exceptional items as well as
acquisition-related asset amortizations.
In the first six months of 2019, the following items were considered ‘non-core’:
The Align Technology patent dispute settlement charge of CHF 25.5m or CHF 22.3m after tax
(‘Administrative expense’)
Fire damage at Dental Wings: CHF 6.8m (‘COGS’) and CHF 2.3m (‘Administrative expense’)
Insurance coverage to date amounts to CHF 8.7m (‘Other income’)
Amortization of acquisition-related intangible assets of CHF 8.9m (EBIT level)
Consolidation gains of CHF 6.0m related to the acquisition/consolidation of Zinedent, Anthogyr,
Abutment Direct and Valoc (below EBIT)
Reconciliation tables are shown on page 12 of the media release and in slides 17, 43 and 44.
14

13.08.2019
8
Core financials at a glance
15
placeholder
In CHF million, rounded H1 2019% of
revenue
Margin
change
Change
in %Comments
Revenue 780.0 100.0% 14.5%
COGS (177.5) 22.8% (11.2%)
GROSS PROFIT 602.5 77.2% 60bps 15.5%
Operating expenses (388.4) 49.8% (15.8%)
EBIT 214.1 27.5% 10bps 14.8%FX headwind -70bps
IFRS16 +20bps
Financial result (10.7) 1.4% (87.1%)3m additional interest
expenses due to IFRS16
Associates (1.4) 0.2% (7.1%)
Income tax (32.5) 4.2% (23.6%)
NET PROFIT 169.6 21.7% (80bps) 10.8%
Basic EPS 10.64 12.6%
Reported financials at a glance
16
placeholder
In CHF million, rounded H1 2019% of
revenue
Margin
change
Change
in %Comments
Revenue 780.0 100.0% 14.5%
COGS (185.0) 23.7 (9.8%) Fire damage at Dental Wings
GROSS PROFIT 595.0 76.3% 100bps 16.0%
Operating expenses (415.8) 53.3 (21.2%) Align patent settlement costs
EBIT 179.3 23.0% (190bps) 5.6%FX headwind -70bps
IFRS16 +20bps
Financial result (10.7) 1.4% (87.1%)Additional interest
expenses due to IFRS16
Associates (1.4) 0.2% 84.9% Impairment in H1 2018
Gain on consolidation 6.0 0.8%Full consolidation of
former associates
Income tax (26.7) 3.4% (21.4%)
NET PROFIT 146.5 18.8% (70bps) 10.2%
Basic EPS 9.21 12.3%
13.08.2019
9
17
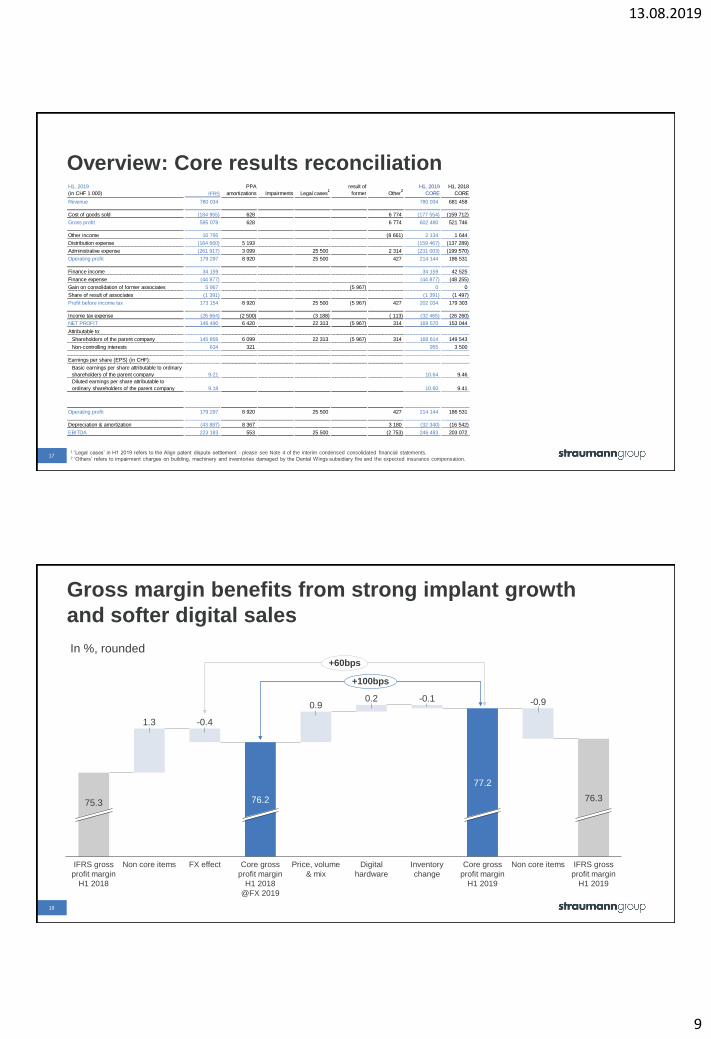
Overview: Core results reconciliation
1 ‘Legal cases’ in H1 2019 refers to the Align patent dispute settlement - please see Note 4 of the interim condensed consolidated financial statements. 2 ‘Others’ refers to impairment charges on building, machinery and inventories damaged by the Dental Wings subsidiary fire and the expected insurance compensation.
H1, 2019
(in CHF 1 000) IFRS
PPA
amortizations Impairments Legal cases1
Consolidation
result of
former Other2
H1, 2019
CORE
H1, 2018
CORE
Revenue 780 034 0 0 0 0 0 780 034 681 458
Cost of goods sold (184 955) 628 0 0 0 6 774 (177 554) (159 712)
Gross profit 595 078 628 0 0 0 6 774 602 480 521 746
Other income 10 795 0 0 0 0 (8 661) 2 134 1 644
Distribution expense (164 660) 5 193 0 0 0 0 (159 467) (137 289)
Administrative expense (261 917) 3 099 0 25 500 0 2 314 (231 003) (199 570)
Operating profit 179 297 8 920 0 25 500 0 427 214 144 186 531
Finance income 34 159 0 0 0 0 0 34 159 42 525
Finance expense (44 877) 0 0 0 0 0 (44 877) (48 255)
Gain on consolidation of former associates 5 967 0 0 0 (5 967) 0 0 0
Share of result of associates (1 391) 0 0 0 0 0 (1 391) (1 497)
Profit before income tax 173 154 8 920 0 25 500 (5 967) 427 202 034 179 303
Income tax expense (26 664) (2 500) 0 (3 188) 0 ( 113) (32 465) (26 260)
NET PROFIT 146 490 6 420 0 22 313 (5 967) 314 169 570 153 044
Attributable to:
Shareholders of the parent company 145 856 6 099 0 22 313 (5 967) 314 168 614 149 543
Non-controlling interests 634 321 0 0 0 0 955 3 500
Earnings per share (EPS) (in CHF):
Basic earnings per share attributable to ordinary
shareholders of the parent company 9.21 10.64 9.46
Diluted earnings per share attributable to
ordinary shareholders of the parent company 9.18 10.60 9.41
Operating profit 179 297 8 920 0 25 500 0 427 214 144 186 531
Depreciation & amortization (43 887) 8 367 0 0 0 3 180 (32 340) (16 542)
EBITDA 223 183 553 0 25 500 0 (2 753) 246 483 203 072
Core results reconciliation
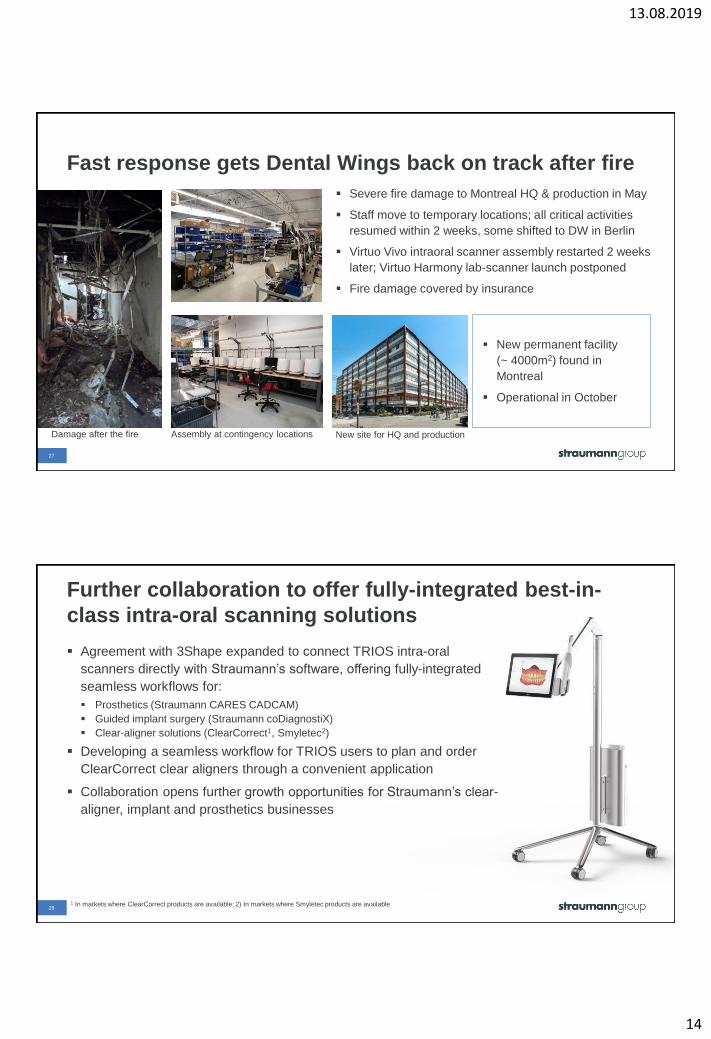
Gross margin benefits from strong implant growth
and softer digital sales
1.3
0.90.2
Non core items
-0.4
-0.1
Inventory
change
75.3
Core gross
profit margin
H1 2018
@FX 2019
-0.9
Non core itemsPrice, volume
& mix
76.3
IFRS gross
profit margin
H1 2019
76.2
FX effect Digital
hardware
Core gross
profit margin
H1 2019
77.2
IFRS gross
profit margin
H1 2018
+60bps
+100bps
In %, rounded
18

13.08.2019
10
Core EBIT margin exceeds 27% despite adverse FX
effects
In %, rounded
2.5 1.0 0.2
IFRS16Non core
items
Core EBIT
margin H1
2019
Administration
expenses
-4.5
-0.1
Distribution
expense
IFRS EBIT
margin H1
2019
Core EBIT
margin H1
2018 @FX
2019
FX effect Gross profit
improvement
Non core
items
-0.7 -0.3
24.9
26.727.5
23.0
IFRS EBIT
margin H1
2018
+10bps
+80bps
191 The adoption of the new leasing standard IFRS16 led to a change of the H1 2019 EBIT margin of 20bps (CHF +1.9m). The prior
year basis was not restated.
1
Acquisitions and expansion add to global team
5474
5954
6882
0
1000
2000
3000
4000
5000
6000
7000
2018 HY 2018 FY 2019 HY
Headcount
55%
45%
928 new colleagues since 31 December
Organic increase
Acquired businesses
20

13.08.2019
11
Underlying net profit climbs 11%
In CHF m
132.9153.0
169.6
146.5
20.1
25.7
EBIT
improvement
IFRS net
profit H1
2018
Non-core
items
Core net
profit H1
2018
-1.7
Financial
result
Associates
-1.30.1
Core net
profit H1
2019
-23.1
Non-core
items
IFRS net
profit H1
2019
IFRS 16
impact
-6.2
Income
taxes
+11%
Net profit
margin
22.5%
Net profit
margin
21.7%
21 1 Special effect: Asset impairment of CHF 7.7 million related to the associated company RODO Medical Inc.
Operating cash flow invested in global production to
cater for future growth
16.2
12.8
6.7
-28.6
57.9
-0.5
Change non-cash
OPEX and share
based payments
IFRS 16 effect Change in interest,
taxes and others
EBITDA
improvement
Free cash
flow H1 2018
-11.0
Change in CAPEX Free cash
flow H1 2019
62.3
Change in NWC
-7%
In CHF m
FCF margin
7.4%
FCF margin
9.1%
Production expansion in
various Group sites; CHF 15
million related to Anthogyr
acquisition
22
Operating Cash Flow In CHF million Y/Y Change
H1 2018 106.7
H1 2019 130.8 22.6%

13.08.2019
12
Recent highlights – Executing our strategyMarco Gadola, CEO
BLX – highly appealing to customers
Full market release in most EMEA markets started in March
>30 000 BLX implants sold in H1, despite aggressive competitor
promotions
Innovative, next-generation BLX implant, priced at
a premium to Straumann’s popular BLT range
Launches in the Americas and Australia underway;
Brazil to follow soon; China and Japan expected 2020
Other markets to follow pending regulatory approvals
24

13.08.2019
13
Innovation stream continues e.g. in ceramics
25
1 Kajiwara N et al. Implant Dent 24(1):37-41. 2 Degidi M et al. J Periodontol. 2006 Jan;77(1):73-80. 3 Liñares A et al. J Clin Periodontol. 2016 Jun;43(6):538-46. 4 Erbshäuser M. Implantologie Journal
11 | 2015, 32-36. 5 Welander M et al. Clin Oral Implants Res. 2008 Jul;19(7):635-41. 6 Tetè S et al. Int J Oral Maxillofac Implants. 2009 Jan-Feb;24(1):52-8. 7 De Medeiros RA et al. J Contemp Dent
Pract 14(3):567- 572.8 S. Roehling, M et al. Clin. Oral Impl. Res. 26 (Suppl. 12), 2015. 9 Scarano A et al. J Periodontol. 2004 Feb;75(2):292-6.
Straumann® Ceramic Healing Abutments
Initiates soft-tissue contouring as implant integrates with bone
Benefits include more favorable soft-tissue attachment/integration
than titanium1-9
Available for all Straumann BL and BLT implants
Straumann® PUREloc retentive system
Attaches removable hybrid dentures to ceramic implants
Durable, precise, multiple removal strength options
Launched in CE-mark countries (others pending registration)
Clear-aligner business growing rapidly
H1: customer base expands >15%; case
growth +60%
Building to full market releases in Europe,
LATAM & APAC
Pilots in new countries; training and specialist
recruitment
First projects to integrate Dental Monitoring
initiated
Patent disputes with Align settled
+55%
case starts
y.o.y.
26
Q1 2018 Q2 Q3 Q4 Q1 2019 Q2
13.08.2019
14
Fast response gets Dental Wings back on track after fire
27
Damage after the fire Assembly at contingency locations
Severe fire damage to Montreal HQ & production in May
Staff move to temporary locations; all critical activities
resumed within 2 weeks, some shifted to DW in Berlin
Virtuo Vivo intraoral scanner assembly restarted 2 weeks
later; Virtuo Harmony lab-scanner launch postponed
Fire damage covered by insurance
New permanent facility
(~ 4000m2) found in
Montreal
Operational in October
New site for HQ and production
Further collaboration to offer fully-integrated best-in-
class intra-oral scanning solutions
281 In markets where ClearCorrect products are available; 2) In markets where Smyletec products are available
Agreement with 3Shape expanded to connect TRIOS intra-oral
scanners directly with Straumann’s software, offering fully-integrated
seamless workflows for:
Prosthetics (Straumann CARES CADCAM)
Guided implant surgery (Straumann coDiagnostiX)
Clear-aligner solutions (ClearCorrect1, Smyletec2)
Developing a seamless workflow for TRIOS users to plan and order
ClearCorrect clear aligners through a convenient application
Collaboration opens further growth opportunities for Straumann’s clear-
aligner, implant and prosthetics businesses

13.08.2019
15
Collaboration with Carestream in China
Group strengthens intra-oral-scanner (IOS) offering as market
emerges rapidly in China, where <4% of clinics have IOS
5-year distribution agreement to sell co-branded Carestream’s
CS3600 scanner, which is already approved in China
Local support from Carestream’s R&D, production & service center
in Shanghai
CS3600 certified for Straumann Group software (DWOS, DWOS
chairside design & coDiagnostiX)
Integrated solution with Smyletec clear aligners expected in Q4
Complements Straumann TRIOS 3, which is now registered
Regulatory approval for Group’s Virtuo Vivo IOS pending
29
Highly competitive portfolio of Straumann co-branded
intra-oral scanners
30
Virtuo Vivo TRIOS 4 CS3600
Extensive offering for all requirements
Partnerships to ensure availability
across regions and markets
Scanner Manufacturer Full colour Powder-free Speed AccuracyArtifact
deletion
Diagnostic
capabilitesAntifogging
DWOS
software
Virtuo Vivo Dental Wings
TRIOS 4 3Shape ()
CS3600 Carestream ()

13.08.2019
16
Further acquisitions to support our expanding digital
business
31
Yller Biomateriais S.A. Digital Planning Service Private Limited
• High-tech consumables for 3D printers &
orthodontic products
• Generating recurring revenues
• Located in Brazil
• 100% acquisition; expected closing by end
of August
• Treatment planning & diagnostics for clear
aligners
• Case planning service for ClearCorrect
• Located in Lahore, Pakistan; ~200 staff
• 100% acquisition; consolidated as of 30 July
2019
J. Doe
Recent agreements Key investment reasons
ScannersCarestream,
3Shape, Medit (lab)
• Fast entry to Chinese market
• Enablers for clear-aligner, implant and
prosthetics businesses
Software integration 3Shape, Medit• Recurring revenues (license fees)
• Integrated workflow
Consumables Yller Biomateriais • Recurring revenues
ServicesDigital Planning
Service Private Ltd• Insource/control service
Rationale for recent transactions in digital dentistry
32
13.08.2019
17
Premium brand
Upper value brands
Lower value brands
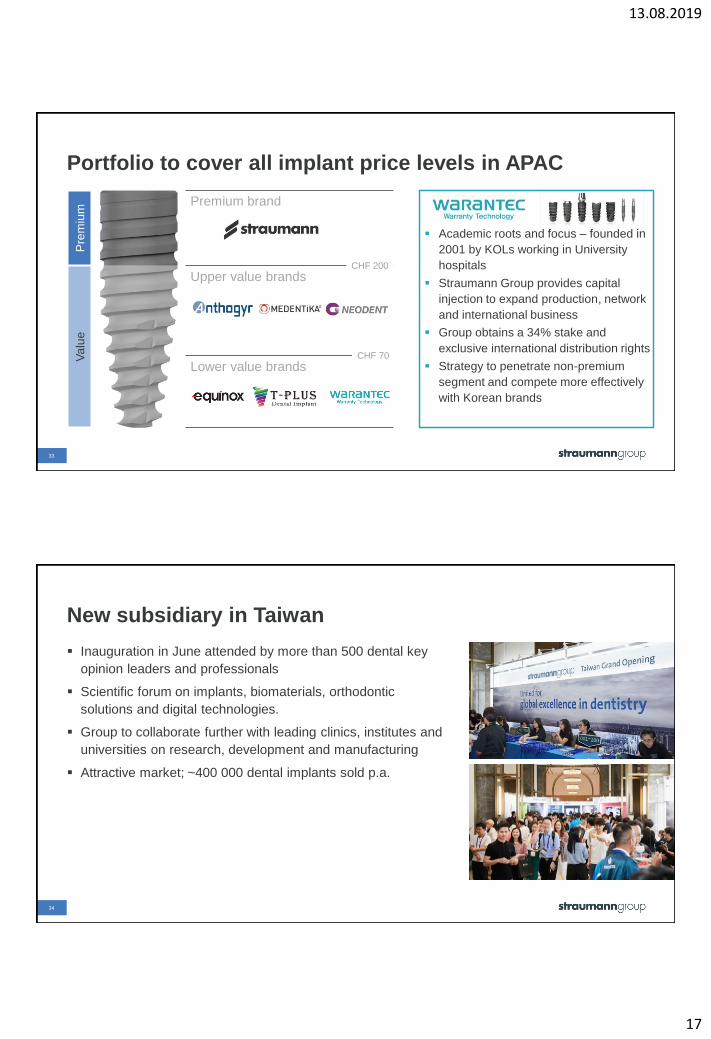
Portfolio to cover all implant price levels in APAC
Academic roots and focus – founded in
2001 by KOLs working in University
hospitals
Straumann Group provides capital
injection to expand production, network
and international business
Group obtains a 34% stake and
exclusive international distribution rights
Strategy to penetrate non-premium
segment and compete more effectively
with Korean brands
33
Pre
miu
mV
alu
e
CHF 200
CHF 70
New subsidiary in Taiwan
Inauguration in June attended by more than 500 dental key
opinion leaders and professionals
Scientific forum on implants, biomaterials, orthodontic
solutions and digital technologies.
Group to collaborate further with leading clinics, institutes and
universities on research, development and manufacturing
Attractive market; ~400 000 dental implants sold p.a.
34
13.08.2019
18
35
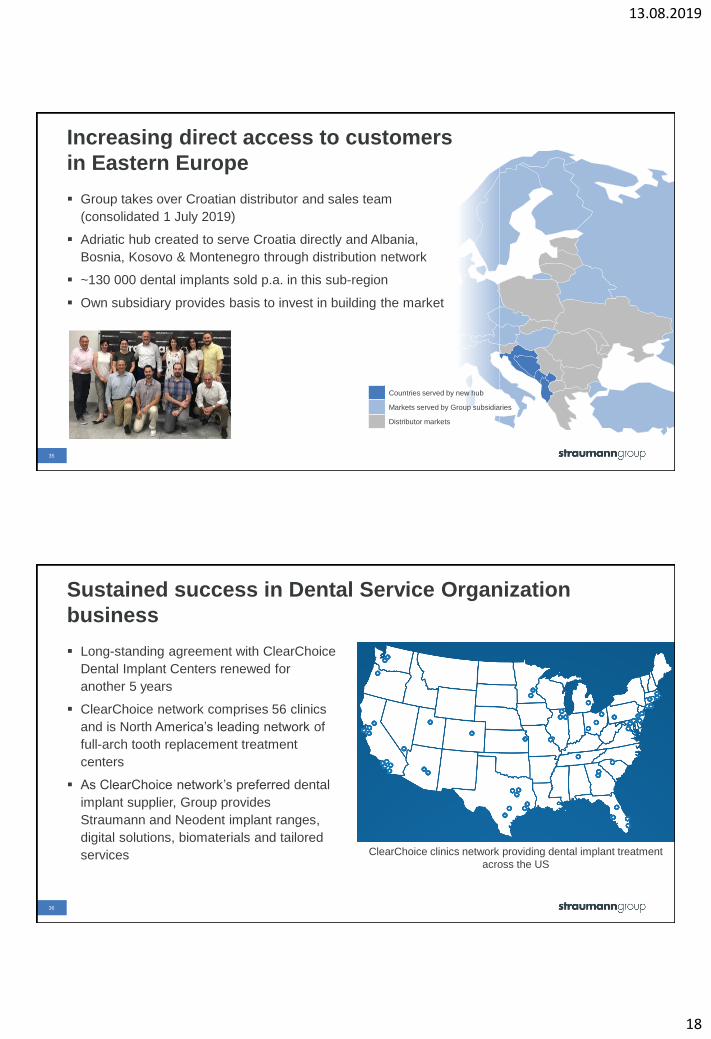
Increasing direct access to customers
in Eastern Europe
Group takes over Croatian distributor and sales team
(consolidated 1 July 2019)
Adriatic hub created to serve Croatia directly and Albania,
Bosnia, Kosovo & Montenegro through distribution network
~130 000 dental implants sold p.a. in this sub-region
Own subsidiary provides basis to invest in building the market
Countries served by new hub
Markets served by Group subsidiaries
Distributor markets
Sustained success in Dental Service Organization
business
Long-standing agreement with ClearChoice
Dental Implant Centers renewed for
another 5 years
ClearChoice network comprises 56 clinics
and is North America’s leading network of
full-arch tooth replacement treatment
centers
As ClearChoice network’s preferred dental
implant supplier, Group provides
Straumann and Neodent implant ranges,
digital solutions, biomaterials and tailored
services
36
ClearChoice clinics network providing dental implant treatment
across the US

13.08.2019
19
2019 Outlook
Our 2019 guidanceBarring unforeseen circumstances
Market growth
Our revenue
growth
Profitability
Global implant market
to continue growing at 4-5%
Core EBITDA and EBIT margin
improvements excluding FX and IFRS 16 effects
Group to outperform and achieve
organic revenue growth in
low to mid-teen percentage range
38
13.08.2019
20
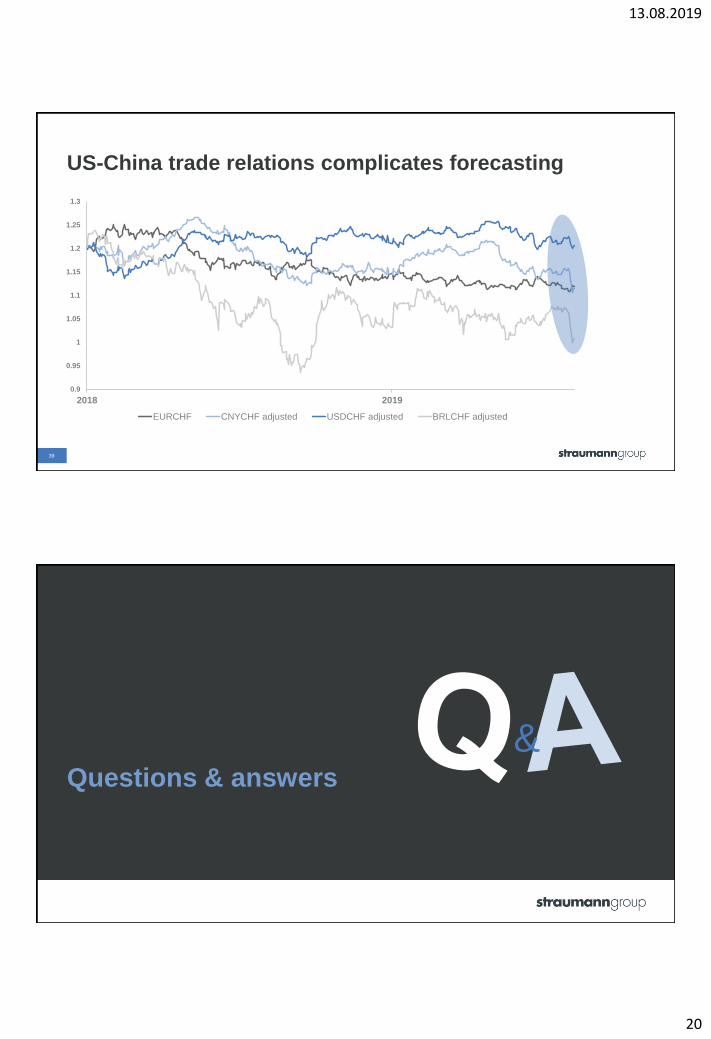
US-China trade relations complicates forecasting
39
0.9
0.95
1
1.05
1.1
1.15
1.2
1.25
1.3
2018 2019
EURCHF CNYCHF adjusted USDCHF adjusted BRLCHF adjusted
Questions & answers
&

13.08.2019
21
Marcel Kellerhals appointed Head of Investor Relations
& Corporate Finance
On 1 September Marcel Kellerhals will take over
responsibility for Investor Relations from Fabian
Hildbrand, who is leaving Straumann to pursue a
career opportunity in the consumer goods industry.
Marcel joined Straumann in 2018 as Head of Corporate
Finance, having spent 16 years in the global logistics
industry, prior to which he worked in client relationship
management for Swiss banks.
41
Calendar of upcoming events
2019 Event Location
29 August Healthcare reverse roadshow / Octavian Basel
03 September Investor meetings Milano
04 September Goldman Sachs Medtech conference London
05 September Investor meetings London
06 September UBS Best of Switzerland conference Zurich
16 September Investor meetings Toronto
17 September Investor meetings Boston
29 October Q3 sales update Webcast
Social media Type Source
Analyst Talk Executive interviewed by analysts Corporate Website / youtube
StraumannIR Investor Relations Twitter @StraumannIR
42

13.08.2019
22
Appendix
44
Overview: FY 2018 core results reconciliation
1 Non-core items relate to the acquisition of Batigroup, including an inventory revaluation expense of CHF 9m (COGS) and the related tax benefit of CHF 2m. 2 Impairment charge of
CHF 8 million for RODO Medical due to the delay in the development and commercialization of the company’s prosthetic-retention system.
FY 2018
(in CHF 1 000) IFRS
PPA
amortizations Impairments2
Legal cases
Consolidation
result of former
associates Other CORE
Revenue 1 363 560 0 0 0 0 0 1 363 560
Cost of goods sold1
(344 315) 8 887 0 0 0 0 (335 429)
Gross profit 1 019 245 8 887 0 0 0 0 1 028 132
Other income 3 424 0 0 0 0 0 3 424
Distribution expense (291 018) 10 033 0 0 0 0 (280 984)
Administrative expense (389 016) 5 871 0 0 0 0 (383 145)
Operating profit 342 635 24 791 0 0 0 0 367 426
Finance income 72 852 0 0 0 0 0 72 852
Finance expense (89 802) 0 0 0 0 0 (89 802)
Gain on consolidation of former associates 10 725 0 0 0 (10 725) 0 0
Share of result of associates (9 984) 0 7 688 0 0 0 (2 296)
Profit before income tax 326 426 24 791 7 688 0 (10 725) 0 348 180
Income tax expense (48 639) (6 611) 0 0 0 0 (55 250)
NET PROFIT 277 787 18 180 7 688 0 (10 725) 0 292 930
Attributable to:
Shareholders of the parent company 272 770 17 585 7 688 0 (10 725) 0 287 318
Non-controlling interests 5 017 595 0 0 0 0 5 612
Earnings per share (EPS) (in CHF):
Basic earnings per share attributable to ordinary
shareholders of the parent company 17.24 18.16
Diluted earnings per share attributable to ordinary
shareholders of the parent company 17.18 18.09
Operating profit 342 635 24 791 0 0 0 0 367 426
Depreciation & amortization (52 367) 15 980 0 0 0 0 (36 387)
EBITDA 395 002 8 811 0 0 0 0 403 813
FY 2018
(in CHF 1 000) IFRS
PPA
amortizations Impairments1
Legal cases
Consolidation
result of former
associates Other CORE
Revenue 1 363 560 1 363 560
STRAUMANN GRUPPE
Core results reconciliation – 2018

13.08.2019
23
45
Overview: H1 2018 core results reconciliation
3 Impairment charge of CHF 8 million for RODO Medical due to the delay in the development and commercialization of the company’s prosthetic-retention system.
CHF29%
EUR22%
USD/CAD/AUD26%
JPY3%
BRL8%
Other12%
CHF6%
EUR29%
USD/CAD/AUD31%
JPY5%
BRL8%
Other21%
Straumann Group’s currency exposure
1 These distribution charts represent the total net revenues and the total COGS, as well as OPEX in the various currencies. All numbers are rounded and based
on FY 2018 figures as well as average FX rates in 2017-18. They also include recent acquisitions and new subsidiaries.
Cost breakdown FY20181Revenue breakdown FY20181
Average exchange rates (rounded)FX sensitivity
(+/- 10%) on full-year...
2017 2018 YTD July 2019 Revenue EBIT
1 EURCHF 1.11 1.15 1.12 +/- 39m +/- 23m
1 USDCHF 0.98 0.98 0.99 +/- 37m +/- 17m
100 BRLCHF 30.69 26.87 25.86 +/- 11m +/- 2m
100 JPYCHF 0.87 0.88 0.91 +/- 7m +/- 4m
46

13.08.2019
24
Thank you


