First Financial Bankshares 1st qtr 2015
49
0 1st Quarter 2015 First Financial Bankshares, Inc.
-
Upload
first-financial-bankshares-inc -
Category
Business
-
view
493 -
download
3
Transcript of First Financial Bankshares 1st qtr 2015
0
1st Quarter 2015
First Financial Bankshares, Inc.
Forward Looking Statement
The numbers, as of and for the quarter ended March 31, 2015, contained within this presentation are
unaudited. Certain statements contained herein may be considered “forward-looking statements” as
defined in the Private Securities Litigation Reform Act of 1995. These statements are based upon the
belief of the Company’s management, as well as assumptions made beyond information currently
available to the Company’s management and, may be, but not necessarily are identified by such words
as “expect”, “plan”, “anticipate”, “target”, “forecast” and “goal”. Because such “forward-looking
statements” are subject to risks and uncertainties, actual results may differ materially from those
expressed or implied by such forward-looking statements. Factors that could cause actual results to
differ materially from the Company’s expectations include competition from other financial institutions
and financial holding companies; the effects of and changes in trade, monetary and fiscal policies and
laws, including interest rate policies of the Federal Reserve Board; changes in the demand for loans;
fluctuations in value of collateral and loan reserves; inflation, interest rate, market and monetary
fluctuations; changes in consumer spending, borrowing and savings habits; and acquisitions and
integration of acquired businesses, and similar variables. Other key risks are described in the
Company’s reports filed with the Securities and Exchange Commission, which may be obtained under
“Investor Relations-Documents/Filings” on the Company’s web site or by writing or calling the Company
at 325.627.7155. The Company does not undertake any obligation to update publicly or revise any
forward-looking statements herein because of new information, future events or otherwise.
2
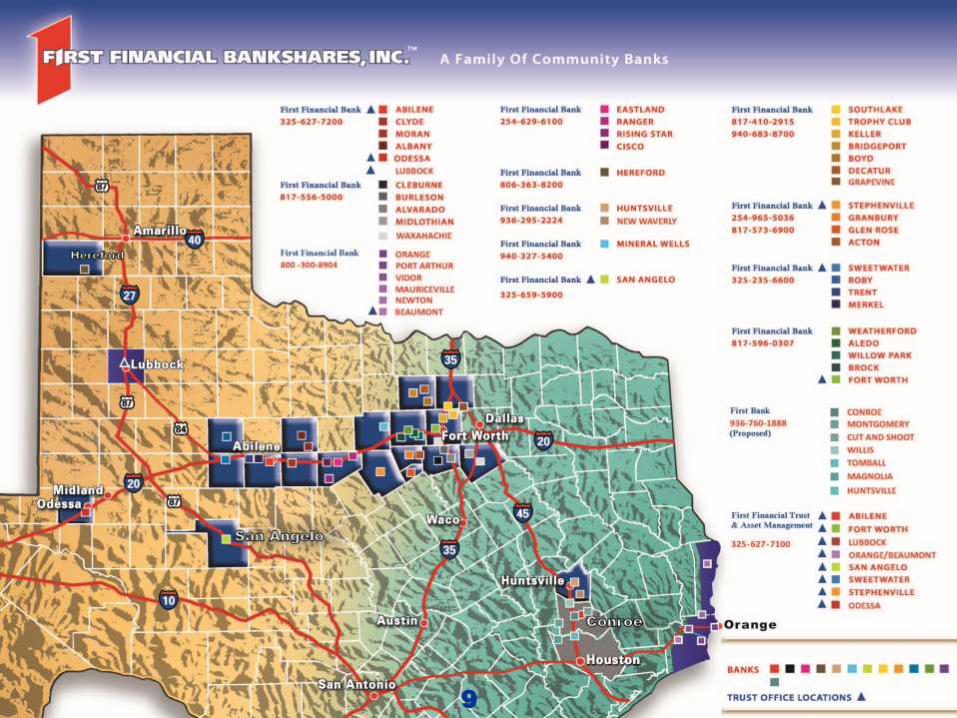
Who We Are
$6.0 billion financial holding company
headquartered in Abilene, Texas
Group of 12 separate regions
125-year history
Growth markets include 50 mile radius of
the larger cities of Texas

3
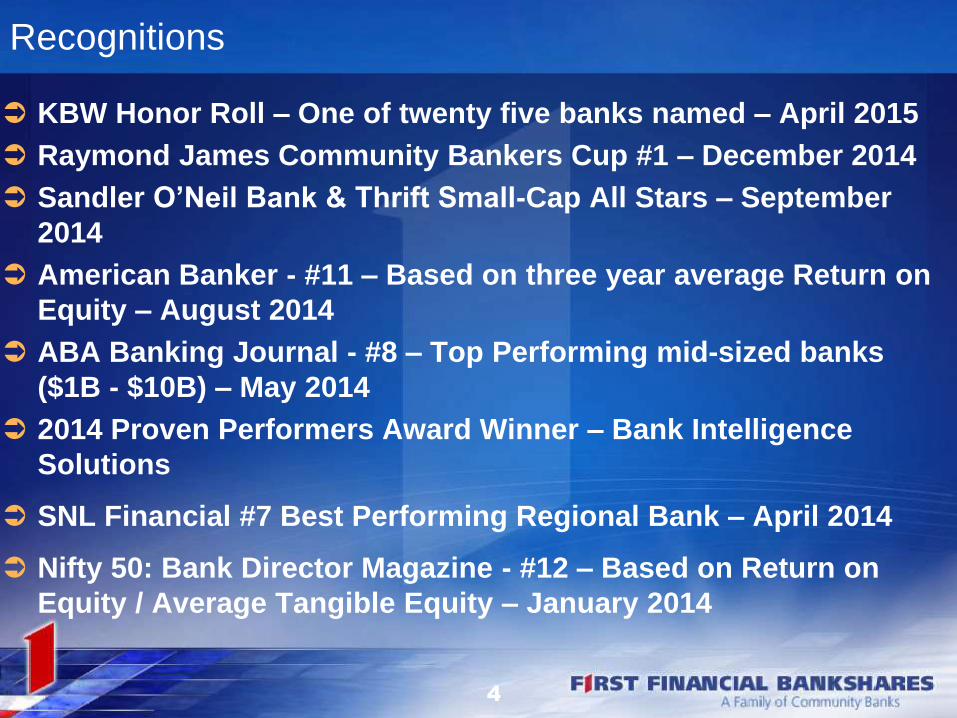
Recognitions
KBW Honor Roll – One of twenty five banks named – April 2015
Raymond James Community Bankers Cup #1 – December 2014
Sandler O’Neil Bank & Thrift Small-Cap All Stars – September
2014
American Banker - #11 – Based on three year average Return on
Equity – August 2014
ABA Banking Journal - #8 – Top Performing mid-sized banks
($1B - $10B) – May 2014
2014 Proven Performers Award Winner – Bank Intelligence
Solutions
SNL Financial #7 Best Performing Regional Bank – April 2014
Nifty 50: Bank Director Magazine - #12 – Based on Return on
Equity / Average Tangible Equity – January 2014
4
5
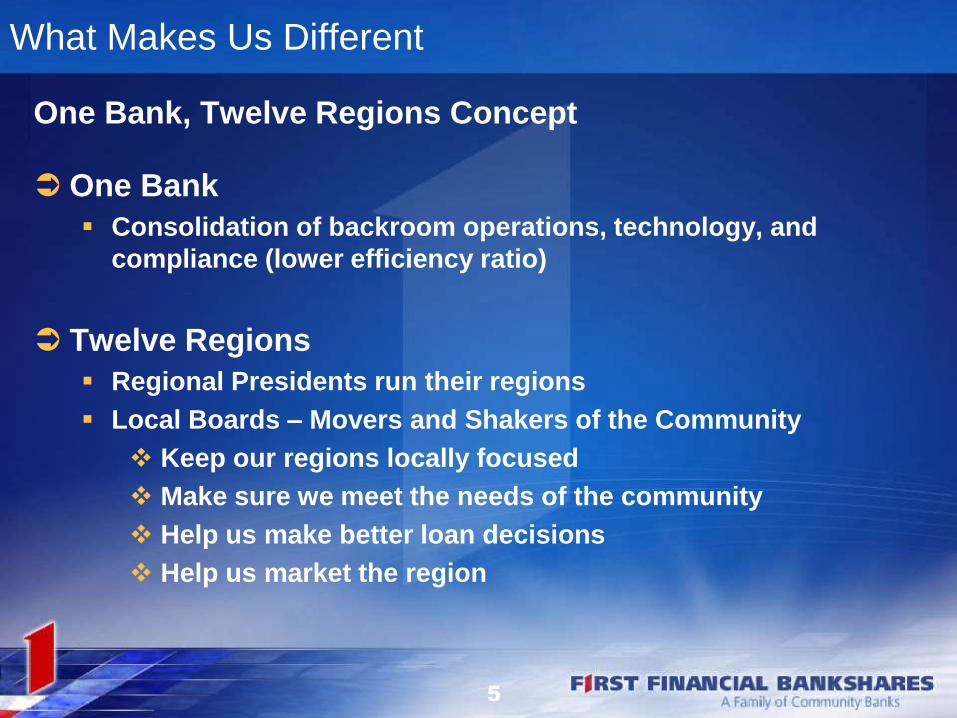
What Makes Us Different
One Bank, Twelve Regions Concept
One Bank
Consolidation of backroom operations, technology, and
compliance (lower efficiency ratio)
Twelve Regions
Regional Presidents run their regions
Local Boards – Movers and Shakers of the Community
Keep our regions locally focused
Make sure we meet the needs of the community
Help us make better loan decisions
Help us market the region
6
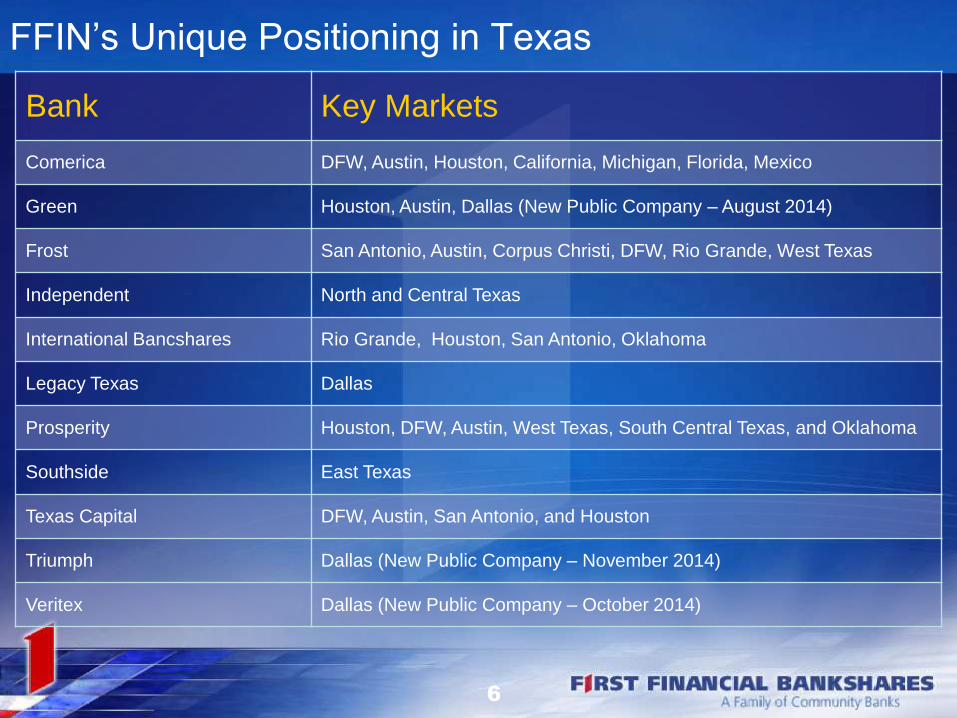
FFIN’s Unique Positioning in Texas
Bank Key Markets
Comerica DFW, Austin, Houston, California, Michigan, Florida, Mexico
Green Houston, Austin, Dallas (New Public Company – August 2014)
Frost San Antonio, Austin, Corpus Christi, DFW, Rio Grande, West Texas
Independent North and Central Texas
International Bancshares Rio Grande, Houston, San Antonio, Oklahoma
Legacy Texas Dallas
Prosperity Houston, DFW, Austin, West Texas, South Central Texas, and Oklahoma
Southside East Texas
Texas Capital DFW, Austin, San Antonio, and Houston
Triumph Dallas (New Public Company – November 2014)
Veritex Dallas (New Public Company – October 2014)
7
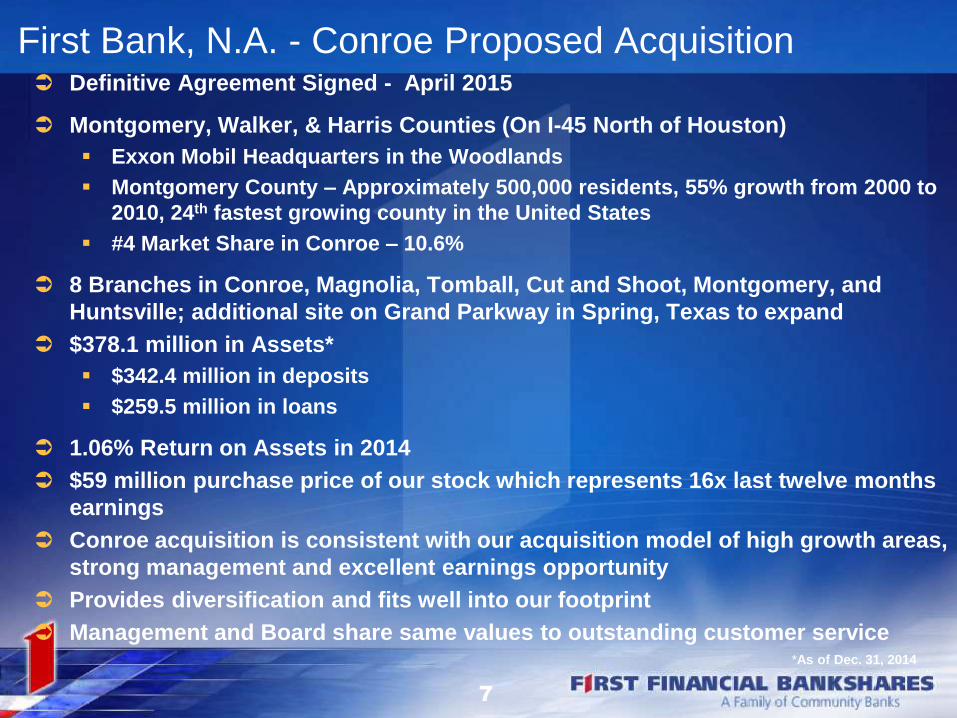
First Bank, N.A. - Conroe Proposed Acquisition Definitive Agreement Signed - April 2015
Montgomery, Walker, & Harris Counties (On I-45 North of Houston)
Exxon Mobil Headquarters in the Woodlands
Montgomery County – Approximately 500,000 residents, 55% growth from 2000 to
2010, 24th fastest growing county in the United States
#4 Market Share in Conroe – 10.6%
8 Branches in Conroe, Magnolia, Tomball, Cut and Shoot, Montgomery, and
Huntsville; additional site on Grand Parkway in Spring, Texas to expand
$378.1 million in Assets*
$342.4 million in deposits
$259.5 million in loans
1.06% Return on Assets in 2014
$59 million purchase price of our stock which represents 16x last twelve months
earnings
Conroe acquisition is consistent with our acquisition model of high growth areas,
strong management and excellent earnings opportunity
Provides diversification and fits well into our footprint
Management and Board share same values to outstanding customer service*As of Dec. 31, 2014
8
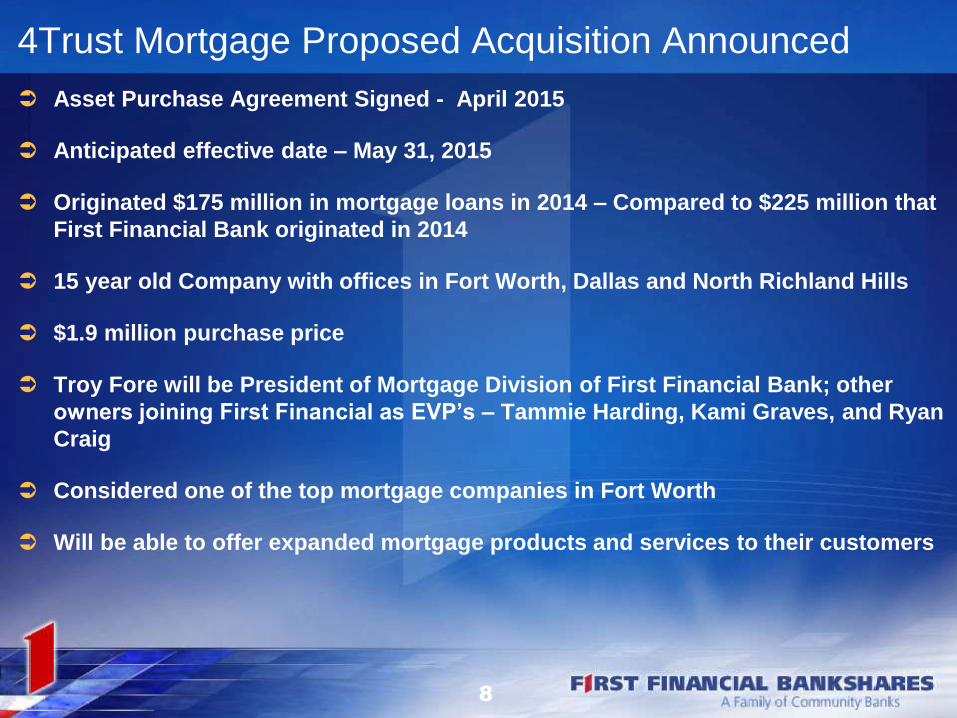
4Trust Mortgage Proposed Acquisition Announced
Asset Purchase Agreement Signed - April 2015
Anticipated effective date – May 31, 2015
Originated $175 million in mortgage loans in 2014 – Compared to $225 million that
First Financial Bank originated in 2014
15 year old Company with offices in Fort Worth, Dallas and North Richland Hills
$1.9 million purchase price
Troy Fore will be President of Mortgage Division of First Financial Bank; other
owners joining First Financial as EVP’s – Tammie Harding, Kami Graves, and Ryan
Craig
Considered one of the top mortgage companies in Fort Worth
Will be able to offer expanded mortgage products and services to their customers
9
10
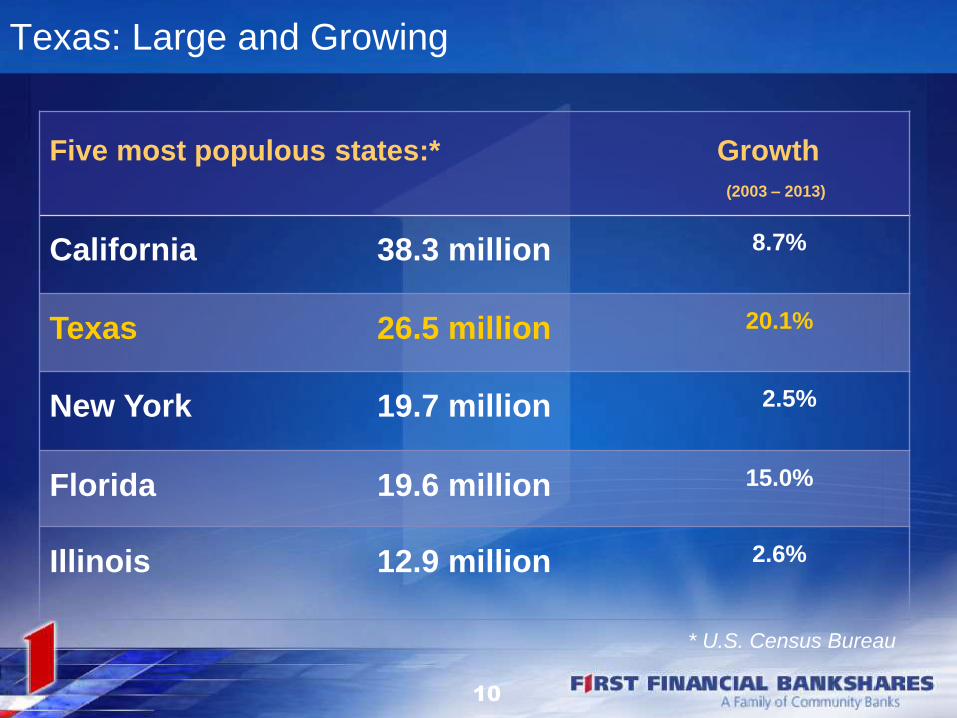
Texas: Large and Growing
Five most populous states:* Growth
(2003 – 2013)
California 38.3 million 8.7%
Texas 26.5 million 20.1%
New York 19.7 million 2.5%
Florida 19.6 million 15.0%
Illinois 12.9 million 2.6%
* U.S. Census Bureau
11
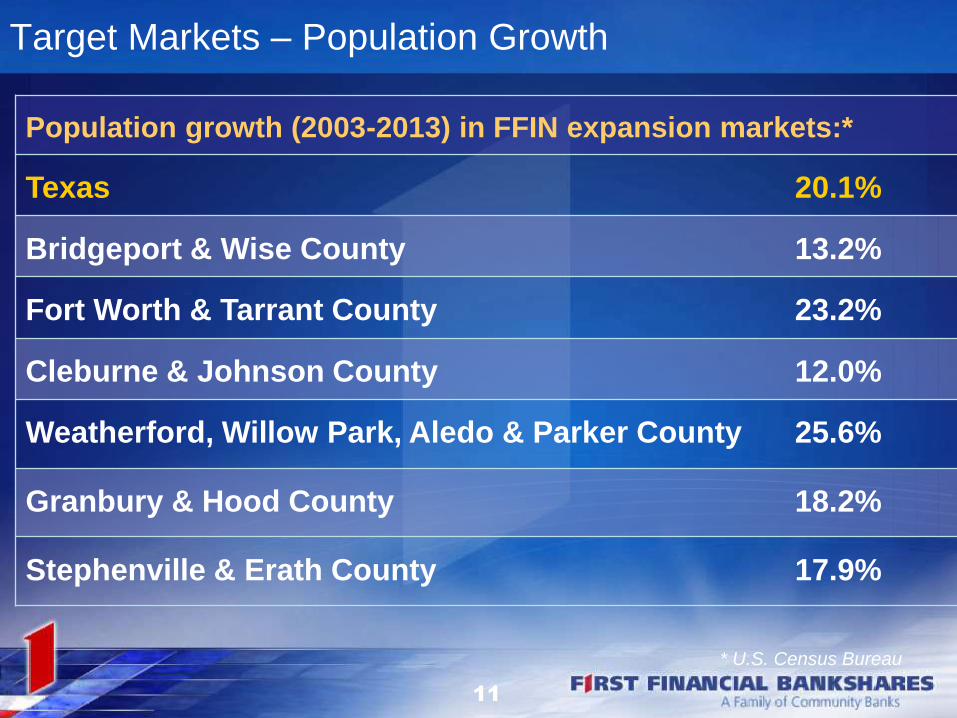
Target Markets – Population Growth
Population growth (2003-2013) in FFIN expansion markets:*
Texas 20.1%
Bridgeport & Wise County 13.2%
Fort Worth & Tarrant County 23.2%
Cleburne & Johnson County 12.0%
Weatherford, Willow Park, Aledo & Parker County 25.6%
Granbury & Hood County 18.2%
Stephenville & Erath County 17.9%
* U.S. Census Bureau
12
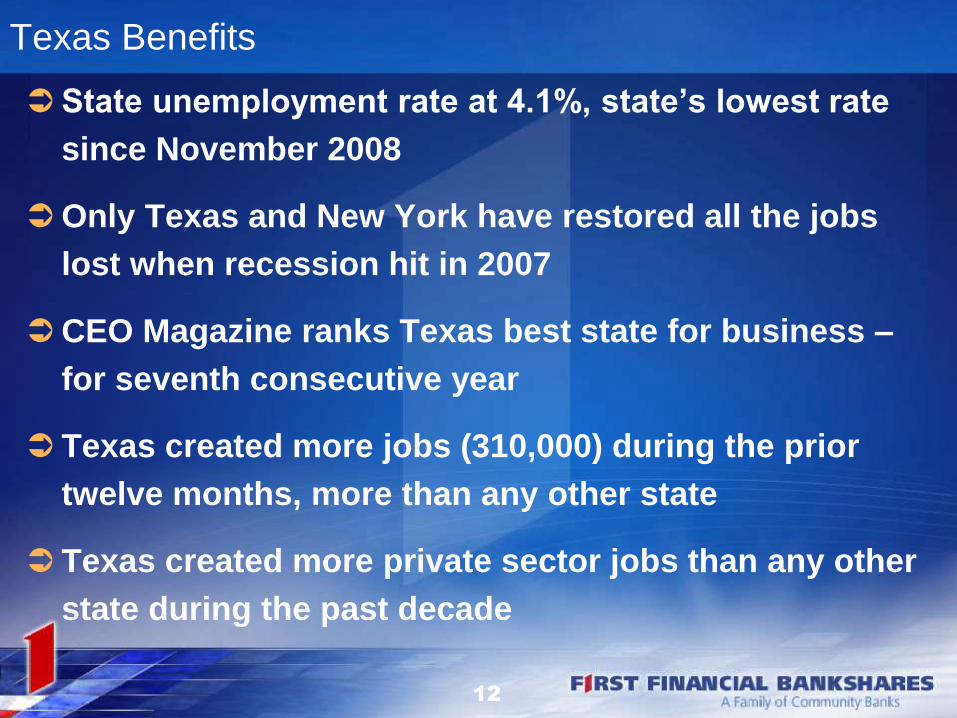
Texas Benefits
State unemployment rate at 4.1%, state’s lowest rate
since November 2008
Only Texas and New York have restored all the jobs
lost when recession hit in 2007
CEO Magazine ranks Texas best state for business –
for seventh consecutive year
Texas created more jobs (310,000) during the prior
twelve months, more than any other state
Texas created more private sector jobs than any other
state during the past decade
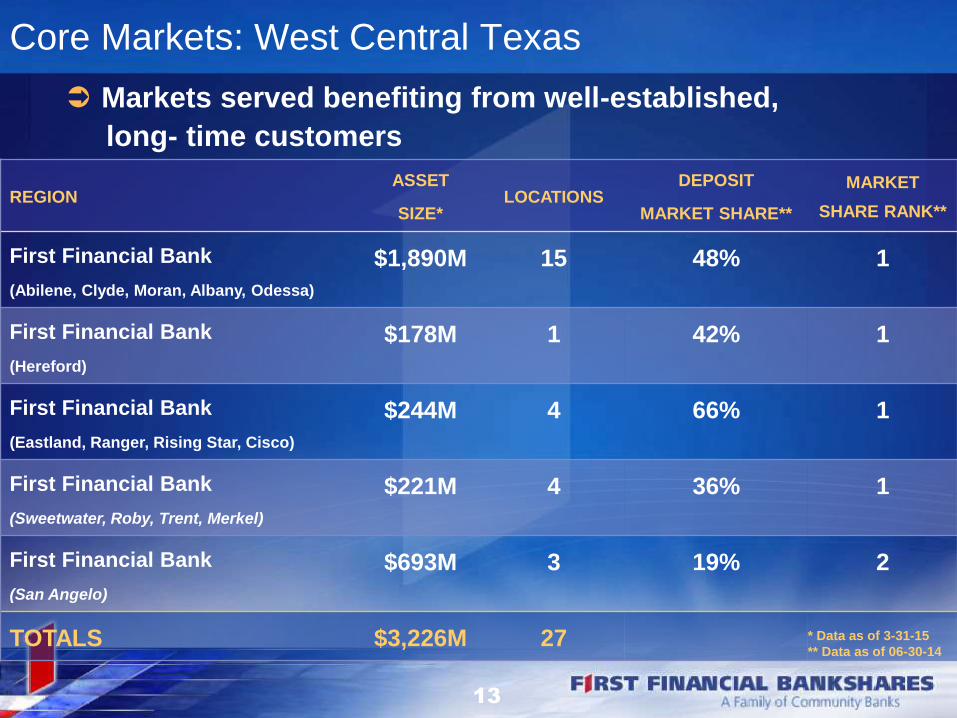
Core Markets: West Central Texas
Markets served benefiting from well-established,
long- time customers
REGIONASSET
SIZE*LOCATIONS
DEPOSIT
MARKET SHARE**
MARKET
SHARE RANK**
First Financial Bank
(Abilene, Clyde, Moran, Albany, Odessa)
$1,890M 15 48% 1
First Financial Bank
(Hereford)
$178M 1 42% 1
First Financial Bank
(Eastland, Ranger, Rising Star, Cisco)
$244M 4 66% 1
First Financial Bank
(Sweetwater, Roby, Trent, Merkel)
$221M 4 36% 1
First Financial Bank
(San Angelo)
$693M 3 19% 2
TOTALS $3,226M 27 * Data as of 3-31-15
** Data as of 06-30-14
13
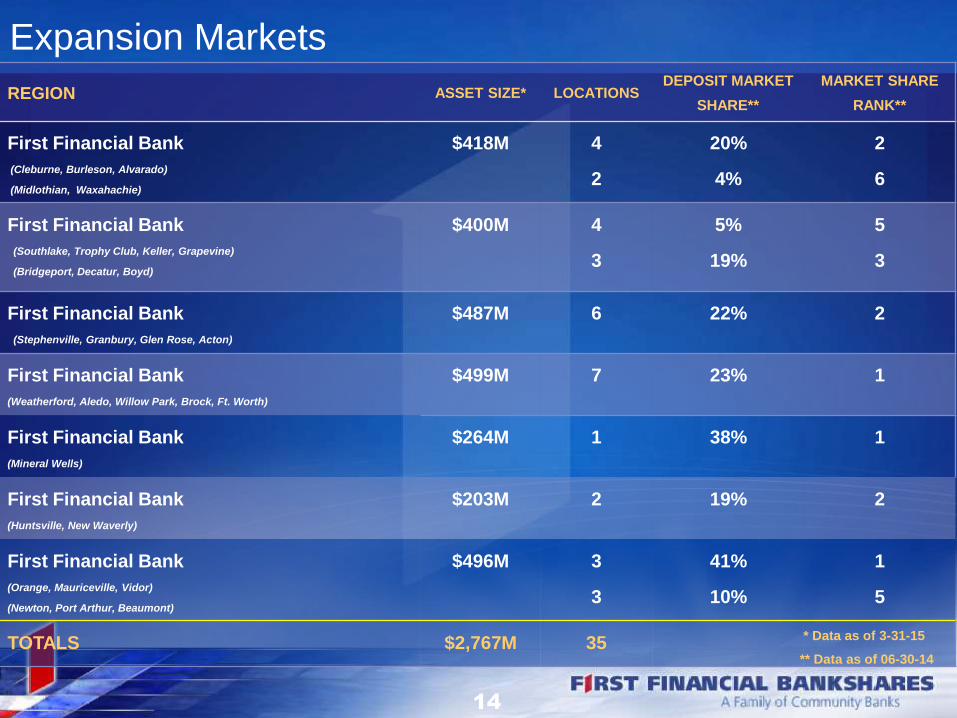
Expansion Markets
REGION ASSET SIZE* LOCATIONSDEPOSIT MARKET
SHARE**
MARKET SHARE
RANK**
First Financial Bank
(Cleburne, Burleson, Alvarado)
(Midlothian, Waxahachie)
$418M 4
2
20%
4%
2
6
First Financial Bank
(Southlake, Trophy Club, Keller, Grapevine)
(Bridgeport, Decatur, Boyd)
$400M 4
3
5%
19%
5
3
First Financial Bank
(Stephenville, Granbury, Glen Rose, Acton)
$487M 6 22% 2
First Financial Bank
(Weatherford, Aledo, Willow Park, Brock, Ft. Worth)
$499M 7 23% 1
First Financial Bank
(Mineral Wells)
$264M 1 38% 1
First Financial Bank
(Huntsville, New Waverly)
$203M 2 19% 2
First Financial Bank
(Orange, Mauriceville, Vidor)
(Newton, Port Arthur, Beaumont)
$496M 3
3
41%
10%
1
5
TOTALS $2,767M 35* Data as of 3-31-15
** Data as of 06-30-14
14
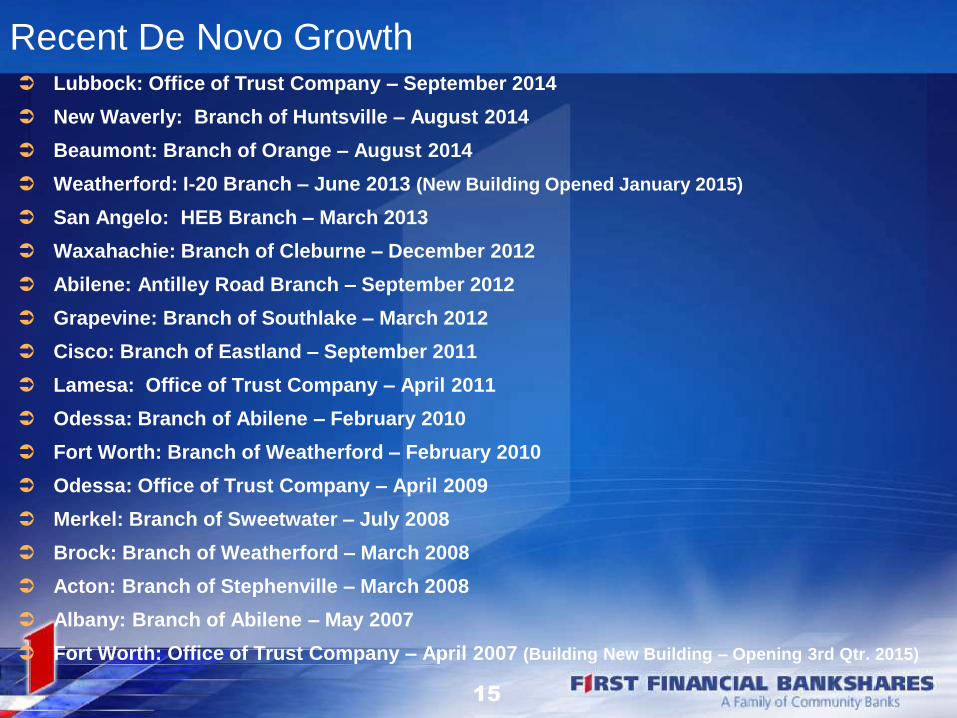
Recent De Novo Growth Lubbock: Office of Trust Company – September 2014
New Waverly: Branch of Huntsville – August 2014
Beaumont: Branch of Orange – August 2014
Weatherford: I-20 Branch – June 2013 (New Building Opened January 2015)
San Angelo: HEB Branch – March 2013
Waxahachie: Branch of Cleburne – December 2012
Abilene: Antilley Road Branch – September 2012
Grapevine: Branch of Southlake – March 2012
Cisco: Branch of Eastland – September 2011
Lamesa: Office of Trust Company – April 2011
Odessa: Branch of Abilene – February 2010
Fort Worth: Branch of Weatherford – February 2010
Odessa: Office of Trust Company – April 2009
Merkel: Branch of Sweetwater – July 2008
Brock: Branch of Weatherford – March 2008
Acton: Branch of Stephenville – March 2008
Albany: Branch of Abilene – May 2007
Fort Worth: Office of Trust Company – April 2007 (Building New Building – Opening 3rd Qtr. 2015)
15

Fort Worth – Forest Park Blvd. and Rosedale
16
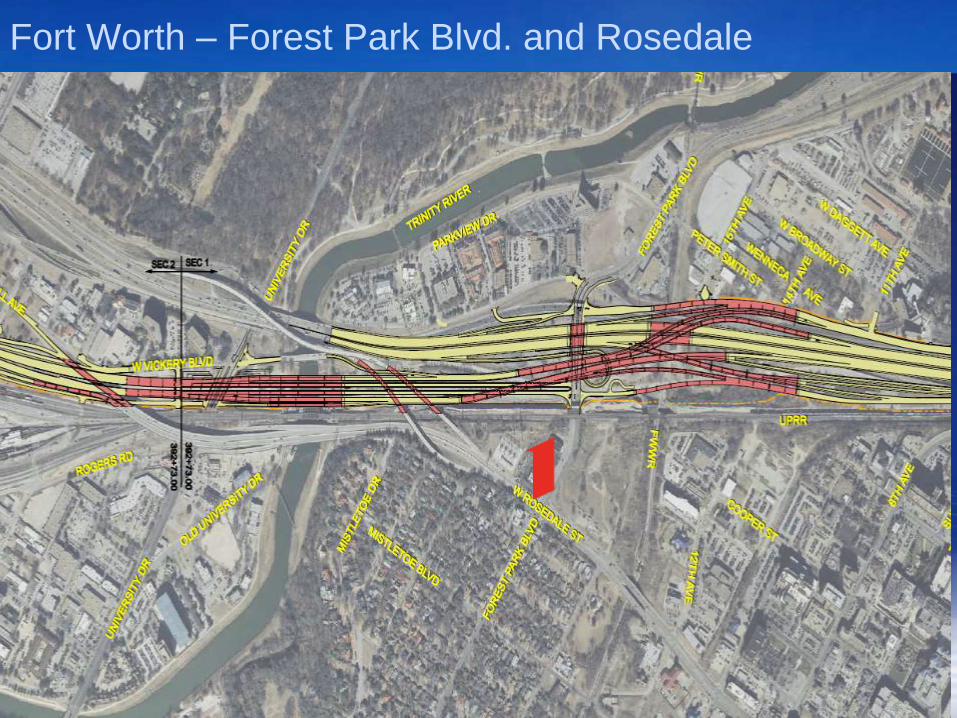
Fort Worth – Forest Park Blvd. and Rosedale
17
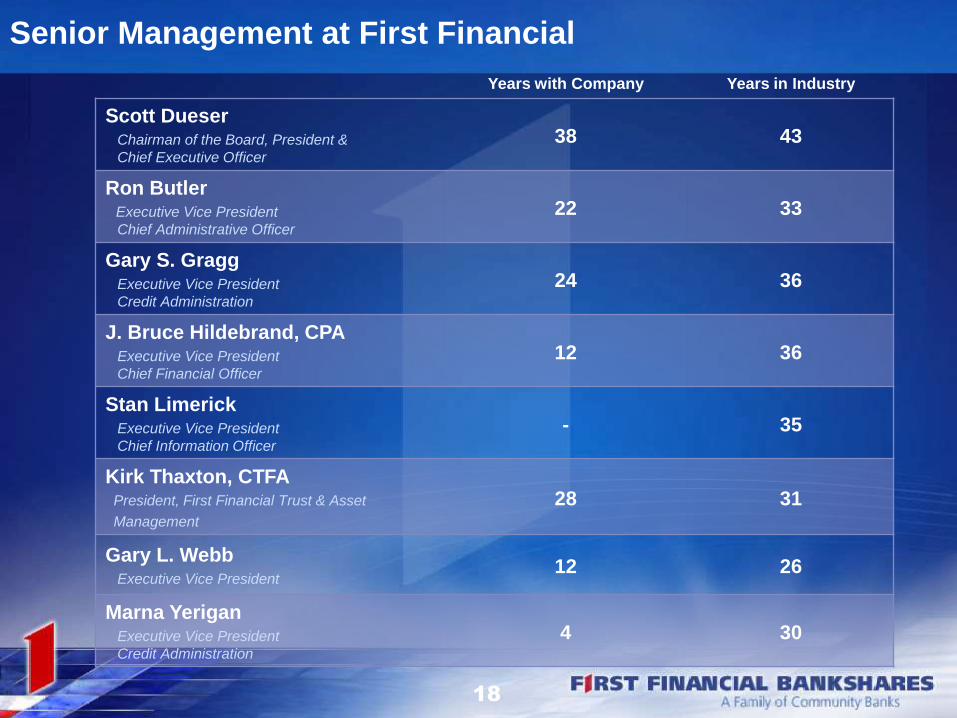
Years with Company Years in Industry
Scott DueserChairman of the Board, President &
Chief Executive Officer
38 43
Ron ButlerExecutive Vice President
Chief Administrative Officer
22 33
Gary S. GraggExecutive Vice President
Credit Administration
24 36
J. Bruce Hildebrand, CPAExecutive Vice President
Chief Financial Officer
12 36
Stan LimerickExecutive Vice President
Chief Information Officer
- 35
Kirk Thaxton, CTFAPresident, First Financial Trust & Asset
Management
28 31
Gary L. WebbExecutive Vice President
12 26
Marna YeriganExecutive Vice President
Credit Administration
4 30
Senior Management at First Financial
18
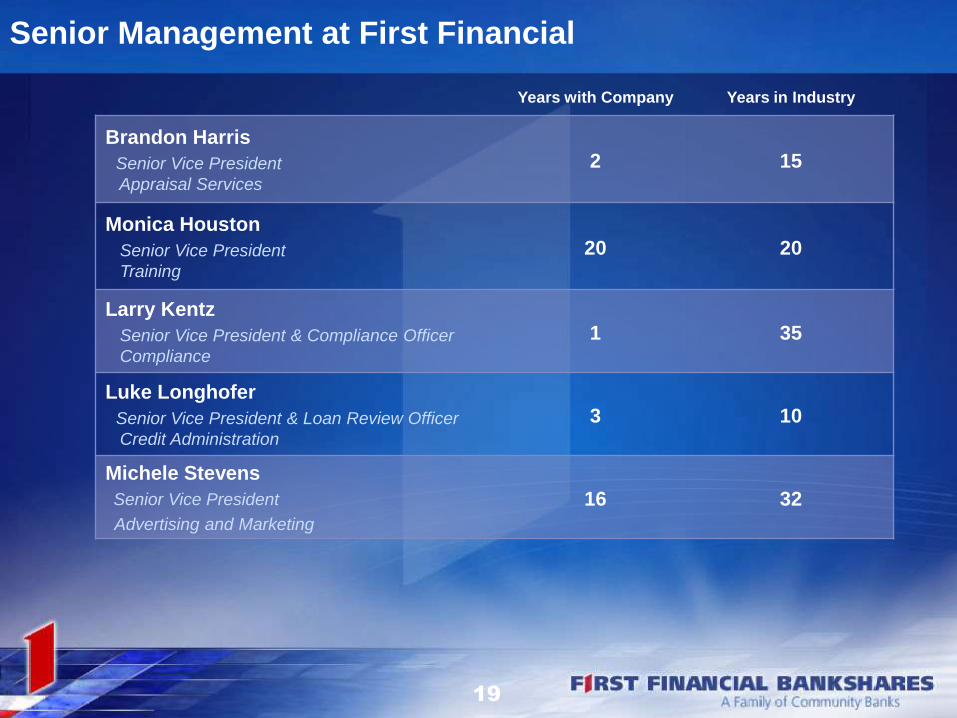
Years with Company Years in Industry
Brandon Harris
Senior Vice President
Appraisal Services
2 15
Monica Houston
Senior Vice President
Training
20 20
Larry Kentz
Senior Vice President & Compliance Officer
Compliance
1 35
Luke Longhofer
Senior Vice President & Loan Review Officer
Credit Administration
3 10
Michele Stevens
Senior Vice President
Advertising and Marketing
16 32
Senior Management at First Financial
19
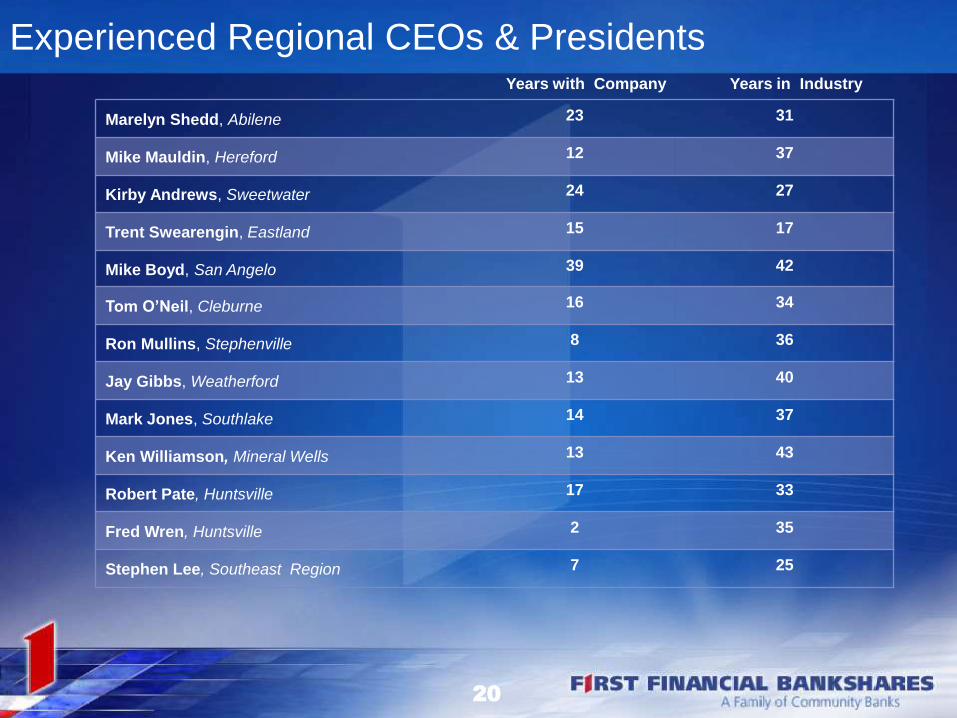
Experienced Regional CEOs & PresidentsYears with Company Years in Industry
Marelyn Shedd, Abilene 23 31
Mike Mauldin, Hereford 12 37
Kirby Andrews, Sweetwater 24 27
Trent Swearengin, Eastland 15 17
Mike Boyd, San Angelo 39 42
Tom O’Neil, Cleburne 16 34
Ron Mullins, Stephenville 8 36
Jay Gibbs, Weatherford 13 40
Mark Jones, Southlake 14 37
Ken Williamson, Mineral Wells 13 43
Robert Pate, Huntsville 17 33
Fred Wren, Huntsville 2 35
Stephen Lee, Southeast Region 7 25
20
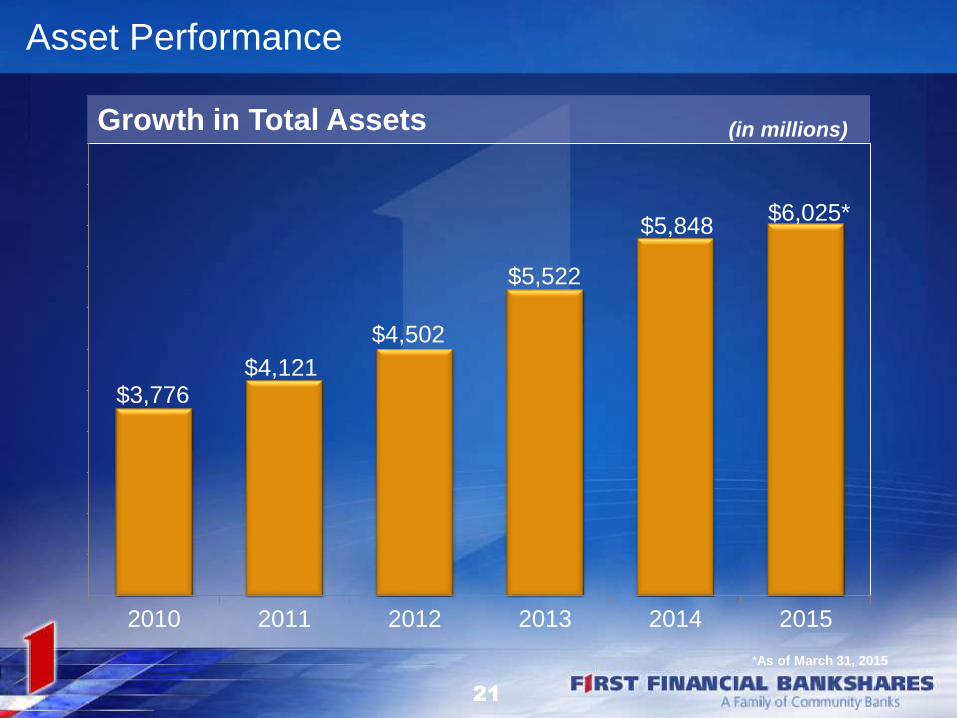
21
$3,776$4,121
$4,502
$5,522
$5,848$6,025*
2010 2011 2012 2013 2014 2015
Growth in Total Assets
Asset Performance
(in millions)
*As of March 31, 2015
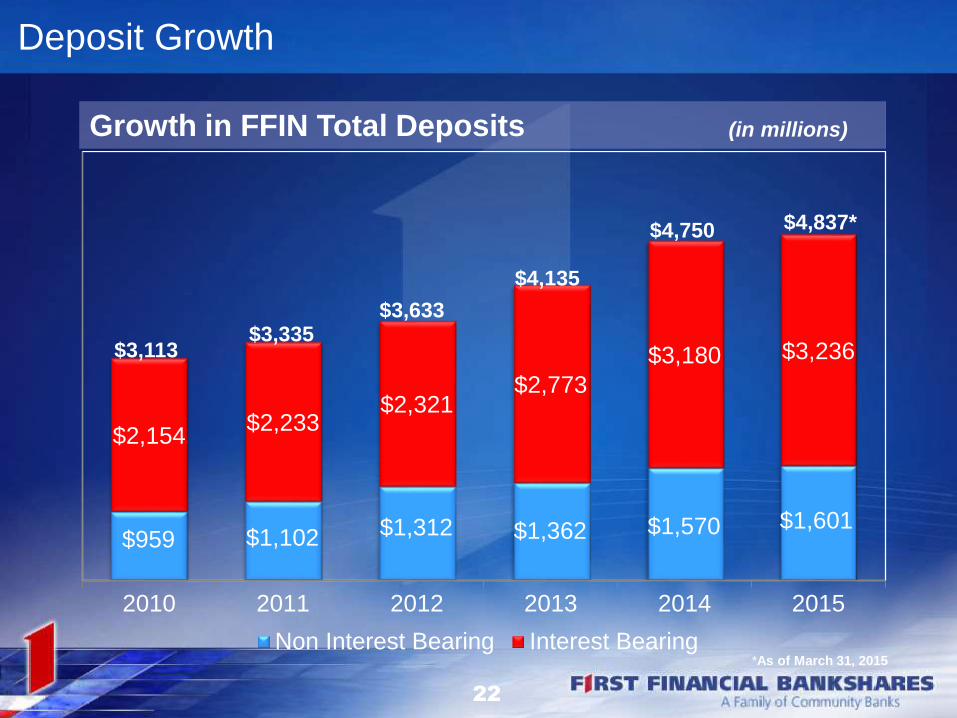
22
$959 $1,102 $1,312 $1,362 $1,570 $1,601
$2,154$2,233
$2,321$2,773
$3,180 $3,236
2010 2011 2012 2013 2014 2015
Non Interest Bearing Interest Bearing
Deposit Growth
Growth in FFIN Total Deposits (in millions)
$4,837*
$3,113$3,335
$3,633
$4,135
$4,750
*As of March 31, 2015
23
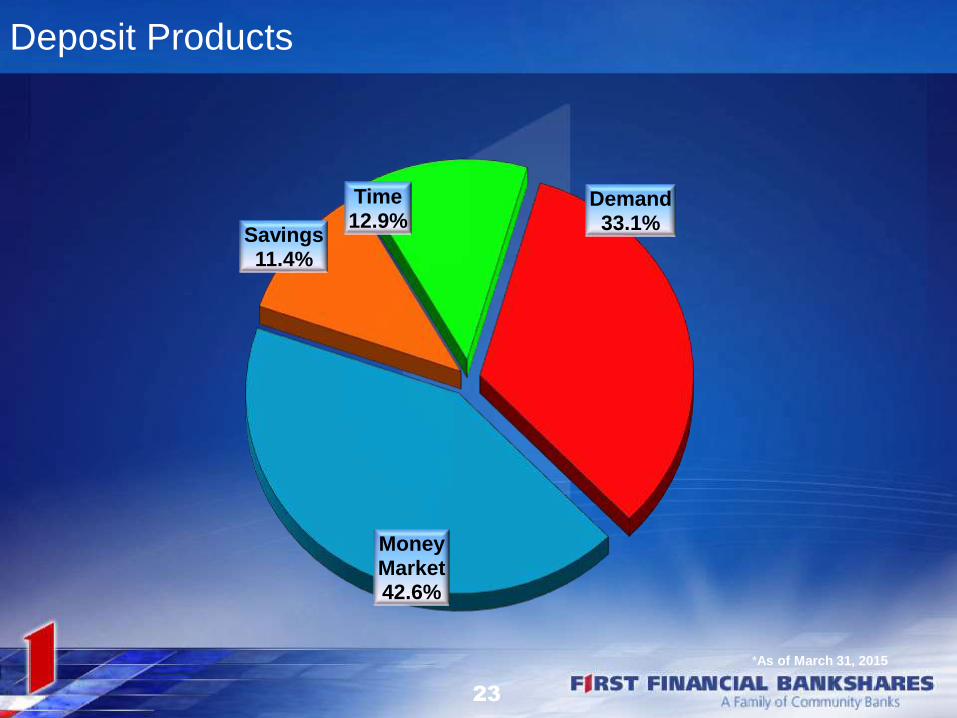
Deposit Products
Time12.9%
Demand33.1%
Money Market42.6%
Savings11.4%
*As of March 31, 2015
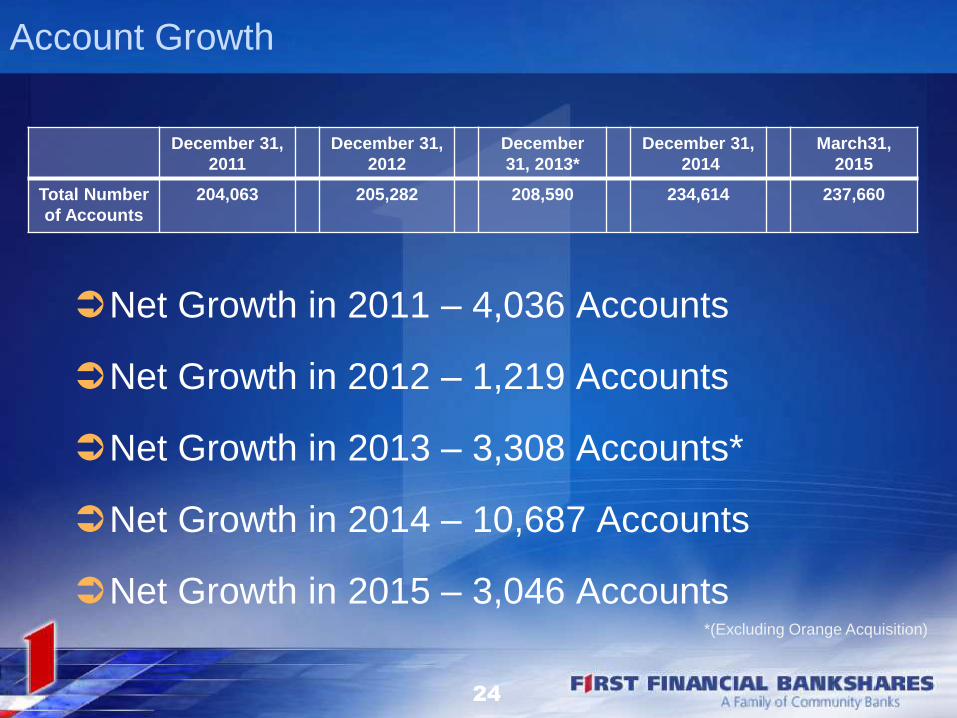
Account Growth
Net Growth in 2011 – 4,036 Accounts
Net Growth in 2012 – 1,219 Accounts
Net Growth in 2013 – 3,308 Accounts*
Net Growth in 2014 – 10,687 Accounts
Net Growth in 2015 – 3,046 Accounts
December 31,
2011
December 31,
2012
December
31, 2013*
December 31,
2014
March31,
2015
Total Number
of Accounts
204,063 205,282 208,590 234,614 237,660
24
*(Excluding Orange Acquisition)
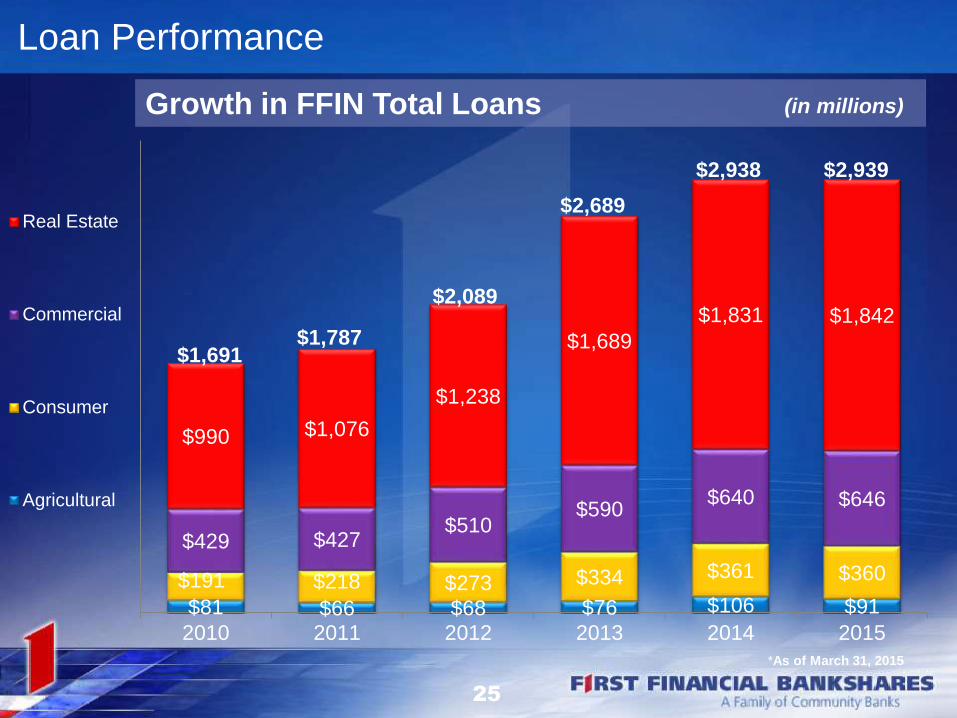
$81 $66 $68 $76 $106 $91
$191 $218 $273 $334 $361 $360
$429 $427 $510
$590 $640 $646
$990 $1,076
$1,238
$1,689
$1,831 $1,842
2010 2011 2012 2013 2014 2015
Real Estate
Commercial
Consumer
Agricultural
Loan Performance
Growth in FFIN Total Loans (in millions)
$1,691$1,787
$2,089
$2,939
25
$2,689
$2,938
*As of March 31, 2015
26
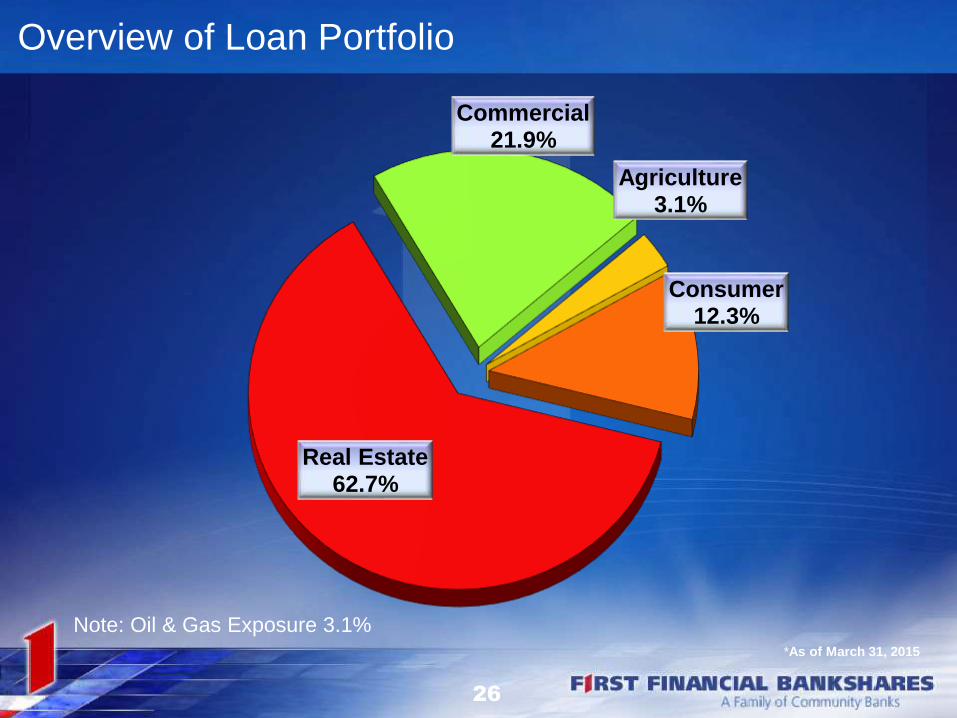
Overview of Loan Portfolio
Commercial 21.9%
Agriculture3.1%
Consumer12.3%
Real Estate62.7%
Note: Oil & Gas Exposure 3.1%*As of March 31, 2015
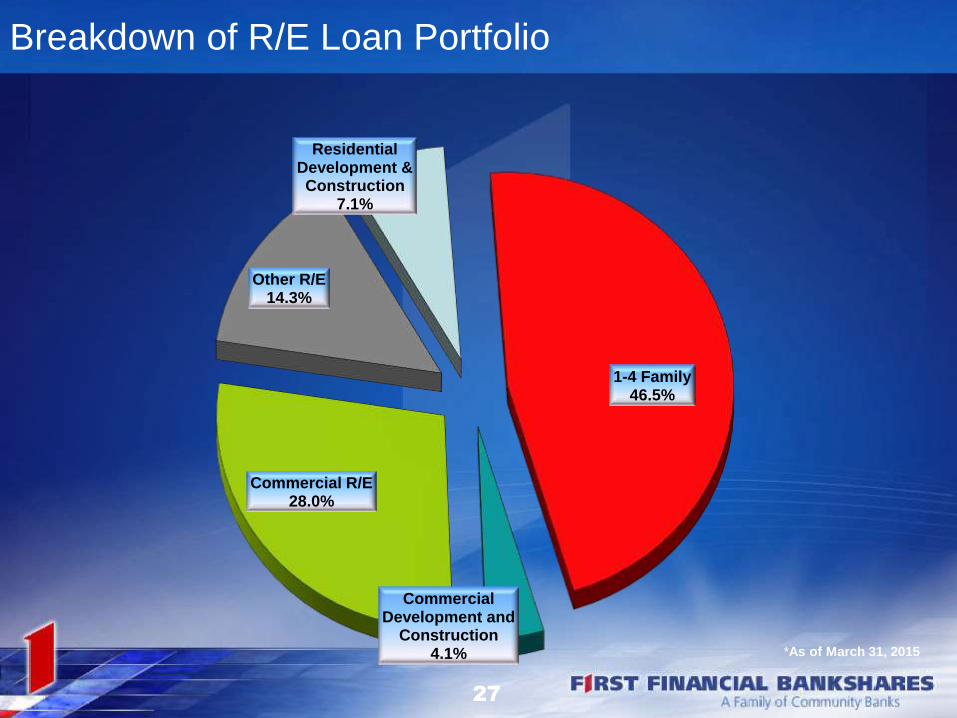
Residential Development & Construction
7.1%
1-4 Family 46.5%
Commercial Development and
Construction4.1%
Commercial R/E 28.0%
Other R/E 14.3%
27
Breakdown of R/E Loan Portfolio
*As of March 31, 2015
28
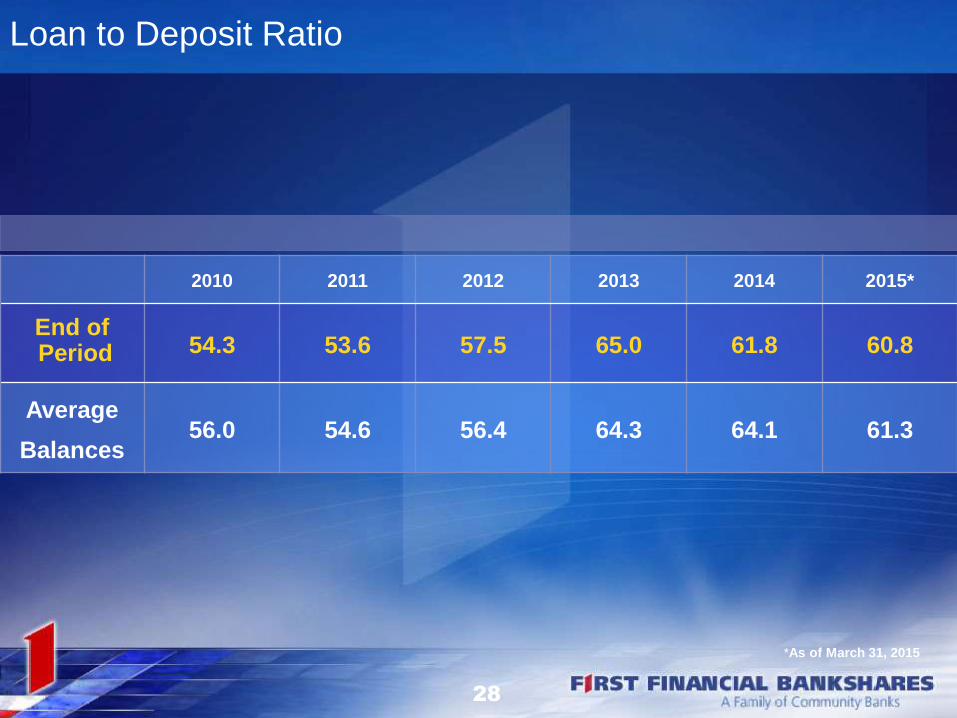
2010 2011 2012 2013 2014 2015*
End ofPeriod 54.3 53.6 57.5 65.0 61.8 60.8
Average
Balances56.0 54.6 56.4 64.3 64.1 61.3
Loan to Deposit Ratio
*As of March 31, 2015
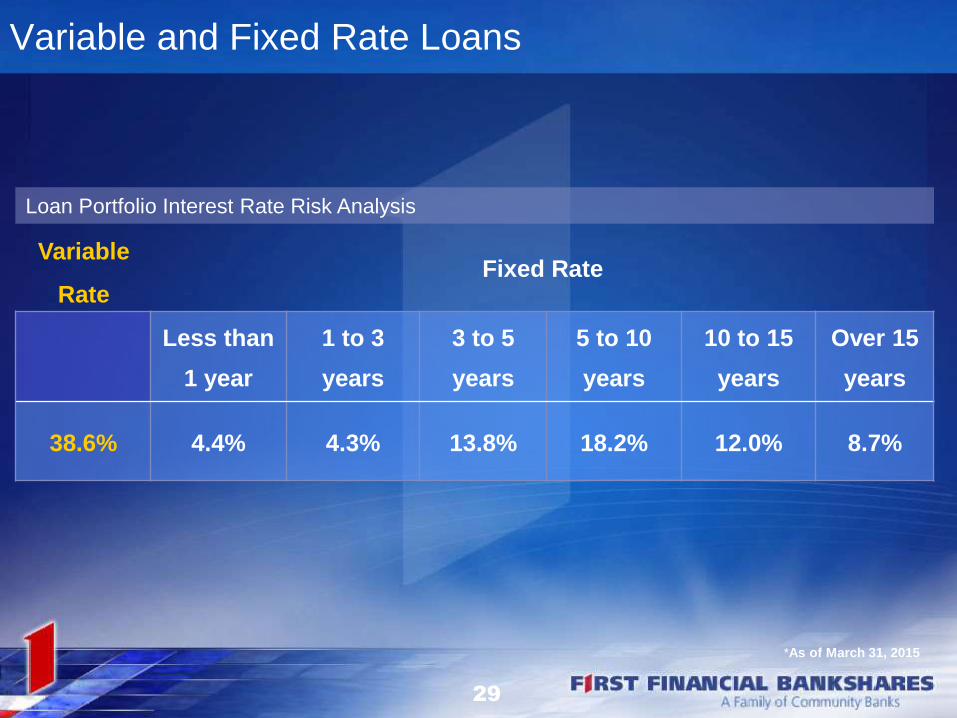
29
Less than
1 year
1 to 3
years
3 to 5
years
5 to 10
years
10 to 15
years
Over 15
years
38.6% 4.4% 4.3% 13.8% 18.2% 12.0% 8.7%
Variable and Fixed Rate Loans
Loan Portfolio Interest Rate Risk Analysis
Variable
RateFixed Rate
*As of March 31, 2015
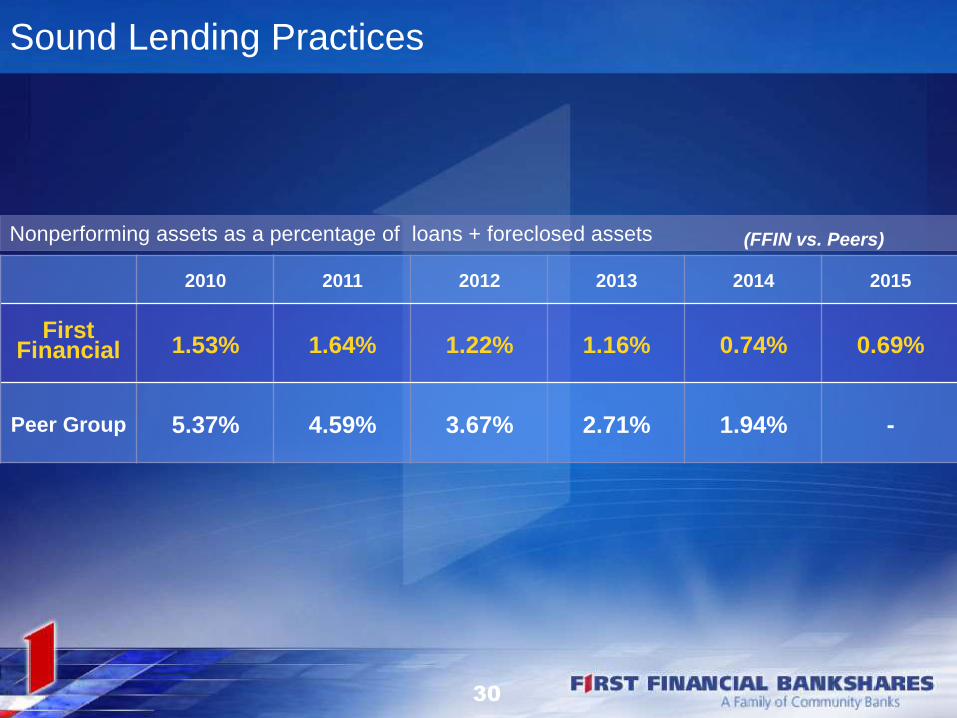
2010 2011 2012 2013 2014 2015
FirstFinancial 1.53% 1.64% 1.22% 1.16% 0.74% 0.69%
Peer Group 5.37% 4.59% 3.67% 2.71% 1.94% -
Sound Lending Practices
Nonperforming assets as a percentage of loans + foreclosed assets (FFIN vs. Peers)
30
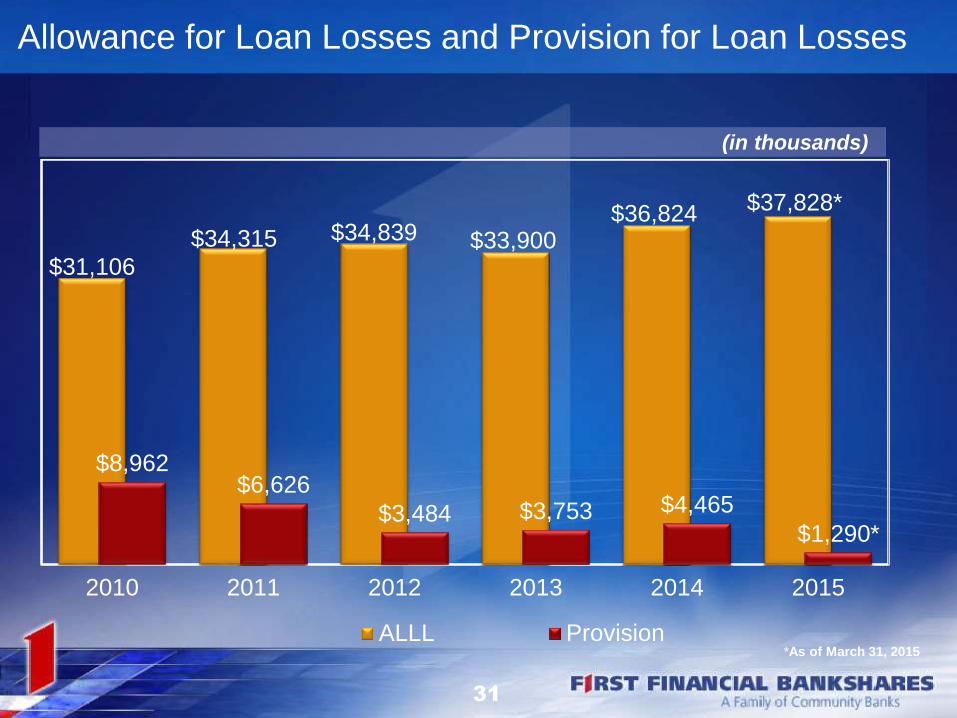
31
$31,106
$34,315 $34,839 $33,900$36,824 $37,828*
$8,962$6,626
$3,484 $3,753 $4,465
$1,290*
2010 2011 2012 2013 2014 2015
ALLL Provision
Allowance for Loan Losses and Provision for Loan Losses
(in thousands)
*As of March 31, 2015
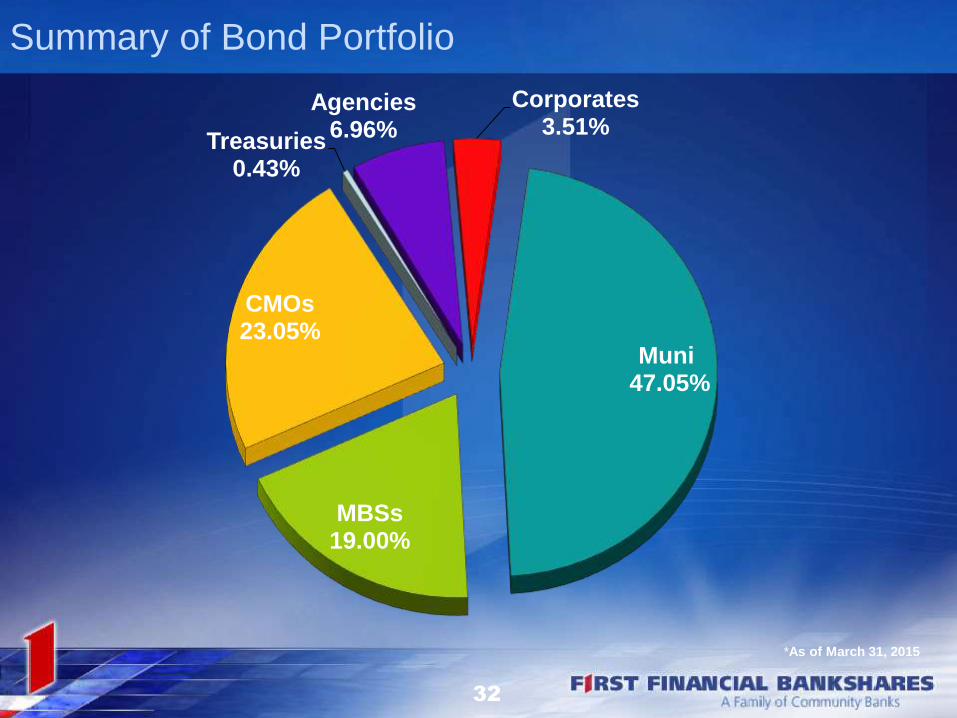
Summary of Bond Portfolio
Agencies 6.96%
Corporates 3.51%
Muni 47.05%
MBSs 19.00%
CMOs 23.05%
Treasuries 0.43%
32
*As of March 31, 2015
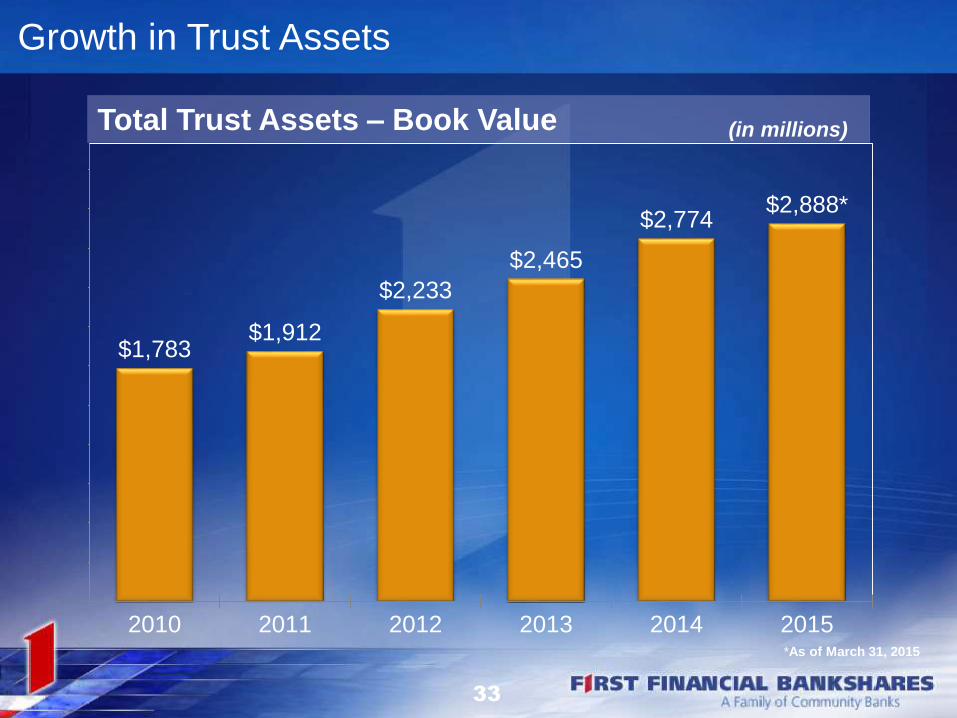
33
$1,783$1,912
$2,233
$2,465
$2,774$2,888*
2010 2011 2012 2013 2014 2015
Growth in Trust Assets
Total Trust Assets – Book Value (in millions)
*As of March 31, 2015
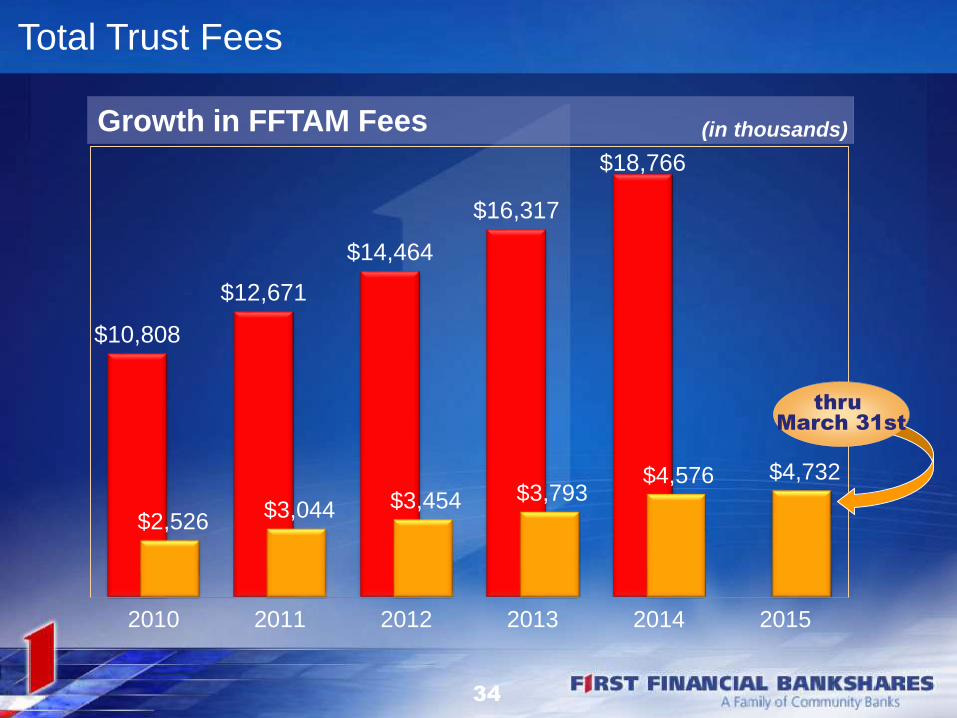
34
$10,808
$12,671
$14,464
$16,317
$18,766
$2,526 $3,044 $3,454 $3,793
$4,576 $4,732
2010 2011 2012 2013 2014 2015
Total Trust Fees
Growth in FFTAM Fees (in thousands)
thru
March 31st
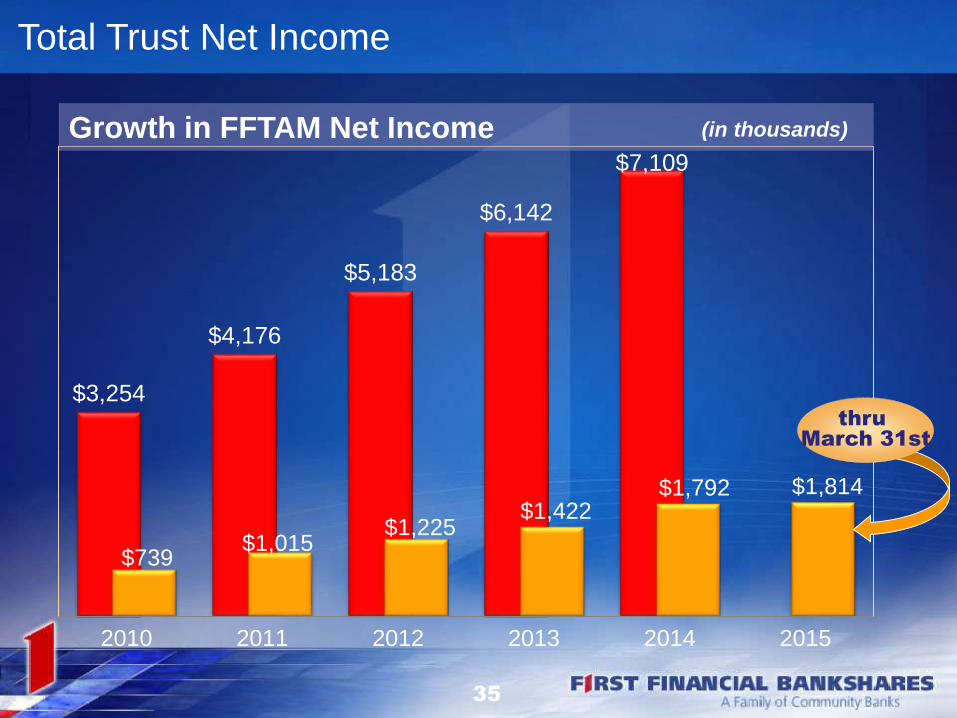
35
$3,254
$4,176
$5,183
$6,142
$7,109
$739 $1,015
$1,225 $1,422
$1,792 $1,814
2010 2011 2012 2013 2014 2015
Total Trust Net Income
Growth in FFTAM Net Income (in thousands)
thru
March 31st
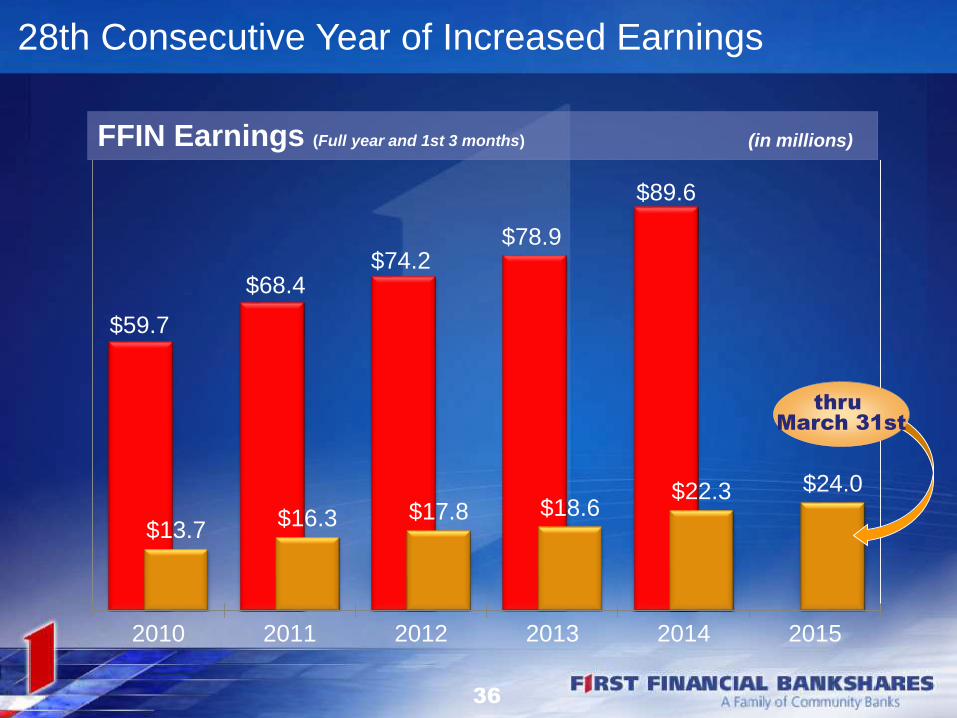
$59.7
$68.4$74.2
$78.9
$89.6
$13.7$16.3 $17.8 $18.6
$22.3 $24.0
2010 2011 2012 2013 2014 2015
28th Consecutive Year of Increased Earnings
FFIN Earnings (Full year and 1st 3 months) (in millions)
36
thru
March 31st
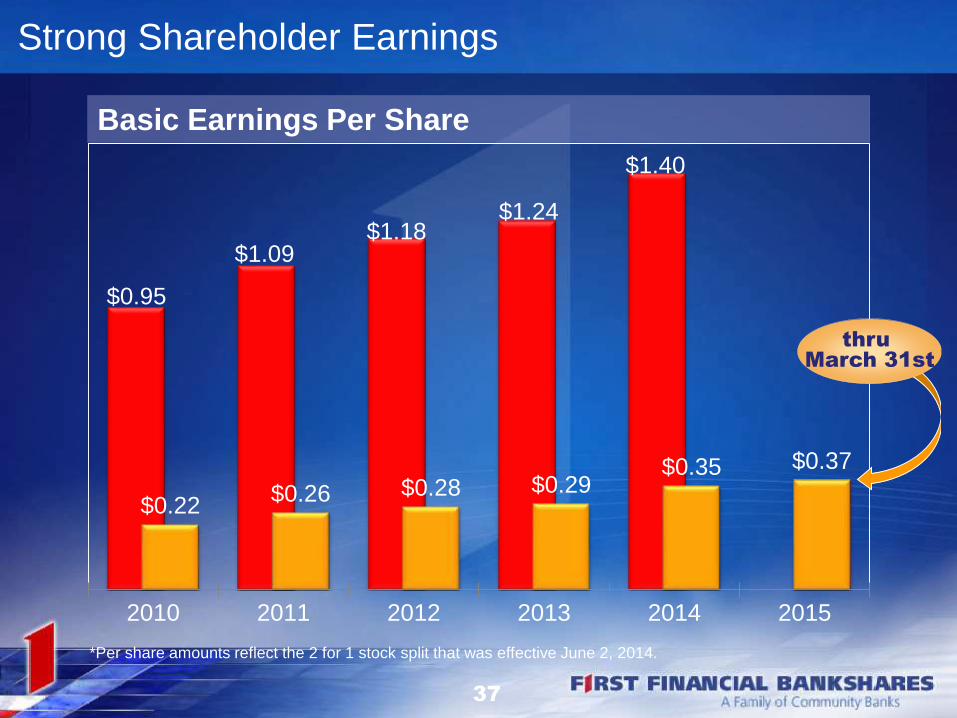
37
$0.95
$1.09$1.18
$1.24
$1.40
$0.22$0.26 $0.28 $0.29
$0.35 $0.37
2010 2011 2012 2013 2014 2015
thru
March 31st
Strong Shareholder Earnings
Basic Earnings Per Share
*Per share amounts reflect the 2 for 1 stock split that was effective June 2, 2014.
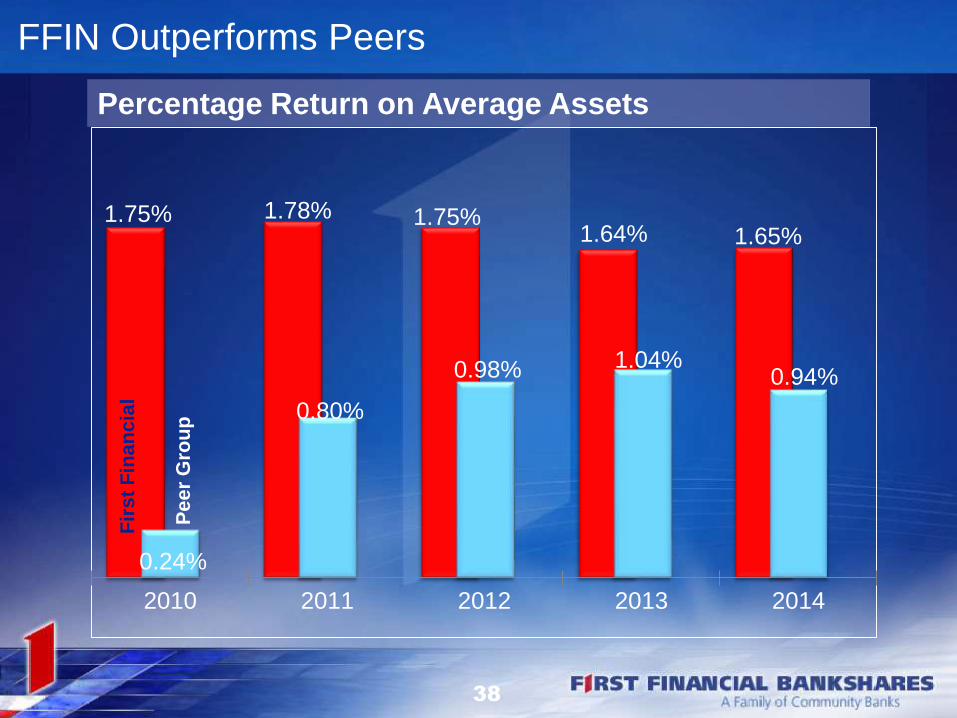
1.75% 1.78% 1.75%1.64% 1.65%
0.24%
0.80%
0.98% 1.04%0.94%
2010 2011 2012 2013 2014
FFIN Outperforms Peers
Percentage Return on Average Assets
Pe
er
Gro
up
Fir
st
Fin
an
cia
l
38
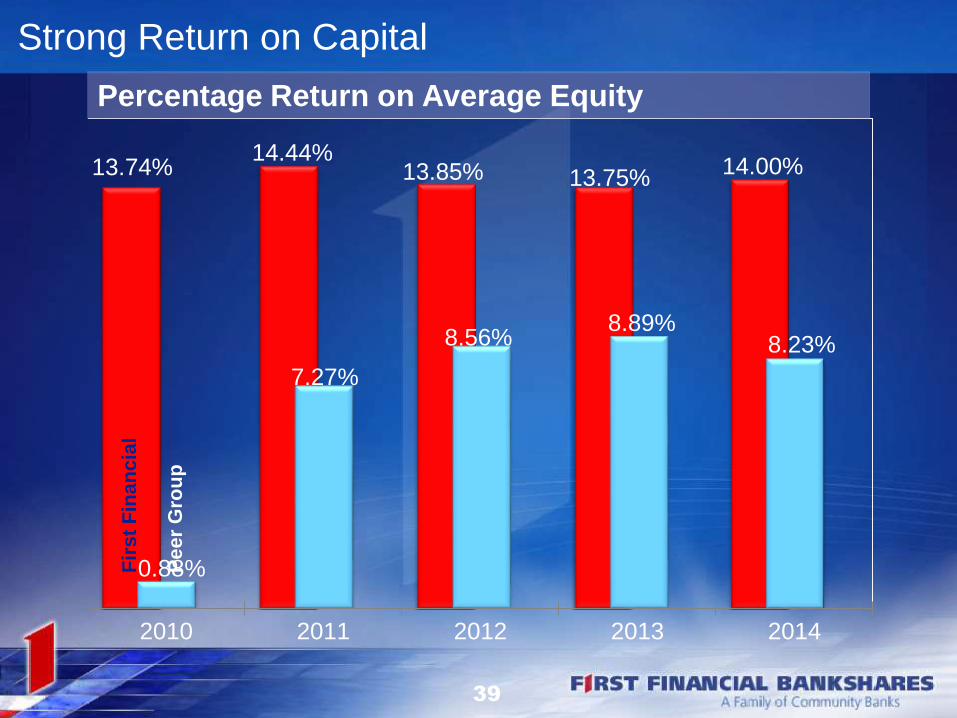
13.74%14.44%
13.85% 13.75%14.00%
0.88%
7.27%
8.56%8.89%
8.23%
2010 2011 2012 2013 2014
Strong Return on Capital
Percentage Return on Average Equity
Pe
er
Gro
up
Fir
st
Fin
an
cia
l
39
40
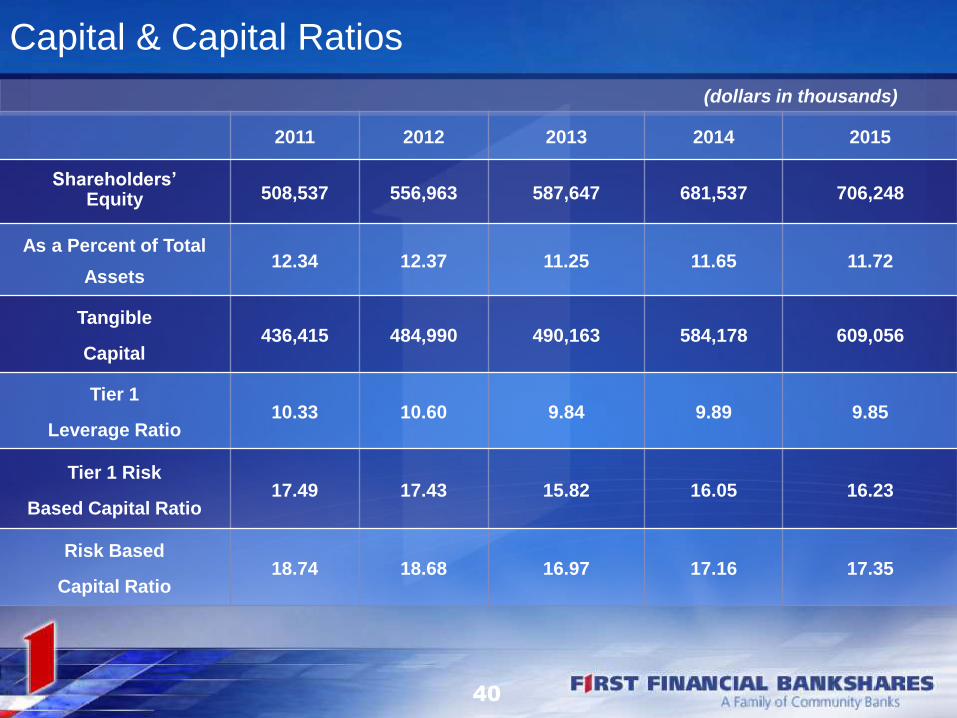
2011 2012 2013 2014 2015
Shareholders’Equity 508,537 556,963 587,647 681,537 706,248
As a Percent of Total
Assets12.34 12.37 11.25 11.65 11.72
Tangible
Capital436,415 484,990 490,163 584,178 609,056
Tier 1
Leverage Ratio10.33 10.60 9.84 9.89 9.85
Tier 1 Risk
Based Capital Ratio17.49 17.43 15.82 16.05 16.23
Risk Based
Capital Ratio18.74 18.68 16.97 17.16 17.35
Capital & Capital Ratios
(dollars in thousands)
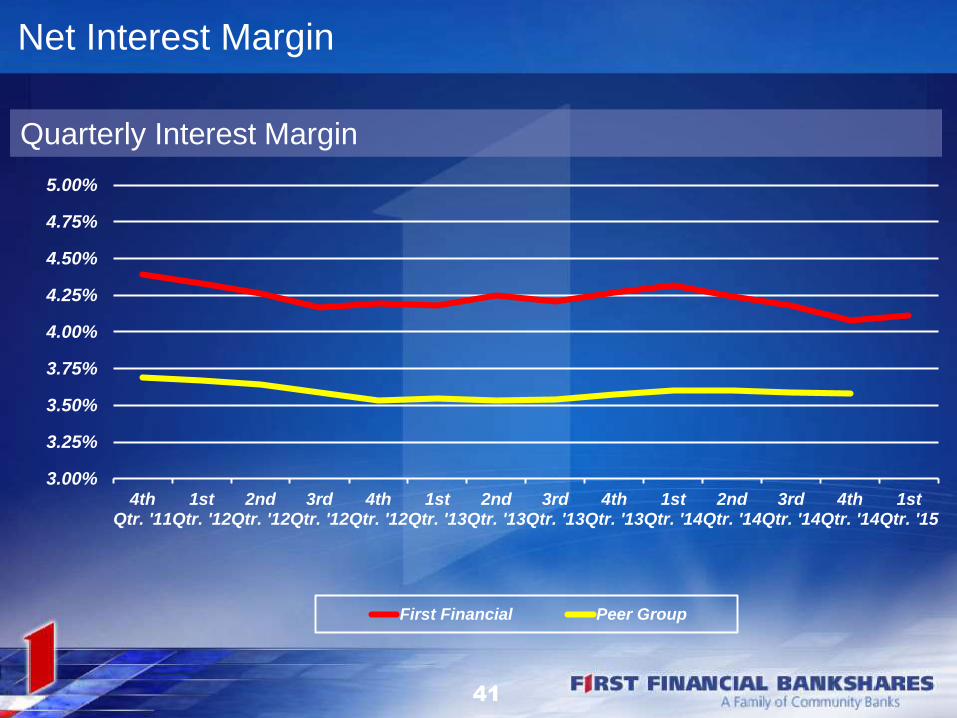
3.00%
3.25%
3.50%
3.75%
4.00%
4.25%
4.50%
4.75%
5.00%
4thQtr. '11
1stQtr. '12
2ndQtr. '12
3rdQtr. '12
4thQtr. '12
1stQtr. '13
2ndQtr. '13
3rdQtr. '13
4thQtr. '13
1stQtr. '14
2ndQtr. '14
3rdQtr. '14
4thQtr. '14
1stQtr. '15
First Financial Peer Group
Net Interest Margin
Quarterly Interest Margin
41
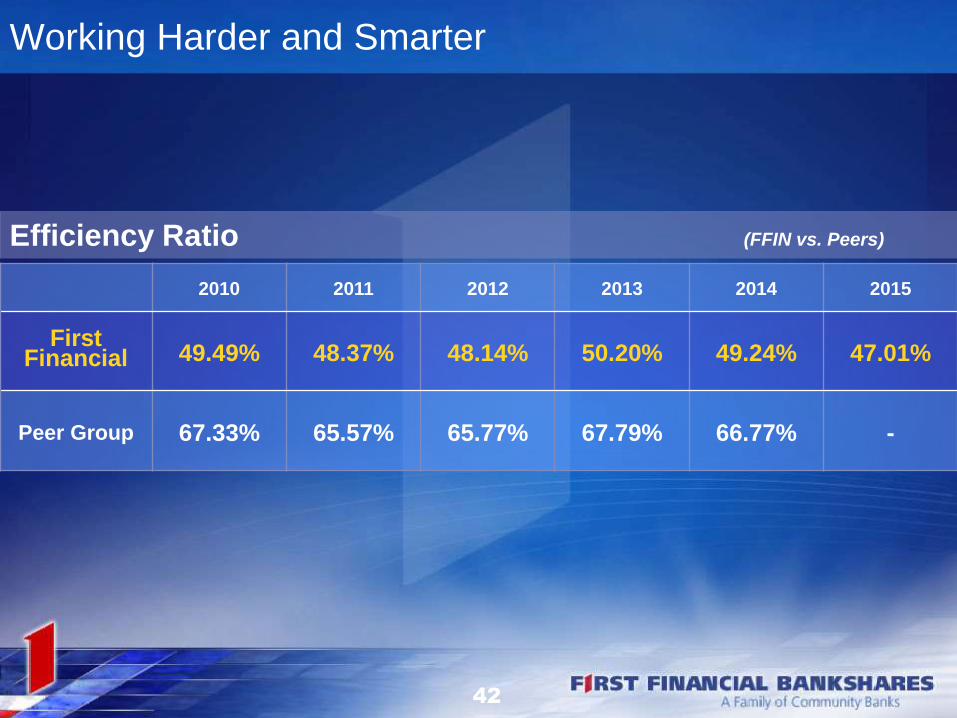
2010 2011 2012 2013 2014 2015
FirstFinancial 49.49% 48.37% 48.14% 50.20% 49.24% 47.01%
Peer Group 67.33% 65.57% 65.77% 67.79% 66.77% -
Working Harder and Smarter
Efficiency Ratio (FFIN vs. Peers)
42
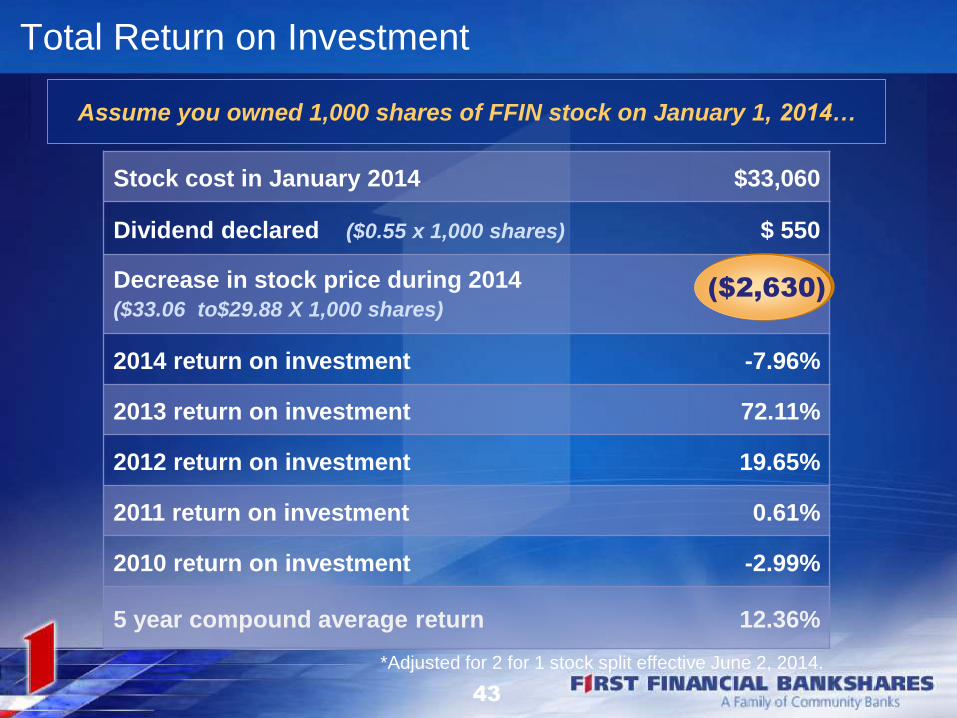
Stock cost in January 2014 $33,060
Dividend declared ($0.55 x 1,000 shares) $ 550
Decrease in stock price during 2014
($33.06 to$29.88 X 1,000 shares)$2210,720
2014 return on investment -7.96%
2013 return on investment 72.11%
2012 return on investment 19.65%
2011 return on investment 0.61%
2010 return on investment -2.99%
5 year compound average return 12.36%
Total Return on Investment
($2,630)
Assume you owned 1,000 shares of FFIN stock on January 1, 2014…
43
*Adjusted for 2 for 1 stock split effective June 2, 2014.
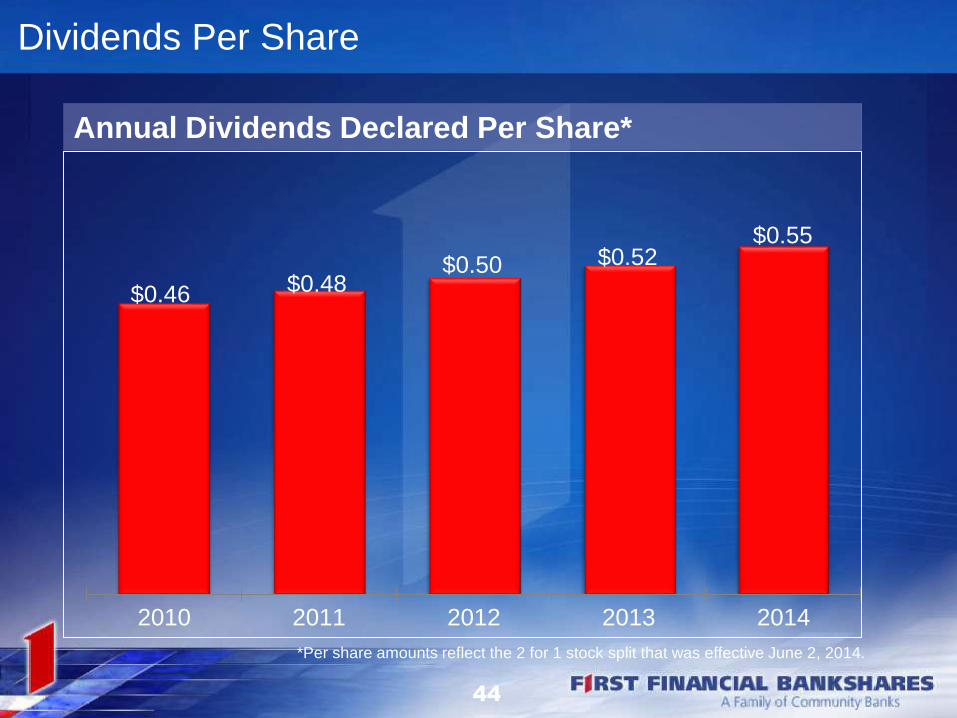
Dividends Per Share
$0.46 $0.48$0.50 $0.52
$0.55
2010 2011 2012 2013 2014
Annual Dividends Declared Per Share*
44
*Per share amounts reflect the 2 for 1 stock split that was effective June 2, 2014.
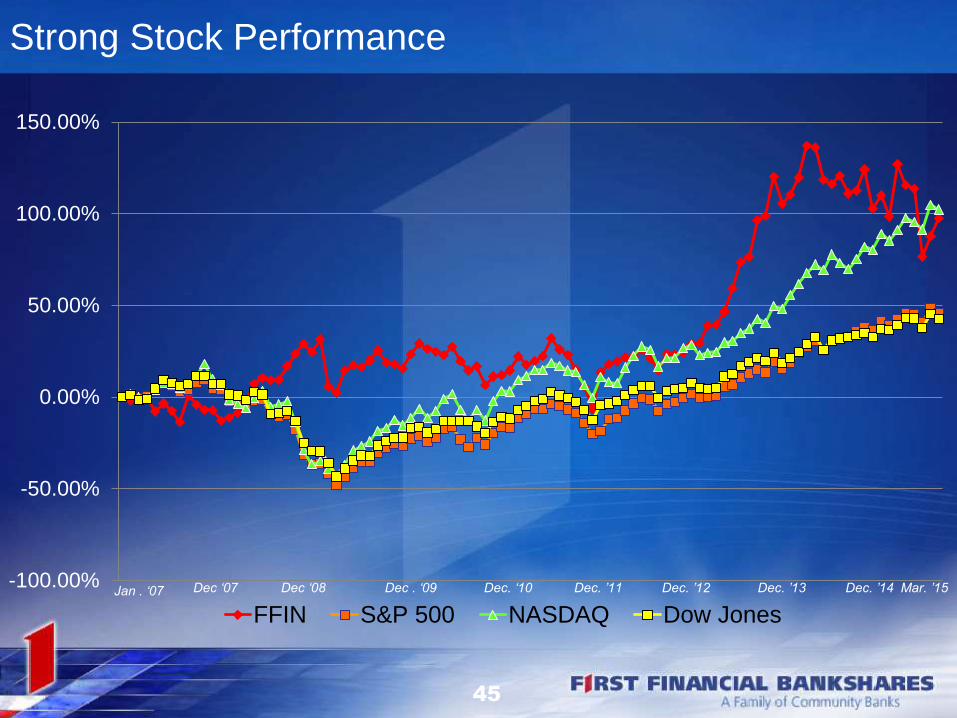
Strong Stock Performance
-100.00%
-50.00%
0.00%
50.00%
100.00%
150.00%
FFIN S&P 500 NASDAQ Dow JonesJan . ‘07 Mar. ’15Dec . ‘09Dec ‘07 Dec ‘08 Dec. ‘10 Dec. ’11 Dec. ’12 Dec. ’13 Dec. ’14
45
Challenges
Regulatory reform from Washington
Stagnant national economy
Oil & gas price decline
Low interest rate environment
Maintaining net interest margin
46
Opportunities
Loan Growth
Mortgage Lending
Trust Services
Treasury Management
Mobile Banking
Lower Efficiency Ratio
Potential Acquisitions
47

48