3. 5th International Conference on Earthquake Geotecnical Engieneering
First European Conference on Earthquake Engineering and Seismology (a joint event of the 13th ECEE & 30th General Assembly of the ESC)
Geneva, Switzerland, 3-8 September 2006 Paper Number: 506
BROADBAND GROUND MOTION SIMULATION OF ROMANIAN EARTHQUAKES USING EMPIRICAL GREEN’S FUNCTION METHOD
Natalia POIATA1 and Hiroe MIYAKE2
SUMMARY
We simulated broadband ground motions for the intermediate-depth subducting earthquakes from the Vrancea seismic region, Romania, using the empirical Green’s function method. The method is for simulating both high- and low-frequency ground motions by summing up subevent records to follow the source scaling with different stress drop and the omega-square spectral model. We first estimated strong motion generation area within a total rupture area of the October 27, 2004 moderate earthquake (Mw 5.8), by comparison of the synthetic waveforms of displacement, velocity, and acceleration with the observed one. The stress drop of the area is estimated to be about 10 MPa, which is similar to that for the inland crustal earthquakes. We then modeled the strong motion generation area for one of the disastrous earthquakes in Romania from March 4, 1977 (Mw 7.4), using the subfault constructing the source parameters of Mw 5.8 earthquake. To simulate the unique record at Bucharest capital city, the rupture is assumed to propagate from the northeast bottom of the area with 50-MPa stress drop. Our estimates support the size-dependent stress drop for the intermediate-depth earthquakes of the Vrancea region in the previous study. Broadband ground motion simulations are compared in terms of MMI intensity calculated from the PGA and PGV values of the synthetic waveforms with the observed intensity values. The simulated MMI intensities slightly overestimate except Bucharest capital city.
1. INTRODUCTION Vrancea intermediate-depth sources dominate the seismic activity in Romania. They are located at the bending of the Carpathian mountains in the rectangle delimited by coordinates 45–46 N and 26–27 E in Figure 1. According to historical information and 20th Century data, seismicity characterizing Vrancea seismic region is located in a high velocity volume and defines a relatively small area with the depth range 60 km to 200 km and epicenters concentrate in an area of 40 km in longitude direction and 90 km in latitude direction. Over last five hundred years, more about five earthquakes with the magnitude Mw 7.0 and grater occurred, some of them coursed damages in the Bucharest, capital city. From the viewpoint of the tectonics, Vrancea represents a zone dominated by collision between the East-European platform and the Intra-Carpathian block. There are several models describing tectonic processes in the Vrancea region, but the deriving mechanism of the intermediate-depth seismicity is still not clearly resolved. According to the one of the most commonly used theories, seismic sources are localized in a cold relic slab denser and more rigid than the surround mantle sinking due to the gravity into the astenosphere and now overlaid by continental crust [McKenzie, 1970, 1972]. Previous studies show that the subduction slab is almost vertical and the earthquakes presents quite stable reverse faulting focal mechanism with the rupture planes oriented NE-SW direction. As already have been mentioned, Bucharest capital city is highly influenced by the subducting earthquakes from the Vrancea seismic region. This is why an accurate estimation of the strong ground motion and detailed study of
1 National Centre for Seismic Risk Reduction, 266 Pantelimon, Bucharest 021652, Romania Email : [email protected] Earthquake Research Institute, University of Tokyo, 1-1-1 Yayoi, Bunkyo-ku, Tokyo 113-0032, Japan Email: [email protected]
1

the source mechanism of the Vrancea earthquakes are very important for better understanding of the phenomena itself but also for establishing the recent technology of the earthquake resistant design of buildings, to reduce earthquake damages. In this study, we applied the empirical Green’s function method to perform source modeling and broadband ground-motion simulation for a recent moderate earthquake on October 27, 2004 (Mw 5.8) and for a past large earthquake on March 4, 1977 (Mw 7.4). The 1977 earthquake is representing a great interest for both seismologists and earthquake engineers from Romania being the largest instrumentally recorded Vrancea event and the most destructive earthquake in the last century.
Figure 1: Seismicity of Romania during the 1000-2004 according to the ROMPLUS catalog by National
Institute of Earth Physics (NIEP).
2. METHODOLOGY AND DATA DESCRIPTION Accurate estimation of the broadband ground motion generated by an earthquake is important for establishing of the new technologies for earthquake-resistant design and response-controlled design of structures to reduce earthquake damages. However the frequency domain for the deterministic simulation of ground motion is limited up to 1 Hz. This is due to the deficit of the precise geophysical and geotechnical information of underground velocity structure in order to calculate Green’s functions by theoretical approach. A useful approach for this purpose is to estimate strong ground motion for a large earthquake using the record of small earthquakes, considered as an empirical Green’s function [Irikura, 1986; Irikura and Kamae, 1994]. The main idea of the empirical Green’s function (EGF) method is that the small events have already included the properties of the propagation path and local site effects. EGF method can provide realistic ground motion including high-frequency component. In the presented work we use the EGF method formulated by Irikura [1983 and 1986], based on scaling law of fault parameters for large and small events [Kanamori and Anderson, 1975] and the omega-squared source spectra [Aki, 1967; Brune, 1970 and 1971]. The waveform for a large event is synthesized by summing the records of small events with corrections for the difference in the slip velocity time function between the large and small events. In this study, we used the data records from National Center for Seismic Risk Reduction (NCSRR) strong motion acceleration network together with the data from broadband stations of National Institute for Earth Physics (NIEP) network making part of the Geophone network We then analyzed events from Vrancea seismic region recorded at six free field NCSRR station located outside the Bucharest capital city (FOC, RMS, BUZ, URZ, PLO, and GRG), one station located inside the Bucharest capital city (INC) and one broadband station of NIEP network (MLR). The distribution of the stations discussed above is shown in the Figure 2. In the first stage of the study, we applied the empirical Green’s function method in order to estimate the source model and simulate the ground motion for a recent Mw 5.8, October 27, 2004 earthquake. To select the
2
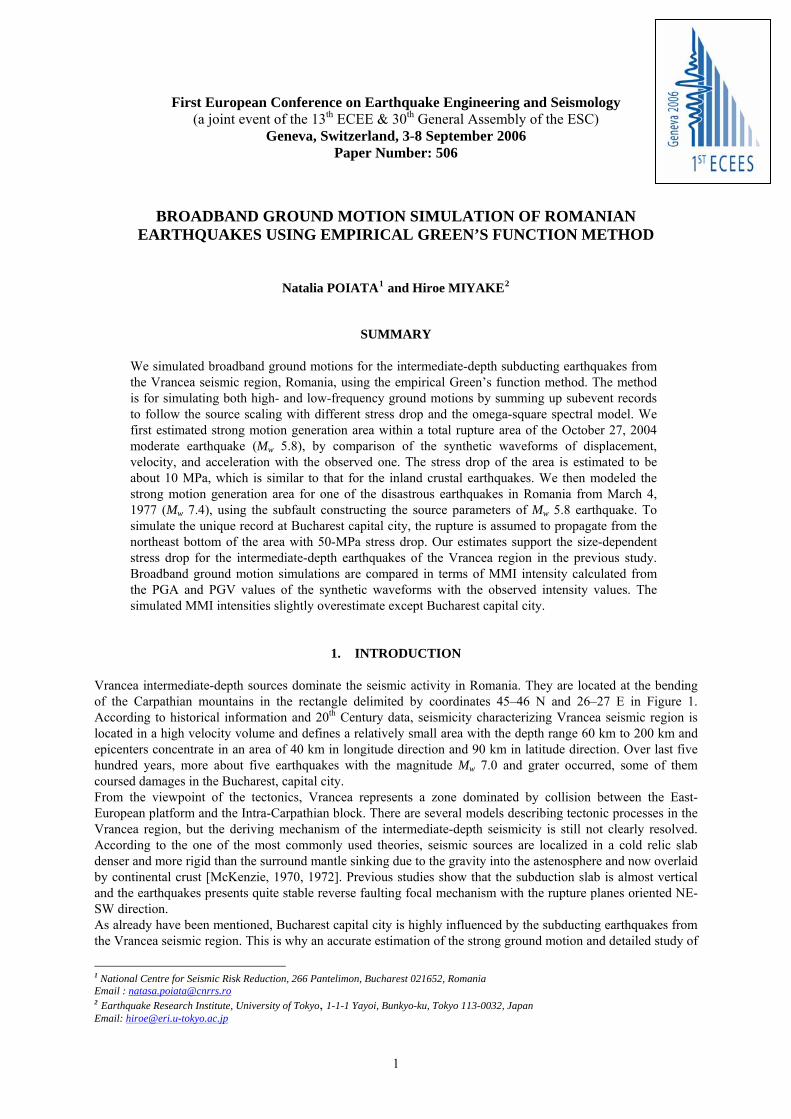
appropriate small (element) event to be used as Green’s function for the simulation of the Mw 5.8 the records from NCSRR strong ground motion network during the period of 2003 to 2005 have been studied. The selected element event is Mw 4.8, September 27, 2004 earthquake, the position of the element and target event is presented in Figure 2 and the information on the parameters of the events is summarized in Table 1. Fault plane used for the simulations (shown in red color in Table 1) for both target and element events have been selected from the Harvard CMT solution by taking into account the tectonics settings of the Vrancea region – the almost vertical position of the subduction slab.
Figure 2: Position of the strong ground motion stations and events used in the study (using Harvard CMT solution)
Table 1: Hypocenters location and focal mechanisms for the events used in the study
In the second part of the study, we performed a simulation of a past large earthquake March 4, 1977 (Mw 7.4) using Mw 5.8 event as the empirical Green’s function with the source model obtained in the first simulation. The position of the target and element event for the second part of the study are shown in Figure 2 and the data on both Mw 7.4 and Mw 5.8 events parameters are summarized in Table 1.
3

For the simulation of the past large earthquake Mw 7.4, we only disposed of the data recorded at one station located in the Bucharest capital city at an analog instrument. The record has been digitized with the sampling rate 50 Hz. We also used the observed MSK intensity map by Radu [1977], Figure 11(a) in order to make a comparison of the simulation results with observed data.
3. ANALYSIS PROCEDURE
3.1 Estimation of Source Parameter for the Recent Moderate Earthquake
We estimated source model of the October 27, 2004 (Mw 5.8) earthquake by EGF method using September 27, 2004 (Mw 4.8) earthquake as empirical Green’s function. For the source parameters determination, we selected four stations closest to the epicenters of target and element events (Figure 2). For an objective estimation of parameters N and C we need, in order to perform the simulation of the strong ground motion using the EGF method we used the source-spectral fitting method proposed by Miyake et al. [1999]. Using this method we calculated source spectral ratio for the four closest to the target event stations (FOC, BUZ, RMS, and PLO; Figure 3). The parameters obtained as the result of the source spectral fitting M0/m0, fcm and fca, N and C are shown in Table 2. The frequency range available for the estimation determined from signal-to-noise level of the small event is 0.3 Hz. We also fixed the upper limit of the frequency range used in this simulation at 10 Hz so that performed simulation is available in the frequency range 0.3–10Hz. The spectral ratios for four stations and the mean spectral ratio with the fitting curve are presented in the Figure 3. The results of the calculations are summarized in Table 2. The strong motion generation area (SMGA) with high stress drop inside the total rupture area plays an important role in broadband ground motion simulation. Since there are no available slip distribution studies to identify the slip areas, we assume an SMGA located around the hypocenter. From the spectral calculation N is found to be 4 so that we divided SMGA into 4×4 subfaults. The parameters of SMGA for the target event were determined to minimize the fitting the observed and synthetics in time domain for acceleration, velocity, and displacement. The final source model is shown in Figure 4 and the parameters of the synthesis are summarized in Table 3. Comparison of the synthetic and observed waveforms is in the Figure 5.
Figure 3: Spectral ratio for stations used in the estimation of source parameters of Mw 5.8 earthquake, upper and lower right plot represent the superimposed of the ration and the mean spectral ratio and the fitted curve of the ω-2 source model, respectively.
Table 2: Source parameters for the Mw 5.8 event determined from the spectral ratio fitting.
4

Using the results of source parameters estimation for the Mw 5.8 earthquake we performed a validation of the obtained model through the simulation of the ground motion at tree strong ground motion stations: URZ, INC, GRG (Figure 2) and a broadband station MLR. Comparison of the synthetic and observed waveforms for these stations is shown in Figure 6. It can be noticed that the simulation offers a good result on the pulse shape but the amplitude of the synthetic wave forms is overestimated. The cause of this amplitude overestimation is still a question showing the necessity of the further more detailed studies on the propagation path of Q-factor or scattering effects.
Table 3: Source parameters for the recent moderate earthquake
Figure 4: Final source model for the recent moderate earthquake Mw 5.8. Black dot represents rupture starting point
Figure 5: Comparison of the observed and synthetic waveforms for four closest stations obtained by the source parameter estimation using the EGF method for the Mw 5.8, October 27, 2004.
5
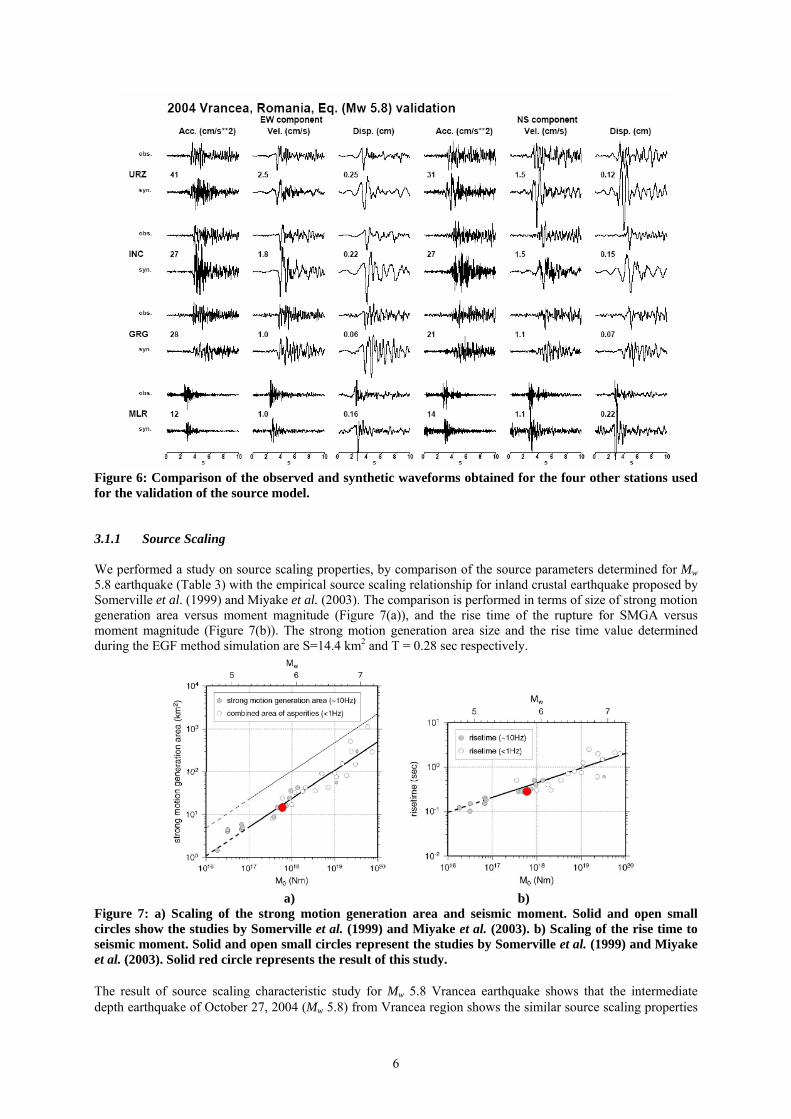
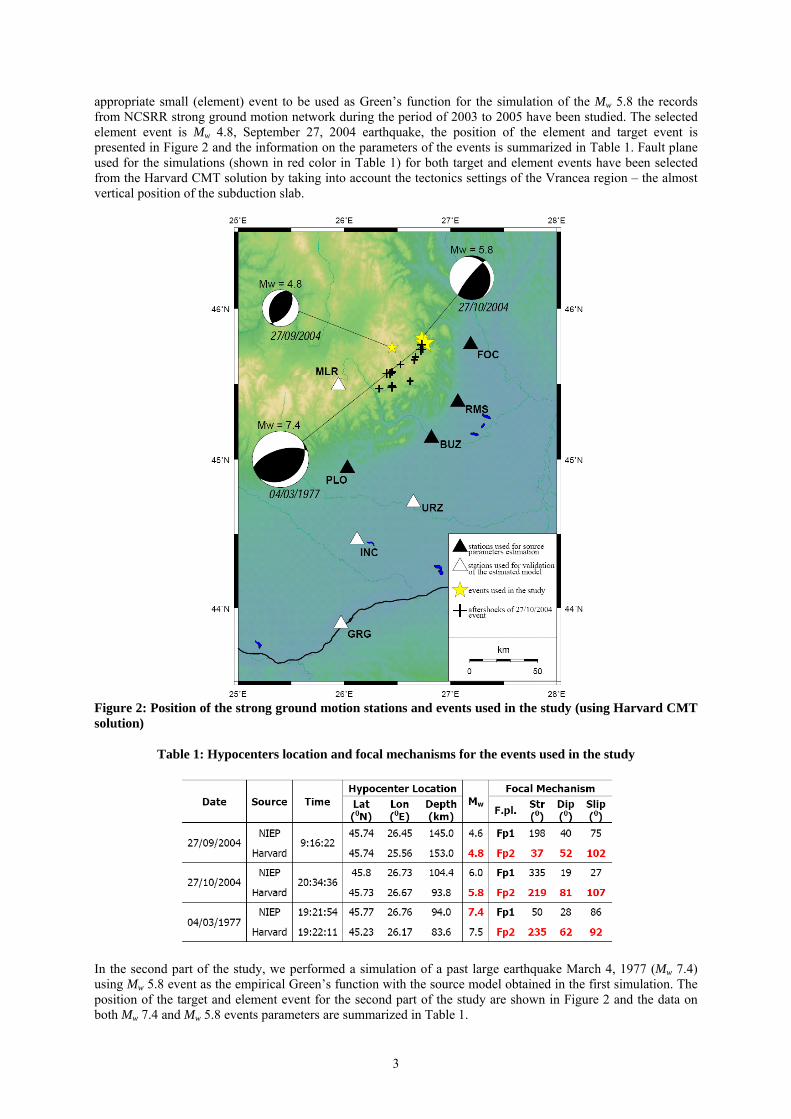
Figure 6: Comparison of the observed and synthetic waveforms obtained for the four other stations used for the validation of the source model. 3.1.1 Source Scaling We performed a study on source scaling properties, by comparison of the source parameters determined for Mw 5.8 earthquake (Table 3) with the empirical source scaling relationship for inland crustal earthquake proposed by Somerville et al. (1999) and Miyake et al. (2003). The comparison is performed in terms of size of strong motion generation area versus moment magnitude (Figure 7(a)), and the rise time of the rupture for SMGA versus moment magnitude (Figure 7(b)). The strong motion generation area size and the rise time value determined during the EGF method simulation are S=14.4 km2 and T = 0.28 sec respectively.
a) b) Figure 7: a) Scaling of the strong motion generation area and seismic moment. Solid and open small circles show the studies by Somerville et al. (1999) and Miyake et al. (2003). b) Scaling of the rise time to seismic moment. Solid and open small circles represent the studies by Somerville et al. (1999) and Miyake et al. (2003). Solid red circle represents the result of this study. The result of source scaling characteristic study for Mw 5.8 Vrancea earthquake shows that the intermediate depth earthquake of October 27, 2004 (Mw 5.8) from Vrancea region shows the similar source scaling properties
6
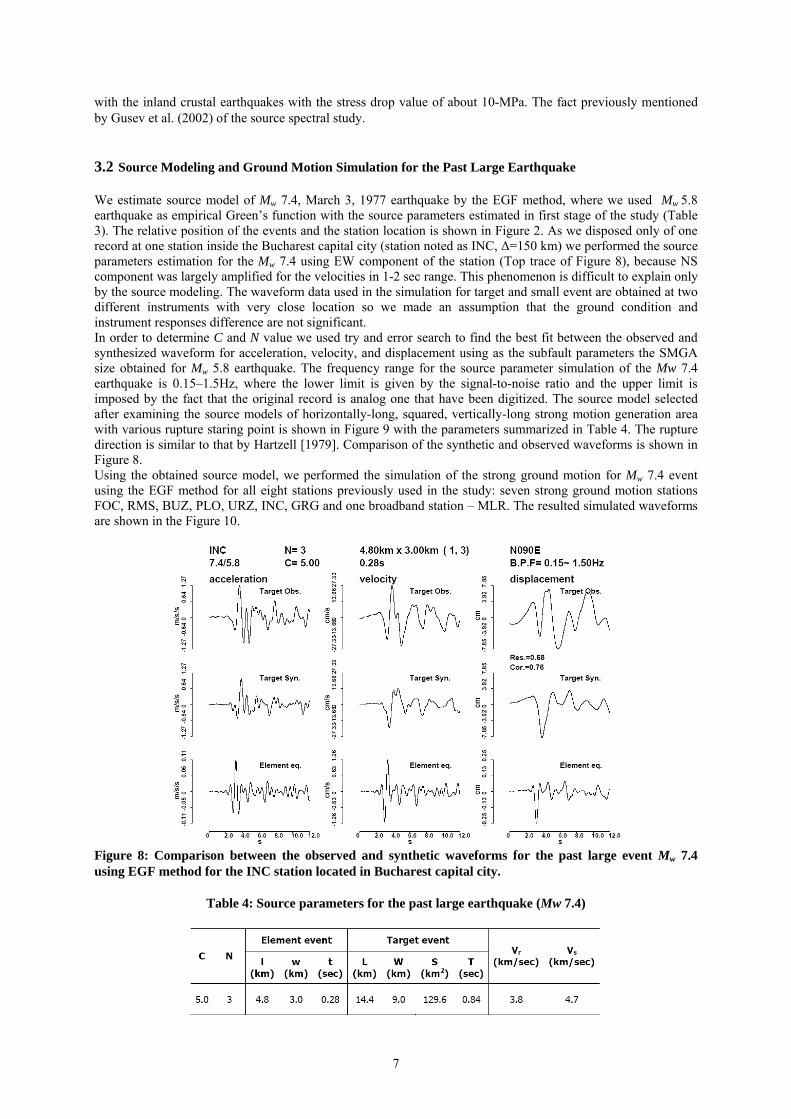
with the inland crustal earthquakes with the stress drop value of about 10-MPa. The fact previously mentioned by Gusev et al. (2002) of the source spectral study. 3.2 Source Modeling and Ground Motion Simulation for the Past Large Earthquake We estimate source model of Mw 7.4, March 3, 1977 earthquake by the EGF method, where we used Mw 5.8 earthquake as empirical Green’s function with the source parameters estimated in first stage of the study (Table 3). The relative position of the events and the station location is shown in Figure 2. As we disposed only of one record at one station inside the Bucharest capital city (station noted as INC, Δ=150 km) we performed the source parameters estimation for the Mw 7.4 using EW component of the station (Top trace of Figure 8), because NS component was largely amplified for the velocities in 1-2 sec range. This phenomenon is difficult to explain only by the source modeling. The waveform data used in the simulation for target and small event are obtained at two different instruments with very close location so we made an assumption that the ground condition and instrument responses difference are not significant. In order to determine C and N value we used try and error search to find the best fit between the observed and synthesized waveform for acceleration, velocity, and displacement using as the subfault parameters the SMGA size obtained for Mw 5.8 earthquake. The frequency range for the source parameter simulation of the Mw 7.4 earthquake is 0.15–1.5Hz, where the lower limit is given by the signal-to-noise ratio and the upper limit is imposed by the fact that the original record is analog one that have been digitized. The source model selected after examining the source models of horizontally-long, squared, vertically-long strong motion generation area with various rupture staring point is shown in Figure 9 with the parameters summarized in Table 4. The rupture direction is similar to that by Hartzell [1979]. Comparison of the synthetic and observed waveforms is shown in Figure 8. Using the obtained source model, we performed the simulation of the strong ground motion for Mw 7.4 event using the EGF method for all eight stations previously used in the study: seven strong ground motion stations FOC, RMS, BUZ, PLO, URZ, INC, GRG and one broadband station – MLR. The resulted simulated waveforms are shown in the Figure 10.
Figure 8: Comparison between the observed and synthetic waveforms for the past large event Mw 7.4 using EGF method for the INC station located in Bucharest capital city.
Table 4: Source parameters for the past large earthquake (Mw 7.4)
7
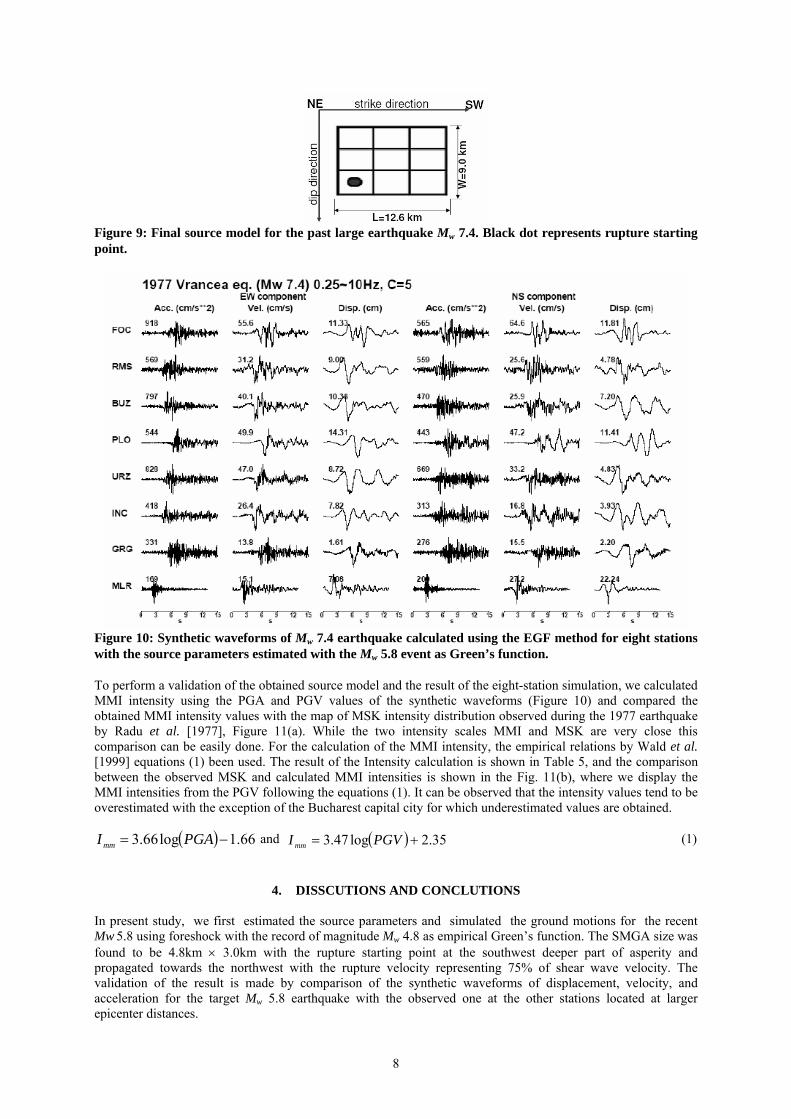
Figure 9: Final source model for the past large earthquake Mw 7.4. Black dot represents rupture starting point.
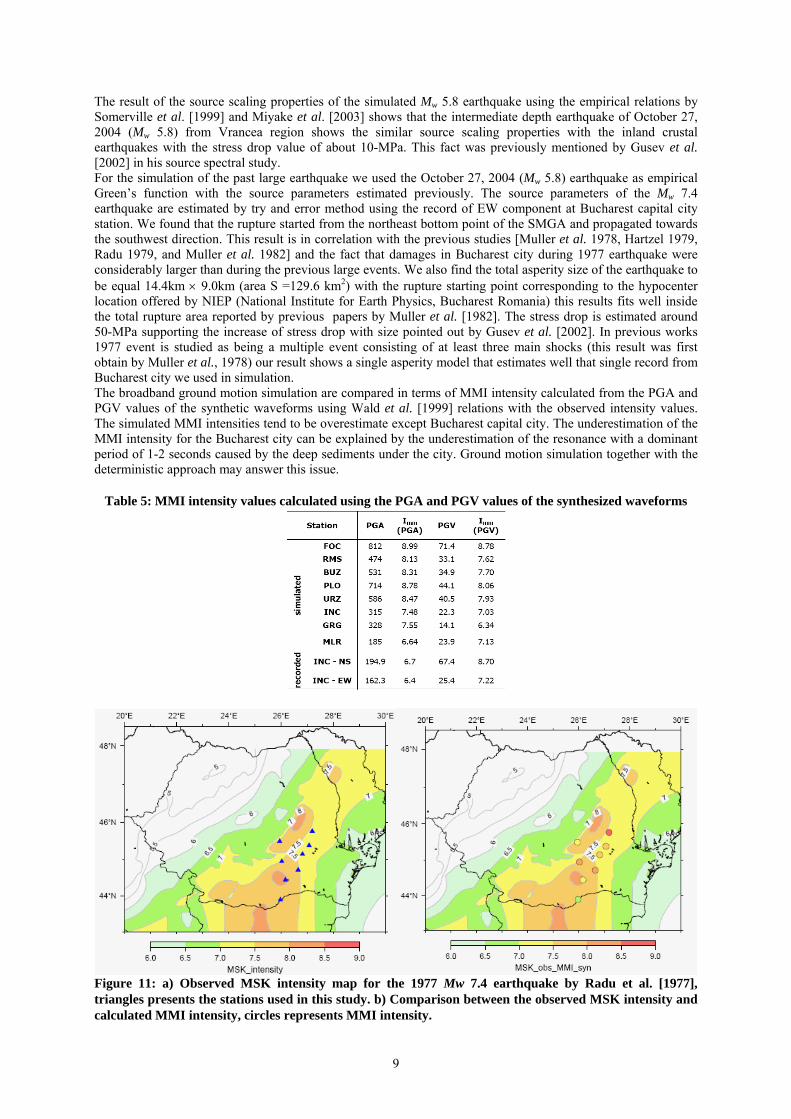
Figure 10: Synthetic waveforms of Mw 7.4 earthquake calculated using the EGF method for eight stations with the source parameters estimated with the Mw 5.8 event as Green’s function. To perform a validation of the obtained source model and the result of the eight-station simulation, we calculated MMI intensity using the PGA and PGV values of the synthetic waveforms (Figure 10) and compared the obtained MMI intensity values with the map of MSK intensity distribution observed during the 1977 earthquake by Radu et al. [1977], Figure 11(a). While the two intensity scales MMI and MSK are very close this comparison can be easily done. For the calculation of the MMI intensity, the empirical relations by Wald et al. [1999] equations (1) been used. The result of the Intensity calculation is shown in Table 5, and the comparison between the observed MSK and calculated MMI intensities is shown in the Fig. 11(b), where we display the MMI intensities from the PGV following the equations (1). It can be observed that the intensity values tend to be overestimated with the exception of the Bucharest capital city for which underestimated values are obtained.
( ) 66.1log66.3 −= PGAImm and ( ) 35.2log47.3 += PGVI mm (1)
4. DISSCUTIONS AND CONCLUTIONS
In present study, we first estimated the source parameters and simulated the ground motions for the recent Mw 5.8 using foreshock with the record of magnitude Mw 4.8 as empirical Green’s function. The SMGA size was found to be 4.8km × 3.0km with the rupture starting point at the southwest deeper part of asperity and propagated towards the northwest with the rupture velocity representing 75% of shear wave velocity. The validation of the result is made by comparison of the synthetic waveforms of displacement, velocity, and acceleration for the target Mw 5.8 earthquake with the observed one at the other stations located at larger epicenter distances.
8
The result of the source scaling properties of the simulated Mw 5.8 earthquake using the empirical relations by Somerville et al. [1999] and Miyake et al. [2003] shows that the intermediate depth earthquake of October 27, 2004 (Mw 5.8) from Vrancea region shows the similar source scaling properties with the inland crustal earthquakes with the stress drop value of about 10-MPa. This fact was previously mentioned by Gusev et al. [2002] in his source spectral study. For the simulation of the past large earthquake we used the October 27, 2004 (Mw 5.8) earthquake as empirical Green’s function with the source parameters estimated previously. The source parameters of the Mw 7.4 earthquake are estimated by try and error method using the record of EW component at Bucharest capital city station. We found that the rupture started from the northeast bottom point of the SMGA and propagated towards the southwest direction. This result is in correlation with the previous studies [Muller et al. 1978, Hartzel 1979, Radu 1979, and Muller et al. 1982] and the fact that damages in Bucharest city during 1977 earthquake were considerably larger than during the previous large events. We also find the total asperity size of the earthquake to be equal 14.4km × 9.0km (area S =129.6 km2) with the rupture starting point corresponding to the hypocenter location offered by NIEP (National Institute for Earth Physics, Bucharest Romania) this results fits well inside the total rupture area reported by previous papers by Muller et al. [1982]. The stress drop is estimated around 50-MPa supporting the increase of stress drop with size pointed out by Gusev et al. [2002]. In previous works 1977 event is studied as being a multiple event consisting of at least three main shocks (this result was first obtain by Muller et al., 1978) our result shows a single asperity model that estimates well that single record from Bucharest city we used in simulation. The broadband ground motion simulation are compared in terms of MMI intensity calculated from the PGA and PGV values of the synthetic waveforms using Wald et al. [1999] relations with the observed intensity values. The simulated MMI intensities tend to be overestimate except Bucharest capital city. The underestimation of the MMI intensity for the Bucharest city can be explained by the underestimation of the resonance with a dominant period of 1-2 seconds caused by the deep sediments under the city. Ground motion simulation together with the deterministic approach may answer this issue.
Table 5: MMI intensity values calculated using the PGA and PGV values of the synthesized waveforms
Figure 11: a) Observed MSK intensity map for the 1977 Mw 7.4 earthquake by Radu et al. [1977], triangles presents the stations used in this study. b) Comparison between the observed MSK intensity and calculated MMI intensity, circles represents MMI intensity.
9

5. ACKNOWLEDGEMENT
The authors acknowledge the Japan International Cooperation Agency JICA that donated to National Centre for Seismic Risk Reduction (NCSRR) seismic instruments data from these instruments were used in the present study. We would also like to express our gratitude to JICA for a continuous support during the present study, to the members of NCSRR for using strong motion records by there seismic network and also to National Institute for Earth Physics (NIEP) for using there earthquake catalogue. We are grateful to Dr. Taiki Saito for providing strong motion data of INC station. Discussion with Drs. Toshiaki Yokoi and Nobuo Hurukawa helped to improve the study. We are also grateful to Profs. Kojiro Irikura and Tomotaka Iwata providing valuable coments helpful for improving the study. Some figures were drawn using the GMT Ver.3.0 [Wessel and Smith, 1995].
6. REFERENCES Aki, K. (1967), Scaling law of seismic spectrum, J. Geophys. Res., 72, 1217-1231. Brune, J. N. (1970), Tectonic stress and the spectra of seismic shear waves from earthquakes, J. Geophys. Res.,
75, 4997-5009. Brune, J. N. (1971), Correction, J. Geophys. Res., 76, 5002. Hartzell, S. (1979), Analysis of the Bucharest strong ground motion record for the March 4, 1977 Romanian
earthquake, Bull. Seism. Soc. Am., 69, 513-530. Irikura, K. (1983), Semi-empirical estimation of strong ground motions during large earthquakes, Bull. Disast.
Prev. Res. Inst., Kyoto Univ., 33, 63-104. Irikura, K. (1986), Prediction of strong acceleration motions using empirical Green's function, Proc. 7th Japan
Earthq. Eng. Symp., 151-156. Irikura, K. and Kamae, K. (1994), Estimation of strong ground motion in broad-frequency band based on a
seismic source scaling model and an empirical Green's function technique, Annali di Geofisica, 37, 1721-1743.
Gusev, A., Radulian, M., Rizescu, M., Panza, G.F. (2002), Source scaling of intermediate-depth Vrancea Earthquakes, Geophys. J. Int., 151, pp 879-889.
Kanamori, H. and Anderson, D.L. (1975), Theoretical basis of some empirical relations in seismology, Bull. Seism. Soc. Am., 65, 1073-1095.
Mckenzie, D. P. (1970), Plate tectonics of Mediterranean region, Nature, 226, 239-242. Mckenzie, D.P. (1972), Active tectonics of the Mediterranean region, Geophys. J. R Astr. Soc., 39, pp
109-185. Miyake, H., Iwata, T. and Irikura, K. (1999), Strong ground motion simulation and source modeling of the
Kagoshima-ken Hokuseibu earthquakes of March 26 (MJMA6.5) and May 13 (MJMA6.3), 1997, using empirical Green's function method, Zisin 2 (J. Seism. Soc. Jpn.), 51, 431-442 (in Japanese with English abstract).
Miyake, H., Iwata T., and Irikura K. (2003), Source Characterization for Broadband Ground-Motion Simulation: Kinematic Heterogeneous Source Model and Strong Motion Generation Area, Bull. Seism. Soc. Am., 93, pp. 2531-2445.
Muller, G., Bonjer, K., Stockl, H. and Enescu, D. (1978), The Romanian earthquake of March 4, 1977. I. Rupture process inferred from fault-plane solution and multiple-event analysis, J. Geophys., 44, 203-218.
Radu, C., Polonic, G., and Apopei, I. (1979), Macroseismic Field of the March 4, 1977 Vrancea Earthquake. Tectonophysics, 53, pp. 185-186.
Rakers, E. and Muller, G. (1982), The Romanian earthquake of March 4, 1977. III. Improved focal model and moment determination, J. Geophys., 50, 143-150.
Somerville, P., Irikura, K., Graves, R., Sawada, S., Wald, D., Abrahamson, N., Iwasaki, Y., Kagawa, T., Smith, N. and Kowada, A. (1999), Characterizing crustal earthquake slip models for the prediction of strong ground motion, Seism. Res. Lett., 70, 59-80.
Wald, D.J., Quitoraiano, V., Heaton, T.H., and Kanamori, H. (1999), Relationships between Peak Ground Acceleration, Peak Ground Velocity, and Modified Mercalli Intensity in California. Earthquake Spectra, 15, pp.557-564.
Wessel, P. and Smith, W.H.F. (1995), New version of the Generic Mapping Tools released, EOS Trans. Am. Geophys. Union., 76, 329.
10