First Annual Malthus Lecture: MEAT - Population … THE AUTHOR JOEL E. COHEN studies the demography,...
12
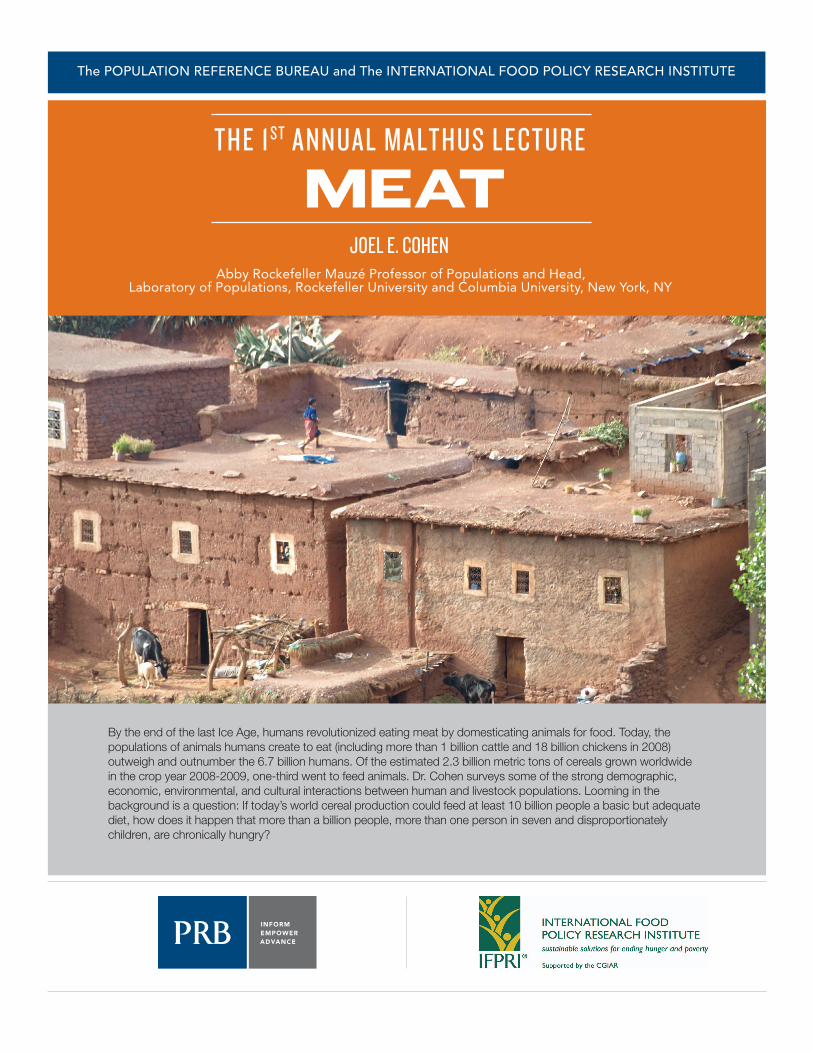
The POPULATION REFERENCE BUREAU and The INTERNATIONAL FOOD POLICY RESEARCH INSTITUTE THE 1 ST ANNUAL MALTHUS LECTURE MEAT JOEL E. COHEN Abby Rockefeller Mauzé Professor of Populations and Head, Laboratory of Populations, Rockefeller University and Columbia University, New York, NY By the end of the last Ice Age, humans revolutionized eating meat by domesticating animals for food. Today, the populations of animals humans create to eat (including more than 1 billion cattle and 18 billion chickens in 2008) outweigh and outnumber the 6.7 billion humans. Of the estimated 2.3 billion metric tons of cereals grown worldwide in the crop year 2008-2009, one-third went to feed animals. Dr. Cohen surveys some of the strong demographic, economic, environmental, and cultural interactions between human and livestock populations. Looming in the background is a question: If today’s world cereal production could feed at least 10 billion people a basic but adequate diet, how does it happen that more than a billion people, more than one person in seven and disproportionately children, are chronically hungry?
Transcript of First Annual Malthus Lecture: MEAT - Population … THE AUTHOR JOEL E. COHEN studies the demography,...
The POPULATION REFERENCE BUREAU and The INTERNATIONAL FOOD POLICY RESEARCH INSTITUTE
THE 1 ST ANNUAL MALTHUS LECTURE
MEATJOEL E. COHEN
Abby Rockefeller Mauzé Professor of Populations and Head, Laboratory of Populations, Rockefeller University and Columbia University, New York, NY
By the end of the last Ice Age, humans revolutionized eating meat by domesticating animals for food. Today, the populations of animals humans create to eat (including more than 1 billion cattle and 18 billion chickens in 2008) outweigh and outnumber the 6.7 billion humans. Of the estimated 2.3 billion metric tons of cereals grown worldwide in the crop year 2008-2009, one-third went to feed animals. Dr. Cohen surveys some of the strong demographic, economic, environmental, and cultural interactions between human and livestock populations. Looming in the background is a question: If today’s world cereal production could feed at least 10 billion people a basic but adequate diet, how does it happen that more than a billion people, more than one person in seven and disproportionately children, are chronically hungry?

ABOUT THE AUTHOR
JOEL E. COHEN studies the demography, ecology, population genetics,
epidemiology, and social organization of human and nonhuman
populations and mathematical concepts useful in these fields. He
earned a Ph.D. in applied mathematics from Harvard in 1970, and
another doctorate in population sciences and tropical public health
from Harvard in 1973. Dr. Cohen is the author or editor of 14 books
and 360 articles, including How Many People Can the Earth Support?
(1995). His research won the Mercer Award of the Ecological Society
of America, the Sheps Award of the Population Association of
America, the Nordberg Award of the Population Council, the Tyler
Prize for Environmental Achievement, the Gheorghe Lazar Prize of
the Romanian Academy, the City of New York Mayor’s Award for
Excellence in Science and Technology, and the Soper Prize of the
Pan American Health Organization. He is a member of the National
Academy of Sciences, the American Academy of Arts and Sciences,
and the American Philosophical Society.
MEAT
This article is based on a lecture given as the first annual Malthus
Lecture, on March 3, 2010, in Washington, D.C.
Joel E. Cohen
Abby Rockefeller Mauzé Professor of Populations
Rockefeller & Columbia Universities
1230 York Avenue, Box 20
New York, NY 10065-6399
© 2011 Joel E. Cohen. All rights reserved.
Cover Photo: Berber Village in the Atlas Mountains, Morocco, 2009.
Joel E. Cohen.

1www.prb.org
Eating meat has a deep evolutionary history that goes back to one cell engulfing another,
long before multicelled animals existed. Carnivory influenced the evolution of our hominid
ancestors and remains important to humans and humans’ nearest living primate relatives. By
the end of the last Ice Age, perhaps 12,000 years ago, humans had revolutionized eating meat
by domesticating animals for food. In the last half century, the magnitude, geographic scope,
and complexity of eating meat have increased enormously. Today, the populations of animals
humans create to eat (including 1.35 billion cattle and 18.4 billion chickens in 2008) outweigh
and outnumber humans (6.7 billion in 2008, nearly 7 billion in 2011). Of the estimated 2.3
billion metric tons of cereals grown worldwide in the crop year 2008-2009, one-third went to
feed domestic animals.
THE 1ST ANNUAL MALTHUS LECTURE MEAT
The strong demographic, economic, environmental, and cultural interactions between human populations and the populations of domesticated animals that people eat also involve the parasitic and microbial populations that eat humans and animals. The costs and consequences of eating meat have changed from largely local to local and global. Responses are required to get the prices of eating meat right and to protect the poorest people. Looming in the background is a troubling question. How does it happen that more than a billion people, more than one person in seven and disproportionately children, are chronically hungry, when world cereal production has the potential to feed 9 billion to 11 billion people a basic but adequate diet? Policies are recommended that could alleviate some of the problems associated with meat production and consumption, hunger, and poverty.
Prehistory and History of Eating MeatEating meat dates back to the early development of life on Earth, long before the origins of multicellular animals such as primates and humans. The cells in every human body evolved from some early single cell (or cells) that ingested another cell, an alpha-
proteobacterium, and packaged the ingested cell in a wrapper of its own cell membranes.1 When the predatory cell did not digest the alpha-proteobacterium it had just enfolded, the genes of the ingested cell enhanced the predator’s survival and reproduction, and the combination of predatory cell plus the embedded alpha-proteobacterium increased in abundance. The genetic material of the alpha-proteobacterium evolved into a protomitochondrion and its genes were gradually transferred from the mitochondrion to the nucleus of the predatory cell.
The cells that incorporated mitochondria evolved into the mitochondriate protists. One line of these mitochondriate protists evolved into animals and fungi. Another line of mitochondriate protists later ingested but did not digest cyanobacteria, blue-green algae, which became symbiotic with the consuming cell. These cyanobacteria living inside the mitochondriate protists evolved into plastids. These plastids led to the development of the green plants. By exchanges of genetic material, bacteria materially influenced the evolution of all the eukaryotes, which include humans as well as most animals, fungi, and plants. (In another, anciently separated line of descent, the cells that did not consume alpha-proteobacteria evolved into what are today known as amitochondriate protists, which constitute today’s Archezoa.)

MALTHUS LECTURE MEATwww.prb.org2
Fast-forward a few billion years to the history of the primates. Chimpanzees, the nonhuman species genetically closest to people, hunt, eat meat, and use tools, like people. Anthropologists infer that the last common ancestor of chimpanzees and people probably also hunted, ate meat, and used tools. That common ancestor probably lived between 4 million and 7 million years ago. The defining characteristics of the genus Homo, which includes our species Homo sapiens, are radical expansion of the brain, greater use of tools, and increased eating of meat.2
By the end of the last Ice Age, which occurred in different places between 12,000 and 18,000 years ago, cattle had been domesticated and were, in some cultures, regarded with reverence.
Human relations with domestic animals are deeply embedded in human culture. For example, the word for “home” in Chinese has two parts.3 At the top is a pictograph of a roof, represented by a horizontal line with serifs. Beneath the roof is a pictograph of a pig. For more than a billion people in the world today, the character for home in classical Chinese depicts “roof over pig.” For another billion people in the Muslim world, eating the flesh of pigs is forbidden (Haraam in Arabic). In the Berber villages of the Atlas Mountains of Morocco, cattle and goats live in the intimate shelter of homes (see cover photo). The domestic animals in Morocco differ from those in China, but in both places people shelter their domestic animals at home.
Growth in the Scale and Complexity of Eating MeatThe growth in the scale and complexity of eating meat can be measured by the growth in the populations of humans and domestic animals in recent decades. Meat production has increased enormously and the economics of livestock are globally significant. Livestock have important effects on land, water, and the atmosphere. Livestock affect human health for good and for ill. I will describe each of these aspects of human interaction with the animals people eat.
Populations of Humans and Domestic AnimalsFrom 1961 to 2008, the populations of most domestic animals grew, while the human population more than doubled from about 3.1 billion in 1961 to about 6.7 billion in 2008.
When the population size of each domestic animal in each year is divided by the size of the human population in the same year, the numbers of animals per person follow three divergent trends. The numbers per person increased dramatically for some domestic animals: chickens, ducks, geese, and Guinea fowl. For others, the number per person was more or less steady: goats and pigs. Finally, the numbers of cattle, sheep, and horses per person declined. Overall, the numbers per person of large
ruminants like cattle and sheep and large animals like horses decreased, while the numbers per person of poultry increased.
By 2008, chickens were the most numerous domestic animals per person: There were nearly three chickens per person. The next most numerous animals per person were cattle, ducks, sheep, pigs, goats, and turkeys. But a simple head count may not be the best measure of the impact of the populations of domestic animals. Each head of cattle weighs much more than each chicken. If the population size of each species of domestic animals is multiplied by a typical or average weight, the result is the biomass or aggregate weight of that species. In 2008, cattle had the largest biomass of all domestic animals.
Meat Production and Economics of LivestockFrom 1961 to 2008, the world’s meat production grew nearly four-fold, from 71 million metric tons to 280 million metric tons (see Figure 1). (One metric ton is 1,000 kilograms, or approximately 2,200 pounds.)
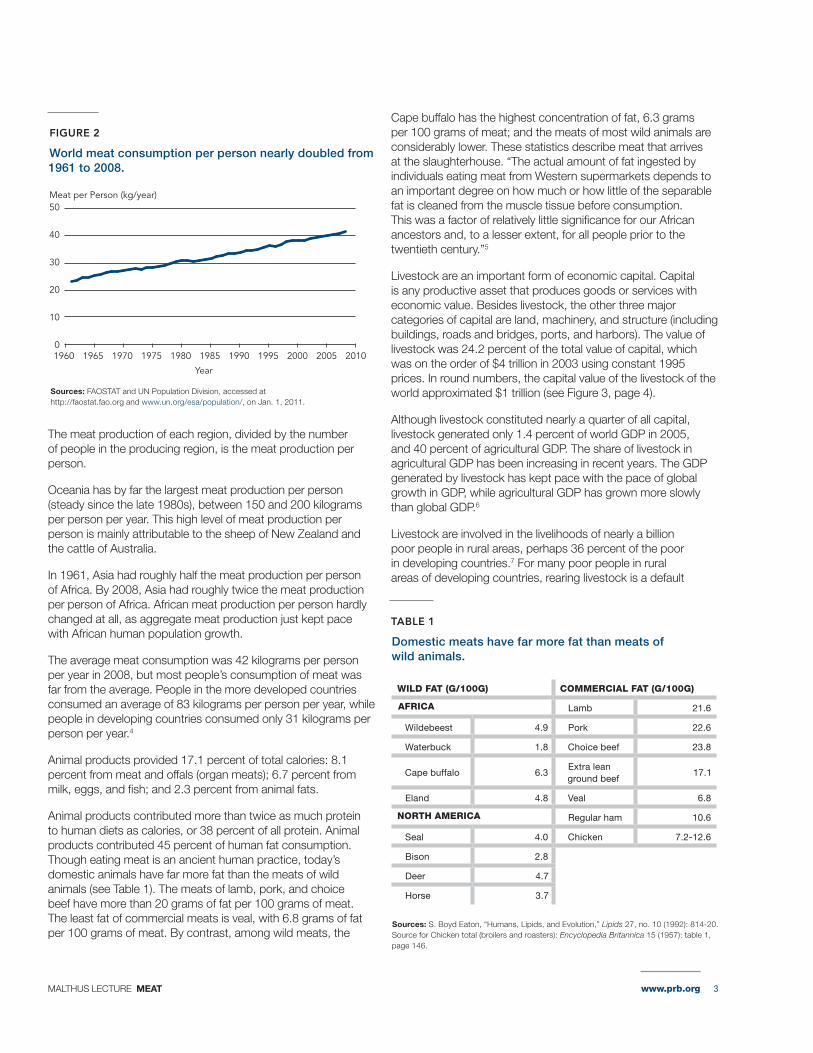
As we have already seen, the human population more than doubled during this interval, so the global average meat production per person nearly doubled from 1961 (23 kilograms per person) to 2008 (41 kilograms per person) (see Figure 2, page 3). The growth in meat production was driven by growth in human population size (responsible for a factor just over 2) and growth in economic demand per person (responsible for a factor just under 2).
The growth in aggregate meat production was concentrated in Asia and the Americas. European meat production in aggregate peaked around 1990 and declined slightly, holding steady since the latter part of the 1990s.
FIGURE 1
Aggregate global meat production grew nearly fourfold from 1961 to 2008.
Source: FAOSTAT, accessed at http://faostat.fao.org, on Jan. 1, 2011.
Year
1960 1970 1980 1990 2000 201020051995198519751965
Metric Tons
50
100
0
150
200
250
300
www.prb.org MALTHUS LECTURE MEAT 3
The meat production of each region, divided by the number of people in the producing region, is the meat production per person.
Oceania has by far the largest meat production per person (steady since the late 1980s), between 150 and 200 kilograms per person per year. This high level of meat production per person is mainly attributable to the sheep of New Zealand and the cattle of Australia.
In 1961, Asia had roughly half the meat production per person of Africa. By 2008, Asia had roughly twice the meat production per person of Africa. African meat production per person hardly changed at all, as aggregate meat production just kept pace with African human population growth.
The average meat consumption was 42 kilograms per person per year in 2008, but most people’s consumption of meat was far from the average. People in the more developed countries consumed an average of 83 kilograms per person per year, while people in developing countries consumed only 31 kilograms per person per year.4
Animal products provided 17.1 percent of total calories: 8.1 percent from meat and offals (organ meats); 6.7 percent from milk, eggs, and fish; and 2.3 percent from animal fats.
Animal products contributed more than twice as much protein to human diets as calories, or 38 percent of all protein. Animal products contributed 45 percent of human fat consumption. Though eating meat is an ancient human practice, today’s domestic animals have far more fat than the meats of wild animals (see Table 1). The meats of lamb, pork, and choice beef have more than 20 grams of fat per 100 grams of meat. The least fat of commercial meats is veal, with 6.8 grams of fat per 100 grams of meat. By contrast, among wild meats, the
Cape buffalo has the highest concentration of fat, 6.3 grams per 100 grams of meat; and the meats of most wild animals are considerably lower. These statistics describe meat that arrives at the slaughterhouse. “The actual amount of fat ingested by individuals eating meat from Western supermarkets depends to an important degree on how much or how little of the separable fat is cleaned from the muscle tissue before consumption. This was a factor of relatively little significance for our African ancestors and, to a lesser extent, for all people prior to the twentieth century.”5
Livestock are an important form of economic capital. Capital is any productive asset that produces goods or services with economic value. Besides livestock, the other three major categories of capital are land, machinery, and structure (including buildings, roads and bridges, ports, and harbors). The value of livestock was 24.2 percent of the total value of capital, which was on the order of $4 trillion in 2003 using constant 1995 prices. In round numbers, the capital value of the livestock of the world approximated $1 trillion (see Figure 3, page 4).
Although livestock constituted nearly a quarter of all capital, livestock generated only 1.4 percent of world GDP in 2005, and 40 percent of agricultural GDP. The share of livestock in agricultural GDP has been increasing in recent years. The GDP generated by livestock has kept pace with the pace of global growth in GDP, while agricultural GDP has grown more slowly than global GDP.6
Livestock are involved in the livelihoods of nearly a billion poor people in rural areas, perhaps 36 percent of the poor in developing countries.7 For many poor people in rural areas of developing countries, rearing livestock is a default
FIGURE 2
World meat consumption per person nearly doubled from 1961 to 2008.
TABLE 1
Domestic meats have far more fat than meats of wild animals.
Sources: FAOSTAT and UN Population Division, accessed at http://faostat.fao.org and www.un.org/esa/population/, on Jan. 1, 2011.
Sources: S. Boyd Eaton, “Humans, Lipids, and Evolution,” Lipids 27, no. 10 (1992): 814-20. Source for Chicken total (broilers and roasters): Encyclopedia Britannica 15 (1957): table 1, page 146.
Meat per Person (kg/year)
Year
1960 1970 1980 1990 2000 201020051995198519751965
20
30
40
0
10
50
WILD FAT (G/100G) COMMERCIAL FAT (G/100G)
AFRICA Lamb 21.6
Wildebeest 4.9 Pork 22.6
Waterbuck 1.8 Choice beef 23.8
Cape buffalo 6.3Extra lean ground beef
17.1
Eland 4.8 Veal 6.8
NORTH AMERICA Regular ham 10.6
Seal 4.0 Chicken 7.2-12.6
Bison 2.8
Deer 4.7
Horse 3.7

MALTHUS LECTURE MEAT4 www.prb.org
occupation that gives them some sustenance but, because it is frequently so unproductive, keeps them poor.
Global accounting for the meat available in any year as food starts with the amount of meat produced, deducts exports, adds imports, and adds net changes to the stock of meat. From 2003 to 2005, meat production of 254 million metric tons, minus the export of 31 million metric tons, plus the import of 29 million metric tons, minus net additions to stock of 2 million metric tons, led to a food supply of 250 million metric tons of meat.8 Had this amount of meat been shared equally among the 6.5 billion people living in 2005, each would have had an ample supply of 105 grams of meat per person per day. About 12 percent of production (almost one part in eight, by weight) crossed an international border (the exports of 31 million metric tons divided by the meat production of 254 million metric tons). Hence meat production is no longer purely for national markets but is involved significantly in international trade.
Livestock Affect Land, Water, and AtmosphereBetween 1700 and 2000, people converted more land to crop land, but converted land to pastures at an even faster rate (see Figure 4), as farmers fed a human population that grew by a factor of roughly 10, from about 600 million people in 1700 to about 6.1 billion in 2000.9
While forests and woodlands shrank, grasslands shrank even faster. Despite the increases in arable land and pasture, the areas of each per person declined.
The developed countries, over the last 40 years, experienced a slower decline in areas of arable land and pasture per person than did the developing countries because population growth in the developed countries was much slower. Throughout the last half-century, the amount of arable land per person in developing countries has been less than half that in developed countries, reaching a low of about 0.2 hectare at the beginning of the 21st century.
As of 2007, livestock used 30 percent of all ice-free land. This 30 percent consisted of the 26 percent of ice-free land devoted to pastures plus the arable land (about 4 percent of all ice-free land)devoted to growing feed for domestic animals. Another 8 percent of all ice-free land is the arable land used for people’s food. Livestock used 79 percent of the total land used for agriculture (30 percent for livestock divided by 38 percent for agriculture).
The huge fraction of the Earth’s ice-free land (30 percent) and the large fraction of human capital (24.2 percent) involved in livestock contrast dramatically with the small fraction of income (1.4 percent) generated by livestock. Only the major contributions to protein and fat from livestock are consistent with the large shares of land and capital involved in livestock.
Plants produce more energy per unit of land area than animals (see Table 2, page 5) and more protein per unit of land area than animals (see Table 3, page 5). For example, while one-quarter of a hectare of land (the area of a square plot 50 meters on each edge) planted in beans produces the protein an adult of typical weight needs for a year, dairy cows require one to three hectares and beef three to six hectares. An adult human who weighs 65 kilograms requires about 55 grams of protein a day or 20 kilograms of protein a year. Similarly, one hectare (the area of a square plot 100 meters on an edge) can produce 5 million kilocalories per year if planted in grain and 25 million kilocalories per year if planted in sugar, while one hectare devoted to beef yields 0.4 million kilocalories per year.
The livestock sector uses about 8 percent of all water that humans use globally. Most of this water is used to irrigate feed crops. Some analysts suggest that livestock are “probably the largest sectoral source of water pollution.”10 Pollution results from animal wastes, antibiotics, and hormones used in bulk for domestic animals, tannery chemicals, fertilizers, and pesticides for feed crops, and sediments from eroded pastures. Moreover, pollution externalities increase with the size of farm.11
FIGURE 3
Livestock account for nearly one-quarter of economic capital.
FIGURE 4
From 1700 to 2000, pasture and cropland grew, while grassland, forest, and woodland shrank.
Source: FAO Statistical Yearbook 2009: table A.14.
Source: J.R. McNeill, “Population and the Natural Environment: Trends and Challenges.” in The Political Economy of Global Population Change 1950-2050, ed. Paul Demeny and Geoffrey McNicoll (Population and Development Review, supplement to vol. 32, 2006).
Structure
24.2%
5.1%
16.0%
54.7%
Livestock
Machinery
Land
Square Kilometers (millions)
Year
Forest & woodland
GrasslandPasture
Cropland
1700 1725 1775 1825 1875 1925 19751750 1800 1850 1900 1950 2000
30
60
0
90
120
150

MALTHUS LECTURE MEAT www.prb.org 5
gases (after converting methane and other greenhouse gases to carbon dioxide equivalents) come from the livestock sector globally, whereas less than 13 percent of all greenhouse gases (in carbon dioxide equivalents) come from the transportation sector globally.13
Maurice Pitesky pointed out that the FAO analysis included a complete lifecycle analysis of livestock sector production of greenhouse gases, whereas the analysis of the transportation sector was not similarly complete. Pitesky and colleagues reported that the United States Environmental Protection Agency, in a 2007 study of United States greenhouse gas emissions, estimated that 3 percent of U.S. emissions came from the livestock sector and 26 percent came from the transportation sector.14 It is unsurprising that the United States has a higher percentage of its emissions from the transportation sector than the global average, but the differences from the global average are dramatic.
Also according to Pitesky and colleagues, the California Energy Commission estimated that California’s greenhouse gas emissions (in carbon dioxide equivalents) came 3 percent from the livestock sector and 37 percent from the transportation sector. Given the dependence on automobiles in California, the high proportion from transportation is perhaps unsurprising but the low proportion from the livestock sector (consistent with that for the United States as a whole) is much lower than the FAO’s estimate for the globe.15
In 2007, the Intergovernmental Panel on Climate Change estimated that all agriculture globally contributes 10 percent to 12 percent of greenhouse gases (in carbon dioxide equivalents) whereas the transportation sector contributes 23 percent. If the IPCC estimate is approximately right, the contribution from livestock must be some fraction of the 10 percent to 12 percent from all agriculture, well below the 18 percent estimated by Henning Steinfeld and colleagues in 2006.16
These discrepancies remain to be resolved. They serve as a warning that the understanding of the environmental, especially the atmospheric, impact of livestock is still limited.
Health and MeatThe interactions between meat and human health are vast and complex. Among the population-related aspects are the global and regional prevalence of hunger and the priorities of people, domestic animals, and other uses of cereal grains (such as for seed, industrial starches, and fuel for machines). I will discuss evidence of the importance of meat for children, the contributions of domestic animals to zoonoses (infectious diseases that are naturally transmitted between vertebrate animals and humans), and the possible impact of horizontal gene transfer for genes involved in antibiotic resistance.
I will not here examine other related topics, such as individual clinical aspects, the impact of hormones used in animal production on people who consume meat products, or the
On average over the period 1997 to 2001, the countries that exported livestock products effectively exported 275 cubic kilometers of water per year, as measured by the water required to produce the exported livestock products in the exporting countries.12 A cubic kilometer is a billion cubic meters. If the same livestock products had been raised in the countries which imported them, the water requirement would have been 320 cubic kilometers. Thus, international trade in livestock products reduced global water withdrawals for meat production by 45 cubic kilometers. Whether this international trade in livestock products is economically and environmentally rational depends on the alterative uses of the water in meat-importing and meat-exporting countries, as well as on other economic and environmental factors.
Livestock affect greenhouse gases, but by how much remains highly controversial. According to a widely publicized FAO study, Livestock’s Long Shadow, about 18 percent of all greenhouse
TABLE 2
Plants produce more energy per land area than animals.
TABLE 3
Animals need more land than plants to produce protein for one adult.
Note: 106 kcal / year=2500 kcal/day x 400 days, more than enough for one adult. Source: Arnold Bender, “Meat and Meat Products in Human Nutrition in Developing Countries,” Paper 53, commissioned jointly by the Animal Production and Health Division and the Food Policy and Nutrition Division of FAO (Rome: FAO, 1992).
Note: 20 kg/year=55 g/day Source: Arnold Bender, “Meat and Meat Products in Human Nutrition in Developing Countries,” Paper 53, commissioned jointly by the Animal Production and Health Division and the Food Policy and Nutrition Division of FAO (Rome: FAO, 1992).
MILLIONS OF KILOCALORIES/HECTARE/YEAR
PLANT PRODUCTS ANIMAL PRODUCTS
Grain 5 Beef 0.4
Rice 7 Eggs 0.5
Potatoes 12 Milk 1.8
Cassava 12
Banana 13
Sugar 25
HECTARES NEEDED TO PRODUCE 20 KG PROTEIN/YEAR
PLANTS ANIMALS
Beans 0.25 Dairy cows 1–3
Grass 0.3–0.6 Chickens 3
Cereals 0.6 Sheep 2–5
Potatoes 0.7 Pigs 5
Beef 3–6

MALTHUS LECTURE MEAT6 www.prb.org
impact of excessive meat fat on people’s health. According to the World Health Organization, in 2005, globally about 1.6 billion adults (ages 15+) were overweight (defined as having a Body Mass Index greater than or equal to 25), including at least 400 million who were obese (defined as having a Body Mass Index greater than or equal to 30).17 It is not clear how many or which of the excess calories come from animal products and how many come from other sources of excess calories like sugar and corn syrup.
Measures of “hunger” disagree. While there is uncertainty about the exact number of people who lack enough food for a normal healthy life, there is no doubt that the numbers are large, in the hundreds of millions or more. For example, for June 2009, the FAO estimated that the world had 1.02 billion undernourished people while the United States Department of Agriculture estimated that 833 million people were food-insecure.18 For Asia, the FAO estimate of 642 million undernourished exceeded the USDA estimate of 379 million food-insecure people. But for sub-Saharan Africa, the FAO estimate of 265 million undernourished people was less than the USDA estimate of 385 million food-insecure people. Estimates of undernourished people from the FAO did not always outnumber estimates of food-insecure people from the USDA. The methods of estimation are different. It is unclear how to interpret the differences and the results of the different estimates.
According to the FAO’s 2009 report State of Food Insecurity, the estimated number of people undernourished was higher in 2009 than in the 40 years since 1969.19 Between 1969 and 1971 and 1995 and 1997, the number of undernourished people dropped from about 880 million to about 825 million. The number then rose dramatically to about 910 million in 2008 and still more dramatically to above 1 billion in 2009. Those undernourished people, by the FAO definition, were concentrated in Asia and the Pacific (642 million) and sub-Saharan Africa (265 million). Latin America and the Caribbean had about 53 million undernourished people and the Near East and North Africa had about 42 million. The FAO estimated that the developed countries had about 15 million undernourished people. In 2010, the FAO estimate of the number of people currently undernourished dropped to 925 million—a number still so large as to be deeply morally troubling.20
Is there enough food in the world? The answer is: yes and no. From 2008 to 2009, the world grew about 2.3 billion metric tons of cereal grain. If each person needs between 2,000 and 2,500 kilocalories per day, this quantity of grain could feed 9 billion to 11 billion people a simple vegetarian diet (though grain alone does not provide all necessary micronutrients). Of the amount grown, some is lost to spoilage and transport. Only 2.2 billion metric tons were used. Of the amount used, 47 percent was fed to people, 33 percent was fed to animals, and 18 percent went to other uses such as seed and industrial production of starch, sweeteners, and biofuels. About 1 billion undernourished people exercised less demand in world food markets than those who demanded meat or industrial products from cereals.
In round numbers, one can divide the world’s grain product in 2009 into six equal portions. Three of those portions (approximately 47 percent) went into human mouths. Two of those portions went into animal mouths. One of those portions fed machines and provided seed. Though food enough for all is produced, the 1 billion poorest people stand in line for food behind domestic animals and machines.
One consequence is that many children grow up stunted—very short for their age. Technically, a child is stunted when its height is in the bottom 2 percent of the distribution of height for well-fed children of the child’s age. Standard distributions of height for age have been developed by the World Health Organization in collaboration with the United States Centers for Disease Control.21 Stunting is concentrated in South Asia and across the middle of southern Africa, where many countries have more than half the children stunted.
A small child can derive half of its daily protein requirement from one ounce of meat (28.3 grams). In what claims to be “the first randomized, controlled feeding study to examine the effect of meat- vs. milk- vs. plant-based snacks on functional outcomes on children,” Charlotte Neumann and colleagues assigned 12 primary schools in rural Kenya to one of four treatments.22 Three of the schools, chosen at random, got no supplemental feeding. The other nine schools got a plant-based dish as a midmorning snack. In three of the schools, the snack was supplemented with meat. In another three schools, the snack was supplemented with milk. In the final three schools, the snack had fat added to equalize the energy content in all feedings. The meat group showed the steepest increase in measures of cognitive function (Raven’s Progressive Matrices scores and end-term total and arithmetic test scores). The meat group also showed the greatest increase in the percent of time in high levels of physical activity, initiative, and leadership behaviors compared with all other groups. In the milk group, only younger and stunted children showed greater gain in height. The meat group nearly doubled its upper mid-arm muscle area and the milk group had a smaller increase. Meat made a crucial contribution to the health, activity, and mental and physical growth of these young children.
Because there are critical periods in the development of children, the ages when children get adequate nourishment make a large difference. In another randomized study, Marie Ruel and colleagues compared a preventive model and a recuperative model of food assistance in Haiti.23 The preventive model targeted all children ages 6 to 23 months. The recuperative model targeted underweight children ages 6 to 60 months. Twenty communities were paired on access to services and randomly assigned to either the preventive or the recuperative model. Cross-sectional surveys at the baseline and three years later looked for differences in undernutrition in children ages 12 to 41 months. There were about 1,500 children per survey. In sum, noted Ruel, “The preventive program was more effective for the reduction of childhood undernutrition than the traditional

www.prb.org MALTHUS LECTURE MEAT 7
recuperative model.” It is more effective to ensure all children adequate food than to try to make up for lost growth with those already underweight. In this study, the food aid included no animal products.
Together, these two randomized studies suggest that ensuring that children get adequate protein from animal products or fortified foods and adequate other nutrients at very early ages promotes their growth and development better than later remedial action.
Although many people think of themselves as the top animal on the world’s food chain (possibly apart from lions, tigers, and a few other predators), the world’s parasites and microbes think otherwise. The human propensity to eat meat of wild and domestic origin exposes people to the viruses, bacteria, and other parasites that consume the animals that people eat. Carnivory risks adding people to the menu of those viruses, bacteria, and other parasites.
For example, it is generally believed that the people who ate nonhuman primates infected by the simian immunodeficiency viruses became infected with those viruses because the meat was not adequately cooked or because they were exposed to the infected primates’ blood or other body fluids. The human immunodeficiency viruses probably resulted from mutations in the very closely related simian immunodeficiency viruses.24
In other examples of human diseases acquired from consuming meat, the prion (a protein with a special 3-dimensional configuration) that causes mad-cow disease (bovine spongiform encephalitis) infected people who ate meat of infected cattle and caused a variant of the same neurodegenerative disease. Trichinosis is caused by a round worm acquired by eating raw or undercooked pork or wild game. Pigs are currently presumed to be an intermediate source of variant forms of influenza A (swine flu), though the original source may be infected wildfowl.
The rise of concern about H5N1 avian influenza illustrates the interaction between economic growth, environmental alteration, meat consumption, and human health. The rising demand in Asia for poultry led to the use of wetlands for domestic ducks and geese. These wetlands were and are used by migratory water fowl who are naturally infected with H5N1 influenza A virus. Through virally loaded feces left in the water, the wild fowl infected the domestic fowl. The domestic fowl then returned to their owners’ homes where close contact with humans made it possible for some humans to acquire H5N1 influenza A infection. The migratory wild fowl passing through Asia have global reach. Analysis of the genetics of the virus shows that viruses found in the United States probably originated from Asia and were carried by migratory birds.25
The World Organization for Animal Health, FAO, and WHO have developed a Global Early Warning System for Major Animal Diseases, including zoonoses.26 Among the zoonotic diseases related to meat production are: anthrax, bovine spongiform
encephalopathy, brucellosis, Crimean-Congo haemorrhagic fever, foodborne diseases (e. g., Escherichia coli, Trypanosoma cruzi), avian influenza, Japanese encephalitis, New World screwworm, Nipah virus, Old World screwworm, Q fever, rabies, Rift Valley fever, sheep pox, goat pox, and tularaemia. Even Ebola haemorrhagic fever has a “Reston” variant active in pigs.27
In addition, economically important nonzoonotic diseases of nonhuman animals related to meat production don’t infect people, but do infect the animals people eat. Examples include: African swine fever, classical swine fever, contagious bovine pleuropneumonia, foot and mouth disease, peste des petits ruminants, rinderpest stomatitis, and enteritis. International animal health organizations care about these diseases less from humanitarian concern for the health of animals than from economic concern that such infectious diseases compete with humans for the flesh of domestic animals.
Zoonoses are not the only way animal husbandry affects human health. The increased use of pesticides and insecticides on a bulk basis in agriculture selects for insects and arachnids that are resistant to these biocides. Some of these are vectors of human infectious diseases and some are vectors of zoonotic diseases. Likewise, the routine use of antibiotics in cattle and other kinds of animal production selects for resistant bacteria that can infect people. Evolution is alive and well and is working in agriculture.
Many studies have investigated the role of lateral or horizontal gene transfer by means of food consumed by humans or laboratory animal models such as mice and rats. In one such study, Shalini Mathur and Rameshwar Singh concluded: “Genes conferring resistance to tetracycline, erythromycin and vancomycin have been detected and characterized in Lactococcus lactis, Enterococci and, recently, in Lactobacillus species isolated from fermented meat and milk products. [We need] better understanding of the role played by the dairy starter microorganisms in horizontal transfer of antibiotic resistance genes to [human] intestinal microorganisms and food-associated pathogenic bacteria.”28
Prices and ProtectionGiven the deep roots of meat eating in human evolution, history, culture, and economics, meat eating seems unlikely to disappear soon. On the contrary, the prospects are that meat will increase as a component of diets in poor countries. A case can be made that animal-source products or equivalently fortified food products are greatly needed for the poorest and most vulnerable portions of the population.
Two kinds of responses are required to cope with the consequences of animal production and the needs for animal-source foods or their nutritional equivalent. First, market-based and regulatory mechanisms should be used to internalize the externalities of meat production. Second, going beyond

www.prb.org MALTHUS LECTURE MEAT8
markets, adequate diets should be ensured to interrupt the intergenerational transmission of poverty.
First, steps should be taken to make the prices of meat to consumers and the costs to producers reflect the full costs of meat production, processing, distribution, and consumption. Specifically, meat consumers and producers in countries of high and middle income should pay for the land degradation, water consumption and pollution, and consequences of the greenhouse gas emissions associated with animal production.
All three of these environmental impacts of meat production are direct and indirect. The direct effects are those produced by the animals themselves: overgrazing and degradation of soils, consumption and pollution of water by the animals, and emissions, notably of methane, from ruminants, as examples.
The indirect effects include the conversion of land from forest, woodlands, and grasslands to pastures or to arable lands to grow animal feeds; the increase in sedimentation of waterways from runoff from arable lands used for animal feeds; and the conversion of standing stocks of carbon in the form of trees and woodlands into atmospheric carbon dioxide when lands are cleared to provide pasture or raise feeds for animals.
In addition to these environmental effects on land, water, and the atmosphere, animal producers and meat consumers should pay the full costs of the human health risks, animal waste treatment and disposal (including the effects of animal waste lagoons on the quality of ground water), and species losses associated with animal production, processing, and consumption.
Health risks of meat consumption include risks from zoonotic infections, antibiotic use, hormones fed to animals, and improper inspection and handling. If each slaughterhouse were required to inspect the meat it sells for contamination by E. coli and Salmonella, to keep permanent records of its inspections, to have the inspections independently audited by third parties, and to furnish the results of its inspections to middlemen and buyers and meat processors, and if processed meat products were required similarly to be inspected at each stage of processing and distribution, the cost of a transparent, traceable system of certification for the healthy quality of meat and meat products would increase. These costs would have to be passed to consumers. The increase in price would lower consumption and improve the safety and quality of the product.
Making the prices of meat to consumers and the costs of animal production to producers reflect the full costs can be expected to raise substantially the price of meat and to reduce both production and consumption. Unfortunately, the effects of internalizing these externalities might be largest on the poor, who are least able to afford the purchase of meat. The poor are most in need of increased food from animal sources or equivalently fortified foods. Thus, an economic and regulatory response is inadequate. Economics is not enough. Market prices take no
account of people’s hunger or of the stunted bodies and brains of underfed children. These are not tradable goods or services.
An additional cultural problem is that the allocation of animal protein or food aid among the members of poor families may be determined by power relations within the family more than by the long-term return on investment from allocating the highest-quality protein sources to those most in need of it: pregnant and lactating women and infants and young children.
Therefore, it is necessary to inform consumers, especially in rich countries, but also in wealthier segments of every national population, when their buying meat puts domestic animals in line for food ahead of other people’s children. In addition to informing consumers about the consequences of meat consumption, it is necessary directly to aid poor parents to feed well the children they have and to have the children they want and can feed well. I propose five targets for food security policy. These are the most vulnerable people:
1. The approximately 215 million women or couples with unmet need for contraception. 2. Pregnant women. 3. Lactating women and nursing children. 4. Weaned infants to 2 to 3 years of age. 5. Teenage girls and boys.
Food security policy needs to advocate and implement three programs: family planning information, services, and materials; nutrition education for individuals and their children, when they have children; and a balanced, adequate diet. Family planning information, services, and materials should focus on women and couples with unmet need for contraception, lactating women, and teenage boys and girls.
In some developing countries, the components of an adequate diet are available at affordable prices but poor people don‘t know how to combine the components to provide a good, healthy diet. For example, in Liberia, polished white rice, a nutritionally poor source of carbohydrates, is considered a food associated with high status. Beans, lentils, and other complementary sources of protein are available at affordable costs. But these foods are considered the foods of poor people. Education is required to help people understand that the combination of rice and beans gives nutritionally complete protein as well as energy.
Wherever lack of information and cultural practices prevent the use of available, affordable foods to compose a healthy diet, nutrition education for parents and their children is required. Nutrition education should focus on women and couples with unmet need for contraception, pregnant women, lactating women, and teenagers. When these individuals have children over age 3, their children should be included in the nutrition education.
To accelerate the transition to more productive, healthier societies, food aid is required. Pregnant women, lactating women and their nursing infants, and weaned infants to the

www.prb.org MALTHUS LECTURE MEAT 9
age of 3 or so need immediate access to animal-source foods or fortified equivalents. The challenge is to ensure that food aid intended for these subpopulations reaches the intended targets. In some situations, food aid provided with the intent of improving the nutrition of very young children is shared among all members of the household, regardless of nutritional need, leaving an inadequate share for the infant or child. Addressing the challenge of reaching the targets of pregnant and lactating women, and nursing and weaned infants will require operational research on effective program management as well as nutrition education.
An additional challenge is to ensure that the food given in programs of food aid is purchased in a way that supports rather than undercuts local farmers and agricultural institutions. Ensuring that food aid programs benefit local producers increases the political difficulty of finding funding for such programs in wealthy countries, where small farmers and agribusinesses have different economic incentives and extensive political influence.
FAO has stated: “To ensure a more effective and efficient global agriculture, food and nutrition system, the governance of world food security must:” provide science-based analysis, coordinate and strengthen international, regional, and national strategies for sustainable agriculture and food security, and promote investment in agriculture. These are all laudable goals. In addition, according to the report, food security governance must: “strengthen coherence among food security policies and related issues such as climate change, environmental sustainability and natural resource management.”29
While including climate change, environmental sustainability, and natural resource management in policy related to food security governance is a very positive step, l believe this vision of “related issues” is too narrow. Food security policy should also aim to internalize the externalities of meat production, processing, distribution, and consumption, and to protect the most vulnerable people, as just described.
Poverty leads people to have insufficient, incomplete, and unbalanced diets that often include too little protein, calories, and trace nutrients. This dietary inadequacy leads to thwarted mental and physical development of parents and their children. Too often, this stunted development perpetuates poverty in the present generation and the next.
The aim of effective food security policy should be to break this vicious cycle. This vision of what is required for effective food security policy follows from a larger vision of the interactions among population, economics, the environment, and culture. It is useful to envision these four spheres of human concerns as the vertices of a regular tetrahedron (see Figure 5). It is equally valid to put population, economics, the environment, or culture at the apex of the tetrahedron. Any one, two, or three of these views of the world is incomplete without the other or others. Population, economics, culture, and the environment all interact
strongly. To succeed, food security policy needs to keep these interactions in view.
AcknowledgmentsI thank Monty Yudelman and the officers of the Population Reference Bureau and International Food Policy Research Institute for supporting the Malthus Lecture, and the U.S. National Science Foundation for supporting research through grants DMS-0443803 and EF-1038337. Any opinions, findings, and conclusions or recommendations expressed in this material are those of the author and do not necessarily reflect the views of the National Science Foundation. I thank Priscilla K. Rogerson for assistance and the family of William T. Golden for hospitality during this work.
References1 W.F. Doolittle,”You Are What You Eat: A Gene Transfer Ratchet Could
Account for Bacterial Genes in Eukaryotic Nuclear Genomes,” Trends in Genetics 14, no. 8 (1998): 307-311.
2 Richard G. Klein, The Human Career: Human Biological and Cultural Origins, 2d ed. (Chicago: University of Chicago Press, 1999).
3 Kenneth F. Kiple and Kriemhild Conee Ornelas, eds., The Cambridge World History of Food (Cambridge, UK and New York: Cambridge University Press, 2000).
4 Food and Agriculture Organization (FAO), “Global Information and Early Warning System—Food and Agriculture (GIEWS)” (2009), accessed at www.fao.org/giews/english/fo/index.htm#2009, on Jan. 10, 2011.
5 S. Boyd Eaton, “Humans, Lipids, and Evolution,” Lipids 27, no. 10 (1992): 814-20.
6 Henning Steinfeld et al., Livestock’s Long Shadow: Environmental Issues and Options (Rome: FAO, 2006).
7 Steinfeld et aI., Livestock’s Long Shadow.
FIGURE 5
Population interacts with economics, the environment, and culture.
Source: Joel E. Cohen.
POPULATION
CULTURE
ECONOMY ENVIRONMENT

www.prb.org MALTHUS LECTURE MEAT10
8 FAO, Statistical Yearbook (2009), accessed at www.fao.org/economic/the-statistics-division-ess/publications-studies/statistical-yearbook/fao-statistical-yearbook-2009/en/, on Jan. 10, 2011.
9 J.R. McNeill, “Population and the Natural Environment: Trends and Challenges.” in The Political Economy of Global Population Change 1950-2050, ed. Paul Demeny and Geoffrey McNicoll (Population and Development Review, supplement to vol. 32, 2006).
10 Steinfeld et al., Livestock’s Long Shadow.
11 Christopher L. Delgado et al., “Determinants and Implications of the Growing Scale of Livestock Farms in Four Fast-Growing Developing Countries,” Research Monograph 157 (2008): 131, accessed at wvvw.ifpri.org/publication/determinants-and-implications-growing-scalelivestock-farms-four-fast-growingdeveloping.
12 A.K. Chapagain, A.Y. Hoekstra, and H.H.G. Savenije, “Saving Water Through Global Trade,” Value of Water Research Report Series, no. 17 (2005).
13 Steinfeld et al., Livestock’s Long Shadow.
14 Maurice E. Pitesky, Kimberly R. Stackhouse, and Frank M. Mitloehner, “Clearing the Air: Livestock’s Contribution to Climate Change,” in Advances in Agronomy, ed. Donald Sparks (Burlington, VT: Academic Press, 2009).
15 Pitesky, Stackhouse, and Mitloehner, “Cleaning the Air.”
16 Steinfeld et al., Livestock’s Long Shadow.
17 WHO, “Obesity and Overweight Factsheet” (2011), accessed at www.who.int/mediacentre/factsheets/fs311/en/index.html, on Jan. 10, 2011.
18 Christopher B. Barrett, “Measuring Food Insecurity,” Science 327, no. 5967 (2010): 825-28.
19 FAO, The State of Food Insecurity in the World: Economic Crises-Impacts and Lessons Learned (Rome: FAO, 2009).
20 FAO, Global Hunger Declining, but Still Unacceptably High: International Hunger Targets Difficult to Reach (Rome: FAO, 2010).
21 WHO, “WHO Child Growth Standards,” accessed at www.who.int/childgrowth/standards/en/, on Jan. 10, 2011.
22 Charlotte G. Neumann et al., “Meat Supplementation Improves Growth, Cognitive, and Behavioral Outcomes in Kenyan Children,” Journal of Nutrition 137, no. 4 (2007): 1119-23.
23 Marie T. Ruel et al., “Age-based Preventive Targeting of Food Assistance and Behaviour Change Communication for Reduction of Childhood Undernutrition in Haiti: A Cluster Randomized Trial,” The Lancet 371, no. 9612 (2008): 588-95.
24 AVERT, “The Origin of AIDS and HIV and the First Cases of AIDS,” accessed at www.avert.org/origin-aids-hiv.htm, on Jan. 10, 2011.
25 United States Geological Survey, “Genetics Provide Evidence for the Movement of Avian Influenza Viruses from Asia to North America via Migratory Birds,” Oct. 27, 2008, accessed at www.usgs.gov/newsroon1/article,asp?ID=2044.
26 World Health Organization, “Global Information and Early Warning System for Major Animal Diseases, Including Zoonoses (GIEWS)” (2009), accessed at www.who.int/zoonoses/outbreaks/GIEWS/en/print.html, on Jan. 26, 2010.
27 Dennis Normile, “Emerging Infectious Diseases: Scientists Puzzle Over Ebola-Reston Virus in Pigs,” Science 323, no. 5913 (2009): 451.
28 Shalini Mathur and Rameshwar Singh, “Antibiotic Resistance in Food Lactic Acid Bacteria—A Review,” Journal of International Food Microbiology 105, no. 3 (2005): 281-95.
29 FAO, The State of Food Insecurity in the World.