Firm Size and the Business Environment: Worldwide Survey ... · PDF fileFirm Size and the...
52
Firm Size and the Business Environment: Worldwide Survey Results Mirjam Schiffer Beatrice Weder The World Bank Washington, D.C. IFC INTERNATIONAL FINANCE CORPORATION DISCUSSION PAPER NUMBER 43
Transcript of Firm Size and the Business Environment: Worldwide Survey ... · PDF fileFirm Size and the...

Firm Size and the Business Environment: Worldwide Survey
Results
Mirjam Schiffer Beatrice Weder
The World Bank Washington, D.C.
IFC INTERNATIONAL FINANCE CORPORATION
DISCUSSION PAPER NUMBER 43
ii
Contents
Foreword.............................................................................................................................. iii
Abstract................................................................................................................................iv
Acknowledgments..................................................................................................................v
Chapter 1. Introduction........................................................................................................ 1
Chapter 2. Firm Characteristics and Obstacle Levels............................................................. 4
Theoretical Arguments on Firm Size and the Business Environment ............................. 4 Further Firm Characteristics that Could Influence Obstacle Levels .............................. 9
Chapter 3. Data on Firm Characteristics and Obstacle Levels.............................................. 11
The Survey.............................................................................................................. 11 Descriptive Statistics on the Level of Obstacles........................................................ 13
Chapter 4. Model Specification.......................................................................................... 20
Chapter 5. Estimation Results ............................................................................................. 22
Basic Regression: Results for Different Firm Sizes..................................................... 22 Analysis by World and Regions ................................................................... 22 Analysis by Regions..................................................................................... 27 Analysis by Country.................................................................................... 29
Extended Regression: Sensitivity Analysis................................................................ 31
Chapter 6. Policy Conclusions and Further Considerations .................................................. 34
References.......................................................................................................................... 36
Appendix A Region List ..................................................................................................... 37
Appendix B Ranking of Obstacles in Different Firm Size Samples........................................ 38
Appendix C Obstacle Levels in Different Regions................................................................ 39
Appendix D Country Regressions ....................................................................................... 43
Appendix E Comparison with the Extended Regression....................................................... 47
iii
Foreword
It is widely recognized by now that the pace of economic and social development is greatly influenced by the quality of government institutions (the "rules of the game") and organizations (for example, the quality of transport infrastructure). In particular, enterprises can help to improve living standards and to reduce poverty most effectively where good government institutions and organizations exist. This discussion paper draws on a world-wide survey of some 10,000 executives carried out in 1999/2000. The paper focuses particularly on small and medium-sized enterprises (SMEs). Governments and development assistance agencies give high priority to that sector because of the high proportion of persons who are employed in small and medium-sized firms. This paper is the first attempt based on empirical evidence to analyze the quality of interactions between firms of different sizes and governments on a worldwide scale. The main focus is to analyze whether there are significant differences among small, medium and large enterprise in terms of perceived obstacles to doing business. The authors find that smaller firms indeed face more obstacles to doing business than do the larger firms. The paper should also provide useful policy guidance, notably in listing in order of severity the obstacles perceived by executives of small firms in each of the countries surveyed.
Guy Pfeffermann Director, Economics Department
& Economic Adviser of the Corporation
iv
Abstract
The development of the small and medium enterprise sector is believed to be crucial for economic growth and poverty alleviation. Those who seek to develop the sector must consent with the general perception that small- and medium-scale enterprises are at a disadvantage compared with larger firms. In theory, however, smaller firms may also have advantages over larger firms. For instance, they may be less affected by excessive regulations because they can more easily slip into informal arrangements. This paper draws on a new private sector survey covering 80 countries and one territory to study the question whether business obstacles are related to firm size. The main finding is that there is indeed a bias against small firms. Overall (that is, for the world sample) small firms report more problems than medium-sized firms, which in turn report more problems than large firms. In particular, smaller firms face significantly more problems than larger firms with financing, taxes and regulations, inflation, corruption and street crime. Thus these impediments should be prime targets for policies directed at leveling the playing field. Some of the most severe perceived impediments to doing business affect firms of all sizes, and consequently call for across-the-board policy improvements. In addition to the world wide analysis, the paper presents an analysis by regions and by individual countries.
v
Acknowledgments
This paper benefited from recent work supported by the University of Mainz and the University of Basel. We thank Guy Pfeffermann and Andrew Stone for helpful comments and Geeta Batra and Mariuz Sumlinski for help with the data. Financial support from IFC is gratefully acknowledged. The opinions presented are those of the authors and do not reflect official policy of the World Bank Group.
1
Chapter 1. Introduction
Over the past decade, the international community has channeled an increasing amount of resources into the development of small- and medium-scale enterprises (SMEs). Evidence of this interest is apparent in a quick search on the internet: the keywords “Small and Medium Enterprise Development” yielded a total of 355,000 hits (in 1.12 seconds). The strategy of promoting small-and medium-scale enterprises rests on the recognition that these enterprises constitute the largest part of the private sector in developing countries, in terms of employment. Thus development of small- and medium-scale enterprises is thought to be important for economic growth, poverty alleviation, and the promotion of more pluralist societies.1 Some analysts, however, such as Hallberg (2000), argue that many of the assumed economic benefits of small firms may be “myth rather than reality.” For instance, small firms are not necessarily more labor-intensive than large ones. Moreover, the link between growth, poverty reduction and the promotion of small firms might not be so tight.
Nevertheless, intervention on behalf of these enterprises may be justified if market forces or institutional failures bias the size-distribution of firms and put small and medium firms at a disadvantage compared with large firms. For instance, economies of scale and entry cost are market forces that favor large firms. Moreover, large entrepreneurs usually wield more political influence; thus government rules and regulations may also be biased in favor of large firms. For this reason, one of the cornerstones of the World Bank strategy for promoting small- and medium-scale enterprises is to “level the playing field;” that is, to create a business environment that gives equal opportunities to entrepreneurs of all sizes.2
There are reasons both to believe that firm size is positively and that it is negatively related to the severity of obstacles. Arguments that show that small firms suffer more than large firms are more familiar than arguments in the other direction, and they might also be more obvious. Still, there are also reasons why small firms could be better off than large ones. For example, small firms may be less affected by regulations because they can more easily slip into informal arrangements—for instance, escaping the notice of corrupt tax assessors, who might focus on larger firms that promise higher returns.
The aim of this paper is to provide empirical evidence on whether small or large firms face more problems with market and government-made obstacles, and for which set of obstacles the firm size bias is most severe. Specifically, this analysis addresses the following questions:
1 Website on small and medium-scale enterprise at www.worldbank.org/html/fpd/privatesector/sme.htm 2 Recent empirical literature has suggested that a "level playing field" is one of the crucial preconditions for rapid
private sector development. For instance, work by Knack and Keefer (1995) has shown that the existence of a meaningful rule of law is among the most robust determinants of economic growth in a large cross-section of countries. A number of other recent studies find significant effects of institutional quality on economic growth. See, for example, Mauro (1995), Barro (1991), Alesina et al. (1996), and Brunetti, Kisunko, and Weder (1998a). Johnson, Kaufmann, and Zoido-Lobaton (1998) have presented empirical evidence showing that countries with a high level of corruption and weak institutions tend to have large informal sectors.
2
1. Does firm size matter? Overall, is there a systematic relationship between the size of a firm and
the severity of obstacles encountered?
2. In case there is a systematic relationship, what does it look like? Is there a decreasing or an increasing function between firm size and obstacle? Or is the relationship hump- or U-shaped, indicating that forces both in favor and against small firms are important?
3. Are there differences between obstacles? If biases exist according to firm size, are they different depending on the nature of the market or government-induced obstacle? In policy and operational terms, on which obstacles should policy-makers focus SME support?
4. Are there differences between regions and countries? Do all countries exhibit the same pattern of biases or do regional patterns exist?
Our findings can be summarized as follows:
1. Firm size matters. In our worldwide estimates, we find that smaller firms generally report
significantly more problems than larger firms.
2. In most cases, the relationship between size and obstacles is decreasing: that is, smaller firms face more obstacles than medium-sized firms, and these in turn face more obstacles than large firms.
3. The results for worldwide regressions reveal the following. There are differences among obstacles:
• Smaller firms have more problems than larger firms with financing, taxes and regulations, inflation, corruption, street crime and anti-competitive practices. For these obstacles, small firms have the biggest problems, followed by medium-sized and large firms.
• Organized crime and the exchange rate appear to affect small firms more than medium-sized and large firms. The latter two do not differ significantly from each other.
• There are no significant differences in how much infrastructure, policy instability and the judiciary affect firms of different sizes. That is, for these obstacles, firms of all sizes are equally affected.
4. The findings for the separate regions and countries back up the results for the world sample: small firms suffer more than medium-sized and large firms. This pattern is most pronounced in Latin America and the Caribbean and transition economies. In Asia, small firms suffer most, but medium-sized and large firms do not differ from each other. In Africa, small firms tend to suffer more than medium-sized firms, which again suffer more than large firms. Overall, it is more difficult to find differences in the risk perception of firms of different sizes in the regional regressions than in the world sample. In particular, the OECD shows only weak differences between firm size and obstacles. For this region, the variance of the obstacles are often very small, indicating that the majority of firms experience the same low level of obstacle.
3
5. The country regressions also reveal the pattern that small firms suffer most, but the results are less strong than the ones from the worldwide and regional samples.
To test our findings, we performed a series of sensitivity tests and found that the results are
robust to changes in the specification. In addition to country dummies that capture differences in the level of obstacles, we also included further firm characteristics. For instance, large firms might be better off simply because they are older and have better connections in the political area. Similarly, large firms might be more likely to come under government participation in ownership and therefore have fewer problems with bureaucracy. To control for such possibilities, we added firm age, government participation in ownership and foreign ownership as explanatory variables to the basic regression. We found that the basic results continue to hold.
The empirical exercise conducted in this paper has been possible thanks only to the availability
of a new data set compiled by the World Bank. It contains private sector surveys of 80 countries and one territory and over 10,000 firms.3 The aim of the survey is to characterize the business environment and uncover obstacles for business development. One advantage of this data set is that there is detailed firm-level information and enough observations to allow regional and even country-by-country analysis. In a previous, similar data set that was also collected by the World Bank, this detailed analysis was not possible because of an insufficient number of observations.4
The paper is organized as follows. Chapter 2 presents theoretical arguments on why firm size could affect the sensitivity to risks. Several hypothesis are suggested that show possible patterns of the relationship between firm size and obstacle levels. Chapter 3 describes the data used in this study, especially data on firm characteristics and the business environment. Chapter 4 introduces the estimation method and the two model specifications: a basic and an extended version of the model. The latter tests whether the results of the basic models are robust. Chapter 5 discusses the estimation results for a worldwide sample as well as for regional and country samples. Finally, chapter 6 draws policy implications. All the figures and tables draw on the survey.
3 The countries are from Africa, Asia, Latin America and the Caribbean, the transition economies, and the OECD.
There is also data on Turkey and the territory of West Bank and Gaza (appendix A). 4 Nevertheless an analysis that pooled all developing countries suggested that there is significant bias against small
firms (Brunetti, Kisunko, and Weder 1999).
4
Chapter 2. Firm Characteristics and Obstacle Levels
Theoretical Arguments on Firm Size and the Business Environment
The basis for any program to develop and foster small- and medium-sized companies is the assumption that these firms have more problems than larger ones. However, in theory, small firms do not necessarily have to be worse off than medium and large firms. Chapter 2 presents arguments both on why smaller firms might be worse and why they might be better off than large firms. Depending on the strength of the influence of these forces, different patterns of the relationship between firm size and obstacle levels can be imagined. These patterns are explored later in this chapter.
Several arguments have been advanced as to why smaller firms might have more problems than larger firms:
Economies of Scale and Entry Costs. Business obstacles may be particularly severe for small firms because they represent fixed costs that a large firm can absorb more easily. It is useful to distinguish between the source of the obstacle: whether it is market- or government-induced. An example of a market-based obstacle for small firms could be financing, since there are fixed costs associated with loan review. Government-induced obstacles could include bureaucratic discretion, since small firms may be unable to bribe their way through bureaucracy. In a famous experiment, De Soto (1987) explored the enormous obstacles in terms of red tape that small entrepreneurs faced when trying to obtain a business license. That study revealed huge entry costs for small entrepreneurs who lacked access to higher levels of the administration and who could not bribe their way through the system.
Political Influence. Large firms may have more possibilities of collusion, with other firms as well as with the public sector. Olson (1965) showed that groups consisting of many members are difficult to form if there is a free-rider problem.5 This means that larger firms might be more successful in influencing politics and obtaining new rules in their favor, and thus gaining advantage over smaller firms. Large firms might also craft special deals with government exactly because of their power and their importance in the economy. For example, in a recession, they might threaten to lay off workers if they do not get tax reductions.
Conversely, there are several good arguments as to why larger firms may have more problems than smaller firms:
Informality. Small firms can more easily slip into informal arrangements, thereby avoiding taxes and regulations. Johnson, Kaufmann and Zoido-Lobaton (1998) have presented empirical
5 There are costs to organizing a pressure group, but the benefits of political organization may accrue also to those
that did not share the cost: they are “free riders.”
5
evidence showing that a high level of corruption and weak institutions increases the size of the informal sector.
Exposure. Large firms may be more exposed to corruption since they usually have higher profits than small firms, they are more visible, and they may be more interesting targets for blackmailing and kickbacks.
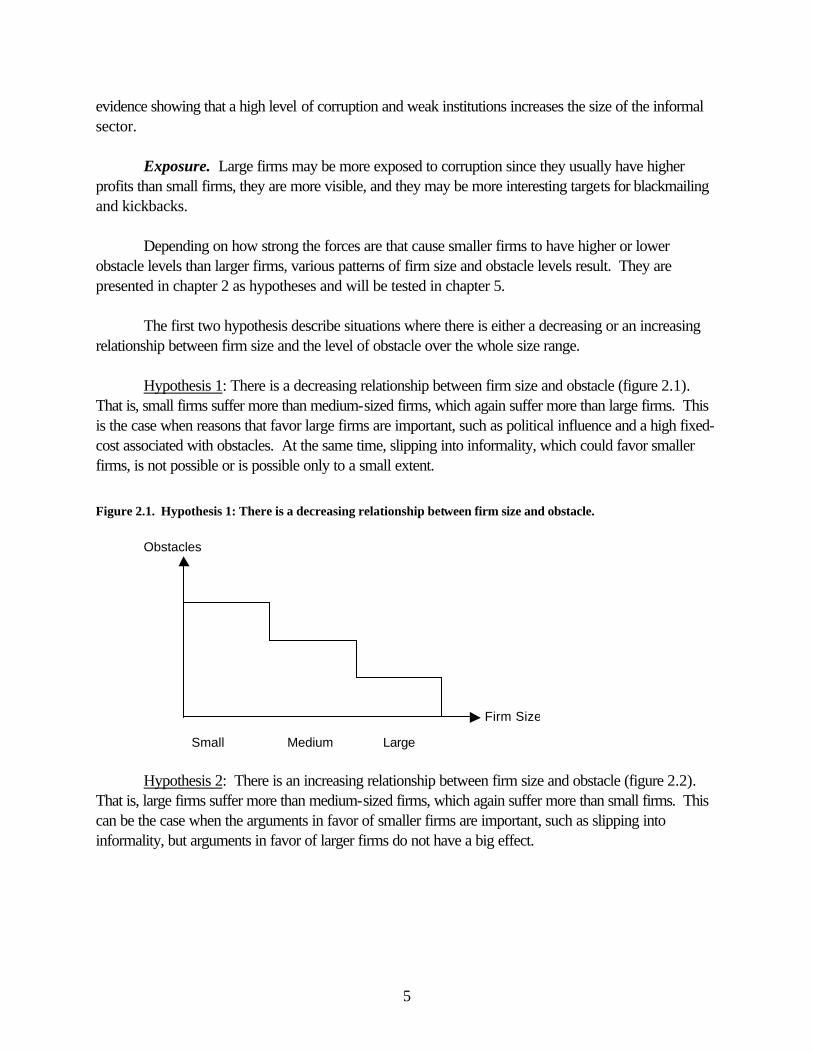
Depending on how strong the forces are that cause smaller firms to have higher or lower obstacle levels than larger firms, various patterns of firm size and obstacle levels result. They are presented in chapter 2 as hypotheses and will be tested in chapter 5.
The first two hypothesis describe situations where there is either a decreasing or an increasing relationship between firm size and the level of obstacle over the whole size range.
Hypothesis 1: There is a decreasing relationship between firm size and obstacle (figure 2.1). That is, small firms suffer more than medium-sized firms, which again suffer more than large firms. This is the case when reasons that favor large firms are important, such as political influence and a high fixed-cost associated with obstacles. At the same time, slipping into informality, which could favor smaller firms, is not possible or is possible only to a small extent.
Figure 2.1. Hypothesis 1: There is a decreasing relationship between firm size and obstacle. Obstacles Small Medium Large
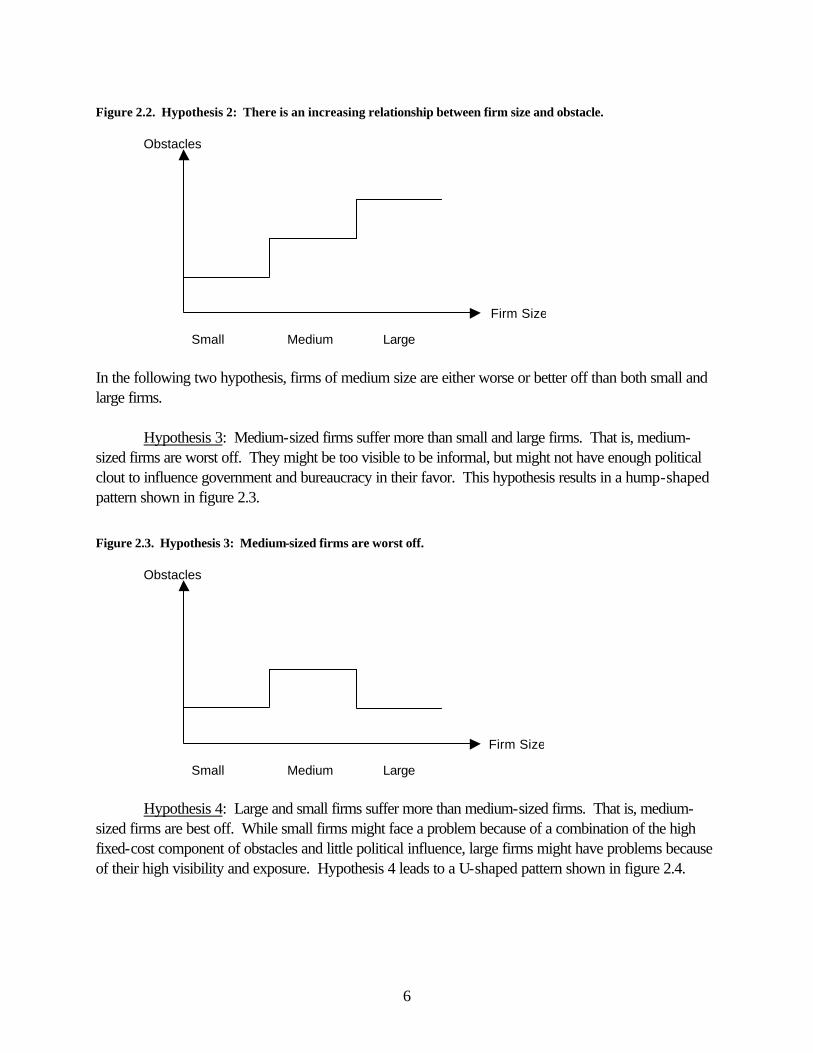
Hypothesis 2: There is an increasing relationship between firm size and obstacle (figure 2.2). That is, large firms suffer more than medium-sized firms, which again suffer more than small firms. This can be the case when the arguments in favor of smaller firms are important, such as slipping into informality, but arguments in favor of larger firms do not have a big effect.
Firm Size
6
Figure 2.2. Hypothesis 2: There is an increasing relationship between firm size and obstacle. Obstacles Small Medium Large In the following two hypothesis, firms of medium size are either worse or better off than both small and large firms.
Hypothesis 3: Medium-sized firms suffer more than small and large firms. That is, medium-sized firms are worst off. They might be too visible to be informal, but might not have enough political clout to influence government and bureaucracy in their favor. This hypothesis results in a hump-shaped pattern shown in figure 2.3.
Figure 2.3. Hypothesis 3: Medium-sized firms are worst off. Obstacles Small Medium Large
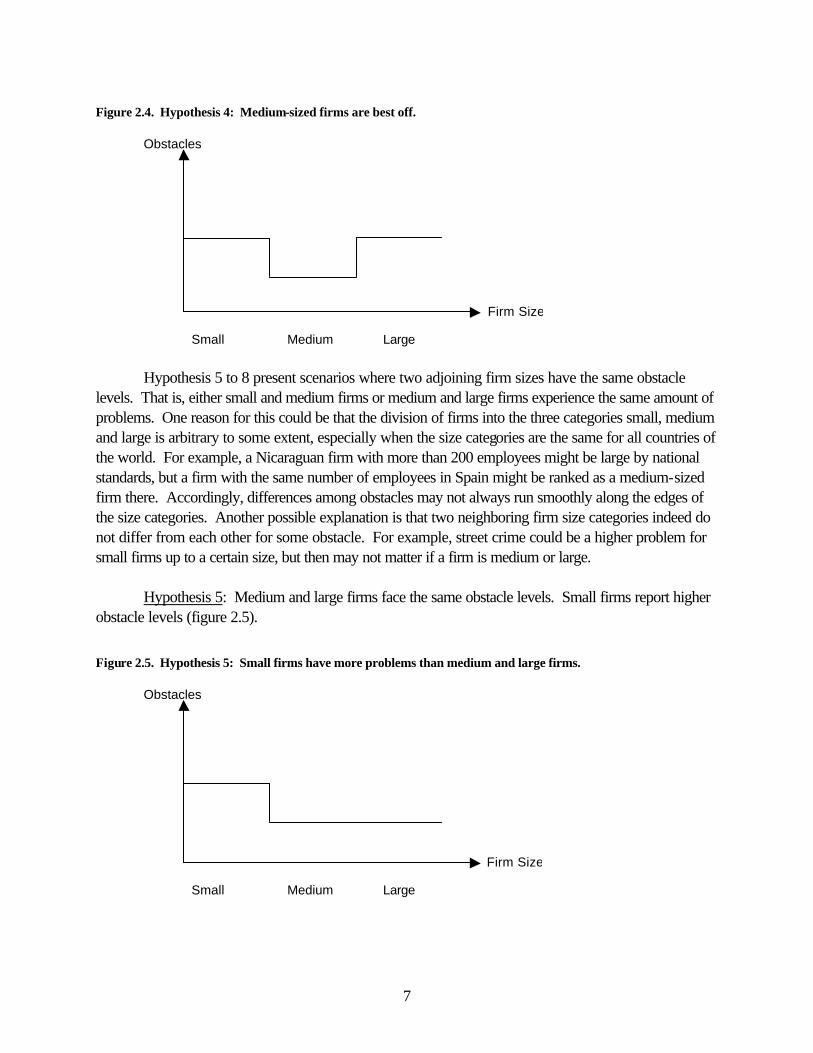
Hypothesis 4: Large and small firms suffer more than medium-sized firms. That is, medium-sized firms are best off. While small firms might face a problem because of a combination of the high fixed-cost component of obstacles and little political influence, large firms might have problems because of their high visibility and exposure. Hypothesis 4 leads to a U-shaped pattern shown in figure 2.4.
Firm Size
Firm Size
7
Figure 2.4. Hypothesis 4: Medium-sized firms are best off. Obstacles Small Medium Large
Hypothesis 5 to 8 present scenarios where two adjoining firm sizes have the same obstacle levels. That is, either small and medium firms or medium and large firms experience the same amount of problems. One reason for this could be that the division of firms into the three categories small, medium and large is arbitrary to some extent, especially when the size categories are the same for all countries of the world. For example, a Nicaraguan firm with more than 200 employees might be large by national standards, but a firm with the same number of employees in Spain might be ranked as a medium-sized firm there. Accordingly, differences among obstacles may not always run smoothly along the edges of the size categories. Another possible explanation is that two neighboring firm size categories indeed do not differ from each other for some obstacle. For example, street crime could be a higher problem for small firms up to a certain size, but then may not matter if a firm is medium or large.
Hypothesis 5: Medium and large firms face the same obstacle levels. Small firms report higher obstacle levels (figure 2.5).
Figure 2.5. Hypothesis 5: Small firms have more problems than medium and large firms. Obstacles Small Medium Large
Firm Size
Firm Size
8
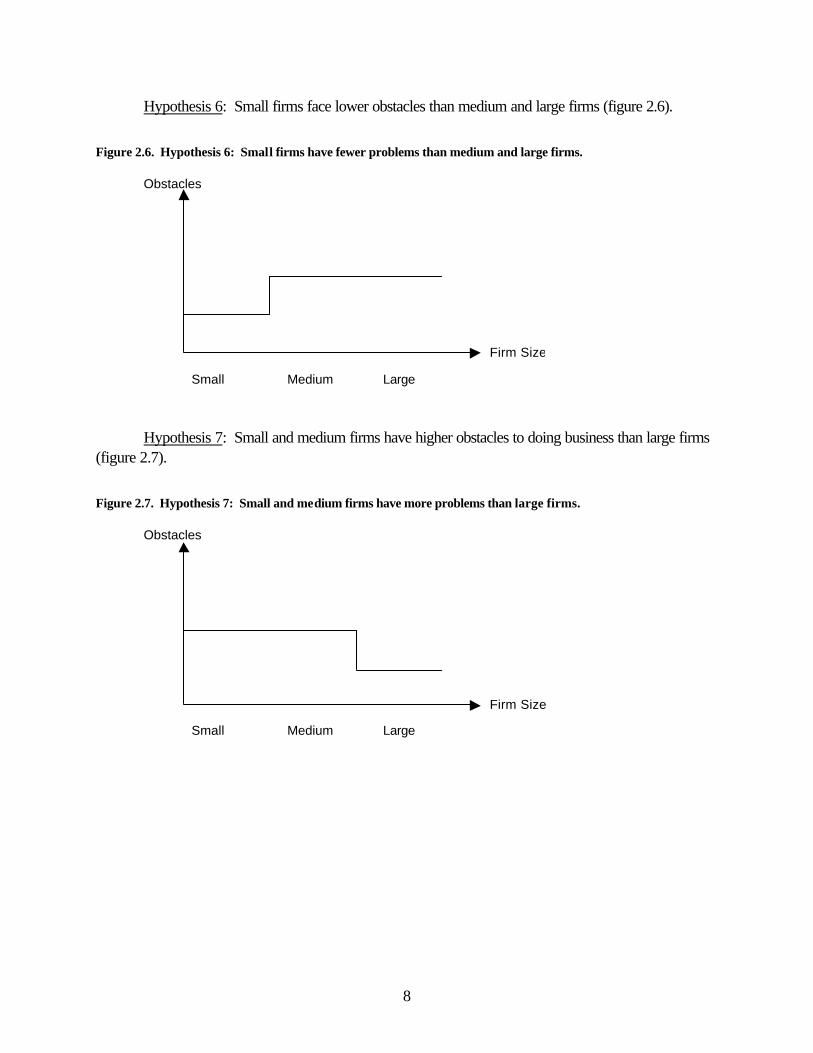
Hypothesis 6: Small firms face lower obstacles than medium and large firms (figure 2.6).
Figure 2.6. Hypothesis 6: Small firms have fewer problems than medium and large firms. Obstacles Small Medium Large
Hypothesis 7: Small and medium firms have higher obstacles to doing business than large firms
(figure 2.7).
Figure 2.7. Hypothesis 7: Small and medium firms have more problems than large firms. Obstacles Small Medium Large
Firm Size
Firm Size
9
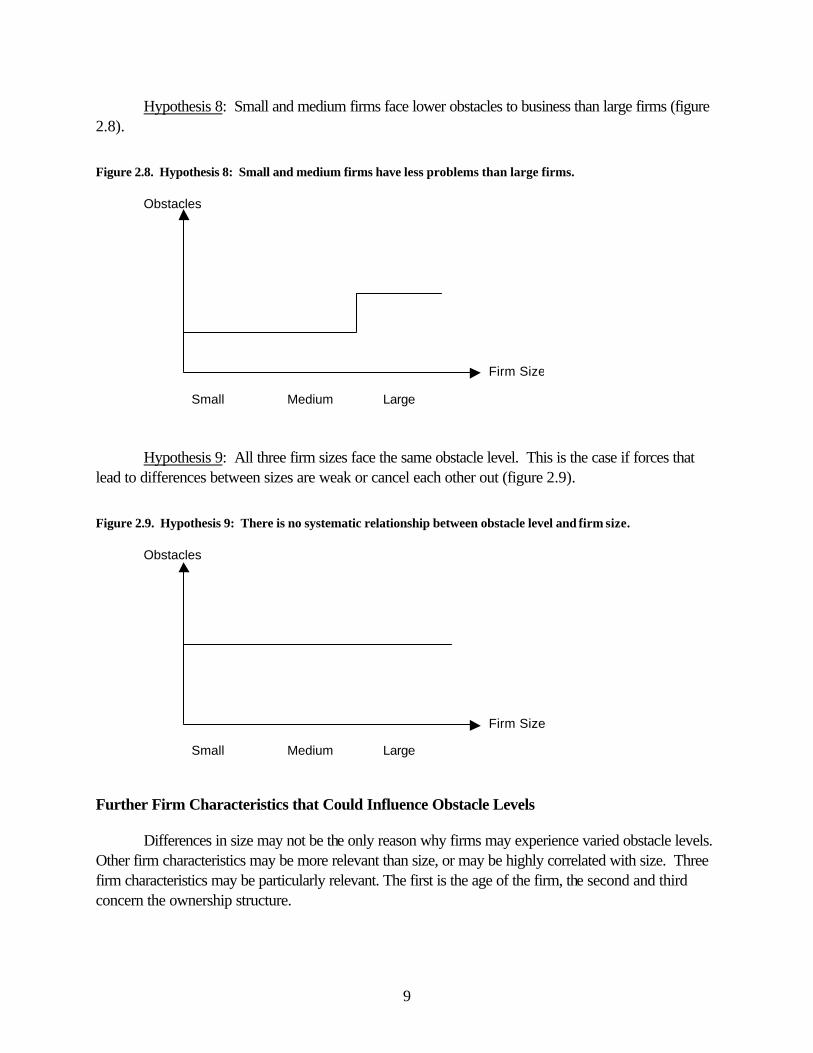
Hypothesis 8: Small and medium firms face lower obstacles to business than large firms (figure 2.8).
Figure 2.8. Hypothesis 8: Small and medium firms have less problems than large firms. Obstacles Small Medium Large
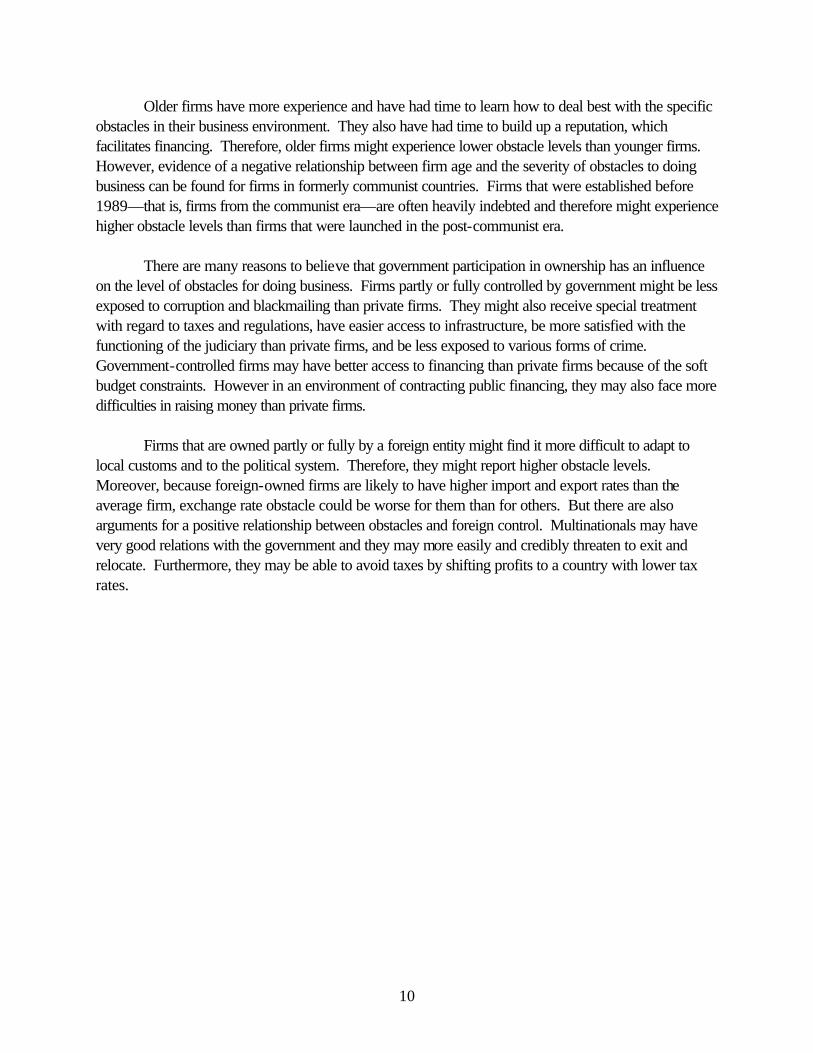
Hypothesis 9: All three firm sizes face the same obstacle level. This is the case if forces that
lead to differences between sizes are weak or cancel each other out (figure 2.9).
Figure 2.9. Hypothesis 9: There is no systematic relationship between obstacle level and firm size. Obstacles Small Medium Large
Further Firm Characteristics that Could Influence Obstacle Levels
Differences in size may not be the only reason why firms may experience varied obstacle levels. Other firm characteristics may be more relevant than size, or may be highly correlated with size. Three firm characteristics may be particularly relevant. The first is the age of the firm, the second and third concern the ownership structure.
Firm Size
Firm Size
10
Older firms have more experience and have had time to learn how to deal best with the specific obstacles in their business environment. They also have had time to build up a reputation, which facilitates financing. Therefore, older firms might experience lower obstacle levels than younger firms. However, evidence of a negative relationship between firm age and the severity of obstacles to doing business can be found for firms in formerly communist countries. Firms that were established before 1989—that is, firms from the communist era—are often heavily indebted and therefore might experience higher obstacle levels than firms that were launched in the post-communist era.
There are many reasons to believe that government participation in ownership has an influence on the level of obstacles for doing business. Firms partly or fully controlled by government might be less exposed to corruption and blackmailing than private firms. They might also receive special treatment with regard to taxes and regulations, have easier access to infrastructure, be more satisfied with the functioning of the judiciary than private firms, and be less exposed to various forms of crime. Government-controlled firms may have better access to financing than private firms because of the soft budget constraints. However in an environment of contracting public financing, they may also face more difficulties in raising money than private firms.
Firms that are owned partly or fully by a foreign entity might find it more difficult to adapt to local customs and to the political system. Therefore, they might report higher obstacle levels. Moreover, because foreign-owned firms are likely to have higher import and export rates than the average firm, exchange rate obstacle could be worse for them than for others. But there are also arguments for a positive relationship between obstacles and foreign control. Multinationals may have very good relations with the government and they may more easily and credibly threaten to exit and relocate. Furthermore, they may be able to avoid taxes by shifting profits to a country with lower tax rates.
11
Chapter 3. Data on Firm Characteristics and Obstacle Levels
The Survey
This study draws on a new worldwide survey of the business environment, which was conducted by the World Bank. It contains observations on 10,090 firms from 80 countries and the territory West Bank and Gaza. The questionnaire has two parts. The first consists of 15 questions on firm characteristics, such as the firm’s main sector of activity and its size.6 The second asks questions on potential risks and obstacles for doing business, notably the quality and integrity of public services, rules and regulations, the legal system, predictability of policies, rules and regulations, the availability and quality of financial sector services and the nature of corporate governance.
The fourth question of the first part of the questionnaire asks about the firm size. Four categories are specified:
• Fewer than 5 full-time employees,
• 5-50 employees (small firm),
• 51-500 employees (medium-sized firm), and
• More than 500 employees (large firm).
For firms reporting fewer than five employees, the interview was terminated immediately. Only firms with at least five full-time employees have been included in the dataset. About 40 percent are small firms, another 40 percent are medium firms, and about 20 percent are large firms. The exact figures can be seen in table 3.1.
Further firm characteristics we use to investigate the relationship between firm size and obstacle levels are:
• The age of the firm (question 7 of the questionnaire),
• Whether any government agency or state body has a financial stake in the ownership of the firm (question 8),7 and
• Whether any foreign company or individual has a financial stake in the ownership of the firm (question 9).8
6 The so-called screener portion of the survey. 7 In other words, the government could be a minority or majority shareholder. This will be referred to from now on as
“government participation in ownership.” 8 Another variable we examined is the location of firm management—whether in the capital city, a large city, or a small
city/country side. Nearly all firms interviewed (95 percent) were located in the capital.
12
The age of the firm varies between 1 and 600 years. The median for the whole sample is 10 years; the mean is 19.75 years, as shown in table 3.1. With regard to ownership, 12.37 percent of the firms have at least some government ownership; 18.74 percent of the firms reported foreign ownership. Table 3.1. Composition of the Sample by Firm Size and Ownership
All Firms
Age
Government Ownership
Foreign Ownership
[%] Mean [years]
Median [years]
Yes [%]
No [%]
Yes [%]
No [%]
All Firms 100.00 19.75 10 12.37 87.63 18.74 81.26 Small 40.44 12.00 7 2.70 97.30 9.32 90.68 Medium 40.17 21.49 12 18.52 81.48 20.63 79.37 Large 19.39 35.11 27 20.29 79.71 35.67 64.33 Note: The samples for age, government ownership and foreign ownership vary slightly. Particularly, firm age is based on the world without the African sample.
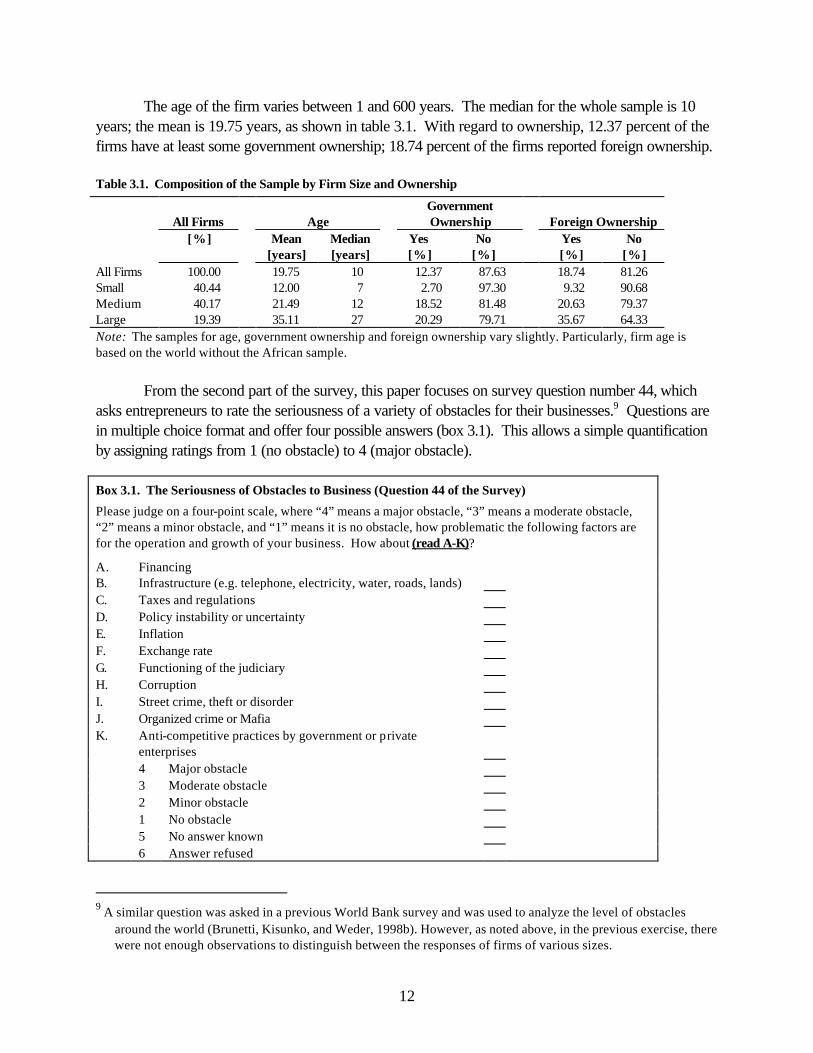
From the second part of the survey, this paper focuses on survey question number 44, which asks entrepreneurs to rate the seriousness of a variety of obstacles for their businesses.9 Questions are in multiple choice format and offer four possible answers (box 3.1). This allows a simple quantification by assigning ratings from 1 (no obstacle) to 4 (major obstacle).
Box 3.1. The Seriousness of Obstacles to Business (Question 44 of the Survey)
Please judge on a four-point scale, where “4” means a major obstacle, “3” means a moderate obstacle, “2” means a minor obstacle, and “1” means it is no obstacle, how problematic the following factors are for the operation and growth of your business. How about (read A-K)?
A. Financing B. Infrastructure (e.g. telephone, electricity, water, roads, lands) C. Taxes and regulations D. Policy instability or uncertainty E. Inflation F. Exchange rate G. Functioning of the judiciary H. Corruption I. Street crime, theft or disorder J. Organized crime or Mafia K. Anti-competitive practices by government or private
enterprises
4 Major obstacle 3 Moderate obstacle 2 Minor obstacle 1 No obstacle 5 No answer known 6 Answer refused
9 A similar question was asked in a previous World Bank survey and was used to analyze the level of obstacles
around the world (Brunetti, Kisunko, and Weder, 1998b). However, as noted above, in the previous exercise, there were not enough observations to distinguish between the responses of firms of various sizes.
13
Descriptive Statistics on the Level of Obstacles
This section aims to give an overview of the average level of obstacles for all firms in the sample, and also for firms of different sizes, regions and countries (without testing for the significance of differences between obstacles and firm sizes). It focuses first on the world sample and then moves on to the regional as well as the country samples.10
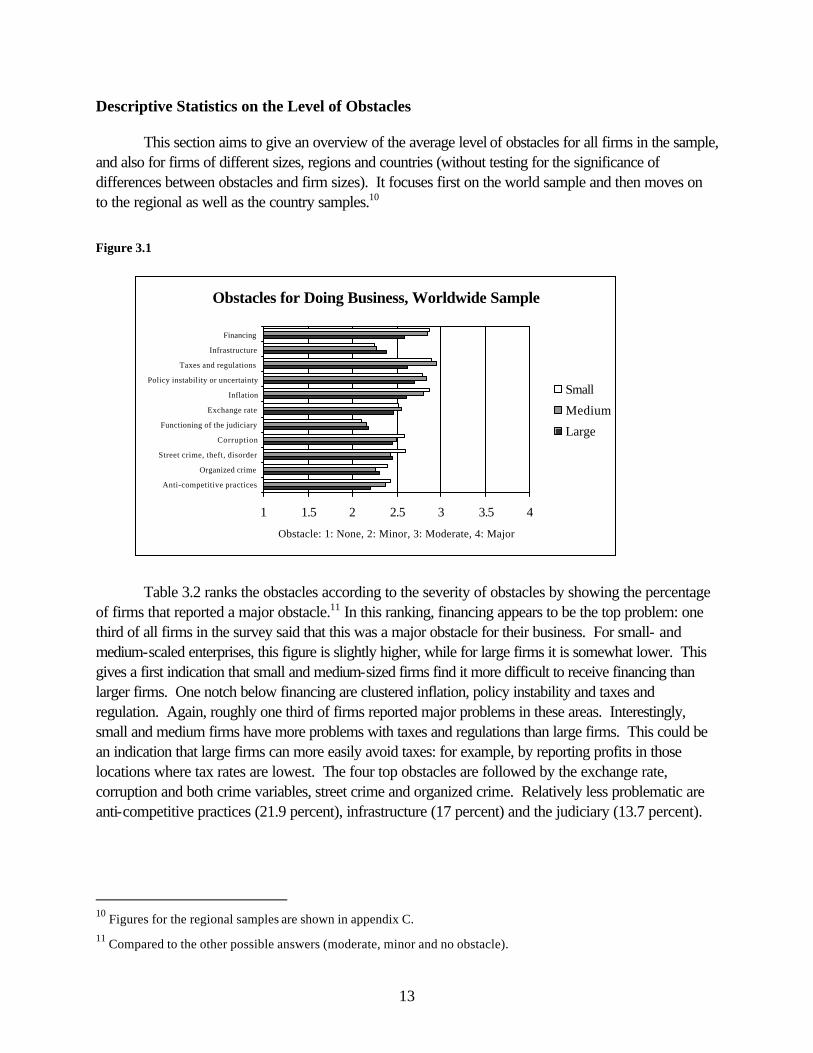
Figure 3.1
Table 3.2 ranks the obstacles according to the severity of obstacles by showing the percentage of firms that reported a major obstacle.11 In this ranking, financing appears to be the top problem: one third of all firms in the survey said that this was a major obstacle for their business. For small- and medium-scaled enterprises, this figure is slightly higher, while for large firms it is somewhat lower. This gives a first indication that small and medium-sized firms find it more difficult to receive financing than larger firms. One notch below financing are clustered inflation, policy instability and taxes and regulation. Again, roughly one third of firms reported major problems in these areas. Interestingly, small and medium firms have more problems with taxes and regulations than large firms. This could be an indication that large firms can more easily avoid taxes: for example, by reporting profits in those locations where tax rates are lowest. The four top obstacles are followed by the exchange rate, corruption and both crime variables, street crime and organized crime. Relatively less problematic are anti-competitive practices (21.9 percent), infrastructure (17 percent) and the judiciary (13.7 percent).
10 Figures for the regional samples are shown in appendix C. 11 Compared to the other possible answers (moderate, minor and no obstacle).
Obstacles for Doing Business, Worldwide Sample
1 1.5 2 2.5 3 3.5 4
Financing
Infrastructure
Taxes and regulations
Policy instability or uncertainty
Inflation
Exchange rate
Functioning of the judiciary
Corruption
Street crime, theft, disorder
Organized crime
Anti-competitive practices
Obstacle: 1: None, 2: Minor, 3: Moderate, 4: Major
Small
Medium
Large
14
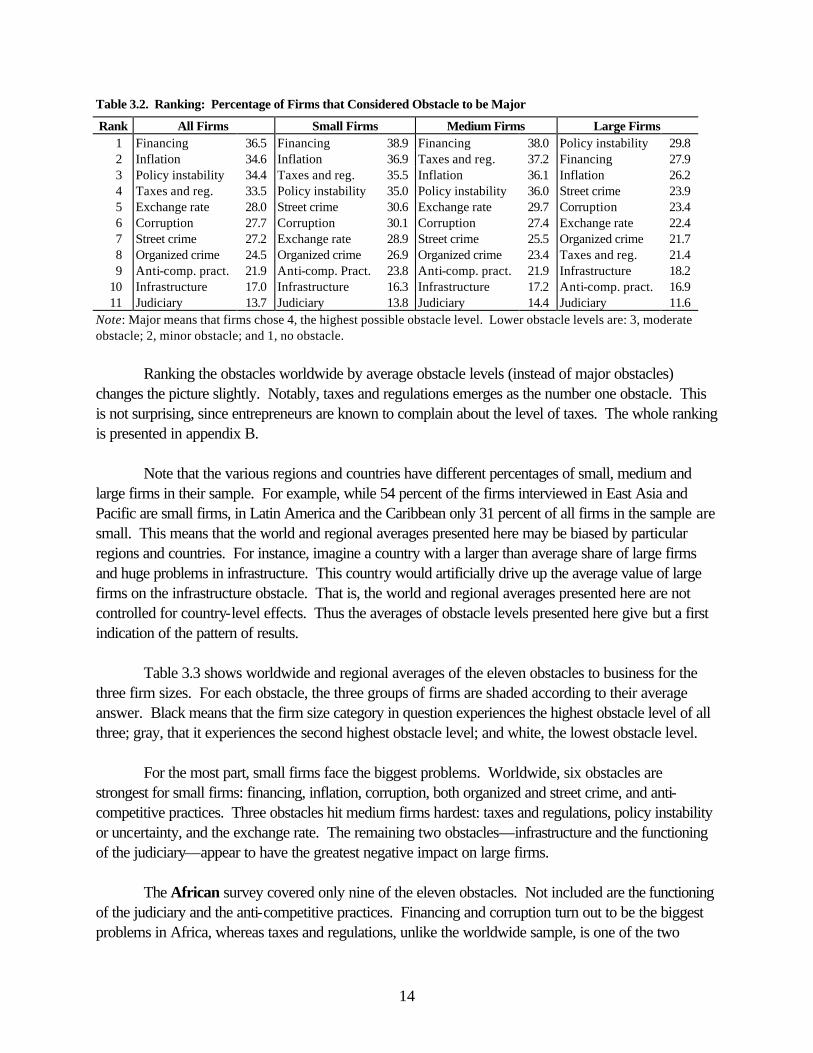
Table 3.2. Ranking: Percentage of Firms that Considered Obstacle to be Major
Rank All Firms Small Firms Medium Firms Large Firms 1 Financing 36.5 Financing 38.9 Financing 38.0 Policy instability 29.8 2 Inflation 34.6 Inflation 36.9 Taxes and reg. 37.2 Financing 27.9 3 Policy instability 34.4 Taxes and reg. 35.5 Inflation 36.1 Inflation 26.2 4 Taxes and reg. 33.5 Policy instability 35.0 Policy instability 36.0 Street crime 23.9 5 Exchange rate 28.0 Street crime 30.6 Exchange rate 29.7 Corruption 23.4 6 Corruption 27.7 Corruption 30.1 Corruption 27.4 Exchange rate 22.4 7 Street crime 27.2 Exchange rate 28.9 Street crime 25.5 Organized crime 21.7 8 Organized crime 24.5 Organized crime 26.9 Organized crime 23.4 Taxes and reg. 21.4 9 Anti-comp. pract. 21.9 Anti-comp. Pract. 23.8 Anti-comp. pract. 21.9 Infrastructure 18.2
10 Infrastructure 17.0 Infrastructure 16.3 Infrastructure 17.2 Anti-comp. pract. 16.9 11 Judiciary 13.7 Judiciary 13.8 Judiciary 14.4 Judiciary 11.6
Note: Major means that firms chose 4, the highest possible obstacle level. Lower obstacle levels are: 3, moderate obstacle; 2, minor obstacle; and 1, no obstacle.
Ranking the obstacles worldwide by average obstacle levels (instead of major obstacles) changes the picture slightly. Notably, taxes and regulations emerges as the number one obstacle. This is not surprising, since entrepreneurs are known to complain about the level of taxes. The whole ranking is presented in appendix B.
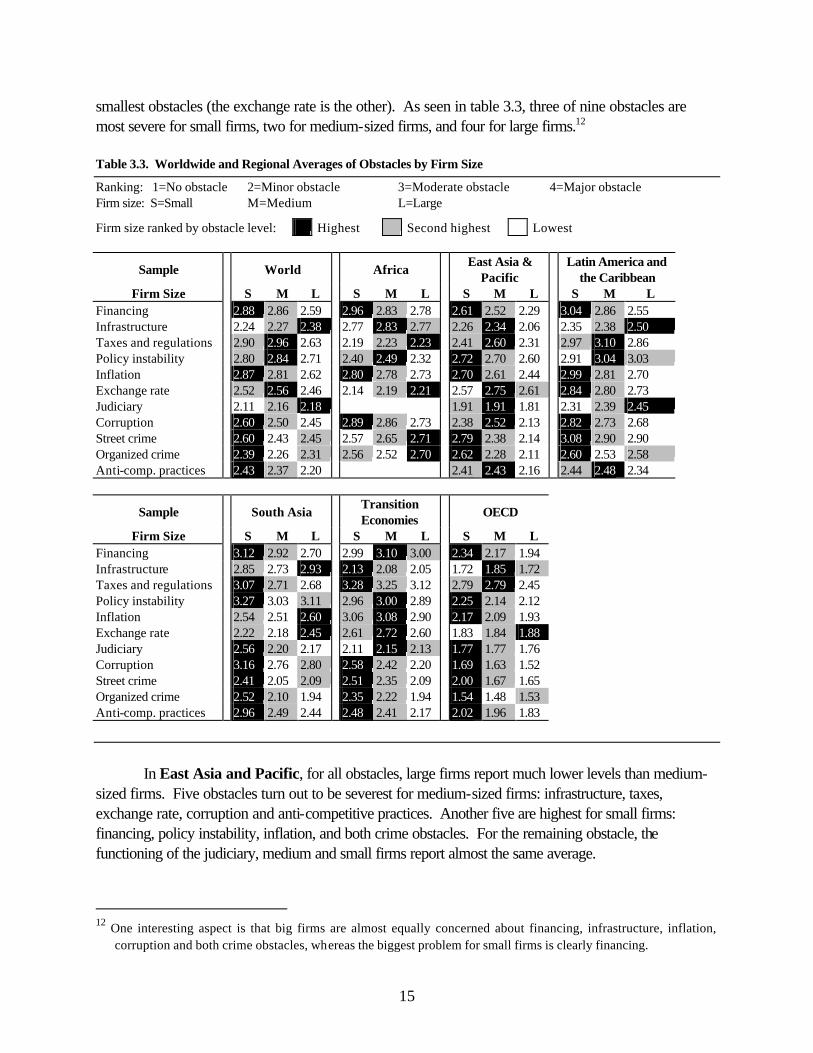
Note that the various regions and countries have different percentages of small, medium and large firms in their sample. For example, while 54 percent of the firms interviewed in East Asia and Pacific are small firms, in Latin America and the Caribbean only 31 percent of all firms in the sample are small. This means that the world and regional averages presented here may be biased by particular regions and countries. For instance, imagine a country with a larger than average share of large firms and huge problems in infrastructure. This country would artificially drive up the average value of large firms on the infrastructure obstacle. That is, the world and regional averages presented here are not controlled for country-level effects. Thus the averages of obstacle levels presented here give but a first indication of the pattern of results. Table 3.3 shows worldwide and regional averages of the eleven obstacles to business for the three firm sizes. For each obstacle, the three groups of firms are shaded according to their average answer. Black means that the firm size category in question experiences the highest obstacle level of all three; gray, that it experiences the second highest obstacle level; and white, the lowest obstacle level.
For the most part, small firms face the biggest problems. Worldwide, six obstacles are strongest for small firms: financing, inflation, corruption, both organized and street crime, and anti-competitive practices. Three obstacles hit medium firms hardest: taxes and regulations, policy instability or uncertainty, and the exchange rate. The remaining two obstacles—infrastructure and the functioning of the judiciary—appear to have the greatest negative impact on large firms.
The African survey covered only nine of the eleven obstacles. Not included are the functioning of the judiciary and the anti-competitive practices. Financing and corruption turn out to be the biggest problems in Africa, whereas taxes and regulations, unlike the worldwide sample, is one of the two
15
smallest obstacles (the exchange rate is the other). As seen in table 3.3, three of nine obstacles are most severe for small firms, two for medium-sized firms, and four for large firms.12 Table 3.3. Worldwide and Regional Averages of Obstacles by Firm Size
Ranking: 1=No obstacle 2=Minor obstacle 3=Moderate obstacle 4=Major obstacle Firm size: S=Small M=Medium L=Large
Firm size ranked by obstacle level: Highest Second highest Lowest
Sample
World
Africa East Asia &
Pacific Latin America and
the Caribbean Firm Size S M L S M L S M L S M L
Financing 2.88 2.86 2.59 2.96 2.83 2.78 2.61 2.52 2.29 3.04 2.86 2.55 Infrastructure 2.24 2.27 2.38 2.77 2.83 2.77 2.26 2.34 2.06 2.35 2.38 2.50 Taxes and regulations 2.90 2.96 2.63 2.19 2.23 2.23 2.41 2.60 2.31 2.97 3.10 2.86 Policy instability 2.80 2.84 2.71 2.40 2.49 2.32 2.72 2.70 2.60 2.91 3.04 3.03 Inflation 2.87 2.81 2.62 2.80 2.78 2.73 2.70 2.61 2.44 2.99 2.81 2.70 Exchange rate 2.52 2.56 2.46 2.14 2.19 2.21 2.57 2.75 2.61 2.84 2.80 2.73 Judiciary 2.11 2.16 2.18 1.91 1.91 1.81 2.31 2.39 2.45 Corruption 2.60 2.50 2.45 2.89 2.86 2.73 2.38 2.52 2.13 2.82 2.73 2.68 Street crime 2.60 2.43 2.45 2.57 2.65 2.71 2.79 2.38 2.14 3.08 2.90 2.90 Organized crime 2.39 2.26 2.31 2.56 2.52 2.70 2.62 2.28 2.11 2.60 2.53 2.58 Anti-comp. practices 2.43 2.37 2.20 2.41 2.43 2.16 2.44 2.48 2.34
Sample
South Asia Transition
Economies
OECD
Firm Size S M L S M L S M L Financing 3.12 2.92 2.70 2.99 3.10 3.00 2.34 2.17 1.94 Infrastructure 2.85 2.73 2.93 2.13 2.08 2.05 1.72 1.85 1.72 Taxes and regulations 3.07 2.71 2.68 3.28 3.25 3.12 2.79 2.79 2.45 Policy instability 3.27 3.03 3.11 2.96 3.00 2.89 2.25 2.14 2.12 Inflation 2.54 2.51 2.60 3.06 3.08 2.90 2.17 2.09 1.93 Exchange rate 2.22 2.18 2.45 2.61 2.72 2.60 1.83 1.84 1.88 Judiciary 2.56 2.20 2.17 2.11 2.15 2.13 1.77 1.77 1.76 Corruption 3.16 2.76 2.80 2.58 2.42 2.20 1.69 1.63 1.52 Street crime 2.41 2.05 2.09 2.51 2.35 2.09 2.00 1.67 1.65 Organized crime 2.52 2.10 1.94 2.35 2.22 1.94 1.54 1.48 1.53 Anti-comp. practices 2.96 2.49 2.44 2.48 2.41 2.17 2.02 1.96 1.83
In East Asia and Pacific, for all obstacles, large firms report much lower levels than medium-
sized firms. Five obstacles turn out to be severest for medium-sized firms: infrastructure, taxes, exchange rate, corruption and anti-competitive practices. Another five are highest for small firms: financing, policy instability, inflation, and both crime obstacles. For the remaining obstacle, the functioning of the judiciary, medium and small firms report almost the same average.
12 One interesting aspect is that big firms are almost equally concerned about financing, infrastructure, inflation,
corruption and both crime obstacles, whereas the biggest problem for small firms is clearly financing.
16
In Latin America and the Caribbean, small, medium, and large firms do not share a common major obstacle. Whereas small firms report street crime, theft and disorder as their biggest problem, for medium firms, the most substantial problem is taxes and regulations, and for large firms it is policy instability. Still, for all three firm sizes, these three obstacles are among the highest. Overall, of the three firm types, small firms have the highest value on six obstacles, medium firms on three obstacles, and large firms on two obstacles.
Three countries make up the South Asian countries sample: Bangladesh, India and Pakistan.
The most severe obstacle for all three firm sizes is policy instability or uncertainty. Eight obstacles have the highest levels for small firms. Inflation, exchange rate and infrastructure are highest for large firms (table 3.3). Compared with medium and large firms, small firms are at a disadvantage, especially because of anti-competitive practices and organized crime; their average is about 0.5 points higher than that of the other firm types.
The biggest obstacles in transition economies are taxes and regulations, followed by financing, inflation, and policy instability or uncertainty. Six obstacles are most severe for small firms, and five for medium firms. However, the difference in answers given by small, medium and large firms is small for the majority of obstacles (table 3.3). The exception to this are the questions on corruption, crime (both street crime and organized crime) and anti-competitive practices. For these obstacles, smaller size very clearly indicates a higher obstacle level.
Firms in the OECD area experience substantially lower obstacle levels than developing countries. The largest obstacle by far for all three firm sizes are taxes and regulations, which are higher for small and medium firms than for large firms. Overall, there is a tendency of small firms to have higher obstacle levels and large firms to have smaller obstacle levels than the average. However, there is no homogenous pattern in this.
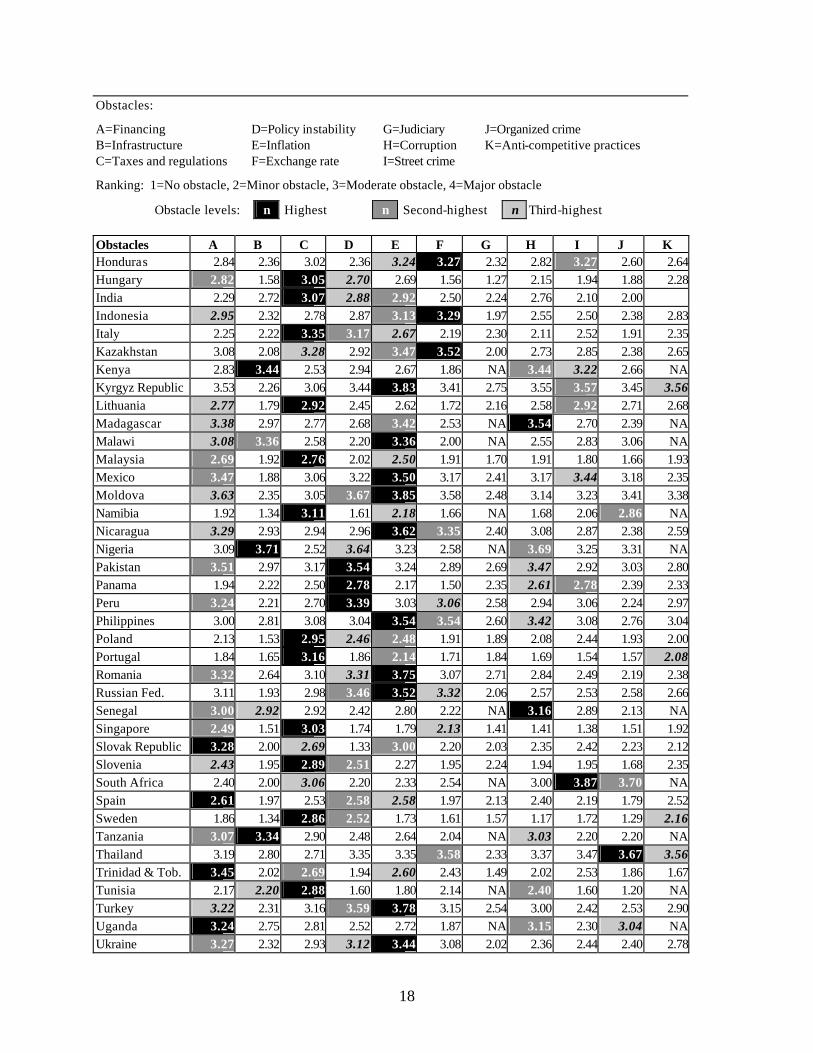
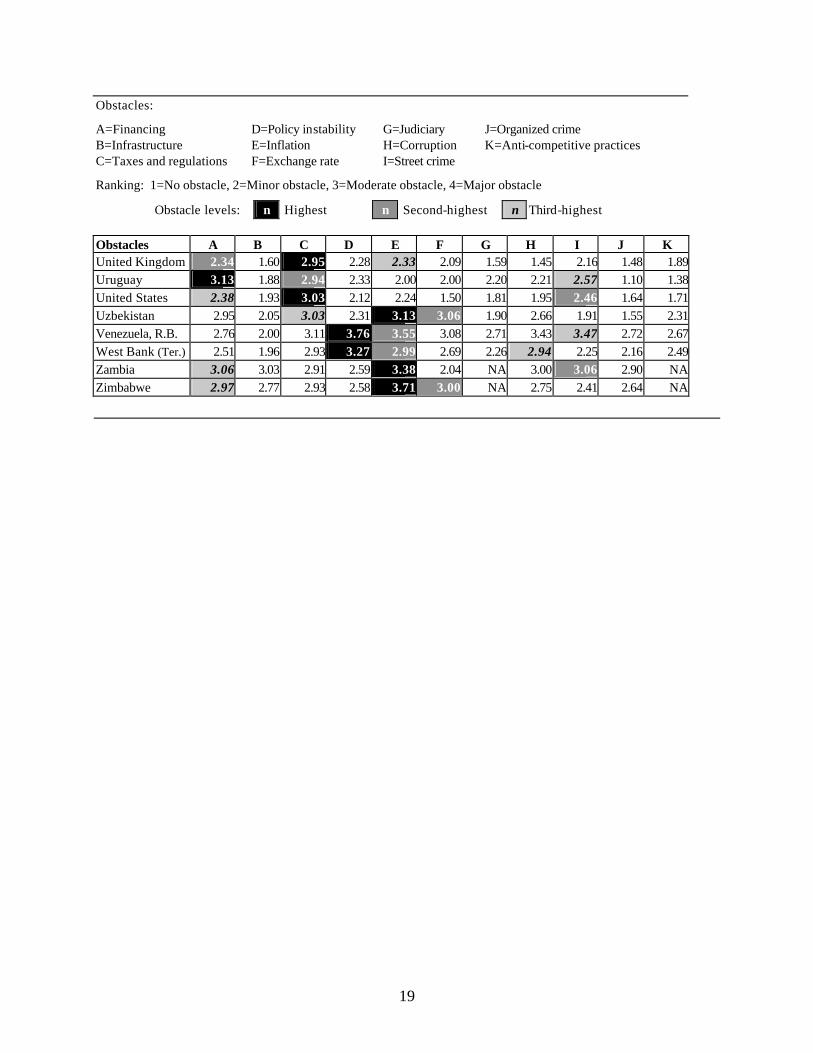
Table 3.4 focuses on the small firms. It shows the average value that small firms assigned to any obstacle in all countries of this study. For each country, the three obstacles that are most worrying to small firms are shaded: black for the most severe obstacle of all eleven, dark gray for the second-most severe obstacle, and light gray for the third-most severe obstacle.
Again, financing emerges as one of the three most severe obstacles (it is among the top in 47 countries). Inflation is one of the top three obstacles in 42 countries. They are followed by taxes and regulations (in the top in 38 countries) and policy instability (in the top in 35 countries).13 It is interesting that small firms do not appear to be shielded from macroeconomic problems. Take for instance, Argentina, Thailand, Turkey, and the Russian Federation. In all of these countries policy instability, inflation and the exchange rate are among the most important obstacles. A different pattern can be seen in South Africa. Here crime, both street crime and organized crime, are the most important problems
13 Overall, small firms of 24 countries rank taxes and regulations as their most severe obstacle. It is followed by
inflation (16 countries), financing (12 countries) and policy instability (8 countries).
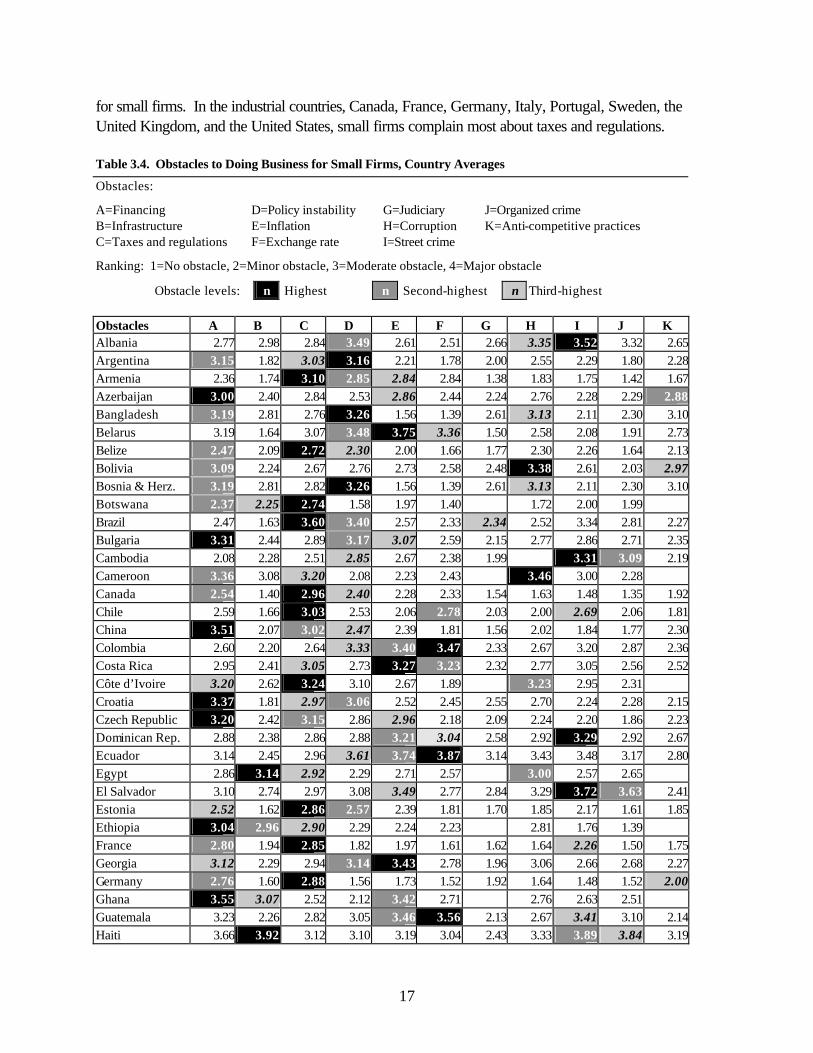
17
for small firms. In the industrial countries, Canada, France, Germany, Italy, Portugal, Sweden, the United Kingdom, and the United States, small firms complain most about taxes and regulations.
Table 3.4. Obstacles to Doing Business for Small Firms, Country Averages
Obstacles:
A=Financing D=Policy instability G=Judiciary J=Organized crime B=Infrastructure E=Inflation H=Corruption K=Anti-competitive practices C=Taxes and regulations F=Exchange rate I=Street crime
Ranking: 1=No obstacle, 2=Minor obstacle, 3=Moderate obstacle, 4=Major obstacle
Obstacle levels: n Highest n Second-highest n Third-highest Obstacles A B C D E F G H I J K Albania 2.77 2.98 2.84 3.49 2.61 2.51 2.66 3.35 3.52 3.32 2.65Argentina 3.15 1.82 3.03 3.16 2.21 1.78 2.00 2.55 2.29 1.80 2.28Armenia 2.36 1.74 3.10 2.85 2.84 2.84 1.38 1.83 1.75 1.42 1.67Azerbaijan 3.00 2.40 2.84 2.53 2.86 2.44 2.24 2.76 2.28 2.29 2.88Bangladesh 3.19 2.81 2.76 3.26 1.56 1.39 2.61 3.13 2.11 2.30 3.10Belarus 3.19 1.64 3.07 3.48 3.75 3.36 1.50 2.58 2.08 1.91 2.73Belize 2.47 2.09 2.72 2.30 2.00 1.66 1.77 2.30 2.26 1.64 2.13Bolivia 3.09 2.24 2.67 2.76 2.73 2.58 2.48 3.38 2.61 2.03 2.97Bosnia & Herz. 3.19 2.81 2.82 3.26 1.56 1.39 2.61 3.13 2.11 2.30 3.10Botswana 2.37 2.25 2.74 1.58 1.97 1.40 1.72 2.00 1.99 Brazil 2.47 1.63 3.60 3.40 2.57 2.33 2.34 2.52 3.34 2.81 2.27Bulgaria 3.31 2.44 2.89 3.17 3.07 2.59 2.15 2.77 2.86 2.71 2.35Cambodia 2.08 2.28 2.51 2.85 2.67 2.38 1.99 3.31 3.09 2.19Cameroon 3.36 3.08 3.20 2.08 2.23 2.43 3.46 3.00 2.28 Canada 2.54 1.40 2.96 2.40 2.28 2.33 1.54 1.63 1.48 1.35 1.92Chile 2.59 1.66 3.03 2.53 2.06 2.78 2.03 2.00 2.69 2.06 1.81China 3.51 2.07 3.02 2.47 2.39 1.81 1.56 2.02 1.84 1.77 2.30Colombia 2.60 2.20 2.64 3.33 3.40 3.47 2.33 2.67 3.20 2.87 2.36Costa Rica 2.95 2.41 3.05 2.73 3.27 3.23 2.32 2.77 3.05 2.56 2.52Côte d’Ivoire 3.20 2.62 3.24 3.10 2.67 1.89 3.23 2.95 2.31 Croatia 3.37 1.81 2.97 3.06 2.52 2.45 2.55 2.70 2.24 2.28 2.15Czech Republic 3.20 2.42 3.15 2.86 2.96 2.18 2.09 2.24 2.20 1.86 2.23Dominican Rep. 2.88 2.38 2.86 2.88 3.21 3.04 2.58 2.92 3.29 2.92 2.67Ecuador 3.14 2.45 2.96 3.61 3.74 3.87 3.14 3.43 3.48 3.17 2.80Egypt 2.86 3.14 2.92 2.29 2.71 2.57 3.00 2.57 2.65 El Salvador 3.10 2.74 2.97 3.08 3.49 2.77 2.84 3.29 3.72 3.63 2.41Estonia 2.52 1.62 2.86 2.57 2.39 1.81 1.70 1.85 2.17 1.61 1.85Ethiopia 3.04 2.96 2.90 2.29 2.24 2.23 2.81 1.76 1.39 France 2.80 1.94 2.85 1.82 1.97 1.61 1.62 1.64 2.26 1.50 1.75Georgia 3.12 2.29 2.94 3.14 3.43 2.78 1.96 3.06 2.66 2.68 2.27Germany 2.76 1.60 2.88 1.56 1.73 1.52 1.92 1.64 1.48 1.52 2.00Ghana 3.55 3.07 2.52 2.12 3.42 2.71 2.76 2.63 2.51 Guatemala 3.23 2.26 2.82 3.05 3.46 3.56 2.13 2.67 3.41 3.10 2.14Haiti 3.66 3.92 3.12 3.10 3.19 3.04 2.43 3.33 3.89 3.84 3.19
18
Obstacles:
A=Financing D=Policy instability G=Judiciary J=Organized crime B=Infrastructure E=Inflation H=Corruption K=Anti-competitive practices C=Taxes and regulations F=Exchange rate I=Street crime
Ranking: 1=No obstacle, 2=Minor obstacle, 3=Moderate obstacle, 4=Major obstacle
Obstacle levels: n Highest n Second-highest n Third-highest Obstacles A B C D E F G H I J K Honduras 2.84 2.36 3.02 2.36 3.24 3.27 2.32 2.82 3.27 2.60 2.64Hungary 2.82 1.58 3.05 2.70 2.69 1.56 1.27 2.15 1.94 1.88 2.28India 2.29 2.72 3.07 2.88 2.92 2.50 2.24 2.76 2.10 2.00 Indonesia 2.95 2.32 2.78 2.87 3.13 3.29 1.97 2.55 2.50 2.38 2.83Italy 2.25 2.22 3.35 3.17 2.67 2.19 2.30 2.11 2.52 1.91 2.35Kazakhstan 3.08 2.08 3.28 2.92 3.47 3.52 2.00 2.73 2.85 2.38 2.65Kenya 2.83 3.44 2.53 2.94 2.67 1.86 NA 3.44 3.22 2.66 NA Kyrgyz Republic 3.53 2.26 3.06 3.44 3.83 3.41 2.75 3.55 3.57 3.45 3.56Lithuania 2.77 1.79 2.92 2.45 2.62 1.72 2.16 2.58 2.92 2.71 2.68Madagascar 3.38 2.97 2.77 2.68 3.42 2.53 NA 3.54 2.70 2.39 NA Malawi 3.08 3.36 2.58 2.20 3.36 2.00 NA 2.55 2.83 3.06 NA Malaysia 2.69 1.92 2.76 2.02 2.50 1.91 1.70 1.91 1.80 1.66 1.93Mexico 3.47 1.88 3.06 3.22 3.50 3.17 2.41 3.17 3.44 3.18 2.35Moldova 3.63 2.35 3.05 3.67 3.85 3.58 2.48 3.14 3.23 3.41 3.38Namibia 1.92 1.34 3.11 1.61 2.18 1.66 NA 1.68 2.06 2.86 NA Nicaragua 3.29 2.93 2.94 2.96 3.62 3.35 2.40 3.08 2.87 2.38 2.59Nigeria 3.09 3.71 2.52 3.64 3.23 2.58 NA 3.69 3.25 3.31 NA Pakistan 3.51 2.97 3.17 3.54 3.24 2.89 2.69 3.47 2.92 3.03 2.80Panama 1.94 2.22 2.50 2.78 2.17 1.50 2.35 2.61 2.78 2.39 2.33Peru 3.24 2.21 2.70 3.39 3.03 3.06 2.58 2.94 3.06 2.24 2.97Philippines 3.00 2.81 3.08 3.04 3.54 3.54 2.60 3.42 3.08 2.76 3.04Poland 2.13 1.53 2.95 2.46 2.48 1.91 1.89 2.08 2.44 1.93 2.00Portugal 1.84 1.65 3.16 1.86 2.14 1.71 1.84 1.69 1.54 1.57 2.08Romania 3.32 2.64 3.10 3.31 3.75 3.07 2.71 2.84 2.49 2.19 2.38Russian Fed. 3.11 1.93 2.98 3.46 3.52 3.32 2.06 2.57 2.53 2.58 2.66Senegal 3.00 2.92 2.92 2.42 2.80 2.22 NA 3.16 2.89 2.13 NA Singapore 2.49 1.51 3.03 1.74 1.79 2.13 1.41 1.41 1.38 1.51 1.92Slovak Republic 3.28 2.00 2.69 1.33 3.00 2.20 2.03 2.35 2.42 2.23 2.12Slovenia 2.43 1.95 2.89 2.51 2.27 1.95 2.24 1.94 1.95 1.68 2.35South Africa 2.40 2.00 3.06 2.20 2.33 2.54 NA 3.00 3.87 3.70 NA Spain 2.61 1.97 2.53 2.58 2.58 1.97 2.13 2.40 2.19 1.79 2.52Sweden 1.86 1.34 2.86 2.52 1.73 1.61 1.57 1.17 1.72 1.29 2.16Tanzania 3.07 3.34 2.90 2.48 2.64 2.04 NA 3.03 2.20 2.20 NA Thailand 3.19 2.80 2.71 3.35 3.35 3.58 2.33 3.37 3.47 3.67 3.56Trinidad & Tob. 3.45 2.02 2.69 1.94 2.60 2.43 1.49 2.02 2.53 1.86 1.67Tunisia 2.17 2.20 2.88 1.60 1.80 2.14 NA 2.40 1.60 1.20 NA Turkey 3.22 2.31 3.16 3.59 3.78 3.15 2.54 3.00 2.42 2.53 2.90Uganda 3.24 2.75 2.81 2.52 2.72 1.87 NA 3.15 2.30 3.04 NA Ukraine 3.27 2.32 2.93 3.12 3.44 3.08 2.02 2.36 2.44 2.40 2.78
19
Obstacles:
A=Financing D=Policy instability G=Judiciary J=Organized crime B=Infrastructure E=Inflation H=Corruption K=Anti-competitive practices C=Taxes and regulations F=Exchange rate I=Street crime
Ranking: 1=No obstacle, 2=Minor obstacle, 3=Moderate obstacle, 4=Major obstacle
Obstacle levels: n Highest n Second-highest n Third-highest Obstacles A B C D E F G H I J K United Kingdom 2.34 1.60 2.95 2.28 2.33 2.09 1.59 1.45 2.16 1.48 1.89Uruguay 3.13 1.88 2.94 2.33 2.00 2.00 2.20 2.21 2.57 1.10 1.38United States 2.38 1.93 3.03 2.12 2.24 1.50 1.81 1.95 2.46 1.64 1.71Uzbekistan 2.95 2.05 3.03 2.31 3.13 3.06 1.90 2.66 1.91 1.55 2.31Venezuela, R.B. 2.76 2.00 3.11 3.76 3.55 3.08 2.71 3.43 3.47 2.72 2.67West Bank (Ter.) 2.51 1.96 2.93 3.27 2.99 2.69 2.26 2.94 2.25 2.16 2.49Zambia 3.06 3.03 2.91 2.59 3.38 2.04 NA 3.00 3.06 2.90 NA Zimbabwe 2.97 2.77 2.93 2.58 3.71 3.00 NA 2.75 2.41 2.64 NA
20
Chapter 4. Model Specification
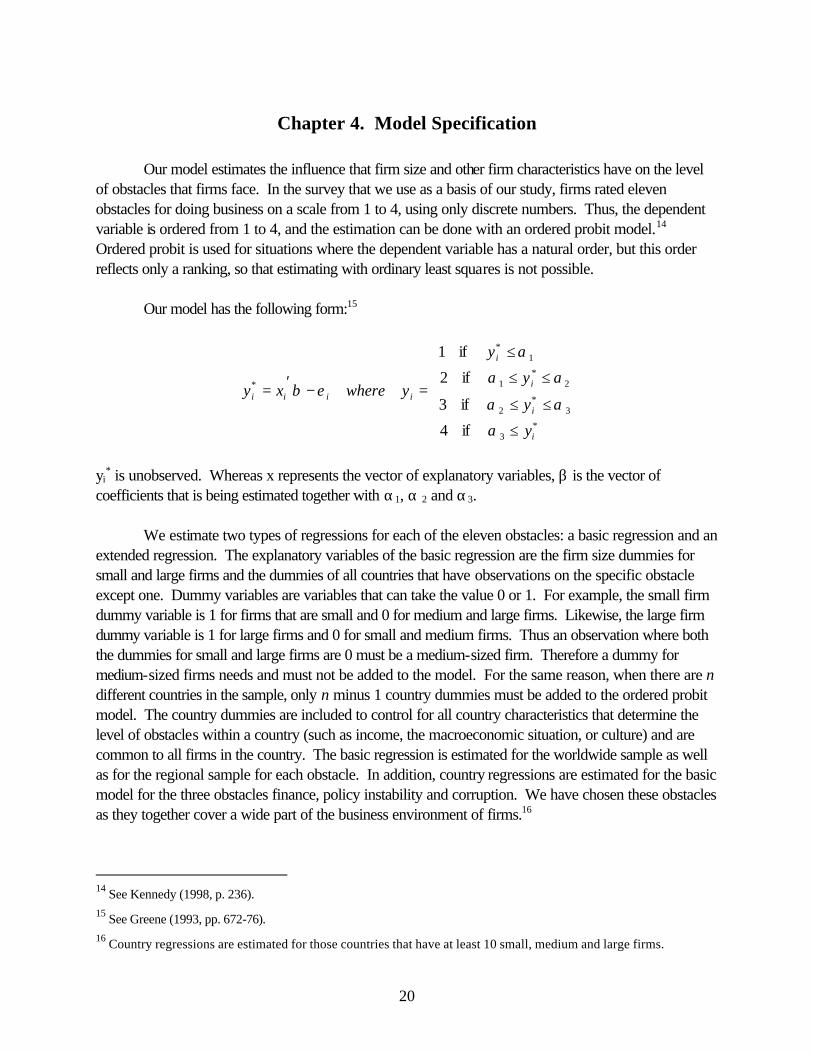
Our model estimates the influence that firm size and other firm characteristics have on the level of obstacles that firms face. In the survey that we use as a basis of our study, firms rated eleven obstacles for doing business on a scale from 1 to 4, using only discrete numbers. Thus, the dependent variable is ordered from 1 to 4, and the estimation can be done with an ordered probit model.14 Ordered probit is used for situations where the dependent variable has a natural order, but this order reflects only a ranking, so that estimating with ordinary least squares is not possible.
Our model has the following form:15
≤
≤≤
≤≤
≤
=−′=
*3
3*
2
2*
1
1*
*
if4
if3
if2
if1
i
i
i
i
iiii
y
y
y
y
ywherexy
α
αα
αα
α
εβ
yi
* is unobserved. Whereas x represents the vector of explanatory variables, β is the vector of coefficients that is being estimated together with α1, α 2 and α3.
We estimate two types of regressions for each of the eleven obstacles: a basic regression and an extended regression. The explanatory variables of the basic regression are the firm size dummies for small and large firms and the dummies of all countries that have observations on the specific obstacle except one. Dummy variables are variables that can take the value 0 or 1. For example, the small firm dummy variable is 1 for firms that are small and 0 for medium and large firms. Likewise, the large firm dummy variable is 1 for large firms and 0 for small and medium firms. Thus an observation where both the dummies for small and large firms are 0 must be a medium-sized firm. Therefore a dummy for medium-sized firms needs and must not be added to the model. For the same reason, when there are n different countries in the sample, only n minus 1 country dummies must be added to the ordered probit model. The country dummies are included to control for all country characteristics that determine the level of obstacles within a country (such as income, the macroeconomic situation, or culture) and are common to all firms in the country. The basic regression is estimated for the worldwide sample as well as for the regional sample for each obstacle. In addition, country regressions are estimated for the basic model for the three obstacles finance, policy instability and corruption. We have chosen these obstacles as they together cover a wide part of the business environment of firms.16
14 See Kennedy (1998, p. 236). 15 See Greene (1993, pp. 672-76). 16 Country regressions are estimated for those countries that have at least 10 small, medium and large firms.

21
The extended regression adds three variables to the basic regression: firm age, a dummy for whether the government has a stake in the firm, and a dummy for whether a foreign entity has a stake in the firm. The aim of estimating this is to test whether the results gained from the basic regression are robust. The testing is done for the worldwide sample for all eleven obstacles.
22
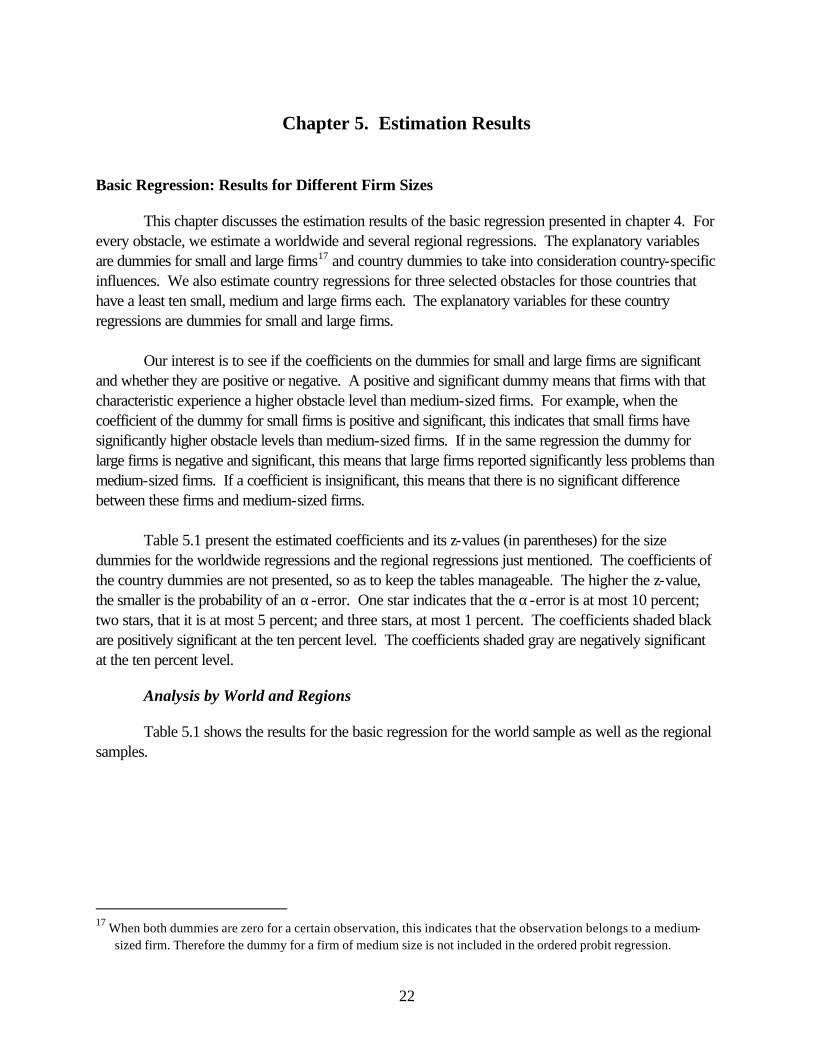
Chapter 5. Estimation Results
Basic Regression: Results for Different Firm Sizes
This chapter discusses the estimation results of the basic regression presented in chapter 4. For every obstacle, we estimate a worldwide and several regional regressions. The explanatory variables are dummies for small and large firms17 and country dummies to take into consideration country-specific influences. We also estimate country regressions for three selected obstacles for those countries that have a least ten small, medium and large firms each. The explanatory variables for these country regressions are dummies for small and large firms.
Our interest is to see if the coefficients on the dummies for small and large firms are significant and whether they are positive or negative. A positive and significant dummy means that firms with that characteristic experience a higher obstacle level than medium-sized firms. For example, when the coefficient of the dummy for small firms is positive and significant, this indicates that small firms have significantly higher obstacle levels than medium-sized firms. If in the same regression the dummy for large firms is negative and significant, this means that large firms reported significantly less problems than medium-sized firms. If a coefficient is insignificant, this means that there is no significant difference between these firms and medium-sized firms.
Table 5.1 present the estimated coefficients and its z-values (in parentheses) for the size dummies for the worldwide regressions and the regional regressions just mentioned. The coefficients of the country dummies are not presented, so as to keep the tables manageable. The higher the z-value, the smaller is the probability of an α-error. One star indicates that the α-error is at most 10 percent; two stars, that it is at most 5 percent; and three stars, at most 1 percent. The coefficients shaded black are positively significant at the ten percent level. The coefficients shaded gray are negatively significant at the ten percent level.
Analysis by World and Regions
Table 5.1 shows the results for the basic regression for the world sample as well as the regional samples.
17 When both dummies are zero for a certain observation, this indicates that the observation belongs to a medium-
sized firm. Therefore the dummy for a firm of medium size is not included in the ordered probit regression.
23
Table 5.1. Basic Regression Results for the World Sample and the Regional Samples
World Africa Dependent variable: Obstacles to doing
business Small firm
dummy Large firm
dummy No of obs. Small firm
dummy Large firm
dummy No of obs.
Financing 0.077*** -0.184*** 9286 0.158** -0.053 1260 (2.848) (-5.538) (2.080) (-0.691) Infrastructure -0.039 0.019 9238 -0.06 -0.015 1264 (-1.467) (0.585) (-0.767) (-0.193) Taxes and reg. 0.051* a/ -0.149*** 8025 -0.01 b/ -0.124 1347
(1.781) (-4.044) (-0.134) (-1.605) Policy instability 0.031 -0.041 9097 -0.024 -0.206*** 1214 (1.144) (-1.219) (-0.312) (-2.628) Inflation 0.139*** -0.131*** 9179 0.031 -0.206*** 1268 (5.021) (-3.907) (0.393) (-2.595) Exchange rate 0.062** -0.01 8965 0.038 -0.043 1187 (2.243) (-0.309) (0.479) (-0.546) Judiciary 0.001 0.015 7250 c/
(0.038) (0.406) Corruption 0.153*** -0.135*** 8412 0.091 -0.258*** 1279 (5.403) (-3.888) (1.181) (-3.295) Street crime 0.18*** -0.111*** 8837 0.029 -0.169** 1254 (6.493) (-3.241) (0.372) (-2.159) Organized crime 0.123*** a/ -0.053 7212 0.004 -0.005 895
(3.887) (-1.321) (0.048) (-0.053) Anti-comp. pract. 0.087*** a/ -0.135*** 7165 c/
(2.905) (-3.460) Notes: a/ Without African Countries. b/ Originally non-integer values from 1 to 4. Rounded to integer values. c/ No observations.
Continued
The worldwide regressions for financing, taxes and regulations, inflation, corruption, street crime
and anti-competitive practices all reveal the same pattern: whereas the dummy for small firms is positively significant, the dummy for large firms is negatively significant. This means that small firms have more and large firms fewer problems than medium-sized firms. In other words, there is a negative relationship between firm size and risk level. The pattern is shown in figure 5.1. Given that all firm size dummies in these regressions but one are significant at the 1 percent level, this is a very strong result.18
18 The exception is the dummy for small firms in taxes and regulations, which is significant at the 10 percent level
only.
24
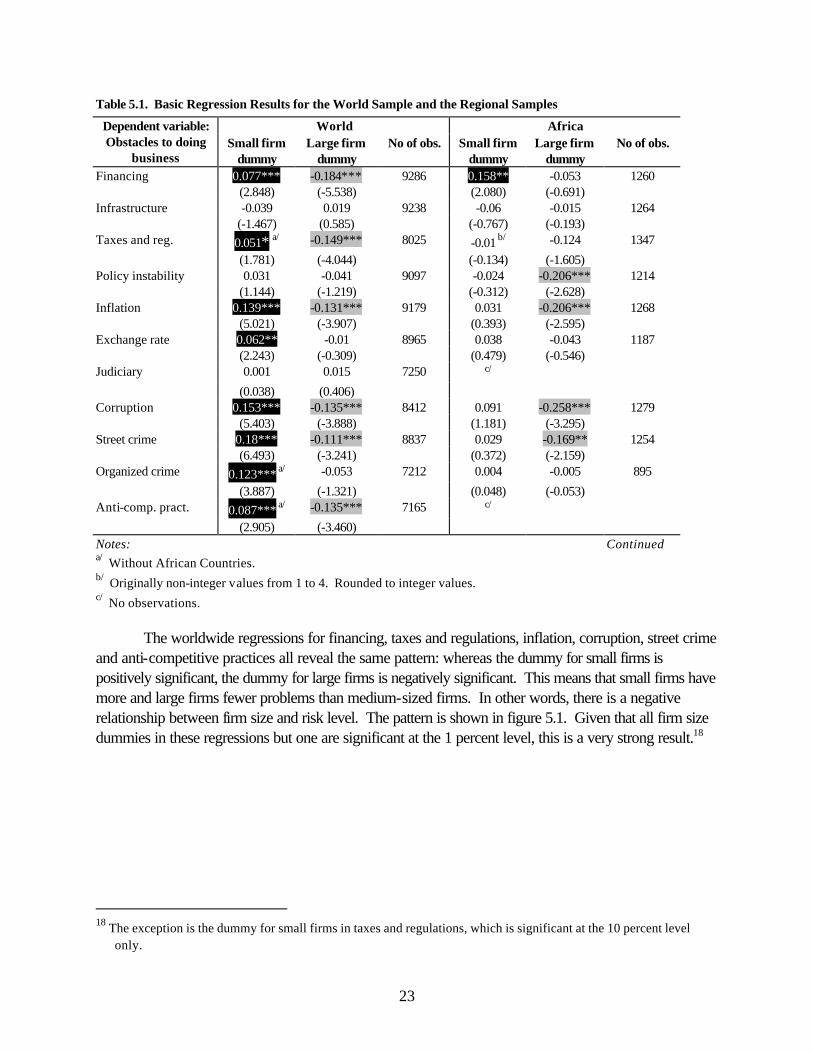
The negative relationship between firm size and these obstacles is also reflected in the regional regressions, though the results are less pronounced.19 Table 5.1. Basic Regression Results for the Regional Samples (Continued)
East Asia Latin America and the Caribbean Dependent variable: Obstacles to doing
business Small firm
dummy Large firm
dummy No of obs. Small firm
dummy Large firm
dummy No of obs.
Financing 0.372*** -0.126 1018 0.155** -0.26*** 2060 (4.264) (-1.139) (2.543) (-4.204) Infrastructure 0.018 -0.106 945 -0.168*** 0.101* 2060 (0.206) (-0.956) (-2.795) (1.651) Taxes and reg. 0.036 -0.087 1065 -0.004 -0.18*** 2065 (0.439) (-0.851) (-0.064) (-2.905) Policy instability 0.053 0.06 956 -0.011 -0.005 2059 (0.586) (0.541) (-0.181) (-0.081) Inflation 0.321*** 0.024 895 0.173*** -0.148** 2059 (3.451) (0.212) (2.817) (-2.375) Exchange rate 0.203** 0.134 973 0.091 -0.071 2037 (2.199) (1.195) (1.466) (-1.116) Judiciary 0.021 -0.004 796 0.029 0.068 1997 (0.201) (-0.036) (0.475) (1.103) Corruption 0.064 d/ -0.117 569 0.118* -0.107* 2010
(0.574) (-0.881) (1.916) (-1.697) Street crime 0.148 -0.114 836 0.187*** -0.102 2047 (1.462) (-0.925) (2.989) (-1.604) Organized crime 0.028 -0.055 812 0.062 -0.05 1967 (0.268) (-0.443) (0.954) (-0.766) Anti-comp. pract. 0.132 -0.105 883 -0.067 -0.188*** 1981 (1.375) (-0.900) (-1.104) (-3.013) Note: d/ East Asia and Pacific without Cambodia.
Continued
19 For financing, Africa, East Asia and Pacific, Latin America and the Caribbean, and the OECD show significantly
negative small firm dummies. In addition, Latin America and the Caribbean and the OECD show significantly positive dummies for large firms. Large firms suffer less than medium-sized firms from taxes and regulations in Latin America and the Caribbean and the OECD. Small firms have significantly higher inflation obstacle levels than medium-sized firms in all regions except Africa and the OECD, whereas large firms have lower obstacle levels than medium-sized firms in Africa, Latin America and the Caribbean, and the OECD. In three regions, the dummy for small firms is positively significant in explaining corruption, whereas again in three regions, the dummy for large firms is negatively significant. Small firms in Latin America and the Caribbean, South Asia, and transition economies have higher levels of street crime than medium-sized firms, while large firms have lower levels in Africa and transition economies. For anti-competitive practices, the small firm dummy is negatively significant in South Asia and transition economies, and the large firm dummy is positively significant in Latin America and the Caribbean.
25
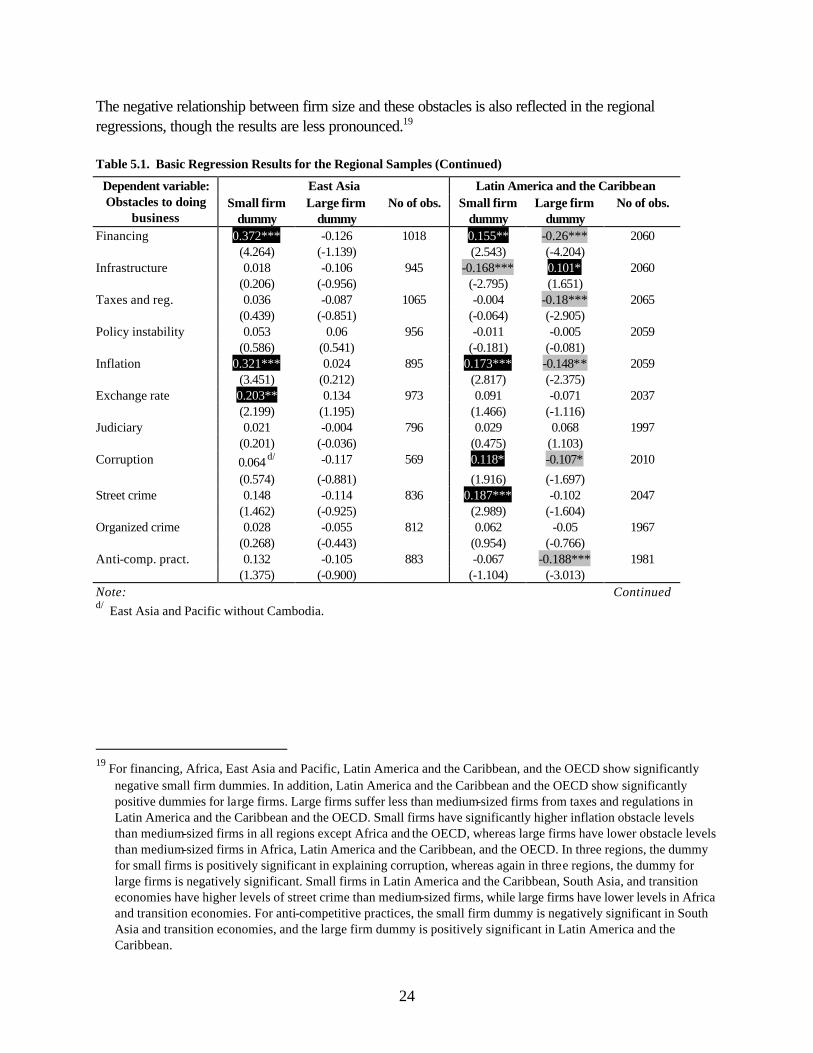
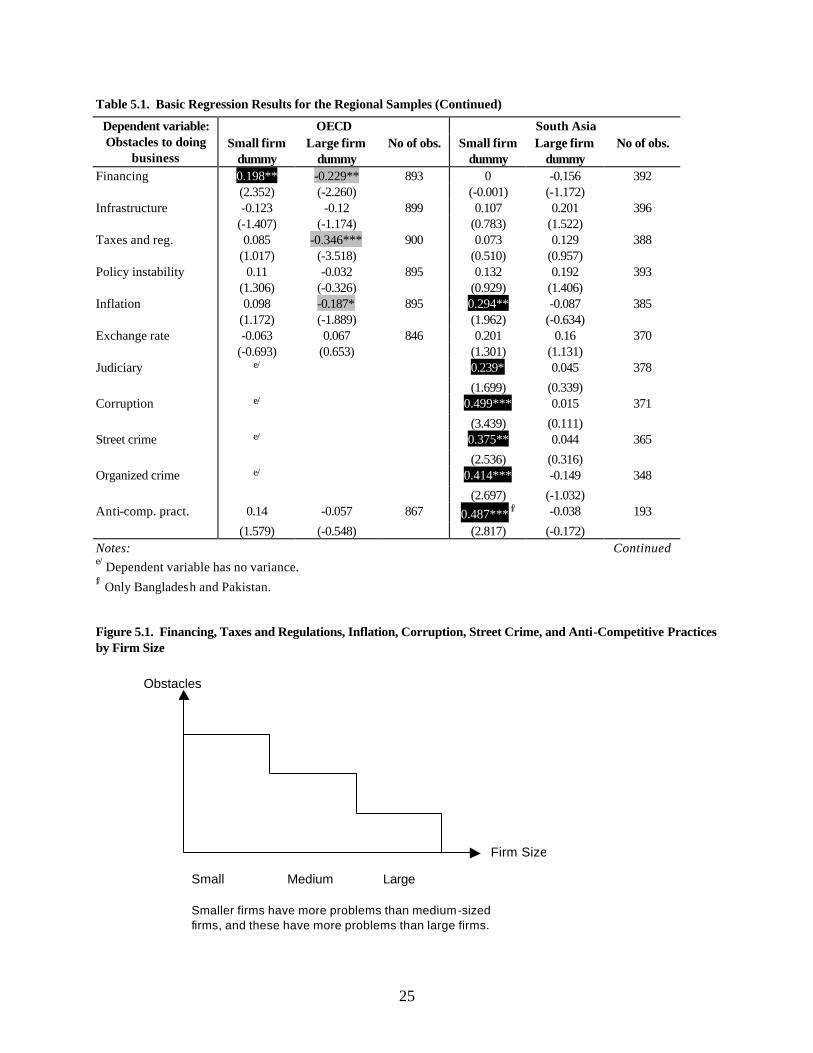
Table 5.1. Basic Regression Results for the Regional Samples (Continued)
OECD South Asia Dependent variable: Obstacles to doing
business Small firm
dummy Large firm
dummy No of obs. Small firm
dummy Large firm
dummy No of obs.
Financing 0.198** -0.229** 893 0 -0.156 392 (2.352) (-2.260) (-0.001) (-1.172) Infrastructure -0.123 -0.12 899 0.107 0.201 396 (-1.407) (-1.174) (0.783) (1.522) Taxes and reg. 0.085 -0.346*** 900 0.073 0.129 388 (1.017) (-3.518) (0.510) (0.957) Policy instability 0.11 -0.032 895 0.132 0.192 393 (1.306) (-0.326) (0.929) (1.406) Inflation 0.098 -0.187* 895 0.294** -0.087 385 (1.172) (-1.889) (1.962) (-0.634) Exchange rate -0.063 0.067 846 0.201 0.16 370 (-0.693) (0.653) (1.301) (1.131) Judiciary e/ 0.239* 0.045 378
(1.699) (0.339) Corruption e/ 0.499*** 0.015 371
(3.439) (0.111) Street crime e/ 0.375** 0.044 365
(2.536) (0.316) Organized crime e/ 0.414*** -0.149 348
(2.697) (-1.032) Anti-comp. pract. 0.14 -0.057 867 0.487*** f/ -0.038 193
(1.579) (-0.548) (2.817) (-0.172) Notes: e/ Dependent variable has no variance. f/ Only Bangladesh and Pakistan.
Continued
Figure 5.1. Financing, Taxes and Regulations, Inflation, Corruption, Street Crime, and Anti-Competitive Practices by Firm Size Obstacles Small Medium Large
Smaller firms have more problems than medium-sized firms, and these have more problems than large firms.
Firm Size
26
Table 5.1. Basic Regression Results for the Regional Samples (Continued)
Transition Economies Dependent variable: Obstacles to doing
business Small firm
dummy Large firm
dummy No of obs.
Financing -0.081 -0.06 3341 (-1.892) (-0.815) Infrastructure 0.016 0.04 3358 (0.396) (0.565) Taxes and reg. 0.054 -0.044 3372 (1.259) (-0.592) Policy instability 0.031 -0.052 3282 (0.729) (-0.716) Inflation 0.096** -0.036 3361 (2.215) (-0.489) Exchange rate 0.029 0.013 3229 (0.659) (0.170) Judiciary -0.07 -0.002 2973 (-1.592) (-0.030) Corruption 0.164*** -0.138* 3020 (3.763) (-1.815) Street crime 0.155*** -0.134* 3183 (3.646) (-1.822) Organized crime 0.111** -0.098 3019 (2.462) (-1.274) Anti-comp. pract. 0.11** -0.118 3013 (2.559) (-1.597)
In the worldwide sample, small firms experience significantly larger problems with organized
crime and the exchange rate than medium-sized firms (1 percent and 5 percent significance). Large firms do not differ significantly from medium-sized firms with respect to these two obstacles. 20 The pattern is therefore as in figure 5.2.
20 Looking at the regional regressions, the exchange rate is a bigger problem for small firms than for medium size or
large firms only in East Asia and Pacific, as all other firm-size dummies in the exchange rate regressions are not significant. Small firms suffer more from organized crime than medium-size firms in South Asia and in transition economies.
27
Figure 5.2. Organized Crime and Exchange Rates by Firm Size. Obstacles Small Medium Large Firm Size
Small firms have more problems than medium and large firms.
Three obstacles do not show any significance in the world regressions: infrastructure, policy
instability and judiciary (figure 5.3). This is also reflected in the regional regressions of these three obstacles. For each of them, only one regional regression is significant.21
Figure 5.3. Infrastructure, Policy Instability, and the Judiciary by Firm Size Obstacles Small Medium Large
There is no systematic relationship between obstacle- perception and firm size.
Analysis by Regions
Of all regions, Latin America and the Caribbean and the transition economies show the strongest negative relationship between firm size and obstacle. The pattern where small firms have 21 In Africa, larger firms suffer less from policy instability than medium and small firms. In South Asia, small firms
have more problems caused by the judiciary than medium and large firms. Finally, in Latin America and the Caribbean, infrastructure is a bigger obstacle to large firms than to small firms. The dummy for small firms is negatively significant at the 1 percent level. The dummy for large firms positively significant at the 10 percent level. This is the only regression of all regional and worldwide regressions that shows a significantly positive pattern between firm size and obstacle.
Firm Size
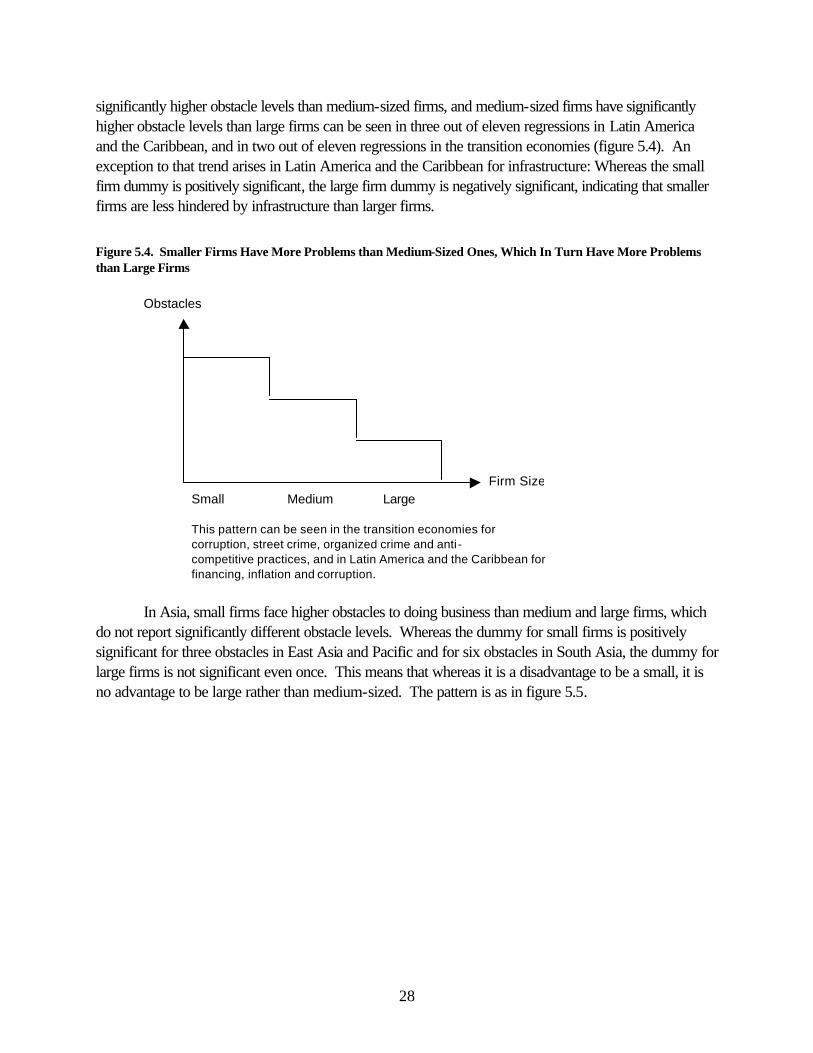
28
significantly higher obstacle levels than medium-sized firms, and medium-sized firms have significantly higher obstacle levels than large firms can be seen in three out of eleven regressions in Latin America and the Caribbean, and in two out of eleven regressions in the transition economies (figure 5.4). An exception to that trend arises in Latin America and the Caribbean for infrastructure: Whereas the small firm dummy is positively significant, the large firm dummy is negatively significant, indicating that smaller firms are less hindered by infrastructure than larger firms.
Figure 5.4. Smaller Firms Have More Problems than Medium-Sized Ones, Which In Turn Have More Problems than Large Firms Obstacles Small Medium Large
This pattern can be seen in the transition economies for corruption, street crime, organized crime and anti - competitive practices, and in Latin America and the Caribbean for financing, inflation and corruption.
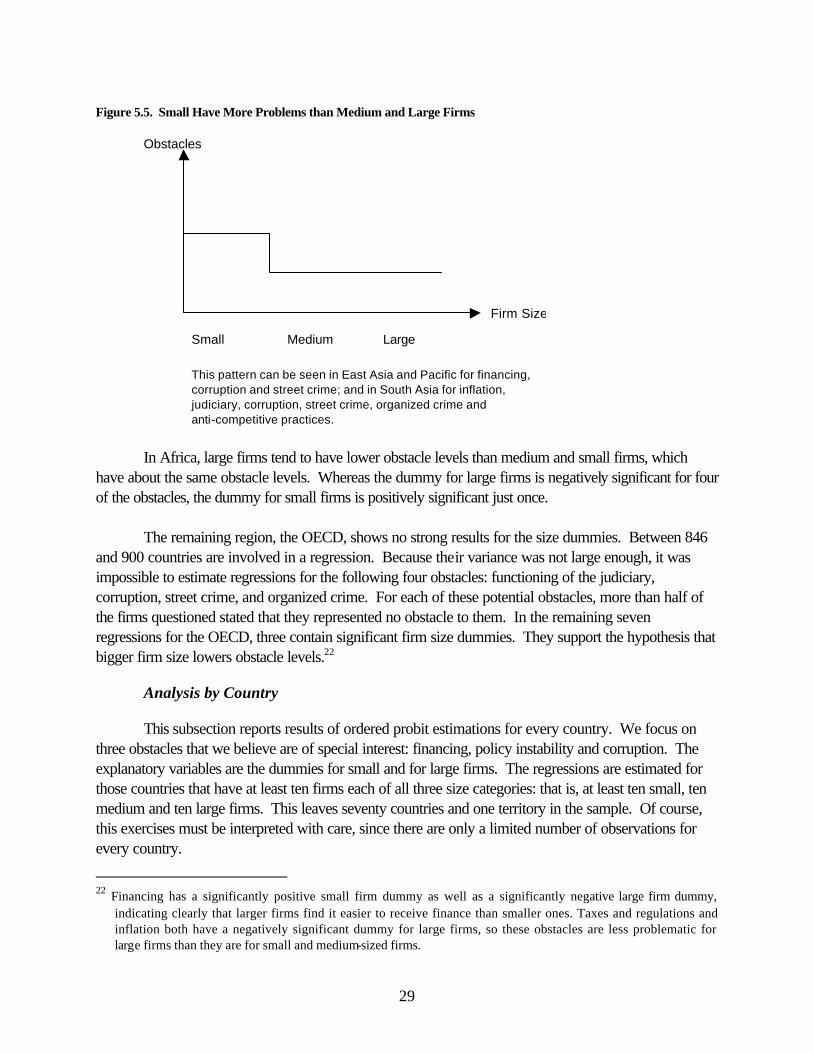
In Asia, small firms face higher obstacles to doing business than medium and large firms, which
do not report significantly different obstacle levels. Whereas the dummy for small firms is positively significant for three obstacles in East Asia and Pacific and for six obstacles in South Asia, the dummy for large firms is not significant even once. This means that whereas it is a disadvantage to be a small, it is no advantage to be large rather than medium-sized. The pattern is as in figure 5.5.
Firm Size
29
Figure 5.5. Small Have More Problems than Medium and Large Firms Obstacles Small Medium Large
This pattern can be seen in East Asia and Pacific for financing, corruption and street crime; and in South Asia for inflation, judiciary, corruption, street crime, organized crime and anti-competitive practices.
In Africa, large firms tend to have lower obstacle levels than medium and small firms, which
have about the same obstacle levels. Whereas the dummy for large firms is negatively significant for four of the obstacles, the dummy for small firms is positively significant just once.
The remaining region, the OECD, shows no strong results for the size dummies. Between 846 and 900 countries are involved in a regression. Because their variance was not large enough, it was impossible to estimate regressions for the following four obstacles: functioning of the judiciary, corruption, street crime, and organized crime. For each of these potential obstacles, more than half of the firms questioned stated that they represented no obstacle to them. In the remaining seven regressions for the OECD, three contain significant firm size dummies. They support the hypothesis that bigger firm size lowers obstacle levels.22
Analysis by Country
This subsection reports results of ordered probit estimations for every country. We focus on three obstacles that we believe are of special interest: financing, policy instability and corruption. The explanatory variables are the dummies for small and for large firms. The regressions are estimated for those countries that have at least ten firms each of all three size categories: that is, at least ten small, ten medium and ten large firms. This leaves seventy countries and one territory in the sample. Of course, this exercises must be interpreted with care, since there are only a limited number of observations for every country.
22 Financing has a significantly positive small firm dummy as well as a significantly negative large firm dummy,
indicating clearly that larger firms find it easier to receive finance than smaller ones. Taxes and regulations and inflation both have a negatively significant dummy for large firms, so these obstacles are less problematic for large firms than they are for small and medium-sized firms.
Firm Size
30
Table D.1 in appendix D shows the estimated coefficients and z-values (in parentheses) of the
two size dummies.23 For the majority of countries, there are no significant differences between firms of different sizes and their perception of the business environment. This may well be due to low power to find differences in such small samples. In spite of this, there are a number of countries that do show significant differences; these will be discussed selectively.
In the financing area, the bias against small firms is quite pronounced. In a number of large Latin American countries, including Argentina, Brazil, and Colombia, large firms reported significantly fewer problems with financing than medium and small firms (which do not differ significantly from each other). The same pattern emerges in South Africa and Thailand. It is possible that in these relatively developed emerging markets small and medium-sized firms are in similar situations, whereas large size firms play by completely different rules.
In a number of countries, small firms report significantly more problems with financing than medium and large firms (which do not differ). Quite a few of these are in Africa, including Côte d’Ivoire, Ghana, and Senegal. Not only low-income countries fall in this group: for instance, the same pattern of bias also emerges in Spain and Malaysia. There are only two countries where small firms report significantly fewer problems than larger firms and, interestingly, they are both transition economies: Poland and Ukraine. It is conceivable that in transition economies, the small firms are also the young and dynamic private sector firms that have fewer problems with financing than older, less dynamic firms.
The picture is more mixed for policy instability. There were no significant differences on this obstacle in the worldwide sample. This is also reflected in the country analyses: there are no dominant patterns of biases.
Large firms have fewer problems with corruption than smaller firms in a number of countries (for instance, in Costa Rica, Egypt, Kenya, and Turkey). In the same vein, small firms report significantly more problems in countries such as Hungary, Nigeria, and Senegal. Kenya is an interesting special case: it is the only country where a hump-shaped pattern emerges; this means that medium-size firms have the most problems with corruption. This could be consistent with the hypothesis that large firms work through political connection and small firms escape altogether, leaving medium-sized firms worst off.
23 As before, one star indicates that the α-error is at most 10 percent; two stars, at most 5 percent, and three stars, at
most 1 percent.

31
Extended Regression: Sensitivity Analysis
This section tests whether additional variables can help explain the obstacle levels and whether the significance of the firm size dummy variables are affected when more variables are added to the basic regression of the previous section.
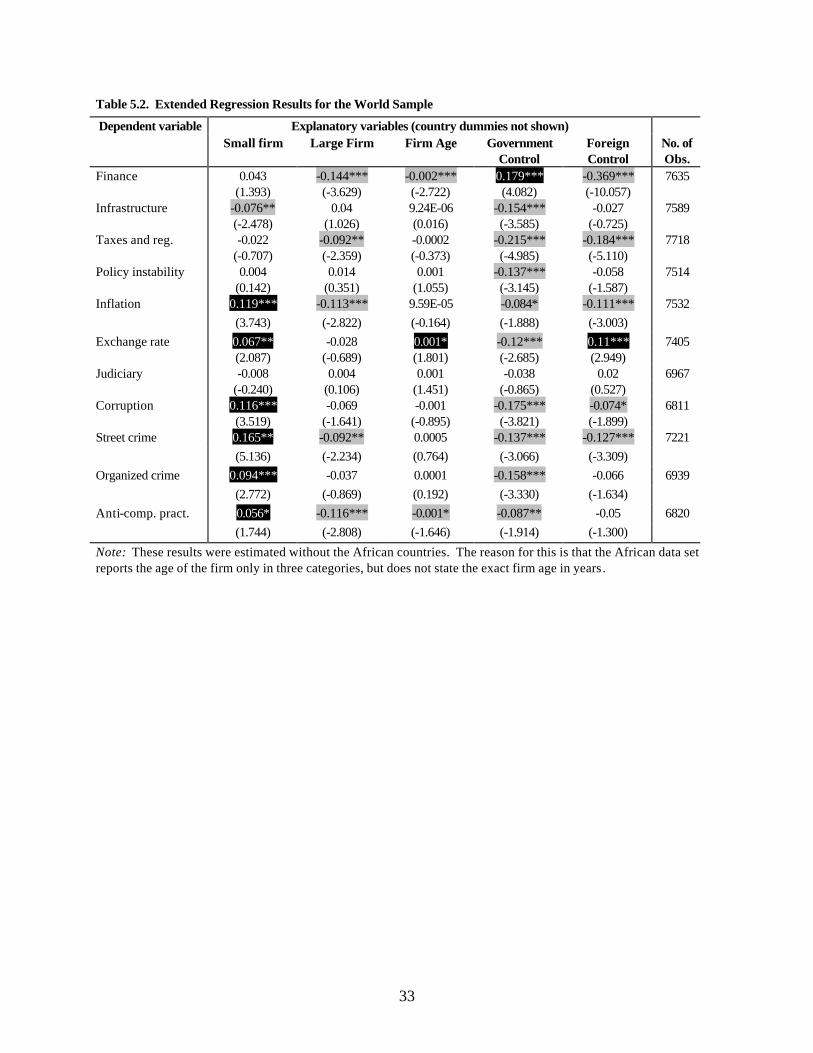
Three variables are jointly added to the previous regression: firm age, a dummy for whether a government or state agency has a financial stake in the ownership of the firm, and a dummy for whether a foreign entity has a financial stake in the ownership. As explained in chapter 2, there are reasons to believe that these three additional firm characteristics can influence the level of obstacles to doing business experienced. Unfortunately, the sample for African firms does not include the exact firm age, so this analysis is done without the African countries. The results are presented in table 5.2. As before, country dummies are added to the regression but are not reported.
Of the three additional variables, the dummy for government participation in ownership turns out to be the most significant, followed by the dummy for foreign control and firm age.
Government participation in ownership is negatively significant for almost all obstacles: for infrastructure, taxes and regulations, policy instability, the exchange rate, corruption, street crime and organized crime at the 1 percent level; for anti-competitive practices at the 5 percent level, and for inflation at the 10 percent level. This means that firms that have the government as an owner face lower obstacle levels than privately owned firms. The only exception to this pattern is finance, for which the government participation in ownership dummy has a highly significant positive coefficient. This indicates that on average government-owned firms find it harder to raise financing than private firms.
Foreign ownership is negatively associated with most obstacles. Firms with foreign control have easier access to financing than locally owned firms, are less hindered by taxes and regulations and suffer less from inflation, corruption and street crime. For the exchange rate, the foreign control dummy is positively significant: that is, foreign-controlled firms have more problems with the exchange rate than the average firm.
Firm age is significant only for three obstacles: negatively for finance and anti-competitive practices and positively for the exchange rate. This means that younger firms find financing more difficult to obtain than older ones, which is very plausible in view of the fact that their reputations are not as well established. Younger firms also have more problems with anti-competitive practices but fewer problems with the exchange rate.
Looking at the firm size dummies in the extended regressions in table 5.2, the dummy for small firms is negatively significant for the following six obstacles: inflation, the exchange rate, corruption, street crime, organized crime and anti-competitive practices. The small firm dummy is positively significant for infrastructure. The dummy for large firms is negatively significant for five obstacles: finance, taxes and regulations, inflation, street crime and anti-competitive practices. Overall, this shows
32
that bigger firms have fewer problems with obstacles to doing business. The only exception is infrastructure, which small firms experience to be less of a problem than medium-sized and large firms.
Comparing this to the results of the basic regression from earlier in chapter 5,24 the introduction of the additional regressors reduces the significance of the firm size dummies, though only to a small degree.25 The main finding of the basic regression—namely, that smaller firms have higher obstacles to doing business than larger ones—remains valid, and the results from the first part of this chapter turn out to be robust.26
24 Due to data problems, the extended regressions had to be estimated without the firms from the African region.
Therefore, correctly, they should be compared to the basic regressions where the sample is also restricted to the world without the African countries. We have done these estimations, and they are presented in appendix E. We found that the results with and without Africa are very similar, so that a comparison of the extended regressions with the basic regressions from earlier in chapter 5 does not hinder the analysis in any way.
25 For infrastructure, the dummy for small firms turns from being insignificant to being positively significant at the 5 percent level.
26 Looking at the correlation matrix of the regressors, the following can be seen for the relationship between the firm size dummies and the additional three regressors. The small firm and the large firm dummy are correlated with firm age by –0.261 and 0.272, respectively; with the government participation in ownership dummy, by 0.257 and –0.108; and with the foreign control dummy, by 0.208 and –0.226. This indicates that smaller firms tend to be younger and that they tend to be more under the control of the state and of foreign entities than the average firm.
33
Table 5.2. Extended Regression Results for the World Sample
Explanatory variables (country dummies not shown) Dependent variable Small firm Large Firm Firm Age Government
Control Foreign Control
No. of Obs.
0.043 -0.144*** -0.002*** 0.179*** -0.369*** 7635 Finance
(1.393) (-3.629) (-2.722) (4.082) (-10.057) -0.076** 0.04 9.24E-06 -0.154*** -0.027 7589 Infrastructure (-2.478) (1.026) (0.016) (-3.585) (-0.725) -0.022 -0.092** -0.0002 -0.215*** -0.184*** 7718 Taxes and reg.
(-0.707) (-2.359) (-0.373) (-4.985) (-5.110) 0.004 0.014 0.001 -0.137*** -0.058 7514 Policy instability
(0.142) (0.351) (1.055) (-3.145) (-1.587) 0.119*** -0.113*** 9.59E-05 -0.084* -0.111*** 7532 Inflation (3.743) (-2.822) (-0.164) (-1.888) (-3.003) 0.067** -0.028 0.001* -0.12*** 0.11*** 7405 Exchange rate (2.087) (-0.689) (1.801) (-2.685) (2.949) -0.008 0.004 0.001 -0.038 0.02 6967 Judiciary
(-0.240) (0.106) (1.451) (-0.865) (0.527) 0.116*** -0.069 -0.001 -0.175*** -0.074* 6811 Corruption (3.519) (-1.641) (-0.895) (-3.821) (-1.899) 0.165** -0.092** 0.0005 -0.137*** -0.127*** 7221 Street crime (5.136) (-2.234) (0.764) (-3.066) (-3.309)
0.094*** -0.037 0.0001 -0.158*** -0.066 6939 Organized crime (2.772) (-0.869) (0.192) (-3.330) (-1.634) 0.056* -0.116*** -0.001* -0.087** -0.05 6820 Anti-comp. pract. (1.744) (-2.808) (-1.646) (-1.914) (-1.300)
Note: These results were estimated without the African countries. The reason for this is that the African data set reports the age of the firm only in three categories, but does not state the exact firm age in years.
34
Chapter 6. Policy Conclusions and Further Considerations
This paper points clearly to some policy conclusions, but also raises a number of open questions for further research and consideration.
First, there is a systematic pattern of bias against small and medium firms in the full world sample. Overall, small firms report more problems than medium-sized firms, which in turn face more obstacles than large firms.
Second, the pattern of bias against small firms is most pronounced in Latin America and the Caribbean and transition economies. This suggests that these areas might be prime targets of efforts to reduce size bias. However, the power to find significant differences in some of the other regions may be low due to data limitations. This comment applies with even more force to the country by country analysis. For instance, for financing we find significant evidence of a bias against smaller firms in a number of emerging markets, including Argentina, Brazil, Colombia, South Africa and Thailand. We also find the opposite pattern—namely, large firms reporting more problems with financing than smaller ones—in two transition economies: Poland and Ukraine. At the very least, this suggests that further country level analysis with larger data sets would be fruitful.
Third, the analysis of different obstacles reveals that the biases are quite consistent across obstacles. This means that in leveling of the playing field is necessary in almost all areas. The bias against small firms is pronounced in financing and this is probably the area where most efforts have been concentrated to date. The findings on taxes and regulations are somewhat difficult to interpret since (by the design of the survey) it is unclear if they refer to the level of taxes, to the tax administration or to regulations in general. Certainly in this area there is scope for further research. The finding that inflation is bad for small firms confirms the belief that sound macroeconomic management is important not only for overall growth in general but for the growth of small firms in particular. Indeed, inflation is not just bad for small firms but also worse than for larger firms. A similar finding relates to the exchange rate: small firms in East Asia and Pacific, with a recent experience of devaluation and perhaps limited hedging possibilities, have suffered most. Then there are a series of obstacles that relate to the bureaucracy and property rights (corruption, street crime, organized crime) where, again, smaller firms report more problems than larger ones. It follows that efforts to level the playing field and improve the rule of law would benefit small entrepreneurs. Finally, there are those obstacles where we did not find differences according to firm size: policy instability and uncertainty, infrastructure and the judiciary. The fact that there are no significant differences among firms in their evaluation of policy uncertainty does not make this an irrelevant area for reform. To the contrary, when we look at the level of obstacles rather than differences among firms, policy uncertainty ranked among the top obstacles. In other words, higher policy stability will help firms of all sizes equally. Infrastructure and the judiciary, on the other hand ranked among the lowest obstacles in all regions. In the case of the judiciary, this may be due to the fact that small and medium-sized firms are unlikely to have much experience with the working of the judiciary. Therefore they are unlikely to report large problems. Moreover, firms may long since have given up on courts and developed alternative conflict resolution mechanisms.

35
Fourth, the patterns of results are very robust. We tested some alternative and complementary explanations for biases in firms’ problems. For instance, large firms may face fewer obstacles simply because they tend to be older and are further down the learning curve. To test this, we included firm age in the estimates. For similar reasons, we also included control of whether firms are in foreign or local control and whether they are privately owned or have government participation in ownership. None of these permutations changes the basic pattern that small firms are worse off than medium and larger ones. All the sensitivity analysis does is to sometimes blur the differences between large and medium-sized firms. Finally, there are some interesting side results:
Firms with government participation in ownership face significantly fewer obstacles than non-private firms—with the notable exception of financing, where they have significantly more problems. This may so because state-owned firms were used to soft budget constraints but may be facing hard ones in the context of tighter fiscal management. Also, on average, government-controlled firms may have more problems receiving private financing.
Foreign-owned firms report significantly fewer problems than local firms, for the most part. This is an interesting finding in itself since the opposite finding would have been equally possible. However, it appears that the advantages of foreign firms (for instance, in bargaining with the government and their power to credibly threaten exit and relocation) dominate over possible disadvantages such as being unfamiliar with the local circumstances.
Firm’s age matters less than expected. Older firms have better access to finance. However, for most obstacles, firm age is not significant.
To conclude, let us reiterate the main finding. We find that a bias against small firms exists: small firms report more problems than medium-sized firms, which in turn face more obstacles than large firms. Assuming that such a bias in the size distribution of firms is indeed damaging for economic development and poverty alleviation, this finding is consistent with programs of support for small and medium-sized enterprise. However, based on the information in the survey, we cannot establish the source of the bias. We cannot distinguish between market-induced problems for smaller firms (which may not necessarily warrant intervention) and government-induced problems, such as bureaucratic discrimination (which would warrant intervention and leveling of the playing field). Certainly this is one of the most important areas for further research.
36
References
Alesina, Alberto, Sule Oezler, Nouriel Roubini and Philip Swagel. 1996. “Political Instability and
Economic Growth.” Journal of Economic Growth 1 (2):189-211. Barro, Robert. 1991. “Economic Growth in a Cross Section of Countries.” Quarterly Journal of
Economics 106 (2):407-43. Brunetti, Aymo, Gregory Kisunko, and Beatrice Weder. 1998a. “Credibility of Rules and Economic
Growth: Evidence from a Worldwide Survey of the Private Sector.” World Bank Economic Review 12 (3):353-84.
———. 1998b. How Businesses See Government: Responses from Private Sector Surveys in 69
Countries. IFC Discussion Paper 33. Washington D.C. ———. 1999. “A Note on an Institutional Bias against Small, Local Firms in Less Developed
Countries.” http://www.unibas.ch/wwz/wifor/staff/bw/survey/new/working_papers.htm
De Soto, Hernando. 1987. The Other Path. New York: Harper and Row. Greene, William H. 1993. Econometric Analysis. Second edition. London: Prentice Hall. Hallberg, Kristin. 2000. A Market Oriented Strategy For Small and Medium Scale Enterprises.
IFC Discussion Paper 40. Washington, D.C. Johnson, Simon, Daniel Kaufmann, and Pablo Zoido-Lobaton. 1998. “Regulatory Discretion and the
Unofficial Economy.” American Economic Review 88 (2):387-92. Kennedy, Peter. 1998 A Guide to Econometrics. Fourth Edition. Cambridge, Massachusetts: The
MIT Press. Knack, Stephen, and Philip Keefer. 1995. “Institutions and Economic Performance: Cross-Country
Tests Using Alternative Institutional Measures.” Economics and Politics 7 (3):207-27. Mauro, Paolo. 1995. “Corruption and Growth.” Quarterly Journal of Economics 110 (3):681-712. Olson, Mancur. 1965. The Logic of Collective Action. Cambridge: Harvard University Press.
37
Appendix A
Region List
Developing Countries All countries listed below, except for the OECD countries.
Africa Botswana, Cameroon, Côte d’Ivoire, Ethiopia, Ghana, Kenya, Madagascar, Malawi, Namibia, Nigeria, Senegal, South Africa, Tanzania, Uganda, Zambia, and Zimbabwe.
East Asia and Pacific Cambodia, China, Indonesia, Malaysia, Philippines, Singapore, and Thailand.
Latin America and the Caribbean Argentina, Belize, Bolivia, Brazil, Chile, Colombia, Costa Rica, Dominican Republic, Ecuador, El Salvador, Guatemala, Haiti, Honduras, Mexico, Nicaragua, Panama, Peru, Trinidad and Tobago, Uruguay, and Republica Bolivariana de Venezuela.
OECD Canada, France, Germany, Italy, Portugal, Spain, Sweden, United Kingdom, and United States.
South Asia Bangladesh, India, and Pakistan.
Transition Economies Albania, Armenia, Azerbaijan, Belarus, Bosnia and Herzegovina, Bulgaria, Croatia, Czech Republic, Estonia, Georgia, Hungary, Kazakhstan, Kyrgyz Republic, Lithuania, Moldova, Poland, Romania, the Russian Federation, Slovak Republic, Slovenia, Turkey, Ukraine, and Uzbekistan.
Other Countries Egypt, Turkey, and Tunisia.
Territories West Bank and Gaza.
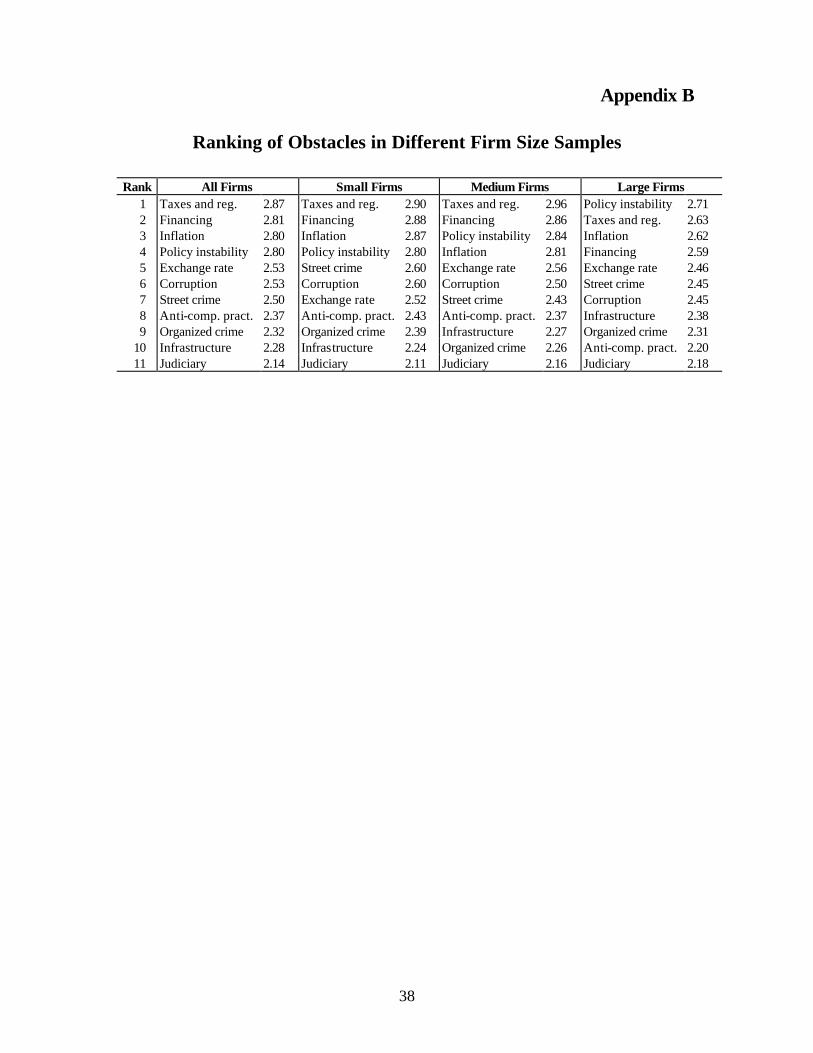
38
Appendix B
Ranking of Obstacles in Different Firm Size Samples
Rank All Firms Small Firms Medium Firms Large Firms 1 Taxes and reg. 2.87 Taxes and reg. 2.90 Taxes and reg. 2.96 Policy instability 2.71 2 Financing 2.81 Financing 2.88 Financing 2.86 Taxes and reg. 2.63 3 Inflation 2.80 Inflation 2.87 Policy instability 2.84 Inflation 2.62 4 Policy instability 2.80 Policy instability 2.80 Inflation 2.81 Financing 2.59 5 Exchange rate 2.53 Street crime 2.60 Exchange rate 2.56 Exchange rate 2.46 6 Corruption 2.53 Corruption 2.60 Corruption 2.50 Street crime 2.45 7 Street crime 2.50 Exchange rate 2.52 Street crime 2.43 Corruption 2.45 8 Anti-comp. pract. 2.37 Anti-comp. pract. 2.43 Anti-comp. pract. 2.37 Infrastructure 2.38 9 Organized crime 2.32 Organized crime 2.39 Infrastructure 2.27 Organized crime 2.31
10 Infrastructure 2.28 Infrastructure 2.24 Organized crime 2.26 Anti-comp. pract. 2.20 11 Judiciary 2.14 Judiciary 2.11 Judiciary 2.16 Judiciary 2.18
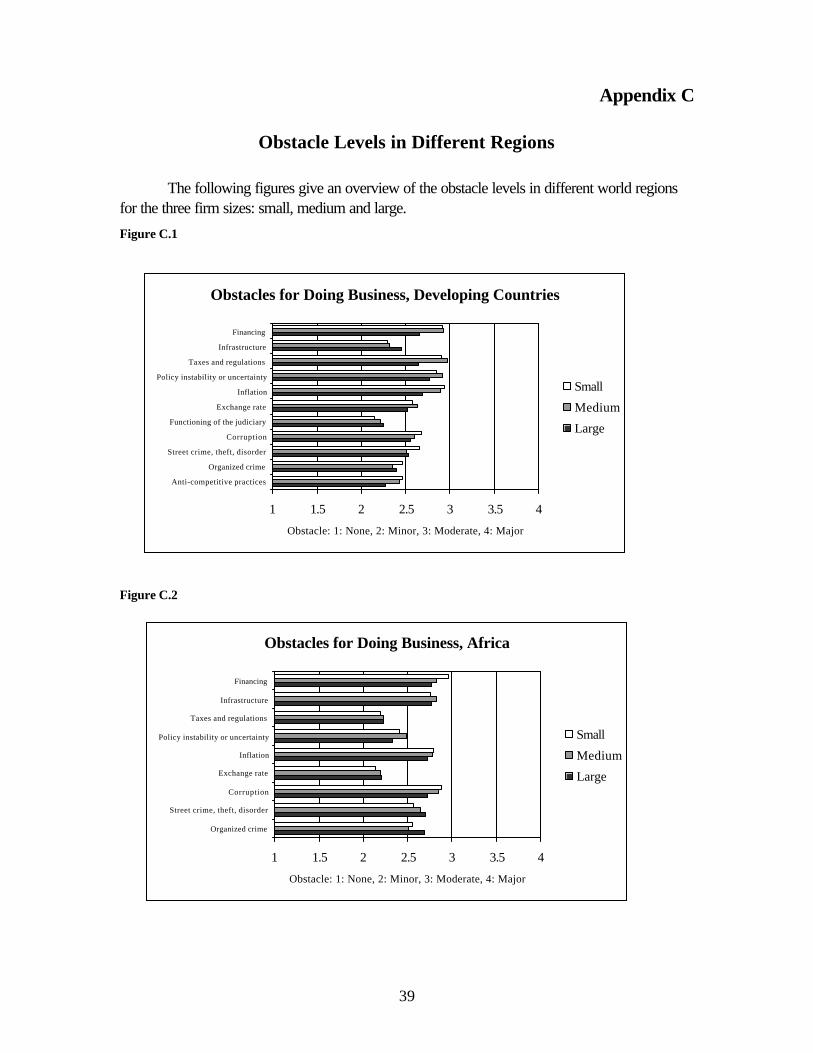
39
Appendix C
Obstacle Levels in Different Regions
The following figures give an overview of the obstacle levels in different world regions for the three firm sizes: small, medium and large.
Figure C.1
Figure C.2
Obstacles for Doing Business, Developing Countries
1 1.5 2 2.5 3 3.5 4
Financing
Infrastructure
Taxes and regulations
Policy instability or uncertainty
Inflation
Exchange rate
Functioning of the judiciary
Corruption
Street crime, theft, disorder
Organized crime
Anti-competitive practices
Obstacle: 1: None, 2: Minor, 3: Moderate, 4: Major
Small
Medium
Large
Obstacles for Doing Business, Africa
1 1.5 2 2.5 3 3.5 4
Financing
Infrastructure
Taxes and regulations
Policy instability or uncertainty
Inflation
Exchange rate
Corruption
Street crime, theft, disorder
Organized crime
Obstacle: 1: None, 2: Minor, 3: Moderate, 4: Major
Small
Medium
Large
40
Figure C.3
Figure C.4
Obstacles for Doing Business, East Asia
1 1.5 2 2.5 3 3.5 4
Financing
Infrastructure
Taxes and regulations
Policy instability or uncertainty
Inflation
Exchange rate
Functioning of the judiciary
Corruption
Street crime, theft, disorder
Organized crime
Anti-competitive practices
Obstacle: 1: None, 2: Minor, 3: Moderate, 4: Major
Small
Medium
Large
Obstacles for Doing Business, Latin America
1 1.5 2 2.5 3 3.5 4
Financing
Infrastructure
Taxes and regulations
Policy instability or uncertainty
Inflation
Exchange rate
Functioning of the judiciary
Corruption
Street crime, theft, disorder
Organized crime
Anti-competitive practices
Obstacle: 1: None, 2: Minor, 3: Moderate, 4: Major
Small
Medium
Large
41
Figure C.5
Figure C.6
Obstacles for Doing Business, South Asia
1 1.5 2 2.5 3 3.5 4
Financing
Infrastructure
Taxes and regulations
Policy instability or uncertainty
Inflation
Exchange rate
Functioning of the judiciary
Corruption
Street crime, theft, disorder
Organized crime
Anti-competitive practices
Obstacle: 1: None, 2: Minor, 3: Moderate, 4: Major
Small
Medium
Large
Obstacles for Doing Business, Transition Economies
1 1.5 2 2.5 3 3.5 4
Financing
Infrastructure
Taxes and regulations
Policy instability or uncertainty
Inflation
Exchange rate
Functioning of the judiciary
Corruption
Street crime, theft, disorder
Organized crime
Anti-competitive practices
Obstacle: 1: None, 2: Minor, 3: Moderate, 4: Major
Small
Medium
Large
42
Figure C.7
Obstacles for Doing Business, OECD
1 1.5 2 2.5 3 3.5 4
Financing
Infrastructure
Taxes and regulations
Policy instability or uncertainty
Inflation
Exchange rate
Functioning of the judiciary
Corruption
Street crime, theft, disorder
Organized crime
Anti-competitive practices
Obstacle: 1: None, 2: Minor, 3: Moderate, 4: Major
Small
Medium
Large
43
Appendix D
Country Regressions
Table D.1. Basic Regression Results for the Country Samples
Dependent variable
Financing Policy Instability Corruption
Independent variables
Small firm Large firm Small firm Large firm Small firm Large firm
Argentina 0.095 -0.478* -0.057 -0.383 -0.207 -0.261 (0.368) (-1.657) (-0.222) (-1.335) (-0.801) (-0.915) Bangladesh -0.029 0.152 0.025 0.029 0.973*** -0.106 (-0.118) (0.441) (0.103) (0.085) (3.662) (-0.262) Belarus -0.279 -0.255 0.709*** -0.628* (-1.119) (-0.773) (2.690) (-1.866) (0.000) (0.000) Bolivia 0.002 -0.177 -0.454* 0.172 -0.546* -0.349 (0.007) (-0.639) (-1.751) (0.622) (-1.754) (-1.066) Bosnia & Herz. -0.029 0.152 0.025 0.029 0.973*** -0.106 (-0.118) (0.441) (0.103) (0.085) (3.662) (-0.262) Botswana -0.01 -0.271 a/ a/
(-0.037) (-0.823) Brazil -0.342 -0.458* -0.123 0.1 -0.005 -0.197 (-1.528) (-2.006) (-0.526) (0.404) (-0.023) (-0.849) Bulgaria 0.342 -0.457 0.261 -0.339 0.339 -0.066 (1.476) (-1.204) (1.226) (-0.943) (1.537) (-0.175) Cambodia 0.344* 0.168 -0.189 -0.098 b/
(1.704) (0.609) (-0.963) (-0.364) Cameroon 0.68* 0.31 -0.239 -0.664 c/
(1.744) (0.726) (-0.592) (-1.325) Canada 0.356 -0.689** 0.355 -0.146 a/
(1.308) (-2.444) (1.321) (-0.546) Chile 0.303 0.067 -0.037 0.092 0.253 0.109 (1.134) (0.254) (-0.140) (0.353) (0.911) (0.395) China 0.401 -0.039 0.639** 0.553* 0.044 0.159 (1.375) (-0.125) (0.016) (0.065) (0.167) (0.521) Colombia -0.394 -0.575** 0.002 0.106 -0.226 -0.156 (-1.179) (-2.385) (0.005) (0.421) (-0.674) (-0.653) Costa Rica 0.289 1.01* 0.05 -0.088 0.152 -0.412* (-0.476) (-1.946) (0.175) (-0.360) (0.534) (-1.681) Côte d’Ivoire 0.717** 0.647** 0.275 -0.238 -0.168 -0.068 (2.301) (2.126) (0.907) (-0.834) (-0.540) (-0.226) Croatia 0.211 0.143 0.108 0.073 0.122 0.055 (0.807) (0.538) (0.446) (0.298) (0.502) (0.220) Czech Republic 0.143 -0.048 0.298 -0.224 0.245 -0.415 (0.642) (-0.122) (1.362) (-0.601) (1.054) (-0.982) Dom. Republic 0.028 -0.52** 0.036 0.307 0.057 0.172 (0.100) (-2.188) (0.134) (1.313) (0.207) (0.728) Ecuador -0.166 -0.142 0.145 0.38 -0.171 0.022 (-0.562) (-0.497) (0.466) (1.119) (-0.563) (0.069) Egypt -0.495 -0.721* -1.13** -0.242 -0.628 -1.05*** (-0.906) (-1.707) (-2.372) (-0.627) (-1.309) (-2.699)
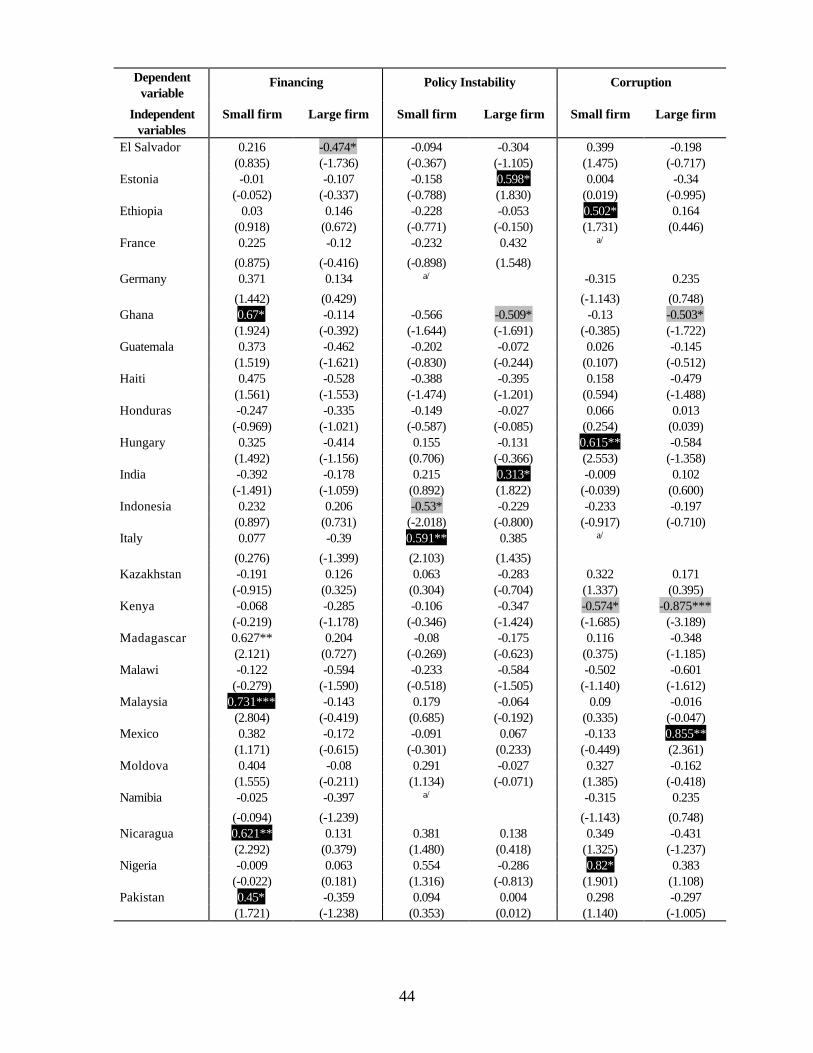
44
Dependent variable
Financing Policy Instability Corruption
Independent variables
Small firm Large firm Small firm Large firm Small firm Large firm
El Salvador 0.216 -0.474* -0.094 -0.304 0.399 -0.198 (0.835) (-1.736) (-0.367) (-1.105) (1.475) (-0.717) Estonia -0.01 -0.107 -0.158 0.598* 0.004 -0.34 (-0.052) (-0.337) (-0.788) (1.830) (0.019) (-0.995) Ethiopia 0.03 0.146 -0.228 -0.053 0.502* 0.164 (0.918) (0.672) (-0.771) (-0.150) (1.731) (0.446) France 0.225 -0.12 -0.232 0.432 a/
(0.875) (-0.416) (-0.898) (1.548) Germany 0.371 0.134 a/ -0.315 0.235
(1.442) (0.429) (-1.143) (0.748) Ghana 0.67* -0.114 -0.566 -0.509* -0.13 -0.503* (1.924) (-0.392) (-1.644) (-1.691) (-0.385) (-1.722) Guatemala 0.373 -0.462 -0.202 -0.072 0.026 -0.145 (1.519) (-1.621) (-0.830) (-0.244) (0.107) (-0.512) Haiti 0.475 -0.528 -0.388 -0.395 0.158 -0.479 (1.561) (-1.553) (-1.474) (-1.201) (0.594) (-1.488) Honduras -0.247 -0.335 -0.149 -0.027 0.066 0.013 (-0.969) (-1.021) (-0.587) (-0.085) (0.254) (0.039) Hungary 0.325 -0.414 0.155 -0.131 0.615** -0.584 (1.492) (-1.156) (0.706) (-0.366) (2.553) (-1.358) India -0.392 -0.178 0.215 0.313* -0.009 0.102 (-1.491) (-1.059) (0.892) (1.822) (-0.039) (0.600) Indonesia 0.232 0.206 -0.53* -0.229 -0.233 -0.197 (0.897) (0.731) (-2.018) (-0.800) (-0.917) (-0.710) Italy 0.077 -0.39 0.591** 0.385 a/
(0.276) (-1.399) (2.103) (1.435) Kazakhstan -0.191 0.126 0.063 -0.283 0.322 0.171 (-0.915) (0.325) (0.304) (-0.704) (1.337) (0.395) Kenya -0.068 -0.285 -0.106 -0.347 -0.574* -0.875*** (-0.219) (-1.178) (-0.346) (-1.424) (-1.685) (-3.189) Madagascar 0.627** 0.204 -0.08 -0.175 0.116 -0.348 (2.121) (0.727) (-0.269) (-0.623) (0.375) (-1.185) Malawi -0.122 -0.594 -0.233 -0.584 -0.502 -0.601 (-0.279) (-1.590) (-0.518) (-1.505) (-1.140) (-1.612) Malaysia 0.731*** -0.143 0.179 -0.064 0.09 -0.016 (2.804) (-0.419) (0.685) (-0.192) (0.335) (-0.047) Mexico 0.382 -0.172 -0.091 0.067 -0.133 0.855** (1.171) (-0.615) (-0.301) (0.233) (-0.449) (2.361) Moldova 0.404 -0.08 0.291 -0.027 0.327 -0.162 (1.555) (-0.211) (1.134) (-0.071) (1.385) (-0.418) Namibia -0.025 -0.397 a/ -0.315 0.235
(-0.094) (-1.239) (-1.143) (0.748) Nicaragua 0.621** 0.131 0.381 0.138 0.349 -0.431 (2.292) (0.379) (1.480) (0.418) (1.325) (-1.237) Nigeria -0.009 0.063 0.554 -0.286 0.82* 0.383 (-0.022) (0.181) (1.316) (-0.813) (1.901) (1.108) Pakistan 0.45* -0.359 0.094 0.004 0.298 -0.297 (1.721) (-1.238) (0.353) (0.012) (1.140) (-1.005)
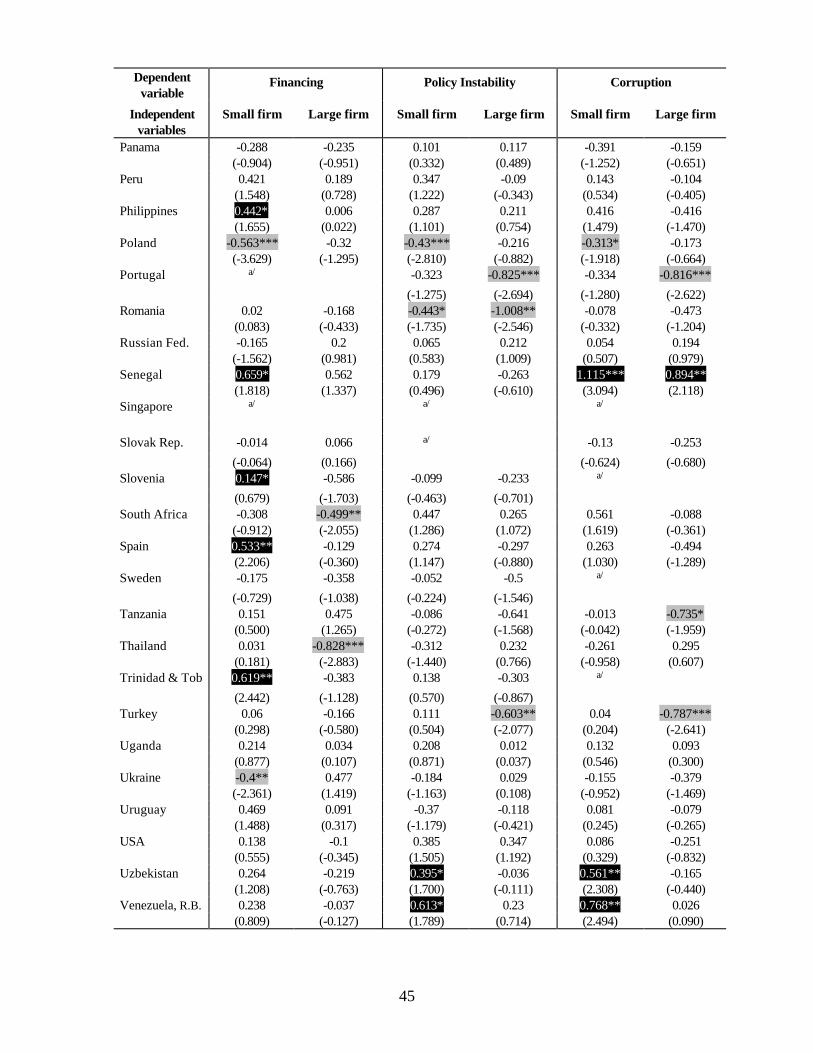
45
Dependent variable
Financing Policy Instability Corruption
Independent variables
Small firm Large firm Small firm Large firm Small firm Large firm
Panama -0.288 -0.235 0.101 0.117 -0.391 -0.159 (-0.904) (-0.951) (0.332) (0.489) (-1.252) (-0.651) Peru 0.421 0.189 0.347 -0.09 0.143 -0.104 (1.548) (0.728) (1.222) (-0.343) (0.534) (-0.405) Philippines 0.442* 0.006 0.287 0.211 0.416 -0.416 (1.655) (0.022) (1.101) (0.754) (1.479) (-1.470) Poland -0.563*** -0.32 -0.43*** -0.216 -0.313* -0.173 (-3.629) (-1.295) (-2.810) (-0.882) (-1.918) (-0.664) Portugal a/ -0.323 -0.825*** -0.334 -0.816***
(-1.275) (-2.694) (-1.280) (-2.622) Romania 0.02 -0.168 -0.443* -1.008** -0.078 -0.473 (0.083) (-0.433) (-1.735) (-2.546) (-0.332) (-1.204) Russian Fed. -0.165 0.2 0.065 0.212 0.054 0.194 (-1.562) (0.981) (0.583) (1.009) (0.507) (0.979) Senegal 0.659* 0.562 0.179 -0.263 1.115*** 0.894** (1.818) (1.337) (0.496) (-0.610) (3.094) (2.118) Singapore a/ a/ a/
Slovak Rep. -0.014 0.066 a/ -0.13 -0.253
(-0.064) (0.166) (-0.624) (-0.680) Slovenia 0.147* -0.586 -0.099 -0.233 a/
(0.679) (-1.703) (-0.463) (-0.701) South Africa -0.308 -0.499** 0.447 0.265 0.561 -0.088 (-0.912) (-2.055) (1.286) (1.072) (1.619) (-0.361) Spain 0.533** -0.129 0.274 -0.297 0.263 -0.494 (2.206) (-0.360) (1.147) (-0.880) (1.030) (-1.289) Sweden -0.175 -0.358 -0.052 -0.5 a/
(-0.729) (-1.038) (-0.224) (-1.546) Tanzania 0.151 0.475 -0.086 -0.641 -0.013 -0.735* (0.500) (1.265) (-0.272) (-1.568) (-0.042) (-1.959) Thailand 0.031 -0.828*** -0.312 0.232 -0.261 0.295 (0.181) (-2.883) (-1.440) (0.766) (-0.958) (0.607) Trinidad & Tob 0.619** -0.383 0.138 -0.303 a/
(2.442) (-1.128) (0.570) (-0.867) Turkey 0.06 -0.166 0.111 -0.603** 0.04 -0.787*** (0.298) (-0.580) (0.504) (-2.077) (0.204) (-2.641) Uganda 0.214 0.034 0.208 0.012 0.132 0.093 (0.877) (0.107) (0.871) (0.037) (0.546) (0.300) Ukraine -0.4** 0.477 -0.184 0.029 -0.155 -0.379 (-2.361) (1.419) (-1.163) (0.108) (-0.952) (-1.469) Uruguay 0.469 0.091 -0.37 -0.118 0.081 -0.079 (1.488) (0.317) (-1.179) (-0.421) (0.245) (-0.265) USA 0.138 -0.1 0.385 0.347 0.086 -0.251 (0.555) (-0.345) (1.505) (1.192) (0.329) (-0.832) Uzbekistan 0.264 -0.219 0.395* -0.036 0.561** -0.165 (1.208) (-0.763) (1.700) (-0.111) (2.308) (-0.440) Venezuela, R.B. 0.238 -0.037 0.613* 0.23 0.768** 0.026 (0.809) (-0.127) (1.789) (0.714) (2.494) (0.090)
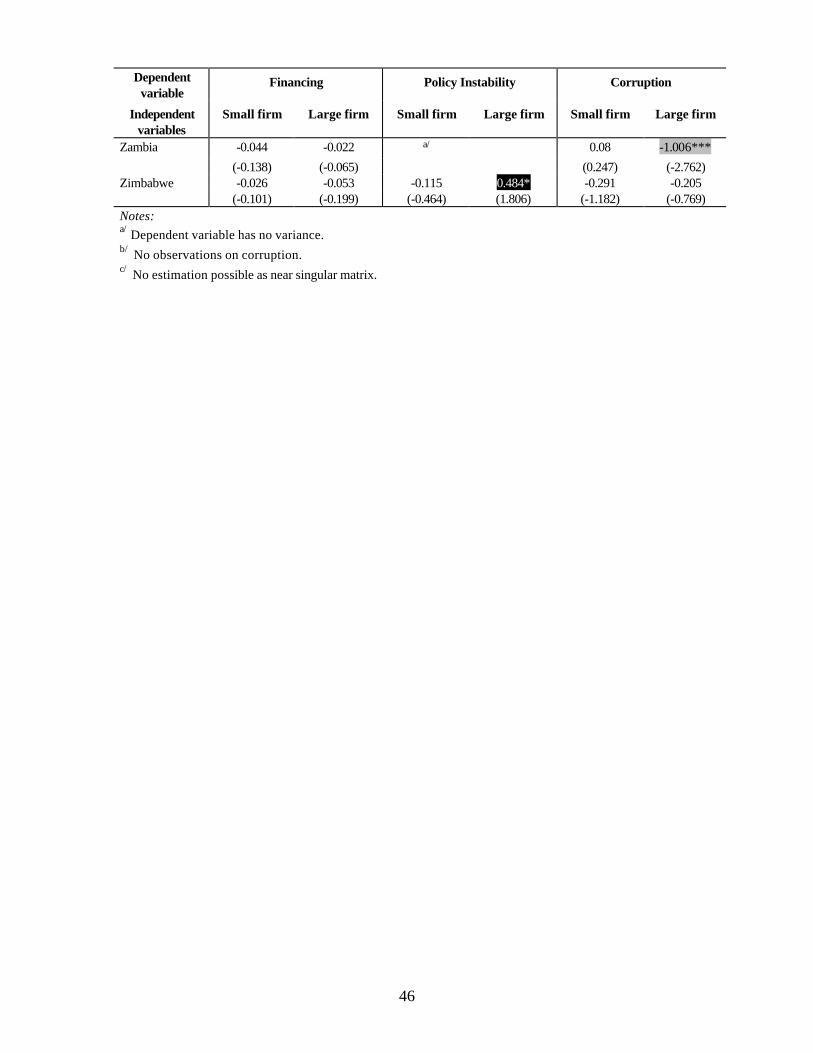
46
Dependent variable
Financing Policy Instability Corruption
Independent variables
Small firm Large firm Small firm Large firm Small firm Large firm
Zambia -0.044 -0.022 a/ 0.08 -1.006***
(-0.138) (-0.065) (0.247) (-2.762) Zimbabwe -0.026 -0.053 -0.115 0.484* -0.291 -0.205 (-0.101) (-0.199) (-0.464) (1.806) (-1.182) (-0.769) Notes: a/ Dependent variable has no variance. b/ No observations on corruption. c/ No estimation possible as near singular matrix.
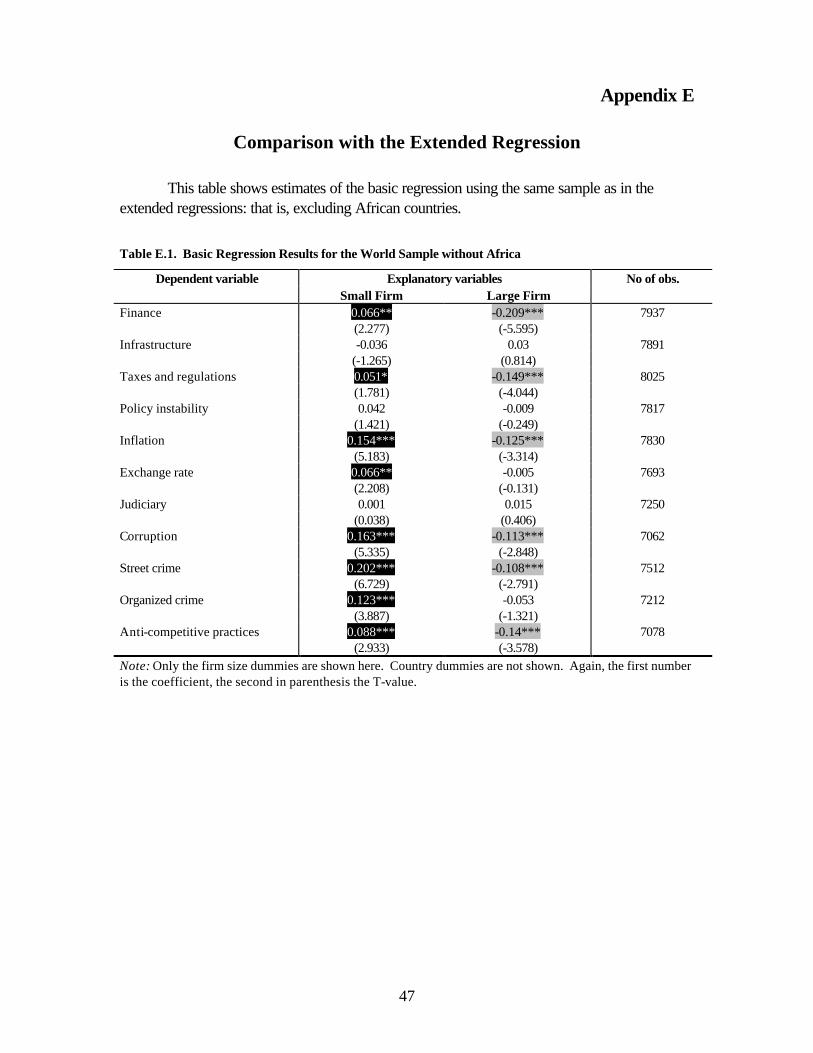
47
Appendix E
Comparison with the Extended Regression
This table shows estimates of the basic regression using the same sample as in the extended regressions: that is, excluding African countries.
Table E.1. Basic Regression Results for the World Sample without Africa
Dependent variable Explanatory variables Small Firm Large Firm
No of obs.
Finance 0.066** -0.209*** 7937 (2.277) (-5.595) Infrastructure -0.036 0.03 7891 (-1.265) (0.814) Taxes and regulations 0.051* -0.149*** 8025 (1.781) (-4.044) Policy instability 0.042 -0.009 7817 (1.421) (-0.249) Inflation 0.154*** -0.125*** 7830 (5.183) (-3.314) Exchange rate 0.066** -0.005 7693 (2.208) (-0.131) Judiciary 0.001 0.015 7250 (0.038) (0.406) Corruption 0.163*** -0.113*** 7062 (5.335) (-2.848) Street crime 0.202*** -0.108*** 7512 (6.729) (-2.791) Organized crime 0.123*** -0.053 7212 (3.887) (-1.321) Anti-competitive practices 0.088*** -0.14*** 7078 (2.933) (-3.578) Note: Only the firm size dummies are shown here. Country dummies are not shown. Again, the first number is the coefficient, the second in parenthesis the T-value.