
Firm Organization and Market Structure: Centralization...
31
Firm Organization and Market Structure: Centralization vs. Decentralization Kieron Meagher, Wen. Wang February 27, 2008 Abstract The profitability of a firm is jointly determined by the market structure and the firm’s organizational structure. To explore the re- lationship between these two structures, a real-time information pro- cessing model in a dynamic duopoly environment is developed, which allows us to examine the effects of the product market competition and the cost of delay. It is found that Decentralization tends to out- perform centralization when product market competition is intense due to the cost of delay associated with centralization. This result is supported by several empirical papers, such as Acemoglu et al. (2006) and Meagher and Wait (2006). Keywords:Organizational Structure; Decentralization; Market Struc- ture; Product Market Competition; Real-time Information Processing 1 Introduction The performance of a firm is jointly determined by the external environment – ‘market structure’ and internal environment – ‘organizational structure’. ‘Market structure’ consists of the factors in a market which affect the pay- offs of firm decision making. Product market competition is argued to be one of the most important factors in market structure, and other factors include the distribution of consumer tastes, consumer sensitivity to firm operations, and so on. ‘Organizational structure’ determines the architecture of an organization: who collects information, with whom information is communicated, and how decisions are made, which affect the quality of decision making. The two organizational forms that we will discuss in this thesis are ‘Centralization’ 1
Transcript of Firm Organization and Market Structure: Centralization...

Firm Organization and Market Structure:Centralization vs. Decentralization
Kieron Meagher, Wen. Wang
February 27, 2008
Abstract
The profitability of a firm is jointly determined by the marketstructure and the firm’s organizational structure. To explore the re-lationship between these two structures, a real-time information pro-cessing model in a dynamic duopoly environment is developed, whichallows us to examine the effects of the product market competitionand the cost of delay. It is found that Decentralization tends to out-perform centralization when product market competition is intensedue to the cost of delay associated with centralization. This result issupported by several empirical papers, such as Acemoglu et al. (2006)and Meagher and Wait (2006).
Keywords:Organizational Structure; Decentralization; Market Struc-ture; Product Market Competition; Real-time Information Processing
1 Introduction
The performance of a firm is jointly determined by the external environment– ‘market structure’ and internal environment – ‘organizational structure’.
‘Market structure’ consists of the factors in a market which affect the pay-offs of firm decision making. Product market competition is argued to be oneof the most important factors in market structure, and other factors includethe distribution of consumer tastes, consumer sensitivity to firm operations,and so on.
‘Organizational structure’ determines the architecture of an organization:who collects information, with whom information is communicated, and howdecisions are made, which affect the quality of decision making. The twoorganizational forms that we will discuss in this thesis are ‘Centralization’
1

and ‘Decentralization’. Under centralization, the decision making authorityis vested in the headquarters; while under decentralization, the decision mak-ing is delegated to the local managers who have superior local information(Kruisinga 1954).
Understanding the relationship between organizational structure and mar-ket structure is important, because the external and internal environmentswork together to determine the profitability of the firm. Thus, there is not asingle best organizational structure for a firm, instead, we are looking for afit between the organizational structure and market structure.
This thesis attempts to address two questions. Does market structurehave any impact on the performance of an organizational structure? If so,how does the market structure affect the firm’s optimal organizational struc-ture?
Only a small and recent literature has studied the relationship betweenorganizational structure and market structure.
Meagher (1996) pioneered the analysis which explores the relationshipbetween organization structure and market structure as described by a real-time information processing model for the case of a dynamic monopoly.
Chang and Harrington (2003) enriches the market environment by intro-ducing product market competition. They draw the conclusion that central-ization tends to outperform decentralization when product market compe-tition is intense. However, the opposite results have been found by severalempirical papers, that product market competition favors decentralization(Acemoglu et al. 2006; Meagher and Wait 2006).
We argue that Chang and Harrington have ignored an important factorin organization, namely, that individuals have limited capacities in com-municating, formulating and processing, which is well known as ‘boundedrationality’.
‘Bounded rationality’ was first suggested by Simon (1955). The concept ofbounded rationality revises the traditional ‘rational choice theory’ to accountfor the fact that perfectly rational decisions are often not desirable in practicedue to the finite computational resources available for making them.
It is suggested by Van Zandt (1999) that it is important to recognizeboundedness of rationality of economic decision makers in studying eco-nomics of organization.
The economies of today’s industrialized nations are dominated by giantfirms, each with hundreds or even thousands of employees. A single personcannot be in control of everything. Hence, instead of treating a firm as aunitary ‘entrepreneur’, bent on maximizing profit, we should consider a firmas an organization of economic agents of bounded rationality (Radner 1992).
To synthesise Chang and Harrington (2003) and Meagher (1996), this the-
2

sis develops a real-time information processing model in a dynamic duopolyenvironment, which allows us to consider the effects of the product marketcompetition as well as the cost of delay. In this computational model ofchain stores, consumers keep searching among stores for a better match, andstore managers continually search for better practices. In addition, new dataabout the environment arrives from time to time in each chain, and decisionsare correspondingly revised that are computed from the lagged informationunder centralization.
The major finding of this thesis is that the choice of organizational struc-ture is affected by the market structure, and the relative performance ofdecentralization is superior when the product market competition is moreintense. This finding is consistent with the results found by several recentempirical papers (Acemoglu et al. 2006; Meagher and Wait 2006), that firmsare more likely to decentralize in a more competitive product market.
The organization of the paper is following. Section 2 presents the com-putational model used. Section 3 presents the simulation design. Section4 discusses the results. Section 5 presents the sensitivity analysis. Finally,Section 6 concludes and discusss the limitations as well as the future research.
2 Computational Model
The major weakness of the model of Chang and Harrington (2003) is that itdoes not consider the bounded rationality on the part of organization. Theyassume that information processing is effortless and occurs on the spot.
However, Simon (1955) introduced the concept of ‘bounded rationality’,which indicates that boundedly rational agents experience limits in commu-nicating and processing information. Van Zandt (1999) also suggests thatrecognizing the boundedness of rationality is important to study seriouslythe economics of organization.
To synthesise Chang and Harrington (2003), Meagher (1996) and Radnerand Van Zandt (2001), a reduced form of real-time decentralized informationprocessing dynamic computational model will be developed in the duopolycase.
Bounded rationality has been introduced to this model, in which thecost of delay is considered. Our approach is different from Radner (1993).Delay is modeled as the time taken to transmit information between the storemanagers and the corporate headquarters instead of computational delay. Itis assumed that when information is acquired by or generated internally, eachmember of the firm who uses this information must invest some time to doso.
3

2.1 Market Setup
There are two chains a and b competing in M distinct geographic markets.Each chain is modeled as a corporate headquarters (HQ) and M stores. Eachstore serves one single market. For each store, there are two organizationalstructures available: ‘Centralization’ and ‘Decentralization’, which are de-noted by ‘C’ and ‘D’ respectively.
The operations of each store are viewed as a bundle of practices/attributesover N dimensions, such as ease of access, selection and quality of prod-ucts, style of trading, service offered, and so on(Lancaster 1966; Mintel In-ternational Group Limited 1995). Specifically, the operations of chain j’sstore in market h in period t is fully described by an N-dimensional vectorzj,h(t) ≡ (zj,h
1 (t), zj,h2 (t), ..., zj,h
N (t)) ∈ {1, 2, ..., R}N , where zj,h(t) is the over-all operations of the store, zj,h
k (t) is the practice for the kth dimension ofthe store’s operations, and R is number of feasible practices for each the Ndimensions. All the dimensions are independent of each other.
There is a constant number of consumers C in each market. Each con-sumer i is defined as a bundle of preferences over these N dimensions ofthe store’s operations, wi ≡ (wi
1, wi2, ..., w
iN) ∈ {1, 2, ..., R}, which is drawn
independently across markets. Each consumer’s actual type is a randomdraw from a distribution that is parameterized by her ‘primary type’ overN dimensions. If a consumer’s primary type is s , then her actual type isa random draw from {s − E, ..., s + E}N ⊂ {1, 2, ..., R}N , according to auniform distribution where E is a parameter. Each consumer’s primary typeis a one dimensional vector, which is drawn from a triangular density distri-bution over {Sh −G, ..., Sh + G} ⊂ {1, 2, ..., R}, where Sh denotes the meanof the market h, and G denotes intra-market heterogeneity, which measureshow different the consumers’ tastes are within a market. The difference ofthe means between market h′ and market h′′ is measured by α = |Sh′ −Sh′′ |,where α is inter-market heterogeneity.
2.2 Organizational Structure and Decision Making
Store managers continually search for better practices in each period throughgeneration, evaluation and implementation of innovation ideas. This processis described in the following.
2.2.1 Generation of Innovation Ideas
Innovation is modeled as a random search carried out in a fixed space ofideas. In each period, each store generates one idea. An idea is created by
4

randomly selecting a value from {1,...,R} over a randomly selected dimensionfrom {1,...,N}.
Consider an example with 5 dimensions and 100 feasible practices. Sup-pose that the current store practice is (24, 77, 43, 52, 12), and an adoption ofan innovation involves changing the practice in the second dimension from77 to 59. Then the new store practice becomes (24, 59, 43, 52, 12).
2.2.2 Evaluation and Implementation of Innovation Ideas
In Chang and Harrington (2003)’s model, there is no information processingdelay. They assume that information processing is effortless and occurs onthe spot.
However, Radner (1993) suggests that it takes time to process informa-tion. To quantify the cost of delay, we need a temporal decision problem inwhich current decisions are computed from lagged information (Van Zandt2003).
Thus, a reduced form of the cost of delay approach is adopted in thismodel. It is assumed that it involves one period delay for the transmis-sion of information between store managers and the HQ, such that, for eachperiod, store managers send local information to the HQ, and then receivethe aggregated information from the HQ. The processing of this informationtransmission takes one period in total.
Under decentralization, in each period, each store manager generates oneinnovation idea. In each period, any store’s set of innovation ideas comefrom two sources: (1) the idea generated by the store itself, and (2) the storemanager receives, via the HQ, the ideas adopted by other stores under thesame chain in the previous period. The store manager sequentially evaluatesall of these ideas, and adopts the idea which raises the store’s profit the most,and then sends this profitable idea to the HQ. If none of the innovation ideasraise its profit, it discards all, and the practices of the store remain the sameas the practices in the previous period.
Modeling the inter-store learning under decentralization is still possible,but due to the information transmission delay, in each period, each store canonly observe the ideas adopted by other stores in the previous period. Asemphasized by Chang and Harrington (2003), decentralization also involvesan implicit cost. When the practices of each store drift away from each otherin order to adapt the local market, it is less likely for the store to learnfrom the ideas adopted by other stores, which in turn, hampers the effectivelearning between stores.
Under centralization, each store manager generates one innovation idea ineach period, and evaluates this idea. If the idea raises the store’s own profit,
5

store manager sends it to the HQ, otherwise discards it at the local level.At the end of each period, the local information about the current consumerbase and store profit in each market are sent to the HQ as well. Note that,due to the information transmission delay, in each period, all the informationavailable to the HQ is the innovation ideas and local information sent by storemanagers in the previous period. Based on the lagged information, the HQevaluates all the ideas sequentially, and implements the idea which raises thechain’s overall profit the most throughout the chain. If none of them raisesthe chain’s overall profit, then the HQ discards all of them, and the practicesof the chain remain the same.
It is also assumed that the HQ does not have detailed information ofstores’ markets. Information about the current consumer base and the storeprofit in each market is aggregated at the HQ level, on which the evaluationof innovation ideas is based. Inter-store learning is relatively effective undercentralization in the sense that it promotes the spillover of profitable ideasacross all the stores under the chain.
In both the centralization and decentralization cases, the evaluation ofinnovation ideas is based on the current consumers γj,h(t), who just consumedfrom the store.
Once the idea is decided, implementation of innovation ideas has to bedone. Under decentralization, store managers have the authority to imple-ment ideas, while, under centralization, this authority rests with HQ only,who does not have detailed information of store’s markets so that it eitherimplements a practice throughout the chain or not at all. This implies thatcentralization imposes uniform practices across all the stores in the chain.Once an innovation idea is implemented, the store’s practice in the specifieddimension is changed to the new value.
2.3 Consumer Search and Demand
2.3.1 Consumer Search
Bounded rationality on the consumer part suggests that consumers cannot bethinking about which store to purchase from every hour, or even every weekdue to their ‘attention budget’. Instead, a consumer rethinks such decisionsfrom time to time regularly or at some random intervals (Radner 2003).
In our model, consumer search proceeds as follows. A consumer enterseach period with a ‘favourite store’ which she currently prefers. In eachperiod, with probability Q ∈ [0, 1], a consumer engages in search, whichinvolves searching all the stores in the market, and then buying from thestore which gives her highest utility. Her favourite store is then changed to
6

the store that she has just purchased from. With probability 1−Q, she doesnot search and buys from her current favourite store.
Note that if Q = 0, then each consumer has absolute loyalty to herfavourite store, in such case, no consumer searches or switches stores in eachperiod, and each chain acts as a monopolist. On the other hand, if Q = 1,then all consumers search in each period, but it does not necessarily lead tozero loyalty, as they may search without switching stores.
2.3.2 Demand/Consumption
The distance between a consumer’s ideal store practices and store’s actualpractices is called the ‘preference distance’, which is measured by a function
of Euclidian distance,√∑N
k=1 (zk − wk)2.
A consumer ranks stores according to this preference distance. A smalldistance indicates that the store’s actual practices stay close to the con-sumer’s preference, which implies that the consumer’s utility is high. On theother hand, a large distance implies that the store’s actual practices are faraway from the consumer’s ideal practices, which leads to a low consumer util-ity. A consumer’s decision on which store to purchase from is based on therank of preference distance. A consumer buys from the store with smallestpreference distance.
Once a consumer decides which store to purchase from, the number ofunits demanded by the consumer depends by the preference distance as well,which is specified as
A−
√√√√N∑
k=1
(zk − wk)2
σ
(1)
This is decreasing in the preference distance, so that a consumer buysmore if she is more satisfied by the store practices. A is specified as theminimum value to ensure the positive demand for each consumer, A =√∑N
k=1 (R/2 + G + E)2 1, and σ measures the sensitivity of the consumer
responding to store practices.Defining γj,h(t) to be the set of consumers that are shopping at chain j’s
store in market h in period t, then this store’s profit in period t is specifiedas
1(R/2 + G + E) is the maximum distance between a consumer’s preference and store’sactual practice in each dimension.
7

πj,h(t) =∑
i∈γj,h(t)
A−
√√√√N∑
k=1
(zk − wk)2
σ
(2)
This is the sum of consumers’ demands as the price is set to one, andcosts are normalized to zero. A chain’s profit is the sum of profits of all thestores under this chain.
For the purpose of comparison, all the profits are scaled to one, by dividingeach store’s nominal profit πj,h(t) by
∑Ci=1 Aσ. 2
3 Simulation Design
3.1 Parameters
The simulation program is written in MatLab. Since there is no pre-developedsoftware for this type of joint agent-market simulation, we had to write ourown program.
Simulations were run with sets of parameters with different values, asshown in Table 1. For each set of parameter values, the computational ex-periment consists of X replications of the procedures over T periods describedin the ‘Computational Model’ section.
Each replication involves a randomly drawn market set-up, generation ofinnovations, so each replication is independent of the rest. 3
There are three geographically distinct markets M = 3, which are defined
2∑C
i=1 (A− 0)σ is the maximum demand/profit which a store can get, which assumesthat all the consumers in the market buy from the store, and the preference distance iszero for each of them.
3For each replication, the same initial practices and the same sequence of ideas foreach store are used under both organizational forms, so that we are able to control for twosources of randomness.
8

Table 1: Table of Model Parameters:
Parameters Values
Number of Replications (X) {1, 400}Number of Periods (T ) {100, 500, 1000}Number of Markets (M) {2, 3}Number of Consumers (C) {100, 800}Number of Dimensions (N) {2, 5, 10}Fluctuation to Consumers’ Primary Types (E) {0, 2}Feasible Practices for Each Dimension (R) {100}Inter-market Heterogeneity (α) {0, 2, 4}Intra-market Heterogeneity (G) {10, 25, 40}Consumer’s Sensitivity to Store Practices (σ) {3, 9, 15}Consumer Search Probability (Q) {0, 0.05, 0.5, 1}
as S1, S2, S3 = {R2−α, R
2, R
2+α}. S1, S2, S3 also denote the ‘consumer peak’
in market 1, market 2, and market 3 respectively and the consumer peak inmarket 2 lies between the consumer peak in market 1 and market 3.
There are three parameters to which we need to pay special attention.Firstly, in this thesis, intensity of competition is measured by the con-
sumer search probability Q (Stahl 1996). When Q is approaching zero, thereis no competition in the market, as each consumer has absolute loyalty toher favourite store, in that case, each store acts as a monopolist (Axell 1997;Stahl 1996). On the other hand, when Q is approaching one, each consumersearches in every single period, which results in a intense product marketcompetition.(Salop and Stiglitz 1977).
Secondly, the intra-market heterogeneity G measures how different con-sumers are in a market. A small G indicates that tastes of consumers in amarket is relatively homogenous, while a large G means the market is rel-atively spread out with heterogeneous consumer tastes. For example, whenC = 800, R = 100, E = 0, the consumer densities over each dimension4 inall markets are shown in Fig. 1 when G = {10, 25, 40}. It is shown that, foreach row, from the left to the right with increasing intra-market heterogeneityG, the consumers are more heterogenous represented by a more spread outconsumer density; while for each column, from the top to the bottom, the
4Note that when there is no fluctuation to consumers’ primary types E = 0, the densityof consumers over each dimension is the same, which is density of the consumers’ primarytypes.
9

consumer peak moves to the right due to the inter-market heterogeneity α.
Figure 1: Triangular density of consumers in the 3 market when G ={10, 25, 40}
0 50 1000
100
Market 1 when G=10
0 50 1000
100
Market 1 when G=25
0 50 1000
100
Market 1 when G=40
0 50 1000
100
Market 2 when G=10
0 50 1000
100
Market 2 when G=25
0 50 1000
100
Market 2 when G=40
0 50 1000
100
Market 3 when G=10
0 50 1000
100
Market 3 when G=25
0 50 1000
100
Market 3 when G=40
NOTE: This figure shows the triangular consumer density for each dimensionN in different markets with different intra-market heterogeneity G, wherefluctuation to the consumers’ primary types E is zero. The first row of thefigure shows the consumer density in market 1, the second row and thirdrow show the consumer density in market 2 and market 3 respectively. Foreach market, from the left to the right, the consumer densities with differentintra-market heterogeneity G = {10, 25, 40} are shown.
Lastly, recall that σ denotes the sensitivity of consumer’s demand re-sponding to the store practices. With a larger value of σ, the consumer ismore sensitive to the store practices, so that the same amount of increase inthe preference distance would lead to a larger drop in the demand. On theother hand, a smaller value of σ implies that the consumer is less sensitiveto store practices.
3.2 Initialization
In the first period, due to the empty consumer base, the evaluation of ideasbased on an existing consumer base is impossible. Thus a decentralized storeimplements the innovation idea generated by itself without evaluation, whileunder centralization, HQ implements a randomly generated idea throughoutthe chain.
10

In the second period, a decentralized store follows the same pattern de-scribed in the ‘Computation Model’ section. Under centralization, the set upof the second period is different. Because it takes time to transfer informa-tion between store managers and the HQ, in the second period, no promptdecision can be made by the HQ. Thus, there is no implementation of a newidea in the second period for a centralized chain, and the practices stay thesame as the practices in period 1.
On the other side of the market, it is assumed that each consumer searchesin the first period, and buys from the store which gives her highest utility.This store becomes her favourite store in period 1. Thus, the first periodconsumer base and profit of each chain are determined by the random ini-tialization of store practices.
3.3 Statistical Testing
For each replication, there are four scenarios which are simulated, denotedby CC, CD,DC and DD. The first entry gives the organizational structureof Chain a, while Chain b’s organizational structure is given by the secondentry. For example, CC/DD describes the market where both chains arecentralized/decentralized; CD is where Chain a is centralized while Chain bis decentralized, and DC is where Chain a is decentralized while Chain b iscentralized.
Let vt,nC (O) denote the profit of a centralized chain in period t for replication
n, given the other chain’s organizational structure O, and O can be either central-ization or decentralization. Similarly, vt,n
D (O) denote the profit of a decentralizedchain instead.
We are also interested in the time series on 1/X∑X
n=1[vt,nC (O) − vt,n
D (O)],which describes how the average performance across all the replications differsbetween centralized and decentralized chains over the T periods. Define δn(T,O) ≡V n
C (O; T )− V nD(O; T ) and δ̄(T ; O) ≡ 1
X
∑Xn=1 δn(T ; O) where V n
C (O; T ) ≡ ∑Tt=1
1T vt,n
C (O)and V n
D(O;T ) ≡ ∑Tt=1
1T vt,n
D (O).This statistic is used to test whether δ̄(O;T ) = 0 or not, which is, in turn, used
to determine whether one organizational structure form outperforms another. Thetest statistic is constructed as follows:
δ̄(O; T )/
√√√√ 1
X
X∑
n=1(δn(O; T ))2 − (δ̄(O; T ))2/
√X
(3)
where 1X
∑Xn=1 (δn(O; T ))2−(δ̄(O; T ))2 is the estimator of variance of δn(T ; O),
and√
1X
∑Xn=1 (δn(O; T ))2 − (δ̄(O; T ))2/
√X is estimator of standard deviation of
δ̄(O; T ).
11

For example, if δ̄(C;T ) > 0 and δ̄(C; T )/(√
1X
∑Xn=1 (δn(C; T ))2 − (δ̄(C; T ))2/
√X
)
is rejected at 5% level, centralization outperforms decentralization when the com-peting chain is centralized, and it is statistically significant.
3.4 The Profit Landscape
Search takes place over a rugged landscape defined over the space of store practices{1, ...R}. Store profit, corresponding to the store practices, forms a landscape overwhich the store manager can search for better practices through a hill-climbingrule (Carley and Lee 1998).
In case of a monopoly described by Chang and Harrington (2000), when themarket environment is specified to be unchanging, each store manager searchesover a fixed landscape. It is shown that in such case, the global optimum in theprofit landscape is fixed at the location that most consumers prefer, or what wecall the ‘consumer peak’ in the market.
However, in the case of duopoly, where product market competition takes place,the profit landscape becomes volatile. The shape of landscape and the location ofthe global optimum are not fixed, but jointly determined by the market structureand practices chosen by the competing chain.
Take market 2 as an example where the consumer peak is 50, we randomly gen-erate the practices of Chain b’s store in market 2 over all the dimensions {1, ..., N}and practices of Chain a’s store in market 2 over the dimensions {1, ..., N −1}. Byfixing these practices, Fig. 2 plots the profit landscapes of Chain a’s store in themarket 2 corresponding to the feasible practices of the Nth dimension of Chaina’s store in 4 different random cases.
It is shown that the shapes of these four profit landscapes are all different, asthe shapes are jointly determined by the operations of both stores in the market.
In the case of duopoly competition, unlike monopoly, chains do not want tolocate at the same point - the consumer peak, instead, they both want to locateslightly from each other in order to relax the competition by satisfying their owntarget consumers better. This is evidenced by each store’s actual location at theend of period T for each replication, which is shown in the Appendix B.
4 Results and Analysis
This section is organized as follows. Section 5.1 briefly describes the pattern ofthe results. Section 5.2 analyzes the relationship between organizational structureand the product market competition. Section 5.3 and 5.4 analyze the relationshipbetween organizational structure and other factors in the market structure. Section5.5 discusses the limitations of this paper as well as possible extensions for futureresearch.
12

Figure 2: Random Profit Landscapes
0 50 1000
0.2
0.4
0.6
0.8
1The Profit Landscape
Store a Practice
Pro
fit
0 50 1000
0.2
0.4
0.6
0.8
1The Profit Landscape
Store a Practice
Pro
fit
0 50 1000
0.2
0.4
0.6
0.8
1The Profit Landscape
Store a Practice
Pro
fit
0 50 1000
0.2
0.4
0.6
0.8
1The Profit Landscape
Store a Practice
Pro
fit
NOTE: Randomly generate the practices of Chain b’s store in market 2 over{1, ..., N} dimensions and practices of Chain a’s store over {1, ..., N − 1}.The Chain a’s profit in market 2 is plotted corresponding to all the feasiblepractices on the Nth dimension of Chain a’s store in market 2. Four differentrandom cases are shown with one trial of replication.
4.1 Introduction
The experiments in this section assume, unless noted otherwise, M = 3, α = 4,G = 25, E = 2, Q = 0.5, σ = 3, N = 5, T = 1000, X = 400, while the otherparameter values can be found in Section 4.1
On the basis of average chain profit, Table 2 presents the profit matrix whichdetermines the equilibrium organizational structure given the values of parameterspecified above. The results were generated as follows. For each replication, theprofits of Chain a and Chain b under the four scenarios-CC,CD,DC and DD, werecalculated. After replicating 400 times, the profits in each period were averagedacross replications. This gave us a time series for average chain profits underall of these four scenarios. The profits were then averaged across T periods andthey were used as entries in a 2*2 payoff matrix for the game in which chainssimultaneously select organizational structures.
As shown in Table 2, given the average profits of Chain a and Chain b underthe four scenarios, it is clear that DD is the equilibrium organizational structure,where both chains choose to decentralize. This profit matrix provides an examplefor constructing the equilibrium organizational form, and the equilibrium tablesshown later all follow this procedure.
Fig. 3 and 4 plot a time series for the difference of chain profits between a
13

Table 2: Profit Matrix for Orga-nizational Structure
Chain a / b C D
C (0.3975,0.3994) (0.3515,0.4490)
D (0.4506,0.3499) (0.4005,0.4011)
Note: There are two strategies for each Chain- C and D, where C denotescentralization, while D denotes decentralization.Given α = 4, Q = 0.5, G = 25 and σ = 3, the first figure in each bracket denotesthe average profit of Chain a across 400 replications and 1000 periods given theorganizational structure chosen by each chain; while the second figure denotes theaverage profit of Chain b.
centralized and a decentralized organization, given that the competing chain iscentralized and decentralized, respectively, (1/X)
∑Xn=1[v
t,nC (O) − vt,n
D (O)]. It isshown that the pattern of these two figures are similar, and they both look fairlysystematic. Both of the curves lie below zero, which indicates that centralizationis strictly dominated by decentralization in any period in this specific case. Thisresult is highly consistent with the equilibrium organizational structure that wejust found, DD.
These two curves initially dip at the early periods, because stores’ initial prac-tices are highly suboptimal so that a store can probably effectively learn on itsown as most new innovation ideas generated are effective in improving on existingpractices. Hence, in this stage, the inter-store learning achieved by centralizationis not that important.
Decentralization is increasingly performing better until the curves start to risein the second stage. In this stage, as stores get out of having highly suboptimalpractices, finding profitable ideas becomes more difficult. As a result, inter-storelearning starts becoming important, which allows stores to choose from a largerset of innovation ideas. Thus, centralization performs relatively better in thisstage, because inter-store learning, which is effectively achieved by centralization,promotes the spillover of profitable ideas across the chain.
After period 150, the curves start to flatten out, which means centralizationis not as favorable as in the second stage. At this point of time, stores beginto hit the limit of centralization because the uniformity of practices imposed by
14

Figure 3: Difference of ChainProfits between Centralizationand Decentralization when theCompeting Chain is Centralized
0 200 400 600 800 1000−0.3
−0.25
−0.2
−0.15
−0.1
−0.05
0
0.05VC(C)−VD(C)
Time
Pro
fit D
iffer
ntia
l
Figure 4: Difference of ChainProfits between Centralizationand Decentralization when theCompeting Chain is Decentral-ized
0 200 400 600 800 1000−0.25
−0.2
−0.15
−0.1
−0.05
0VC(D)−VD(D)
TimeP
rofit
Diff
ernt
ial
centralization prevents stores from approaching their own global optimum. Theadvantage of ‘local adaptability’ under decentralization starts to appear critical atthis point, which allows stores to tailor their practices to the local market in orderto achieve their global optimum.
4.2 The Relationship between a Firm’s Optimal Or-ganizational Structure and the Product MarketCompetition
PROPERTY 1. The relative performance of decentralization is superior whenthe product market competition is intense, where competition is measured by theconsumer search probability Q.
Table 3 reports the equilibrium organizational structures with different valuesof consumer search probability Q and inter-market heterogeneity α, over short run(T = 100), median run (T = 500) and long run (T = 1000). The construction ofthis equilibrium table has been described in Section 5.1. An equilibrium is statis-tically significant if the difference in payoffs between the equilibrium structure fora chain and the alternative structure, given the other firm’s equilibrium organiza-tional structure, is rejected at 5% level. The number in each bracket presents thedifference of profits between centralized chain and decentralized chain, given thatthe competing chain is decentralized.5
5As shown in Table 2, decentralization is the dominant strategy for both chains, so weonly focus on the profit differentials when the competing chain is decentralized.
15
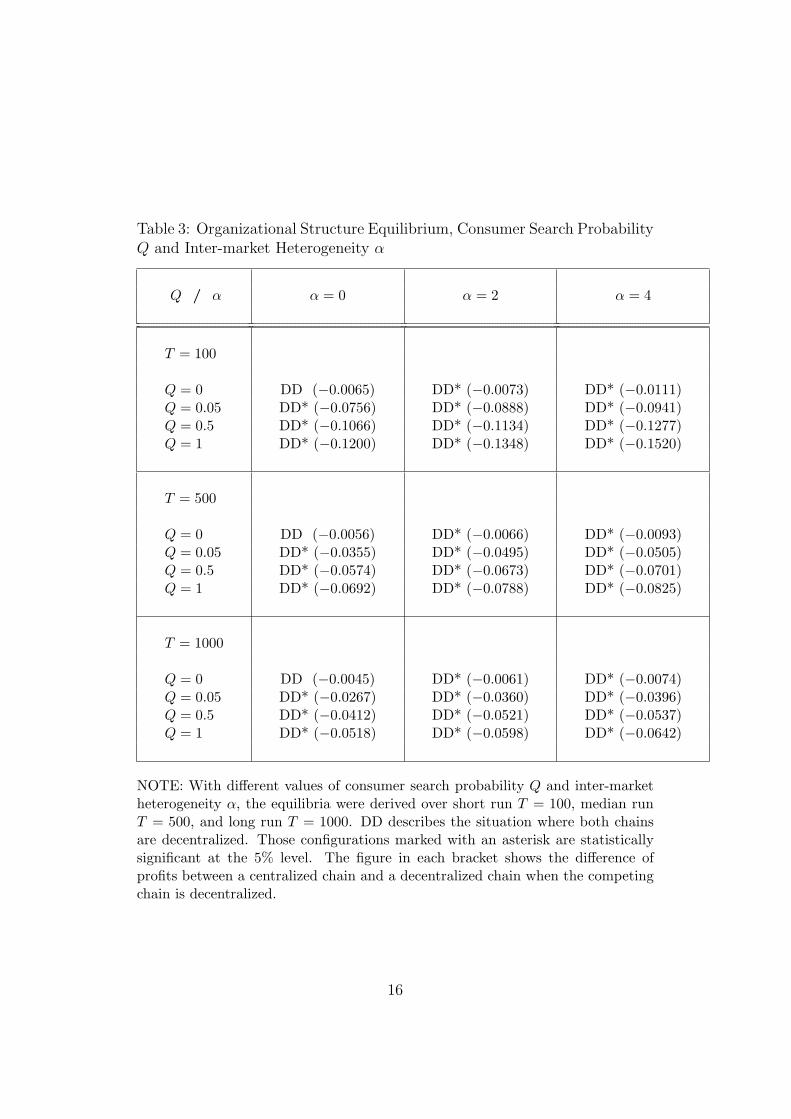
Table 3: Organizational Structure Equilibrium, Consumer Search ProbabilityQ and Inter-market Heterogeneity α
Q / α α = 0 α = 2 α = 4
T = 100
Q = 0 DD (−0.0065) DD* (−0.0073) DD* (−0.0111)Q = 0.05 DD* (−0.0756) DD* (−0.0888) DD* (−0.0941)Q = 0.5 DD* (−0.1066) DD* (−0.1134) DD* (−0.1277)Q = 1 DD* (−0.1200) DD* (−0.1348) DD* (−0.1520)
T = 500
Q = 0 DD (−0.0056) DD* (−0.0066) DD* (−0.0093)Q = 0.05 DD* (−0.0355) DD* (−0.0495) DD* (−0.0505)Q = 0.5 DD* (−0.0574) DD* (−0.0673) DD* (−0.0701)Q = 1 DD* (−0.0692) DD* (−0.0788) DD* (−0.0825)
T = 1000
Q = 0 DD (−0.0045) DD* (−0.0061) DD* (−0.0074)Q = 0.05 DD* (−0.0267) DD* (−0.0360) DD* (−0.0396)Q = 0.5 DD* (−0.0412) DD* (−0.0521) DD* (−0.0537)Q = 1 DD* (−0.0518) DD* (−0.0598) DD* (−0.0642)
NOTE: With different values of consumer search probability Q and inter-marketheterogeneity α, the equilibria were derived over short run T = 100, median runT = 500, and long run T = 1000. DD describes the situation where both chainsare decentralized. Those configurations marked with an asterisk are statisticallysignificant at the 5% level. The figure in each bracket shows the difference ofprofits between a centralized chain and a decentralized chain when the competingchain is decentralized.
16

As shown in Table 3, although the equilibria in all the specifications are DDs6,where both chains decentralize, the profit differentials shown in the brackets illus-trate a clear pattern. For each column, from the top to the bottom for each valueof time T , the differential profits decrease in the consumer search probability Q,which demonstrates that decentralization performs increasingly better in a morecompetitive environment in terms of the increasing consumer search probabilitygiven the inter-market heterogeneity α fixed. For each row, from the left to theright, the differential profits decrease in the inter-market heterogeneity α, whichillustrates that the relative performance of decentralization increases when themarkets are more heterogenous, as decentralization allows each store to tailor itspractices to its own unique market.
It should not be too surprising to see that, with all sets of parameters, decen-tralization outperforms centralization. In the case of single chain, decentralizationalmost always outperforms centralization (Chang and Harrington 2000), and com-petition makes the performance of decentralization even superior. Thus, whenproduct market competition is introduced, decentralization should be more pre-ferred by each chain.
Figure 5: Differential Profit when Q = 0.05, 0.5, 1, where the competingchain is decentralized.
0 200 400 600 800 1000−0.25
−0.2
−0.15
−0.1
−0.05
0
0.05
0.1
Time
Pro
fit D
iffer
ntia
l
VC(D)−VD(D)
Q=0.05Q=0.5Q=1
Fig. 5 plots a time series for the difference in chain profits between a centralizedand a decentralized organization given that the competing chain is decentralized.7
6Decentralization significantly outperforms centralization in all the specifications, ex-cept that when Q = 0 and α = 0, centralization is insignificantly dominated by decentral-ization over short run, median run and long run.
7As shown in Table 3, the equilibria for all specifications are DD, where both chainsare decentralized. Thus, we only focus on the profit differential path when the competing
17

It is clear that when the consumer search probability Q increases, the profit dif-ferential curve shifts downwards, which illustrates that the relative performanceof decentralization tends to be superior when the product market competitionbecomes more intense.
After introducing the ‘cost of delay’, the competitive advantage of decentral-ization becomes apparent. According to the cost of delay, it takes time for thetransmission of information between store managers and the HQ. Under central-ization, the HQ evaluates the innovation ideas based on the information about thechain’s overall consumer base in the previous period. When the consumer searchprobability is high, a store’s consumer base is changing quickly from time to time,so that the group of consumers who are consuming from the store in the currentperiod can be extremely different from the group of consumers who purchasedfrom this store in previous period. This leads to the information about the store’sconsumer base, on which the evaluation of innovation ideas is based, becomingobsolete very quickly. This obsolesce of the information is costly because the im-plementation of the practices under centralization based on the previous consumerinformation may not be able to satisfy the current consumers effectively.
A second force is also at work. Competition favors decentralization becauseit makes the inter-market learning under decentralization more likely. When theconsumer search probability is high, movement from the initial point of practices tothe global optimum is more likely. Because, when the consumer search probabilityQ approaches zero, the consumer base for each store is likely to be localized, whichcan be extremely different from each other depending on the initial conditions. Inorder to satisfy the current consumers, the location of each store can possibly befar away from each other, which prevents inter-market learning between storesunder decentralization. On the other hand, higher consumer search probabilityQ allows consumers to search more actively and frequently, in order to satisfythe changing consumer base, stores are likely to move from the localized pointtowards the global optimum more quickly. Although the global optimum in eachmarket is different from each other according to the inter-market heterogeneity α,the movement from the localized point towards the global optimum still reducesthe difference of the target consumers of each store, which effectively increases theinter-market learning.
By introducing the cost of delay of transferring information between storemanagers and the HQ, our model gives us a result which is consistent with theempirical finding (Acemoglue 2006; Meagher and Wait 2006), that decentralizationis more likely when the product market is more competitive.
It is widely accepted that centralization is associated with a cost of delay (Aoki1986) and competition motivates prompt decision making (Aghion and Tirole 1997;Meagher, Orbay and Van Zandt, 2001). In our learning model, consumers searchand change their favourite stores over time, the better a store or a chain un-
chain is decentralized. The results are similar when the competing chain is centralized,which are included in Appendix C.
18

derstands its own current consumers, the more likely it can effectively satisfy andretain these consumers. Under centralization, intense competition, in terms of highconsumer search probability, makes the information about the current consumersbecoming obsolete quickly, as the group of consumers on which the evaluationbased is different from the group of consumers who actually consume from thechain. Consequently, the practices adopted by a centralized chain may mismatchthe targeted consumer base which the chain is supposed to pursue. Hence, therelative performance of decentralization is superior when the product market com-petition is intense. This is not only because decentralization utilizes the localadaptability, but also because it takes advantage of more fresh information aboutits consumers, which allows it to make more prompt and accurate decisions inorder to satisfy its consumers more effectively.
4.3 The Relationship between a Firm’s Optimal Orga-nizational Structure and Consumer Tastes in theMarket
PROPERTY 2. Decentralization performs relatively better when consumer tastesare more homogenous in the market, which is captured by a relatively small intra-market heterogeneity G.
Recall that G captures the intra-market heterogeneity, which measure how differentthe consumers are in a market. Larger G indicates that the tastes of consumers inthe market are more heterogenous, while smaller G indicates that consumer tastesare more homogenous.
Table 4 reports the equilibrium organizational structures with different valuesof intra-market heterogeneity G when the intra-market heterogeneity α = 4 andthe consumer search probability Q = 0.5. It is shown that, decentralization is stillthe dominant strategy for both chains under all the specifications. However, thedifference of profits between a centralized chain and a decentralized chain when thecompeting chain is decentralized, as shown in each bracket, increases in G, whichindicates that centralization tends to perform relatively better in the market withheterogenous consumer tastes.
A similar message is sent by Fig. 6, which is a plot of the difference of profitsbetween centralization and decentralization when the competing chain is decen-tralized. It is shown that the profit differential curve shifts down when the intra-market heterogeneity G becomes smaller, which demonstrates that the relativeperformance of decentralization is superior when the consumers in the market aremore homogenous in their tastes.
Following the same pattern as discussed in the subsection 5.1, Fig. 7 plots thethree different profit landscapes in market 2 when G = {10, 25, 40} respectivelygiven the practice of Chain a’s store in market 2 over the Nth dimension changingfrom {1,...,R}. It is shown that when the intra-market heterogeneity G is small,
19

Table 4: Organizational Struc-ture Equilibrium and Intra-market Heterogeneity G
Intra-market heterogeneity G Equilibrium
G = 10 DD* (−0.1456)
G = 25 DD* (−0.0524)
G = 40 DD* (−0.0186)
NOTE: The equilibrium was derived by calculating the average profits across 400replications and 1000 periods, where the inter-market heterogeneity α = 4 andthe consumer search probability Q = 0.5.
Figure 6: Differential Profit when G = 10, 25, 40, where the competing chainis decentralized.
0 200 400 600 800 1000−0.3
−0.25
−0.2
−0.15
−0.1
−0.05
0
0.05
Time
Pro
fit D
iffer
ntia
l
VC(D)−VD(D)
G=10G=25G=40
20

Figure 7: The profit Landscapes and Intra-market Heterogeneity G
0 20 40 60 80 1000
0.5X: 46Y: 0.4123
G=10
Store a Practice
Pro
fit
0 20 40 60 80 1000
0.5X: 44Y: 0.3983
G=25
Store a Practice
Pro
fit
0 20 40 60 80 1000
0.5X: 44Y: 0.3395
G=40
Store a Practice
Pro
fit
such as G = 10, the profit landscape appears to be relatively steep; when Gincreases to 40, the profit landscape becomes much flatter. This suggests thatwhen the market is more homogenous, a slight deviation from the global optimumwill lead to a large drop in the profit. Thus, the local information possessedby store managers appears especially important when consumer tastes are morehomogenous in the market, which allows each store to adapt the global optimumin its own market.
In Fig. 7, attention should also be paid to the global optimum of the profitlandscape shown in the datatip in each sub-figure. When the consumer tastes inthe market are homogenous with a small G, in order to achieve the global optimum,the store tends to locate more close to the middle of the market, which is knownas the consumer peak.
It is concluded by Anderson et al. (1994), the store that has the larger con-sumer base tends to have lower consumer satisfaction. Chang and Harrington(2003) also show that decentralization tends to have higher consumer satisfactionbut a smaller loyal consumer base. However, we argue that when consumer tastesare relatively homogenous in a market, decentralization does not only satisfy con-sumers better but also tends to have a larger consumer base. This is because,when the consumers are relatively homogenous in a market, a practice which sat-isfies the consumer types who are most prevalent in the market will also tend tosatisfy many other consumers in the market. Thus, decentralized store utilizes itssuperior local information to satisfy its current consumers, and, in turn, to satisfymost of the consumers in the market effectively.
21

4.4 The Relationship between a Firm’s Optimal Orga-nizational Structure and the Consumer’s Sensitiv-ity to Store Practices.
PROPERTY 3. The relative performance of decentralization is superior whenconsumers are not too sensitive to store practices, which is captured by a relativelysmall σ.
Table 5: Organizational Struc-ture Equilibrium and ConsumerSensitivity to Store Practices σ
Consumer Sensitivity σ Equilibrium
σ = 3 DD* (−0.0522)
σ = 9 DD* (−0.0384)
σ = 15 DD* (−0.0268)
NOTE: The equilibrium was derived by calculating the average profits across 400replications and 1000 periods, where inter-market heterogeneity α = 4.
As shown in Table 5, given the different value of consumer sensitivity to storepractices σ = {3, 9, 15}, decentralization is always the dominant strategy for eachchain no matter whether the competing chain is centralized or decentralized. Thenumber in each bracket shows the difference of profits between centralization anddecentralization, given that the competing chain is decentralized. It is shownthat even though all the profit differentials are negative, they increase in σ. Thisillustrates that relative performance of centralization is superior when consumersare more sensitive to the store practices.
Fig. 8 plots the difference of profits between centralization and decentral-ization when the competing chain is decentralized. The curve shifts up when σbecomes larger, which demonstrate that when consumers are more sensitive tostore practices, centralization performs relatively better.
To some degree, Fig. 9 provides an explanation to Property 3. Following thesame pattern as discussed in subsection 5.1, Figure 5.9 plots the profit landscape
22

Figure 8: Differential Profit when σ = 3, 9, 15, when the competing chain isdecentralized.
0 200 400 600 800 1000−0.25
−0.2
−0.15
−0.1
−0.05
0
Time
Pro
fit D
iffer
ntia
l
VC(D)−VD(D)
sigma=3sigma=9sigma=15
Figure 9: The Profit Landscape all the 3 Markets when Consumer’s Sensi-tivity σ = 3, 9, 15.
0 50 1000
0.5
1X: 44Y: 0.4594
sigma=3, Market 1
Store a Practice
Pro
fit
0 50 1000
0.5
1X: 43Y: 0.3097
sigma=9, Market 1
Store a Practice
Pro
fit
0 50 1000
0.5
1
X: 44Y: 0.2039
sigma=15, Market 1
Store a Practice
Pro
fit
0 50 1000
0.5
1X: 46Y: 0.3687
sigma=3, Market 2
Store a Practice
Pro
fit
0 50 1000
0.5
1
X: 44Y: 0.2245
sigma=9, Market 2
Store a Practice
Pro
fit
0 50 1000
0.5
1
X: 44Y: 0.175
sigma=15, Market 2
Store a Practice
Pro
fit
0 50 1000
0.5
1
X: 47Y: 0.2305
sigma=3, Market 3
Store a Practice
Pro
fit
0 50 1000
0.5
1
X: 45Y: 0.1127
sigma=9, Market 3
Store a Practice
Pro
fit
0 50 1000
0.5
1
X: 44Y: 0.07234
sigma=15, Market 3
Store a Practice
Pro
fit
23

of Chain a in each market with different values of consumer sensitivity σ corre-sponding to the practice on the Nth dimension of the each store under Chaina. For each column, from the top to the bottom, the sub-figures show the profitlandscapes in market 1, market 2 and market 3 respectively, given the consumer’ssensitivity; while for each row, from the left to the right, the sub-figures show theprofit landscapes when the consumer’s sensitivity to store practices σ increasesfrom 3, 9 to 15. The datatip in each figure points out the global optimum ofthe profit, given the practice of the Nth dimension for each store under Chain a.Given the inter-market heterogeneity α = 4, it is shown that when σ is relativelysmall, each store under the same chain tends to locate differently from the othersin order to adapt its own local market. For example, as shown, when σ = 3, theoptimal practice on the Nth dimension for the stores in market 1, 2 and 3 are 44,46 and 47 respectively, which implies that when σ is relatively small, uniformity ofpractices imposed by centralization is not favorable as it prevents the store in eachmarket from achieving its own unique global optimum. On the other hand, whenσ is relatively large, the optimum position in each market corresponding to theglobal optimum is shown to be overlapping. When σ = 15, it is shown that the op-timum practice for each stores under Chain a is 44, which gives the highest profitto the store in each market under Chain a. Therefore, centralization performsbetter when consumers are sensitive to store practices because the uniformity ofpractices imposed by centralization tends to promotes the spillover of profitableideas across the chain without suffering from the loss of ‘local adaptability’ in suchcase.
However, the underlying reason that centralization is favored when consumersare more sensitive to store practices cannot be well explained here. Thus, it stillremains for future research on this point.
5 Sensitivity Analysis
We will conduct a sensitivity analysis in this section. As shown in the last section,‘decentralization’ is the dominant strategy for each chain across all the specifica-tions. Thus, we only present a time series for the difference of profits between acentralized and a decentralized chain for each case when the competing chain isdecentralized.8
Firstly, we change the number of markets M in which the chains are competingwith each other. In the case of 2 markets with inter-market heterogeneity α = 4,Fig. 10, 11 and 12 plot the differences of profits between centralization and decen-tralization when the competing chain is decentralized with the consumer searchprobability Q, the intra-market heterogeneity G and the consumer sensitivity to
8Form the unreported figures, it is also clear that the differential profit curve when thecompeting chain is centralized is quite similar to the curve when the competing chain isdecentralized in each case.
24

store practices σ varied respectively. It is shown that the change in the number ofmarkets does not change our results.
Figure 10: Differential Profit andConsumer Search Probability Qwhen the Number of Markets M = 2
0 200 400 600 800 1000−0.25
−0.2
−0.15
−0.1
−0.05
0
Time
Pro
fit D
iffer
ntia
l
VC(D)−VD(D)
Q=0.05Q=0.5Q=1
Figure 11: Differential Profit andIntra-market Heterogeneity G whenthe Number of Markets M = 2
0 200 400 600 800 1000−0.3
−0.25
−0.2
−0.15
−0.1
−0.05
0
0.05
Time
Pro
fit D
iffer
ntia
l
VC(D)−VD(D)
G=10G=25G=40
Figure 12: Differential Profit andConsumer Sensitivity to Store Prac-tices σ when the Number of MarketsM = 2
0 200 400 600 800 1000−0.2
−0.15
−0.1
−0.05
0
0.05
Time
Pro
fit D
iffer
ntia
l
VC(D)−VD(D)
sigma=3sigma=9sigma=15
Second, we show that our results are robust to the number of consumers C ineach market. By changing the number of consumers in each market C from 800to 100, the profit differentials are plotted in Figure 13, 14 and 15 for the threeproperties.
Lastly, Figure 16, 17 and 18 plot the differential profits when the number ofdimensions N is changed from 5 to 2. It is found that the change in the numberof dimensions of store practices does not change our results.
Therefore, it is found that our properties are not sensitive to small changes inour parameter values.
25

Figure 13: Differential Profit andConsumer Search Probability Qwhen the Number of ConsumersC = 100
0 200 400 600 800 1000−0.25
−0.2
−0.15
−0.1
−0.05
0
0.05
0.1
Time
Pro
fit D
iffer
ntia
l
VC(D)−VD(D)
Q=0.05Q=0.5Q=1
Figure 14: Differential Profit andIntra-market Heterogeneity G whenthe Number of Consumers C = 100
0 200 400 600 800 1000−0.35
−0.3
−0.25
−0.2
−0.15
−0.1
−0.05
0
0.05
Time
Pro
fit D
iffer
ntia
l
VC(D)−VD(D)
G=10G=25G=40
Figure 15: Differential Profit andConsumer Sensitivity to Store Prac-tices σ when the Number of Con-sumers C = 100
0 200 400 600 800 1000−0.2
−0.15
−0.1
−0.05
0
0.05
Time
Pro
fit D
iffer
ntia
l
VC(D)−VD(D)
sigma=3sigma=9sigma=15
26

Figure 16: Differential Profit andConsumer Search Probability Qwhen the Number of DimensionsN = 2
0 200 400 600 800 1000−0.2
−0.15
−0.1
−0.05
0
0.05
Time
Pro
fit D
iffer
ntia
l
VC(D)−VD(D)
Q=0.05Q=0.5Q=1
Figure 17: Differential Profit andIntra-market Heterogeneity G whenthe Number of Dimensions N = 2
0 200 400 600 800 1000−0.25
−0.2
−0.15
−0.1
−0.05
0
0.05
0.1
Time
Pro
fit D
iffer
ntia
l
VC(D)−VD(D)
G=10G=25G=40
Figure 18: Differential Profit andConsumer Sensitivity to Store Prac-tices σ when the Number of Dimen-sions N = 2
0 200 400 600 800 1000−0.25
−0.2
−0.15
−0.1
−0.05
0
0.05
0.1
Time
Pro
fit D
iffer
ntia
l
VC(D)−VD(D)
sigma=3sigma=9sigma=15
27

6 Conclusion
The thesis examined the relationship between a firm’s optimal organization struc-ture and the market structure.
By incorporating bounded rationality, a reduced form of a dynamic real-timedecentralized information processing model has been developed in the duopolycase. This model allows us to consider the cost of delay (Meagher 1996) as well asproduct market competition (Chang and Harrington 2003).
It is found that the relative performance of decentralization tends to be superiorwhen the product market competition is more intense. This is because more intensecompetition, which is measured by a relatively high consumer search probability,causes information about the consumers to become obsolete quickly, which in turn,limits a firm’s ability to satisfy its current consumers.
Fisher et al (1994) argue that the superior performance of firms like Wal-Mart,The Gap, The Limited and Benetton is largely due to their ability to manage de-mand uncertainty using ’accurate response’ strategy. This implies that using morerecent information and reacting to the changing consumer base more promptlyserves as a competitive advantage for a firm. The need for timely decision makingfavors decentralization because it reduces the lag between the receipt of informa-tion and decision making.
Although this positive relationship between decentralization and product mar-ket competition has been briefly discussed in some organization textbooks (forexample, Brickley, Smith and Zimmerman (2004)), no theoretical work to datesupports this argument. Conversely, Chang and Harrington (2003) shows a con-tradictory result with their theatrical model, that product market competitionfavors centralization.
Since intuitively, the positive relationship between decentralization and prod-uct market competition holds, our finding is important, which provides theoreticalevidence to reinforce this argument. Moreover, this result is also consistent withfindings in several recent empirical papers, such as Acemoglu et al. (2006) andMeagher and Wait (2006).
Secondly, we find that decentralization performs relatively better in a marketwhere consumer tastes are more homogenous. Based on superior local information,by tailoring its practices to the consumer types who are most prevalent in themarket, decentralization can satisfy many other consumers if the consumer tastesin the market are similar.
Finally, we also find that the relative performance of decentralization is supe-rior when the consumers are not too sensitive to store practices because a highconsumer sensitivity makes the optimal practices of the store in each market over-lapping. However, the future research on this point can be further expanded.
There are also two major limitations regarding the model and the simulationmethodology respectively.
First, we find that, decentralization is the dominant strategy over all the spec-
28

ifications. However, in the real world, the performance of decentralization maynot be as desirable as shown in our results. That is because one of the majordrawbacks of decentralization – ‘loss of control’ – is not included in this model(Aghion and Tirole 1997). By introducing the loss of control, the relative perfor-mance of centralization is expected to increase, and centralization may become thedominant strategy when the markets are sufficiently homogenous and the productmarket competition is not too intense.9
Second, it has been customary to be sceptical of results that are produced bysimulation. We agree that closed-form results may be more persuasive in the sensethat they are independent of the particular values of parameters in the model.However, numerical methods provide a countervailing advantage, which allows usto explore new lines of theory which are beyond the scope of the traditional scien-tific methods. In our model, the complexity of finding the optimal organizationalstructure when multi-dimensional competition and consumer search take place inthe market is too great to make closed-form solutions tractable. Alternatively, ournumerical simulation makes it possible to explore the properties of the model thatwould otherwise be inaccessible to analysis.
In addition, there are several directions that future work can take, such astaking the price competition into account, making the consumer search probabilityendogenous 10, and introducing the market research (Peter and Olson, 2005).
In conclusion, the relationship between organizational structure and marketstructure is an important and interesting topic, because these two structures jointlydetermine the performance of a firm. However, very little research has been done toexplore this relationship. This thesis develops a theoretical computational modelto establish the link between the theory, empirical evidence and economic intuition.
References
[1] Acemoglu, D., Aghion, P., Lelarge,C., Reenen, J. V., and Zilibotti, F., (2006).“Technology, Information and the Decentralization of the Firm”, NBERWorking Papers 12206, National Bureau of Economic Research, Inc.
[2] Aghion, P., Tirole, J., (1997). “Formal and real authority in Organization”,Journal of Political Economics, 105, 1-29.
[3] Anderson, E. W., Fornell, C., Lehmann, D. R., (1994). “Customer Satisfac-tion, Market Share, and Profitability: Findings from Sweden”, Journal ofMarketing, 58(3), 53-66.
9Although the loss of control may increases the relative performance of centralization,it does not invalidate our properties, as we considered the derivative of the differenceof performance between centralization and decentralization instead of the level of thedifference.
10For example, consumers only search if the utility that she receives from her favouritestore falls below a certain level (Radner, 2003).
29
[4] Aoki, M., (1986). “Horizontal vs. Vertical Information Structure of the Firm”,The American Economic Review, 76(5), 971-983.
[5] Axell, B., (1977). “Search Market Equilibrium”, The Scandinavian Journalof Economics, 79(1), 20-40.
[6] Brickley, J., Smith, C. W., and Zimmerman, J., (2004). “Managerial Eco-nomics and Organizational Architecture”, third edition, McGraw- Hill/Irwin.
[7] Carley, K. M., Lee, J. S., (1998). “Dynamic Organizations: OrganizationalAdaptation in a Changing Environment”, Advances in Strategic Management,15, 269-297.
[8] Chang, M. H., Harrington Jr, J. E., (2000). “Centralization vs. Decentraliza-tion in a Multi- unit Organization: A Computational Model of a Retail Chainas a Multi-agent Adaptive System”, Management Science, 46(11), 1427-1440.
[9] Chang, M. H., Harrington Jr, J. E., (2003). “Multimarket Competition, Con-sumer Search, and the Organizational Structure of Multiunit Firms”, Man-agement Science, 49(4), 541-552.
[10] “Customer Loyalty in Grocery Retailing”, (1995). Mintel International GroupLimited, London.
[11] Fisher, M. L., Hammond, J. H., Obermeyer, W. R., and Raman, A., (1994).“Marking Supply Meet Demand in an Uncertain World”, Harvard BusinessReview, May- June 1994, 83-93.
[12] Kruisinga, H. J., (1954). “The Balance between Centralization and Decen-tralization in Managerial Control”, Proceedings of an International Study-Conference.
[13] Lancaster, K., (1966). “A new approach to consumer theory”, Journal ofPolitical Economy, 74 (2), 132 -157.
[14] Meagher, K.,(1996). “Managing Change and the Success of Niche Products”,Santa Fe Institute Working Paper 96-08-066.
[15] Meagher, K., Orbay, H., and Van Zandt, T., (2001). “Hierarchy Size and Envi-ronmental Uncertainty”, CEPR Discussion Papers 2839, C.E.P.R. DiscussionPapers.
[16] Meagher, K., Wait, A., (2006). “Big Decisions and Little Fish: Theory andEvidence on Competition, Uncertainty and Delegation in Firms”, workingpaper.
[17] Peter, J. P. and Olson, J. C., (2005). “Consumer Behaviour and MarketingStrategy”, McGraw- Hill Irwin, NY.
30

[18] Radner, R., (1992). “Hierarchy: The Economics of Managing”, Journal ofEconomic Literature, XXX, 1382-1415.
[19] Radner, R., (1993). “The Organization of Decentralized Information Process-ing”, Econometrica, 61(5), 1109-1146.
[20] Radner, R., (2003). “Viscous Demand”, Journal of Economic Theory, 112,189-231.
[21] Salop, S., and Stiglitz, J., (1977). “Bargains and Ripoffs: A Model of Monop-olistically Competitive Price Dispersion”, Review of Economic Studies, 44,493-510.
[22] Simon, H., (1955). “A Behavioral Model of Rational Choice”, in Models ofMan, Social and Rational: Mathematical Essays on Rational Human Behaviorin a Social Setting. New York: Wiley.
[23] Stahl, D. O., (1996). “Oligopolistic Pricing with Heterogeneous ConsumerSearch”, International Journal of Industrial Organization, 14, 243-268.
[24] Van Zandt, T., (1999). “Decentralized Information Processing in the Theoryof Organizations”, Contemporary Economic Development Reviewed, Vol. 4:The Enterprise and its Environment. Murat Sertel. ed. London: MacmillanPress, 125-160.
[25] Van Zandt, T., (2003). “Real-time Hierarchical Resource Allocation”, Prince-ton University. Mimeo.
[26] Van Zandt, T., Radner, R., (2001). “Real-time Decentralized InformationProcessing and Returns to Scale”, Economic Theory, 17, 497-544.
31


![[KEYADE CASE STUDY] Air France: best organization is centralization!](https://static.fdocuments.net/doc/165x107/559673aa1a28ab47618b475a/keyade-case-study-air-france-best-organization-is-centralization.jpg)


