
FIRM-LEVEL EVIDENCE ON THE COOPERATIVE · PDF filecooperative innovation strategies in russian...
35
Vitaliy Roud, Valeriya Vlasova FIRM-LEVEL EVIDENCE ON THE COOPERATIVE INNOVATION STRATEGIES IN RUSSIAN MANUFACTURING BASIC RESEARCH PROGRAM WORKING PAPERS SERIES: SCIENCE, TECHNOLOGY AND INNOVATION WP BRP 63/STI/2016 This Working Paper is an output of a research project implemented within NRU HSE’s Annual Thematic Plan for Basic and Applied Research. Any opinions or claims contained in this Working Paper do not necessarily reflect the views of HSE.
Transcript of FIRM-LEVEL EVIDENCE ON THE COOPERATIVE · PDF filecooperative innovation strategies in russian...

Vitaliy Roud, Valeriya Vlasova
FIRM-LEVEL EVIDENCE ON THE
COOPERATIVE INNOVATION
STRATEGIES IN RUSSIAN
MANUFACTURING
BASIC RESEARCH PROGRAM
WORKING PAPERS
SERIES: SCIENCE, TECHNOLOGY AND INNOVATION
WP BRP 63/STI/2016
This Working Paper is an output of a research project implemented within NRU HSE’s Annual Thematic Plan for
Basic and Applied Research. Any opinions or claims contained in this Working Paper do not necessarily reflect the
views of HSE.

Vitaliy Roud1 and Valeriya Vlasova
2
FIRM-LEVEL EVIDENCE ON THE COOPERATIVE
INNOVATION STRATEGIES
IN RUSSIAN MANUFACTURING
This paper focuses on revealing the heterogeneous impact of firms’ specificities and the
environment on the sophistication of the cooperative innovation strategies. We use the firm-level
data on innovation strategies of over 800 innovation-active manufacturing enterprises in Russia
to model the networking strategy as a simultaneous choice of the range of cooperative linkages
(within and beyond the value chain and knowledge production sectors) with a special respect to
geography of partners. The determinants comprise the internal factors (as absorptive capacity)
and the external conditions (e.g. technological opportunities, appropriability and competition
regimes). Revealed effects prove the initial heterogeneity hypothesis thus challenging the wide-
spread simplified perception of ‘openness’ of the innovation strategy as a one-dimensional
characteristic.
Keywords: Innovation cooperation; open innovation; firm-level; Russia; manufacturing;
innovation strategy; econometric analysis
Thematic area: Applied economics
JEL: L2, O3
1 Laboratory for Economics of Innovation, National Research University Higher School of Economics; [email protected] 2 Institute for Statistical Studies and Economics of Knowledge, National Research University Higher School of Economics, [email protected]
3
1. Introduction
For the recent decades the cooperative behavior has been considered as one of the central
topics in the innovation studies. The importance of engaging external knowledge sources was
formally emphasized in the central conceptual models (e.g. the chain-link model of innovation
(Kline and Rosenberg, 1986)) and reflected in the statistical measurement frameworks (Oslo
Manual, 2005). These theoretical considerations were fully supported by the emerging base of
empirical evidence that has greatly improved our understanding of different patterns of
cooperative innovation strategies. However, few researchers focused on the empirical analysis of
the determinants for the cooperative innovation strategies, addressing the full range of
heterogeneities of motivations for the different configurations of collaborative networks.
This study employs the firm-level data on the innovation activities of the Russian
manufacturing enterprises to address the major research question: what are the key determinants
(including the internal firm specificity and the characteristics of the external environment) that
define a cooperative strategy in innovation activities: partner choice and geographical patterns of
networking.
To address this question we use the results of the specialized survey entitled “Monitoring
the innovation activity of actors of the innovative process”, which the Institute for Statistical
Studies and the Economics of Knowledge of the National Research University Higher School of
Economics has undertaken in 2014-2015 and provides data for 805 innovation-active
manufacturing enterprises.
We analyze nine possible types of innovation cooperation chosen by firms: cooperation
with customers, suppliers of raw materials, competitors, providers of services, related value-
chain members, consulting firms, universities, research organizations and public authorities. We
control for six dimensions determining cooperative strategies: firm-specific characteristics, level
of competition, technological opportunities, absorptive capacity, appropriability conditions and
public support as explanatory variables. The estimation of a multivariate probit model and
multinomial logit model provides a measure of factors determining firm’s decision on
cooperation and its geographical pattern.
The rest of the paper is structured as follows. Section 2 provides a brief overview of the
theoretical and empirical literature on innovation cooperation, focusing on innovation
cooperation strategies and factors that may either contribute or prevent cooperative behavior.
Section 3 shifts the focus to the dataset description, variables construction and estimation
methodology. An econometric analysis of the cooperative behavior is delivered in Section 4.
Section 5 presents main results and concludes with possible directions for future research.

4
2. 2. Background
2.1. Cooperation as a core of innovation strategy
Business environment is characterized by widespread circulation of knowledge, rise in
venture capital, short product and innovation life cycles and other. Driven by these changes
companies are forced to place on the same level of importance both internal and external
knowledge resources. Moreover, firms’ awareness that they are unable to hold in-house all
knowledge and competencies they require, forces them to open up their research and innovation
process (Powell and Grodal, 2005; Pavitt, 2005).
Firms obtain various benefits from innovation cooperation by attracting external
knowledge, competences, human resources, tangible assets and intellectual property objects.
Further each cooperation type has its particular benefits contributing to a multi-partner
cooperation.
A cooperative buyer-supplier relationship allows firms to reduce production and
operating costs and project development lead times (Clark, 1989), because suppliers have high
position in the knowledge chain and operate in the same in the same industry segment, having
close contextual knowledge distance to the company (Un, Asakawa, 2015). Suppliers support
innovation process, helping to overcome shortcomings in markets, technical resources and
capabilities (Zhang and Li, 2010) and providing an opportunity to involve in planning and
operation (Fritsch, Franke, 2004). Cooperation with suppliers is essential for marketing and
organizational innovation (Sánchez-González, 2013).
An innovation cooperation with clients also help firms to gain the competitive
advantages. Customers act as a source of information about user needs (Tether, 2002), market
trends and opportunities (Von Hippel et al. 1999) and competitors’ offers (Padmore, Schuetze,
Gibson, 1998), allowing the company to reduce the risk of uncertainty associated with market
introduction. These linkages are especially beneficial when the nature of innovation project is
novel and complex or the final market is poorly understood.
Science-industry linkages hold a unique position among all cooperation types. Being a
source of fundamental knowledge important to innovation, technology and economic growth
(Cohen, Nelson, Walsh, 2002; Mansfield, 1998) and upstream in the knowledge chain of the
industry (Un, Asakawa, 2015), collaboration with universities and research organizations enables
to realize radical innovations (Kaufmann, Tödtling, 2001), to receive public support for
innovation activity and to accelerate the return on investments through shorter innovation cycles
and costs reduction (Veugelers and Cassiman, 2005). Moreover, such cooperative agreements
increase the mobility of employees and researches across both sectors (Hackett, 2008), allowing

5
enterprises to trainee employees and to offer highly qualified and expert researches (Schmidt et
al., 2007). Nonetheless, this type of cooperation is characterized by the divergence of respective
objectives related to the lack of complementarity between scientific studies and business
function (Fiaz, Naiding, 2012; Garcia et al., 2015), high uncertainty, communication and trust
issues connected to transmission of information.
Many companies are in close coordination with public authorities that provide a legal
framework for cooperative agreements, on the one hand, and financial support, on the other. It is
an effective tool to support direct investment in various sectors of the economy, to harmonize
sectoral legislation and to strengthen the company's market power. Consulting firms, for its part,
could provide a variety of inputs to the innovation process (e.g. specialist skills and market
information) and stimulate new innovative ideas (Tether, 2002), concerning changes in
organization or marketing strategies (Garcia et al., 2015).
Collaboration with competitors differs from all previous types significantly, because they
belong to the same industry sector (Miotti and Sachwald, 2003) and have common goals and
problems and pursue common innovation projects (Tether, 2002). These linkages are valuable in
long complex innovation projects, allowing partners to improve their knowledge, skills and
absorptive capacity through the cooperation. The basic problem is the possibility of opportunistic
behavior resulting in coordination, communication and trust problems (Edwards-Schachter et al.,
2013; Wu, 2014). The lack of a strong intellectual property management and regulation can
cause a non-cooperation.
Broadly, firms pursue different objectives when enter into cooperation with external
entities, i.e. value chain actors, market players, knowledge producers and other. Nevertheless,
they are often forced to delay or even abandon their collaborative projects due to various external
and internal hindering factors.
2.2. Determinants of cooperative strategies
The variety of cooperative strategies implies the heterogeneity of motives behind the
particular choices of collaborative partners. Numerous surveys of innovation activities (e.g. CIS)
have been conducted over the last decades, providing information on innovation behavior of
firms. It has led to an increase of empirical studies, including research on:
Motives leading to innovation and R&D cooperation (e.g. Bayona, García-Marco and Huerta
2001; Segarra-Blasco and Arauzo-Carod 2008; De Faria, Lima and Santos, 2010; Arvanitis
2012),
Patterns of cooperative innovation and R&D strategies (e.g. Hagedoorn 2002; Tether 2002;
Dachs, Ebersberger and Pyka 2008; Franco and Gussoni 2010),

6
Factors affecting the choice of partners and the likelihood to enter into a cooperation
agreement (e.g. Cassiman and Veugelers 2002, 2005; Miotti and Sachwald 2003; Belderbos
et al. 2004; De Faria and Schmidt, 2012; Abramovsky et al., 2008; Badillo and Moreno 2016;
Srholec 2014), and
The impact of cooperation on firm innovativeness and performance (e.g. Kaiser 2002;
Becker and Dietz 2004; Fritsch and Franke 2004; Jaklic, Damijan and Rojec 2008).
All papers investigating various R&D and innovation cooperation strategies and
analyzing factors that affect the decision to cooperate and key finding of these studies are
presented in Table A1 (see Appendix 1). Pursuant to the literature review determinants of firms’
innovation cooperation strategies can be arranged into six groups (see Table 1).
Table 1 Determinants of cooperative strategies
Category Definition
Firm-specific characteristics Background characteristics of the firms, e.g. size, age, form of
ownership, sector of activity
Level of competition The potential existence of comparative advantages at the industry
and firm level
Technological opportunities Firm innovativeness: the suitability of the currently existing and
exploitable external resources
Absorptive capacity The link between the external stock of technological opportunities
and the in-house capabilities
Appropriability conditions An ability to obtain the benefits from innovation by protecting
innovations from imitation
Public support Public financial support from local and national administrations
Most studies show that firms’ strategic decisions rely heavily on firm-specific
characteristics, such as industry affiliation, size, age and other. Large companies have sufficient
financial, human and technological resources and its own knowledge base needed for innovation
activity (Bayona, Garcı́a-Marco and Huerta, 2001). Firms with foreign participation are more
likely to cooperate with customers and universities (Tether, 2002), while a general belonging to a
group increases innovation cooperation with customers and suppliers (Belderbos et al., 2004).
Another group of factors relates to the playing field. On the one hand, an increase of
competition in the market encourages firms’ willingness to engage in innovation partnership,
because it enables to broaden the value chain and to strengthen the competitive position
(Arvanitis, 2012). On the other hand, a high degree of intensity in competition attended by a risk
of leaking knowledge prevent the cooperation (Dachs, Ebersberger and Pyka, 2008).
In general, innovation capabilities of firms depend on the balance between the ability to
conduct and expand internal R&D (technological opportunities) and to seize the opportunities
offered by external environment (absorptive capacity). Technological opportunities could be
assessed as the share of expenditures for R&D and innovation activities (Castellacci, 2007),

7
importance of different types of innovation and the length of their establishment. Absorptive
capacity characterizes the “ability of a firm to identify, assimilate and exploit knowledge from
the external environment” (Cohen, Levinthal, 1990), expressed in staff qualification, corporate
culture, access to outside sources of information (incoming spillovers) in relation to the
development and implementation of innovation.
Outgoing spillovers in turn are resources that can be used by external partners for their
personal interest (Becker and Dietz, 2004). Confidence in a steady return on implemented
innovations is provided through effective intellectual property protection mechanisms, otherwise
the probability of free-riding problem related to innovation investments increases (Belderbos et
al., 2004). Alternatively, low appropriability conditions enable intra-firms knowledge diffusion
(Castellacci, 2007), with a possible beneficial effect on the productivity growth. Empirically,
firm's ability to appropriate returns from innovations has a positive significant effect on the
probability of innovation cooperation of any kind (Lhuillery and Pfister, 2009; Veugelers and
Cassiman, 2005 among other).
Considering that innovation is a costly and uncertain process, various direct and indirect
measures of financial support from public authorities affect cooperation decisions significantly.
Availability of public support has a particular effect on science-industry interaction in the
process of innovation (Arranz and Fdez. De Arroyable, 2008; Miotti and Sachwald, 2003).
Previous studies have shown that firm-specific characteristics and high level of
absorptive capacity play a key role in the propensity for R&D and innovation cooperation
regardless of cooperation type. Sustainable competitive advantages encourage firms to engage in
innovation cooperation with knowledge producers and competitors. At the same time there is no
effect on the cooperation within the supply chain. Firm’s technological opportunity that refers to
ease the achievement of innovations and technical improvements is especially important for
vertical and institutional cooperation. Appropriability conditions contribute to better likelihood
of vertical and institutional cooperation. The impact of public support on the probability of
innovation cooperation is very strong, especially for cooperation with customers, suppliers and
knowledge production sector.
Nevertheless, most of the existing literature focuses on R&D cooperation and not on
patterns of cooperative arrangements for innovation. Researchers often consider different
cooperation strategies as independent, regardless of possible interdependence among them due to
complementarities and substitutability (Belderbos et al., 2004). Moreover, they combine several
partners in a single cooperation strategy: vertical (suppliers and consumers), horizontal
(competitors) and institutional (universities and research organizations) cooperation. Only a
small number of studies are focused on factors determining geographical patterns in the choices

8
of cooperation partners, while what defines the duration of collaboration is entirely unexplored.
In this paper we take into account all these shortcomings and drawbacks.

9
3. Data and Method
3.1. General information on data source
The empirical work is based on the results from a specialized survey entitled “Monitoring
the innovation activity of actors of the innovative process”, which the Institute for Statistical
Studies and the Economics of Knowledge of the National Research University Higher School of
Economics has undertaken on a regular basis since 20093. The aim of the project is to develop
empirical studies and to accumulate empirical knowledge about the innovation nature and types
of interaction between various actors in the national innovation system.
The monitoring of the manufacturing and services industries adapts techniques from
integrated European Manufacturing Survey – research into technology levels and innovative
activity in industry (organized by a consortium of 18 research centers and universities and
coordinated by Fraunhofer ISI, Germany4) and international standards on statistical measures of
innovation. It expands the original framework with a number of specialized modules that ensure
the methodological compatibility with CIS, but also provide a basis for assessing the
respondents’ experience of participating in the official innovation surveys.
The survey in 2014-2015 focuses on the innovation activities of the manufacturing and
service sector companies. The sample includes more than 1300 firms, data are weighted by
population characteristics derived from the Federal State Statistics Service (Rosstat) that include
information on the number of enterprises in each industry sector and size group. The present
analysis is based on a sample of 805 innovation-active firms representatively reflecting
innovation cooperation patterns in Russian manufacturing sector. The brief sample
characteristics are presented in Table A2 in Appendix 2.
3.2. Variables definition
We consider nine types of innovation cooperation partners: customers, suppliers of raw
materials, competitors, providers of services, related value-chain members, consulting firms,
universities, research organizations and public authorities. For each partner we account for three
degrees of the geographical proximity: regional (less than 100 km), national (more than 100 km)
and abroad.
Potential determinants of cooperative behavior patterns (explanatory variables) are
divided into six categories pursuant to the review of theoretical empirical studies. Table A3 in
Appendix 3 summarizes definitions of the variables.
3 https://www.hse.ru/en/monitoring/innproc/
4 http://www.isi.fraunhofer.de/isi-en/i/projekte/fems.php
10
Firm-specific characteristics: SIZE variable captured by the log of average number of
employees and included in the model as a continuous variable, AGE is a dummy variable with
value 1 if there are less than 5 years since registration, ownership variables on whether the firm
is STATE- or FOREIGN-owned, variables assessing the operating results as a rate of changes in
the staffing level (GROWTH) and as a return on sales index (ROS). Sectoral differences are
monitored by a set of INDUSTRY dummies based on NACE Rev 1.1.
Competitive environment: Complex indicators to capture the level of competition: market
structure - MONOPOLY (less than two direct competitors) and OLIGOPOLY (from 2 to 5
rivals), potential markets for future development (REGIONAL, NATIONAL and/or FOREIGN),
different types of advantages acquired by competitors over the firm in PRICE, QUALITY and/or
NOVELTY of products, adaptation of products according to customers' requirements
(CUSTOMIZATION), short time of DELIVERY, additional customer SERVICES and OTHER
strengths of competitors.
Technological opportunity: The level of investment intensity is derived from the question
on what is the share of total innovation expenditures in the total turnover: LOW (less than 2.5%),
MEDIUM (from 2.5% to 10%) and HIGH (more than 10%). There are three dummy variables
for strategically important for business development types of innovation: REGULAR R&D,
development and/or implementation of significantly improved or fundamentally new types of
PRODUCT and PROCESS. Moreover, PERIOD variables represent the long-term process
(more than 3-5 years) of development and/or implementation of product and process innovation,
respectively.
Absorptive capacity: STAFF_HIGH represents the share of employees with a high
education qualification and/or doctor degree. CULTURE variables capture the company
management attitude towards the involvement of external partners at various stages of
development and implementation of innovations (EXTERNAL), independent exchange of idea
among the various units of the company (INTERNAL) and the presence of developed standard
procedures for interaction with the implementing partners of research and development
(PROCEDURES). Catching the variable OWN EFFORT, we consider if the majority of
implemented innovations were developed predominately by firms own. Moreover, there are five
dummy variables that account for the IMPORTANCE of various internal sources of information
for development and implementation of new products, manufacturing processes and services.
OUTBOUND knowledge flow dummy accepts value 1 for firms that acquire and/or transfer
technologies associated with development and implementation of innovations.
Appropriability conditions: Methods of intellectual property protection used to protect
the rents from the firms’ innovation activity: FORMAL including patenting of inventions,

11
industry designs and utility models, registration of trademarks and information units, copyright,
and INFORMAL such as confidentiality agreements with the company’s personnel or
commercial confidentiality (“know-how”), elaborating product design and other.
Public support: Three dummy variables taking the value 1 if the company has used on of
state support measures in 2011-2014: HORIZONTAL such as tax remissions and preferences;
depreciation bonuses; subsidizing of interest rates on loans; NETWORKING for instance,
technology platforms and regional innovation clusters creation and TARGETED including
contracts within federal target programs, state grants and targeted support for training innovation
managers.
Distribution of surveyed firms by the fact of innovation cooperation and its geographical
pattern are presented in Table A4 Appendix 4. The means and standard deviations for each group
of determinants are presented in Table A5 in Appendix 5. The vast majority (98.1%) of
innovation-active firms in Russian manufacturing are engaged in innovation cooperation, while
about 80% prefer to cooperate with several types of partners simultaneously (see Figure 1).
Cooperation within the supply chain is the most common among innovative firms, while only a
quarter interact with universities and research organizations that could be important strategic
partners.
Figure 1 Population of the alternative cooperation modes in relative terms
Notes: Decision-making process among innovation-active manufacturing firms
We undertake a latent class analysis to identify five typical patterns of cooperation with
regard to partner type and geographical location (see Table 3). Firms may engage in cooperation
with clients and suppliers located anywhere (Cluster 1), within a regional value-chain (Cluster 2)
or within a global value chain building on the resources of local universities and research
organizations (Cluster 3). Also we can distinguish a cooperation on the national level with

12
various partners (Cluster 4) and a broad networking with different external actors and frequent
interaction with national public-sector R&D (Cluster 5).
Table 3 Profiles of innovation cooperation strategies derived using latent class analysis
3.3. Estimation methodology
To investigate the factors that lead firms to cooperate we estimate a multivariate probit
model (Cappellari, Jenkins, 2003) with nine binary equations, each one representing a pattern of
innovation cooperation on the assumption that it is possible to cooperate with several partners
simultaneously and that various cooperative strategies are interdependent. The model provides
unbiased, asymptotically normal and efficient estimations. To address the question of possible
interdependence of partner selection strategies we test values of non-diagonal cross-equation
correlations (rhos) and test the hypothesis that all contemporaneous correlations among error
terms across equations are equal to zero based on the likelihood ratio test.
To assess the factors influencing the geographical breadth of the cooperation networks
we estimate a multinomial logit model (Greene, 2012, 803-805). It includes same explanatory
variables and uses maximum likelihood estimation (MLE) to calculate probability of cluster
membership.
1. Clients and
suppliers
2. Regional value-
chain
3. Global value chain
and local knowledge
providers
4. National
networking
5. Broader networking
and national
knowledge base
38.2% 33.1% 12.7% 10.9% 5.1%
regional 0.343 0.715 0.801 0.157 0.839
national 0.546 0.001 0.749 0.640 0.879
foreign 0.126 0.000 0.213 0.148 0.375
regional 0.173 0.724 0.654 0.178 0.888
national 0.521 0.005 0.865 0.537 0.997
foreign 0.162 0.013 0.382 0.319 0.531
regional 0.045 0.351 0.502 0.178 0.505
national 0.153 0.026 0.406 0.334 0.640
foreign 0.028 0.000 0.078 0.062 0.069
regional 0.069 0.289 0.688 0.087 0.848
national 0.066 0.002 0.300 0.251 0.797
foreign 0.020 0.000 0.068 0.091 0.239
regional 0.023 0.103 0.405 0.042 0.207
national 0.039 0.006 0.382 0.204 0.372
foreign 0.000 0.000 0.005 0.001 0.007
regional 0.054 0.110 0.213 0.299 0.853
national 0.097 0.017 0.004 0.775 0.829
foreign 0.013 0.000 0.006 0.128 0.026
regional 0.080 0.078 0.265 0.260 0.772
national 0.019 0.006 0.000 0.585 0.568
foreign 0.002 0.000 0.000 0.038 0.049
regional 0.000 0.052 0.126 0.042 0.305
national 0.018 0.002 0.029 0.121 0.256
foreign 0.013 0.000 0.010 0.046 0.000
regional 0.081 0.146 0.264 0.333 0.631
national 0.031 0.007 0.060 0.392 0.409
foreign 0.000 0.000 0.000 0.034 0.000
Universities
Consulting
firms
Public
authorities
Customers/
Clients
Suppliers of
raw materials
Competitors
Research
organizations
Related value-
chain members
Providers of
services
Cluster Size
Indicators: Innovation cooperation with
Clusters
13
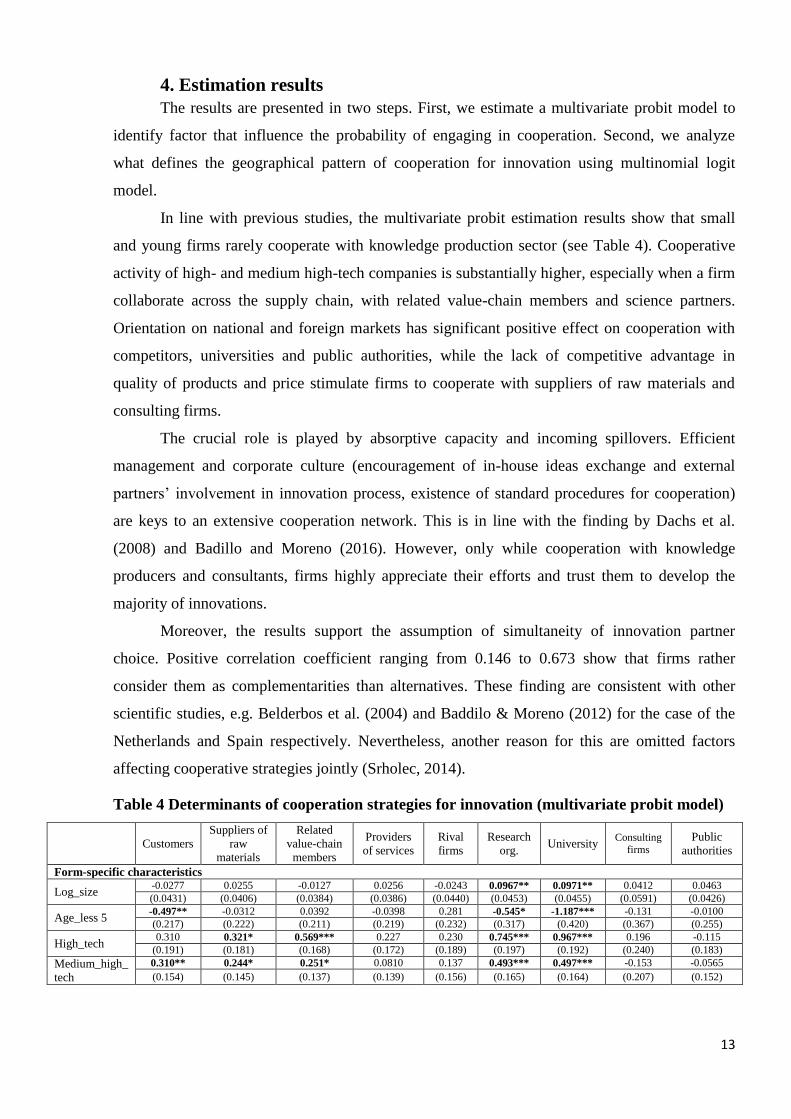
4. Estimation results
The results are presented in two steps. First, we estimate a multivariate probit model to
identify factor that influence the probability of engaging in cooperation. Second, we analyze
what defines the geographical pattern of cooperation for innovation using multinomial logit
model.
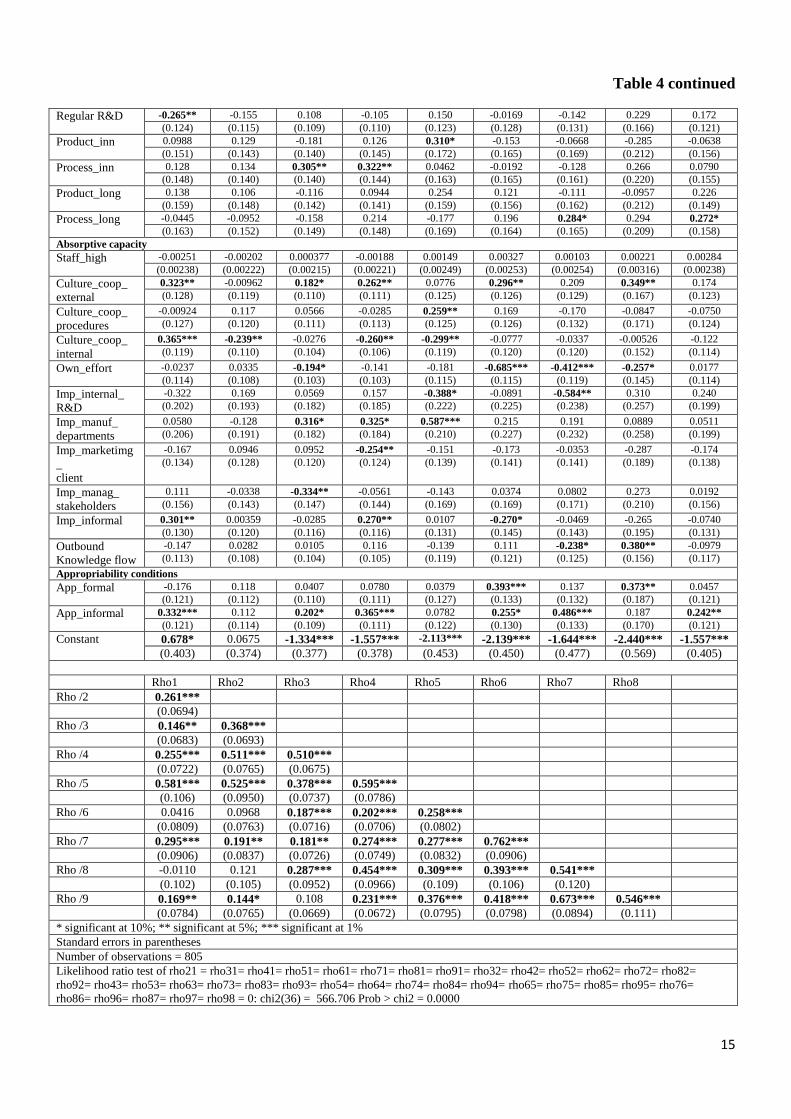
In line with previous studies, the multivariate probit estimation results show that small
and young firms rarely cooperate with knowledge production sector (see Table 4). Cooperative
activity of high- and medium high-tech companies is substantially higher, especially when a firm
collaborate across the supply chain, with related value-chain members and science partners.
Orientation on national and foreign markets has significant positive effect on cooperation with
competitors, universities and public authorities, while the lack of competitive advantage in
quality of products and price stimulate firms to cooperate with suppliers of raw materials and
consulting firms.
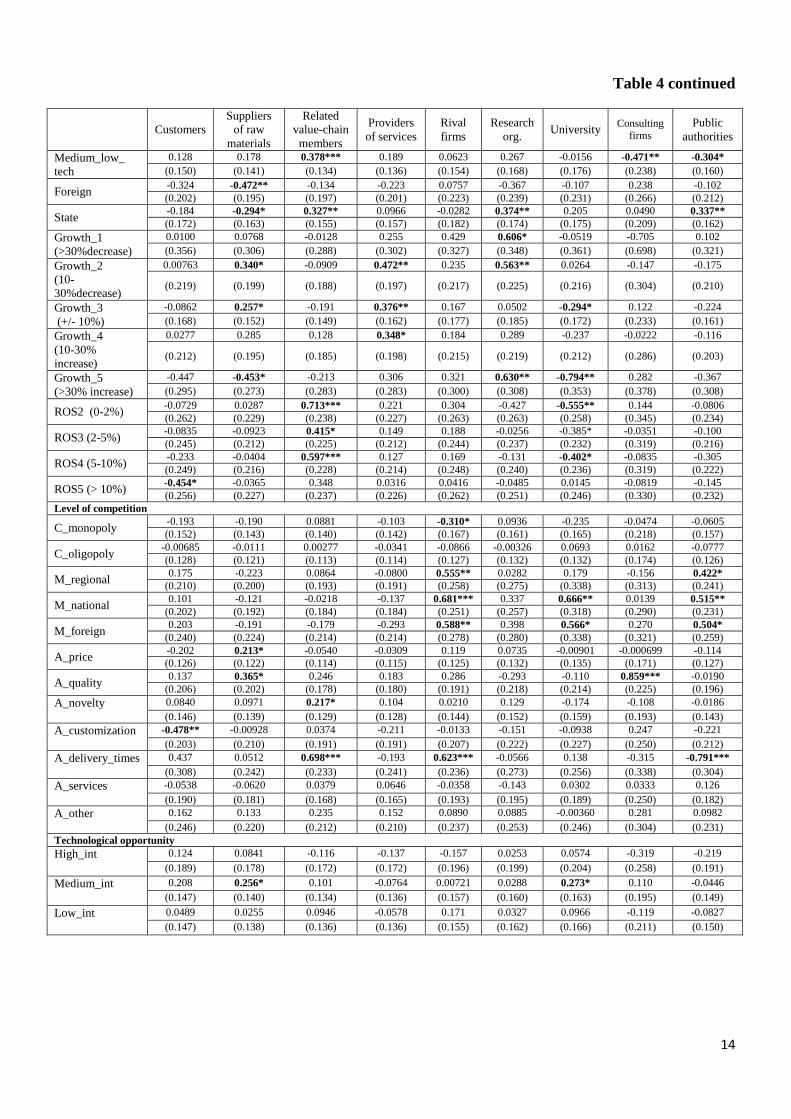
The crucial role is played by absorptive capacity and incoming spillovers. Efficient
management and corporate culture (encouragement of in-house ideas exchange and external
partners’ involvement in innovation process, existence of standard procedures for cooperation)
are keys to an extensive cooperation network. This is in line with the finding by Dachs et al.
(2008) and Badillo and Moreno (2016). However, only while cooperation with knowledge
producers and consultants, firms highly appreciate their efforts and trust them to develop the
majority of innovations.
Moreover, the results support the assumption of simultaneity of innovation partner
choice. Positive correlation coefficient ranging from 0.146 to 0.673 show that firms rather
consider them as complementarities than alternatives. These finding are consistent with other
scientific studies, e.g. Belderbos et al. (2004) and Baddilo & Moreno (2012) for the case of the
Netherlands and Spain respectively. Nevertheless, another reason for this are omitted factors
affecting cooperative strategies jointly (Srholec, 2014).
Table 4 Determinants of cooperation strategies for innovation (multivariate probit model)
Customers
Suppliers of
raw
materials
Related
value-chain
members
Providers
of services
Rival
firms
Research
org. University
Consulting
firms Public
authorities
Form-specific characteristics
Log_size -0.0277 0.0255 -0.0127 0.0256 -0.0243 0.0967** 0.0971** 0.0412 0.0463
(0.0431) (0.0406) (0.0384) (0.0386) (0.0440) (0.0453) (0.0455) (0.0591) (0.0426)
Age_less 5 -0.497** -0.0312 0.0392 -0.0398 0.281 -0.545* -1.187*** -0.131 -0.0100
(0.217) (0.222) (0.211) (0.219) (0.232) (0.317) (0.420) (0.367) (0.255)
High_tech 0.310 0.321* 0.569*** 0.227 0.230 0.745*** 0.967*** 0.196 -0.115
(0.191) (0.181) (0.168) (0.172) (0.189) (0.197) (0.192) (0.240) (0.183)
Medium_high_
tech
0.310** 0.244* 0.251* 0.0810 0.137 0.493*** 0.497*** -0.153 -0.0565
(0.154) (0.145) (0.137) (0.139) (0.156) (0.165) (0.164) (0.207) (0.152)
14
Table 4 continued
Customers
Suppliers
of raw
materials
Related
value-chain
members
Providers
of services
Rival
firms
Research
org. University
Consulting
firms Public
authorities
Medium_low_
tech
0.128 0.178 0.378*** 0.189 0.0623 0.267 -0.0156 -0.471** -0.304*
(0.150) (0.141) (0.134) (0.136) (0.154) (0.168) (0.176) (0.238) (0.160)
Foreign -0.324 -0.472** -0.134 -0.223 0.0757 -0.367 -0.107 0.238 -0.102
(0.202) (0.195) (0.197) (0.201) (0.223) (0.239) (0.231) (0.266) (0.212)
State -0.184 -0.294* 0.327** 0.0966 -0.0282 0.374** 0.205 0.0490 0.337**
(0.172) (0.163) (0.155) (0.157) (0.182) (0.174) (0.175) (0.209) (0.162)
Growth_1
(>30%decrease)
0.0100 0.0768 -0.0128 0.255 0.429 0.606* -0.0519 -0.705 0.102
(0.356) (0.306) (0.288) (0.302) (0.327) (0.348) (0.361) (0.698) (0.321)
Growth_2
(10-
30%decrease)
0.00763 0.340* -0.0909 0.472** 0.235 0.563** 0.0264 -0.147 -0.175
(0.219) (0.199) (0.188) (0.197) (0.217) (0.225) (0.216) (0.304) (0.210)
Growth_3
(+/- 10%)
-0.0862 0.257* -0.191 0.376** 0.167 0.0502 -0.294* 0.122 -0.224
(0.168) (0.152) (0.149) (0.162) (0.177) (0.185) (0.172) (0.233) (0.161)
Growth_4
(10-30%
increase)
0.0277 0.285 0.128 0.348* 0.184 0.289 -0.237 -0.0222 -0.116
(0.212) (0.195) (0.185) (0.198) (0.215) (0.219) (0.212) (0.286) (0.203)
Growth_5
(>30% increase)
-0.447 -0.453* -0.213 0.306 0.321 0.630** -0.794** 0.282 -0.367
(0.295) (0.273) (0.283) (0.283) (0.300) (0.308) (0.353) (0.378) (0.308)
ROS2 (0-2%) -0.0729 0.0287 0.713*** 0.221 0.304 -0.427 -0.555** 0.144 -0.0806
(0.262) (0.229) (0.238) (0.227) (0.263) (0.263) (0.258) (0.345) (0.234)
ROS3 (2-5%) -0.0835 -0.0923 0.415* 0.149 0.188 -0.0256 -0.385* -0.0351 -0.100
(0.245) (0.212) (0.225) (0.212) (0.244) (0.237) (0.232) (0.319) (0.216)
ROS4 (5-10%) -0.233 -0.0404 0.597*** 0.127 0.169 -0.131 -0.402* -0.0835 -0.305
(0.249) (0.216) (0.228) (0.214) (0.248) (0.240) (0.236) (0.319) (0.222)
ROS5 (> 10%) -0.454* -0.0365 0.348 0.0316 0.0416 -0.0485 0.0145 -0.0819 -0.145
(0.256) (0.227) (0.237) (0.226) (0.262) (0.251) (0.246) (0.330) (0.232)
Level of competition
C_monopoly -0.193 -0.190 0.0881 -0.103 -0.310* 0.0936 -0.235 -0.0474 -0.0605
(0.152) (0.143) (0.140) (0.142) (0.167) (0.161) (0.165) (0.218) (0.157)
C_oligopoly -0.00685 -0.0111 0.00277 -0.0341 -0.0866 -0.00326 0.0693 0.0162 -0.0777
(0.128) (0.121) (0.113) (0.114) (0.127) (0.132) (0.132) (0.174) (0.126)
M_regional 0.175 -0.223 0.0864 -0.0800 0.555** 0.0282 0.179 -0.156 0.422*
(0.210) (0.200) (0.193) (0.191) (0.258) (0.275) (0.338) (0.313) (0.241)
M_national 0.101 -0.121 -0.0218 -0.137 0.681*** 0.337 0.666** 0.0139 0.515**
(0.202) (0.192) (0.184) (0.184) (0.251) (0.257) (0.318) (0.290) (0.231)
M_foreign 0.203 -0.191 -0.179 -0.293 0.588** 0.398 0.566* 0.270 0.504*
(0.240) (0.224) (0.214) (0.214) (0.278) (0.280) (0.338) (0.321) (0.259)
A_price -0.202 0.213* -0.0540 -0.0309 0.119 0.0735 -0.00901 -0.000699 -0.114
(0.126) (0.122) (0.114) (0.115) (0.125) (0.132) (0.135) (0.171) (0.127)
A_quality 0.137 0.365* 0.246 0.183 0.286 -0.293 -0.110 0.859*** -0.0190
(0.206) (0.202) (0.178) (0.180) (0.191) (0.218) (0.214) (0.225) (0.196)
A_novelty 0.0840 0.0971 0.217* 0.104 0.0210 0.129 -0.174 -0.108 -0.0186
(0.146) (0.139) (0.129) (0.128) (0.144) (0.152) (0.159) (0.193) (0.143)
A_customization -0.478** -0.00928 0.0374 -0.211 -0.0133 -0.151 -0.0938 0.247 -0.221
(0.203) (0.210) (0.191) (0.191) (0.207) (0.222) (0.227) (0.250) (0.212)
A_delivery_times 0.437 0.0512 0.698*** -0.193 0.623*** -0.0566 0.138 -0.315 -0.791***
(0.308) (0.242) (0.233) (0.241) (0.236) (0.273) (0.256) (0.338) (0.304)
A_services -0.0538 -0.0620 0.0379 0.0646 -0.0358 -0.143 0.0302 0.0333 0.126
(0.190) (0.181) (0.168) (0.165) (0.193) (0.195) (0.189) (0.250) (0.182)
A_other 0.162 0.133 0.235 0.152 0.0890 0.0885 -0.00360 0.281 0.0982
(0.246) (0.220) (0.212) (0.210) (0.237) (0.253) (0.246) (0.304) (0.231)
Technological opportunity
High_int 0.124 0.0841 -0.116 -0.137 -0.157 0.0253 0.0574 -0.319 -0.219
(0.189) (0.178) (0.172) (0.172) (0.196) (0.199) (0.204) (0.258) (0.191)
Medium_int 0.208 0.256* 0.101 -0.0764 0.00721 0.0288 0.273* 0.110 -0.0446
(0.147) (0.140) (0.134) (0.136) (0.157) (0.160) (0.163) (0.195) (0.149)
Low_int 0.0489 0.0255 0.0946 -0.0578 0.171 0.0327 0.0966 -0.119 -0.0827
(0.147) (0.138) (0.136) (0.136) (0.155) (0.162) (0.166) (0.211) (0.150)
15
Table 4 continued
Regular R&D -0.265** -0.155 0.108 -0.105 0.150 -0.0169 -0.142 0.229 0.172
(0.124) (0.115) (0.109) (0.110) (0.123) (0.128) (0.131) (0.166) (0.121)
Product_inn 0.0988 0.129 -0.181 0.126 0.310* -0.153 -0.0668 -0.285 -0.0638
(0.151) (0.143) (0.140) (0.145) (0.172) (0.165) (0.169) (0.212) (0.156)
Process_inn 0.128 0.134 0.305** 0.322** 0.0462 -0.0192 -0.128 0.266 0.0790
(0.148) (0.140) (0.140) (0.144) (0.163) (0.165) (0.161) (0.220) (0.155)
Product_long 0.138 0.106 -0.116 0.0944 0.254 0.121 -0.111 -0.0957 0.226
(0.159) (0.148) (0.142) (0.141) (0.159) (0.156) (0.162) (0.212) (0.149)
Process_long -0.0445 -0.0952 -0.158 0.214 -0.177 0.196 0.284* 0.294 0.272*
(0.163) (0.152) (0.149) (0.148) (0.169) (0.164) (0.165) (0.209) (0.158)
Absorptive capacity
Staff_high -0.00251 -0.00202 0.000377 -0.00188 0.00149 0.00327 0.00103 0.00221 0.00284
(0.00238) (0.00222) (0.00215) (0.00221) (0.00249) (0.00253) (0.00254) (0.00316) (0.00238)
Culture_coop_
external
0.323** -0.00962 0.182* 0.262** 0.0776 0.296** 0.209 0.349** 0.174
(0.128) (0.119) (0.110) (0.111) (0.125) (0.126) (0.129) (0.167) (0.123)
Culture_coop_
procedures
-0.00924 0.117 0.0566 -0.0285 0.259** 0.169 -0.170 -0.0847 -0.0750
(0.127) (0.120) (0.111) (0.113) (0.125) (0.126) (0.132) (0.171) (0.124)
Culture_coop_
internal
0.365*** -0.239** -0.0276 -0.260** -0.299** -0.0777 -0.0337 -0.00526 -0.122
(0.119) (0.110) (0.104) (0.106) (0.119) (0.120) (0.120) (0.152) (0.114)
Own_effort -0.0237 0.0335 -0.194* -0.141 -0.181 -0.685*** -0.412*** -0.257* 0.0177
(0.114) (0.108) (0.103) (0.103) (0.115) (0.115) (0.119) (0.145) (0.114)
Imp_internal_
R&D
-0.322 0.169 0.0569 0.157 -0.388* -0.0891 -0.584** 0.310 0.240
(0.202) (0.193) (0.182) (0.185) (0.222) (0.225) (0.238) (0.257) (0.199)
Imp_manuf_
departments
0.0580 -0.128 0.316* 0.325* 0.587*** 0.215 0.191 0.0889 0.0511
(0.206) (0.191) (0.182) (0.184) (0.210) (0.227) (0.232) (0.258) (0.199)
Imp_marketimg
_
client
-0.167 0.0946 0.0952 -0.254** -0.151 -0.173 -0.0353 -0.287 -0.174
(0.134) (0.128) (0.120) (0.124) (0.139) (0.141) (0.141) (0.189) (0.138)
Imp_manag_
stakeholders
0.111 -0.0338 -0.334** -0.0561 -0.143 0.0374 0.0802 0.273 0.0192
(0.156) (0.143) (0.147) (0.144) (0.169) (0.169) (0.171) (0.210) (0.156)
Imp_informal 0.301** 0.00359 -0.0285 0.270** 0.0107 -0.270* -0.0469 -0.265 -0.0740
(0.130) (0.120) (0.116) (0.116) (0.131) (0.145) (0.143) (0.195) (0.131)
Outbound
Knowledge flow
-0.147 0.0282 0.0105 0.116 -0.139 0.111 -0.238* 0.380** -0.0979
(0.113) (0.108) (0.104) (0.105) (0.119) (0.121) (0.125) (0.156) (0.117)
Appropriability conditions
App_formal -0.176 0.118 0.0407 0.0780 0.0379 0.393*** 0.137 0.373** 0.0457
(0.121) (0.112) (0.110) (0.111) (0.127) (0.133) (0.132) (0.187) (0.121)
App_informal 0.332*** 0.112 0.202* 0.365*** 0.0782 0.255* 0.486*** 0.187 0.242**
(0.121) (0.114) (0.109) (0.111) (0.122) (0.130) (0.133) (0.170) (0.121)
Constant 0.678* 0.0675 -1.334*** -1.557*** -2.113*** -2.139*** -1.644*** -2.440*** -1.557***
(0.403) (0.374) (0.377) (0.378) (0.453) (0.450) (0.477) (0.569) (0.405)
Rho1 Rho2 Rho3 Rho4 Rho5 Rho6 Rho7 Rho8
Rho /2 0.261***
(0.0694)
Rho /3 0.146** 0.368***
(0.0683) (0.0693)
Rho /4 0.255*** 0.511*** 0.510***
(0.0722) (0.0765) (0.0675)
Rho /5 0.581*** 0.525*** 0.378*** 0.595***
(0.106) (0.0950) (0.0737) (0.0786)
Rho /6 0.0416 0.0968 0.187*** 0.202*** 0.258***
(0.0809) (0.0763) (0.0716) (0.0706) (0.0802)
Rho /7 0.295*** 0.191** 0.181** 0.274*** 0.277*** 0.762***
(0.0906) (0.0837) (0.0726) (0.0749) (0.0832) (0.0906)
Rho /8 -0.0110 0.121 0.287*** 0.454*** 0.309*** 0.393*** 0.541***
(0.102) (0.105) (0.0952) (0.0966) (0.109) (0.106) (0.120)
Rho /9 0.169** 0.144* 0.108 0.231*** 0.376*** 0.418*** 0.673*** 0.546***
(0.0784) (0.0765) (0.0669) (0.0672) (0.0795) (0.0798) (0.0894) (0.111)
* significant at 10%; ** significant at 5%; *** significant at 1%
Standard errors in parentheses
Number of observations = 805
Likelihood ratio test of rho21 = rho31= rho41= rho51= rho61= rho71= rho81= rho91= rho32= rho42= rho52= rho62= rho72= rho82=
rho92= rho43= rho53= rho63= rho73= rho83= rho93= rho54= rho64= rho74= rho84= rho94= rho65= rho75= rho85= rho95= rho76=
rho86= rho96= rho87= rho97= rho98 = 0: chi2(36) = 566.706 Prob > chi2 = 0.0000

16
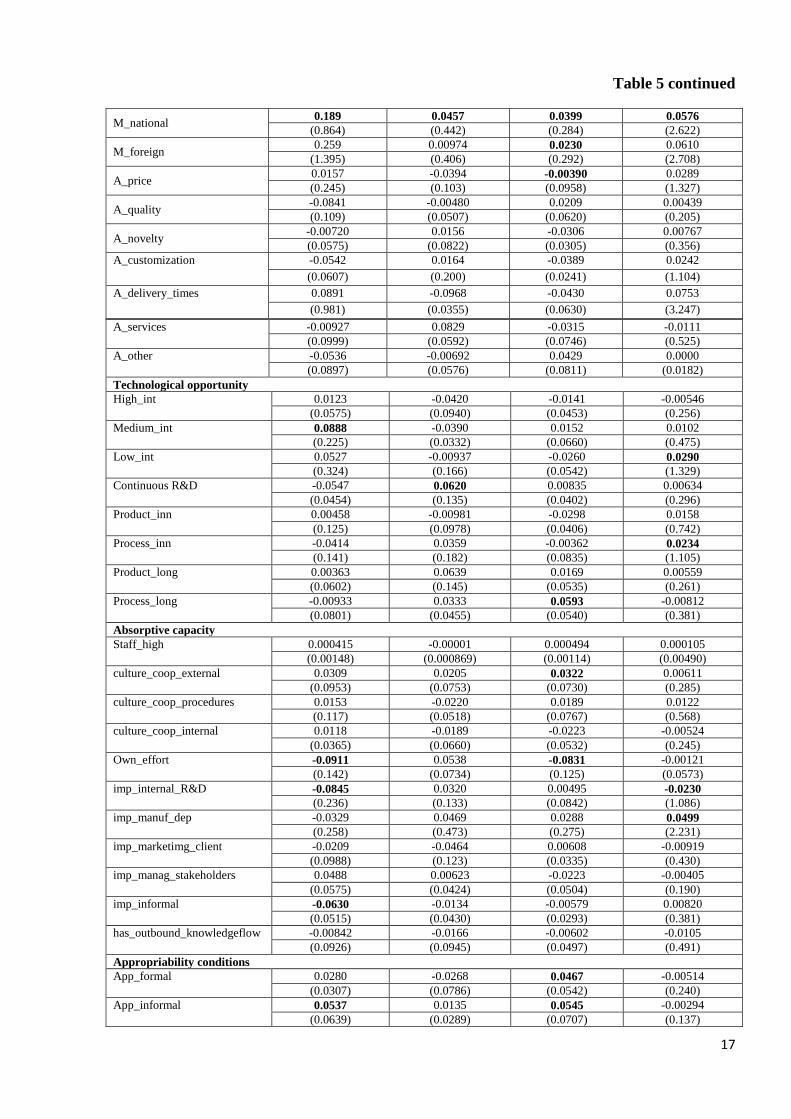
The analysis of factors determining the geographical pattern of cooperation (see Table 5)
revealed that state-owned high-tech firms prefer to develop national and global cooperative
networks, while young companies with low operating profit margins companies that implement
most of innovations on their own and recognize the importance of internal R&D have small
cooperation networks and collaborate mostly with clients and suppliers.
Absence of competitive advantage in price and timely delivery discourage firms to
develop national networking, but subject to the availability of public support and effective
mechanisms of IP protection. Enterprises performing innovation activity on a regular basis
motivates cooperate within a global value chain while taking full advantage of the potential
offered by local universities and research organizations.
Table 5 Determinants of innovation cooperation geographical scope (marginal effects)
Regional value-chain
Global value chain
and local knowledge
providers
National networking
Broader networking
and national
knowledge base
Base outcome vs clients and suppliers
Firm-specific characteristics
Log_size 0.00219 0.00365 0.0111 -0.00652
(0.0453) (0.0375) (0.00997) (0.304)
Age_less 5 -0.143 0.0990 -0.0738 0.0114
(0.189) (0.272) (0.0991) (0.527)
High_tech 0.283 -0.0864 0.0856 0.000786
(0.411) (0.119) (0.133) (0.0396)
Medium_high_tech 0.159 -0.0493 0.0331 0.00773
(0.318) (0.0429) (0.0862) (0.360)
Medium_low_tech 0.0765 -0.0653 -0.0139 0.0175
(0.281) (0.0320) (0.0440) (0.810)
Foreign -0.0314 -0.00137 -0.0235 0.00364
(0.0526) (0.0548) (0.0355) (0.170)
State 0.0210 0.0931 0.0467 0.00293
(0.0716) (0.170) (0.0889) (0.138)
Growth_1 (>30%decrease) -0.0379 0.0686 -0.00403 -0.00494
(0.111) (0.114) (0.0625) (0.233)
Growth_2 (10-30% decrease) 0.0117 -0.0170 0.0566 -0.00314
(0.0556) (0.0638) (0.0813) (0.148)
Growth_3 (+/- 10%) -0.0237 -0.0340 0.00135 0.0114
(0.0641) (0.0462) (0.0506) (0.530)
Growth_4 (10-30% increase) -0.0115 0.0113 -0.0118 0.00579
(0.0555) (0.0760) (0.0307) (0.270)
Growth_5 (>30% increase) 0.0931 0.0460 -0.0639 0.0300
(0.490) (0.331) (0.0725) (1.360)
ROS2 (0-2%) -1.171 -0.132 -0.0692 0.997
(0.0787) (0.0653) (0.0379) (0.478)
ROS3 (2-5%) -0.167 -0.133 -0.0680 0.999
(0.0706) (0.0709) (0.0474) (0.526)
ROS4 (5-10%) -0.166 -0.150 -0.0673 0.999
(0.0627) (0.0538) (0.0414) (0.453)
ROS5 (> 10%) -0.151 -0.132 -0.0731 0.998
(0.0710) (0.0622) (0.0368) (0.451)
Level of competitiveness
C_monopoly -0.0257 -0.0193 -0.0141 -0.0115
(0.117) (0.101) (0.0606) (0.539)
C_oligopoly -0.00147 -0.0243 0.00624 -0.0118
(0.0924) (0.109) (0.0401) (0.552)
M_regional 0.0789 0.0733 0.0133 0.0637
(0.734) (0.654) (0.270) (2.829)
17
Table 5 continued
M_national 0.189 0.0457 0.0399 0.0576
(0.864) (0.442) (0.284) (2.622)
M_foreign 0.259 0.00974 0.0230 0.0610
(1.395) (0.406) (0.292) (2.708)
A_price 0.0157 -0.0394 -0.00390 0.0289
(0.245) (0.103) (0.0958) (1.327)
A_quality -0.0841 -0.00480 0.0209 0.00439
(0.109) (0.0507) (0.0620) (0.205)
A_novelty -0.00720 0.0156 -0.0306 0.00767
(0.0575) (0.0822) (0.0305) (0.356)
A_customization -0.0542 0.0164 -0.0389 0.0242
(0.0607) (0.200) (0.0241) (1.104)
A_delivery_times 0.0891 -0.0968 -0.0430 0.0753
(0.981) (0.0355) (0.0630) (3.247)
A_services -0.00927 0.0829 -0.0315 -0.0111
(0.0999) (0.0592) (0.0746) (0.525)
A_other -0.0536 -0.00692 0.0429 0.0000
(0.0897) (0.0576) (0.0811) (0.0182)
Technological opportunity
High_int 0.0123 -0.0420 -0.0141 -0.00546
(0.0575) (0.0940) (0.0453) (0.256)
Medium_int 0.0888 -0.0390 0.0152 0.0102
(0.225) (0.0332) (0.0660) (0.475)
Low_int 0.0527 -0.00937 -0.0260 0.0290
(0.324) (0.166) (0.0542) (1.329)
Continuous R&D -0.0547 0.0620 0.00835 0.00634
(0.0454) (0.135) (0.0402) (0.296)
Product_inn 0.00458 -0.00981 -0.0298 0.0158
(0.125) (0.0978) (0.0406) (0.742)
Process_inn -0.0414 0.0359 -0.00362 0.0234
(0.141) (0.182) (0.0835) (1.105)
Product_long 0.00363 0.0639 0.0169 0.00559
(0.0602) (0.145) (0.0535) (0.261)
Process_long -0.00933 0.0333 0.0593 -0.00812
(0.0801) (0.0455) (0.0540) (0.381)
Absorptive capacity
Staff_high 0.000415 -0.00001 0.000494 0.000105
(0.00148) (0.000869) (0.00114) (0.00490)
culture_coop_external 0.0309 0.0205 0.0322 0.00611
(0.0953) (0.0753) (0.0730) (0.285)
culture_coop_procedures 0.0153 -0.0220 0.0189 0.0122
(0.117) (0.0518) (0.0767) (0.568)
culture_coop_internal 0.0118 -0.0189 -0.0223 -0.00524
(0.0365) (0.0660) (0.0532) (0.245)
Own_effort -0.0911 0.0538 -0.0831 -0.00121
(0.142) (0.0734) (0.125) (0.0573)
imp_internal_R&D -0.0845 0.0320 0.00495 -0.0230
(0.236) (0.133) (0.0842) (1.086)
imp_manuf_dep -0.0329 0.0469 0.0288 0.0499
(0.258) (0.473) (0.275) (2.231)
imp_marketimg_client -0.0209 -0.0464 0.00608 -0.00919
(0.0988) (0.123) (0.0335) (0.430)
imp_manag_stakeholders 0.0488 0.00623 -0.0223 -0.00405
(0.0575) (0.0424) (0.0504) (0.190)
imp_informal -0.0630 -0.0134 -0.00579 0.00820
(0.0515) (0.0430) (0.0293) (0.381)
has_outbound_knowledgeflow -0.00842 -0.0166 -0.00602 -0.0105
(0.0926) (0.0945) (0.0497) (0.491)
Appropriability conditions
App_formal 0.0280 -0.0268 0.0467 -0.00514
(0.0307) (0.0786) (0.0542) (0.240)
App_informal 0.0537 0.0135 0.0545 -0.00294
(0.0639) (0.0289) (0.0707) (0.137)

18
Table 5 continued
Public Support
PS_horizontal 0.0228 0.0467 0.0212 0.0107
(0.122) (0.152) (0.0779) (0.494)
PS_targeted -0.0407 0.125 0.000470 -0.00835
(0.115) (0.108) (0.0354) (0.392)
PS_networking 0.0291 0.0139 0.0852 -0.00401
(0.0567) (0.0478) (0.105) (0.188)
Number of observations = 805
Standard errors in parentheses
Statistically significant estimated multinomial logistic regression coefficients are marked in bold
chi2(200) = 475.61 Prob > chi2 = 0.0000
Pseudo R2 = 0.2137
The findings also highlight a strong positive impact of the effectiveness of protection
mechanisms for appropriating the benefits of successful innovations on firms’ cooperative
behavior. Availability of effective appropriability mechanisms, especially informal, increases the
probability of innovation cooperation and contributes to the cooperation with knowledge
producers, related industry actors and public authorities on the national level.
The availability of public support also facilitates the expansion of the cooperative
linkages. Results achieved underscore the findings of previous studies (i.e. Veugelers and
Cassiman (2005), Arranz and Fdez. De Arroyabe (2008), Badillo and Moreno (2016)).
Networking measures, such as programs for creation and support of technology platforms and
regional innovation clusters, are especially important for an intensive long-term cooperation with
universities and research organizations and the development of national networking.
5. Conclusion
This article provides evidence for the ongoing discussion on the factors influencing
firm’s cooperative strategy in innovation activities: decision to cooperate (or not) and
geographical pattern, and employs the firm-level data on the innovation activities of the Russian
manufacturing enterprises.
To keep pace with changes in the global business environment, that is characterized by a
high degree of dynamism, global and fierce competition, rapidly growing value and availability
of knowledge and other, companies are forced to align their innovation strategy and corporate
culture, and also to build external innovation networks.
Firms engage in cooperative relations with many different partners such as customers and
suppliers, related value-chain members, competitors, providers of services, universities, research
organizations, consulting firms or public authorities, each of which contribute in accordance with
their capacity and competences. The choice of cooperative innovation strategy depends on a
variety of factors, that could be divided into several categories based on the review of theoretical
and empirical studies: firm-specific characteristics, level of competition, technological
19
opportunities, absorptive capacity, appropriability conditions and the availability of public
support.
Innovation-active enterprises in Russian manufacturing cooperate with various external
actors along the whole innovation process quiet frequently, especially preferring to interact with
several partners simultaneously. However, the specific degree of participation of each party in
innovation development and implementation is non-observed.
The results indicate strong differences in determinants of innovation cooperation strategy
across different types of partners. Large incumbent companies in high-tech sectors prefer long-
term cooperation with R&D sector. Firms, in cooperation with universities and research
organizations, are mostly oriented towards foreign markets, have an adequate intellectual
protection system and receive public support. The availability of government support (i.e.
networking measures) facilitates expansion of the cooperative linkages, especially with
knowledge production sector promotes the development of national networking. Most
importantly, firms highly appreciate the contribution made by universities and research
organizations in innovation development and implementation process.
Focus on process innovation stimulates collaboration with providers of services and
related value-chain members. Such companies develop broader networking and rely on a
national knowledge base. At the same time, focus on product innovation and orientation on
national and foreign markets has a positive effect on cooperation with competitors. The lack of
competitive advantage in quality of products and price stimulate firms to cooperate with
suppliers of raw materials and consulting firms. Availability of effective appropriability
mechanisms contributes to cooperation with knowledge producers, related industry actors and
public authorities on the national level.
The obtained results are broadly consistent with other studies and confirm that, besides
general firm-specific characteristics, company’s capacity to identify, assimilate and apply
valuable external knowledge (absorptive capacity) affects most of their cooperative strategies in
innovation activities. Young companies that implement most of innovations on their own and
find internal R&D as important sources of information have small cooperation networks and
collaborate mostly only within the supply chain.
The revealed heterogeneity of the impact of endogenous and exogenous conditions for
the cooperation with different actors challenges the wide-spread simplified perception of
‘openness’ as a one-dimensional characteristic of the innovation strategy. This should be taken in
mind as a framing consideration in the theoretical modelling of the innovation processes as well
as the practical policy development aimed at intensified networking.

20
References
Abramovsky, L., Kremp, E., López, A., Schmidt, T., & Simpson, H. (2009). Understanding co-
operative innovative activity: Evidence from four European countries. Economics of Innovation
and New Technology, 18(3), 243-265.
Arranz, N. & de Arroyabe, J. C. F. (2008). The choice of partners in R&D cooperation: An
empirical analysis of Spanish firms. Technovation, 28(1), 88-100.
Arvanitis, S. (2012). How do different motives for R&D cooperation affect firm performance? –
An analysis based on Swiss micro data. Journal of Evolutionary Economics, 22(5), 981-1007.
Badillo, E. R., & Moreno, R. (2016). What drives the choice of the type of partner in R&D
cooperation? Evidence for Spanish manufactures and services. Applied Economics, 1-22
Bayona, C., Garcı́a-Marco, T. & Huerta, E. (2001). Firms’ motivations for cooperative R&D: an
empirical analysis of Spanish firms. Research Policy, 30(8), 1289-1307.
Becker, W., & Dietz, J. (2004). R&D cooperation and innovation activities of firms—evidence
for the German manufacturing industry. Research policy, 33(2), 209-223.
Belderbos, R., Carree, M., Diederen, B., Lokshin, B. & Veugelers, R. (2004). Heterogeneity in
R&D cooperation strategies. International journal of industrial organization, 22(8), 1237-1263.
Cappellari, L., & Jenkins, S. P. (2003). Multivariate probit regression using simulated maximum
likelihood. Stata Journal, 3(3), 278-294.
Cassiman, B., & Veugelers, R. (2002). R&D cooperation and spillovers: some empirical
evidence from Belgium. The American Economic Review, 92(4), 1169-1184.
Castellacci, F. (2007). Technological regimes and sectoral differences in productivity growth.
Industrial and corporate change, 16(6), 1105-1145.
Cohen, W. M., & Levinthal, D. A. (1990). Absorptive capacity: A new perspective on learning
and innovation. Administrative science quarterly, 128-152.
Cohen, W. M., Nelson, R. R., & Walsh, J. P. (2002). Links and impacts: the influence of public
research on industrial R&D. Management science, 48(1), 1-23.
Clark, K. B. (1989). Project scope and project performance: the effect of parts strategy and
supplier involvement on product development. Management science, 35(10), 1247-1263.
Dachs, B., Ebersberger, B., & Pyka, A. (2008). Why do firms cooperate for innovation? A
comparison of Austrian and Finnish CIS3 results. International Journal of Foresight and
Innovation Policy, 4(3-4), 200-229.
De Faria, P., Lima, F., & Santos, R. (2010). Cooperation in innovation activities: The importance
of partners. Research Policy, 39(8), 1082-1092.
De Faria, P., & Schmidt, T. (2012). International cooperation on innovation: Firm-level evidence
from two European countries. Innovation, 14(3), 303-323.
Edwards Schachter, M., Castro Martínez, E., & Fernández de Lucio, I. (2013). Motives for
International Inter-Firm Cooperation on R&D and Innovation: Literature Overview and Recent
Trends. Quality Innovation: Knowledge, Theory, and Practices: Knowledge, Theory, and
Practices, 225.
Fiaz, M., Naiding, Y. (2012). Exploring the barriers to R&D collaborations: a challenge for
industry and faculty for sustainable UI collaboration growth. International Journal of u-and e-
21
Service, Science and Technology, 5(2), 1-15.
Franco, C., & Gussoni, M. (2010). Firms’ R&D cooperation strategies: the partner choice.
Unpublished manuscript.
Fritsch, M., & Franke, G. (2004). Innovation, regional knowledge spillovers and R&D
cooperation. Research policy, 33(2), 245-255.
Garcia, R., Araujo, V., Mascarini, S., Gomes dos Santos, E., & Costa, A. (2015). An analysis of
the effects of the characteristics of research groups on their interactions with firms. Innovation
and Development, 5(1), 59-72.
Greene W.H. (2012). Econometric analysis. Boston: Prentice Hall, 7th edition, 306-308, 803-
805.
Hackett, E. J., Amsterdamska, O., Lynch, M., & Wajcman, J. (2008). The handbook of science
and technology studies. The MIT Press.
Hagedoorn, J. (2002). Inter-firm R&D partnerships: an overview of major trends and patterns
since 1960. Research policy, 31(4), 477-492.
Jaklic, A., Damijan, J. P., & Rojec, M. (2008). Innovation cooperation and innovation activity of
Slovenian enterprises. LICOS Centre for Institutions and Economic Performance Discussion
Paper, (201).
Kaiser, U. (2002). An empirical test of models explaining research expenditures and research
cooperation: evidence for the German service sector. International Journal of Industrial
Organization, 20(6), 747-774.
Kaufmann, A., & Tödtling, F. (2001). Science–industry interaction in the process of innovation:
the importance of boundary-crossing between systems. Research policy, 30(5), 791-804.
Kline, S. J., & Rosenberg, N. (1986). An overview of innovation. The positive sum strategy:
Harnessing technology for economic growth, 14, 640.
Lhuillery, S., & Pfister, E. (2009). R&D cooperation and failures in innovation projects:
Empirical evidence from French CIS data. Research policy, 38(1), 45-57.
Mansfield, E. (1998). Academic research and industrial innovation: An update of empirical
findings. Research policy, 26(7), 773-776.
Miotti, L., & Sachwald, F. (2003). Co-operative R&D: why and with whom. Research Policy,
32(8), 1481-1499.
OECD and Eurostat (2005). Oslo Manual: Guidelines for Collecting and Interpreting Innovation
Data, 3rd Edition, The Measurement of Scientific and Technological Activities, OECD
Publishing, Paris.
Padmore, T., Schuetze, H., & Gibson, H. (1998). Modeling systems of innovation: An
enterprise-centered view. Research Policy, 26(6), 605-624.
Pavitt, K. (2005) ‘Innovation processes’, in J. Fagerberg, D.C. Mowery and R.R. Nelson (Eds.)
The Oxford Handbook of Innovation, Oxford/New York: Oxford University Press, 86–114.
Powell, W., & Grodal, S. (2005) 'Networks of Innovators', in J. Fagerberg, D.C. Mowery and
R.R. Nelson (Eds.) The Oxford Handbook of Innovation, Oxford/New York: Oxford University
Press, 56–86.
Sánchez-González, G. (2013). Cooperation and non-technological innovations. In 35th DRUID
Celebration Conference.

22
Schmidt, T., Salomo, N., Mannheim, Z. E. W., & Schiller, F. (2007). The modes of industry-
science links. In DRUID Summer Conference.
Segarra-Blasco, A., & Arauzo-Carod, J. M. (2008). Sources of innovation and industry–
university interaction: Evidence from Spanish firms. Research Policy, 37(8), 1283-1295.
Srholec, M. (2014). Persistence of cooperation on innovation: Econometric evidence from panel
micro data (No. 2014/18). Lund University, CIRCLE-Center for Innovation, Research and
Competences in the Learning Economy.
Tether, B. S. (2002). Who co-operates for innovation, and why: an empirical analysis. Research
policy, 31(6), 947-967.
Un, C. A., & Asakawa, K. (2015). Types of R&D collaborations and process innovation: The
benefit of collaborating upstream in the knowledge chain. Journal of Product Innovation
Management, 32(1), 138-153.
Veugelers, R., & Cassiman, B. (2005). R&D cooperation between firms and universities. Some
empirical evidence from Belgian manufacturing. International Journal of Industrial
Organization, 23(5), 355-379.
Von Hippel, E., Thomke, S., & Sonnack, M. (1999). Creating breakthroughs at 3M. Harvard business
review, 77, 47-57.
Wu, J. (2014). Cooperation with competitors and product innovation: Moderating effects of
technological capability and alliances with universities. Industrial Marketing
Management, 43(2), 199-209.
Zhang, Y., & Li, H. (2010). Innovation search of new ventures in a technology cluster: the role
of ties with service intermediaries. Strategic Management Journal, 31(1), 88-109.

23
Appendix 1
Table A1
Review of empirical studies on R&D and innovation cooperation
Authors, Year of
publication
Title Country,
Survey Years
Dependent
Variables
Independent Variables Methodology Key Findings
Faria and
Schmidt, 2012
International
cooperation on
innovation: Firm-
level evidence from
two European
countries
Germany and
Portugal,
1998-2000
Cooperation
types:
Domestic
partner
Foreign partner
Export status, part of a
group, absorptive capacity
(in-house R&D activities,
the skill level of firms’
employees), innovation
intensity, incoming and
outgoing knowledge
spillovers, size, industry,
public funding
Bivariate
probit model
Statistically significant variables:
1. Domestic partner:
size (+), industry (+), part of a group (+), absorptive
capacity (+), public funding (+), outgoing spillovers
(+)
2. Foreign partner:
size (+), export status (+), part of a group (+),
absorptive capacity (+), public funding (+), outgoing
spillovers (+)
Veugelers and
Cassiman, 2005
R&D cooperation
between firms and
universities.
Some empirical
evidence from
Belgian
manufacturing
Belgium, 1993 Cooperation
with universities
Size, ownership, constraints
(risk and cost), own R&D
capacity, public funding,
vertical cooperation,
appropriability conditions
(strategic and legal),
incoming spillovers, export
intensity, cooperation with
universities at industry level
Instrumental
probit model
Statistically significant variables:
1. Cooperation with universities:
const (-), size (+), foreign (-), cost (-), risk (+),
cooperation with universities at industry level (+),
public funding (+), vertical cooperation (+)
2. Cooperation with universities (correction for
endogeneity for the complementary strategies):
const (-), risk (-), cooperation with universities at
industry level (+), public funding (+)
Kaiser, 2002 An empirical test of
models explaining
research
expenditures and
research
cooperation:
evidence for the
German service
sector
Germany,
1995
Binary choice
between
cooperation and
non-cooperation
Horizontal and vertical
spillovers, research
productivity, the generality
of the research approach,
market demand
Nested
multinomial
logit
(NMNL) and
Multinomial
logit model
(MNL)
Statistically significant variables:
1. Mixed cooperation:
R&D generality-approach (>3) (+), strong decrease in
sales (+), increase in sales (+), eastern German firms
(+)
2. No cooperation:
size (-), transport sector (-), R&D generality-
approach (>3) (-), R&D productivity science (-),
horizontal spillovers (-)

24
Table A1 continued
Miotti and
Sachwald, 2003
Co-operative R&D:
why and with
whom? An
integrated
framework of
analysis
France, - Cooperation
types:
horizontal,
vertical,
institutional
Size, part of a group,
industry, public funding,
market share, permanent
R&D, constraints (risk and
cost), lack of information
(market and technological)
Logit
regression
model
Statistically significant variables:
1. Vertical cooperation:
const (-), size (+), part of a group (-), lack of market
information (+)
2. Cooperation with public institutions:
const (-), size (+), public funding (+), permanent R&D
(-), science (+), cost (-)
3. Horizontal cooperation:
const (-), size (+), public funding (+), high-tech
industry (+), cost (+)
Dachs,
Ebersberger and
Pyka, 2008
Why do firms
cooperate for
innovation? A
comparison of
Austrian and
Finnish CIS3
results
Finland and
Austria, 1995
1) Innovation
activity; Product
innovation,
Process
innovation
2) Cooperative
behavior: any
partner,
suppliers,
customers,
competitors,
universities and
research
institutions
Size, part of a group,
industry, export status,
innovation expenditure,
diversification of the
innovative efforts,
hampering factors (internal
and economic), internal
knowledge flow, basicness
of R&D, appropriability
conditions (strategic and
formal), public funding,
incoming spillovers,
innovation type, speed of
technological development,
labor productivity
Multivariate
logit model
Statistically significant variables (ex. Finland):
1. Collaboration with suppliers:
const (-), public funding (+), diversification of the
innovative efforts (+), process and product innovation
(+), internal knowledge flow (+), appropriability
conditions (strategic and formal) (+), incoming
horizontal and vertical spillovers (+)
2. Collaboration with customers:
const (-), public funding (+), appropriability conditions
in industry (-), process and product innovation (+),
diversification of the innovative efforts (+),
appropriability conditions (strategic and formal) (+),
incoming horizontal and vertical spillovers (+)
3. Collaboration with competitors:
const (-), public funding (+), labor productivity (+),
process innovation (+), innovation expenditure (+),
horizontal incoming spillovers (+)
4. Collaboration with universities and research
organizations:
const (-), public funding (+), labor productivity (+),
continuous of R&D (+), product innovation (+),
diversification of the innovative efforts (+), internal
knowledge flow (+), appropriability conditions (+),
incoming horizontal (-) and vertical (+) spillovers,
basicness of R&D (+)

25
Table A1 continued
Badillo and
Moreno, 2016
What drives the
choice of the type
of partner in R&D
cooperation?
Evidence for
Spanish
manufactures and
services
Spain, 2006-
2008
Cooperation
types:
horizontal,
vertical,
institutional
Group
cooperation
Size, part of a group, sector,
public support, R&D
intensity, appropriability
conditions (legal), incoming
spillovers, constraints (risk
and cost), lack of qualified
personnel, export intensity
Multivariate
probit
model
Statistically significant variables:
1. Vertical cooperation:
const (-), incoming spillovers (+), legal protection (+),
R&D intensity (+), subsidies (+), part of a group (+),
size (+)
2. Cooperation with public institutions:
const (-), incoming spillovers (+), R&D intensity (+),
risk (-), subsidies (+), part of a group (+), large size
(+), industrial sector (-)
3. Horizontal cooperation:
const (-), incoming spillovers (+), R&D intensity (+),
subsidies (+), part of a group (+), size (+), industrial
sector (-)
4. Group cooperation:
const (-), incoming spillovers (+), legal protection (+),
risk (-), public finding - subsidies (+), size (+),
industrial sector (-), part of a group (+)
Franco and
Gussoni, 2010
Firms’ R&D
cooperation
strategies: the
partner choice
Italy,
2002-2004
Cooperation
types: market,
science, mixed
Incoming spillovers,
appropriability, size, sector,
export status, costs of
innovation, subsidies -
public funding, participation
in a multinational group,
permanent R&D
Multinomial
logit model
Statistically significant variables:
1. Market vs Mixed cooperation:
const (+), size (-), subsidies (-), incoming spillovers (-),
appropriability conditions (-), permanent R&D (-),
export status (+), manufacturing industry (+)
2. Science vs Mixed cooperation:
const (-), incoming spillovers (-), export status (+),
manufacturing industry (+)
3. Market vs Science cooperation:
const (+), size (-), subsidies (-), appropriability
conditions (-), permanent R&D (-)

26
Table A1 continued Belderbos,
Carree, Diederen,
Lokshin and
Veugelers, 2004
Heterogeneity in
R&D Cooperation
Strategies
Netherlands19
96 and 1998
Cooperation
types:
horizontal,
vertical,
institutional
Incoming spillovers
(vertical, horizontal,
institutional), industry
outgoing spillovers, R&D
intensity, size, industry,
ownership, part of a group,
constraints (organizational
capability, risk, cost), speed
of technological change,
internal knowledge flows,
R&D subsidy
Multivariate
probit model
Statistically significant variables:
1. Vertical cooperation:
const (-), horizontal (-), vertical (+), institutional (+),
incoming spillovers, R&D intensity (+), R&D intensity
squered (-), size (+), organizational capability
constraint (+), risk constraint (+), service (+), part of a
group (+), R&D subsidy (+)
2. Cooperation with public institutions:
const (-), institutional incoming spillovers (+), R&D
intensity (+), size (+), organizational capability
constraint (+), speed of technological change (+), R&D
subsidy (+)
3. Horizontal cooperation:
const (-), institutional incoming spillovers (+), size (+),
industry average firm size (+), risk constraint (+),
speed of technological change (+), service (+), foreign
multinational (-)
Arranz and Fdez.
de Arroyabe,
2008
The choice of
partners in R&D
cooperation: An
empirical
analysis of Spanish
firms
Spain, 1997 Cooperation
types:
horizontal,
vertical,
institutional
Size, part of a group,
industry, permanent R&D,
incoming spillovers
(science), external R&D,
obstacles (risk and cost),
lack of market information
and technological
information, public funding
Logit
regression
model
Statistically significant variables:
1. Vertical cooperation:
const (+), size (+), part of a group (+), high-tech,
medium-high-tech industry (+), public funding (+),
lack of market and technology (+)
2. Cooperation with public institutions:
const (+), part of a group (+), high-tech, medium-tech
industry (+), external R&D (+), public funding (+)
3. Horizontal cooperation:
const (+), size (+), permanent R&D (+), high-tech
industry (+), cost (+), risk (+), public funding (+)

27
Table A1 continued
De Faria, Lima
and Santos, 2010
Cooperation in
innovation
activities: The
importance of
partners
Portugal,
1998-2000
1) Cooperation
decision in
innovation
activities
2) Importance
of cooperation
partners
Size, Industry; Export share;
Part of a group; Engagement
R&D; Employees education;
Innovation intensity;
Incoming knowledge
spillovers; Appropriability;
Cooperation within the same
group, suppliers,
clients or customers,
competitors, consultants,
commercial
labs or R&D labs,
universities and government
research institutions
1) Selection
probit model
2) Probit
model
Statistically significant variables:
1) Const (-); Size (+), Export share (+); Part of a group
(+); Engagement R&D (+); Employees education (+);
Innovation intensity (+); Appropriability (+)
2) Const (-); Engagement R&D (+); Innovation
intensity (+); Cooperation within the same group (+),
suppliers (+), High-tech (+)
Abramovsky,
Kremp, Lopez,
Schmidt,
Simpson, 2008
Understanding co-
operative
innovative activity:
evidence from four
European countries
France,
Germany, UK,
Spain, 1998-
2000
Cooperation
types: research
base; suppliers
or customers;
competitors
Incoming spillovers;
Appropriability; Industry-
level legal protection;
Constraints; Public support;
R&D intensity; Size;
Industry
OLS
regression
Statistically significant variables:
Incoming spillovers (+); Public support (+);
Appropriability (+); Industry-level legal protection (-);
Constraints (+); R&D intensity [with the research
base] (+); Size (+); Industry (+)
Srholec, 2014 Persistence of
cooperation on
innovation:
Econometric
evidence from
panel micro data
the Czech
Republic, 5
waves of CIS:
1999-2001;
2008-2010
Cooperation
types: suppliers,
customers,
competitors,
consultants,
research
institutes,
universities
Past cooperation on
innovation (1-3 lags);
characteristics of the firm:
continuous R&D activity;
part of a group; age; size;
industry; period of
observations;
Multivariate
Probit
Model
Statistically significant variables:
past cooperation on innovation (+); continuous R&D
activity (+); part of a group (+); size (+)

28
Table A1 continued
Tether, 2002 Who co-operates
for innovation, and
why. An empirical
analysis
United
Kingdom,
1997
Cooperation
types:
customers,
suppliers,
competitors,
universities,
consultants,
other
Size, ownership, part of a
group, sector, R&D
intensity, type of innovation,
obstacles (risk, cost, internal,
regulations), lack of
information on market and
technology, lack of qualified
personnel
Logistic
regression
Statistically significant variables:
1. Cooperation with suppliers:
const (-), size (+), utilities (+), low-tech-services (-),
R&D at least on an occasional basis (+), continuous
and high intensity R&D (+), lack of customers
responsiveness to innovation (+), lack of technology (-
), obstacles risk and finance (+)
2. Cooperation with customers:
const (-), foreign (+), high-tech manufacturing and
services (+), R&D at least on an occasional basis (+),
continuous R&D (+),‘new to the market’ innovations
(+), lack of customers responsiveness to innovation (+),
lack of information on markets (+)
3. Cooperation with competitors:
const (-), size (+), utilities (+), high and low-tech
services (+), R&D at least on an occasional basis (+),
continuous R&D (+), ‘new to the market’ innovations
(+), lack of customers responsiveness to innovation (+)
4. Cooperation with universities:
const (-), size (+), part of a group (+), utilities (+),
high-tech manufacturing (+), low-teck services (-),
R&D at least on an occasional basis (+), continuous
R&D and high intensity (+)
5. Cooperation with consultants:
const (-), size (+), foreign (+), utilities (+), high and
low-tech services (+), R&D at least on an occasional
basis (+), continuous R&D (+), obstacles risk and
finance (+)
6. Other cooperation types:
const (-), new firm (+), size (+), utilities (+), medium-
tech manufacturing (+), high-tech services (+),
obstacles risk and finance (+)

29
Appendix 2
Table A2
Sample characteristics
Manufacturing sector Innovation-
active
Has at least one
cooperation partner
Food and Beverages 83 81
Textiles, clothing and shoes 58 58
Wood and paper 50 47
Printing and Publishing 47 46
Petrochemistry, coal and nuclear fuel 21 20
Rubber, plastics and nonmetallic goods 55 53
Chemical production 54 53
Pharmaceuticals 41 40
Metallurgy 51 50
Metallic products 60 60
Machinery and Equipment 94 93
Precision instruments and computers 44 44
Railway transport and shipbuilding 43 43
Automobiles 27 27
Aircraft and space 23 22
Other manufacturing 54 53
Total 805 790

30
Appendix 3
Table A3
Construction of the explanatory variables
Variable Type Construction
Fir
m-s
pec
ific
ch
arac
teri
stic
s
Size Continuous Log of the average number of employees in 2013 (at least 10)
Age_less 5 Dummy One, if a firm was established after 2010
Industry
High-tech Dummy One, if a firm belongs to high technology manufacturing based on
NACE Rev. 1.1 codes
Medium-high-tech Dummy One, if a firm belongs to a medium-high technology industry based on
NACE Rev. 1.1 codes
Medium-low-tech Dummy One, if a firm belongs to a medium-low technology industry based on
NACE Rev. 1.1 codes
Base level:
Low-tech Dummy
One, if a firm belongs to a low technology industry based on NACE
Rev. 1.1 codes
Ownership
Foreign Dummy One, if a firm has foreign ownership
State Dummy One, if a firm has state ownership
Rate of business growth
> 30% decrease Dummy One, if the average annual changes in the number of employees (in the
past 3 years) are more than 30% decrease
10-30% decrease Dummy One, if the average annual changes in the number of employees (in the
past 3 years) are 10-30% decrease
minor variation (+/-
10%) Dummy
One, if the average annual changes in the number of employees (in the
past 3 years) are in interval +/- 10%
10-30% increase Dummy One, if the average annual changes in the number of employees (in the
past 3 years) are 10-30% increase
> 30% increase Dummy One, if the average annual changes in the number of employees (in the
past 3 years) are more than 30% increase
Base level:
Ambiguous changes Dummy
One, if One, if the average annual changes in the number of employees
(in the past 3 years) were ambiguous
Profitability of sales
0-2% Dummy One, if the return on sales in 2013 (before tax) was 0-2%
2-5% Dummy One, if the return on sales in 2013 (before tax) was 2-5%
5-10% Dummy One, if the return on sales in 2013 (before tax) was 5-10%
>10% Dummy One, if the return on sales in 2013 (before tax) was more than 10%
Base level:
Negative Dummy One, if the return on sales in 2013 (before tax) was negative
Lev
el o
f co
mpet
itio
n
Market structure
Monopoly Dummy One, if a firm has no direct competitors or has less than 2
Oligopoly Dummy One, if a firm has 2-5 principal competitors
Base level:
Competition Dummy One, if a firm has more than 5 principal competitors
Markets for future development
Regional Dummy One, if prospects for company development are associated with regional
markets
National Dummy One, if prospects for company development are associated with national
markets
Foreign Dummy One, if prospects for company development are associated with foreign
markets
Base level:
Local market Dummy
One, if prospects for company development are associated with local
markets

31
Table A3 continued
Lev
el o
f co
mpet
itio
n
Competitors' advantages
Price Dummy One, if prices of products are the most explicitly represent advantages of
competitors
Quality Dummy One, if quality of products are the most explicitly represent advantages
of competitors
Novelty Dummy One, if novelty of products are the most explicitly represent advantages
of competitors
Customization Dummy One, if adaptation of products according to customers' requirements are
the most explicitly represent advantages of competitors
Delivery Dummy One, if prices of products are the most explicitly represent advantages of
competitors
Services Dummy One, if prices of products are the most explicitly represent advantages of
competitors
Other Dummy One, if competitors have other advantages
Tec
hnolo
gic
al O
pport
unit
ies
Investment intensity in innovation
High Dummy One, if the share of total expenditure on innovation activities in the total
turnover in 2013 is less than 2.5%
Medium Dummy One, if the share of total expenditure on innovation activities in the total
turnover in 2013 is from 2.5 to 10%
Low Dummy One, if the share of total expenditure on innovation activities in the total
turnover in 2013 is more than 10%
Base level:
Lack of investment Dummy One, if there were no costs for implementation of new products in 2013
Importance of innovation types for business success
Regular R&D Dummy One, if regular research and development is important for firm's business
success
Product innovation Dummy One, if product innovation are important for firm's business success
Process innovation Dummy One, if process innovation are important for firm's business success
Long_product
innovation Dummy
One, if the period of product innovation development / implementation
is more than 3-5 years
Long_process
innovation Dummy
One, if the period of process innovation development / implementation is
more than 3-5 years
Ab
sorp
tive
Cap
acit
y
Staff_high Share Number of graduated employees and employees with a Candidate of
Sciences, Doctor of Sciences (or PhD) degree
Culture_coop external Dummy
One, if executives and the management welcomes the involvement of
external partners and cooperation at various stages of development and
implementation of innovations
Culture_standard
procedures Dummy
One, if the enterprise has developed standard procedures for interaction
with the implementing partners of research and development (including
the regulatory framework, the criteria for assessing the quality of results,
etc.)
Culture_coop internal Dummy One, if an exchange of ideas is practiced among the various units of the
company without the direct involvement of the management
Own effort Dummy One, if the majority of implemented innovations were developed
predominately by firms’ own
Importance of information sources
Internal R&D Dummy One, if internal R&D are important sources of information
Manufacturing
departments Dummy One, if manufacturing departments are important sources of information

32
Table A3 continued
Ab
sorp
tive
Cap
acit
y Marketing and/or
client services Dummy
One, if marketing departments and/or client services are important
sources of information
Management team
and/or stakeholders Dummy
One, if company's management team and/or stakeholders are important
sources of information
Informal sources of
information Dummy
One, if informal sources of information (ex. scientific literature, patent
information, trade fairs and other professional events) are important
sources of information
Outbound knowledge
flow Dummy
One, if the company performed technology acquisition/transfer in 2011-
2013
Ap
pro
pri
abil
ity
Co
nd
itio
ns Formal methods of IP
protection Dummy One, if the firm uses formal methods of intellectual property protection
Informal methods of
IP protection Dummy One, if the firm uses informal methods of intellectual property protection
Pu
bli
c
Su
pp
ort
Horizontal Dummy One, if the firm received horizontal public support between 2011-2014
Targeted Dummy One, if the firm received targeted public support between 2011-2014
Networking Dummy One, if the firm received networking public support between 2011-2014

33
Appendix 4
Table A4
Distribution of surveyed firms by the fact of innovation cooperation and its location (%)
Cooperation partner Consumers/
Clients
Suppliers
of raw
materials
Related
value-
chain
members
Providers
of
services
Competitors Research
organizations Universities
Consulting
firms
Public
authorities
Cooperation a
No 22.0 25.7 62.5 66.8 80.7 72.9 77.8 90.9 77.1
Yes 78.0 74.3 37.5 33.2 19.3 27.1 22.2 9.1 22.9
Location b
Regional 67.8 61.0 64.6 79.0 56.8 59.2 70.9 58.9 79.3
National 53.7 56.5 50.0 39.7 55.5 62.8 45.8 41.1 37.5
Foreign 14.2 23.7 8.3 11.6 17.4 7.8 3.4 12.3 1.6
a Percentage of the total innovation active firms operating in the manufacturing sector (N = 805)
b Percentage of the total innovation active firms in the manufacturing sector involved in innovation cooperation
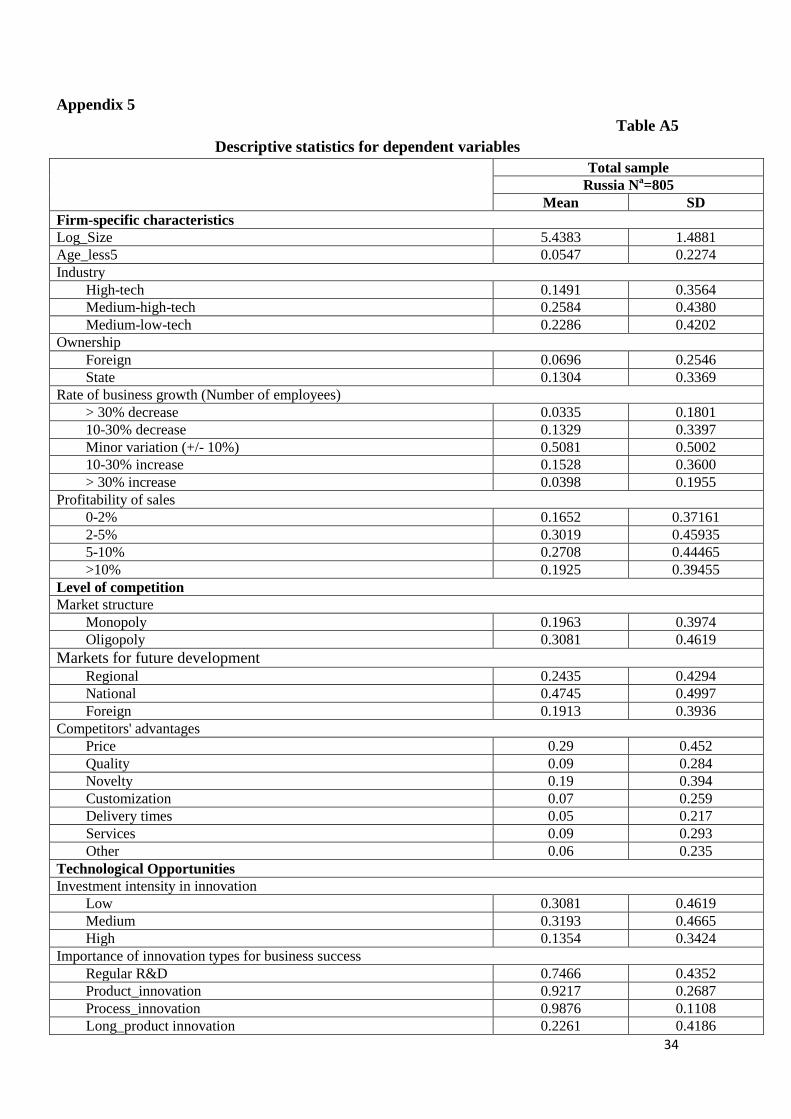
34
Appendix 5
Table A5
Descriptive statistics for dependent variables
Total sample
Russia Na=805
Mean SD
Firm-specific characteristics
Log_Size 5.4383 1.4881
Age_less5 0.0547 0.2274
Industry
High-tech 0.1491 0.3564
Medium-high-tech 0.2584 0.4380
Medium-low-tech 0.2286 0.4202
Ownership
Foreign 0.0696 0.2546
State 0.1304 0.3369
Rate of business growth (Number of employees)
> 30% decrease 0.0335 0.1801
10-30% decrease 0.1329 0.3397
Minor variation (+/- 10%) 0.5081 0.5002
10-30% increase 0.1528 0.3600
> 30% increase 0.0398 0.1955
Profitability of sales
0-2% 0.1652 0.37161
2-5% 0.3019 0.45935
5-10% 0.2708 0.44465
>10% 0.1925 0.39455
Level of competition
Market structure
Monopoly 0.1963 0.3974
Oligopoly 0.3081 0.4619
Markets for future development Regional 0.2435 0.4294
National 0.4745 0.4997
Foreign 0.1913 0.3936
Competitors' advantages
Price 0.29 0.452
Quality 0.09 0.284
Novelty 0.19 0.394
Customization 0.07 0.259
Delivery times 0.05 0.217
Services 0.09 0.293
Other 0.06 0.235
Technological Opportunities
Investment intensity in innovation
Low 0.3081 0.4619
Medium 0.3193 0.4665
High 0.1354 0.3424
Importance of innovation types for business success
Regular R&D 0.7466 0.4352
Product_innovation 0.9217 0.2687
Process_innovation 0.9876 0.1108
Long_product innovation 0.2261 0.4186
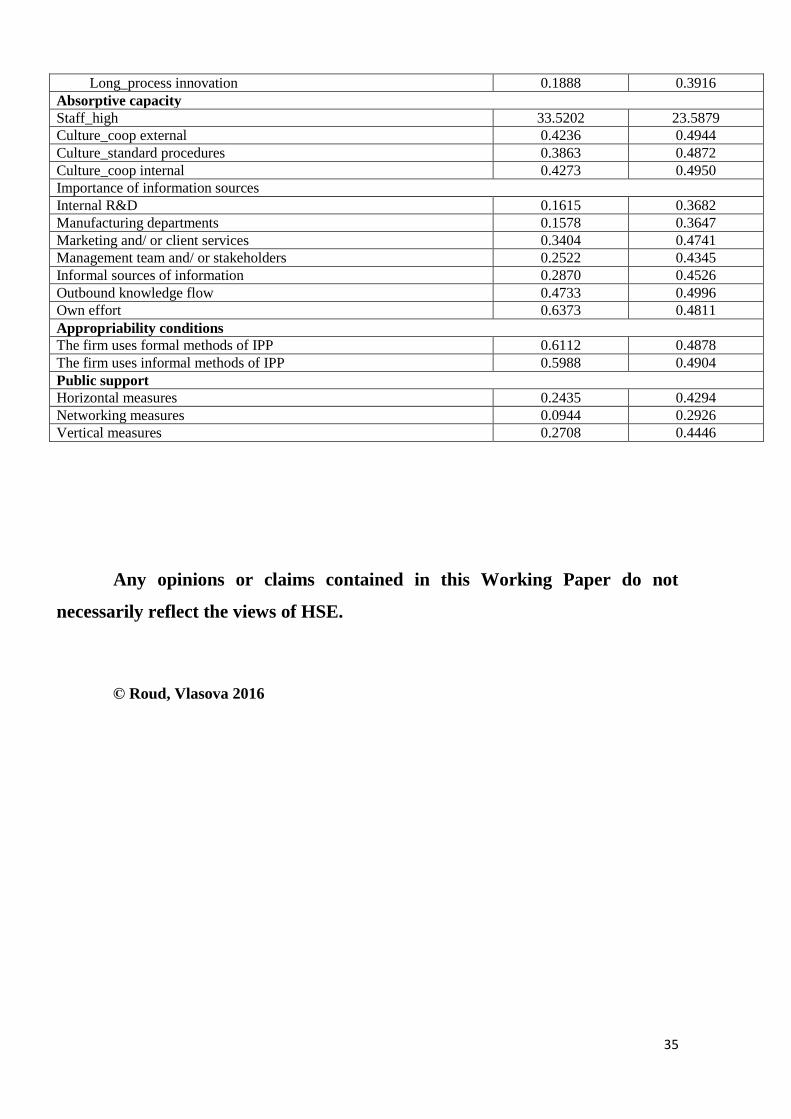
35
Long_process innovation 0.1888 0.3916
Absorptive capacity
Staff_high 33.5202 23.5879
Culture_coop external 0.4236 0.4944
Culture_standard procedures 0.3863 0.4872
Culture_coop internal 0.4273 0.4950
Importance of information sources
Internal R&D 0.1615 0.3682
Manufacturing departments 0.1578 0.3647
Marketing and/ or client services 0.3404 0.4741
Management team and/ or stakeholders 0.2522 0.4345
Informal sources of information 0.2870 0.4526
Outbound knowledge flow 0.4733 0.4996
Own effort 0.6373 0.4811
Appropriability conditions
The firm uses formal methods of IPP 0.6112 0.4878
The firm uses informal methods of IPP 0.5988 0.4904
Public support
Horizontal measures 0.2435 0.4294
Networking measures 0.0944 0.2926
Vertical measures 0.2708 0.4446
Any opinions or claims contained in this Working Paper do not
necessarily reflect the views of HSE.
© Roud, Vlasova 2016


