Firearm-related violent crime - Statistics Canada
2
1. Ottawa refers to the Ontario part of the Ottawa-Gatineau Census metropolitan area. 2. Excludes the portions of Halton Regional Police and Durham Regional Police that police the Census metropolitan area of Toronto. Note: Excludes Quebec. Source: Statistics Canada, Canadian Centre for Justice Statistics, Uniform Crime Reporting Survey. Victims of police-reported violent crime where a firearm was present, five largest Census metropolitan areas, 2009 to 2017 Police-reported crime involving firearms, Canada, 2009 to 2017 In Canada, there were 130 homicides committed using a handgun in 2016, the most since 2005. These accounted for 21% of homicides overall, and 58% of shooting homicides. Since 1996, handguns have been used in 16% to 21% of homicides each year, except for 1998 (13%). In the United States, there were 7,105 homicides using a handgun in 2016. These accounted for 47% of all homicides. Firearm-related violent crime does not include non-violent or administrative-type firearm offences—such as break and enter to steal a firearm or unsafe storage—as these data are collected and reported separately. Firearm-related violent crime Firearm-related violent crime For more information on Statistics Canada data on firearm-related crime in Canada, consult the following: º Firearm-related violent crime in Canada, 2016 º Firearms and violent crime in Canada, 2016 º Police-reported crime statistics in Canada, 2017 º Statistics Canada tables Firearm-related violent crime declined 33% from 2009 to 2013, reaching its lowest point in recent years. The downward trend stopped in 2013 and, since then, it has gone up 42%. Between 2013 and 2017, 16 of Canada’s Census metropolitan areas saw increases in their rate of firearm-related violent crime, including 7 of the 10 largest. Of note, 43% of the national increase since 2013 is due to more victims in Toronto. Each year since 2009, about six in ten firearm-related violent crimes involved handguns. Source: Statistics Canada, Canadian Centre for Justice Statistics, Uniform Crime Reporting Survey. Note: Break and enter includes the Criminal Code offences of break and enter to steal a firearm and break and enter of a motor vehicle to steal a firearm. 10 15 20 25 30 35 40 45 2009 2010 2011 2012 2013 2014 2015 2016 2017 rate per 100,000 population Ottawa Toronto Calgary Edmonton Vancouver Canada - Firearm-related violent crime shows the number of victims of violent Criminal Code offences where a firearm was fired or used as a threat, and/or where a firearm was present and not used but the presence of the firearm was relevant to the incident, according to the police. 1 2 0.0 0.1 0.2 0.3 0.4 0.5 0.6 0.7 0.8 1996 1998 2000 2002 2004 2006 2008 2010 2012 2014 2016 rate per 100,000 population Years Shooting Stabbing Beating Note: Populations are based upon July 1st estimates from Statistics Canada, Demography Division. Source: Statistics Canada, Canadian Centre for Justice Statistics, Homicide Survey. Year number rate per 100,000 number rate per 100,000 2009 309 0.9 1,208 3.6 2010 673 2.0 1,196 3.5 2011 772 2.3 1,077 3.1 2012 913 2.6 1,115 3.2 2013 918 2.6 1,053 3.0 2014 1,000 2.8 990 2.8 2015 1,164 3.2 962 2.7 2016 1,272 3.5 993 2.7 2017 1,175 3.2 921 2.5 Break and enter Unsafe storage Homicides, by most common method, Canada, 1996 to 2016
Transcript of Firearm-related violent crime - Statistics Canada
1. Ottawa refers to the Ontario part of the Ottawa-Gatineau Census metropolitan area.2. Excludes the portions of Halton Regional Police and Durham Regional Police that police the Census metropolitan area of Toronto.Note: Excludes Quebec.Source: Statistics Canada, Canadian Centre for Justice Statistics, Uniform Crime Reporting Survey.
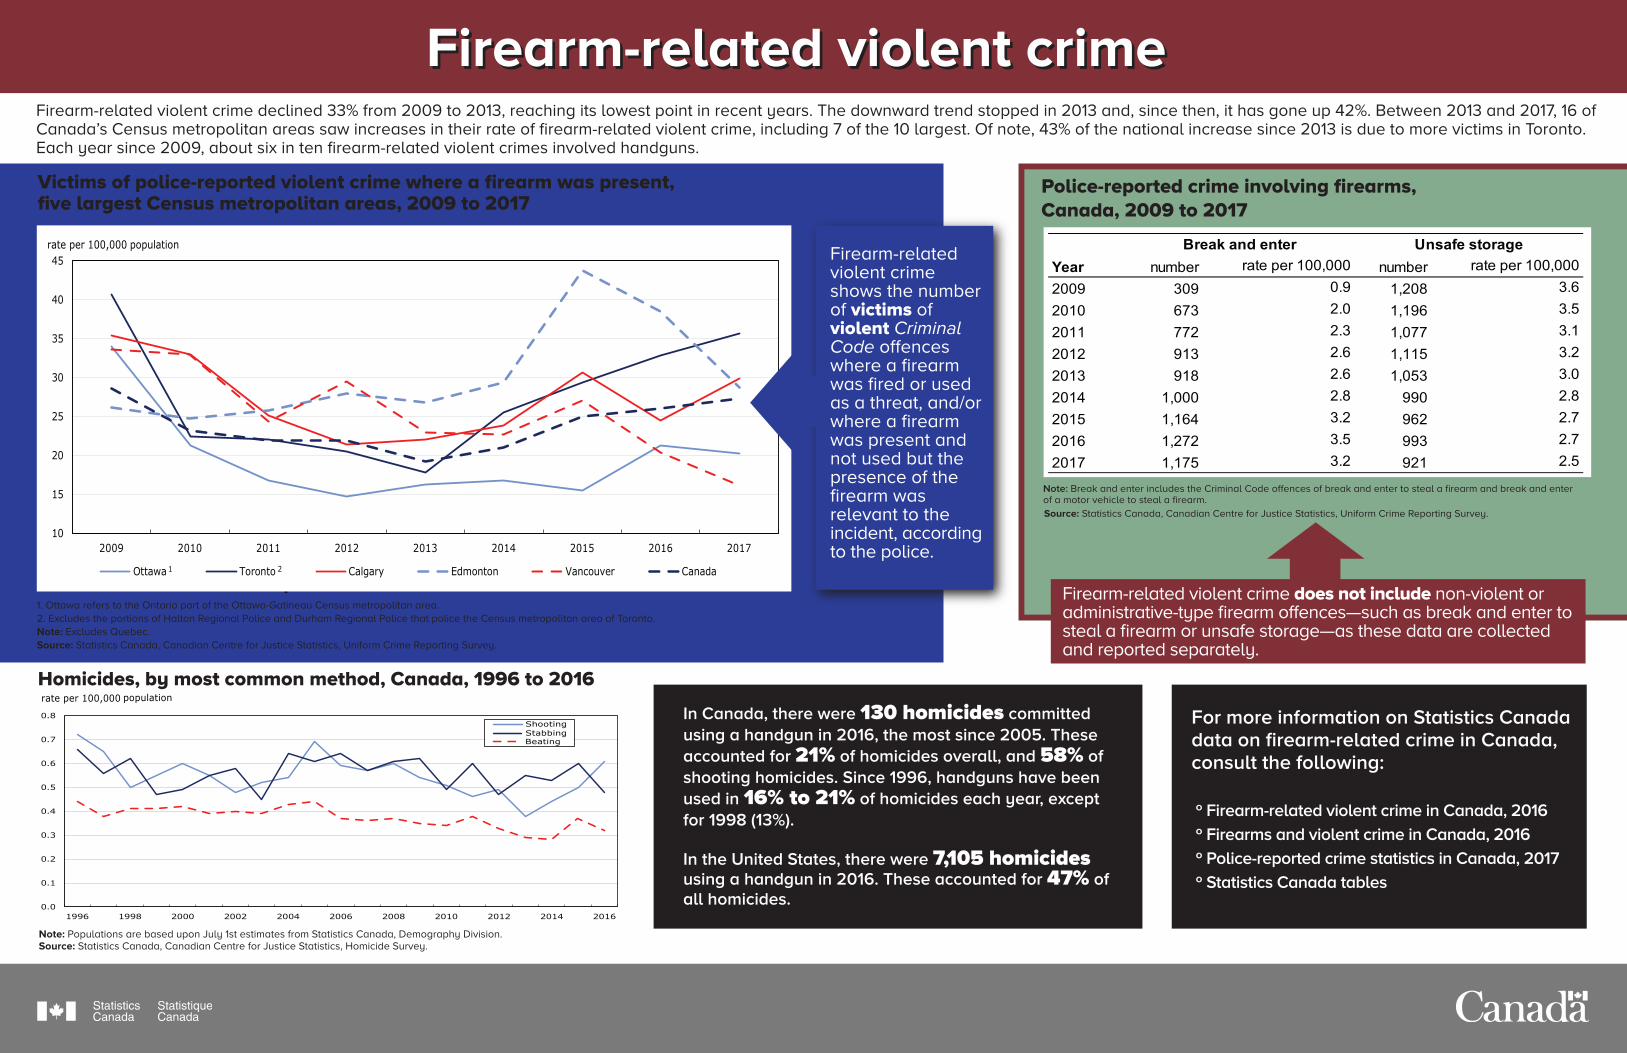
Victims of police-reported violent crime where a firearm was present,five largest Census metropolitan areas, 2009 to 2017
Police-reported crime involving firearms,Canada, 2009 to 2017
In Canada, there were 130 homicides committed using a handgun in 2016, the most since 2005. Theseaccounted for 21% of homicides overall, and 58% of shooting homicides. Since 1996, handguns have been used in 16% to 21% of homicides each year, except for 1998 (13%).
In the United States, there were 7,105 homicides using a handgun in 2016. These accounted for 47% ofall homicides.
Firearm-related violent crime does not include non-violent or administrative-type firearm offences—such as break and enter to steal a firearm or unsafe storage—as these data are collected and reported separately.
Firearm-related violent crimeFirearm-related violent crime
For more information on Statistics Canada data on firearm-related crime in Canada, consult the following:
º Firearm-related violent crime in Canada, 2016
º Firearms and violent crime in Canada, 2016
º Police-reported crime statistics in Canada, 2017
º Statistics Canada tables
Firearm-related violent crime declined 33% from 2009 to 2013, reaching its lowest point in recent years. The downward trend stopped in 2013 and, since then, it has gone up 42%. Between 2013 and 2017, 16 of Canada’s Census metropolitan areas saw increases in their rate of firearm-related violent crime, including 7 of the 10 largest. Of note, 43% of the national increase since 2013 is due to more victims in Toronto. Each year since 2009, about six in ten firearm-related violent crimes involved handguns.
Source: Statistics Canada, Canadian Centre for Justice Statistics, Uniform Crime Reporting Survey.
Note: Break and enter includes the Criminal Code offences of break and enter to steal a firearm and break and enter of a motor vehicle to steal a firearm.
10
15
20
25
30
35
40
45
2009 2010 2011 2012 2013 2014 2015 2016 2017
rate per 100,000 population
Ottawa Toronto Calgary Edmonton Vancouver Canada
-
Firearm-related violent crime shows the number of victims of violent Criminal Code offences where a firearm was fired or used as a threat, and/or where a firearm was present and not used but the presence of the firearm was relevant to the incident, according to the police.
1 2
0.0
0.1
0.2
0.3
0.4
0.5
0.6
0.7
0.8
1996 1998 2000 2002 2004 2006 2008 2010 2012 2014 2016
rate per 100,000 population
Years
ShootingStabbingBeating
Note: Populations are based upon July 1st estimates from Statistics Canada, Demography Division.Source: Statistics Canada, Canadian Centre for Justice Statistics, Homicide Survey.
Year number rate per 100,000 number rate per 100,0002009 309 0.9 1,208 3.62010 673 2.0 1,196 3.52011 772 2.3 1,077 3.12012 913 2.6 1,115 3.22013 918 2.6 1,053 3.02014 1,000 2.8 990 2.82015 1,164 3.2 962 2.72016 1,272 3.5 993 2.72017 1,175 3.2 921 2.5
Break and enter Unsafe storage
Homicides, by most common method, Canada, 1996 to 2016

number rate1 number rate1 number rate1 number rate1 number rate1 number rate1 number rate1 number rate1 number rate1
Canada 7,305 28.6 5,997 23.2 5,707 21.9 5,776 21.9 5,126 19.2 5,681 21.0 6,809 24.9 7,201 26.0 7,660 27.3 ↓ ↑St. John's 16 8.4 16 8.2 26 13.0 7 3.5 28 13.8 18 8.8 15 7.3 19 9.1 25 12.0 ↑ ↓Halifax 170 43.2 118 29.6 165 41.0 171 42.0 104 25.4 80 19.3 67 16.1 61 14.4 107 24.8 ↓ ↓Moncton 22 16.2 12 8.7 40 28.6 55 38.8 27 18.9 35 22.6 24 15.4 66 41.8 47 29.5 ↑ ↑Ottawa2 316 34.0 199 21.2 160 16.8 142 14.7 159 16.3 165 16.7 155 15.6 216 21.3 209 20.2 ↓ ↑Kingston 26 16.3 10 6.2 8 4.9 12 7.3 14 8.5 9 5.4 11 6.6 10 6.0 20 11.8 ↓ ↑Peterborough 14 11.7 16 13.2 10 8.3 18 14.8 26 21.3 5 4.1 19 15.5 18 14.5 11 8.8 ↓ ↓Toronto3 2,056 40.7 1,151 22.4 1,151 22.1 1,086 20.5 955 17.8 1,391 25.6 1,616 29.4 1,837 32.9 2,032 35.7 ↓ ↑Hamilton4 190 36.0 186 35.0 180 33.6 182 33.6 123 22.5 150 27.2 141 25.4 177 31.6 220 38.7 ↑ ↑St.Catharines-Niagara 119 27.0 64 14.5 73 16.5 58 13.0 65 14.6 63 14.1 44 9.8 69 15.2 65 14.2 ↓ ↓Kitchener-Cambridge-Waterloo 84 16.4 93 18.0 90 17.2 114 21.5 81 15.2 70 13.0 67 12.4 107 19.4 120 21.4 ↑ ↑Brantford 21 16.0 20 15.1 25 18.8 23 17.2 38 28.1 14 10.3 25 18.2 26 18.7 32 22.7 ↑ ↓Guelph 8 6.5 6 4.8 5 4.0 13 10.2 15 11.7 9 7.0 15 11.5 11 8.3 8 5.9 ↓ ↓London 115 23.7 118 24.1 95 19.3 94 18.9 63 12.6 53 10.5 61 12.0 82 15.9 60 11.4 ↓ ↓Windsor 75 25.0 66 22.1 67 22.4 49 16.3 51 17.0 43 14.3 68 22.5 70 22.9 82 26.6 ↑ ↑Barrie 13 9.5 17 12.2 11 7.8 17 11.9 27 18.7 14 9.6 18 12.1 26 17.2 30 19.5 ↑ ↑Greater Sudbury 31 18.8 20 12.1 19 11.5 10 6.1 20 12.1 16 9.7 19 11.5 9 5.5 16 9.7 ↓ ↓Thunder Bay 14 11.7 24 20.0 14 11.7 8 6.7 14 11.5 17 14.0 23 19.0 11 9.1 27 22.4 ↑ ↑Winnipeg 295 38.9 304 39.7 306 39.4 247 31.2 243 30.3 230 29.1 290 35.8 396 49.8 473 58.4 ↑ ↑Regina 58 27.3 56 25.9 57 25.8 45 19.8 60 25.7 63 26.4 76 31.4 155 62.5 116 45.7 ↑ ↑Saskatoon 95 36.1 100 37.0 77 27.8 109 38.1 65 22.0 91 30.0 143 46.3 98 30.8 157 48.1 ↑ ↑Calgary 434 35.5 410 32.9 319 25.2 280 21.4 301 22.1 336 23.8 442 30.7 359 24.4 446 29.9 ↓ ↑Edmonton 306 26.2 295 24.8 312 25.7 347 27.9 345 26.8 389 29.3 593 43.7 532 38.5 404 28.7 ↑ ↑Kelowna 38 21.3 44 24.3 32 17.5 34 18.4 29 15.5 40 21.0 35 18.0 40 20.2 31 15.4 ↓ ↓Abbotsford-Mission 63 36.9 61 35.3 36 20.7 33 18.7 36 20.2 39 21.6 61 33.2 31 16.4 45 23.6 ↓ ↑Vancouver 773 33.6 772 32.9 578 24.4 711 29.5 561 22.9 565 22.7 680 27.1 519 20.4 416 16.2 ↓ ↓Victoria 57 16.4 30 8.5 34 9.6 31 8.7 31 8.6 20 5.5 23 6.3 24 6.4 34 9.0 ↓ ↑
2015 2016
Source: Statistics Canada, Canadian Centre for Justice Statistics, Uniform Crime Reporting Survey.
Note: A census metropolitan area (CMA) consists of one or more neighbouring municipalities situated around a major urban core. A CMA must have a total population of at least 100,000 of which 50,000 or more live in the urban core. To be included in the CMA, other adjacent municipalities must have a high degree of integration with the central urban area, as measured by commuting flows derived from census data. A CMA typically comprises more than one police service. The Oshawa CMA is excluded from this table due to the incongruity between the police service jurisdictional boundaries and the CMA boundaries. Excludes Quebec due to the large proportion of cases where the most serious weapon present was reported as unknown and the CMA of Saint John due to data quality concerns.
4. Excludes the portion of Halton Regional Police that polices the CMA of Hamilton.
3. Excludes the portions of Halton Regional Police and Durham Regional Police that police the CMA of Toronto.2. Ottawa refers to the Ontario part of the Ottawa-Gatineau CMA.1. Rates are calculated on the basis of 100,000 population. CMA populations have been adjusted to follow policing boundaries.
change since 2009
change since 2013
2017Census metropolitan area
Year2009 2010 2011 2012 2013 2014
Victims of police-reported violent crime involving a firearm, by census metropolitan area, 2009 to 2017
Firearm-related violent crimeFirearm-related violent crime