FIRE RESEARCH STATION - International Association for · PDF fileFIRE RESEARCH STATION ......
84
Fire Research Note No. 958 PRESSURISATION OF ESCAPE ROUTES IN BUILDINGS P J Hobson and L J Stewart FIRE RESEARCH STATION © BRE Trust (UK) Permission is granted for personal noncommercial research use. Citation of the work is allowed and encouraged.
Transcript of FIRE RESEARCH STATION - International Association for · PDF fileFIRE RESEARCH STATION ......
Fire Research NoteNo. 958
PRESSURISATION OF ESCAPEROUTES IN BUILDINGS
P J Hobson and L J Stewart
FIRERESEARCHSTATION
© BRE Trust (UK) Permission is granted for personal noncommercial research use. Citation of the work is allowed and encouraged.

Heating & Ventilating Research AssociationOld Bracknell LaneBr-ackne.ll, BerkshireRGl2 4AH
Fire Research StationBorehamwoodHertsTel 01. 953.6177

Research Contract CR 10248
PRESSURISATION OF ESCAPE ROUTES IN BUILDINGS
by
P J Hobson and L J Stewart
SUMMARY
FR Note 958December 1972
This paper reports the results of studies made to provide specific
design requirements for mechanical ventilation systems (often called
"pressurisation" systems) for keeping escape routes in buildings clear
of smoke and toxic gases.
The contraGt was placed and originally supervised by the Directorate
of Research and Information of the Ministry of Public Building and Works,
supervision being transferred to the Fire Research Station following the
creation of the Department of the Ehvironment.
KEY WORDS: El3cape means, pressurisation, building, smoke,
movement, air.
Crown copyright
DEPARmENT OF THE ENVIRONMENT AND FIRE OFFICES' COMMITTEE
JOINT FIRE RESEARCH ORGANIZATION

Section 1.
2.
3.
4.
5.
6.
7.
8.
9.
CONTENTS
Introduction
Pressure Acting on and in Buildings
Air Leakage Characteristics of Buildings
Requirements for Pressurisation
Mechanical Pressurisation Systems
Reliability of Plant for Operating Pressurisation Systems
Performance of Existing Pressurisation Systems
De~ign Information for Pressurisation Systems
Future Research into Smoke Control vithin Buildings
Appendix A
References
Illustrations
Diagrams
Page
6
11
17
27
35
39
47
57
58
61

ACKNOWLEDGEMENT
In carrying out the work and preparing the report for
this contract, much advice and guidance vas received from the
DOE Steering Committee, which was represented by the following:-
Mr. E.G. Butcher
Mr. A.J.M. Heselden } BRE, Fire Research Station
DOE
Mr. M. Hall
Mr. R.K. Tarrant
Mr. E.I. Brimelow
Mr. W.J. Millward
Mr. A.B. Fuller
Mr. R.J. Oughten
Dr. 8.J. Leach
Dr. G.M.B. Webber} BRE, Watford
The Association is indebted to the members of this
Co~ttee for their help.
In addition, the assistance and co-operation of officers of
Essex County and the City of Sheffield Fire Brigades in carrying
out the site tests and providing Plates 4-6 is gratefully acknowledged.

INTRODUCTION
1.
It is 'common to think of mechanical ventilation as simply a process for providing fresh
air and removing contaminated air. The process can be and is used in more sophisticated
applications, for example in the control of airborne bacteria in hospi tals and obnoxious fumes in
laboratories. The application of ventilation to the control of the movement of smoke in the event
of a fire has also been practised, in particular it has been applied to the removal of smoke from
fires below ground level. More recently the use of mechanical ventilation has been advocated
for keeping escape routes in buildings clear of smoke and toxic gases in the event of a fire and
such schemes are now in existence. This technique has a number of advantages but this is an
application where the safety of life is at stake and the ventilation system serving this purpose
must meet t.h i e obligation under emergency conditions. The design, constructional and operational
requirements for such systems needs then to be clearly defined.
The technique of keeping escape routes clear of smoke and toxic gases by mechanical
ventilation as discussed in this paper has acquired the title of "pressurisation" and the systems
performing this function are being c~led "pz-es sur-i s at.Lon systems". This terminology arises
because the rjov must ajvays be a¥/'a;y from the escape routes and to achieve this they mus t be at a
higher pressu~e than surrounding areas.
The Joint Fire Research Organisation (JFRO) and others have demonstrated that uni-directional
air flow in buildings can control smoke movement; the application of this to buildings requires a
knowledge of all the forces that can influ~nce air distribution patterns under emergecy conditions.
The HVRA became involved in an ad hoc way in this problem through our studies of air movement in
tall buildings under the action of wind and buoyancy (stack) effects. At this time proposals
were being advanced for putting mechanical pressurisation systems in new buildings and a need for
more specific design requirements for these seemed apparent. The HVRA put to the Department of
the Environment a proposal to study pressurisation and prepare a set of design requirements for
pressurisation systems. The DOE accepted this proposal and this study was undertaken between
October 1970 and July 1972 under the terms of Research Contract CR 102~8.
In carrying out this task we have looked at the following problems:
(i) The pressures acting on and in buildings which can influence the internalair flow patterns and hence the efficacy of pressurisation.
(ii) The influence of mechanical ventilation plant. other than pressurisationsystems, on internal. air flow patterns.
(iii) The air leakage characteristics of building construction so that the~ air supply requirements for press~isation could be determined.
(iv) The requirements of air distribution plant for pressurisation toachieve the design objectives.
(v) The reliability of pressurisation systems.
We tackled (i) and (ii) by theoretical means using an HVRA computer program. CRKFLO, to
study the behaviour of buildings under the actions of wind, stack and fire effects and also of
verrt i Latingor air conditioning plant. For item (iii) we have checked published data on air flow
around closed doors, wi.ndows and through masonry structures and we amplified this Lnf'orma't i.on
with site measurements in typical situations. We have examined the technical and economic
requirements for distributing air to pressurised escape routes and have drawn on our own studies
of plant reliability to comment on the probable availability of mechanical pressurisation plant
and standby needs in an emergency. We "have visited completed buildings which have pressurisation
- 1 -

systems installed and have measured their performance and compared these with the specification.
The results of our study of these problems are set out in this report and we have
concluded the report with a concise set of design requirements for pressurisation systems.
1. 1 Princn.p Zes of Proessurisation
Recognition of smoke .IJJld toxic gases as major hazards to life in building fires
(1,2) has contributed to current attitudes towards controlling smoke movement, alongside
more traditional ideas of limiting fire spread. MOvement of air, under the influence of
temperature and pressure, is the vehicle for smoke spread. Pressurisation therefore
involves the control of air movement such that flow is always away from areas required
to be maintained smoke-free.
In practice this may be achieved by the use of mechanical ventilation plarrt to
inject sufficient air to maintain the area at a higher pressure than adjacent zones,
relying on natural leakage thrOUgh gaps around doors to non-pressurised zones to create
an outward air flow from the pressurised area. Generally escape routes are the areas
required to be kept smoke free so that flow should typically be from stairwells to lobby
or corridor to accommodation space and atmosphere. The excess pressure necessary for
pressurisation is deemed to be that providing protection when adverse conditions induced
by external and internal influences, e.g. wind and fire pressures, act against the needs
for air movement to be always outwards from the escape routes.
The principles behind pressurisation are established procedure in other fields
which require controlled air movement, such as explosion protection in hazardous
industries and prevention of cross-infection in hospitals. In fact the first known
feasibility study in Britain by DOE Fire Branch in 1959 was based on the earlier work
of James Ferguson and Ian Mackenzie, DOE engineers engaged·on the control of radio-active
contaminated atmosphere through doors and other openings.
1.2 Backgroound to HVRA Controact
During the late 1950's and early 1960's, a rapid increase in the number of high
rise buildings highlighted the inadequacy of existing "means of escape" regulations.
Following the lead of London County Council the lobby approach staircase gained
acceptance as a means ot; providing both a bridgehead on each floor for fire-fighting
operations and an added precaution against smoke entering-the staircase.
This trend placed severe restrictions on architects Who, wanting to put available
letting space to the best economic use, were instead confined to staircases and lobbies
-on external walls for the provision of the necessary natural ventilation. Against a
background of economic pressure for internal staircases, various ideas for mechanical
or natural ventilation as an alternative were tried. This led to natural vent shafts or
mechanical extraction from staircases but these posed the problem of encouraging smoke
movement towards the staircases. Consequently the idea of pressurisation of escape
routes by the mechanical introdu~ti9n of air was evolved.
Meanwhile parallel developments in Canada, Australia and U.S.A., where concern over
the evacuation time required for tall buildings was felt, were serving as guidelines for
new techniques being introduced in the U.K. Same tests at a new department store (3)
involving JFRO showed that positive pressurisation ~f a staircase was a feasible means of
- 2 -

keeping such an escape route clear or smoke. Following this, investigations by JFRO
using a four storey tower building demonstrated the practicability of pressurisation in
a real fire situation. A report of this work (4) was included in a Symposium on The
Movement of Smoke on Escape Routes, at Watford, 1968, which stimulated interest in
pressurisation.
On the basis of JFRO's work, some new buildings were constructed incorporating
pressuri sed staircases but a lack of design information for the mechanical ventilation
systems required was apparent. Uncertainty as to the r-eIevancy of Canadian methods and
design information in this countc-y led to the commencement of this study by HVRA under
contract to OOE in 1970.-
1.3 Ob.jectives of HVRA st;udy
These were to produce such information as would enable pressurisation systems
to be accurately and economically designed, and to show that this information could lead
to satisfactory designs in practice.
To achieve these objectives, the proposed study was' to include the following
aspects;
1) Collection of data on air leakages through doors and structural elements so
that the air flow requirements ror pressurisation can be established.
A search or available literature and other sources of information was proposed
to obtain air leakage characteristics of such ·building components that are
likely to be f01..U1d in lobbies and stairwells.
2) Site tests to establish air leakage characteristics of. actual lobbies. The
purpose of these tests was to assist in relating information from 1) above
to actual situations.
3) Study methods of distributing air vertically in buildings and to compare their
technical and economic aspects. (This would include an assessment of the
contribution that may be made by ventilation plant installed for occupants or
equipment in buildings).
4) Examine, using computer techniques, the effect of temperature differences and
wind pressures on the performance of pressurisation systems. This would
show how temperature and wind may affect the distribution of air from a
mechanical system.
5) ~ assessment of the reliability of different methods of operating
pressurisation systems and advising on the need for standby plant.
6) Investigation of the site performance of two or three systems in operation
to assess their behaviour in the light of information collated by this study.
1.4 Survey of other' zJor'k on pressurisation
Prior to the commencement or study of the aspects listed in 1.3, a survey was made
to determine the existing state of knowledge and practice of pressurisation both in this
count.r-y and abroad. Further information also came to light later in the course of the
project. A summary of this information given below represents the bulk of published and
unpublished work from the United Kingdom, USA, Canada and Australia, though studies of
smoke control problems have been made in other countries, including Japan and France.
- 3 -

1.4.1
1. 4.2
1. 4. 3
. Uni ted Kingdom
Preliminary experiments with pressurisation were carried out by the Joint Fire
Research Organisation and the Building Research Station (3) on the 3-storey staircase o~
a new department store. Pressurisation of the staircase was varied and, using a portable
smoke generator, it was found that a pressure difference of just under O.03i~.
wg (7.5 N/m2 ) was sufficient to prevent the entry of smoke through the door gaps. It
was suggested that this value be increased to 0.05 in. wg (12.5 N/m2) to cater for poor
fitting doors, and that higher values yet would be required for systems coming into
operation on demand, to ensure fairly rapid clearance of smoke already in the escape
route.
In subsequent tests at JFRO on an experimental four storey building, "Butcher et a:l
(4) demonstrated the effectiveness' of pressurisation in preventing smoke from an actual
fire entering the staircase. ~ In addition they measured the pressure differential developed
across the top of the staircase door, while smoke and hot-gases flowed into the staircase.
It was concluded that pressurisation of 0.1 - 0.2 in. wg (25-50 N/m2) was necessary to
override pressure differences produced by both this and adverse weather conditions.
U.S.A.
In 1964, the San Di~go and Los Angeles Fire Department investigated the use of
mechanical ventilation in smoke-proof enclosures (i.e. lobby approach staircases). They
found that the best system was to pressurise the stairshaft to 0.05 in. ;g (12.5 N/m2)
above atmospheric pressure, with the lobby maintained at a pressure not less than 0.1 in.
wg below that of the stairshaft. A minimum discharge of 2500 cfm is required from the
top of the. stairshaft to ensure adequate air movement. These provisions were subsequently
written into the Uniform Building Code (7) and are illustrated in Fig. 1. The lobby is
designed to act as a sm?ke- and heat-trap.
Further tests were carried out by the Los Angeles Fire Department (8), which
·resulted in their adding refinements to the above system (9). These include provision
for a minimum exhaust of 2500 cfm from ecch of three lobbies while the doors from them to
the staircase are held· open, and mechanical devices to control the air flow in the lobby.
The Los Angeles system has been criticised recently (10) as being unnecessarily
complicated.
Canada
An extensive programme of research into problems of smoke control in tall
buildings has been undertaken by the National Research Council of Canada. A critical
look at the evacuation time required in the event of fire in.....such buildings in relation
to the speed of smoke spread (11) highlights the concern felt. Full scale measurements
of the pressure differences caused by wind (12), temperature "differences (13,14) and
mechanical ventilation (13) were made in several buildings, the air leakage characteristics
of which were derived. From experience gained in these measurements, a computer analysis
of pressurisation (15) and smoke movement (16) under various conditions was made. It was
concluded from the latter that the major influence on smoke spread in the event of a fire
was stack effect which, because of the very low temperatures sustained in Canadian
winters, could produce smoke logging of upper floors within a short periOd of time. In
addition to the work on mechanical pressurisation, studies have been made of the use·of
natural venting to control smoke movement (17,18).
- 4 -

1. 4.4
1.5
The. culmination of the Canadian work was an explanatory document (19) setting out
the principles of smoke control, and the requirements for seven alternative methods of
aChieving them in practice. These range from natural ventilation to fully pressurised
buildings. Pressurisation requirements are given in terms of the air supply necessary,
but the general aim is to provide a pressure difference of 0.1 in. wg (25 N/m2) across
closed doors (20). Since an emergency opening of at least 20 ft2 (2m2) is required at the
bottom of stairwells, the air flow rates needed to pressurise stairwell enclosures are
rather large. Where the lobbies adjoining stairwells are pressurised instead however,
the vent serves to keep the lobbies at a higher pressure than the stairs.
Australia
Although no work appears to have been published, the Commonwealth Experimental
Building Station (21) has carried out some experiments with pressurisation_ in a test
building similar to that used by JFRO. In addition a draft document (22) of the
Standards Association of Australia lays down requirements for pressurisa~ion systems.
These provide for a positive pressure difference between an escape route and adjacent
areas of not more than 0.2 in. wg (50 N/m2) when all doors to the escape route are closed
and secondly an average air velocity of 250 fpm (1.3 m/s) through the doors, when not less
than 10% of them are open.
Current trends in pressuPisatior. design in the U. K.
At the start of the contract several new buildings incorporating pressurisation
systems were under construction and two of these, a tall office block ~n Cardiff and
new legal offices in London, came into operation shortly afterwards. In both of these,
staircases in a central service core were pressurised at two levels, a continuous low
level for normal operation, boosted to a higher one under emergency conditions. In the
first case the design was based 'on empiriCal air change rates, not related to any specific
pressure difference. The staircases at the law courts building were designed to be
pressurised to 7.5 N/m2 continuously during the day and boosted to 25 N/m2 in an emergency,
the latter figure to be achieved while one of the doors to the staircase was held open.
Several other buildings with pressurisation have reached completion more recently.
Performance tests on three of these are described later. In general the design
pressurisation of staircases, lobbies or both was 50 N/m2 under fire conditions. Design
figures were based on the work of JFRO, whose advice was usually sought by the local fire
authority in the initial stages of development. '
- 5 -
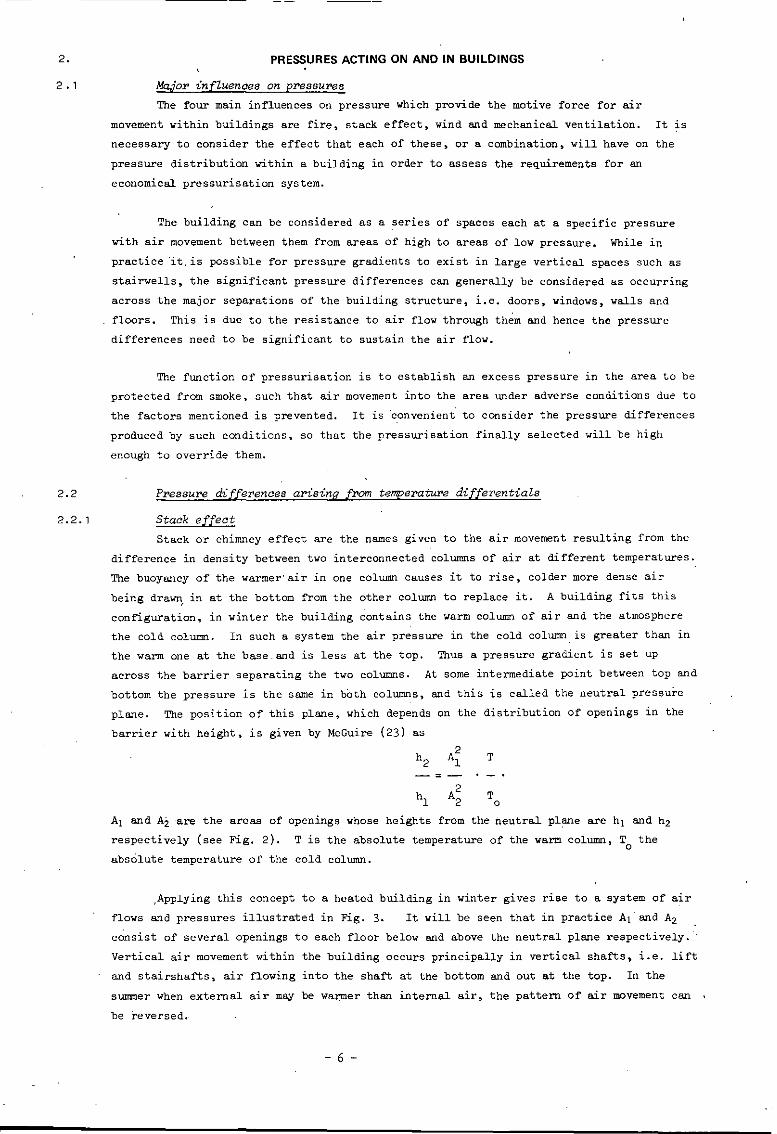
2. PRESSURES ACTING ON AND IN BUILDINGS
2 . 1 Ma,ior influenaes on pressures
The four main influences on pressure which provide the motive force for air
movement within buildings are fire, stack effect, wind and mechanical ventilation. It is
necessary to consider the effect that each of these, or a combination, will have on the
pressure distribution within a building in order to assess the requirements for an
economical pressurisation system.
The building can be considered as a series of spaces each at a specific pressure
with air movement between them from areas of high to areas of low presSure. While in
practice "it, is possible for pressure gradients to exist in large vertical spaces such as
stairwells, the significant pressure differences can generally be considered us occurring
across the major separations of the building structure, i.e. doors, windows, walls and
floors. This is due to the resistance to air flow through th~m and hence the pressure
differences need to be significant to sustain the air flow.
The function of pressurisation is to establish an excess pressure in the area to be
protected from smoke, such that air movement into the area under adverse conditions due to
the factors mentioned is prevented. It is 'convenient to consider the pressure differences
produced by such conditions, so that the pressurisation finally selected will be high
enough to override them.
2.2
2.2.1
Pressure differences arising from temperature differentials
Stack effect
Stack or chimney effect are the names given to the air movement resulting from the
difference in density between two interconnected columns of air at different temperatures.
The buoyancy of the warmer'air in one column causes it to rise, colder more dense air
being drawn! in at the bottom from the other column to replace it. A building fits this
configuration, in winter the building contains the warm column of air and the atmosphere
the cold column. In such a system the air pressure in the cold column is greater than in
the warm one at the base. and is less at the top. Thus a pressure gradient is set up
across the barrier separating the two columns. At some intermediate point between top and
bottom the pressure is the same in both columns, and this is called the neutral pressure
plane. The position of this plane, which depends on the distribution of openings in the
barrier with height, is given by McGuire (23) as
T
To
temperature of the warm column, To
Al and A2.are the areas of openings whose heights
respectively (see Fig. 2). T is the absolute
absolute temperature of the cold column.
from the neutral p'Lane are h j and h2
the
,Applying this concept to a heated building in winter gives rise to a system of air
flows and pressures illustrated in Fig. 3. It will be seen that in practice AI' and A2
consist of several openings to each floor below and above the neutral plane respectively.
Vertical air movement within the building occurs principally in vertical shafts, i.e. lift
and stairshafts, air flowing into the shaft at the bottom and out at the top. In the
summer when external air may be wanner than internal air, the pattern of air movement can
be reversed.
- 6 -

2.2.2
2.2.3
The height of the "neutral plane is determined by the relative leakage areas of the
buildings structure at high and lOW" levels. Generally these are about equal in typical.
buildings so that the neutral plane is at or near mid-height.
It is possible by providing sufficiently large openings at the top or bottom of a
building to shift the neutral plane close to the position of the opening. This is the
underl~ing principle behind natural venting to control smoke movement. Assunaog winter
stack conditions, the pressure in a top vented shaft will be less than that on each floor
of' the building. Air flow is into the shaft at all levels and out of the vent, so forming
a smokeshaft. Similarly the pressu~ in a bottom vented shaft is higher than that in the
rest of the building, and air flow from stack effects is always from t~e shaft to
accommodation areas. Smoke is prevented from entering the Shaft, which is effectively
pressurised. The success of such methods is obviously dependent on there being favourable
weather conditions.
Temperatures - U.K.
The design outside temperatures for heating and ventilating installation given by
the IHVE Guide are _1°C in winter and up to 28°c in summer. An internal temperature of
210C is common practice for design purposes. Clearly the largest temperature differential
is likely to occur in winter. The winter design figures are optimistic when considering
stack effect since instantaneous temperatures should be considered rather than the daily
average temperature as a suitable basis for designing systems whose purpose is to preserve
life of building occupants. The range of mean minimum monthly temperatures i s given by
Quenzel (35) as -10°C ~o +290C. A survey of minimum temperatures from Met. office data
appeared to bear out the use of the more critical winter temp. (-10°C) as a suitable basis
for calculating likely extremes of temperature difference between inside and outside of
buildings in the U.K.
Pressure differoential due to stack
The pressure difference due to stack is given 1.0 the IHVE Guide as:
~p 3462 h ( 1 1 H/m2 --2.1T T
°where h = distance from neutral plane, m.
T = absolute temperature outside. OK.
°T absolute temperature inside, OK
For a temperature
gradient caused by stack
difference of 31°C (T = 2630K.
T = 294oK)
the pressure°is 1.4 N/m2 per metre vertical distance from neutral plane.
2.3
It can be seen that the maximum pressure difference across the enclosure due to
stack effect can be doubled if the neutral plane is moved from mid-height to the top
or bottom of the building.
The pressure differential due to stack distributes itself across the external
and internal separations in proportion to relative flow resistances.
P1'essure developed by a fi1'e
a fire is produced by two mechanisms,
a fire compartment rises, the gases expand in direct proportion
2.3.1 Expansion
Air movement in the neighbourhood of
expansion due to temperature rise and stack effect. Firstly as the temperature within
to their absolute
- 7 -

2.4
2.4.1
temperature. Two to three volumes of hot gases may be displaced from the room depending
on the maximum temperature attained by the fire. Increases in pressure are small in
comparison to absolute pressure since the expansion process is relieved by the flow of
gases. out through the nonnal. leakage paths of the room: In an explosive situation, the
pressure rise would be much larger and f'airly rapid and would clearly result in windows
and doors being blown out.
Stack effect
For doors separating escape routes from corridors and accommodation areas the
pressures developed due to expansion can be neglected in relation to the second mechanism,
stack effect. This is because expansion of gases from the fire zone can take place into
the remaining area of that floor of' the building producing a minimal pressure change.
If' the fire developed fully over the floor area the high temperature may lead to f'ailure
of the external facade, alternatively the natural leakage of' the facade would relieve
the internal pressure. The stack effect also acts across separations like closed doors
where the two sides are at different temperatures; this happens when a fire occurs on
one side of the door. Typical~y smoke and hot gases flow out of' the gap at the top of a
door to be replaced by cool air, drawn in through the gap at the bottom. The adverse
pressure diff'erence developed at the top of the door is proportional to the ·distance from
'the neutral pressure plane, as given by equation 2.1. 'Ihe maximum value which can be
attained in a single floor is obviously limited very much by the height of' the compart
ment. For an BOOoe temperature differential (fire 'tempe rat.ure 11OOoK), the pressure
diff'erence at the top of a normal door could theoretically reach 17 N/m2 if' the neutral
pressure plane were at floor leveL In practice however, only about half this value will
be obtained since the neutral plane is likely to be nearer the centre of the door.
Higher temperature differences do not alter this figure significantly.
Some practical measurements have been made or the pressures developed by fires.
In Los Angeles a series of experimental school fires were made (24) in 1959. The maximum
pressure increase in a stair enclosure was 37.5 N/m2, corresponding to 12.5 N/m2 per
'storey height or 6 N/m2 at the top of a door. This value was considerably reduced when
windows or doors were open to'the atmosphere. More recently Butcher (4) found that the
pressure difference across the top of a door to a. stairway due to fire· on one side never
exceeded 7.5 N/m2• The temperature reached by the fire was BOOoe and at this stage the
top of the door was beginning to burn. awB\Y., increasing the size of' the gap there •
.. TIle stack eff'ect for underground buildings at normal temperatures is negligible.
Wind Effects on Buiz.dinfl8
Nature of Wind
The surface of' the earth gives rise to frictional drag on wind and hence the
wind speed near the surface is considerably reduced and a boundary layer is formed giving
a vertical gradient of wind velocity. The height of the boundary IB\Yer is reached when
the frictional drag forces of the earth's surface are balanced by the movement due to the
earth's rotation. The gradient height and velocity profile depend on the roughness of tlJe
underlying terrain t the gradient height verdes from about 300m in nat open country to
about 500m in urban areas.
Opinion is divided on the best mathematical expression for variation of windspeed
with height (25), the use of a power law being the simplest, i.e.
- 8 -

2.4.2
2.4.3
-----------
V h aV,O = (10) 2.2
where VIO is the meteorological vi.ndspeed usually quoted for a standard height of 10m above
ground: The value of the exponent u depends on the. t:rye of terrain and also the v indspeed
averaging time used. Many estimates of suitable values for 0. have been made, and are given
for example in the IHVE Guide. Appr'opr-iet.e values of a for mean ..... indspeeds in U.K. are
0.17 and 0.35 for open country and urban areas respectively (26,27).
Design Wind Speed
As with temperatures, the averaging time of meteorological observations is an
important factor in the choice of a design figure. The maximum hourly v indepeed and
3-second gust speed exceeded once in 50 years are commonly used. These are relatively
infrequent and for present purposes, the mean annual maximum hourly windspeed is more
appropriate. Values are given for over 70 sites in the U.K. (28)~ mostly in open c~untry~
and these do not generally exceed a figure of 20 mls (45 mph) at 10 metres above ground ~
(apart from some of the more exposed coastal sites). Mean windspeeds in urban areas are
somewhat lower than in corresponding country area, although this difference becomes less
marked with increasins height. A reduction of 4 ·m/s (10 mph) has been suggested at 10 m
height (26) and is borne out by recent results of Helliwell for London (29).
Although providing some guidance for average situations, figures given in
preceding paragraphs should be used with caution. Maximum hourly windspeeds may be much
higher for coastal or mountainous areas. Although mean wi.ndspeeda are reduced by wooded
and built-up areas funnelling effects in valleys and between buildings can produce high
local velocities. When buildings are being considered in such localities it is advisable
to consult the Meteorological Office.
Wind pressures on buildings
The slowing dow of wind by an obstruction, .i v e . building, in its path creates a
build up of pressure on the windward face. The wind is deflected and accelerated around
the sides and over the roof of the building, creating an eddy behind the building and
exerting a negative pressure or suction on all areas other than the windward face(s).
The pressure distribution on the surface of a building due to wind is far from
uniform and depends on such factors as direction of wind, shape and height of building,
shielding effects of local obstructions to flow. The distribution is conveniently
expressed in terms of pressure coefficients Cp, which relate the actual pressure on the
surface to the velocity or 'dynamic' pressUre of the wind, i.e.
wind pressure Cpxpv2 N/m2 2.32
where p density of air, kg/m 3
v =wind velocity, mls
The pressure around tall buildings is difficult to predict accurately. Average
pressure coefficients for the main surfaces of a building are given in the B.S. Code of
Practice on Wind wads (30).. MJdel and full scale tests are increasingly used to obtain
a more detailed picture of wind effects on buildings (31, 32 ~33). From these it appears
that the maximum pressure difference across a building is approximately 1.2 times ~he
velocity pressure~ consisting typically of coefficients for the windward and leeward
faces of +0.8 WId -0.4 respectively.
- 9 -

Fig. 4 shows the pressure distribution on tall rectangular buildings in an urban
area from the~results of an earlier study (34) in terms of the velocity pressure of the
wind at the height of the top of the building. '!be primary effe~t of such a dist~ibution
on internal ~r movement is to produce a horizontal air flow through the building from
windward to leeward. Some vertical movement also occurs in the building due to increasing
pressure on building faces with height and negative pressure on the roof.
The wind effects on underground buildings are limited to pressures on openings and
vents at or above gr-ound level.
Ventilation system pressures
Air movement produced by mechanical ventilation sets up pressure differences in a
building in a similar manner to and superimposed on those due to natural forces.
In addition the building as a whole may be at a greater pressure than ambient air
due to the current practice of supplying air at .a higher rate than i~ is extracted (or the
reverse may occur in certain applications). It is becoming more common for buildings to be.
pressurised, i.e. at a positive pressure with respect to extern81 conditions, particularly
with the increasing use of sealed windows. This has the advantage of limiting air
infiltration caused by wind and stack effects.
- 10 -

3.
3.1
AIR LEAKAGE CHARACTERISTICS DF BUILDINGS
Importance of air teakag~ characteristics
Reference has alre~dy been ~ade (section 2.1) to the resistance to air flow through'" .'.
the major separations' of a buiiding which results in zones of different pressure being-,
set up , . Air rjovs from high. pr-eaaure to low pressure through leakage paths and the amount
of air moving will depend on the resistance offered by the s~parations. In practice the
separations are doo~s and windows and the leakage paths ar~ the gaps around these. Leakage
flow can also occur through floor and wall cons t r-uc t i.on s where these are of a pervious
nature. To pressurise a particular zone in a building to a specified level by means of
mechanical ventilation the rate of input air is determined by the resistance of the leakage
paths, hence a knovledge of the behaviour of these leakage paths is the prime requirement
for estimating the capacity of pressurisation systems for buildings. This section covers
existing knowledge of the leakage characteristics of doors, windows and building
construction and sets out the results of some site tests which extend the published data .
. Natu:t'e of air" leakage
A general expression relating leakage flow rate Q to the static pressure differential
across an individual leakage component is:
1N
Q K (Ap) £/5 3.1 .
where Ap is in N/~2
K is the leakage coefficient of the component
i.e. it is the value of Q when 6p is 1 N/m2.
It is more commonly quoted in terms of the "crack coefficient" C for
unit length of crack
length L. i v e . K
(£ /5
CL.
per metre per N/m2) multiplied by the crack
For small leakage openings as represented by cracks and pervious structures the
value of N varies between 1 and 2. For vei:y small dimensioned openings the Reynolds No.
( ~ ) is low and the flow' resistance is' mainly due to viscous forces, hence N willu
approach 1. For larger openings the Reynolds No. increases (since.it is proportional
to the characteristic flow dimension d) and the resistance will be mainly due to inertia
forces in the turbulent flow and N will approach 2. In practice this means that the
following values of N are typical of normal construction,
Leakage component N
Brickwork 1Window crackage 1.6Door crackage 2
The leakage characteristic of a component can also be. expressed in terms of an
equivalent area of. opening A. If the coefficient of· discharge for the opening is taken
as 0.65 (IHVE Guide, Section .!\..4) then for ambient conditions equat i.on 3.1 becomes'1
Q - 827 A (Ap)N ·£/s
If leakage through pervious structures is ignored and N.is approximated .to 2 then
this becomes
Qt
827 A (Ap)' '£/s ---3.2
Where several leakage components are in parallel and the pressure drop across each is
the same the total rate of air flow is given by. ,
Q = 827 E A CAp)' £/s ---3.3
- 11 -

are the equiv9.lent areas of opening of the individual leakage
;; .
and At. AZ' A3'
components.
For several components an series. as often occurs, the air now through each J.S the
same, i.e.
Q '" 827 A} (lIPt) ~ '" 827 Az (lIP2)
The total pressure drop lip'" lIPt + lIP2 + lIP3 + ....•..
Thus the effective equivalent leakage area A of components in series is given by
3.4
3.3
3.3.1
For just tvo components in series
Q. 827GAfAJ.X ~)Ij Ap I
From equation 3.4 it can be seen that the effective equivalent area A is strongly
dependent on the smallest of the individual openings that are in series and it is always
less "than this. the smallest value. If the smallest of the openings in series J.S less than
one quarter of any other opening then only the smallest need be considered and equation
3.2 can be used.
It is possible to produce more general relationships between Q. A and lip using
particular values of K and N but: since nearly all internal building flows are controlled
by door and window cracks the above equations are sUfficiently accurate for most
applications where manual calculations are used.
Litepature 8upvay on aip leakage data
An extensiv~ survey, including a literature search and enquiries to appropriate
bodies, was made with a view to assembl ing exi sting data ~n ai r leakages into a
comprehensive guide. The survey was less fruitful than anticipated however and the
results are summarised below under the three main categories of component, windows. doors
and structures. Leakage studies seem to have traditionally been orientated towards
assessing heat losses due to the infiltration of cold air. and have consequently
concentrated on windows. External wall construction and doors have been considered to a
lesser extent.
Windows
Early studies of air infiltration through windows were made in the U.S.A.
(36.37,38.39.40.41), and more recently further work has been reported (42,43). In the
U.K. Dick and Thomas (44) investigated the effect of gap size on window leakage and in
recent years th~s has been followed up at the Princes Risborough Laboratory of the
Building Research -Establishment (49). With increasing emphasis being placed on the
performance of individual building elements, a standard for testing the weather-tightne~s
of windows now exists (45). A draft standard for the grading of window performance (46i
recommends that air leakage rates should not exceed 3.3 !/s/m at 100 N/mZ pressure
difference.
Two sources (47.48) "containing the most comprehensive test results were selected
for more detailed analysi s , in view of the wide range of window types and figures
reported. To s1mp!ify the presentation the data was grouped firstly into that for
windows with weatherstripping and without weatherstripping, and secondly according to the
- 12 -
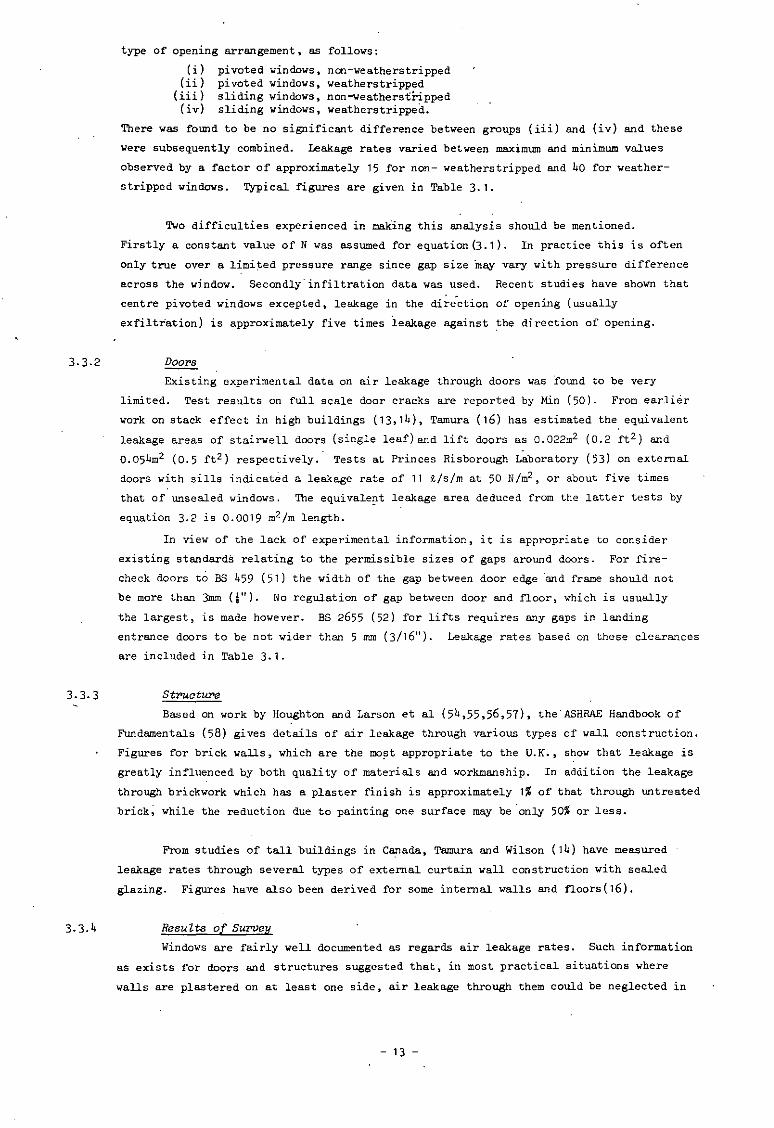
3.3.2
3.3.3
3.3.4
type of' opening arrangement. as follows:
(i) pivoted windows, nan-weathers tripped(ii) pivoted windows, weathers tripped
(iii) sliding windows, non-veatherstripped(iv ) sliding windows. weatherstripped.
There was f01D'1d to be no significant difference between groups (iii) and (Lv ) and these
were subsequently combined. Leakage rates varied between maximum and minimum values
observed by a factor of approximately 15 for 000- weathers tripped and 40 for weather
stripped vindovs . Typical figures are given in Table 3.1.
Two difficulties experienced in making this analysis should be mentioned.
Firstly a constant value of N was assumed for equation (3.1). In practice this is often
only true over a Limi.t.ed pressure range since gap size may vary wi.t.b pressure difference
across the window. Secondly"infiltration data was used. Recent studies have shown that
centre pivoted windows excepted, leakage in the di~ection of opening {usually
exfiltration} is approximately five times leakage against ~he direction of opening.
Doors
Existing experimental data on air leakage through doors was found to be very
limited. Test results on full scale door cracks are reported by Min (50). From earlier
work on stack effect in high buildings (13,14), Tamura {16} has estimated the equivalent
leakage areas of stairwell doors (single leaf) and lift doors as O.022m2 (0.2 ft 2) and
O.054m2 (0.5 ft 2) respectively." Tests at Princes Risborough Laboratory (53) on external
doors with sills indicated a leakage rate of 11 t/s/m at 50 N/m2, or about five times
that of unsealed windows. The equivale~t leakage area deduced from the latter tests by
equation 3.2 is 0.0019 m2/m length.
In view of the lack of experimental information, it is appropriate to consider
existing standards relating to the permissible sizes of gaps around doors. For fire
check doors to BS 459 (51) the width of the gap between door edge "and frame should not
be more than 3mm (j "}. No regulation of gap between door and floor, which is usually
the largest, is made however. BS 2655 (52) for lifts requires any gaps in landing
entrance doors to be not wider than 5 mm (3/16 11) . Leakage rates based on these clearances
are included in Table 3.1.
Struature
Based on work by Houghton and Larson et al (54,55,56,57), the'ASHRAE Handbook of
Fundamentals (58) gives details of air leakage through various types of wall construction.
Figures for brick walls, which are the mo~t appropriate to the U.K., show that leakage is
greatly influenced by both quality of materials and workmanship. In addition the leakage
through brickwork Which has a plaster finish is approximately 1% of that through untreated
brick~ while the reduction due to painting one surface may be "only 50% or less.
From studies of tall buildings in Canada, Tamura and Wilson (14) have measured
leakage rates through several types of external curtain wall construction with sealed
glazing. Figures have also been derived for some internal walls and fl.oors(16).
Results of Survey
Windows are fairly well documented as regards air leakage rates. Such information
as exists for doors and structures suggested that, in most practical situations where
walls are plastered on at least one side, air leakage through them could be neglected in
- 13 -

Table 3.1 Summa:t"i of air leakage data [or building components taken [rom various sources
Component Description Reference Average leakage in l/s Value of' Remarkssource for lip = 25 N/m2 Index N
Windows Pivoted 47.48 1.60 per metre crack 1.6 Leakage range 0.42-5.7Pivoted &weatherstripped 47. 48 0.22 per metre crack 1.6 Leakage range' 0.035-1. 5Sliding 47.48 0.61 per metre crack 1.6 , Le.akage- range 0.)5-2.)Proposed exposure grade
Sheltered 46 1.40 per metre crack 1.6Moderate 46 1.08 'per metre crack 1.6Severe 46 0.91 per metre crack 1.6
Doors Single stairwell door 16 75 2
Lift door 16 200 2Ext. door with sill 53 8 per metre crack 2
Standard fire stop 51 13 per metre cr-ack 2 computed valuedoor with A" {Smm} gap
Lift door with 3/16 11 52 21 per metre crack 2 computed value(5mm) gap
Brick and 8l" (216mm) plain brick 58 0.76 per,
1. 15m-Masonry .' 8l" (216mm) plain brick 58 0.0068 per m2
wi th plaster1. 15
13" (33Omm) plain brick 58 0.68 per m2 1. 1513" (33Omm) plain brick. 58 0.0034 per m2 1. 15with plaster
External. walls 14 1-2 per m2 for curtain wall 2 The leakage through
Internal. walls· 16 200 per floor unplastered 2 . completed structuresis assumed to be40 per noor plastered through cracks, hencevalue of N = 2
Floors 16 1 per m2 2
•

relation to that through door cracks. A need for more reliable information on the
magnitude of door leakages to be ~ound in practice was indicated. and this aspect was
consequently investigated in some detail in subsequent site tests.
Typical air leakage rates arising out of the survey are given in Table 3.1.
3.4 Air leakage site tests
The purpose of these tests was to establish the air leakage characteristics of
actual lobbies, stairwells and corridors. emphasis being placed on the measurement of
leakage rates for doors since the literature survey findings showed that this was where
confirmatory data was most needed.
It was not practicable under site conditions to measure leakage rates through
individual components directly. Such information was obtained however by a method of
differences. i.e. successively sealing off individual components and observing the
resultant.difference in pressurisation when using a knovn air supply to the enclosure.
3.4.1 Test method
Pressurisation of a se~ected enclosure was achieved by use of a portable centri
fugal fan rated at 570 tis (1200 cfm). The restriction on the fan size arose from the
requirement of being portable and being operated from a single phase 13 amp 230 v supply.
The size of enclosure which could be satisfactorily pressurised with this size of fan was
limited by t~e number of doors forming leakage paths from the enclosure. This did not
prove to be too serious a limitation but did mean that the tests were mainly carried out
on lobbies with only a few on corridors and stairwells. A temporary door, erected in one
of the entrances to the enclosure. was fitted with the inlet orifice for the
pressurisation air supply (Plate 1).
The rate of air supply could be varied oyer the fan output range and the volume
flow was measured from the static depression. at a 600conical inlet to BS 848 positioned
on the fan inlet. Precautions were. taken to minimise unwanted air leakage from the fan
rig and temporary door (Plate 2)~
During the tests the static pressure difference across each door was measured by
means of an electronic micromanometer and a probe specially designed to fit round a door
(Plate 3).
Analysis of the test results into a logarithmic form of equation 3.1 gives a
linear relationship between Q and 8p, from which values of K and N for each test run are
more easily derived, i.e.1
log Q = log K + N log (6p)
Providing the resistance to air leakage beyond each door from the enclosure was
relatively small. the static pressure difference was nearly the same across each door.
This condition could be obtained by opening a rew windovs in the appropriate places, and
ensured that the resistance measured was that or the doors only. In the lobby or similar
situation where the doors are acting as parallel leakage paths. the leakage rate of a
particular door can be deduced from the difference in the value of K obtained before and
after sealing the door cracks.
- 15 -

3.4.2 Test results
Tests were carried out in five buildings giring leakage rates for a total of
thirty doors. The mean leakage rates and the range of results are shown in Table 3.2 for
:four fairly distinct" categories. All single and double leaf doors had rebated frames.
Off'ice doors were found to have sUbstantially lower leakage than other single leaf
swing doors, indicating a generally better fit in their frames. This is probably due in
part to the fact that they are retained in the shut position in closer proximity to the
frames by the action of the door catch. In the limited sample tested, no significant
difference in leakage was observed between double leaf doors with a centre rebate and
those without one. The value of the exponent N ranged from 1.5 to nearly 2, v i.t.h an
average value of 1.7.
It is interesting to compare the leakage rates per unit length of crack with thOse
obtained in the literature sur-vey. Test values correspond closely to the maximum gap,
or slightly above, allowed by the relevant British Standards. Office doors are a sig
nificantly better fit although there is no present standard for these. Other single
door and li:f't door f'Lgur-es are" in reasonable agreement with total leakage rates calculated
from Tamura's eqivalent leakage areas.
Whilst the agreement between the measurements obtained from the site tests with
the data of Tamura (16) and that implied in the British St~dards (51, 52)
is good this does not automatically ensure that in practice actual situations will always
accord with the mean data. There is no apparent control during building construction to
ensure that these leakage da~a will be typical, yet it is not economic to size a
.pressurisation system after a building is complete and its "leakiness" assessed. Hence
the control of the fit of these doors (and windows) which play a part in the effectiveness
of pressurisation in cont.r-oLli.ng smoke movement forms an integral part of pressurisation
system design. This point must not be lost sight of in specifying pressurisation system
per-rornance .
Table 3.2 Results of air leakage tests on installed doors
Mean leakage Range of Standard Mean leakage Computed EquivalentDoor type rate measured deviation of per metre of gap width leakage
~/s at lip = leakage measurements openable mm : area25 N1m2 rates ~/s joint ~/s.m m2
Single leaf door
(a) office doorwi th catch 44 30 - 61 7 8 1.9 0.01
(b) doors with-out catch 86 79 - 98 7 15 3.7 0.02
Double leaf i"Tithor without" centre 123 94 - 164 29 13 3·.2 0.03rebate)
Lift landing 195 157 - 255 29 24 5.9 0.05entrance
- 16 -

4.4.1
REQUIREMENTS FOR PRESSURISATION
In t1'oduation
This section deals with pressure differentials, air flow rates and venting
requirements for pressurisation systems, which can be summarised as follows:
(i) Pressure differentials
An excess pressure must be maintained in an escape route so that flow
is always outwards, preventing the entry of smoke under adverse conditions.
(ii) Air flow rates
The rates of air flow from the escape route necessary to achieve the
pressure differences of (i) must be determined from the leakage character
istics of the escape route, so that the capacity of the mechanical
. ventilation plant required can be correctly determined.
(iii) Venting
The air introduced for pressurisation must be able to escape from the
building after leaking from the escape route. There will be a minimum
leakage area in terms of window leakage rates or special vent sizes
required to ensure the release of a given quantity of pressurisation air
to the atmosphere.
A study has been made of these requirements using a computer and the results are
described below..
4.2 Computer study of pl'essurisation requirements
A digital computer program (CRKFLO) has been developed at HVRA for an earlier
study of natural ve~tilation in tall buildings (34). It was equally suited to the
present study in that it enabled a variety of specific ventilation conditions and their
effect on pressurisation in a building to be investigated.
Air movement within a building is simulated by the CRKFLO program as a pipe network
Air flow paths between a series of inter-connected nodes or spaces in the
equation 3. 1.
problem.
building are represented by a set of non-linear simultaneous
Values of K and N are specified for each path
equations of the form
in the data input. A
solution is approached by making successive approximations to the unknown pressures,
starting from known values, urrt i L a flow balance is achieved. "Inflow" or 11out flow" ,
representing net air supply and extract rates for mechanical ventilation, may also be
specified in the data input at any node for which the pressure is not known. The print
out of results of the computer calculation includes the flow rate and direction and
pressure loss for each path.
Using this program, the sensitivity of a pressurisation system to the following
parameters was investigated:
(i)(ii)
(iii)(iv)
(v)
building planleakage characteristics of building structureexternal weather conditionsother mechanical ventilationopen windows and perimeter venting
The study was made in two parts, firstly considering a single floor of a building
to look at aspects (i) and (ii) and then using a multi-storey model to consider the
remaining aspects. Heights of 6, 18 and 30 storeys were used for the latter. In the
- 17 -

4.2.1
4.2.2
main the study looked at pres~urisation in vertical escape routes, i.e. stairshafts, but
guidance is given concerning the application of the results to horizontal. escape routes.
Bui1.ding plan
Two hypothetical building plans (see Fig. 5) both having centrally situated service
cores but incorporating a number of different lobby/staircase arrangements were devised
for the study. Pressurisation .ves simulated in the staircases in each plan and in the
main lirt lobby of Plan 2. The computer analysis showed that these pressurised areas ....ere
not equally sensitive to changes in leakage parameters (see 4.2.2) or to the ext~rn.al
climate. The general. air movement pattern in. these buildings is an outward ODe from the
central core to atmosphere via the accommodation area. Any increase in the leakage
resistance of external or corridor walls (or the introduction of internal walls into an
open pi~ building) tends "to push more pressurisation air towards the lift shafts,
reducing the effective pressurisation of staircases adjacent to them (see Table 4.1).
Positive wind or stack pressures on the outside of the building produce a similar effect.
Since lift shafts, which are normally associated with staircase cores, can act as
pres~ure relief points, their position on the building plan should.be considered with
regard to their possible effect on pressurisation.
Building plan and leakage characteristics are closely interlinked in their.
influence on air movement within a building. The. overall pattern is determined by the
resistance to flow of components in series and parallel with each other in the total
building network.
Leakage characteris tics
Table 4.1. shows the change in pressurisation produced by varying individual leakage
rates of windows and doors over approximately the same range of values described in
secti~n 3, other factors remaining constant. These results relate to the pressure·
difference between escape route and corridor. This value is less than that across the
door immediately protecting the escape route·in the event of air flowing into the lift
shaft via the lobby.
In plan 2, (Fig. 5) window leakage is the most significant parameter affecting
pressurisation in stair A and lift lobby C. This is not surprising since a much wider
r-ange of leakage rates' exists for windows than for other components. The pressurisation
of lobby C is similarly affected by changes in ·lift door leakage.
In plan 1 (Fig. 5) the main lift shaft is not protected by a pressurised lobby.
Thus air is able to escape freely into the lift shaft and pressurisation of the stairsis insensitive ~o changes in window and lift door leakages. Opening door F in plan 1.
(Fig 5.) results in a large flow of air round one limb of the corridor, adversely
affecting the pressurisation of the opposite stair/lobby arrangement.
- 18 -
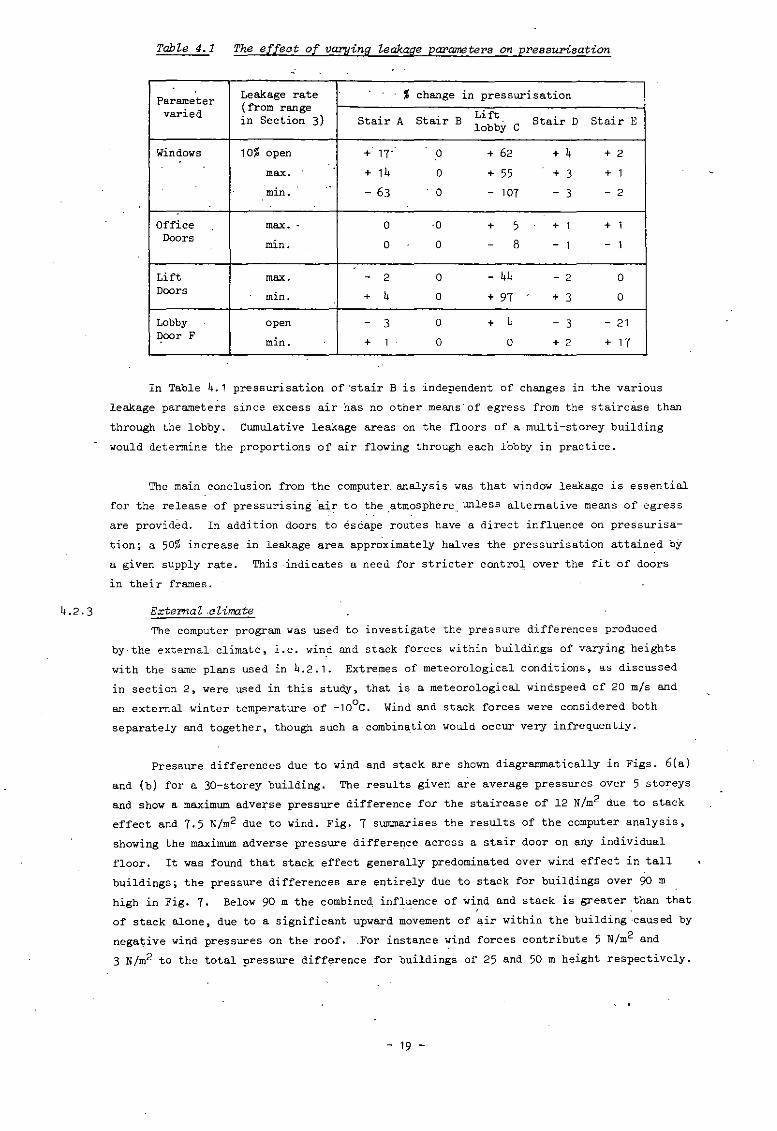
Tab~e 4.1 The e[[eot of varying leakage pal'ameters on presBul'isation
4.2.3
Parameter Leakage rate % change in pressurisation
varied(from range
Linin Section 3) Stair A Stair B lobby C Stair D Stair E
Windows 10% open + 17- 0 + 62 + 4 + 2
max. + 14 0 + 55 + 3 + 1
min. .-63 0- - 107 - 3 - 2
Office max. 0 ·0 + 5 + 1 + 1Doors
min. S0 0 - - 1 - 1
Lift max. - 2 0 - 44 - 2 0Doors min. + 4 0 +97 + 3 0
Lobby open - 3 0 + 4 - 3 - 21Door F min. 0+ 1 0 + 2 + 17
In Table 4.1 pressurisation of'stair B is independent of changes in the various
leakage parameters since excess air has no other means' of egress from the staircase than
through the lobby. Cumulative leakage areas on the floors of a multi-storey building
would determine the proportions of air flowing through' each lobby in practice.
The main conclusion from the computer. analysis was that window leakage is essential
for the release of pr-es sur-i s i.ng ed r to the .atmosphe t-e unLeas alternative means of egress
are provided. In addition doors to escape routes have a direct influence on pressurisa
tion; a 50% increase in leakage area approximately halves the pressurisation attained by
a given supply rate. This ,indicates a need for stricter control over the fit of doors
in their frames.
External ;olimate
The computer program was used to investigate the pressure differences produced
by' the external climate, i.e. wind and stack forces within buildings of varying heights
with the same plans used in 4.2.1. Extremes of meteorological conditions, as discussed
in section 2, were used in this study, that is a meteorological windspeed of 20 m/s and
an external winter temperature of -1 DoC. Wind and stack forces were considered both
separately and together, though such a·combination would occur very infrequently.
Pressure differences due to wind and stack are shown diagrammatically in Figs. 6(a)
and (b) for a 30-storey building. The results given are average pressures Over 5 storeys
and show a maximum adverse pressure difference for the staircase of 12 N/m2 due to stack
effect and 7.5 N/m2 due to wind. Fig. 7 summarises the results of the computer analysis,
showing the maximum adverse pressure difference across a stair door on any individual
floor. It was found that stack effect generally predominated over wind effect in tall
buildings; the pressure differences are entirely due to stack for buildings over 90 m
high in Fig. 7. Below 90 m the combined influence of wind and stack is greater than that
of stack alone, due to a significant upward movement of air within the building ·caused by
negative wind pressures on the roof..For instance wind forces contribute 5 N/m2 and
3 N/m2 to the total pressure diff~rence for buildings of 25 and 50 m height respectively.
- 19 -

I »" The above figures were computed for buildings with windows of average leakage,
" Le. 0.12 R-/s.m.N/m2. In view of current t.rends towards better weather seals end window
design generally, it is expected that pressure di fferences will be lower th~ these in
modern buildings.
Horizontal and vertioal esoape routes
The pressure differences due to the external climate given above apply to'vertical
escape routes and to lobbies giving access to them only. Other horizontal escape routes,. ,
i.e.' lobbies and corridors, are affected differently by climatic forces, in that they can
be seriously affected by wind pressures but are relatively insensitive to stack effect.
The pressure differences across a door due to stack effect in a single storey doe s not
exceed 1 N/m2 for normal temperature differences (i.e. excluding fires).
Horizontal escape routes can form a "through route" for willd induced air movement
from the windward to the leeward side of a building, e.g. stair lobby in plan 1, and are
particularly prone to win'd action when the lobby or corridor present the path of lowest,
resistance' to air flow across the building. This aspect was not studied in great detail
in the computer analysis, but the pressure difference across a door to a "through route"
due to wind can be calculated approximately from the relative leakage areas of internal
and external walls and the,total pressure head of the wind.
i ve ,
where
6 P = P
6 PPA =
pressure difference developed across' lobby doortotal pressure head due to wind (see section 2)effective leakage area of walls and doors inseries across the building (see section 3)
leakage area of lobby door.
4.2.4
The value of 6 p is not likely to exceed 10% of the total head providing windows are
kept closed in the building.
It is concluded that pressures in horizontal and vertical escape routes are affected
mainly by wind and stack forces respectively, though wind cannot be neglected in relation
to vertical shafts. The leakage resistances to horizontal and vertical air movement
determine the extent to which pressurisation systems are influenced by prevailing weather
conditions. The approximate ratio of 1 :2:5 for staircase, external end internal wall
leakage areas used in the computer analysis is felt to be typical of the sort of building
studied, though inevitably a wide range of values will exist in practice.
Open windaJJs and perimeter venting
Windows opened at random in a building can unbalance a pressurisation system by
al10ving air to flow more easily through one entrance of the escape route at the expense
of the pressurisation across the other entrances. This depends on the prevailing weather
conditions and also the relative leakage or closed windows in the rest of the building.
Openings at lov level in winter increase the adverse effect of stack (Fig 6c), unless the
windows are well sealed (Fig. 6d). If the latter condition is met, venting can be used to
aid pressurisation and therefore smoke control. By venting the fire space adequately the
outflow from the staircase on that floor would be Lncreaaed , with a reduction on other
floors. This gives added protection to the escape route on the fire floor. Since the
behaviour of occupants is often unpredictable, the design of pressurisation systems must
allow for an adverse arrangement of open windows to exist in the event of a fire. The
worst situation, vindows open at low level in winter, can give rise to an adverse
- 20 -

4.2.5
4.2.6
pressure difference of 10 N/m2 at the bottom of a pressurised staircase for a building
height of 100 m ~ith an opening 1~ .of the storey ~all ~ea.
other mechanicat venti lation
The computer analysis shoved that ventilation to the accommodation areas at a net
supply rate of 1 or 2 air changes per hour (i.e. supply rate less extract rate) does not
affect pressurisation adversely. These rates are typical of present practice. A
necessary proviso is that, should the extract system shut down, the supply ventilation
could create pressurised zones in direct competition with those of the escape routes.
Uncontrolled opening of windows would also be a serious problem with normal
ventilation running. Fig. 6(e) shows ho~ venting at low level upsets the balance of
the pressurisation system in favour of the vented floor.
Use of nonnat mechanicat ventilation to contT'Ot smoke movement
Fig. 6(f) illustrates that ~ithout staircase pressurisation~ continued running
of normal supply fans in conjunction with venting specific floor areas could control
smoke movement. ~ venting the fire space the mechanical ventilation may be. sufficient
to maintain this space at a lower pressure than the remainder of the building, so that air
movement is always towards the fire. With well sealed ~indows, a supply rate of 2 air
changes per hour produces an "effective pressuri aat.i.on" of lift and stair shafts of
30 -·40 N/m2 on the vented floors.
This suggests that building pressurisation and smoke control may be achieved by
. normal air conditioning plant. The limitation on developing such schemes is the require
ment for the sustained integrity of the system in the event of a serious fire. The idea
is attractive but a detailed study of system requirements and construction is first
necessary.
4.3 Pressure requirements
-Under- fire conditions pressurisation must be sufficient to overcome pressures
developed in the building by fire, wind and stack effects. Further it must be sufficient
to overcome the possible application of all three effects acting against pressurisation
at the same time so as to maintain outward flow from the escape route. The pressure
developed by a fire across the top of a closed door was discussed in section 2, the
pressures developed by wind and stack effect in section 4.2.3 (Fig. 7). The overall
pressure requirement for stairwells extending through the height of the building, with a
safety margin to include the adverse effects on pressurisation of rWLdom window opening,
is given in Table 4.2. It will be noted that the recommended pressurisation levels have
been rounded off to two values, 25 and 50 N/m2. This is because an increase in pressuris
ation from 25 to 50 N/m2 constitutes only a 40% increase in the air flow requirement,
and hence furth_er SUbdivision would result in very marginal increments in air flow.
Underground buildings would normally fall into the Love r-r pr-es suz-e category (25N/m2) since
the stack and wind effects. in these buildings should be small.
- 21 -

TabZe 4.2
Minimum pressures required for presBurisation of 8 tairwe lls in bui Zdings
Building height Fire pressure Wind and stack Recommended total pressurem N/m 2 effect including safety margin
N/m2 N/m2
.
}5 8.5 8
25 8.5 10.5 25
50 8·5 13
}100 8·5 19.5 50
150 8.5 29.5
It is important that pressurisation should not hinder the opening of doors on
to escape routes during evacuation. Whilst an average adult can applyaforce of about
lBoN (40 Ibf) to open a door (71), some people would not be able to exert this force and
a recommended maximum opening force of 90N is suggested. Allowing for a pull of 45N to
overcome the doors self-closing mechanism then the force available to open a door against
pressurisation is 45N. This is equivalent to a uniform pressure of about 50 N/m2 On a
typical door and this is recommended as the maximum level for pressurisation.
Various methods for countering stack effect and hence reducing the pressure
requirements for smoke control have been suggested. Two of these are:
(l) the sUbdivision of vertical sharts to limit the total compartment height over
which stack effect can act.
cannot normally be
compartments, under
effect by compartmentalisation
to divide stairshafts into
the equivalent limitations
Canadian practice is
UK winter conditions
storeys. Limiting stack
applied to lift shafts.
about 7-8
5 storey
would be
(2) use"of separate pressurisation systems to serve each floor of a building.
The economic aspects of this form of s~stem are discussed in section 5.
4.44.4.1
Air- [low r-equi:r-ements
Closed doors
The air flow rate for pressurisation will normally be assessed on the pressure
differences required across closed doors and the associated leakage rates. During the
normal passage of people through a doorway, the momentary loss of pressurisation does not
seriously reduce the effectiveness of. the pressurisation system. It has been found that
smoke tends to be held back by the outflow of air through the open doorway and pressurisa
tion air quickly clears small amount~ of smoke which do filter through when the door is
closed again (S).
4.4.2 Large openings
Smoke and hot gases can infiltrate onto an escape route against an outward flow of
air due to the action of buoyancy forces across a large opening e. g. an open doorway (72).
Such infiltration can be curbed by maintaining an outward velocity of sufficient magnitude
to overcome the buoyancy effect, the required velocity being proportional to the tempera
ture difference across the opening (see Fig. 8). Although it has previously been stated
that pressurisation design will be based an closed door leakage rates the above relation
ship can be used to assess whether smoke will be kept back irr the event of a door being
opened. A velocity of 1 mis, corresponding to a 20°C temperature differenge, should
- 22 -

4.4.3
meet most purposes during the evacuation period. though it may not be sufficient to
counteract flows arising from building wind and stack effects. It should be noted that
the now stratification of hot gases and backt'Lov in a corridor is considerably more
complex and cannot be treated in this simple way.
CalauZation of air [?ow rateS for pressUPisation systems
In the straightforward case of a lobby or staircase. the air now rate is simply
the sum of leakage allowances at the desired ppessurisation. Two examples are given
below of more complicated situations occurring quite frequently.
Example 1
Lift
Lift
Pressurised lift lobby on each floor of a 5-storey building
Design pressurisation 25 N/m2
Leakage rate into the lift shaft depends on theleakage area of ventilation opening to the shaft
• and the lift doors in series.Vent area 0.1 m2 per liftLift door leakage area = 0.05 m2 pe r doorTotal leakage area into each shaft 0.25 m2
From equation 3.4, the eJfective leakage area of each shaft 15
1Al-A
1(~5)2
0.093 m2
+
(Note: For 8 or more storeIs, A would beapproximately 0.1 m i.e. just thearea of the vent)
Air leakage per shaft at.25 N/ml 827 x 0.093 x (25)~ (Eqn 3.2)
385 ~/s or 77 ~/s per floor.
Leakage rates per lobby:
Double leaf doorsLift shaftsTotal
2 x 1232 x 77
246 9../s154 'lIs400 'lIs
Example 2
Total air supply rate per lobby required for pressurisation
400 'lIs
Two systems serving to produce different pressures inadj acent areas
Staircase
10 storey staircase, adjoining lobby on each floo~
Design pressurisation: staircase 35 N/m2
lobbies 25 N/m 2
a) Staircase
Pressure difference between staircase and lobby= 10 N/m2
Leakage rate per double leaf door at 10 N/m2 = 78 tis
Total staircase supply rate 78 x 10 = 780 tis
b) Lobby
Leakage rate from lobby:2 double leaf doors at 25 N/m = 123 x 2 = 246 ~/s
Leakage rate into lobby from stairs = 78 'lIs from (a)
Total lobby supply rate required 246 - 78168 tis per lobby
4.5 Venting ~quirement8
Fresh air introduced into the building for pressurisation must escape again other
Yise the complete building becomes pressurised and the internal a1r flow patterns and
hence smoke movement are nO longer under control. The high and low'pressures would no
longer be .clearly defined. The venting of pressurisation air is then as an important
- 23 -

4.. 5.2
part of pressurisation as the controlled supply of air.
The position of pressure relief points is also important in controlling the
internal air flow pattern. Vents must be provided to relieve pressure from each floor
served by a pressurised staircase or from each room served by a pressurised corridor to
ensure that the required pressure differentials are achieved across all entrances or
exits of the escape route.
Me thods 0 f venting
Practical methods by which air may egress frombuildipgs incorporating
pressurisation systems are:
(i) leakage past cracks formed in opens91e (but normally closed)windows
(ii) vents in the external walls
(iii) mechanical extract systems
(iv) natural ventilation system~
Window leakage
The leakage characteristics of windows were discussed in section 3. In naturally
ventilated buildings there is normally SUfficient leakage past window frames for the
preeeur-isation air to escape and further venting measures may not be necessary. An
assessment can be made as to whether there is sufficient window crackage to provide the
required peripheral leakage area. Using typical window leakage rates from section 3,
Table 4.3 gives the required crack length in terms of the net volume rate of pressurisa-•
tion air supplied to the floor ~ tis. ~ will be less than the total pressurisation
volume rate where lift shafts and other defined routes contribute to the total leakage
from the building.
Table 4.3 Recorrrnended minirmun window crackage to l'elielJe pl'esBUl"isationsystems
Window Typical air leakage rate Recommended crack lengthtype tis. m. N/m2 in metres
Pivoted 0.21 1.2 "r.Sliding 0.082 3.0 "r.Pivoted andweather- 0.030 8.3 "r.
stripped
Non-weatherstripped windows will normally provide sufficient crackage for
peripheral leakage. The figures in Table 4.3 indicate that additional venting by one of
the methods described below will be necessary to supplement leakage through weather
strlpped windOWS, where these provide insufficient crackage on their own. Use of
sliding windows may also necessitate extra venting, since they normally incorporate
some form of weatherstripping.
In assessing the required crackage per building floor, window crackage on one side
of the building should be discounted to ej.Lov for the possibility of adverse wind
condi tions.
- 24 -
4.5.3 Periphera l ven ts
In this proposal vents are spaced uniformly in the external walls and these are
released in the event of the pressurisation system being activated. These vents would be
more effective if they had non-return characteristics to prevent back flow under adverse
wind conditions. This method achieves the leakage requirement when the building facade is
particularly airtight, e.g. when the glazing is sealed. The effective open area on a
floor to be provided by the vents has been shown by the computer analysis to be ~/2500 m2
where ~ is the net volume rate in lis of pressurisation air to the floor as defined in
4.5.2. The effective area is that which can be con s i de red Unaffected by wind pressures,
hence vent areas on a windward face must be discounted. In assessing the minimum vent
areas required the above criteria must be met with the vents on anyone side of the
building not being effective.
Mechanical extroct
If the mechanical extract system in an air conditioned or mechanically ventilated
building can be run in the event of a fire then this is an effective way of removing
pressurisation air from the accommodation.
The minimum extract required on each floor is the pressurisation supply to that
floor if the air conditioning or ventilating supply is stopped. If the extract rate on
the f{re floor can be increased over that on other floors in a sealed building then this
has a considerable advantage in reducing the fire floor to a minimum pressure area. The
extract points must not be positioned within pressurised areas nor in such areas adjacent
to pressurised areas that would prevent flow to the accommodation (e.g. internal toilets).
There are practical difficulties involved in this method of venting. The extract
4.5.5
system must be able to·handle very hot gases (although the temperature w~ll be reduced by
dilution with air extracted from other floors). Heat or smoke actuated fire dampers must
be omitted otherwise the venting would be stopped when most needed. Such an arrangement
would conflict with present regulations but it is possible that shunt duct connections
on each floor might be an acceptable way of preventing fire being transmitted to other
parts of the building by the extract duct. Electrically operated dampers under the control
of the fire brigade are another alt~rnative.
Nat:ul'al extract systems
This is an altern'ative to the above and has a potential application in sealed
buildings of open plan layout. The most economical arrangement is likely to be a
vertical vent shaft running the height of the building with openings to each floor.
These openings would normally be closed by a damper but in the event of a fire the
damper would be opened on the fire floor. This opening could be achieved by an auto-
~ matic smoke detector system. Alternatively it could be made by the release of a fusible
link although this is less satisfactory since considerable smoke could be generated before
the damper is released.
The only openings to the shaft that occur are at the top of the shaft and on fire
floors. The size of the opening to a fire floor must be sufficient to vent all.,the
pressurisation air supplied to that floor plus some pressurisation air from other floors.
This is to ensure' a. general air movement. to the fire floor. The sizing of the vent and
shaft shall be as follows:
- 25 -

Net vent area (room to shaft) Av
where ~ = net pressurisation floor supply i/s
Vertical shaft size 3 A m2v
The area of the opening at the top of the. shaft shall not be less than the area
of the shaft itself.
4. 6 Underground Buildings
Pressurisation can be applied to underground buildings and in the case of
extensive or deep accommodation it is perhaps the only practical measure for smoke
control.
Stack effects are negligible underground and apart from the possibility of
wind-induced cross flow near ground level the wind effects are not great. The
pressures required are then only those for low level buildings. i.e. 25 N/m2.
Venting of potential fire spaces is essential and is normally achieved by natural
ventilation shafts (4.5.5.) .. These need not be sited at the periphery. These vent
shafts can be smaller than those normally specified for natur~ly smoke vented under
ground buildings since the pressures developed by the plant can aid egress through the
shafts.
Care is necessary in the design of the terminal to the shafts to ensure adverse
wind pressures are not generated.
- 26 -

5.
5.1.1
5.1.2
MECHANICAL PRESSURISATION SYSTEMS
The objective of a pressurisation system is simply to provide sufficient clean air
at the required pressure level to the escape routes to keep them clear of smoke and
toxic gases. It needs to perform this function in the event of a fire for a sufficient
length of time for the occupants to escape or seek a safe refuge and to aid the fire
righting team in their attack on the tire.
The mechanical design of a pressurisation system should meet all the technical
requirements needed for this objective as economically as possible. The economics will be
influenced by the schedule of operation of the system, that is whether the plant is idle
except for an emergency or whether it runs continuously and if 50 at what level of
performance. The operational ;equirements are discussed in detail below.
Operational. 8ohedul.es for pres8uI'isation systems
The three basic modes of operating pressurisation systems are:
(a) pressurisation plant normally off. In the event of a fire the plant is
switched on to its full duty.
(b) pressurisation plant runs continuously at full duty during all hours of
occupancy.
(c) pressurisation plant runs continuously at reduced capacity during all hours
of occupancy with a boost to full duty in the event of a fire.
The advantages and disadvantages of these three modes are discussed in detail in
the following notes.
Pl.ant off except in an emergenc:y
The strict requirement for pressurisation is fully met by this mode of operation.
The basic weakness is that there can be a delay between the start of a fire, its discovery
and notification" and the starting of the pressurisation plant. During the early stages of
a fire it is possible for large quantities of smoke to be generated through incomplete
combustion and hence the operation of pressurisation during the early stages is important.
If an automatic smoke detector system is installed and the alarm also initiates the
pressurisation plant this weakness is met. This is not likely to be the case in typical
office accommodation which constitutes the bulk of tall buildings. Whilst site tests have
shown (5, 6) that pressurisation can quickly and effectively clear escape routes if
smoke does infiltrate on to them this could still be a hindrance during the early stages
of evacuation. This mode will then rely on an early discovery of a fire for the system
to fulfil all its duties.
Plant rwzning continuous l.y
This meets the objective of the availability of pressurisation during the early stages
of a fire but this mode has the disadvantages of relatively high running costs and of
difficulty in providing adequate environmental conditions on the escape routes during
normal occupancy.
The high runn ing costs arise through:
(i) continuous running of the pressurisation fans
(ii) supply of heat to temper the pressurisation air in cool weather
(iii) in air conditioned buildings the use of refrigeration to
counteract the direct introduction of outside air into the building.
- 27 -

5· 1.3
It was apparent from the site visits to existing installations that the
environmental conditions in pressurised areas were distinctly uncomfortable when the
pressurisation systems were operating at full duty. The causes were strong draughts
and excessive noise and these were due to the substantial air volumes being circulated
in the stairwells and the lobbies. These existing system; were not intended to operate
continuously and it would be feasible, but difficult, to disperse the momentum of the
supply air without causing objectionable draughts if continuous running was requested.
The modifications needed to reduce the possibilities of draughts and noise would add
SUbstantially to the system costs, There are special cases where continuous running of
the pressurisation would be warranted, an example is a building where known toxic gases
would be generated by a process if a fire occurred. Otherwise the additional costs are
excessive to cater for the possibility of some smoke infiltration onto escape routes
prior to the alarm being raised.
P"lant running oontinuously at l'educed capacity except in an emel'gency
. This mode seeks to overCOme the objection of possible smoke infiltration on to
escape routes before the fire alarm is raised by supplying sufficent air to limit the
smoke movement towards the escape routes and to dilute any smoke that does actually
enter them. The cost saving of operating pressurisation schemes at reduced capacity
is quite substantial.
A particular reason for advocating running the'pressurisation systems continuously
at reduced capacity is that they would serve the dual purpose of some smoke control
facility at all times and of providing the normal fresh air ventilation requirements for
int~rnal spaces. The ventilation requirement for internal corridors as recommended in the
IRVE and ASHRAE Guides is 1.3 2./s per 102 of floor area. Considering a typical pressurised
lobby of 50 102 floor area with two double exit doors and two lifts, this would need an
input of about 500 ~/s, that is 10 tis per 102 , to produce a pressure differential of
25 N/m2. In this case the level of pressurisation produced by the nOrmal ventilation
requirement is.
(~)2 x 25 = 0.42 N/m210
This 1S insignificant in terms of commonly occurring pressure fluctuations within
a building, hence the ventilation needs do not contribute to the pressurisation
requirements. However a common system to serve both needs is quite feasible.
A more realistic estimate of the level of pressurisation needed during the very
early stages of a fire (before the alarm is raised) should be based on the followingl
(i) pressures developed in the early stages of a fire
(ii) wind and stack effects that are not commonly exceeded
(iii) smoke dilution capabilities of the pressurisation air.
In section 4 it was shown that a fully developed fire on one side of a closed door
could produce a pressure differential at the top of the door of 8.5 N/m2• If the fire
is not fully developed then the pressure differential is less. A typical test (73)
indicates that the room temperature is likely to reach about 2000C
during the early stages
of a fire. The pressure difference developed across the top of a closed door at this
, condition is about 4.5 N/m2•
- 28 -

5 ..1. 4
In the analysis of wind and stack effects in section 4 extreme climatic conditions
have been assumed to exist when a fire develops. In fact for most of the year the wind
and stack effects are significantly less. The IHVE Guide, Book A, gives 90% of all days
at temperature of 4~C and above and coincident wind speeds at the low temperature are
rarely above 7.5m/s (for London). Hence a stack effect arising from an outside temperature
of just 4°C, inside temperature 210C, and neglecting the wind effect would cover eventua
lities on 90% of all days. The stack effect for this condition is a function of the
building height as given below.
Building height Stack effect
m N/m2
5 0.5
25 2.5
50 5.5100 10.5 -150 16
Hence the pressure and flow conditions given· in Table 5.1 would meet most
conditions occurring during the early stages of a fire whilst operating at a lower
level of pressurisation.
Table 5~1 Recommended reduced pressurisation levels
Building Reduced fire Reduced stack Reduced Recommended Approx. %reductionheight pressureS effect pressurisation levels in flow ove r full
m N/m2 N/m2 level N/m2 N/m2 capacity
5 4.5 0.5 5.0 }7.0 } 5025 4.5 2.5 7.0
50 4.5 5·5 10.0 } 15 } 45100 4.5 10.5 15.0
150 4.5 16 20.5 20 40
rThe operating costs for a system running at half capacity are about one third of
those for continuous operation at full capacity.
Application of operating schedules
The choice of preferred operating schedule will be influenced by the probability
of early detection of a fire. Automatic smoke detector systems or a reasonably dense
occupancy level should ensure early detection, but where sleeping accommodation is
involved or the occupancy density is very low detection could be delayed and the ·operation
must take this into account , The following arrangements of operation are suggested.
- 29 -
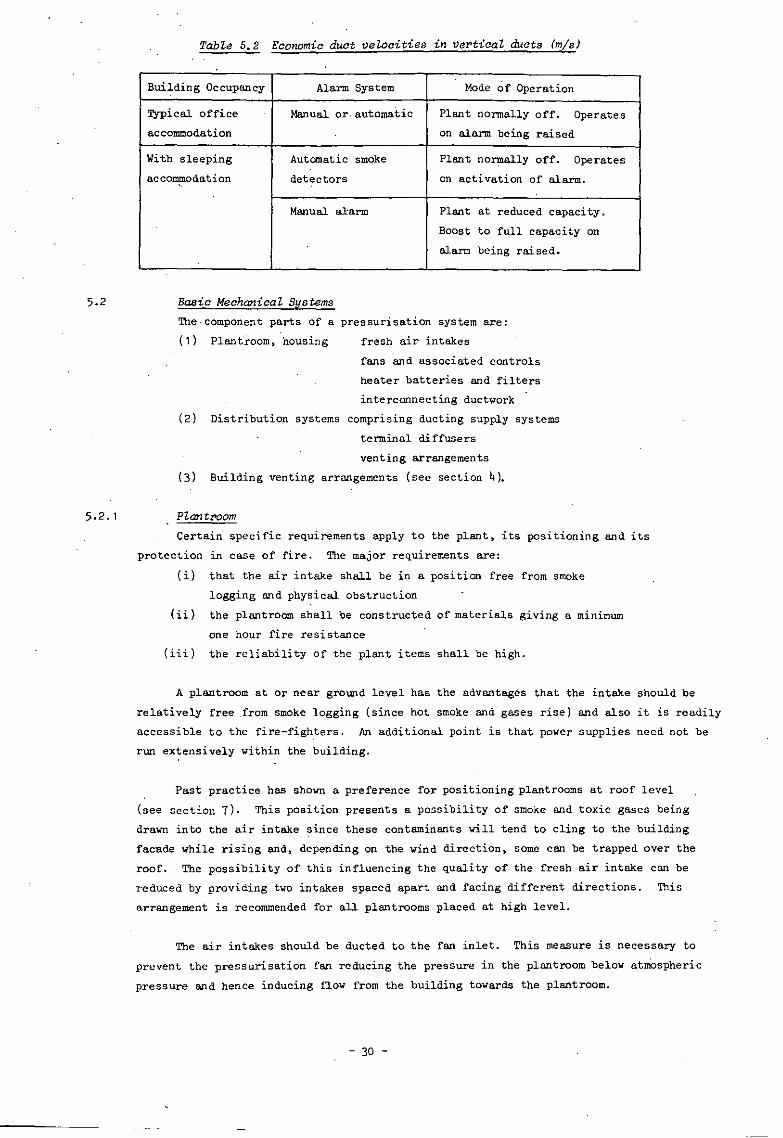
(1) Plantroom, housing
5.2
5.2.1
Table 5.2 Economic duct velocities in vertical ducts (mls)
Building Occupancy Alarm System Mode of Operation
Typical office Manual or. automatic Plant normally off. Operates
accommodation on alarm being raised
With sleeping Automatic smoke Plant normakLy off. Operates
accotnplodation detectors on activation of alarm.
Manual al'arm Plant at reduced capacity.
Boost to full capacity on
alarm being raised.
Basic Mechanical Systems
The· component parts of a pressurisation system are:
fresh air intakes
fans and associated controls
heater batteries and filters
interconnecting ductwork
(2) Distribution systems comprising ducting supply systems
terminal diffusers
venting arrangements
(3) Building venting arrangements (see section 4).
Plantroom
Certain specific requirements apply to the plant, its positioning and its
protection in case of fire. The major requirements are:
(i) that the air intake shall be in a position free from smoke
logging and physical obstruction
(ii) the plantroom shall be constructed of materials giving a minimum
one hour fire resistance
(iii) the reliability of the plant items shall be high.
A plantroom at or near gz-ound level has the advantages that the intake should be
relatively free .from smoke logging (since hot smoke and gases rise) and also it is readily
accessible to the fire-figh~ers. An additional point is that power supplies need not be
run extensively within the building.
Past practice has shown a preference for positioning plantrooms at roof level
(see section 7). This position presents a possibility of smoke and toxic gases being
drawn into the air intake since these contaminants will tend to cling to the building
facade while rising and, depending on the wind direction, some can be trapped over the
roof. The possibility of this influencing the qUality of the fresh air intake can be
reduced by providing two intakes spaced apart and facing different directions. This
arrangement is recommended for all plantrooms placed at high level.
The air intakes should be ducted to the fan inlet. This measure is necessary to
prevent the pressuris~tion fan reducing the pressure in the plantroom below atmospheric
pressure and hence inducing flow from the building towards the plant rOOm.
- 30 -

5.2.2
The reliability of the plant items are discussed in section 6.
Where an emergency power supply is provided (other than from batteries) then the
pressurisation" fan should also be connected to this supply. The load that can be taken
on the emergency power supply may influence the sizing, and hence the power requirements,
of the pressurisation fan.
Distribution arrangements
The purpose of the distribution system is to convey the air to the escape routes in
the event of a fire and to do this economically. The escape routes in general consist of
lobbies arid staircases and these invariably repeat themselves at the same position at each
floor level for at least a number of successive floors. Distributing to these areas with
a minimum length of ducting can "b~ achieved by:
(a) A single plant serving a vertical duct with short horizontal branches to
each floor.
(b) System (a) but with plants at various levels so as to restrict the
length of duct r-un served by a single plant'->
( c) Individual plants serving each floor.
These methods are shown schematically in Fig 9.,
If arrangements (a) and (b) are compared it is apparent that (b) does not present
any particular economic advantages unLess the building is very tall and ducting is a
major part of the system cost. Taking the cost of the vertical ducting as uniform per
unit surface area and the cost of the hori~ontal branch connestions and fittings being
25% of the total ducting cost then the capital cost ratios are approximately":
No. of plants Relative distribution Relative plantand vertical costs room costs
ducts
1 1.0 1.0
2 0.89 1.6
3 0.82 2.1
These figures do not take full account of the floor space saved by running
smalled ducts vertically when more thanorie plant is used.
There is a technical reason-for limiting the vertical distance served by anyone
pressurisation system. This is the need for a design which inherently meets the
requirement for uniform (or set) discharge at intervals along the vertical length.
This is more easily achieved as the number of branch outlets is reduced (section 5.2.4).
It is more difficult to quantify the cost comparison between systems (a) and (c).
Provided system (a) has branches of limited length and complexity this method will
almost always be cheaper in the case of a multistorey building since the recommended
requirements for (c) would, in "the case of internal pressurised areas, include:
(il individual fan units with controls duplicated at building entrance
(ii) horizontal ducts spanning the building width so that air intakes could
be in two alt~rnative positions
(iii) enclosure of fresh air ducts to give them the necessary fire resistance.
- 31 -

The advantages of (c) are that the vertical shaft is eliminated and net floor
space can be increased.
Ducwork CDns'truction
"The constructional requirements of ducting are for integrity in the event of a
fire and long life at a minimum cost.
These properties for common duct materi~s are summarised qualitively in Table 5.2.
TabLe 5.2.
Duct Maximum operating Resistance tomaterial temperature °c et.moaphe r-Lc Relative cost
corrosion
mild steel 500 poor 1.00
ga.lvanised500 good 1.25mild steel
aluminium 250 good 1.60
P..v.c. 60 excellent 1.90
stainless 600 excellentsteel 9
brick or. 1000 good low since struc-concrete tura! shaft isnonnally required.Extra cost is forsealing.
The economic choice. is between galvanised mild steelducting and builders work.
The latter is probably slightly cheaper (Appendix A), but the necessity for completely
sealing the surfaces, and preferably the internal surface, of builders work ducts is
very important. Brick ducts should not be used for pressurisation without an internal
lining or rendering of the surface. Experience has shown that without seal1ng the loss
through leakage can be high (20 - 50%).
The cost of rectangular sheet metal duct is significantly influenced by the design
operating condition, that is with fan operating at maximum capacity. Current construc
tional specifications (67, 68) distinguish between low velocity ducting at pressures up
to 500 N/m2 and high velocity ducting at pressures over 500 N/m2. The latter is approx
imately 25% dearer (61). Since ducting constitutes about 50% of the t~tal system cost,
the difference represents about 12% on capital costs. For circular sheet metal ducting
there is little difference in cost between law velocity and high velocity ducting.
Pressurisation ducting must be run in a protected shaft but it does provide a
vertical duct connecting with all floors. Whilst this would normally require fire
dampers it is recommended that these be omitted so as to eliminate the possibility of a
malfunction of a damper shutting down the pressurisation system in an emergency. With
the system running at full capacity the pressure developed by a fully developed fire
would not be large enough for ~he fire to enter the duct and hence spread of fire through;
the duct would be pr-event-ed;
- 32 -

5.2.4 Duct sizing
Experience gained from the site visits (Section 7) indicated that many systems
were initially well out of balance and considerable adjustment at the terminals was
necessary to approach the discharge conditions specified. In one case the system ....as
incapable of being balanced in its installed form. This situation is not acceptable when
the correct distribution of air is a prime requirement for the system. The mal-distribution,
which was common, need not arise if suitable procedures are adopted to size the distribution
system. Two design procedures which produce an inherently. balanced distribution system
for long ducts with uniformly spaced outlets are:
(a) the static re-gain method for variable sectio~ ducts
(b) the manifold design metho~ for constant section· ducts.
(a) Static regain method
The design pilosophy of this method is that for a duct with multiple outlets
spaced along its length the static pressure at entry to each branch shall
remain constant. This can be achieved by balancing the static pressure gains
and losses between the branch take-offs, i.e.
Static pressure regain due to lowering of velocity after a branch = friction
plus other losses in main duct up to and including next branch.
The method sizes the duct so that this equation balances. Provided that the
velocity pressure in the main duct. does n~t contribute significantly to the
flow in the branch this method of duct sizing should ensure approximately
uniform outflow.
Standard charts (69) are available for' computing the size of duct's to achieve
this balance. The method has one particular limitation, if a main ,duct of
constant cross-section is chosen then the de~ign solution gives an equivalent
duct diameter of about 260 where £ is the duct length. This solution may be
neither practical nor economic.
(b) Manifold design method
~le solution to sizing ducts of constant cross section appears in many texts,
a simplified solution which can be readily adapted to sizing pressurisation
systems for multistorey buildings where the flow to each floor is equal is
given by Haert'er (70). A balanced flow situation can be achieved if:
(i) the main duct is made very large in relation to the branch ducts
(ii) the resistances of the branches are relatively high.
Where the equivalent diameter of the main duct does not exceed
then these two requirements can be quantified by the equation,
t70
n~ c 0.7 A ICb
or ~< 0.7 A IC
bn
where ~ c.s. area of each branch duct, m2
A = of main duct, ?c.s. area m-
n number of branch ducts
Cb = total resistances factor for branch duct
- 33 -

c _total resistance of branch duct. N1m2
b - velocity pressure in branch duct, N1m2
Total resistance of branch duct =branch entry loss + branch duct friction
loss + branch duct fittings loss + terminal loss.
This simplified solution to sizing of main and br-anch ducts is not valid
if the take-offs at each floor differ sUbstantially.
Economic duct veZocities
The economic duct velocity is that velocity which produces the lowest annual
operating cost for the pressurisation system. The cost- factors Involved in conveying
air for pressurisation through buildings are:
(i)
(ii )
(iii )
(iv)
plant capital costs
duc't ing costs
plant operating costs
space costs.
A simplified analysis of these costs is presented in Appendix A.
Considering only the m~in vertical distribution duct this analysis (equation ~) gives the
mean val~s of Table 5.2 for a typical distribution system handling 1 - 10m3/s.
TabZe 5.2 Economic duct velocities in vertical ducts (mls)
Annual plant Duct space rental £/m'/Annumrunning hours
0 20 50
2600 12 17 21
0 20 27 33
- 34 -

6.
6.1
RELIABILITY OF PLANT FOR OPERATING PRESSURISATION SYSTEMS
Introduotion
The reliability of mechanical ~entilation in comparison to natural ventilation is
one of the main points in favour of pressurisation. The possibility of a breakdown
occurring in mechanical plant must however be considered since safety of life may be
dependent on the plant. A separate study has been made by ~VRA of the reliability of
heating and ventilating equipment (62) and use has been made of data collected in this
study to assess the likely performance of pressurisation,systems. The need for standby
plant has been considered in the light of failure rate data and the frequency of fire
outbreaks in buildings. The type of standby plant, vhere it is required, has also been
considered.
6.2 Conaept of reLiabiLity
Reliability is the probability that an item will perform a required function under
stated conditions for a stated period of time. If n items out of N are still serviceable
after this period, the reliability R=*. Hence if no failures occur, R =1. R can be
related exponentially to the failure rate A (number of failures per unit time), making
the simplification that A is constant with time.
The criterion of reliability can be used to assess the performance of systems.
Where the plant is run continuously, the criterion is the probability of a failure within
a given period of time. Alternatively where a system only operates at any required
instant, e.g. emergencies, then availability (ratio of time in working condition to total
time) is the correct criterion.
6.3 Fai lu.re rates [or mechanical plant
Items of plant to be considered in an assessment of reliability of pressurisation
systems are fans and their motors, various controls including switches, failure sensing
devices where standby plant is to be provided, filters and ductwork including grilles.
Failure rates where available and estimates of the useful life of these items are given
in Table 6.1. Failure rates are given as the average number of faults per year requiring
unscheduled maintenance action. A failure rate of 0.5/yr is equivalent to one failure
every two years. Electrical faults. include power failures due to power cuts, although the
HVRA survey did not include data for the two winters 1970/71 and '1971/72, when extensive
power cuts occurred. No data was available on the reliability of standby generators.
6.3.1
6.3.2
Fan systems
It can be seen from Table 6.1 that fans and motors are the major sources of failure,
and rates are independent of size (motor kv ) and the" ratio of operating/calendar hours.
Common causes of failure are bearings in both fan and motor, and drive belts for centri
fugal fans. A direct driven axial fan has a greater inherent reiiability than a centri
fua! fan due to the elimination of some fan bearings and the drive belts. Not all faults
result in total loss of capability, the percentage that do being considerably greater for
axial fans than centrifugal (68% as oppcaed to 23%). This is due to the difficulty of
regularly inspecting installed direct driven axial fans. The average time to repair a
fault is 12 hours for both types.
Controls
Failure rate data for controls is rather scanty. The figures given in Table.6.1 are
- 35 -

not specifically for ventilation
included· in the fan motor rates.
in the data used.
•
plant. Electrical faults in starter switches, etc. are
15% of all centrifugal fan faults were electrical ones
6.4
Table 6.1 Failure rates [or meohanical ventilation plant
Item Failure rate/yr. Estimated useful lifeyears
Axial fan 0.052 15 - 20comprising fan 0.002
motor 0.05
Centrifugal fan 0.5 15 - 20comprising fan 0.25
motor 0.25
Controlspneumatic 0.68 15electrical 15
Automatic filters negligible 10Ductwork negligible Life of buildingGrilles, diffusers negligibl~ 15 - 20Fresh air screens
negligible 15 - 20and louvres
Fire statis tics
The probability of an outbreak of fire per building per unit time is the frequency
of outbreaks divided by the number of buildings at risk. The frequency of outbreaks in
buildings of various occupancies are published in the annual fire statistics for the U.K.
(63). The number of buildings in these groups can be obtained from rating information (64),
also available annually. An estimate of the probability of a fire outbreak for some
buil~ing occupancies has been made along the lines used by Baldwin (65) but using data
from these 2 sources for 1968 (see Table 6.2),
TabZe 6.2
OccupancyProbability of an outbreak offire per building per year.
Offices 0.0016
Private dvellings 0.0023
Shops 0.0056
Hotels 0.025
Education establishments 0.039
Industrial 0.089
Local government 0.39
Fire statistics used are based on the number of fires large enough for a fire
brigade to be called. In some buildings several outbreaks may be experienced in one year,
in others none. at all. The occupancy classification varies slightly between the 2 sources,
as the population is not strictly the same. Nevertheless the figures serve as a useful
approximate guide. In this light office buildings present relatively low risk, hotels
medium and local government buildings high.
- 36 -

6.5 The need for standby plant
Provision of both main and standby plant for pressurisation systems is an obvious
way of increasing system reliability. To provide a rational basis for deciding whether
the extra expense of providing standby plant is justified, a statistical. approach has
been initially taken but this must be tempered by the emotional considerations associated
v'i t h the safety of life in the final. analysis.
The chance of a fire outbreak and pressurisation plant failure coinciding
The probabilities to be considered are that a fire may occur during breakdoYD or
vice versa. The probability of 2 separate events occurring together is given by the
product of their separate probabilities.
Consider the worst combination from the data in Tables 6.1 and 6.2,- a centrifugal
fan operating a pressurisation system in a-local government building. The mean time the
fan would be inoperative if failure occurred is 12 hours. Hence probability that fan is
inoperative for any 12 hour period in a year is
Probability of fire outbreak in any 12 hour period in a local government building
is0.39
2 x 365 =
3.7 x
Probability.of a plant failure coinciding with an putbreak of fire is therefore-7
10
This is extremely small and does not appear to justify provision of standby plant.
This is not to say that standby plant is not necessary at all, just that the need
for standby plant is very small. Where lives are possibly at stake there is a strong
desire on the part of authorities to ensure maximum safety. Reliability of ,. is not
attainable but by providing standby pl_ant the reliability can be improved. Various
forms of operati~g pressurisation plant with standby provisions are considered in the
next section.
6.6 Operation of standby plant
Reliability figures, based on failure rates from Table 6.1, are given for the
following configurations of standby in Table 6.3.
1) Single fan and motor, i.e. no standby.
-2) Two fan and motor sets in parallel (both operating).
3) Fan and motor, standby fan and motor.
4) Fan, motor and standby motor.
Reliability of standby and parallel systems are given by Ireson (66).
- 37 -

Table 6.3
Arrangement System ReliabilityM= motor (subscript 5F = fan for standby) Fan type
Axial Centrifugal
1
D-[f-0.949 0.607
M, , 1
2 0·997 0.579~
M2 F2
3 ~ 0.998 0.910.
~s
4
~ 0.996 0.758
s
•
that a considerable increase
though, in the case of an
the standby motor being
reliability
standby plant. (this
The overall reliability figures for arrangements (3) and (4) assume
. R = , for switches and -f'a.i.Lure sensing devices that operate
reliability is not reached in practice). These figures show
in reliability is gained by having a standby fan and motor,
axial fan, little extra is gained by having the fan itself,
sufficient.
A parallel system where both fans operate simultaneously and one would continue to
run at reduced load if the other failed, .appears to be significantly less reliable than a
single fan and motor of centrifugal type due presumably toa greater inherent failure rate,
i.e. more components to go wrong.
Conclusions
Mean failure rates for mechanical plant are low, the main causes being fan and fan
motor. Axial fans are more reliable than centrifugal ones. The risk of a breakdown
coinciding with a fire is apparently very small, t~ough where a life support system is
concerned, reliability is of paramount importance to continuing safety of occupants and
warrants the provision of standby plant. In particular a standby motor and/or fan
improves potential reliability considerably. However, the general conclusion is that
standby plant is not objectively necessary to achieve a high level of plant availability
in the event of a fire.
- 38 -

7.7.1
7.1. 1
7.1.2
PERFORMANCE OF EXISTING PRESSURISATION SYSTEMS
Introduction
At the present time there are at least ten known completed buildings in this country
with pressurisation systems and undoubtedly many more are planned or under construction.
None -ot the operational ones has ~een put to the test by a significantly real fire
situation yet, so in a sense their des~gn criteria and performance has not been completely
proven. However smoke tests end various measurements have been made which demonstrate their,.effectiveness in simulated fire conditions. Two site tests have been carried out by JFRO
(5, 6) using a density of smoke comparable with fire conditions, but the accompanying
temperature rise has been rathe! small because of the practical_difficulties associated
with simulation of fire ·io completed buildings. The results of these tests are summarised
below.
PeW'Z Assurance House, CW'di[[
This 26-storey office block has a centre service core containing two staircases with
a lift lobby in between them. In normal operation air is supplied to the staircases at
the rate of 4 air changes per hour and to· the lobbies at 8 air changes per hour. Air is
extracted from the 'staircases, also at 4 air changes per hour, to provide ,a balanced
ventilation system~ In an emergency the staircase supply is boosted to 16 air changes an
hour, extract and lobby supply remaining the same.
Although the pressurisatiori obtained was fairly low (5 N/m2 across stair door and
7.5 N/m2 across lobby door) because of the low air flow rates and the extraction from the
stairs, smoke tests in both' stairs and lobby showed that the system was capable of keeping
smoke out of them when the doors were·closed and the outside weather conditions were
typical.
Royal Courts of Justice, London
This is a 14-storey block consisting mainly of office accommodation. Twin stair
cases in the central core were to be provided with continuous pressurisation to 7.5 N/m2
during office hours. In the event of a fi~e, pressurisation was designed to be increased to
a level of 25 N/m2 , this pressure being maintained while a door to the staircase was held
open.
The des Lgn figures were adequately met. Smoke tests were carried out under normal
and· emergency con~tions, smoke being generated in one of the office areas. The perform
ance of 'normal' pressurisation was rather inconclusive, possibly due to ambient
conditions at the time of the test. Emergency pressurisation was capable of preventing
spread to other parts
This was thought to
smoke entering the staircase and lobbies, although some smoke
building, possibly via the ventilation ductwork, was observed.
to the air tightness of the external wall construction.
of the
be due
7.2 Site· test programme
An investigation of some existing systems (other than those mentioned above) has
been made to assess their performance and to examine practical problems arising in their
design and operation. In the light of the previous work further smoke tests were
considered unnecessary. A quantitative assessment of performance of three systems was
made by the following measurements:
(i) the measurement of the air supply rate to the enclosure by the pressuri.ati~
- 39 -

system. Direct reading anemomet.era and hoods Were used to measure the e rrflow at each inlet grille.
(ii) the relative pressures attained in the pressurised areas. Pressure differencesacross separating doors were measured using a micromanometer and the pitotdescribed earlier (Plate 3).
The precision of measurement (i) was subjeot to certain limitations. In each case
site conditions ruled out the possibility of in-duct measurements, which are inherently
more accurate, for both the branch ducts and the fan discharge. Hence neither the fan
performance nor duct losses could be measured. In addition the grille measurements made
could have been suspect due to non-uniformity of now at the grille face in some cases.
Nevertheless some conclusions can be drawn about the standard of ductwork from a com
parison of design and actual air flows.
7.3
7.3.1
The buildings
Deacon House, Sheffie ld
An office building forming an L-shape, one leg of which rises to 8.storeys. A
design pressurisation of 50 N/m2 was specified for the main staircase and lift lobby ~reas.
Some openable windows were provided in these areas but these were under the control of the
fire brigade. The pressurisation system is single stage, coming into operation on demand
{emer-gency.) only. See Fig -. 10 and Plate 4.
Based on a leakage allowance of 75 tis per single leaf door and 550 tis per lift
shaft , a design air flow of 5135 tis (10,880 cfm) was calculated. The plant room is at
roof level. It contains an axial fan r~ted at 5665 tis and mount-ed at the top o f a
vertical builders duct which has branches to each lobby and to .the staircase at alternate
floor levels. The fresh air intake is in. the side of the plant room. and is not connected
directly to the fan. The design supplies were:
staircase 225 £/5 at each of 4 levels
lobbies 520 tis each, except gro\.Uld floor = 595 tisfor combined entrance hall/lift lobby.
Apart from mechanical extraction from the toilets, the building is naturally
ventilated. Air leakage from the pressurised areas is via windows in offices, stairs
and lobbies, extract ducts in toilets, lift shafts and an exit door at ground level from
the staircase.
the
completed.
In view of
Tests were initially carried out before the building was fully
Temporary doors were stil1 in place and the floors were unfiniShed.
low pressure differences obtained tests were repeated on completion of the building to
see what improvements had been made.
Connnents
The site measurements are set out in Tables 7.1 and 7.2. A marked Improvement, in
pressurisation was achieved in the second set of measurements (Table 7.2). With a mean
value of 60 N/m2., the final pressure "d.i f'f'er-ence between lobby and off~ces was higher than
the design· figure, despite the total air fiow being lower by some 40% than required. This
can be explained by the fact that pressure differences across other doors, for which full
allowance has been made, w~re considerably smaller, indicating a significant resistance
to leakage of air from toilets.
- 40 -

Overall the pressurisation was balanced between staircases and adjoining lobbies.
This is not surprising in view of the positions of the respective supply grilles on
adjacent sides of the pressurisation duct at the same level. Ideally the staircase would
be maintained at a slightly higher pressure than the lobbies.
Table 7.1
Deacon House: Site measurements on preeeur-ieatdon systembefore compl-et-ion of the building.
Floor Staircase Lift lobby
Air supply Pressurisation Air supply Pressurisationils w.r.t. lobby ils w.r.t. offices
N/m2 N/m2
G + 25 t Not measured
1 115 - 2.5 145 + 20
2 - 7.5 170 + 12.5
3 105 - 2·5 260 + 20
4 - 5 270 + 20
5 85 - 2.5 300 + 30
6 - 7.5 265 + 20
7 105 - 5 285 + 25
* 1695Total 410
* Estimated leakage through the toilets was ,40 £/s giving anapparent system supply of 2245 £/s.
t Pressure difference across door to outside.
Tab~e 7.2
Deacon House: Site measurements on preeeur-ieat.ion systemafter completion of building.
Floor Staircase Lift lobby
Air supply Pressurisation Air supply Pressurisationils w.r.t. lobby ils w.r.t. offices
N/m2 N/m2
t ~
G + 2.5 525 + 30 (+105)
1 160 - 7·5 250 + 82.5
2 - 7.5 270 + 87·5
3 170 + 5 • 190 + 52.5
4 + 5 305 + 60
5 185 - 2.5 210 + 52.5
6 - 2.5 300 + 60.
7 125 0 265 + 32.5
*Total 640 2315
*Estimated leakage through toilets was 100 £/s giving an apparentsystem supply of 3055 £/s.
tAcross two sets of double leaf doors in series.Pressure difference across each set is half this value.
~Across main entrance door to street
- 41 -

During the tests a positive airflow from the toilet next to the duct into the lobby
was noticed. It was discovered that the toilet extract ducting was situated inside the
builders work pressurisation duct~ and that pressurisation air was leaking into the
toilets as a result. The estimated leakage is thus included in the total pressurisation
supply.
Due to the suction of the fan~ a negative pressure difference was created across
the plant room door at 'the top of the stairs, and is the most likely cause of the
reduced pressurisation at '[t.h , floor LeveL.
7.3.2. DUson House,SheffieLdThis is a 9-storey office building (10 at the rear), the main staircase and lift
lobby enclosure forming an internal service core at the inner angle of the L-shaped
block. A pressurisatio~ system providing a positive pressure of 50 N/m2 in the staircase
and lobbies was installed and comes into operation only in an emergency.
, The plant room and air intake are at lower ground level. Two axial fans, main
and standby~ each rated at 7360 £/s (15,600 cfm) are provided to distribute pressurisation
air .via a single vertical riser (consisting of sheet trunking inside a builders duct)
to each lobby except the lower ground and the staircase at each half-landing. In addition
a ~aller fan supplies warmed air via the same ducting·to lobbies and staircase during
normal office hours. At ground floor level a fan rated at 1040 £/s (2,200 cfm) has been
mounted in the external wall of the main entrance lobby to cope with the increased
volume of that space. This fan is linked electrically to the main pressurisation system.
Design air supplies for the main system, based on the same allowances as Deacon
House, were 1660 tis for the stairs and 5665 tis for the lobbies. No other mechanical
ventilation is provided in the building. Air leakage from the pressurised areas is via
windows in office and toilet areas, lift shafts, main entrance and rear exit from the
staircase at lower ground floor.
Tests were carried out on completion of the building but before it was occupied.
Plate 5 and Fig. 11 show the building and its layout.
Comments
summary of the site test results is given in Table 7.3.
figure for the staircase is
A·mean pressurisation of
to the lobbies, so that the total
The correspondingmore than required.lobbies~ significantly
17.5 N/~2 with respect
was achieved in the
A
70 N/m2
staircase pressurisation is effectively the sum of these values. Th~se figures are
surprising considering that the total airflow is approximately 35% less than the design,
but can be explained by two factors:
(i) the lobby and staircase entrance doors were clearly a much better fitthan average. Further leakage tests which were made revealed a meangap width about 1.5 mm, or half the average value. Carpet tiles laidon the lobby floor probably contributed significantly towards this lowvalue.
(ii) resistance to air leakage through the toilet windOWS increasingpressure in toilet areas.
The size of the main duct was relatively small causing a very high air velocity
(approximately 20 m/s) at entry on full flow. The effect of this was apparent from the
- 42 -

staircase measurements where extraction of air from the stairs took place at the lower
5 grilles.
Table 7.3
Dyson Hous~: Site meaBUl"ements on pressurisation system.
Floor Staircase Lin lobbies
Air supply Pressurisation Air supply Pressurisation~/s w.r.t. lobby ~/s w.r.t. office N/me
N/m2 Doo~ At Door Bt
LG· -115 Not measured* + 10*§ ,
G - 80 + 35 350 + 20 + 52.5 (+47.5)
- 25
1 - 80 + 5 465 + 75 + 75
2 -.35 + 2.5 460 + 75 + 72.5
3 90 + 17.5 495 + 65 + 67.5
4 180 + 7.5 505 + 75 + 77.5
5 180 + 12.5 495 + 75 + 75
6 200 + 17.5 430 + 67.5 + 67.5
7 175 + 17.5 380 + 65 + 67.5
8 205 + 15 400 + 77.5 + 77.5
Total 695 3980
t See plan
* door to outside
'U across main entrance door to street
does not include additional fan input in ground floor· lobby.
,The volume of the pressurised enclosure only affects the air flow requirement in so
far as the leakage characteristics may be chan~d. It is evident from the test results
that there .was some justification on this basis for the installation of the extra fan in
the entrance hall.
Basildon Hospital
The tests at Basildon were concerned with a tower block containing office and
residential accommodation and rising 9 storeys above the rest of the hospital. A central
service core contains the staircase, of which the lobby was required to be pressurised to
50 N/m2' on each floor. Natural ventilation was provided for the staircase by a Louvred
window and a louvred door, both at the top of the. staircase. Apart from pressurisation,
mechanical ventilation is only provided in the toilets. Plate 6 and Fig. 12 shows details
of the tower block.
The plant room for the pressurisation system is on the 8th floor.' Air intakes were
situated on the roof above the plant room and were sheltered somewhat by a high parapet
wall. A centrifugal' fan rated at 2125 l/s (4500 cfm) supplies air to the lobbies via a
single vertical builders work duct. The system only comes into operation in an emergency
and.a standby motor can be brought in manually if required.
A design supply of 235 t/s 'per lobby vas based on an allowance of just over 75 lisper single leaf door. The inlet grille is situated at low level at one end of the lobby.
- 43 -

Air leakage takes place through lift sh~fts and windows, e ted rceee entrance and vents to
the atmosphere.
Two sets of meaaur'emerrt e were made; firstly with the stair vents open and secondly
with the vents temporarily blocked off. Sealing in the la1;iter case was not perfect by
any means, but the results show some improvement over the previous situation.
Comments
The site test results are summarised in Tables 7.4 and 7.5. With the stair vent
open, a mean lobby pressurisation of 19 N/m2 was measured, considerably less than required.
Total airflow was 30% less than design, which is not enough to account for the low
pressurisation. A total of approximately 2470 tIs or 90 tIs per door is calculated to
ech'ieve 50 N/m2• This clearly reflects on the over size of the door gap.
Air distribution from this system is fairly uni rorm, 9th floor being an exception.
The lobby grille on this floor is almost directly opposite the fan outlet connection,
to the main duct, resulting in a relatively high flow to the lobby •
. In view of the low pressures and the airflow into the staircase at ground level
the staircase vents were blocked off and the tests repeated. The effect of this was to
increase the pressure difference between lobby and corridor (mean value 24 N/m2) at the
expense of a lower pressure difference between lobby and staircase. The staircase is
pressurised with respect to outside air by leakage from the lobbies to a limited extent.
The higher stair pressure observed in the, second tests reduces the possibility of any
smoke which does enter the lobby being driven onto the stairs.
Table 7.4
BasildOn Hospital: Site test measurements withstaircase vents open.
.Floor Air supply Lobby pressurisation N/m2
tl.sw.r.t. stairs ".r.t~ corridor
tdoor A door B
• - 6.5' - 6.51G - 6.5
1 165 + 23 + 22 + 25
2 165 + 14 + 16 + 16
3 165 + 15 + 14 + 12.5
4 .150 + 15 +·17 + 18
5 165 + 16 + 20 + 18
6 175 + 21 + 22 + 20
7 185 + 26 + 23 + 18
8 150 I + 15 + 10 + 10
9 205 Not measured
Total 1525 .
t see plan
• stair door to outside, stair door to main entrance hall
stair door to changing room
- 44 -

BasUdon HospitaZ:
TabZe 7.S
Si te . test measzatem6nts lsJithstair vente bloeked
7.4
Floor Air supply Lobby pressurisation N/m21/s w.r.t. stairs w.r.t. ccrr Ldor-
t t'door A door B
• + 16' + 16§G + 221 165 + 12 + 32 + 302 165 + 5.5 + 2.1 + 223 165 + 4 + 23 + 21·
4 150 + 4.5 + 21 . + 22
5 165 + 7 + 27 + 256 175 + 10 + 26 + 24
7 185 + 13 + 28 + 238 150 - 1 + 17 + 18
9 205 Not measured
Total 1525
t see plan
* stair door to outside
~ stair d09r to main entrance hall
stair door to changing room
Genel'at conatu.sions
A properly sized ductwork system .is clearly needed to achieve the required air
distribution (see section 5) and in particular to avoid the sort of suction effect near
the fan (reference pyson House). It is important that a che~k of the fan and system
performance can be made and the system should be designed with this in mind.
Although no direct check was made, it is expected that leaky ductwork contributed
to the low airflows in each case. The site tests implied that the builders ducts were
the main culprits and these should be rendered if it is intended to use them unlined for
pressurisation. In any case an allowance for ductwork losses should be made at design
stage.
Variation in the fit of doors is a major factor in attaining a specified pressuri
sation.·· It ,can be seen from the site tests that high pressure differences do not neces
sarily correspond to areas with high air supply rates. The only wa¥ in which an accurate
design can be made ·is by fairly precise control over the size of door gaps to the
pressurised enclosure.
In two of the buildings the fan was not directly connected to. the air intake and
this created a negative pressure in ·the plant room in relation to the rest of the
building. There is a danger that smoke could be dz-evn Int.o t.he plant room and. distributed
with pressurisation air to the escape routes. It is recommended that a ducted connection
be used from the air intake to the fan inlet.
Pressurisation of staircase lobbies can provide an effective me~6 of keeping smoke
- 45 -

out of the s~aircase too, although the staircase is necessarily at a lower pressure and
this may be considered an inferior s~ke control system to positive pressurisation of the
staircase. Providing the staircase is not vented, leakage from the lobbies press~ises
the staircase· to a limited extent.
- 46 -

8. DESIGN INFORMATION FOR PRESSURISATION SYSTEMS
This section sets out as concisely as possible the design data required for pressurisation,
which has been extracted from sections 1-7. Reference' to the appropriate subsection for more
detail is given wherever possible.
8.1
8.2
space pres8urisation requirements
The level of pressurisation should not be less than the appropriate value for the
building height given in Table 8.1 or greater than 50 N/m2 with all doors to the
pressurised zone closed (4.3, 5.1.3).
Table 8.1
Building height Pressurisation level, N/m2
metres Emergency operation Reduced capacity operation
5 or under- . 25 7ground
25 25 7
50 50 15
100 50 15
150 50 20
The figures in Table 8.1 do not apply to buildings on coastal or other exposed
sites i.e. those experiencing minimum temperatures less than -lOOC or maximum hourly2
wind speeds greater than 20 m/s. A pressurisation of 50 N/m will normally be required
for exposed sites to overco~e wind effects. Meteorological data for the exposed site
should be considered to ensure that local conditions are taken into 'account (2.4.2).
Air Leakage characteristics of buiUingE!..
Table 8.2 contains values of air leakage rates for doors (3.4.2) and windows
(3.3.4) to qe used in conjunction with the pressurisation requirement in calculating air
flow rates for pressurisation. The leakage rate Q at other pressure differences, 6p,
can be calculated from the leakage rate K at 1 N/m2 using the appropriate value of N in
Table 8.2. from
Q = K x '-IsTable 8.2
Component Type Crack Leakage rate fJ./s Index Equivalentlength Pressure difference N/m2 N leakage
m 1 15 io 25 50area m?
7
Windows Pivoted 1 0.21 0.71 1. 14 1. 37 1.60 2.42 1.6,
Pivoted andweather stripped 1 0.030 0.10 0.16 0.20 0.22 0.35 1.6
Sliding 1 0.082 0.28 0.45 0.53 0.61 0.94 1.6
Doors Single leafa) office door
5·5 9 24 34 39 44 62 2 0.01with catch
b) doors withoutcatch 5.6 17 45 67 77 86 . 122 2 0.02
Double leaf(with or without 9 25 66 95 110 123' 174 2 0.03centre rebate)
Lift entrance 8 39 103 151 174 195 276 2 0.05
- 47 -

8.3 Calculation of air voLwnes [or preBsurisation (4.4.3)
Procedure
(i) Consider building lao-out, confirm ar-ea] e ) to be pressur-ised and decide on
system of operation (5. 1 ) to be used.
(ii) Select pressurisation levels for emergency and if necessary reduced capacity
operation from Table 8.1.
(iii) Determine the component air leakage rates from each area at the required
pressurisation 85 follows:
a) Sinsle components
For individual doors and windows, use the leakage.. rates in Table 8.2.
For other openings c8J.culate the leakage rate Q as,
Q = 827 A (6P)! ~/s
Where A is the effective leakage area of the opening .in m2,
6p is the pressurisation in N/m2~
For single openings A is the net free area. The effective leakage area
of several components in series is,
=,
+ (A,)2 + +
and the effective leakage area of aever-ej, components in parallel is
A = Aj + A2 + A, + •••••.•.
b) Lift Shafts
The effective leakage area and hence the leakage rate of lift shafts
should be computed from the respective .leakage areas of lift doors,
ventilation and other openings to the shaft using the above equations.
For shafts in which the only openings are the doors and the minimum vent
. area of 0.1 m2 per lift req~ired for ventilation purposes (74), the
total leakage rate into the shaft is,
QD
x K]
where
=
lift door leakage rate from Table 8.2,
a "factor for the number of floors (i.e. number of lift
doors to the shaft) from Table 8.3.Table 8 3
Number of floors served K[by lift shaft
1 0.9
2 1.4
4 1.8
8 or more 2.0
c) Toilets adjacent to a pressurised zone
For toilet and other areas which are directly connected to a pressurised
zone and have mechanical extract systems, the leakage rate into them
is either
the extract rate in tIs when the extract fan is running,a)
or b) Q x K2 s t«,
where Q =
with the extract fan off,
the door leakage rate in 9./s
- 48 -
at the design pressurisation

tis
specific grilles or gaps arefrom Table 8.2, unless
provided for air now,
=in which,
827 AD (6p)'
case
K2 factor from Table 8.4 for the ratio
~ door Leakage. area including air flow grilles etc, m?
For ordinary' crackage around the door, a typical value
for ~ is 0.02 m2.
~ = Minimum cross section area of extract branch duct in m2.
Note: This may occur at a balancing device i.e. orifice.
or damper.
TaU. 8.4
~AD
K2
4 or more 1
2 0.91 0.7
0.5 0.45
0.25 or less '0.25
d) Large openings (4.4.2)
Design pressurisation cannot be maintained if large openings exist between
pressurised areas and neighbouring spaces. If openings arise intermittently
then design pressurisation levels are not continuously maintained but smoke
can be kept back from the opening for short periods of time if the·egress
velocity from pressurised spaces is sufficiently high. A minimum egress
velocity of 1 mls is recommended. The average air velocity through the
opening can be assessed from the air supply rate to the pressurised space
. and the area of the opening by assuming all the air flows out through the
opening.
(iv) Determine the total air leakage rate as the sum of leakage rates through single
components, lift shafts and toilets (iii).
(v) Determine the total rate of mechanical extraction, if any, from the pressurised
spaces (other than toilet extraction included in (iii) ).
(vi) The total fan capacity r-equi r-ed is the sum of air flow rates from (dv) and (v),
plus an allowance for duct losses as given in 8.4.3.
(vii) Supply rates at terminals to individual pressurised spaces are in the proportion
of leakage and extraction rates from each space to the total fan capacity.
8.4 Pl.ant and pl.antl'Oom requil'ements . (5.1)
The following recommendations cover the number and extent of pressurisation systems
for servicing escape routes in buildings.
(a) A separate pressurisation system should be provided for each stairwell.
(b) A single pressurisation plant and distribution syst~m may serve a stairwell
and its associated lobbies where both are pressurised.
- 49 -

8.4. ,
8.4.2
8.4.3
(c) Where more than one stairwell has access to a cammon lobby .separate pressurisa
t.Lon systems should be provided for each stairwell as specified. in (a). Allor
any of these stairwell pressurisation systems may also supply. the common lobby.
The recommended operating procedures for pressur~sation systems are summarised
in the' following table.
TabZe 8.:;
Building details Operating schedule for pressurisationplant
Accommodation Fire alarm Normal duty Emergency dutysystem
Occupied buildings Automatic or Plant off Plant runs at fullwithout sleeping manual capacityaccommodation -
Occupied buildings Automatic Plant off . Plant runs at fullwi:th sleeping capacityaccommodation
Manual Plant off in Plant r-uns at fulldaylight hours. capacityPlant runs atreduced capacityduring silenthour-s
The reduced capacity level for plant operation in the case of buildings with
sleeping accommodation should be 50 - 55% of the full air now duty requi.renent . Where
.an automatic fire or smoke alarm system is installed this is assumed to initiate the
pressurisation system when the alarm is made.
PLantroom Zoaation (5.2.1J
The preferable location for plantrooms housing pressurisation equipment is at or
near ground level. They should not be placed near potential fire hazard areas, e.g.
. a boiler house.
Plantrooms can also' be positioned at roof level or an intermediate level but these
should include dual air intakes to ensure that at least one is clear of smoke. These
intakes should face in different directions and if placed near the side of the buil~ing
they should have smoke operated dampers in each inlet duct to prevent smoke circulation
by pressurisa~ion systems.
A system of pressurising each floor individually is feasible but may be more
expensive.
P2antroom construction
The structure of pressurisation plantrooms should be of materials having a minimum
fire resistance rating of one hour. Plantroom access doors should be self-closing.
PLant (:;.2)
The basic plant requirements are a fan and distribution system. If the same
system is used to supply the normal ventilation requirements to pressurised areas
during occupied hours a heat exchanger end filter are likely to be included. These
- 50 -

8.4.4
latter items can, be by-passed for emergency operation.
The required fan duty shall be assessed from the following:
Volume flow rate = Aggregated supply to all pressurised areas (see 8.3)
+ 10% for possible leakage.
Fan total pressure = Total resistance of distribution system PLUS
emergency pressurisation level (see 8.1).
Fan static pressure = Fan total pressure - velocity head at fan discharge.
For normal applications a standby pressurisation fan should not be necessary
(see section 6.).
The ductwork systems should generally conform -to BSCP 413 - Ducts for Building
Services.
PlAnt suppZy and controZs
Where an emergency power supply is provided for the building (other than by
accumulators) then the pressurisation fan should also have a connection to this supply.
The following control arrangements are recommended:
(a) The fan shall be energised from an automatic smoke or -fire detector system
where this is fitted. The fan shall be switched off independently of the
detector system.
(b) Manual start/stop contro~s shall ~e placed in the following positions,
Ci) in the central building services control room
(ii) in the pressurisation plantroom if this is remote from the
central control room
(iii) near the building entrance in a position agreed with the
local fire authority.
8.5 Distribution system (5.2.2, 5.2.3)
For multi storey buildings the pr~ferred arrangement of a pressurisation distribution
system is a vertical duct running adjacent to the pressurised spaces. This arrangement
has advantages of low cost and minimum exposure of ducting in the event of a fire.
The distribution ducting should generally conform to BSCP 413. For the arrangement
outlined above the latest draft of this Code of Practice calls for fire dampers where
the branch ducts penetrate the vertical protective structural shaft. The operating
conditions for pressurisation syste~s during the evacuation period should not lead to
closing of such dampers, but they could create a hazard in the case of pressurised
lobbies if a random mechanical failure of a fusible link occurred when the pressurisation
fan started. To avoid this happening it is recommended that permission be sought to omit
these fire dampers (fire dampers can be avoi~ed if the duct is situated wholly within a
protected enclosure).
The recommended forms of construction of the distribution system are,
(i) galvanised mild steel ducting run in protected shafts. The sheet
metal construction fJ'hould be to the HVCA specifications DW/121 or DW/132
(ii) brickWork ducting used solely for air distribution and with the internal
surface rendered to limit air leakage
(iii) concrete ducting used solely for air distribution with all joints sealed.
- 51 -
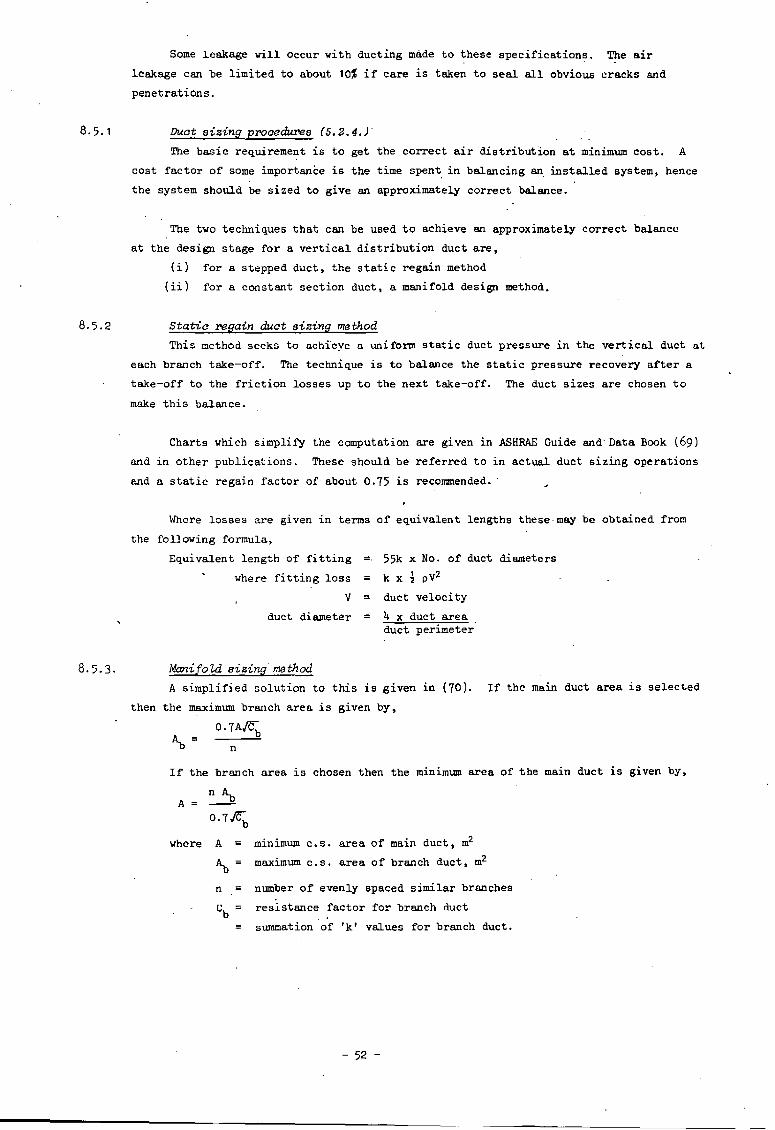
8.5.1
Some leakage will occur with ducting made to these specifications. The air
leakage can be limited to about 10% if care is taken to seal all obvious cracks and
penetrations.
Duct sizing pl'Ooodurea (5.2.4.)"
The basic requirement is to get the correct a~r distribution at minimum cost. A
cost factor of some importance is the time spent, in balancing an installed system, hence
the system should be sized to give an approximately correct balance.
The two techniques that can be used to achieve an approximately correct balance
at the design stage for a vertical distribution duct are,
(i) for a stepped duct, the static regain method
(Li ) for a constant section duct. a manifold design method.
Static :regain duct sizing method
This method seeks to ech ieye a uniform static duct pressure in the vertical duct at
each branch take-off. The technique is to balance the static pressure recovery after a
take-off to the friction losses up to the next take-off. The duct sizes are chosen to
make this balance.
Charts which simplify the computation are given in ASHRAE Guide and'Data Book (69)
and in other publications. These should be referred to in actual duct sizing operations
and a static regain factor of about 0.75 is r'ecoamended , '
Where losses are given in terms of equivalent lengths these·may be obtained from
the following formula,
Equivalent length of fitting -. 55k x No. of duct diameters
where fitting loss = k x ~ pv2
V = duct velocity
duct diameter '" 4 x duct area .duct perimeter
8. 5. 3. Mani[0 Zd sizing method
A simplified solution to this is given in (70). If the main duct area ~s selected
then the maximum branch area is given by.
0.7A~
n
If the branch area is chosen then the m~1mum area of the main duct is given by,
A =
where A minimum c i s , area of main duct. m2
~ = maximum c. s , area of branch duct. m2
n = number of evenly spaced similar branches
~ resistance factor for branch ductb
= summation of 'k' values for branch duct.
- 52 -

Cb can be" determined as. follows,
Branch duct k factor Area correction Area correctedelement for element factor k value
branch connection kl 1 k j
duct re sistence ft ....!!.... ss. C:Yd Po d
branch fittings k2 __a_ k 2 C:YPoterminal
~ ....!!.... ~(PoYp V Po p V a
Cb
sum of area corrected k values
The area correction is applied if the branch duct changes its cross-sectional
area (from say ~"to a):
f = duct friction factor, approx. 0.018
~ = duct element length, m.4a
d = duct diameter (or perlmeter) , m
a = c.s. area of duct fitting or length, m2
6p = terminal pressure drop, N/m2
V = nominal velocity at duct. te~nal, m/s.
Some loss factors for t.yp'i cal, branch connections are shown in Table 8.6
The losses. in the straight through section of a branch fitting are relatively small.
Values for a typical range of fittings are given in Table 8.7.
Tab~e 8.6 ~nch ~o88e8 IkJ for typica~ duct fitting8
Branch loss k =
Velo~ity Rectangular duct fittings. Fig.Nos~ refer to Circular duct fittings. Fig. Nos •ratio HVCA Duct Spec . DW/121 (67) refer to HVCA Duct Spec. DW/132 (68)
~ -?> ~ ~ ;-71
V3 ,tl ~J1 I~I 1;r ,-1,iv, 3 , 3 3 3Fig.9. Branch Fig.l0. Branch Fig.l0l. Fig. 113..ducts up to 400 ducts over 400 Conical tee Straight tee.mID. wide mm. wide
0.2 18.0 22 22
0.3 8.5 10.0 10 10
0.4 4 6.3 5 6.3
0.5 2.3 4.3 3 4.3
0.6 1.5,
3.2 2 3.2.
0.7 1.0 2.5 1.5 2.5
0.8 0.7 2.1 1.2 2.1
0;9 0.6 1.7 0.95 1.7
1.0 0.5 1.5 0.8 1.5
- 53 -

TabZe 6.7 Straight-through Zosses [or typicaZ branch fittings
Straight through loss K ~~pV12
V1
) --~)V2
8.6
Velocity Loss factor kratioV2 Rectangular duct Circular duct-Vi
0.4 0.12 0.36
0.5 0.09 0.25
0.6 0.06 0.-16
0.7 0.03 0.10
0.8 }0.9 0.0 0.0
1.0
Venting requirements (4.5)
The requirements of one of the following four methods should be used to ensure
adequate venting. Alternatively, if more than one method is to be used, the requirement
of individual methods may be reduced in proportion to the amount of venting provided by
each one. ~ is the net volume rate of pressurising air leakage to the floor (i.e.
excluding the air leakage to atmosphere via lift shafts and toilets) in lis.
Method
(a) Window leakage (4.5.2)
Table 8.8
Recommended minimum winaow crackage for reZief of proessur'isation systems
Window typeTypical air leakage rate Recommended crack length
R.ls. m. N/m2 metres
Pivoted, no weather 0.21 1.2 ~stripping
Sliding 0:082 3.0 ~
Pivoted and weather 0.030 8.3 ~stripped
In assessing the available crackage, one face of the building shQuld be discounted
because of possible adverse wind conditions.
- 54 -

(b) Peripheral venting (4.5.3)
Vents should be provided on all sides of the building, but one side should be
discounted in assessing the effective open area to allow for adverse wind
conditions. The effective Open area per floor should not be less than~I
m22500
(c) Verticai shafts (4.5.5)
The recommended minimum sizes of shaft and vents are as rcr.i.cve r
Net vent area (room to shaft) A" =~m22000
8.7
8.7.1
Shaft size· = 3 Av m2
Top vent (shaft to atmosphere) = 3 ~ m2
(d) Mechanical extract (~.5.4)
The extract rate per floor should not be less than ~ lIs. Suitable precautions
should be taken to ensure that the system, will withstand high temperatures and
that smoke will not be spread to other floors via the ducting system.
Table 8.9 Guide to the choioe of venting system
Bui.Ld'ing layout Windows Ventilation Venting system.
Main method Additional methods,if required '
,Open plan Openab.Le , Natural (a)non -weatherstripped
Open ebLe , Natural or (a) or (c) (b) or (d)weather- Mechanicalstripped
Sealed Mechanical (c)
.Compar-tmerrted Openable, Natural (a)non-weatherstripped
Openab.Le , Natural or (a) or (b) (c) or (d)weather- Mechanicalstripped
Sealed Mechanical (b)
Site testing of pressurisation systems
Generat conditions of tes ting
Tests should be carried out to check the performance of pressurisation systems after
completion and before occupation of the building. It is particularly important that the
proper doors and windows are fitted and are in the closed position before ai~ flow and
pressure difference measurements are made. Vents to vertical shafts and on the leeward.
sides of.. the building that are required for pressurisation relief should be open. Tests
should not be carried out in winds stronger than 5 mls (11 mph), since it would b~
difficult to allow far the adverse effects of wind on pressurisation. An allowance may be
made for stack effect however as indicated in 8.7.3.
- 55 -
\

8.7.5
Measurement of ail' [?a.J rates
Provision should be made for the measurement and regulation of the total air flow
rate in the main duct near the fan and the air flow rates in the branches near each
terminal in accordance with the' general guidelines set out by the IHVE Commissioning
Code (75). The l~out of .the plant room and air distribution system should;be designed
with these measurements in mind. It is recommended that actual air now rates to each
terminal be measured, since these are critical to pressurisation, rather than proportional
measurements at the terminals suggested by the Code.
Measurement of pressure differences
Pressure differences should be measured across each floor from the pressurised zone
giving access to thc accommodation area. Plate 3 shows suitable portable apparatus for
these measurements. The design pressurisation level should be achieved on each floor of
the building. In practice however stack effect may act to modify the pressure differences.
Table 8.10 gives maximum recommended values for the reduction in pressurisation due to
stack ef~ect which may be allowed in assessing whether the system meets design require
ments. In winter the greatest reduction occurs on the lowest floor level of the building,
becoming successively less at each floor up to the neutral pressure plane level. Above the
neutral plane the a~tual pressure differences become successively greater than the design
pressurisation at each floor.
Table 8.10
Building height Maximum allowable reduction in pressurisationmetres due to stack effect for testing purposes. N/m2
Indoor/outdoor temperature difference
10°C 200C
5. 1 1
25 2 3.5
50 3.5 6.5
100 6.5 12.5
150 9·5 19
Alarm system test
Tests should be made to ensure that the pressurisation system is brought into
operation by manual and automatic alarm systems i.~. the pressurisation fan(s) are
started, or are boosted to full capacity when reduced leve~ pressurisation is provided.
In addition cancellation of the alarm should not shut dqwn pressurisation fans.
Main tenance
The operation of pressurisation systems inclUding all starting controls should
be tested, in conjunction with fire alarm tests, at regular intervals not more than
12 weeks apart to ensure that systems are maintained in working order.
- 56 -

9.
FUTURE RESEARCH INTO SMOKE CONTROL WITHIN BUILDINGS
During the course of this project certain problems have been seen to be much deeper
than the scope envisaged and problems in other related fields have also been apparent.
These areas which in our opinion need further consideration and research are briefly
reviewed below.
(a) An assessment of the evacuation of a building and its influence on the
efficacy of a pressurisation system.
A pressurisation scheme for escape routes is most effective when there are
barriers which impede the escape of the pressurising air. However, during
evacuation there will be intermittent opening of doors between stairwells and
lobbies and further the ground rj.oor door leading from the stairwell may be
open for a considerable period. Hence pressurisation air will be dispersed
through these openings with a substantial reduction in pressurisation level.
The influence of such events or the movement of smoke within the building does
requir~ further consideration. The p~oble~ is not simple, the influence of
wind and stack effect with an open ground floor door could conceivably increase
the pressurisation of stairwells.
(b) Use of normal air conditioning and ventilating systems for smoke control._
We have shown that with a well-sealed building facade that the excess air
supplied for air conditioning or ventilating purposes is adequate to pressurise
the building. It is then feasible for such systems to overcome the pressures
developed by fire, wind and stack effects by simply venting (i.e. lowering the
pressure) of the fire space. There are many attractions to such a scheme but
much more detailed consideration needs to be given to the mechanics and
protection of the mechanical systems to ensure their operation and reliability
under emergency conditions.
(c) Methods of venting.
The report has high-lighted that venting is an integral part of pressurisation.
Methods of venting buildings have been outlined but apart from the case of the
building with a sufficient number of ~verage quality openable windows a simple
universal solution to venting potential fire spaces is not apparent. All the
methods advocated (section 4.5) have limitations in application or conflict
with existing regulations. There is a need for detailed consideration of
methods of venting we~l-sealed building that will lead to hardware specifications.
(d) Unusual. applications_
The design procedures put forward in this report are based on studies of
buildings of simple shape and layout sub ject.ed to design wind and stack effects
and as such are generally applicable to most modern building designs. The wind
effects can however be different for unusually shaped buildings or special
locations and this may warrant a separate study being made in such casea , The
computer program CRKFLO used in this project could with some modification be
made more efficient for studying the infiuence of a range of conditions or
building parameters on. the pressurisation requirements of special. applications.
This program would be complementary to the proposed design procedure.
- 57 -

APPENDIX A
ECONOMIC VELOCITIES IN VERTICAL DISTRIBUTION DUCTS
An anaf.ys i s of .tl!e economic velocities in ducts was made by Swain et a1 (60) a
rew years ago and their data confirmed the then existing practice. Their analysis is
repeated here using more up-to-data figures end applying the study to a simple vertical
pressurisation distribution system.
The cost factors involved in assessing the economics are,
(i) amortisation of the plant costs
(ii) amortisation of the ducting costs
(iii) running costs of the plant
(iv) cost of floor space occupied by ducting.
Symbols
Air volume Q m3/s
cost of ducting /m2 .. £/m2 of surface area
length of small side of duct a
duct aspect ratio s
mean duct velocity v
friction factor. f
air density p
equivalent duct dia. D = 2as1+5
annual fan r-unn-ing hours T
unit electricity charge ~ £/kwh
:fan efficiency n,
motor efficiency n2
floor rental value R £/m2
pressure drop p
For a given design the system factors influenced by the duct velocity are the size
and resistance of the main duct since the branch conditions will be common to all floors.
Hence a single length of ducting can be analysed and this has been taken as unit length.
The cost factors are quantified belovo
(i) Plant costs
Assume that plant costs are given by the formula
Cost = bQ + cQp, where b and c are constants.
If the pressure loss in the main duct at the branch is neglected,
dC, =dv
friction loss
Capital cost (;1
Taking f = 0.02
f (jpv2 )D
= f (1+s)pv24as
and with a = jelLvs
bQ + 0.005 cQ C: s) p (v~sy0.0125 co C: s) (Q sv3)~
=
=p
- 58 -

If p 1.2 kg/m 3
c = £0.07 (taken from typical plant costs),
____ (1)
The amortised cost is taken over 10 years at a rate of interested of 10%, this
then gives
1. 711Ql+
(ii) Ducting costs
The alternatives are (al sheet metal duct 1n brick shaft (two extra brick
walls required)
(b) concrete duct.
At current building prices,
(al a = 5.4 (sheet metal) + 3 (brick)
1:8. 41m2
(b) a = £8.0/m2
Taking option (b) then ducting cost is,
C2 a x perimeter
8 x 2a( 1 + S l16 (, + s ) j1
sv
dC2 =dv -8 (, + s ) ~~
jsv
The amortised cost is,
1.3(1+s) (~~)~
(iii) Running costs
For unit length of duct annual running cost,
C3 = ---'!:.L x~njn2 1000
(4)
dC3dv
0.7, n2 0.8, T 2600, q, 1:0.0087,
0.0404 Qp
0.0404 Q [ 0.005 x 1.2 C:s) (v~s) ~ ]
1
2.4Q (Lp) (v~s)
~
~
1
6 (Lp) (Qsv.3 ) ~ (5 l1""()'+
(iv) Space rental
Assume that space taken up 1S duct c.s. area plus 150 rom on all sides.
Floor area lost
~ 59 -
+ 0.09
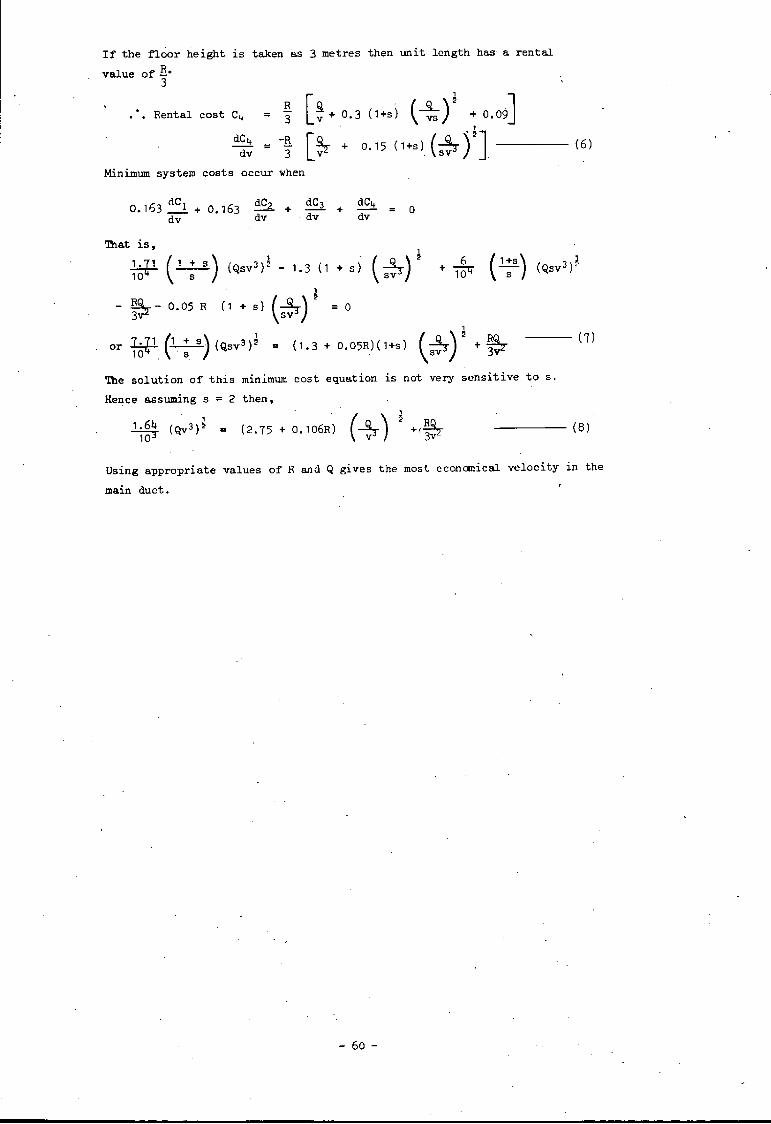
If the noor height is taken as 3 metres then unit length has a rental
value of B..3
----(6)
,+ 0.09J
R [~ . (-%sYRental cost C4 = 3 v + 0.3 (1+s)1
dC4=
-R[~ 0.15 (1+s) (~rJ+
dv 3
Minimum system costs occur when
0.163 del + 0.163dv
dC2- +dv
dC3 +dv
dC4dv
o
~at is,
~ cP C: s) (Qsv3)~ - 1. 3 (1 + s ) (se3) ~ 6+ "'i"'Q'G" (
1+s) ~-s- (QSV 3 ) L
~~ - 0.05 R
The solution of this minimum cost equation is not very sensitive to 5.
Hence assuming s = 2 then,
.. (2.75 + 0.106R) (8)
Using appropriate values of R and Q gives the most economical velocity in the
main duct.
- 60 -

References
1. J. H. McGuire, "Smoke movement in buildings II • Fire 'Pechncd.ogy , 1967, l, p.163.2. A. Silcock, "A critical look at the current problems of escape route planning and a glimpse
of the future" • JFRO Symposium No. 4, M:>vemcnt of smoke on escape routes in buildings,
Paper 1, Watford, 1969.
3. H. L. Malhotra and N. Milbank, "reovement of smoke in escape routes and effect of pressuri
sation. Results of some tests performed in a new departmental store". JFRO Fire Research
Note No. 566, 1964.
4. E. G. Butcher, P. J. Fardell and J. Clarke, "Pressurisation as a means of corrt ro.Ll.i.ng the
movement of smoke and toxic gases on escape routes", JFRO Symposium No.4. Movement of
smoke on escape routes in buildings, Paper 5, Watford. 1969.
5. T. H. Cottle, T. A. Bailey. E. G. Butcher and C. Shore, "Smoke tests in the pressurised
stairs and lobbies in a 26 storey office building". JFRO Fire Research .Note No. 850. 1970.
6. E. G. Butcher and M. Hall, "Smoke tests in new law courts building", JFRO Fire Research
Note No. 889, 1971.
7. Uniform Building Code, VoL -3. 1970, Housing. Section 3309, "Smoke proof encLoaure s'",
8. "Vertical enclosures II. A study by the Los Angeles Fire Department, 1966.
9. "Mechanically ventilated smoke proof enclosure", Los Angeles Fire Department, 1970,. City
of Los Angeles BFP & PA Requirement No. 56.
10. J. G. Degenko.Lb , "Smoke proof enclosures", ASHRAE Jnl, April 1971, 33.
11. M. Galbreath, "Time for evacuation by stairs in high buildil1/?s", Fire Fighting in Canada,
1969, D, No. 1.
12. G. T. Twnura and A. G. Wilson, "Pressure differences caused by wind on two tall bui.Ldi.nga",
ASllRAE Trans., 1968, l!!., II, 170.
13. G. T. Twnura and A. G. Wilson, "Pressure differences :for a c-stcrev building as. a re.s.ult
of chimney'effect and ventilation system operation", ASHRAE Trans., 1966. E, I, 180.
14. G. T. Tamura and A. G. Wilson. ''Building pressures caused by chimney effect in 3 hi.gh
buildings", ASHRAE Trans., 1967, TI, II, .1.1.
15. G.T. Tamura and A.G. Wilson. "Building pressures caused by chimney action and mechanical
ventilation". ASH RAE 'I'r-ans . , 1967, n, II, 2.1.,
16. G.T. Tamura, "Compu'ter analysis of smoke movement in tall buildings", ASliRAE 'I'rans , , 1969,
1.2., II, 81.
17. G. T. Tamura and A. G. Wilson, "Natural venting to control smoke movement in buildings
via vertical shafts", ASHRAE Trans., 1970.12., II, 279.
18. G. T. Tamura. "Analysis of smoke ·shafts for control of smoke movement in buildings",
ASHRAE Trans •• 1970, 76, II. 290.
19. National ~esearch Council of Canada~ Associate Co~ttee on the National Building Code,
"ExpLanat.cry paper on control of smoke movement in high buildings II , NRC No. 11413, 1970.
20. G. T. Twnura, J. H. McGuire and A. G. Wilson. "Air handling systems for control of smoke
movement". ASHRAE Jnl, November 1970, 37.
21. Commonwealth Experimental.Building Station. "CEBS Researches and Facilities - Flame
spread 8J1d smoke tests", RF No. 35-. February, 1972.
22. Standards Association of Australia, Committee BD/41 Ventilation and Air Conditioning,
"Draft Australian Standard Code for mechanical ventilation and air conditioning' in
buildings. Part 2, Fire precautions in buildings with air handling systems", May 1970.
23. J. H. McGuire, "Control of smoke in buildings", Fire Teclm'alogy , 1967,3, p.281.
24. "Operation school burni.ng'", Official report on tests conducted by the Los Angeles Fire
Department, 1959, NFPA.
- 61 -

25. V. B. Torrance, "Wind profiles over a surburban site and wind effects on a half full
scale model bu'iLd'i.ng'", Building Science, 1972, 1, 1-12.
26. H. C. Shellard, "~e estimation of design wind speeds", NPL Symposium No. 16,Wind
effects on buildings and structures, 1963, Vol. 1, Paper 1.
27. A. G. Davenport, "The dependence of wind loads on meteorologiCal'parameters", Int.
Research Seminar, Wind effects on buildings and structures, Canada, 1967, Vol. 1.
28. Meteorological Office, "Tables of surface wind speed and direction over the United
Ki.ngdom'", 1968, M.O. 792.
29. N. C. Helliwell, "Wind over London", 3 Int. Conference, Wind effects on buildings and
structures, Vol. 1, Tokyo 1971.
30. BSCP 3, Ch V, Part 2, "Wind Loads".
31. R. E. Whitbread, "An aez-odynanri,c investigation for the 437 !'t. tower block proposed for
the Albert Embankment, Vauxhall, London", NFL Aero Report 1032, 1962.
32. M. A. Packer, "Wind pressure measurements on a model of building block F in the Barbican,
London", NPL Aero Report 1086, 1964.
33. C. W. Newberry, K. J. Eaton, J. R. Mayne, "Wind loading of a tall building ill an urban
environment. A comparison of full scale en d wind tunnel tests", Symposium on wind
effects on buildings and structures, Vol. 1, Loughborough, 1968.
34. P. J. Jackman, "A study of natural ventilation of tall office buildings", HVRA Lab.
Report 53", 1969.
35. K. H. Q.uenzel, "Meteorological data", Forster-Verlag AG, 'Switzerland, 1969,44-46'.
36. F. C. Houghton and C. C. Schrader, "Air leakage through openings in bui.Ld'inga'", ASHVE
Trans., 1924, 30, 105.
37. F. C. Houghton and M. E. 0' Connell, "Air leakage through a pivoted metal window",
ASHVE Trans., 1928, 34, 519.
38. F. C. HOUghton and M. E. O'Connell, "Air leakage studies on metal windows in a modern
office building", ASHVE Trans., 1928, 34, 321.
39. W. M. Richtman and C. Braatz, "Effect of frame caulking and storm windows on infiltration
around and through win dovs II , ASHVE Trans., 1928,~, 547.
40. .G. L. Larson, D. W. Nelson and R. W. Kubasta, "Air infiltration 'th rough'<doubLe-Hung
wood windows", ASHVE Trans., 1931, 11, 571.
41. D. O. Rusk, V. H. Cherry and L. Boelter, "Air infiltration through steel-framed windows",
ASHVE Trans., 1933, ~, 169.
42. J. R. Sasaki and A. G. Wilson, "Air Leakage values for residential windows", ASHRAE
Journal, 1965, 1.!, II, 81.
43. W. J. Grubbs, "Leaky prime v indovs", ASHRAE Journal, 1967,2" (1), 109·
44. J. B. Dick and D. A. Thomas, "Air infiltration through gaps around windows", JIHVE,
1953, ~, 85.
45. BS 4315: Part 1: 1968, "Methods of test for resistance to air and water penetration:
Windows and gasket glazing systems".
46. DD4: 1971, "Recommendations for the grading of windows. Resistance to wind loads, air
infiltration and water penetration and notes on window security". British Standards
Institution.
47. Private communication from Building Research Station, 1971.
48. Private communication, Princes Risborough Laboratory, 1972.
49. Private communication, Princes Risborough Laboratory, 1972.
50. T. C. Min, "Winter infiltration through swinging door entrances ll, ASHRAE Trans.,
1958, 64, 421.
- 62 -

- --------
51. BS 459: Part 3: 195 1, "Doors: fire check flush doors and wood and metal frames (half
hour and one hour types)".
52. BS 2655: Part 1: 1970, "Specification for lifts, escalators, passenger conveyors and
paternosters: general requirements for electric, hydraulic 'and hand-powered lifts".
Private communication, Princes Risborough Laboratory, 1972 •., .
54. F. C. Houghton and M. Ingels, "Infiltration through plastered and unplastered brick walls",
ASHVE Trans., 1927, 33, 377.
55. G. L. Larson, D. W. Nelson and C. Braatz, "Air infiltration through various types of
brick wall construction II , ASHVE Trans., 1929, li, 183 and 1930, 36, 99.
56. G. L. Larson, D. W. Nelson and C. Braatz. "Air infiltration through various types of
wood frame construction", ASHVE Trans .• 1930, 36, 397.
57. F. C. Houghton, C. Gutbeelet and C. A. Herbert. "Air leakage through various forms of
building construction", ASHVE Trans., 1931, TI. 177.
58. ASHRAE Handbook of Fundamentals, 1967, Ch. 25.
59. BS 848: Part 1: 1963, "Methods of testing rene".
60. c. P. Swain. D. L. Thornley and R. Wensley , liThe choice of air conditioning systems",
JIHVE, 1964, 32, 1.
61. Private communications from contractors.
62. A. Hasan, liThe occurrence of faults in he at i.ng and air conditioning equipment",
HVRA Lab. Report 68, 1972.
63. "United Kingdom fire and loss statistics 1968", Mi.n , Tech. and Fire Offices Committee,
,FRO, HMSO, 1970.
64 "Inland Revenue statistics. 1970 11, p , 190, HM30.
65. R. Baldwin, "The chance of an outbreak of fire and the likelihood of large fires in
various occupancies II • JFRO FR Note No. 745, 1969.
66. W. G. Ireson, "Re Li.ab i.Li ty handbook", cu.u , McGraw-Hill, 1966.
67. HVCA Specification for sheet metal ductwork, DW/121, low velocity low pressure air
systems.
68. HVCA Specification for sheet metal ductwork, DW/132, high velocity high pressure air
systems.
69. ASHRAE Guide and data book, Systems and equipment, 1967, Ch. 3.
70. A. A. Hae r-t.e r , "Flow distribution and pressure change along slotted a!' branched duc t a",
ASHRAE 'I'r-ans • , 1963, 22, 124.
71. R. E. Barrett and D. W. Locklin, "Computer analysis of stack effect in high-rise
buildings II, ASHRAE Trans., 1968, il, II, 155.
72. E. H". Shaw, "Heat and mass transfer by natural convection and combined natural convection
and forced air flow through large r-ec tengufar openings in a vertical partition", Heat
and Fluid Flow, 1972, £, No.2, 74-83.
73. Private communication, JFRO.
74. "The Building Regulations 1972, Part E, Structural fire ·precautions", Statutory
Instruments No. 317, HMSO.
75. "Commis s i on ing Code, Series A, Air distribution systems, high and low velocity" IHVE,
1971.
- 63 -

Plate 1 Temporary door installed in lobbydoor-way for air leakage tests
Plate 2 Fan unit used in air leakage tests

Plate 3 Apparatus for measuring pressure differentials
. 1111111. __.'.111111.111"""-:1
. .111......,•••:.,~ 1"".1 .... .
~~ .'=====.,111
II 1111.111101
Plate 4 Deacon House·

Plate 5 Dyson House
,
Plate 6 Basildon Hospital

F"IG.\ MECHF\N\CALLY VEtfTlLAIED 5MOKE -PROOFENCL05URE
PRe!tftUtE 0'05 u.l.~.
A60VI MC"\~~ {A.IC
"'N::M II f>TRAcT so I""""kf U''''''' II'.C?
ICORRiDoR I LoBBY
II
I PUnut.( 0 -11M. 'vir.- .I QQ.ow ST'-Ul.cA'~I
I
t SUPPLY~I
~ Lo&8YOOO~~

FIG. 2. MECHANISM OF STAC K. EFFECT
: h.J.II
I- - - +PoI
To, Co :r k,I
t
.. tA,
• '.I,
IiPt=k18 teo -et. )-- ~ --.,rI
Po +PRE~WP.E
L-----. .
, ,
(c ) AIR MOVEMENT FOR T > To
T, re :: ABSOLUTE 1EMPAND AlP. DENS \TY WITH IIJ
ENCL05URE
To I eo =ABSOLLJTE TEMPAND AIR DENS~IY OOTS\DE
ENCLOSURE
~R := k18 (fo - (c )
(b) PA.E~S~E c;.RADIENT INENCLOSURE WI1H RESPECT "TO
OlJT~\OE PRESCjlJRE Po

FIG.3 S,ACK EFFECT IN A BUILDING IN WJN1ER
I iJ ~ii)
'"~TAIF4. of\,liFT ",t\ ,tiJ=T
NEUTR,AI..- - PR£S<wP.£ - - - - - -
Pl4N£
+
PREssull..E
~) AIR NIOV[MENT PATTERN b) PRES~RE 4RADlENT5(DIA~~AJ'v\ATlc) WrTH RE~P£CT TOOUTS\DE. A\R PRESSURE PC' FOR(i) FLOOR SP~E~
(ij) VE.~T\CAL SHAFT

FIG. 4-- WIND PRE.SSURE COE.FFIC.IENTS CPo FORA TALL BUILDING;
/..-,
WlI'IO
~ \i ~ ,.,. ~0 0
I I I I-
/ 0"90-73. • 6 o."9-o-37~\
avg 0-6:l. .. 5 ovg-o-++ ..
\ 0."\3 0·7:1. .. 4- Gl/g-O'43
\•
ov9O-~ • 3 00i9 .1.0'3"1•\
QV9 0-57 • 2. Q."9-o-~
avg 0-&1 • 1 ~-O-l
/Cp = -055 FOR FM.e.-:.
?AR"LLE.L TO 'll/I~D

FIG.5.
BUILDING PLANS FoR COMPUTER ~TuDY
PLAN I
OFFlCES
..STNA
E ltnuTS
loMV coeAJ~
PL~N 2.
OfF'ce~
OFFiCES
COIUUOOR F
OFFICES

100 200 300
pP.lSoWRE' N/""(EXT£RNAL PReSSURE TAKEN AS 'ZERo)
wu"1X)W lEAK~t. '" 0·,1 tji. ~/,.,.lFoP.. l().) \0 lc.)
(a.)
'NINO l.Dr1s
lb)'NI""U~
STAC.K EffEcT t----...ol(A.1- 31·C)
LfV£L b
5
3
1
~,. ."
~\\oU. r+. \
.w~I". I
It'. I
f'i'I
o
" .............
..... -.. ,
...1....PW~)
I'I
//
II.\
- STJ'I~~
_._. "CCO ..... O.AT/ON
- -- LIFT
~'T~I~C.A"1E' -100 0 roo 2.00 bo
(c) €:I
~!I <.~) fI\J1~
I "'5~ VEWT . I1\1 \..fVE~ 1 5 I,'
I
4- .It'I,'
3 I
2"
'II .
" 1 \.
-10l? 0 100 100 '&00

FIG. b.
WlNOOW L.EAKI\CtE 0·01'1 'Is.~lfOQ. Uf) ToIf)-
LfWl &
/j,.~ ;1~ ,I '«e.~~uRlsrO 'SHAM"
I-, !/I,
I e;,TAIR~
l ACCOt'loD""HOH
j LIFT.,t /1
LIFT 0 100 100 300~"'AFT PRE$~Up.e N,lm1
(~TERN"L PR.E&~URE TAKEN A';. ZERo)
(e) b'\S c.d) I\l6 //I\C£.ot'\OWl1MJN "surp\..'1 1 At S /1
+ 1/I.
1/3 I-
.1//', I
. ../' I,-- /_.-&iAIR'-A~e 0 100 100
(f)lIc.~ Cd) !'..us I /
IAtCo~O~lION //SVPP\..'1 ~ "tltt~ ~f.Ul.ltl~otol //
I
I /I .
3 ,'/I
,'fI
j...-- I UtlolPRB-:'VRI~ED StlAf"T-- I_._'
0 roo 100
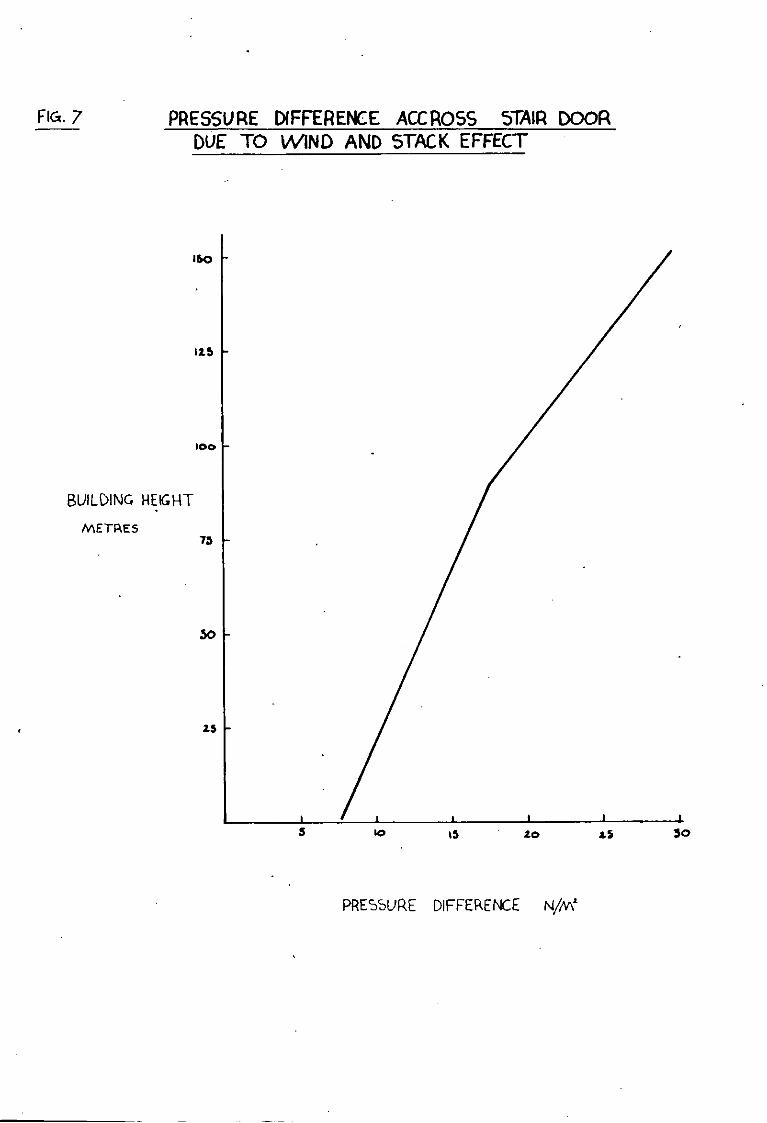
FI~. 7 PRESSURE DIFFERENCE ACCROSS 5TAIR DOORDUE TO WIND AND STACK EFFECT
BUILDING HEIGHT
METRES
PRESSURE DIFFERENCE N/M'
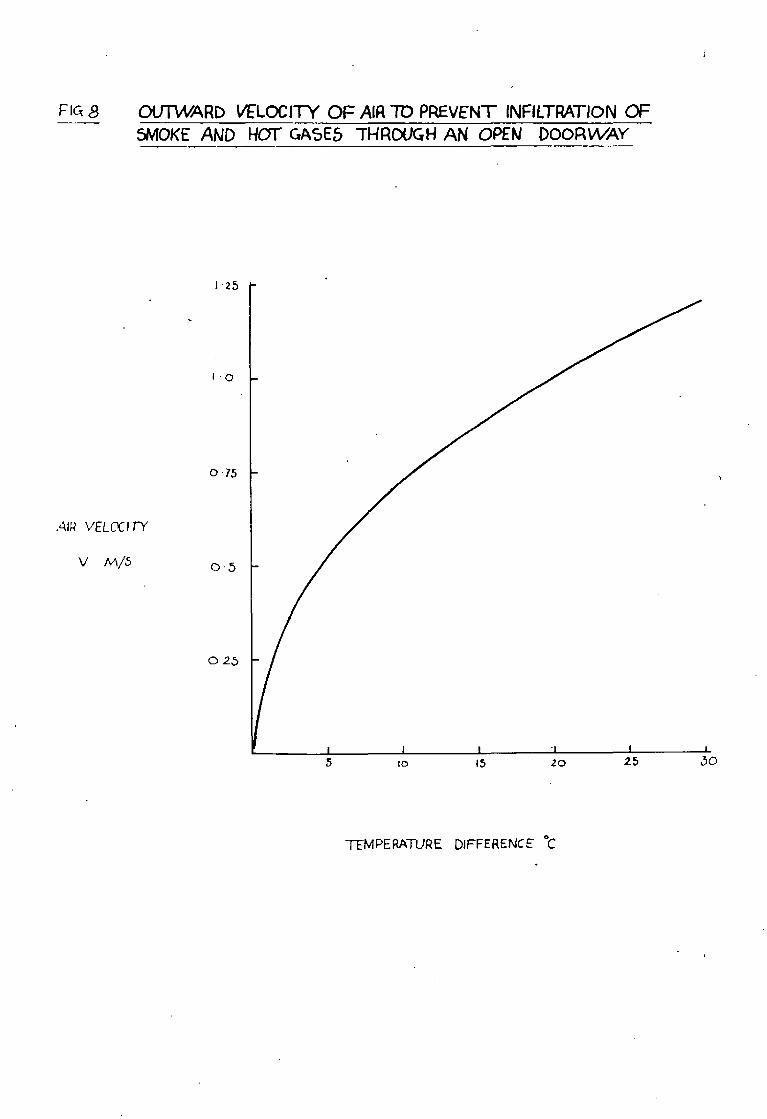
FIe; 8 OlfTWARD VELOCITY OF AIR 10 PREVENT INFILTRATION OFSMOKE AND HOT GA~E5 THROUGH AN OPEN DOORWAY
1·0
0·75
AIR VELOCrn'
V M/5 0.5
02~
TfMPERAWRE DIFFERENCE "c

PLANT I-ROOM
,... ~•
•~ ~
•~ ~
•~ ~
.-
I
'" ••
• -T
~ ~
I
~ ~
-T
~ ~
I- ~T
PLAN. I- PlANT I-ROOM f\ooM
FIUr.~ METHODS OF VERTICAL DISTRIBUTION OF PRE5SURISATION AIR IN MULTISTORY BUILDINGS '
SINGLE PLANT AND DUCT DJAl PLf\NT5 A.ND DUC1S INDIVIDUAL PLJW15AND DUCTS
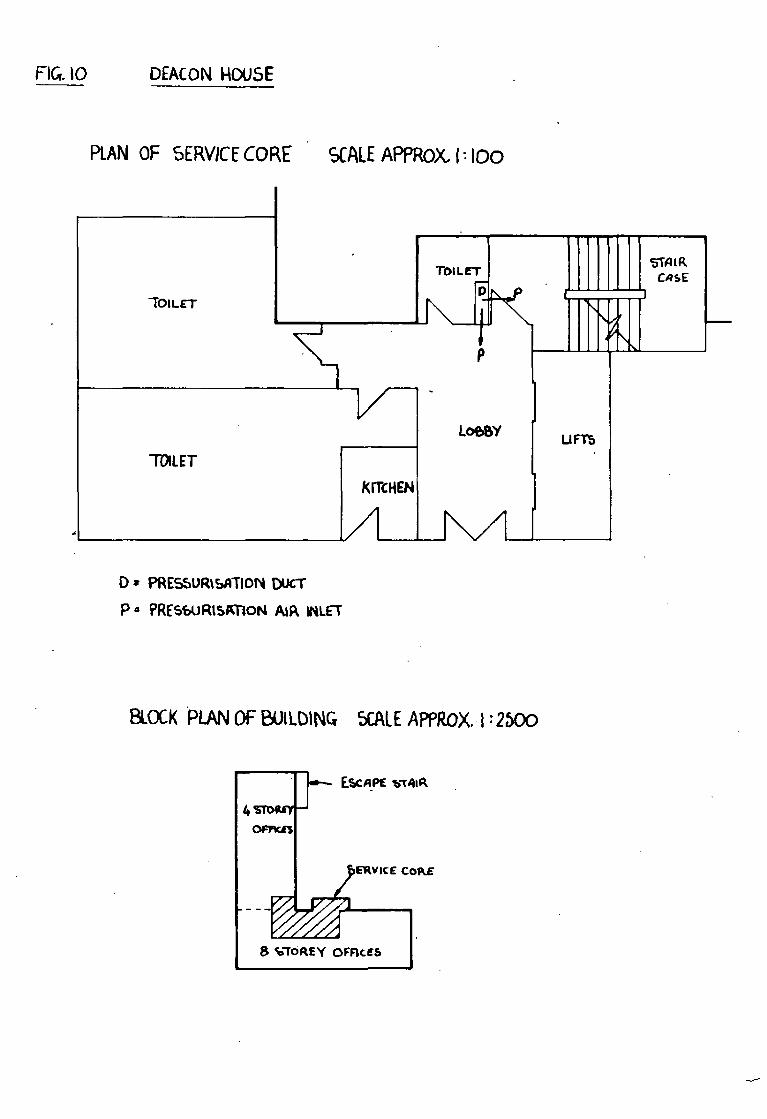
FIG.lO DEACON HOUSE
PiAN OF SERVICE CORE
1'01 lET
TOtlET
SCALE APPROX. t:100
p
lOftBy urn
stAIR.CA~E
D· PRE~UR\~i'ONOUCT
P a PR[~WR'5ImON AiR INLET
&'OCK 'PlAN OF OOILD'NG SCALE A?PRoX. I:2:>00
E'RVICE coRE
8 'O"TOAEY OFAc.n

F\&.l\ DYSON HOU5E
PLAN OF SERVICE CORE ~Al.E APPRoX. l :'00
LIFBLOBBY
R
o
D=PRE55lJRl5AT\ ON DlXT
p : PRE~~UR\5A110N AIR INLET
BLocK PlAN OF 8U~LOING
OfFici!.
SCALE APPROX. l 2500
E&cAPE &TA1P.&
lOFF1C"

FI~. 12. Bl\SILOON HOSPITAL
PLAN OF 5fRVJC£ CORE ~AL£ APPROX. I :100
~iRIACASE
" / ~H
:h~ 1i
/ L06&Y NTOILET
r1/l liFT
u-, LIFT
r---
TOILET
B
o= PRE~SUR\~AT\ON DUCTp: P\U:~SURlSATION A\R INLET
BLOCK PL1\N OF BUILDING SCALE APPP-oX. ,; \250
COERVICE' coilE
OfFICE~


![[Pressurisation] d22011l Tutkintaselostus](https://static.fdocuments.net/doc/165x107/577c7ac11a28abe0549625ac/pressurisation-d22011l-tutkintaselostus.jpg)