
FIRE RESCUE DEPARTMENT SUMMARY MISSION …
34
FIRE RESCUE DEPARTMENT SUMMARY MISSION STATEMENT: To meet and exceed the needs of the community through the highest level of emergency response and prevention services. PROGRAMS AND SERVICES: ACCOMPLISHMENTS, INITIATIVES, TRENDS AND ISSUES AND SERVICE LEVEL IMPACTS: Fire Operations: • Fire suppression, hazardous materials mitigation, technical rescue, advanced life support first responder medical Accomplishments: • Capital replacement for fire engines at Stations 43 and 80 • Purchased life safety “bail out” kits replacement, this is the first year of three • Continuation of the cancer particulate firefighting hoods for firefighting personnel • Expected to update two interlocal agreements by end of fiscal year Initiatives: • On scene gross decontamination procedures to reduce the risk of carcinogen absorption Trends and Issues: • Firefighter Health and Wellness, Fire and Emergency Medical Services (E M S) suicide rates now surpass the number of line of duty death overall in the nation, we must begin a proactive approach to the physical and mental wellbeing of our personnel • Firefighting attrition and associated cost continue to be an issue • Extrication tools continue to age and are becoming more difficult to get services with some units being nearly 30 years old, replacement electric tool remain in unfunded • Continue to be challenged by budgetary constraints as expenses outpace revenue Service Level Impacts: Reserve funds balances are less than established standard (10% of operating or two-month expenses). Emergency Medical Services: • County wide Advanced life-support and ambulance transport Accomplishments: • Continued success from Resuscitation Academy • Coordinated with multiple educational institutions for clinical student ride along/preceptors • Implemented Code Stat 11 as part of E M S Total Quality Management program
Transcript of FIRE RESCUE DEPARTMENT SUMMARY MISSION …

FIRE RESCUE DEPARTMENT SUMMARY
MISSION STATEMENT:
To meet and exceed the needs of the community through the highest level of emergency response and prevention services.
PROGRAMS AND SERVICES:
ACCOMPLISHMENTS, INITIATIVES, TRENDS AND ISSUES AND SERVICE LEVEL IMPACTS:
Fire Operations:
• Fire suppression, hazardous materials mitigation, technical rescue, advanced life support first responder medical
Accomplishments:
• Capital replacement for fire engines at Stations 43 and 80 • Purchased life safety “bail out” kits replacement, this is the first year of three • Continuation of the cancer particulate firefighting hoods for firefighting personnel • Expected to update two interlocal agreements by end of fiscal year
Initiatives:
• On scene gross decontamination procedures to reduce the risk of carcinogen absorption
Trends and Issues:
• Firefighter Health and Wellness, Fire and Emergency Medical Services (E M S) suicide rates now surpass the number of line of duty death overall in the nation, we must begin a proactive approach to the physical and mental wellbeing of our personnel
• Firefighting attrition and associated cost continue to be an issue • Extrication tools continue to age and are becoming more difficult to get services with some
units being nearly 30 years old, replacement electric tool remain in unfunded • Continue to be challenged by budgetary constraints as expenses outpace revenue
Service Level Impacts:
Reserve funds balances are less than established standard (10% of operating or two-month expenses).
Emergency Medical Services:
• County wide Advanced life-support and ambulance transport
Accomplishments:
• Continued success from Resuscitation Academy • Coordinated with multiple educational institutions for clinical student ride along/preceptors • Implemented Code Stat 11 as part of E M S Total Quality Management program

• The Firehouse Subs (M C I Kits) and the Heroes Grant (received 2200 vial of Narcan) saved the department $100,000
• Adjusted Stroke Protocol to meet the needs of the regional E M S system • Implemented the following E M S equipment in protocol: Bougies, Air Traq, and Autovents • Performed 3,292 Quality Assurance Reviews • Provided E M S Coverage for 26 special events and three area schools for sporting events • Processed more than 600 subpoenas annually
Initiatives:
• Worked with Health First to modify and improve the current Nurse ride along program which provides local hospital nurses opportunity to observe the medical care rendered in the prehospital setting
• Working with County Information Technology Department on upgrading the Fire Rescue website page to make it both A D A compliant and Search Engine Optimized
• Community Congestive Heart Failure committee with the Space Coast Health Foundation Group • Multiple Health Fair’s for Board of County Commissioners and local agencies • Critical Incident Stress Management Awareness First Responders & Mental Health
Subcommittee • Hands Only C P R for County Government and Local Community organizations • Vial of Life presentation for multiple organizations and homeowners’ associations • Worked with the Florida Department of Health to assist with Hepatitis A shots to the homeless • Implemented a new cardiac arrest tone to assist crews on identifying when CPR was being
performed prior to arrival • Initiated a Lean Six Sigma Cardiac Arrest Improvement project
Trends and Issues:
• COVID-19 pandemic continues to challenge daily operations • Recruitment of paramedic certified firefighters continues to be challenging, high demand and
competitive wages within the state have reduced significantly the number of paramedic certified candidates in the hiring pool
• Single certified employees are noted to have attrition rate of twice the rate of dual certified employees
• Increased E M S call volume in the south county area is an ongoing challenge for the E M S service delivery, the department will work to find budgetary resources to address high call volume through the potential permanent implementation of an additional ambulance
Service Level Impacts:
E M S call volume in the south has increased significantly; emergency medical patients may experience delays in response times and strain E M S service delivery. Increased call volume translates into greater workload for Paramedics and Emergency Medical Technicians which could result in employee

“burnout.” Staff is working toward solutions to alleviate per unit call volume by developing an additional ambulance.
The Department continues to be aggressive in bolstering the number of paramedic certified personnel in light of very competitive job market. Focused approach includes paramedic education opportunity for current employees as well as targeted hiring of both firefighter-paramedics and non-fire certified paramedics.
Fire Prevention:
• Fire safety inspections, plans review, public education and fire investigation
Accomplishments:
• Conducted 7,600 annual and complaint type fire inspections, over 2,000 new construction inspections and 2,900 plans review
• Performed 67 fire scene investigations to determine the origin and cause • Facilitated with 178 Public education events, providing fire safety education to over 22,000
citizens
Initiatives:
• Continued with the ongoing distribution and/or installation of over 700 smoke alarms to the residents in F Y 18-19, completing the FEMA fire safety grant
• Changed the methodology on how we are conducting the annual fire inspections instead of an occupancy-based inspection to a geographically based, thus reducing travel and inspector time
Trends and Issues:
• Uptick in the economy is resulting in a correlating rise in new construction, specifically commercial
• Due to retirements we had to replace and train 20% of our inspection staff
Service Level Impacts:
Not Applicable
Emergency 9 1 1 (E 9 1 1) Dispatch Services:
• Intake of E 9 1 1 calls and effective and efficient dispatching of emergency response units
Accomplishments:
• Training- continue to train new hires with 100% pass rate of state mandated certification • Updated Continuity of Operation Plan • Deployed Rapid Response questioning for non-responsive/non-breathing patients • Acquired New World CAD to replace existing CAD, go live set for June 2020 • Upgraded Advance Quality Assurance Emergency Medical Dispatch/Emergency Fire Dispatch
Quality Assurance software with current Paramount version

• Malabar Fire Department now Zetron paging no longer using the old dial up system • Implemented Memo of Understanding to new hires of two (2) year commitment in dispatch or
repay tuition and registration fees
Initiatives:
• Provide CAD programming capability that will allow Automatic Vehicle Location recommendations to take advantage of the time savings and closest unit response (should be consistent with the new CAD go-live)
• Integrated Mobile Data Terminal user response into dispatch to provide decreased radio traffic and increased dispatch productivity (should be consistent with the new CAD go-live)
• Fire Professional Question and Answer implementation • Monthly Quality Assurance call review by Training Coordinator
Trends and Issues:
• COVID-19 has slowed release of employees from orientation due to State offices not being able to process certifications
• Unable to obtain job required training classes for new dispatchers due to social distancing
Service Level Impacts:
Not Applicable
Ocean Rescue:
• Provide protective life-safety services to area beaches for our residents and visitors
Accomplishments:
• Ocean Rescue implemented its accelerated training program during the summer to offset/address high turn over within the seasonal lifeguard workforce, the program’s success has been incorporated into the annual training schedule so more lifeguards are available during the peak beach-goer demand times, such as Spring Break and Memorial Day
• Established another seasonal lifeguard tower at Tulip Lane, Cocoa Beach to combat multiple near drownings and promote beach safety
• Ocean Rescue Services resulted in zero drowning fatalities in lifeguard protected areas (100 yards North and South of tower) during normal operational hours
• Executed four contracts with City partners to provide seasonal coverage
Initiatives:
• Ocean Rescue has created a continuous recruitment program to allow flexible tryouts dates and a larger recruitment base
• Worked closely with the schools and other non-profit organizations educating students on ocean safety, sun protection and beach safety
• NOAA and National Weather Service joint collaboration on ocean conditions and warning flags

Trends and Issues:
• Difficulty in seasonal employment retention • Schools are focused on extracurricular activities that do not allow much time for outside
employment reducing our pool of target candidates • Temporary Beach closures statewide increased beach goers in service areas, during spring
break increased rescues and assists above the season long whole number were documented
Service Level Impacts:
Not Applicable
Support Services (Supply, Fleet, Facilities):
• Provide support services and assist the entire Fire Rescue department for optimal efficiency and productivity
Accomplishments:
• Sent out to R F P for the E M S bunker gear purchase to establish standardization of E M S gear • Purchased and processed replacement stretchers for E M S units • Established service contract for E M S ventilators • Streamlined new vehicle processing for quicker delivery to the field • Four new ambulances purchased and delivered • Two rescues rebuilt and delivered to the field • Two new engines delivered to the field E43 and E80 • Started building replacement for Stations 67 and 88 • Moderate station repairs 23, 24, 26, 29, 40, 41, 42, 65, 81, 83 • Major station repairs/ remodeled 41, 42 and 63 • New General Repair Technician vehicle purchased • Replaced generator at Station 44 • Established maintenance contract for generators
Initiatives:
• Put in place a 3-year plan to replace all mattresses and bed frames to extra-large beds • Hired a new Special Projects Coordinator for iMaint administration, inventory control and
invoice processing as we transition away from NAPA • Hired additional General Repair Technician for in house facilities maintenance • Station 43 and 80, all new exterior lighting crew security • Added new central control thermostats to central area in a pilot program attempting to control
temperature variances that contribute to mold

Trends and Issues:
• Fleet maintenance costs and related down time continue to increase due to the age and mileage of both Fire and Emergency Medical Services vehicles, the Department is actively working to improve its emergency vehicle fleet through capital replacement
• Aging facilities continue to remain vulnerable to costly on-going repairs • Non-improved facilities continue to fiscally challenge the department • Non-hardened facilities continue to Operationally challenge the department during storm
events
Service Level Impacts:
Not Applicable

FIRE RESCUE DEPARTMENT: SUMMARY
Fire Rescue Department Revenue & Expense Category
Actual F Y 2018-
2019
Final Budget F Y 2019-2020
Adopted Budget
F Y 2020-2021 Difference %
Change
Taxes Revenue $11,660,104 $12,611,603 $13,159,709 $548,106 4.35%
Permits, Fees & Special Assessment Revenue $23,350,955 $24,813,622 $26,103,122 $1,289,500 5.20%
Intergovernmental Revenue $299,162 $658,218 $177,830 -$480,388 -72.98%
Charges for Services Revenue $18,559,271 $20,006,937 $18,618,186 -
$1,388,751 -6.94%
Fines and Forfeits Revenue $0 $0 $0 $0 0.00%
Miscellaneous Revenue $643,148 $362,368 $927,352 $564,984 155.91%
Statutory Reduction $0 -$2,922,638 -$2,949,195 -$26,557 0.91%
Total Operating Revenues $54,512,640 $55,530,110 $56,037,004 $506,894 0.91%
Balance Forward Revenue $5,199,472 $3,945,870 $4,429,951 $484,081 12.27%
Transfers - General Revenue $10,235,753 $11,237,093 $11,070,489 -$166,604 -1.48%
Transfers - Other Revenue $86,052 $104,214 $82,751 -$21,463 -20.60%
Other Finance Source Revenue $0 $0 $0 $0 0.00%
Total Non-Operating Revenues $15,521,277 $15,287,177 $15,583,191 $296,014 1.94%
TOTAL REVENUES $70,033,917 $70,817,287 $71,620,195 $802,908 1.13%
Compensation and Benefits Expense $51,426,513 $51,231,091 $52,709,760 $1,478,669 2.89%
Operating Expense $11,185,113 $11,715,157 $12,354,789 $639,632 5.46%
Capital Outlay Expense $2,675,350 $4,636,879 $2,590,413 -
$2,046,466 -44.13%
Operating Expenditures $65,286,976 $67,583,127 $67,654,962 $71,835 0.11%
C I P Expense $0 $1,087,273 $1,333,684 $246,411 22.66%
Debt Service Expense $0 $107,855 $0 -$107,855 -
100.00%
Reserves-Operating Expense $0 $0 $0 $0 0.00%
Reserves - Capital Expense $0 $0 $542,500 $542,500 0.00%
Reserves - Restricted Expense $0 $1,164,335 $1,164,335 $0 0.00%
Grants and Aid Expense $13,000 $33,050 $33,000 -$50 -0.15%

Fire Rescue Department Revenue & Expense Category
Actual F Y 2018-
2019
Final Budget F Y 2019-2020
Adopted Budget
F Y 2020-2021 Difference %
Change
Transfers Expense $788,070 $841,647 $891,714 $50,067 5.95%
Total Non-Operating Expenses $801,070 $3,234,160 $3,965,233 $731,073 22.60%
TOTAL EXPENDITURES $66,088,045 $70,817,287 $71,620,195 $802,908 1.13%

FIRE RESCUE DEPARTMENT: FIRE RESCUE OPERATIONS
Fire Rescue Operations Program Revenue & Expense Category
Actual F Y 2018-
2019
Final Budget F Y 2019-
2020
Adopted Budget
F Y 2020-2021
Difference % Change
Taxes Revenue $11,660,104 $12,611,603 $13,159,709 $548,106 4.35%
Permits, Fees & Special Assessments Revenue $23,350,955 $24,813,622 $26,103,122 $1,289,500 5.20%
Intergovernmental Revenue $182,327 $84,456 $80,231 -$4,225 -5.00%
Charges for Services Revenue $6,508 $17,000 $11,650 -$5,350 -31.47%
Fines and Forfeits Revenue $0 $0 $0 $0 0.00%
Miscellaneous Revenue $462,102 $173,168 $203,460 $30,292 17.49%
Statutory Reduction $0 -$1,884,992 -$1,977,909 -$92,917 4.93%
Total Operating Revenues $35,661,994 $35,814,857 $37,580,263 $1,765,406 4.93%
Balance Forward Revenue $4,946,157 $2,870,177 $2,344,690 -$525,487 -18.31%
Transfers - General Revenue $0 $0 $0 $0 0.00%
Transfers - Other Revenue -$1,143,891 -$1,219,527 -$1,276,571 -$57,044 4.68%
Other Finance Source Revenue $0 $0 $0 $0 0.00%
Non-Operating Revenues $3,802,266 $1,650,650 $1,068,119 -$582,531 -35.29%
TOTAL REVENUES $39,464,260 $37,465,507 $38,648,382 $1,182,875 3.16%
Compensation and Benefits Expense $28,704,525 $26,982,657 $27,931,497 $948,840 3.52%
Operating Expense $5,459,147 $5,861,327 $6,160,917 $299,590 5.11%
Capital Outlay Expense $1,582,936 $2,111,563 $1,362,714 -$748,849 -35.46%
Operating Expenses $35,746,608 $34,955,547 $35,455,128 $499,581 1.43%
C I P Expense $0 $459,273 $600,000 $140,727 30.64%
Debt Service Expense $0 $50,000 $0 -$50,000 -100.00%
Reserves-Operating Expense $0 $0 $0 $0 0.00%
Reserves - Capital Expense $0 $0 $542,500 $542,500 0.00%
Reserves - Restricted Expense $0 $1,164,335 $1,164,335 $0 0.00%
Grants and Aid Expense $0 $0 $0 $0 0.00%
Transfers Expense $782,775 $836,352 $886,419 $50,067 5.99%

Fire Rescue Operations Program Revenue & Expense Category
Actual F Y 2018-
2019
Final Budget F Y 2019-
2020
Adopted Budget
F Y 2020-2021
Difference % Change
Non-Operating Expenses $782,775 $2,509,960 $3,193,254 $683,294 27.22%
TOTAL EXPENSES $36,529,382 $37,465,507 $38,648,382 $1,182,875 3.16%
FIRE RESCUE OPERATIONS: BUDGET VARIANCES
Fire Rescue Operations Program Revenue and Expense Category Variance %
Variance Explanation
Taxes Revenue $548,106 4.35% Projected increase in property valuations and new construction
Permits, Fees & Special Assessments Revenue $1,289,500 5.20%
Fire Assessment rates adjusted to change in Consumer Price Index and new constructions and parcels added to fire assessment
Intergovernmental Revenue -$4,225 -5.00% Projected decrease in eligibility Firefighter Supplemental Compensation
Charges for Services Revenue -$5,350 -31.47% Decrease in projected revenue from fee based training courses
Fines and Forfeits Revenue $0 0.00%
Miscellaneous Revenue $30,292 17.49% Increase projection on interest earned
Statutory Reduction -$92,917 4.93% Corresponds to change in Operating Revenue
Balance Forward Revenue -$525,487 -18.31%
The decrease in Balance Forward projections are attributed to the consumption of Fire Assessment Reserves
Transfers - General Revenue $0 0.00%
Transfers - Other Revenue -$57,044 4.68%
Transfers to Fire Prevention for projected losses related to Fire Prevention fees and lack of new construction due to COVID-19
Other Finance Source Revenue $0 0.00%

Fire Rescue Operations Program Revenue and Expense Category Variance %
Variance Explanation
Compensation and Benefits Expense $948,840 3.52%
Attributable to increase Cost of Living Adjustments to non-bargaining employees, funding annual and sick leave pay, and the negotiated step plan increases defined by the collective bargaining agreement
Operating Expense $299,590 5.11% Attributable to increases in the internal support fund and the purchase of bail out kits
Capital Outlay Expense -$748,849 -35.46%
Attributable to the fire training facility being reclassified from Capital Outlay to Capital Improvement Plan, maintains the purchase of 2 fire engines and 1 District Chief vehicle
Grants and Aid Expense $0 0.00%
C I P Expense $140,727 30.64%
Attributable to the purchase of the live fire training facility (burn building), moved from Capital Outlay
Debt Service Expense -$50,000 -100.00% Mobile Data Terminal lease agreement fulfilled
Reserves-Operating Expense $0 0.00%
Reserves - Capital Expense $542,500 0.00%
Reserves - Restricted Expense $0 0.00%
Transfers Expense $50,067 5.99% Attributed to internal support transfers
FIRE RESCUE DEPARTMENT: EMERGENCY MEDICAL SERVICES
Emergency Medical Services Program Revenue & Expense Category
Actual F Y 2018-
2019
Final Budget
F Y 2019-2020
Adopted Budget
F Y 2020-2021 Difference %
Change
Taxes Revenue $0 $0 $0 $0 0.00%
Permits, Fees & Special Assessments Revenue $0 $0 $0 $0 0.00%

Emergency Medical Services Program Revenue & Expense Category
Actual F Y 2018-
2019
Final Budget
F Y 2019-2020
Adopted Budget
F Y 2020-2021 Difference %
Change
Intergovernmental Revenue $116,386 $573,162 $96,999 -$476,163 -83.08%
Charges for Services Revenue $17,716,586 $18,957,066 $17,623,024 -
$1,334,042 -7.04%
Fines and Forfeits Revenue $0 $0 $0 $0 0.00%
Miscellaneous Revenue $163,019 $184,200 $714,100 $529,900 287.68%
Statutory Reduction $0 -$985,722 -$921,591 $64,131 -6.51%
Total Operating Revenues $17,995,991 $18,728,706 $17,512,532 -$1,216,174 -6.49%
Balance Forward Revenue $57,836 $952,130 $2,085,261 $1,133,131 119.01%
Transfers - General Revenue $8,697,815 $9,377,654 $9,249,652 -$128,002 -1.36%
Transfers - Other Revenue -$1,484,123 -$1,501,798 -$1,419,521 $82,277 -5.48%
Other Finance Source Revenue $0 $0 $0 $0 0.00%
Non-Operating Revenues $7,271,528 $8,827,986 $9,915,392 $1,087,406 12.32%
TOTAL REVENUES $25,267,519 $27,556,692 $27,427,924 -$128,768 -0.47%
Compensation and Benefits Expense $18,557,752 $19,812,661 $20,214,569 $401,908 2.03%
Operating Expense $4,950,687 $4,618,715 $5,363,205 $744,490 16.12%
Capital Outlay Expense $1,003,653 $2,406,411 $1,083,466 -
$1,322,945 -54.98%
Operating Expenses $24,512,091 $26,837,787 $26,661,240 -$176,547 -0.66%
C I P Expense $0 $628,000 $733,684 $105,684 16.83%
Debt Service Expense $0 $57,855 $0 -$57,855 -100.00%
Reserves-Operating Expense $0 $0 $0 $0 0.00%
Reserves - Capital Expense $0 $0 $0 $0 0.00%
Reserves - Restricted Expense $0 $0 $0 $0 0.00%
Grants and Aid Expense $13,000 $33,050 $33,000 -$50 -0.15%
Transfers Expense $0 $0 $0 $0 0.00%
Non-Operating Expenses $13,000 $718,905 $766,684 $47,779 6.65%
TOTAL EXPENSES $24,525,091 $27,556,692 $27,427,924 -$128,768 -0.47%

EMERGENCY MEDICAL SERVICES: BUDGET VARIANCES
Emergency Medical Services Program Revenue and Expense Category
Variance % Variance Explanation
Taxes Revenue $0 0.00%
Permits, Fees & Special Assessments Revenue $0 0.00%
Intergovernmental Revenue -$476,163 -83.08%
Attributable to the one time award of Health and Human Services Public and Social Services Emergency fund grant to respond to the public health emergency caused by COVID-19
Charges for Services Revenue -
$1,334,042
-7.04%
Due to projections for ambulance billing revenue, decreased number of transports and Health and Human Services billing requirements related to COVID-19
Fines and Forfeits Revenue $0 0.00%
Miscellaneous Revenue $529,900 287.68% Projected increase to Public Emergency Medical Transport is based on actuals from fiscal year 2020
Statutory Reduction $64,131 -6.51% Corresponds to the change in Operating Revenue
Balance Forward Revenue $1,133,131 119.01%
Increase due to anticipated funds from Managed Care Organization funds due prior to F Y 2020 close and revenues from Health and Human Services Relief Funds
Transfers - General Revenue -$128,002 -1.36% General Funds increased for Fiscal Year 2021, offset by one time critical needs funding allocated in F Y 2020
Transfers - Other Revenue $82,277 -5.48% Attributable to the cost allocation for Dispatch for the New World Computer-Aided Dispatch
Other Finance Source Revenue $0 0.00%
Compensation and Benefits Expense $401,908 2.03%
Attributable to increase of Cost of Living Adjustment, increase to the Firefighter Supplemental Compensation eligibility and increase to projected overtime expenses

Emergency Medical Services Program Revenue and Expense Category
Variance % Variance Explanation
Operating Expense $744,490 16.12% Attributable to the purchase of stretchers rather than the anticipated lease purchase agreement in the prior year
Capital Outlay Expense -
$1,322,945
-54.98%
Attributable to the purchase of stretchers in prior year, maintains the purchase of two ambulances and replacement of Patient Care Report laptops
Grants and Aid Expense -$50 -0.15% Adjustment based on actual award amounts for the Emergency Medical Services Trust Grant
C I P Expense $105,684 16.83% Attributable to the projected completion of Station 67 in prior year
Debt Service Expense -$57,855 -100.00% Attributable to the end of the Rocket Lease agreement and the termination of E P C R computer capital lease
Reserves-Operating Expense $0 0.00%
Reserves - Capital Expense $0 0.00%
Reserves - Restricted Expense $0 0.00%
Transfers Expense $0 0.00%
FIRE RESCUE DEPARTMENT: DISPATCH
Dispatch Program Revenue & Expense Category
Actual F Y 2018-
2019
Final Budget
F Y 2019-2020
Adopted Budget
F Y 2020-2021
Difference % Change
Taxes Revenue $0 $0 $0 $0 0.00%
Permits, Fees & Special Assessments Revenue $0 $0 $0 $0 0.00%
Intergovernmental Revenue $0 $0 $0 $0 0.00%
Charges for Services Revenue $9,500 $9,500 $9,500 $0 0.00%
Fines and Forfeits Revenue $0 $0 $0 $0 0.00%
Miscellaneous Revenue $2,385 $1,000 $2,714 $1,714 171.40%
Statutory Reduction $0 -$525 -$611 -$86 16.38%
Total Operating Revenues $11,885 $9,975 $11,603 $1,628 16.32%

Dispatch Program Revenue & Expense Category
Actual F Y 2018-
2019
Final Budget
F Y 2019-2020
Adopted Budget
F Y 2020-2021
Difference % Change
Balance Forward Revenue $0 $123,563 $0 -$123,563 -100.00%
Transfers - General Revenue $9,700 $8,364 $9,763 $1,399 16.73%
Transfers - Other Revenue $2,316,023 $2,467,741 $2,362,541 -$105,200 -4.26%
Other Finance Source Revenue $0 $0 $0 $0 0.00%
Non-Operating Revenues $2,325,723 $2,599,668 $2,372,304 -$227,364 -8.75%
TOTAL REVENUES $2,337,608 $2,609,643 $2,383,907 -$225,736 -8.65%
Compensation and Benefits Expense $1,716,366 $1,765,083 $1,911,126 $146,043 8.27%
Operating Expense $479,313 $835,755 $464,048 -$371,707 -44.48%
Capital Outlay Expense $18,365 $8,805 $8,733 -$72 -0.82%
Operating Expenses $2,214,044 $2,609,643 $2,383,907 -$225,736 -8.65%
C I P Expense $0 $0 $0 $0 0.00%
Debt Service Expense $0 $0 $0 $0 0.00%
Reserves-Operating Expense $0 $0 $0 $0 0.00%
Reserves - Capital Expense $0 $0 $0 $0 0.00%
Reserves - Restricted Expense $0 $0 $0 $0 0.00%
Grants and Aid Expense $0 $0 $0 $0 0.00%
Transfers Expense $0 $0 $0 $0 0.00%
Non-Operating Expenses $0 $0 $0 $0 0.00%
TOTAL EXPENSES $2,214,044 $2,609,643 $2,383,907 -$225,736 -8.65%

DISPATCH: BUDGET VARIANCES
Dispatch Program Revenue and Expense Category Variance % Variance Explanation
Taxes Revenue $0 0.00%
Permits, Fees & Special Assessments Revenue $0 0.00%
Intergovernmental Revenue $0 0.00%
Charges for Services Revenue $0 0.00%
Fines and Forfeits Revenue $0 0.00%
Miscellaneous Revenue $1,714 171.40% Increase attributable to interest revenue
Statutory Reduction -$86 16.38% Corresponds to change in Operating Revenue
Balance Forward Revenue -$123,563 -100.00%
Balance Forward from prior year was from retained savings in order to fund a one-time critical need, the purchase of New World Computer-aided Dispatch software
Transfers - General Revenue $1,399 16.73%
Adjusted due to the workload for other departments (Traffic Engineering / Utilities) resulted in increase to General Fund transfer
Transfers - Other Revenue -$105,200 -4.26%
Decrease attributable to mid-year supplements dollars in prior year from the other Fire Rescue programs to fund New World Computer-aided dispatch
Other Finance Source Revenue $0 0.00%
Compensation and Benefits Expense $146,043 8.27%
Attributable to Cost of Living Adjustments, increased overtime, FRS rate increase, Union Contract step plan and longevity eligibility
Operating Expense -$371,707 -44.48%
New World Computer-aided dispatch project to be completed summer of 2020, discontinued Deccan and Tri-Tech maintenance agreements
Capital Outlay Expense -$72 -0.82% Attributable to the cost allocation of Support Capital Expenses

Dispatch Program Revenue and Expense Category Variance % Variance Explanation
Grants and Aid Expense $0 0.00%
C I P Expense $0 0.00%
Debt Service Expense $0 0.00%
Reserves-Operating Expense $0 0.00%
Reserves - Capital Expense $0 0.00%
Reserves - Restricted Expense $0 0.00%
Transfers Expense $0 0.00%

FIRE RESCUE DEPARTMENT: FIRE PREVENTION
Fire Prevention Program Revenue & Expense Category
Actual F Y 2018-
2019
Final Budget
F Y 2019-2020
Adopted Budget
F Y 2020-2021
Difference % Change
Taxes Revenue $0 $0 $0 $0 0.00%
Permits, Fees & Special Assessments Revenue $0 $0 $0 $0 0.00%
Intergovernmental Revenue $450 $600 $600 $0 0.00%
Charges for Services Revenue $695,306 $892,000 $837,000 -$55,000 -6.17%
Fines and Forfeits Revenue $0 $0 $0 $0 0.00%
Miscellaneous Revenue $50 $0 $0 $0 0.00%
Statutory Reduction $0 -$44,630 -$41,880 $2,750 -6.16%
Total Operating Revenues $695,806 $847,970 $795,720 -$52,250 -6.16%
Balance Forward Revenue $0 $0 $0 $0 0.00%
Transfers - General Revenue $0 $0 $0 $0 0.00%
Transfers - Other Revenue $398,043 $357,798 $416,302 $58,504 16.35%
Other Finance Source Revenue $0 $0 $0 $0 0.00%
Non-Operating Revenues $398,043 $357,798 $416,302 $58,504 16.35%
TOTAL REVENUES $1,093,849 $1,205,768 $1,212,022 $6,254 0.52%
Compensation and Benefits Expense $1,051,027 $1,062,236 $1,069,367 $7,131 0.67%
Operating Expense $102,227 $112,737 $137,360 $24,623 21.84%
Capital Outlay Expense $0 $25,500 $0 -$25,500 -100.00%
Operating Expenses $1,153,254 $1,200,473 $1,206,727 $6,254 0.52%
C I P Expense $0 $0 $0 $0 0.00%
Debt Service Expense $0 $0 $0 $0 0.00%
Reserves-Operating Expense $0 $0 $0 $0 0.00%
Reserves - Capital Expense $0 $0 $0 $0 0.00%
Reserves - Restricted Expense $0 $0 $0 $0 0.00%
Grants and Aid Expense $0 $0 $0 $0 0.00%
Transfers Expense $5,295 $5,295 $5,295 $0 0.00%

Fire Prevention Program Revenue & Expense Category
Actual F Y 2018-
2019
Final Budget
F Y 2019-2020
Adopted Budget
F Y 2020-2021
Difference % Change
Non-Operating Expenses $5,295 $5,295 $5,295 $0 0.00%
TOTAL EXPENSES $1,158,549 $1,205,768 $1,212,022 $6,254 0.52%

FIRE PREVENTION: BUDGET VARIANCES
Fire Prevention Program Revenue and Expense Category Variance %
Variance Explanation
Taxes Revenue $0 0.00%
Permits, Fees & Special Assessments Revenue $0 0.00%
Intergovernmental Revenue $0 0.00%
Charges for Services Revenue -$55,000 -6.17%
Reflects projected decrease in fee based services including projected decrease in new construction and inspections due to COVID-19
Fines and Forfeits Revenue $0 0.00%
Miscellaneous Revenue $0 0.00%
Statutory Reduction $2,750 -6.16% Corresponds to change in Operating Revenue
Balance Forward Revenue $0 0.00%
Transfers - General Revenue $0 0.00%
Transfers - Other Revenue $58,504 16.35% Increased Fire Assessment funds to cover the loss in Charges for Services revenue
Other Finance Source Revenue $0 0.00%
Compensation and Benefits Expense $7,131 0.67%
Attributable to the Cost of Living Adjustments, the collective bargaining agreement step increase, Florida Retirement System rate increase and firefighter supplemental compensation
Operating Expense $24,623 21.84%
Attributable to public education material, increase of cell phone stipend users, increase in fuel consumption and required travel for the Florida Fire Marshals Conference due to changing fire codes and laws
Capital Outlay Expense -$25,500 -100.00% Attributed to a deferment in the capital replacement plan
Grants and Aid Expense $0 0.00%

Fire Prevention Program Revenue and Expense Category Variance %
Variance Explanation
C I P Expense $0 0.00%
Debt Service Expense $0 0.00%
Reserves-Operating Expense $0 0.00%
Reserves - Capital Expense $0 0.00%
Reserves - Restricted Expense $0 0.00%
Transfers Expense $0 0.00%
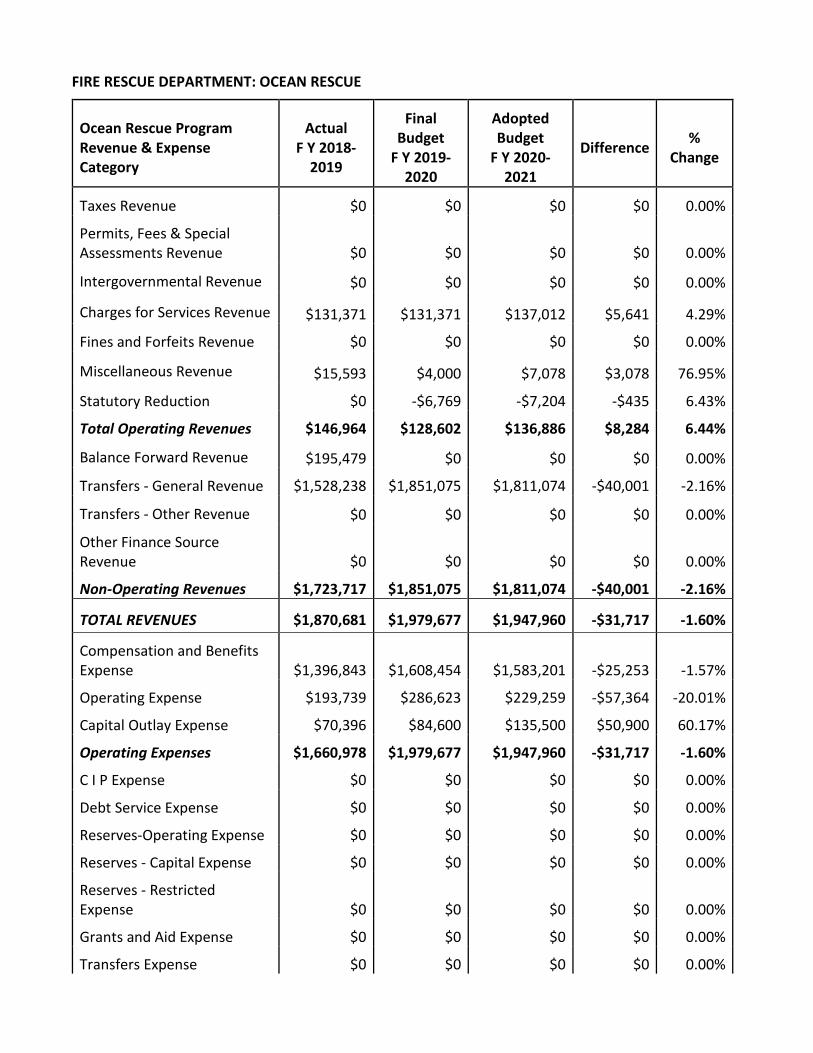
FIRE RESCUE DEPARTMENT: OCEAN RESCUE
Ocean Rescue Program Revenue & Expense Category
Actual F Y 2018-
2019
Final Budget
F Y 2019-2020
Adopted Budget
F Y 2020-2021
Difference % Change
Taxes Revenue $0 $0 $0 $0 0.00%
Permits, Fees & Special Assessments Revenue $0 $0 $0 $0 0.00%
Intergovernmental Revenue $0 $0 $0 $0 0.00%
Charges for Services Revenue $131,371 $131,371 $137,012 $5,641 4.29%
Fines and Forfeits Revenue $0 $0 $0 $0 0.00%
Miscellaneous Revenue $15,593 $4,000 $7,078 $3,078 76.95%
Statutory Reduction $0 -$6,769 -$7,204 -$435 6.43%
Total Operating Revenues $146,964 $128,602 $136,886 $8,284 6.44%
Balance Forward Revenue $195,479 $0 $0 $0 0.00%
Transfers - General Revenue $1,528,238 $1,851,075 $1,811,074 -$40,001 -2.16%
Transfers - Other Revenue $0 $0 $0 $0 0.00%
Other Finance Source Revenue $0 $0 $0 $0 0.00%
Non-Operating Revenues $1,723,717 $1,851,075 $1,811,074 -$40,001 -2.16%
TOTAL REVENUES $1,870,681 $1,979,677 $1,947,960 -$31,717 -1.60%
Compensation and Benefits Expense $1,396,843 $1,608,454 $1,583,201 -$25,253 -1.57%
Operating Expense $193,739 $286,623 $229,259 -$57,364 -20.01%
Capital Outlay Expense $70,396 $84,600 $135,500 $50,900 60.17%
Operating Expenses $1,660,978 $1,979,677 $1,947,960 -$31,717 -1.60%
C I P Expense $0 $0 $0 $0 0.00%
Debt Service Expense $0 $0 $0 $0 0.00%
Reserves-Operating Expense $0 $0 $0 $0 0.00%
Reserves - Capital Expense $0 $0 $0 $0 0.00%
Reserves - Restricted Expense $0 $0 $0 $0 0.00%
Grants and Aid Expense $0 $0 $0 $0 0.00%
Transfers Expense $0 $0 $0 $0 0.00%

Ocean Rescue Program Revenue & Expense Category
Actual F Y 2018-
2019
Final Budget
F Y 2019-2020
Adopted Budget
F Y 2020-2021
Difference % Change
Non-Operating Expenses $0 $0 $0 $0 0.00%
TOTAL EXPENSES $1,660,978 $1,979,677 $1,947,960 -$31,717 -1.60%
OCEAN RESCUE: BUDGET VARIANCES
Ocean Rescue Program Revenue and Expense Category Variance %
Variance Explanation
Taxes Revenue $0 0.00%
Permits, Fees & Special Assessments Revenue $0 0.00%
Intergovernmental Revenue $0 0.00%
Charges for Services Revenue $5,641 4.29% Attributable to new contractual rates established with municipalities
Fines and Forfeits Revenue $0 0.00%
Miscellaneous Revenue $3,078 76.95% Attributable to the projected number and scope of special events
Statutory Reduction -$435 6.43% Corresponds to change in Operating Revenue
Balance Forward Revenue $0 0.00%
Transfers - General Revenue -$40,001 -2.16%
Attributable to the critical need funding allocated at mid-year supplements to pay for additional lifeguards at Tulip Lane
Transfers - Other Revenue $0 0.00%
Other Finance Source Revenue $0 0.00%
Compensation and Benefits Expense -$25,253 -1.57% Adjusted based on prior year costs
Operating Expense -$57,364 -20.01%
Decrease attributable to reduced repair and maintenance expenses and operating supplies based on prior year expenditures
Capital Outlay Expense $50,900 60.17% Attributable to the replacement of a mobile Conex Storage Facility at Cherie Down
Grants and Aid Expense $0 0.00%

Ocean Rescue Program Revenue and Expense Category Variance %
Variance Explanation
C I P Expense $0 0.00%
Debt Service Expense $0 0.00%
Reserves-Operating Expense $0 0.00%
Reserves - Capital Expense $0 0.00%
Reserves - Restricted Expense $0 0.00%
Transfers Expense $0 0.00%

FIRE RESCUE DEPARTMENT PERFORMANCE MEASURES
PROGRAM OBJECTIVE MEASURE
ACTUAL F Y
2018-2019
ESTIMATED
F Y 2019-2020
PROJECTED
F Y 2020-2021
Fire Rescue Operations
Fulfill Workload Requirements
Calls with emergency response 80,601 81,404 85,000
Fire Rescue Operations
Fulfill Workload Requirements
Structure fires, wildland fires, and other fires
3,777 3,084 3,850
Fire Rescue Operations
Fulfill Workload Requirements Non-emergency calls 10,140 10,152 12,000
Fire Rescue Operations
Fulfill Workload Requirements
Emergency Medical Services and rescue calls
79,841 82,768 83,500
Fire Rescue Operations
Improve Effectiveness
Fire Suppression unit's response time is 4 minutes or less for a structure fire call (National Fire Protection Association-1710 Guideline)
53% 53% 53%
Fire Rescue Operations Develop Workforce Training hours
provided annually 127,000 135,000 135,000
Emergency Medical Services
Fulfill Workload Requirements
Emergency response calls (Excludes canceled calls)
83,741 86,253 88,765
Emergency Medical Services
Fulfill Workload Requirements E M S transports 52,765 54,348 55,930
Emergency Medical Services
Increase Customer Satisfaction
Customer surveys with a minimum overall score of 4 out of 5
82% 84% 86%
Emergency Medical Services
Improve Effectiveness
E M S personnel achieve spontaneous circulation when treating cardiac arrest patients
265 272 280

PROGRAM OBJECTIVE MEASURE
ACTUAL F Y
2018-2019
ESTIMATED
F Y 2019-2020
PROJECTED
F Y 2020-2021
Fire Prevention
Fulfill Workload Requirements
Annual fire and safety inspections 7,695 7,700 7,900
Fire Prevention
Fulfill Workload Requirements
New construction plans reviewed 2,900 2,800 2,800
Fire Prevention
Fulfill Workload Requirements
New construction inspections 2,058 2,100 2,200
Fire Prevention
Community Outreach
Fire Prevention and Public Education programs/events facilitated
178 165 175
Dispatch Fulfill Workload Requirements
Phone calls processed by Communication Center
177,929 183,266 188,763
Dispatch Fulfill Workload Requirements Units dispatched 173,646 178,855 184,220
Dispatch Improve Effectiveness
9 1 1 Emergency Calls answered within 20 seconds per NENA Call Answering Recommendation 56-005
99% 99% 99%
Dispatch Improve Effectiveness
Average ring time of all incoming calls in the Communication Center within 10 seconds
95% 96% 96%
Ocean Rescue
Safeguard Life, Safety, and Property; Maintaining Levels of Service
Patrons who visit a lifeguard protected beach
4,570,880 5,000,000 5,000,000
Ocean Rescue Improve Effectiveness Ocean/Water Rescues 512 600 600
Ocean Rescue Improve Effectiveness
Preventive contacts made to reduce rescues (warnings)
63,200 70,000 70,000

FIRE RESCUE DEPARTMENT FISCAL YEAR 2020-2021 TRAVEL A&B SUMMARY
Program Name Description Position Destination Funding Source
Total Cost
Dispatch
Emergency Medical Dispatch & Emergency Fire Dispatch Certification
Dispatchers Local, FL
User Fees, General
Fund, Fire
Assessment
$9,600
Emergency Medical Services
Florida State Emergency Medical Service
Asst. Chief T B D User Fees,
General Fund
$2,300
Fire Prevention
Florida Fire Marshal & Inspectors Association Conference
Fire Marshall, Asst. Fire
Marshall and Inspector
T B D, FL User Fees,
Fire Assessment
$2,535
Dispatch Computer Aided Dispatch User Group
2 CAD Programmer
s T B D
User Fees, General
Fund, Fire
Assessment
$5,500
Fire Operations National Fire Academy
10 Officers & 3 Fire
Inspectors T B D
User Fees, General
Fund, Fire
Assessment, M S T U
$2,500
Total Funded For Department $22,435

FIRE RESCUE DEPARTMENT FISCAL YEAR 2020-2021 TRAVEL A&B SUMMARY
Program Name Description Position Destination Funding Source
Total Cost
Fire Operations Blue Card command Instructor Certification
2 District Chiefs T B D Unfunded $13,000
Fire Operations Florida Government Finance Officer Association
Asst. Chief to Finance T B D Unfunded $2,000
Fire Operations Manufacturer Fire Apparatus Training
Fleet technicians T B D Unfunded $3,000
Emergency Medical Services - Ocean Rescue
United States Lifeguard Association
Ocean Rescue Chief or
Asst. Chief
T B D Unfunded $2,000
Emergency Medical Services
Emergency Cardiac Care Update Conference
Asst. Chief T B D Unfunded $1,800
Fire Operations Florida Fire East Conference 8 Officers T B D Unfunded $3,000
Emergency Medical Services - Ocean Rescue
Florida Beach Patrol Chiefs Association
Ocean Rescue Chief or
Asst. Chief
T B D Unfunded $600
Total Unfunded For Department $25,400

FIRE RESCUE DEPARTMENT FISCAL YEAR 2020-2021 CAPITAL OUTLAY SUMMARY
Program Name Description Quantity Unit Cost Funding Source Total Cost
Fire Operations Fire Engine 1 $540,000 Fire Assessment $540,000
Fire Operations Large Intake Valve 2 $1,600 M S T U $3,200
Fire Operations Deck Gun For New Engines 1 $2,500 Fire
Assessment $2,500
Fire Operations Generator for Apparatus 2 $1,200 M S T U $2,400
Fire Operations 3 Section Column Lifts for Fleet 3 $37,000
General Fund, Fire
Assessment, M S T U,
User Fees
$111,000
Fire Operations Service Truck Ford F450/550 with service body 4 Wheel Drive
1 $100,000 General Fund, Fire
Assessment, M S T U,
User Fees
$100,000
Fire Operations Bunker Gear ( New Hires) 60 $2,200 Fire
Assessment $132,000
Fire Operations District Chief Vehicle 1 $56,000 Fire Assessment $56,000
Fire Operations Battery powered Extrication Equipment 3 $21,460 Fire
Assessment $64,380
Fire Operations Thermal Imaging Cameras 5 $7,800 Fire
Assessment $39,000
Fire Operations Bunker Gear 50 $2,200 M S T U $110,000
Fire Operations Bunker Gear (Replacement) 50 $2,200 Fire
Assessment $110,000
Fire Operations Ice Machines 4 $3,200
General Fund, Fire
Assessment, M S T U,
User Fees
$12,800
Fire Operations Single Head Radios for Base Stations 4 $4,000 Fire
Assessment $16,000

Program Name Description Quantity Unit Cost Funding Source Total Cost
Fire Operations 15 X G 75 Portable radios @ $3,000 15 $3,000 M S T U $45,000
Fire Operations Station Generator 1 $75,000
General Fund, Fire
Assessment, M S T U,
User Fees
$75,000
Fire Operations Station Kitchen Appliances 2 $5,000
General Fund, Fire
Assessment, M S T U,
User Fees
$10,000
Fire Operations Treadmills 2 $4,500
General Fund, Fire
Assessment, M S T U,
User Fees
$9,000
Fire Operations Staff Laptops 14 $1,785
General Fund, Fire
Assessment, M S T U,
User Fees
$24,990
Fire Operations Base Station Radios 800 M h z 5 @ $3,600 5 $3,600 M S T U $18,000
Fire Operations Type 6 Brush Truck with Pump Motor 5 $4,800 M S T U $24,000
Fire Operations Generator for Apparatus 4 $1,200 Fire Assessment $4,800
Fire Operations Internal Distribution to Support Emergency Medical Services
1 ($140,268)
($140,268)
Fire Operations Internal Distribution to Support Dispatch 1 ($7,088) ($7,088)
Emergency Medical Service Rescue Quad Unit 2 $207,000 General Fund,
User Fees $414,000
Emergency Medical Service Rescue Basic Unit 2 $184,000 General Fund,
User Fees $368,000

Program Name Description Quantity Unit Cost Funding Source Total Cost
Emergency Medical Service
X G -75 800 MHZ mobile radio Dual Head 2 $5,600 General Fund,
User Fees $11,200
Emergency Medical Service
XG-75 800 MHZ Portable Radios 4 $4,300 General Fund,
User Fees $17,200
Emergency Medical Service
X G- 75 800 MHZ Mobile Radio Dual Head
3 $5,600 General Fund, User Fees $16,800
Emergency Medical Service
X G- 75 800 MHZ Portable Radios
6 $4,300 General Fund, User Fees $25,800
Emergency Medical Service Portable Ventilators 1 $2,198 General Fund,
User Fees $2,198
Emergency Medical Service e P C R Laptops 40 $2,200 General Fund,
User Fees $88,000
Emergency Medical Service
Internal Distribution to Support Emergency Medical Services
1 $140,268 $140,268
Ocean Rescue Enclosed Lifeguard Towers 2 $10,000 General Fund,
User Fees $20,000
Ocean Rescue Utility Terrain Vehicle 3 $13,500 General Fund, User Fees $40,500
Ocean Rescue Portable Office Trailer 1 $15,000 General Fund, User Fees $15,000
Ocean Rescue Storage Conex Container 1 $60,000 General Fund,
User Fees $60,000
Dispatch A E D 1 $1,645
General Fund, Fire
Assessment, M S T U,
User Fees
$1,645
Dispatch Internal Distribution to Support Dispatch 1 $7,088 $7,088
Total Funded For Department $2,590,413
Special Note:
In accordance with Brevard County Board of County Commissioners’ Policy BCC-24, Procurement, this form satisfies Directive III. E. 4., requiring a detailed list of approved capital outlay items and equipment to be reviewed and approved by the Board during the Budget process.

FIRE RESCUE DEPARTMENT FISCAL YEAR 2020-2021 CAPITAL OUTLAY SUMMARY
Program Name Description Quantity Unit Cost Funding Source Total Cost
Fire Operations Fire Engine 1 $540,000 Unfunded $540,000
Fire Operations Deck Gun for New Engines 1 $2,500 Unfunded $2,500
Fire Operations Platform Ladder truck 1 $980,000 Unfunded $980,000
Fire Operations Water Tender 1 $300,000 Unfunded $300,000
Fire Operations Scott 4.5 Self-Contained Breathing Apparatus packs
40 $4,085 Unfunded $163,400
Fire Operations Admin Vehicle 1 $32,000 Unfunded $32,000
Fire Operations Haz Mat monitor 1 $5,000 Unfunded $5,000
Fire Operations Raman Spectroscopy 1 $25,000 Unfunded $25,000
Fire Prevention Inspector/Investigator Vehicles 2 $24,500 Unfunded $49,000
Fire Operations Service Truck Ford F 450/550 with service body 4 Wheel Drive
1 $100,000 Unfunded $100,000
Fire Operations Training Vehicle District Chief 1 $56,000 Unfunded $56,000
Fire Operations Utility Van 1 $35,500 Unfunded $35,500
Emergency Medical Service Power Generator 1 $75,000 Unfunded $75,000
Emergency Medical Service Rescue Unit Bariatric 1 $225,000 Unfunded $225,000
Ocean Rescue A T V 4 Wheeler 1 $10,000 Unfunded $10,000
Total Unfunded For Department $2,598,400

FIRE RESCUE DEPARTMENT FISCAL YEAR 2020-2021 CAPITAL IMPROVEMENTS PROGRAM
Program Name Description Funding Source Total Cost
Fire Operations Burn Building & Tower Replacement
Fire Assessment $600,000
Station 67 Station Replacement General Fund, User Fees $393,725
Station 88 Station Replacement General Fund, User Fees $339,959
Total Funded For Department $1,333,684

FIRE RESCUE DEPARTMENT
FISCAL YEAR 2020-2021 CAPITAL IMPROVEMENTS PROGRAM
Program Name Description Funding Source Total Cost
Fire Operations Land Acquisition and Engineering Station 86 Replacement Unfunded $2,000,000
Fire Operations Land Acquisition and Engineering Station 40 Replacement Unfunded $2,000,000
Fire Operations Land Acquisition and Engineering Station 82 Replacement Unfunded $2,000,000
Fire Operations Land Acquisition and Engineering Station 43 Replacement Unfunded $2,000,000
Fire Operations Station 64 Replacement Unfunded $3,000,000
Emergency Services Land Acquisition and Engineering Station 84 Replacement Unfunded $1,200,000
Emergency Services Station 85 Unfunded $900,000
Total Unfunded For Department $13,100,000