Fipp world media trends special report content
27
TRENDS SPECIAL REPORT VIDEO SOCIAL MEDIA MOBILE BIG DATA REVENUE CONTENT MAGAZINE MEDIA CONTENT TRENDS Brand partner
-
Upload
tuan-anh-nguyen -
Category
Mobile
-
view
211 -
download
0
Transcript of Fipp world media trends special report content

TRENDS SPECIAL REPORTVIDEO
SOCIAL MEDIAMOBILE
BIG DATAREVENUECONTENT
MAGAZINE MEDIA
CONTENTTRENDS
Brand partner

2
WORLD MEDIA TRENDS 2015
WELCOME TO THE FIPP WORLD MEDIA TRENDS SPECIAL REPORTSThe FIPP Insight and World Newsmedia Network in-depth special World Media Trends reports take a deep-dive into the key opportunities and challenges facing magazine media and presents strategies for success.
Each report is packed with data charts, commentary on trends and practical, usable case studies.
Contact André Glazier ([email protected]) or John Schlaefli ([email protected]) at FIPP for unique commercial opportunities in the FIPP Insight reports.
THE SPECIAL REPORTS IN THIS SERIES ARE:1. Video2. Social media3. Mobile 4. Big data5. Revenue6. Magazine media7. Content
To compile the reports, WNMN sources evidence-based data from sources around the world, analyses the data and provides commentary on top trends identified, trends you should be considering in your business today.
MORE FROM FIPP INSIGHTVisit www.fipp.com/Insight for news on upcoming reports and for any queries about this report and ones to follow. Contact FIPP’s Head of Insight, Helen Bland at [email protected] or +44 7404 4169.
AUTHOR and PUBLISHERMartha L StoneWorld Newsmedia [email protected]
EDITORIAL DIRECTORLeah McBride Mensching
DESIGNERJohn Moreno
REPORT LICENSEEFIPPwww.fipp.com
PROJECT MANAGERHelen [email protected]
COMMERCIAL MANAGERAndré [email protected]
FIPP – the worldwide magazine media association – represents companies and individuals involved in the creation, publishing or distribution of content, by whatever channel, to defined audiences.
FIPP exists so that its members develop better strategies and build better media businesses by identifying and communicating emerging trends, sharing knowledge, and improving skills worldwide.
© World Newsmedia Network 2015All rights reserved, except by prior written permission of FIPP, the worldwide magazine media association, no part of this work may be copied or publicly distributed, displayed or disseminated by any means of publication or communication now known or developed hereafter, including in or by any:
i) directory or compilation or other printed publication; ii) information storage and retrieval system iii) electronic device, including any analogue or digital, visual or audio visual
device or product
Data is provided with thanks to contributors of this book. Every effort has been made in the preparation of this report to ensure accuracy of the content, but FiPP, the publishers and WNMN, the copyright owners, cannot accept liability in respect of errors or omissions. Readers will appreciate that the data is only as up to date as publication schedules and contributors will allow, and is subject to change.
WNMNWORLD NEWSMEDIA NETWORK
WNMNWORLD NEWSMEDIA NETWORK
Brand partner
www.pressreader.com
1. Video2. Social media3. Mobile4. Big data5. Revenue6. Content7. Magazine media
DIGITAL CONTENT AND USERSHIP TRENDS 2015
DIGITAL CONTENT AND USERSHIP TRENDS 2015
A seismic transformation in content development and publishing is taking place in the magazine and newspaper industries. Content consumption patterns,
audience insight technologies and an increasing array of devices from which to access content are driving the metamorphosis
WNMNWORLD NEWSMEDIA NETWORK
WNMNWORLD NEWSMEDIA NETWORK
3
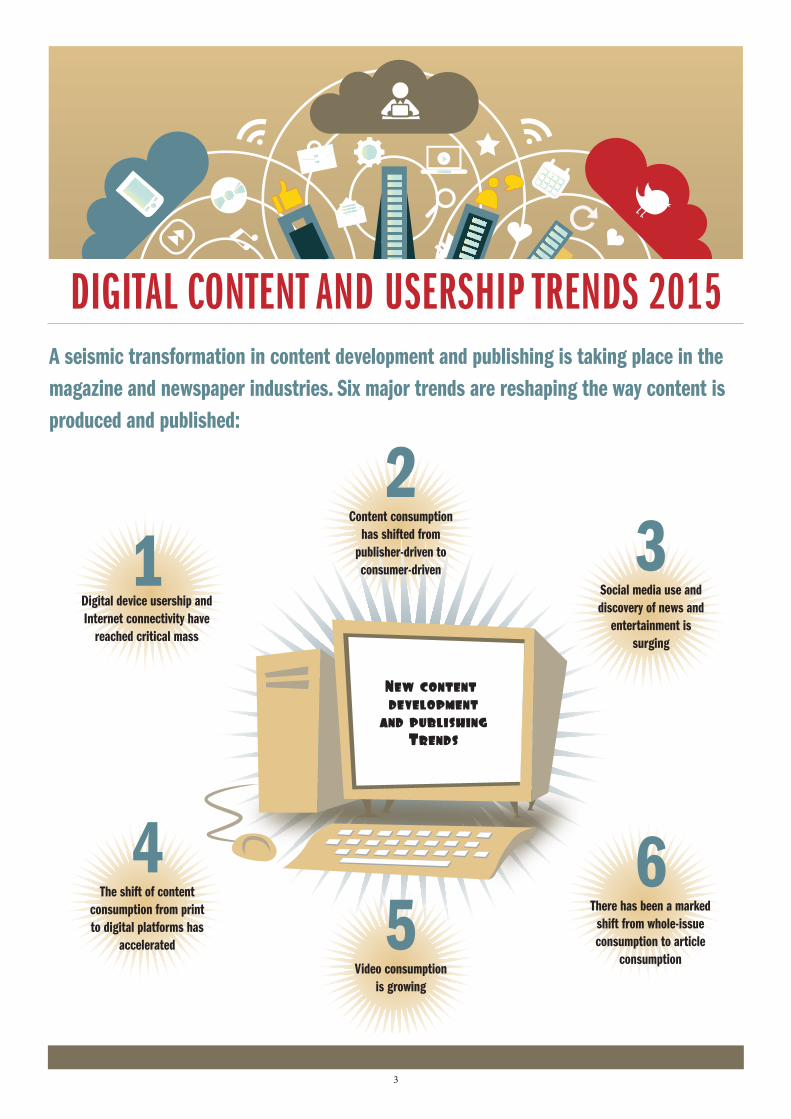
DIGITAL CONTENT AND USERSHIP TRENDS 2015A seismic transformation in content development and publishing is taking place in the magazine and newspaper industries. Six major trends are reshaping the way content is produced and published:
Digital device usership and Internet connectivity have
reached critical mass
1Content consumption
has shifted from publisher-driven to consumer-driven
2Social media use and discovery of news and
entertainment is surging
3
The shift of content consumption from print to digital platforms has
accelerated
4Video consumption
is growing
5 There has been a marked shift from whole-issue consumption to article
consumption
6
New content development
and publishingTrends
4
DIGITAL CONTENT AND USERSHIP TRENDS 2015
The key drivers underlying this transformation are consumers’ reading and viewing habits; technology enabling audience insights; and an increasing array of devices from which to choose to access information at any time of the day or night.
Digital device usership and Internet connectivity have reached critical massWorld Newsmedia Network has constructed the Digital Hot Spots map each year since 2006. A decade ago, most devel-oped nations had a critical mass, or three-quarters, of their populations using Internet and owning mobile phones. Ten years later, even emerging nations have critical mass or are tracking toward critical mass on Internet and mobile usage. The implications are a connected world for everyone, not just the wealthy. The maps show the nations with the highest pen-etrations of Internet and mobile users, the highest concentra-tions of mobile but not Internet, and the countries with high penetrations of Internet but not mobile.
Those nations shaded in yellow on the 2014 map continue to underperform in both mobile and Internet penetrations, according to global Central Intelligence Agency and Internet World Stats data.
Here we show the ever-changing map from 2012 to 2014, with dramatic changes going on in Latin America and Africa. Many countries that were once described as “cold” spots are now surging in mobile usage.
Since 2006, the world has seen dramatic growth in mobile and Internet penetrations. An important change that started in 2011 is the shift toward mobile-focused access of the Internet, particularly in Africa, Latin America and parts of Asia. The main drivers of this shift are inexpensive smartphones and connectivity that are making it possible for people of limited means to access the Internet.
From 2013 to 2014, a variety of countries are graduating from the ranks of unconnected to connected via personal comput-ers and mobile devices. The most notable changes are China, India and a host of Latin American and African countries, all of which have moved to mobile hotspots, with mobile penetra-tions of more than 75 percent.
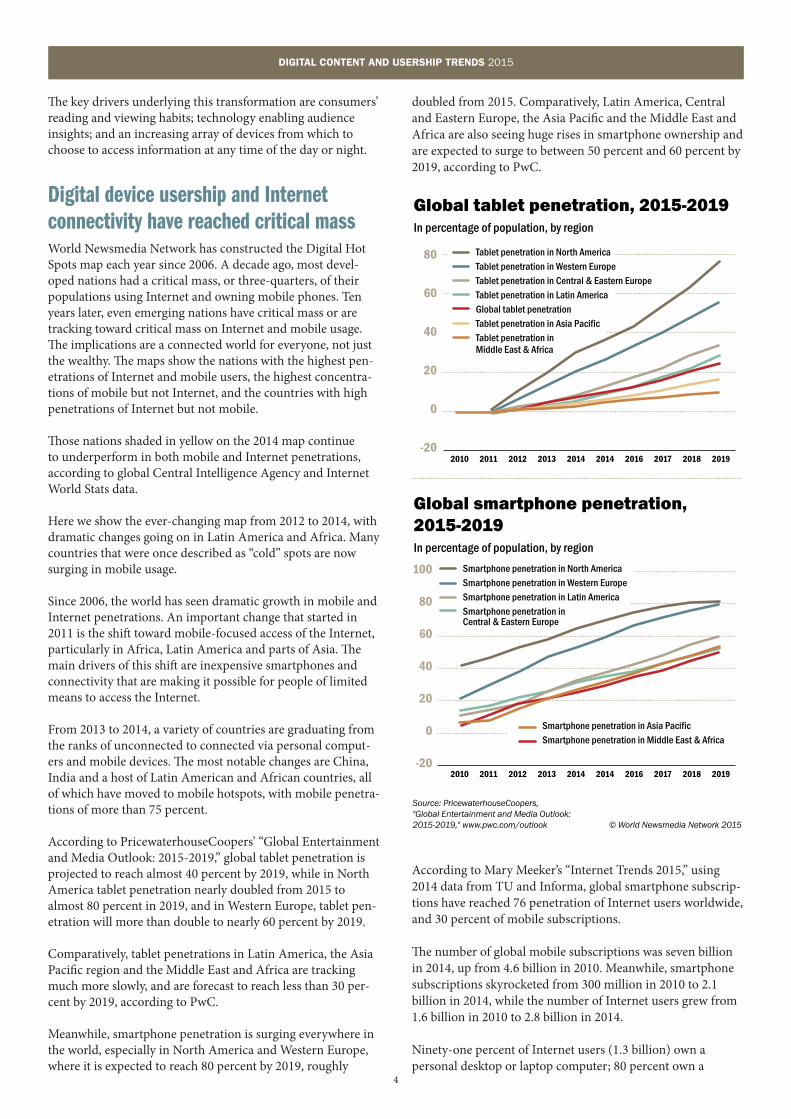
According to PricewaterhouseCoopers’ “Global Entertainment and Media Outlook: 2015-2019,” global tablet penetration is projected to reach almost 40 percent by 2019, while in North America tablet penetration nearly doubled from 2015 to almost 80 percent in 2019, and in Western Europe, tablet pen-etration will more than double to nearly 60 percent by 2019.
Comparatively, tablet penetrations in Latin America, the Asia Pacific region and the Middle East and Africa are tracking much more slowly, and are forecast to reach less than 30 per-cent by 2019, according to PwC.
Meanwhile, smartphone penetration is surging everywhere in the world, especially in North America and Western Europe, where it is expected to reach 80 percent by 2019, roughly
doubled from 2015. Comparatively, Latin America, Central and Eastern Europe, the Asia Pacific and the Middle East and Africa are also seeing huge rises in smartphone ownership and are expected to surge to between 50 percent and 60 percent by 2019, according to PwC.
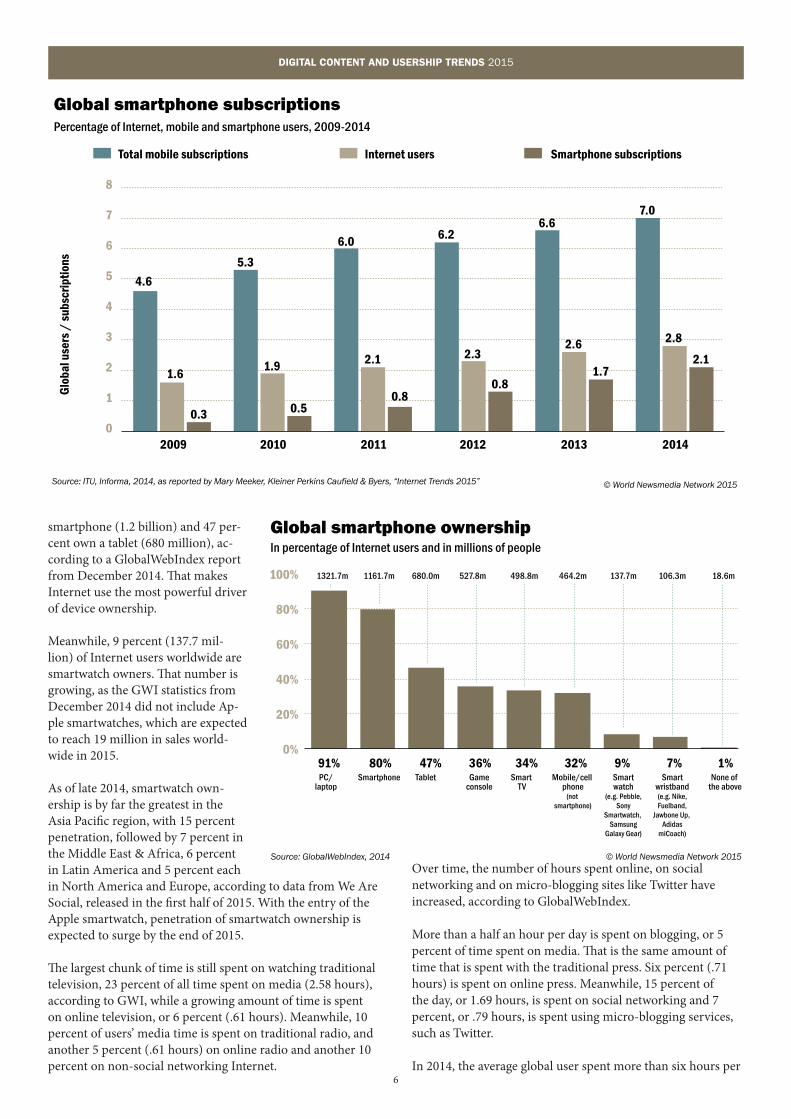
According to Mary Meeker’s “Internet Trends 2015,” using 2014 data from TU and Informa, global smartphone subscrip-tions have reached 76 penetration of Internet users worldwide, and 30 percent of mobile subscriptions.
The number of global mobile subscriptions was seven billion in 2014, up from 4.6 billion in 2010. Meanwhile, smartphone subscriptions skyrocketed from 300 million in 2010 to 2.1 billion in 2014, while the number of Internet users grew from 1.6 billion in 2010 to 2.8 billion in 2014.
Ninety-one percent of Internet users (1.3 billion) own a personal desktop or laptop computer; 80 percent own a
2.global.pwc.sourcesofnews
Source: PricewaterhouseCoopers, "Global Entertainment and Media Outlook: 2015-2019," www.pwc.com/outlook © World Newsmedia Network 2015
Global apps in use, 2015-2019In millions of apps worldwide and by region
2010 2011 2013 2014 2017 20192012 2014 2016 2018
150k
125k
100k
75k
50k
25k
0k
-25k
Apps in Asia PacificApps in North AmericaApps in Western EuropeApps in Central and Eastern EuropeApps in Latin AmericaApps in Middle East & Africa
Global tablet penetration, 2015-2019In percentage of population, by region
2010 2011 2013 2014 2017 20192012 2014 2016 2018
80
60
40
20
0
-20
Tablet penetration in North AmericaTablet penetration in Western EuropeTablet penetration in Central & Eastern EuropeTablet penetration in Latin AmericaGlobal tablet penetrationTablet penetration in Asia PacificTablet penetration in Middle East & Africa
Global smartphone penetration, 2015-2019In percentage of population, by region
2010 2011 2013 2014 2017 20192012 2014 2016 2018
100
80
60
40
20
0
-20
Smartphone penetration in North AmericaSmartphone penetration in Western EuropeSmartphone penetration in Latin AmericaSmartphone penetration in Central & Eastern Europe
Smartphone penetration in Asia PacificSmartphone penetration in Middle East & Africa

5
DIGITAL CONTENT AND USERSHIP TRENDS 2015
Digital Hotspots 2012-2014Global mobile phone and Internet penetrations
Source: CIA World Factbook, 2012 to 2014, and Internet World Stats, 2012 to 2014 © World Newsmedia Network 2015
Hottest
Hot in mobile
Hot in Internet
Coolest MobileInternet
<><
MobileInternet
><
75%50%
MobileInternet
>≤
75%50%
MobileInternet
<>
75%50%
75%50%
Hottest
Hot in mobile
Hot in Internet
Coolest MobileInternet
<<
MobileInternet
≥≥
75%40%
MobileInternet
≥<
75%40%
MobileInternet
<≥
75%40%
75%40%
Hottest
Hot in mobile
Hot in Internet
Coolest MobileInternet
<<
MobileInternet
≥≥
75%40%
MobileInternet
≥<
75%40%
MobileInternet
<≥
75%40%
75%40%
2012
2013
2014
6
DIGITAL CONTENT AND USERSHIP TRENDS 2015
smartphone (1.2 billion) and 47 per-cent own a tablet (680 million), ac-cording to a GlobalWebIndex report from December 2014. That makes Internet use the most powerful driver of device ownership.
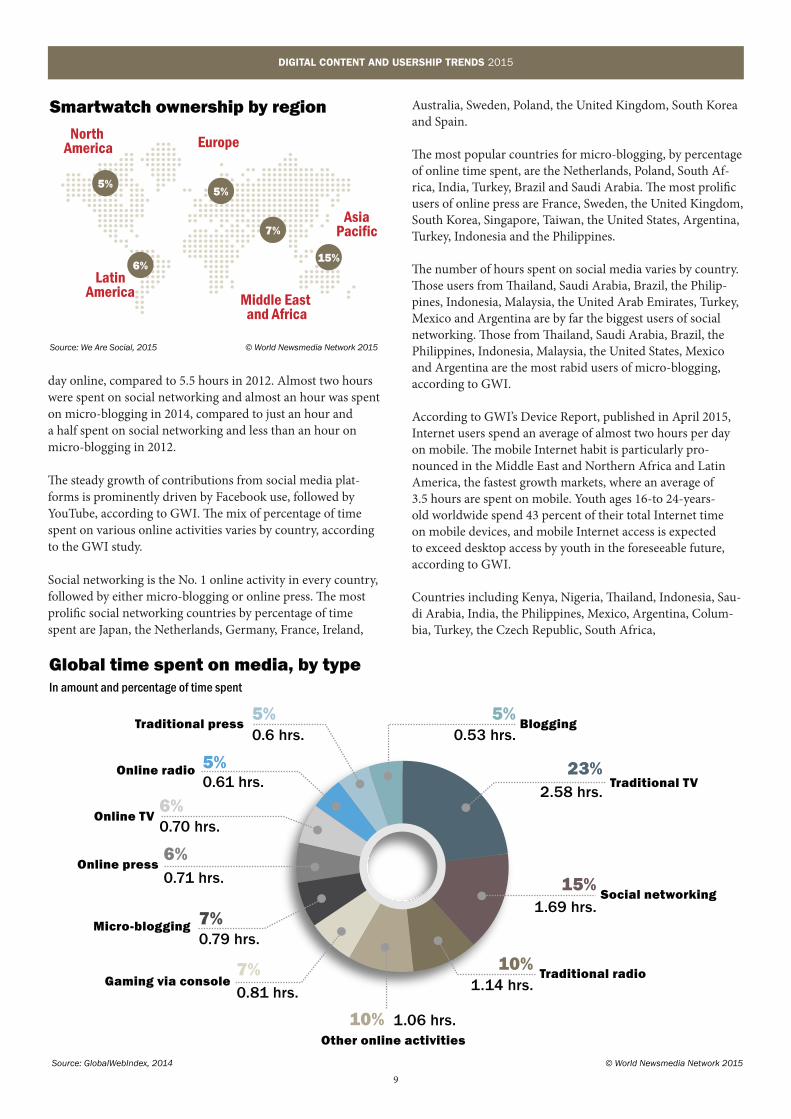
Meanwhile, 9 percent (137.7 mil-lion) of Internet users worldwide are smartwatch owners. That number is growing, as the GWI statistics from December 2014 did not include Ap-ple smartwatches, which are expected to reach 19 million in sales world-wide in 2015.
As of late 2014, smartwatch own-ership is by far the greatest in the Asia Pacific region, with 15 percent penetration, followed by 7 percent in the Middle East & Africa, 6 percent in Latin America and 5 percent each in North America and Europe, according to data from We Are Social, released in the first half of 2015. With the entry of the Apple smartwatch, penetration of smartwatch ownership is expected to surge by the end of 2015.
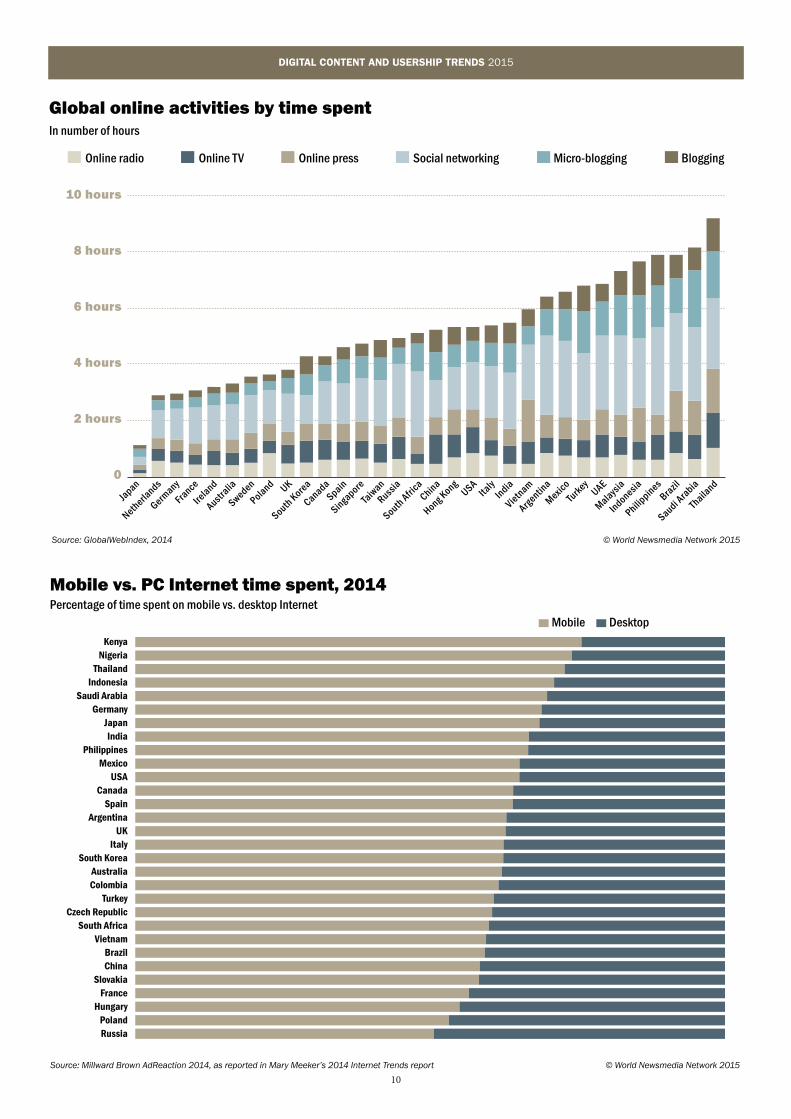
The largest chunk of time is still spent on watching traditional television, 23 percent of all time spent on media (2.58 hours), according to GWI, while a growing amount of time is spent on online television, or 6 percent (.61 hours). Meanwhile, 10 percent of users’ media time is spent on traditional radio, and another 5 percent (.61 hours) on online radio and another 10 percent on non-social networking Internet.
Over time, the number of hours spent online, on social networking and on micro-blogging sites like Twitter have increased, according to GlobalWebIndex.
More than a half an hour per day is spent on blogging, or 5 percent of time spent on media. That is the same amount of time that is spent with the traditional press. Six percent (.71 hours) is spent on online press. Meanwhile, 15 percent of the day, or 1.69 hours, is spent on social networking and 7 percent, or .79 hours, is spent using micro-blogging services, such as Twitter.
In 2014, the average global user spent more than six hours per
Source: ITU, Informa, 2014, as reported by Mary Meeker, Kleiner Perkins Caufield & Byers, “Internet Trends 2015” © World Newsmedia Network 2015
Global smartphone subscriptionsPercentage of Internet, mobile and smartphone users, 2009-2014
0
1
2
3
4
5
6
7
8
2009 2010 2011 2012 2013 2014
Glo
bal u
sers
/ s
ubsc
riptio
ns
Total mobile subscriptions Internet users Smartphone subscriptions
4.6
1.6
0.3
5.3
1.9
0.5
6.0
2.1
0.8
6.26.6
2.6
1.7
7.0
2.8
2.12.3
0.8
2.globalsmartphoneownership.ai
Global smartphone ownershipIn percentage of Internet users and in millions of people
Source: GlobalWebIndex, 2014 © World Newsmedia Network 2015
0%
20%
40%
60%
80%
100%
91% 80% 47% 36% 34% 32% 9% 7% 1%PC/
laptopSmartphone Tablet Game
consoleSmart
TVMobile/cell
phone(not
smartphone)
Smartwatch
(e.g. Pebble,Sony
Smartwatch, Samsung
Galaxy Gear)
Smartwristband(e.g. Nike,Fuelband,
Jawbone Up, Adidas
miCoach)
None of the above
18.6m106.3m137.7m464.2m498.8m527.8m680.0m1161.7m1321.7m

7
DIGITAL CONTENT AND USERSHIP TRENDS 2015
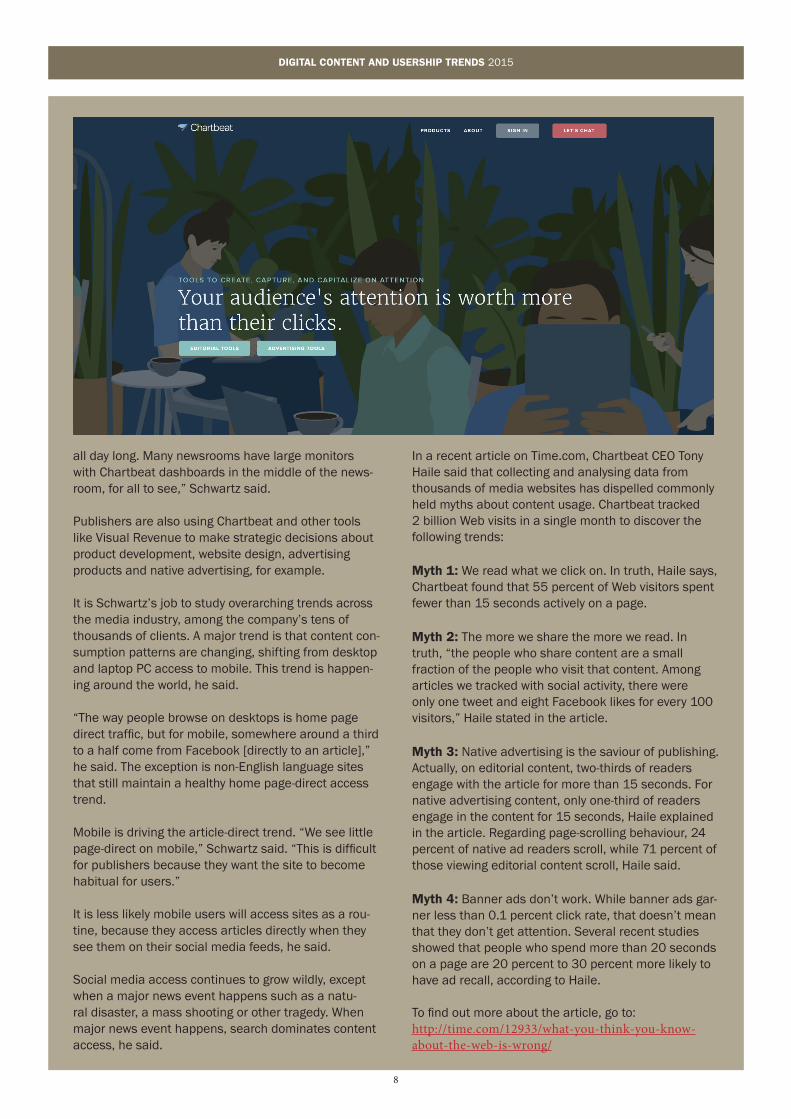
Chartbeat measures traffic of 60,000 websites across the globe, in real-time, and in minute details. Using a dashboard interface, Chartbeat measures the most popular stories happening right now and in any other time interval over the life of the story. Further, Chartbeat ranks trending pages, stories that are most shared across social plat-forms, and much more.
Here’s how it works, according to Josh Schwartz, chief data scientist at Chartbeat: In order for the company’s clients to un-derstand their unique audience behaviours, they must place a Javascript code on each of their Web pages. When users access these pages, a series of beacons are sent to Chart-beat, telling them about the pages’ users and how they are reading the pages.
“In the background, we get a second-by-second and pixel-by-pixel view of how people are consuming the
page and how many people are navigating and reading the pages today,” Schwartz said in an interview with World Newsmedia Network.
Chartbeat has more than 50,000 publisher clients. In fact, 80 per-cent of the publishers in the Unit-ed States use Chartbeat. Some globally recognised media brands using the service include Time magazine, The New York Times, Al Jazeera and the Financial Times.
Media companies are using the analytics technology to under-stand their audiences by mon-itoring their usage patterns in real-time and historically. Publish-
ers are using the information to make decisions about story placements on websites and also for dispatch-ing more journalistic coverage when topics become popular.
“Homepage editors may keep Chartbeat on the screen
Chartbeat measures audience content consumption
Josh Schwartz
8
DIGITAL CONTENT AND USERSHIP TRENDS 2015
all day long. Many newsrooms have large monitors with Chartbeat dashboards in the middle of the news-room, for all to see,” Schwartz said.
Publishers are also using Chartbeat and other tools like Visual Revenue to make strategic decisions about product development, website design, advertising products and native advertising, for example.
It is Schwartz’s job to study overarching trends across the media industry, among the company’s tens of thousands of clients. A major trend is that content con-sumption patterns are changing, shifting from desktop and laptop PC access to mobile. This trend is happen-ing around the world, he said.
“The way people browse on desktops is home page direct traffic, but for mobile, somewhere around a third to a half come from Facebook [directly to an article],” he said. The exception is non-English language sites that still maintain a healthy home page-direct access trend.
Mobile is driving the article-direct trend. “We see little page-direct on mobile,” Schwartz said. “This is difficult for publishers because they want the site to become habitual for users.”
It is less likely mobile users will access sites as a rou-tine, because they access articles directly when they see them on their social media feeds, he said.
Social media access continues to grow wildly, except when a major news event happens such as a natu-ral disaster, a mass shooting or other tragedy. When major news event happens, search dominates content access, he said.
In a recent article on Time.com, Chartbeat CEO Tony Haile said that collecting and analysing data from thousands of media websites has dispelled commonly held myths about content usage. Chartbeat tracked 2 billion Web visits in a single month to discover the following trends:
Myth 1: We read what we click on. In truth, Haile says, Chartbeat found that 55 percent of Web visitors spent fewer than 15 seconds actively on a page.
Myth 2: The more we share the more we read. In truth, “the people who share content are a small fraction of the people who visit that content. Among articles we tracked with social activity, there were only one tweet and eight Facebook likes for every 100 visitors,” Haile stated in the article.
Myth 3: Native advertising is the saviour of publishing. Actually, on editorial content, two-thirds of readers engage with the article for more than 15 seconds. For native advertising content, only one-third of readers engage in the content for 15 seconds, Haile explained in the article. Regarding page-scrolling behaviour, 24 percent of native ad readers scroll, while 71 percent of those viewing editorial content scroll, Haile said.
Myth 4: Banner ads don’t work. While banner ads gar-ner less than 0.1 percent click rate, that doesn’t mean that they don’t get attention. Several recent studies showed that people who spend more than 20 seconds on a page are 20 percent to 30 percent more likely to have ad recall, according to Haile.
To find out more about the article, go to:http://time.com/12933/what-you-think-you-know-about-the-web-is-wrong/
9
DIGITAL CONTENT AND USERSHIP TRENDS 2015
day online, compared to 5.5 hours in 2012. Almost two hours were spent on social networking and almost an hour was spent on micro-blogging in 2014, compared to just an hour and a half spent on social networking and less than an hour on micro-blogging in 2012.
The steady growth of contributions from social media plat-forms is prominently driven by Facebook use, followed by YouTube, according to GWI. The mix of percentage of time spent on various online activities varies by country, according to the GWI study.
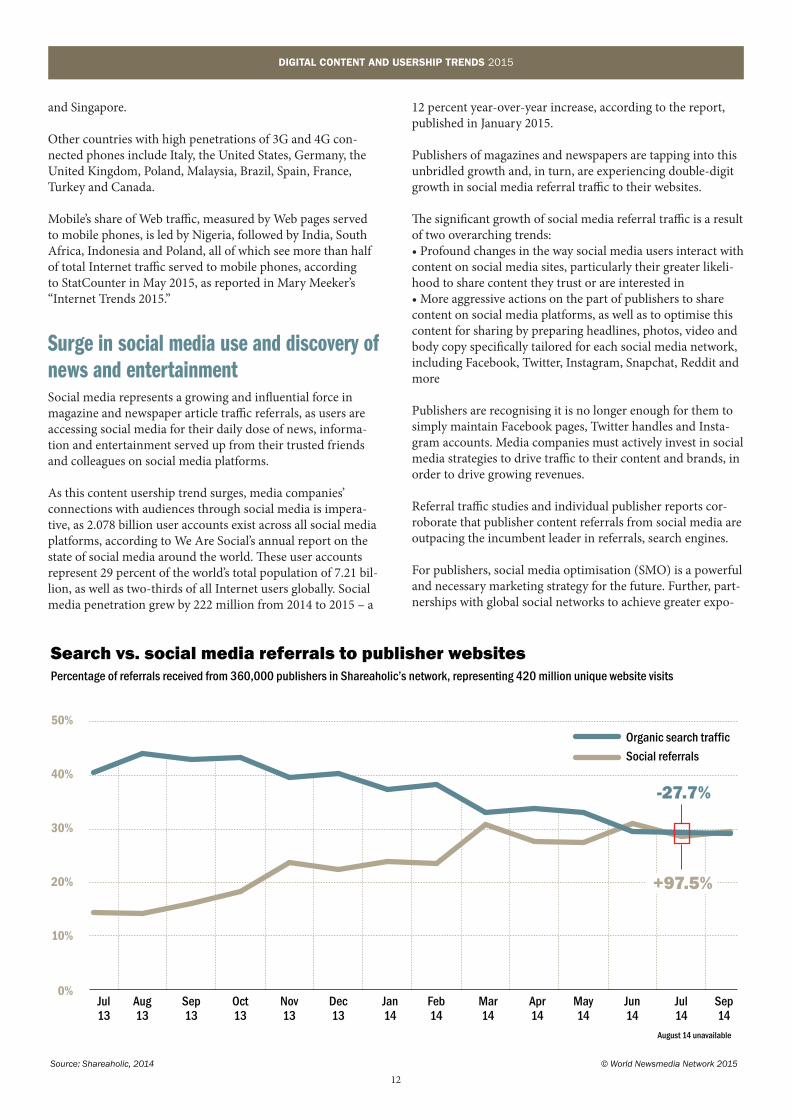
Social networking is the No. 1 online activity in every country, followed by either micro-blogging or online press. The most prolific social networking countries by percentage of time spent are Japan, the Netherlands, Germany, France, Ireland,
Australia, Sweden, Poland, the United Kingdom, South Korea and Spain.
The most popular countries for micro-blogging, by percentage of online time spent, are the Netherlands, Poland, South Af-rica, India, Turkey, Brazil and Saudi Arabia. The most prolific users of online press are France, Sweden, the United Kingdom, South Korea, Singapore, Taiwan, the United States, Argentina, Turkey, Indonesia and the Philippines.
The number of hours spent on social media varies by country. Those users from Thailand, Saudi Arabia, Brazil, the Philip- pines, Indonesia, Malaysia, the United Arab Emirates, Turkey, Mexico and Argentina are by far the biggest users of social networking. Those from Thailand, Saudi Arabia, Brazil, the Philippines, Indonesia, Malaysia, the United States, Mexico and Argentina are the most rabid users of micro-blogging, according to GWI.
According to GWI’s Device Report, published in April 2015, Internet users spend an average of almost two hours per day on mobile. The mobile Internet habit is particularly pro-nounced in the Middle East and Northern Africa and Latin America, the fastest growth markets, where an average of 3.5 hours are spent on mobile. Youth ages 16-to 24-years-old worldwide spend 43 percent of their total Internet time on mobile devices, and mobile Internet access is expected to exceed desktop access by youth in the foreseeable future, according to GWI.
Countries including Kenya, Nigeria, Thailand, Indonesia, Sau-di Arabia, India, the Philippines, Mexico, Argentina, Colum-bia, Turkey, the Czech Republic, South Africa,
Smartwatch ownership by region
Source: We Are Social, 2015 © World Newsmedia Network 2015
5%
6%
5%
15%
7%
North America
AsiaPacific
Europe
Middle East and Africa
LatinAmerica
Traditional press5%0.6 hrs.
1.06 hrs.
1.14 hrs.
1.69 hrs.
2.58 hrs.
0.53 hrs.
0.61 hrs.
0.70 hrs.
0.71 hrs.
0.79 hrs.
0.81 hrs.
5%
6%
6%
7%
7%
10%
10%
15%
5%
23%Online radio
Online TV
Online press
Micro-blogging
Gaming via console
Blogging
Traditional TV
Social networking
Traditional radio
Other online activities
Global time spent on media, by typeIn amount and percentage of time spent
Source: GlobalWebIndex, 2014 © World Newsmedia Network 2015
10
DIGITAL CONTENT AND USERSHIP TRENDS 2015
Global online activities by time spentIn number of hours
Source: GlobalWebIndex, 2014 © World Newsmedia Network 2015
Online radio Online TV Online press Social networking Micro-blogging Blogging
10 hours
8 hours
6 hours
4 hours
2 hours
0
Japan
Netherla
nds
Germany
France
Ireland
Australia
Sweden
Poland UK
South Korea
CanadaSpain
Singapore
Taiw
an
Russia
South Africa
China
Hong KongUSA
Italy
India
Vietnam
Argentina
Mexico
Turkey
UAE
Malaysia
Indonesia
Philippines
Brazil
Saudi Ara
bia
Thailand
Mobile vs. PC Internet time spent, 2014Percentage of time spent on mobile vs. desktop Internet
Source: Millward Brown AdReaction 2014, as reported in Mary Meeker’s 2014 Internet Trends report © World Newsmedia Network 2015
KenyaNigeria
ThailandIndonesia
Saudi ArabiaGermany
JapanIndia
PhilippinesMexico
USACanada
SpainArgentina
UKItaly
South KoreaAustraliaColombia
TurkeyCzech Republic
South AfricaVietnam
BrazilChina
SlovakiaFrance
HungaryPolandRussia
Mobile Desktop

11
DIGITAL CONTENT AND USERSHIP TRENDS 2015
Vietnam and Brazil already passed the 50 percent mark for daily distribution of time on mobiles vs. desktops in 2014, according to Millward Brown AdReaction 2014, as reported in Mary Meeker’s 2014 Internet Trends report.
Mobile phones’ share of Web traffic is rising dramatically as more users are engaging with the Internet, particularly those with smartphones. From 2009 to 2015, mobile-driven Web traffic grew exponentially from 0.7 percent in 2009 to 33.4 percent in 2015, according to January 2015 data from We Are Social and StatCounter.
While one-third of all Web traffic happens on mobile phones, it depends on the region as to how many hours of time are spent online via the devices. The countries with the most mobile-driven Internet traffic are Thailand, Saudi Arabia, Malaysia, Brazil, the Philippines, Indonesia, South Africa, the United Arab Emirates, Mexico, India and Argentina. Mobile users in all of these countries spend more than two hours per day online via their phones.
High-speed connectivity is one component that drives increased smartphone usage. According to We Are Social’s January 2015 report, eight countries have high-speed broad-band connections that exceed the population, made possible
by many mobile users owning more than one phone.
The countries with the highest amount of 3G and 4G con-nected phones including Hong Kong, Japan, Saudi Arabia, Australia, Thailand, the United Arab Emirates, South Korea
Global mobile share of Web traffic, 2009-2015Percentage of total Web pages served to mobile phones
Source: We Are Social, 2015 © World Newsmedia Network 2015
2009 2010 2011 2012 2013 2014 2015
0.7%2.9%
6.1%
10.9%
17.0%
28.9%
33.4%
Source: StatCounter 2015, as reported by Mary Meeker, Kleiner Perkins Caufield & Byers, “Internet Trends 2015” © World Newsmedia Network 2015
Mobile as a percentage of Internet traffic
0% 10% 20% 30% 40% 50% 60% 70% 80%
Nigeria
India
South Africa
Indonesia
Poland
Turkey
Iran
Mexico
China
Japan
Colombia
Spain
Philippines
Argentina
South Korea
Vietnam
UK
Italy
USA
Brazil
Egypt
Germany
Canada
France
Russia
76%
65%
57%
57%
52%
39%
38%
33%
30%
30%
28%
27%
26%
25%
25%
24%
23%
22%
22%
22%
19%
17%
15%
14%
11%
12
DIGITAL CONTENT AND USERSHIP TRENDS 2015
and Singapore.
Other countries with high penetrations of 3G and 4G con-nected phones include Italy, the United States, Germany, the United Kingdom, Poland, Malaysia, Brazil, Spain, France, Turkey and Canada.
Mobile’s share of Web traffic, measured by Web pages served to mobile phones, is led by Nigeria, followed by India, South Africa, Indonesia and Poland, all of which see more than half of total Internet traffic served to mobile phones, according to StatCounter in May 2015, as reported in Mary Meeker’s “Internet Trends 2015.”
Surge in social media use and discovery of news and entertainmentSocial media represents a growing and influential force in magazine and newspaper article traffic referrals, as users are accessing social media for their daily dose of news, informa-tion and entertainment served up from their trusted friends and colleagues on social media platforms.
As this content usership trend surges, media companies’ connections with audiences through social media is impera-tive, as 2.078 billion user accounts exist across all social media platforms, according to We Are Social’s annual report on the state of social media around the world. These user accounts represent 29 percent of the world’s total population of 7.21 bil-lion, as well as two-thirds of all Internet users globally. Social media penetration grew by 222 million from 2014 to 2015 – a
12 percent year-over-year increase, according to the report, published in January 2015.
Publishers of magazines and newspapers are tapping into this unbridled growth and, in turn, are experiencing double-digit growth in social media referral traffic to their websites.
The significant growth of social media referral traffic is a result of two overarching trends: • Profound changes in the way social media users interact with content on social media sites, particularly their greater likeli-hood to share content they trust or are interested in • More aggressive actions on the part of publishers to share content on social media platforms, as well as to optimise this content for sharing by preparing headlines, photos, video and body copy specifically tailored for each social media network, including Facebook, Twitter, Instagram, Snapchat, Reddit and more
Publishers are recognising it is no longer enough for them to simply maintain Facebook pages, Twitter handles and Insta-gram accounts. Media companies must actively invest in social media strategies to drive traffic to their content and brands, in order to drive growing revenues.
Referral traffic studies and individual publisher reports cor-roborate that publisher content referrals from social media are outpacing the incumbent leader in referrals, search engines.
For publishers, social media optimisation (SMO) is a powerful and necessary marketing strategy for the future. Further, part-nerships with global social networks to achieve greater expo-
Search vs. social media referrals to publisher websitesPercentage of referrals received from 360,000 publishers in Shareaholic’s network, representing 420 million unique website visits
Source: Shareaholic, 2014 © World Newsmedia Network 2015
Jul13
Aug13
Sep13
Oct13
Nov13
Dec13
Jan14
Feb14
Mar14
Apr14
May14
Jun14
Jul14
Sep14
August 14 unavailable
10%
0%
20%
30%
40%
50%Organic search traffic
Social referrals
-27.7%
+97.5%
13
DIGITAL CONTENT AND USERSHIP TRENDS 2015
sure and revenue share may be a smart option for publishers in the short term; however, proceed with caution. Partnerships with the likes of Facebook and Snapchat may be riddled with potential competitive dangers for the future.
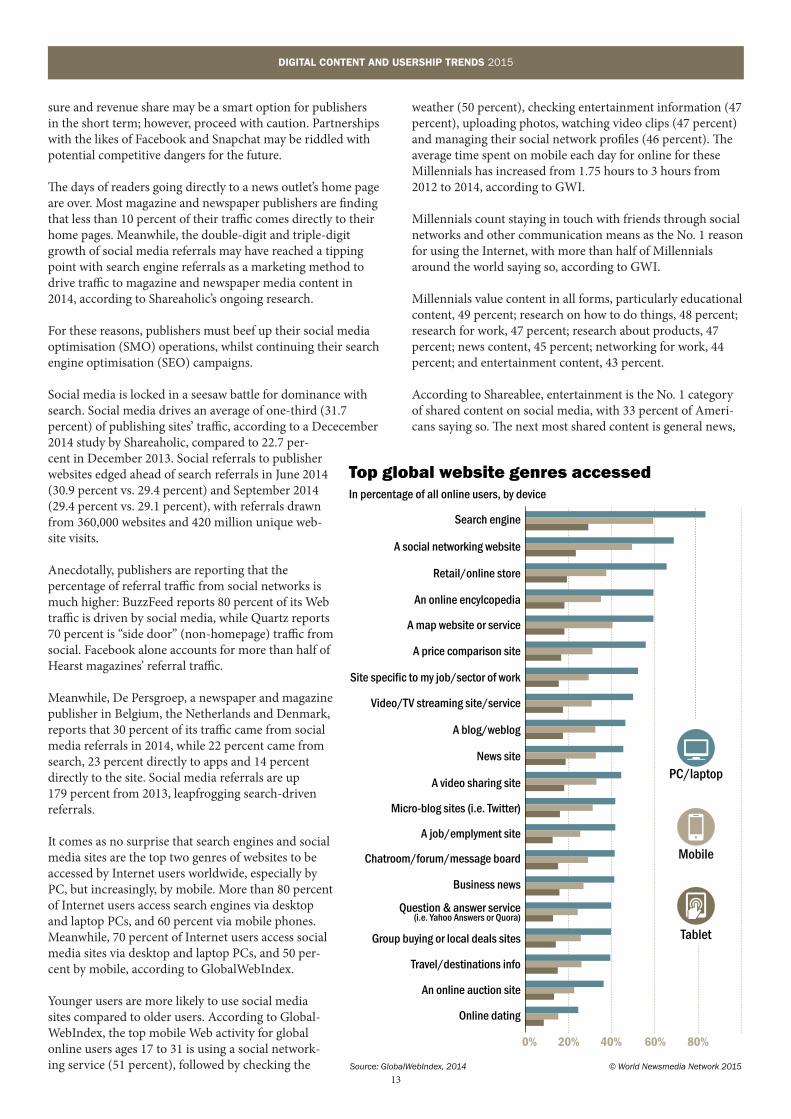
The days of readers going directly to a news outlet’s home page are over. Most magazine and newspaper publishers are finding that less than 10 percent of their traffic comes directly to their home pages. Meanwhile, the double-digit and triple-digit growth of social media referrals may have reached a tipping point with search engine referrals as a marketing method to drive traffic to magazine and newspaper media content in 2014, according to Shareaholic’s ongoing research.
For these reasons, publishers must beef up their social media optimisation (SMO) operations, whilst continuing their search engine optimisation (SEO) campaigns.
Social media is locked in a seesaw battle for dominance with search. Social media drives an average of one-third (31.7 percent) of publishing sites’ traffic, according to a Dececember 2014 study by Shareaholic, compared to 22.7 per-cent in December 2013. Social referrals to publisher websites edged ahead of search referrals in June 2014 (30.9 percent vs. 29.4 percent) and September 2014 (29.4 percent vs. 29.1 percent), with referrals drawn from 360,000 websites and 420 million unique web-site visits.
Anecdotally, publishers are reporting that the percentage of referral traffic from social networks is much higher: BuzzFeed reports 80 percent of its Web traffic is driven by social media, while Quartz reports 70 percent is “side door” (non-homepage) traffic from social. Facebook alone accounts for more than half of Hearst magazines’ referral traffic.
Meanwhile, De Persgroep, a newspaper and magazine publisher in Belgium, the Netherlands and Denmark, reports that 30 percent of its traffic came from social media referrals in 2014, while 22 percent came from search, 23 percent directly to apps and 14 percent directly to the site. Social media referrals are up 179 percent from 2013, leapfrogging search-driven referrals.
It comes as no surprise that search engines and social media sites are the top two genres of websites to be accessed by Internet users worldwide, especially by PC, but increasingly, by mobile. More than 80 percent of Internet users access search engines via desktop and laptop PCs, and 60 percent via mobile phones. Meanwhile, 70 percent of Internet users access social media sites via desktop and laptop PCs, and 50 per-cent by mobile, according to GlobalWebIndex.
Younger users are more likely to use social media sites compared to older users. According to Global-WebIndex, the top mobile Web activity for global online users ages 17 to 31 is using a social network-ing service (51 percent), followed by checking the
weather (50 percent), checking entertainment information (47 percent), uploading photos, watching video clips (47 percent) and managing their social network profiles (46 percent). The average time spent on mobile each day for online for these Millennials has increased from 1.75 hours to 3 hours from 2012 to 2014, according to GWI.
Millennials count staying in touch with friends through social networks and other communication means as the No. 1 reason for using the Internet, with more than half of Millennials around the world saying so, according to GWI.
Millennials value content in all forms, particularly educational content, 49 percent; research on how to do things, 48 percent; research for work, 47 percent; research about products, 47 percent; news content, 45 percent; networking for work, 44 percent; and entertainment content, 43 percent.
According to Shareablee, entertainment is the No. 1 category of shared content on social media, with 33 percent of Ameri-cans saying so. The next most shared content is general news,
Top global website genres accessedIn percentage of all online users, by device
Source: GlobalWebIndex, 2014 © World Newsmedia Network 2015
Search engine
A social networking website
Retail/online store
An online encylcopedia
A map website or service
A price comparison site
Site specific to my job/sector of work
Video/TV streaming site/service
A blog/weblog
News site
PC/laptop
Mobile
Tablet
A video sharing site
Micro-blog sites (i.e. Twitter)
A job/emplyment site
Chatroom/forum/message board
Business news
Question & answer service(i.e. Yahoo Answers or Quora)
Group buying or local deals sites
Travel/destinations info
An online auction site
Online dating
0% 20% 40% 60% 80%

14
DIGITAL CONTENT AND USERSHIP TRENDS 2015
18 percent; fashion & style, 12 percent; teen content, 10 per-cent; home & garden, 5 percent; women’s interest & lifestyle, 5 percent; food, 4 percent; business & finance, 4 percent; science & technology, 3 percent; men’s interest, 3 percent; auto, 2 per-cent; and travel, 1 percent.
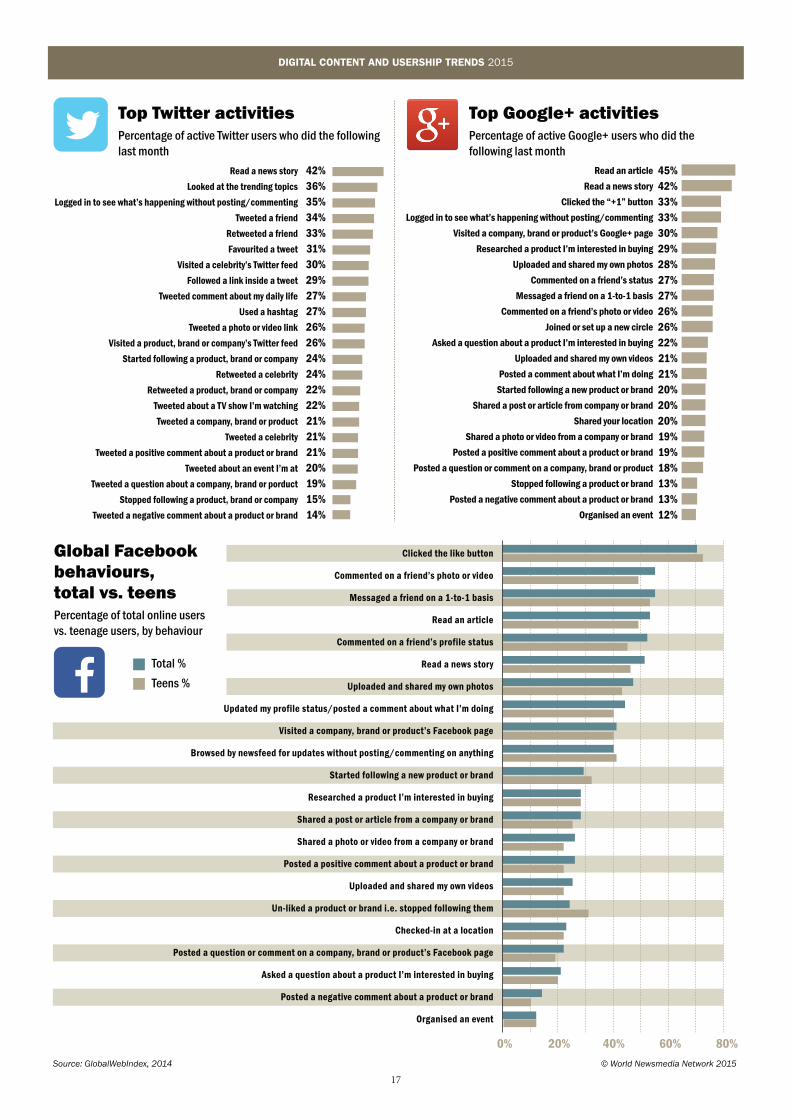
Reading articles and news stories are the top activities for many social network users. Reading a news story is an activity performed by 42 percent of all Twitter and Google+ users in the past month, while reading an article was done by 45 percent of all Google+ users, according to GWI. This is a top reason for media companies to aggressively promote their stories on all social media.
Reading an article and reading a news story are in the top five activities on Facebook, after liking or commenting on postings. Seventy-two percent of teenagers and 70 percent of all Internet users clicked the “like” button in the past month,
Global mobile Internet behavioursIn hours spent each day, and in percentage of global online users, ages 17 to 31
Source: GlobalWebIndex, 2015 © World Newsmedia Network 2015
0% 10% 30%20% 40% 50% 60%
Used a social networking service
Checked the weather online
Checked information aboutmusic, leisure or entertainment
Uploaded photos online
Watched a video clip
Managed your social network profile
Used webmail
Used instant messenger
Searched for product or service to buy
Used Internet banking
2012 2013 2014
3h
2h
1h
0h
Time spent on mobile each day
Top mobile activity
Reasons for Millennials using InternetIn percentage of global online users, ages 17 to 31
Source: GlobalWebIndex, 2015 © World Newsmedia Network 2015
Stay in touch with friends
Education
Research how to do things
Research for work
Research/find products to buy
Stay up to date on news/events
Networking for work
Entertainment e.g. gaming, films TV
To get inspired/get ideas
Update my friends with my life
Fill up spare time
Feedback on companies and brands
Share my opinion
Organise my life
Share and promote my business expertise
Share content
Meet new people
Express myself
Take on a different personality
Change other people’s opinions
0% 10% 30%20% 40% 50%
Top U.S. content categories for shareable contentPercentage of content shares for each category from Facebook, Twitter and Instagram
Source: Shareablee, 2014 © World Newsmedia Network 2015
33%Entertainment
18%General news
12%Fashion & style10%
Teen
5%Home & garden
5%
Women’s interest & lifestyle
4%Business & finance
3%Science & technology
3%Men’s interest
1%Travel
2%Auto
4%Food
Continued on page 18
15
DIGITAL CONTENT AND USERSHIP TRENDS 2015
Although e-commerce has been a lucrative business for retailers for some time, few media companies are in the game. One of the few media organisations to recognise the power of e-commerce early on is Sa-noma Corp., a Dutch multimedia company that owns newspapers, magazines and digital properties in the Netherlands, Finland and beyond.
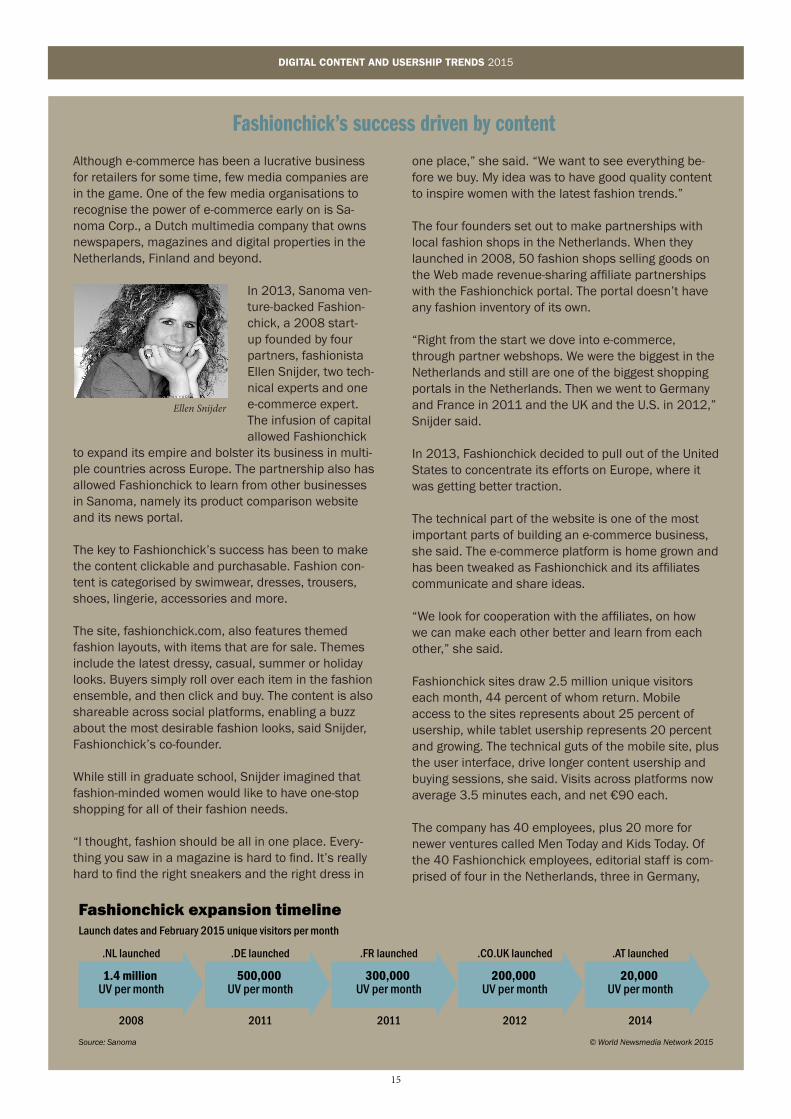
In 2013, Sanoma ven-ture-backed Fashion-chick, a 2008 start-up founded by four partners, fashionista Ellen Snijder, two tech-nical experts and one e-commerce expert. The infusion of capital allowed Fashionchick
to expand its empire and bolster its business in multi-ple countries across Europe. The partnership also has allowed Fashionchick to learn from other businesses in Sanoma, namely its product comparison website and its news portal.
The key to Fashionchick’s success has been to make the content clickable and purchasable. Fashion con-tent is categorised by swimwear, dresses, trousers, shoes, lingerie, accessories and more.
The site, fashionchick.com, also features themed fashion layouts, with items that are for sale. Themes include the latest dressy, casual, summer or holiday looks. Buyers simply roll over each item in the fashion ensemble, and then click and buy. The content is also shareable across social platforms, enabling a buzz about the most desirable fashion looks, said Snijder, Fashionchick’s co-founder.
While still in graduate school, Snijder imagined that fashion-minded women would like to have one-stop shopping for all of their fashion needs.
“I thought, fashion should be all in one place. Every-thing you saw in a magazine is hard to find. It’s really hard to find the right sneakers and the right dress in
one place,” she said. “We want to see everything be-fore we buy. My idea was to have good quality content to inspire women with the latest fashion trends.”
The four founders set out to make partnerships with local fashion shops in the Netherlands. When they launched in 2008, 50 fashion shops selling goods on the Web made revenue-sharing affiliate partnerships with the Fashionchick portal. The portal doesn’t have any fashion inventory of its own.
“Right from the start we dove into e-commerce, through partner webshops. We were the biggest in the Netherlands and still are one of the biggest shopping portals in the Netherlands. Then we went to Germany and France in 2011 and the UK and the U.S. in 2012,” Snijder said.
In 2013, Fashionchick decided to pull out of the United States to concentrate its efforts on Europe, where it was getting better traction.
The technical part of the website is one of the most important parts of building an e-commerce business, she said. The e-commerce platform is home grown and has been tweaked as Fashionchick and its affiliates communicate and share ideas.
“We look for cooperation with the affiliates, on how we can make each other better and learn from each other,” she said.
Fashionchick sites draw 2.5 million unique visitors each month, 44 percent of whom return. Mobile access to the sites represents about 25 percent of usership, while tablet usership represents 20 percent and growing. The technical guts of the mobile site, plus the user interface, drive longer content usership and buying sessions, she said. Visits across platforms now average 3.5 minutes each, and net €90 each.
The company has 40 employees, plus 20 more for newer ventures called Men Today and Kids Today. Of the 40 Fashionchick employees, editorial staff is com-prised of four in the Netherlands, three in Germany,
Fashionchick’s success driven by content
Ellen Snijder
Source: Sanoma © World Newsmedia Network 2015
Fashionchick expansion timelineLaunch dates and February 2015 unique visitors per month
2008
1.4 million UV per month
500,000 UV per month
300,000 UV per month
200,000 UV per month
20,000 UV per month
2011 2011 2012 2014
.NL launched .DE launched .FR launched .CO.UK launched .AT launched

16
DIGITAL CONTENT AND USERSHIP TRENDS 2015
and two each in the United Kingdom and France.
“We have a lot of sharable content that is popular, what people like to read and share on social. ‘Hottest Guys,’ ‘10 Best Buys This Month’ are some of the stories that are trending now,” she said.
As social media drives popular fashion content, fash-
ions are becoming ubiquitous across Europe, Snijder said.
“Fashion trends are slightly different in each country, but if you travel you see the same themes. We work a lot with Instagram. They are really big. They really con-nect the world. People are dressing the same because you get inspired on Instagram from all over the world.”
Source: Sanoma © World Newsmedia Network 2015
Fashionchick international growth strategy
Fashion: Women
Fashion: Men
Fashion: Kids
Home decoration myhomeSHOPPING.NL
myhomeSHOPPING.NL
FASHIONCHICK FASHIONCHICK FASHIONCHICK FASHIONCHICK FASHIONCHICK
K I D ST O D A Y
Netherlands Germany France UK Austria/Belgium
17
DIGITAL CONTENT AND USERSHIP TRENDS 2015
Global Facebook behaviours, total vs. teensPercentage of total online users vs. teenage users, by behaviour
Source: GlobalWebIndex, 2014
Clicked the like button
Commented on a friend’s photo or video
Messaged a friend on a 1-to-1 basis
Read an article
Commented on a friend’s profile status
Read a news story
Uploaded and shared my own photos
Updated my profile status/posted a comment about what I’m doing
Visited a company, brand or product’s Facebook page
Browsed by newsfeed for updates without posting/commenting on anything
Started following a new product or brand
Researched a product I’m interested in buying
Shared a post or article from a company or brand
Shared a photo or video from a company or brand
Posted a positive comment about a product or brand
Uploaded and shared my own videos
Un-liked a product or brand i.e. stopped following them
Checked-in at a location
Posted a question or comment on a company, brand or product’s Facebook page
Asked a question about a product I’m interested in buying
Posted a negative comment about a product or brand
Organised an event
Total %
Teens %
0% 60% 80%40%20%
© World Newsmedia Network 2015
Top Twitter activitiesPercentage of active Twitter users who did the following last month
42%36%35%34%33%31%30%29%27%27%26%26%24%24%22%22%21%21%21%20%19%15%14%
Read a news story
Looked at the trending topics
Logged in to see what’s happening without posting/commenting
Tweeted a friend
Retweeted a friend
Favourited a tweet
Visited a celebrity’s Twitter feed
Followed a link inside a tweet
Tweeted comment about my daily life
Used a hashtag
Tweeted a photo or video link
Visited a product, brand or company’s Twitter feed
Started following a product, brand or company
Retweeted a celebrity
Retweeted a product, brand or company
Tweeted about a TV show I’m watching
Tweeted a company, brand or product
Tweeted a celebrity
Tweeted a positive comment about a product or brand
Tweeted about an event I’m at
Tweeted a question about a company, brand or porduct
Stopped following a product, brand or company
Tweeted a negative comment about a product or brand
Top Google+ activitiesPercentage of active Google+ users who did the following last month
45%42%33%33%30%29%28%27%27%26%26%22%21%21%20%20%20%19%19%18%13%13%12%
Read an article
Read a news story
Clicked the “+1” button
Logged in to see what’s happening without posting/commenting
Visited a company, brand or product’s Google+ page
Researched a product I’m interested in buying
Uploaded and shared my own photos
Commented on a friend’s status
Messaged a friend on a 1-to-1 basis
Commented on a friend’s photo or video
Joined or set up a new circle
Asked a question about a product I’m interested in buying
Uploaded and shared my own videos
Posted a comment about what I’m doing
Started following a new product or brand
Shared a post or article from company or brand
Shared your location
Shared a photo or video from a company or brand
Posted a positive comment about a product or brand
Posted a question or comment on a company, brand or product
Stopped following a product or brand
Posted a negative comment about a product or brand
Organised an event
18
DIGITAL CONTENT AND USERSHIP TRENDS 2015
while 55 percent of teens and 49 percent of adult Internet users have com-mented on postings in the last month. More than half have messaged a friend pri-vately. And although more than half of all Internet users have read an article or a news story, fewer than half of teens have done so, according to GWI’s Social Media Study.
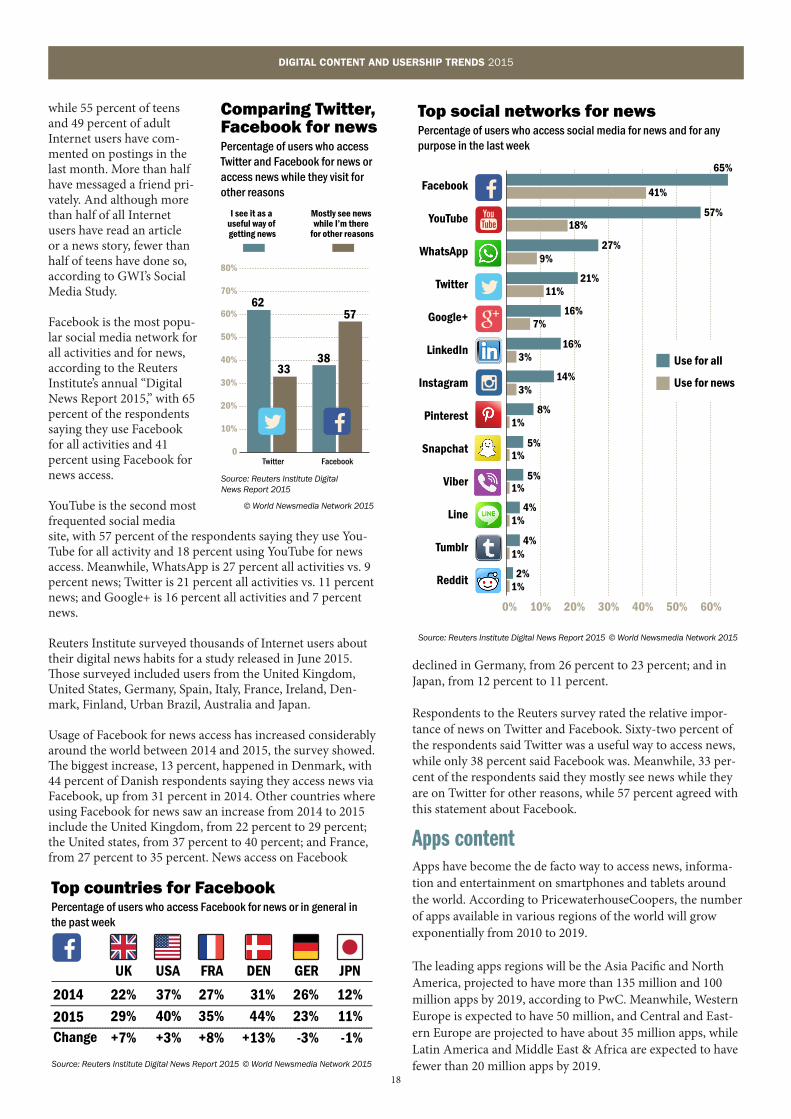
Facebook is the most popu-lar social media network for all activities and for news, according to the Reuters Institute’s annual “Digital News Report 2015,” with 65 percent of the respondents saying they use Facebook for all activities and 41 percent using Facebook for news access.
YouTube is the second most frequented social media site, with 57 percent of the respondents saying they use You-Tube for all activity and 18 percent using YouTube for news access. Meanwhile, WhatsApp is 27 percent all activities vs. 9 percent news; Twitter is 21 percent all activities vs. 11 percent news; and Google+ is 16 percent all activities and 7 percent news.
Reuters Institute surveyed thousands of Internet users about their digital news habits for a study released in June 2015. Those surveyed included users from the United Kingdom, United States, Germany, Spain, Italy, France, Ireland, Den-mark, Finland, Urban Brazil, Australia and Japan.
Usage of Facebook for news access has increased considerably around the world between 2014 and 2015, the survey showed. The biggest increase, 13 percent, happened in Denmark, with 44 percent of Danish respondents saying they access news via Facebook, up from 31 percent in 2014. Other countries where using Facebook for news saw an increase from 2014 to 2015 include the United Kingdom, from 22 percent to 29 percent; the United states, from 37 percent to 40 percent; and France, from 27 percent to 35 percent. News access on Facebook
declined in Germany, from 26 percent to 23 percent; and in Japan, from 12 percent to 11 percent.
Respondents to the Reuters survey rated the relative impor-tance of news on Twitter and Facebook. Sixty-two percent of the respondents said Twitter was a useful way to access news, while only 38 percent said Facebook was. Meanwhile, 33 per-cent of the respondents said they mostly see news while they are on Twitter for other reasons, while 57 percent agreed with this statement about Facebook.
Apps contentApps have become the de facto way to access news, informa-tion and entertainment on smartphones and tablets around the world. According to PricewaterhouseCoopers, the number of apps available in various regions of the world will grow exponentially from 2010 to 2019.
The leading apps regions will be the Asia Pacific and North America, projected to have more than 135 million and 100 million apps by 2019, according to PwC. Meanwhile, Western Europe is expected to have 50 million, and Central and East-ern Europe are projected to have about 35 million apps, while Latin America and Middle East & Africa are expected to have fewer than 20 million apps by 2019.
Top social networks for newsPercentage of users who access social media for news and for any purpose in the last week
Source: Reuters Institute Digital News Report 2015 © World Newsmedia Network 2015
65%
57%
27%
21%
16%
16%
14%
8%
5%
5%
4%
4%
2%1%
1%
1%
1%
1%
1%
3%
3%
7%
11%
9%
18%
41%Facebook
YouTube
Google+
Snapchat
Viber
Line
Tumblr
0% 10% 20% 30% 40% 50% 60%
Use for all
Use for news
Top countries for FacebookPercentage of users who access Facebook for news or in general in the past week
Source: Reuters Institute Digital News Report 2015 © World Newsmedia Network 2015
2014
2015Change
37%
40%
+3%
USA
26%
23%
-3%
GER
22%
29%
+7%
UK
31%
44%
+13%
DEN
12%
11%
-1%
JPN
27%
35%
+8%
FRA
Comparing Twitter, Facebook for newsPercentage of users who access Twitter and Facebook for news or access news while they visit for other reasons
Source: Reuters Institute Digital News Report 2015
© World Newsmedia Network 2015
Twitter Facebook0
10%
20%
30%
40%
50%
60%
70%
80%
I see it as a useful way of getting news
Mostly see news while I’m there
for other reasons
62
3338
57

19
DIGITAL CONTENT AND USERSHIP TRENDS 2015
The most popular apps belong to the gaming and social media genres, according to GWI. According to December 2014 data, 44 percent of the global Internet population used gaming apps in the last month and 42 percent downloaded a gaming app in the past month. Meanwhile, 40 percent of the Internet popula-tion used a social networking app and 25 percent downloaded a social networking app last month.News apps are growing in popularity around the world. According to the Reuters Institute report, 23 percent of all smartphone user-respondents and 19 percent of all tablet user-respondents use a news app in a given week.
News apps for smartphones are most popular in the United States and Brazil (25 percent each), United Kingdom (27 per-cent), Denmark (26 percent) and Finland (30 percent). News apps for tablets are most popular in the United Kingdom (23 percent), Brazil and Japan (24 percent each), Finland (23 per-cent) and Denmark (22 percent).
Source: PricewaterhouseCoopers, "Global Entertainment and Media Outlook: 2015-2019," www.pwc.com/outlook © World Newsmedia Network 2015
Global apps in use, 2015-2019In millions of apps worldwide and by region
2010 2011 2013 2014 2017 20192012 2014 2016 2018
150k
125k
100k
75k
50k
25k
0k
-25k
Apps in Asia PacificApps in North AmericaApps in Western EuropeApps in Central and Eastern EuropeApps in Latin AmericaApps in Middle East & Africa
Smartphone, tablet usage via news app, by countryPercentage of users who accessed content on news apps in a given week via smartphone and tablet
Source: Reuters Institute Digital News Report 2015 © World Newsmedia Network 2015
23%
19%
25%
17%
USA
18%
16%
GER
27%
23%
UK
26%
22%
DEN
30%
23%
FIN
25%
24%
BRA
22%
24%
JPN
26%
15%
IRE
17%
17%
AUS
23%
17%
FRA
17%
13%
ITA
21%
15%
SPA
Smartphone
Tablet
ALL
Global app usage, by categoryPercentage of Internet users who downloaded in last month and used in last month
Source: GlobalWebIndex, 2014 © World Newsmedia Network 2015
0%
10%
20%
30%
40%
Gam
es
Soci
al n
etw
orks
Mus
ic
Ente
rtai
nmen
t
Phot
o
Util
ities
Chat
/mes
sagi
ng
Map
s
New
s
Shop
ping
Ban
king
/fin
anci
al s
ervi
ces
Boo
ks
Trav
el
Food
/res
taur
ants
Hea
lth a
nd fi
tnes
s
Life
styl
e
Spor
ts
VolP
(i.e
. Sky
pe o
r Vib
er)
Bus
ines
s
TV a
pplic
atio
n
Loca
tion-
base
d se
rvic
es
Wor
k-re
late
d se
rvic
e
Loya
lty
Live
eve
nt
Augm
ente
d re
ality
Loca
tion-
base
d da
ting
apps
Non
e of
the
abov
e
(e.g
. Fou
rsqu
are/
Face
book
Pla
ces)
Used in last month
Downloaded in last month
20
DIGITAL CONTENT AND USERSHIP TRENDS 2015
AARP The American Association of Retired Persons (AARP) is a not-for-profit organisation in the United States with 37 million members. Its magazine is among the most circu-lated in the world and is the most circulated in the United States, at about 23 million.
AARP partnered with Krux to harness its audience con-tent data, but by focusing on its memberships’ privacy. AARP collects, organises and analyses all of its digital user data, including page views, clicks, interactions and frequency, and including all content on all screens.
The data about content usage has enabled AARP to iden-tify segments of their membership that they can build products for and communicate to; and to better monetise these segments that become more valuable when used for targeted advertising.
MeredithMeredith Corporation has an audience of 100 million, made up of mostly American women, and attracts 55 million unique visitors per month to its more than 15 websites.
Meredith used the Krux DMP to unify all of its audience databases in order to leverage all of its valuable data of women across titles and platforms. The publishing company created a unified view of its customers and their content interests, and was able to build an advertising network across all 15 websites.
Meredith now collects all of its audience data, includ-ing articles read, ads clicked and social sharing across all digital platforms. Meredith can now create audience segments in real-time and target content and advertising to these segments. The result was a 34 percent increase in revenue after three months of implementation.
Taking their audience members into the digital age
Shift from publisher-driven to consumer-driven content consumptionNewspaper and magazine companies are responding to reader and viewer demand by morphing their content production, as consumers are demanding preferred content on channels and at times of their choice.
Publishers are using tools to monitor traffic and identify con-tent usage trends to their websites, mobile and tablet apps and now, smart watches. These data inform decisions about article positioning and marketing, and even investment in more journalists in trending subject areas.
Digital management platforms are the emerging technology that capture audience analytics and target individual con-sumers in real time. The DMP platform enables publishers to aggregate, segment and make actionable user data to drive user audience engagement and revenue. The technology allows audience usership data to be captured across mobile, desktop and tablet devices.
Two such popular “DMP” companies are Krux, based in the United States, and Cxense, based in Norway.
Among the media customers for Krux are Meredith Digital, Axel Springer, The New York Times, Bloomberg, Dentsu, The Financial Times, Vice, The Telegraph, Univision, News Corporation, AARP Magazine, NBC Universal, Motor Trend Magazine, BBC, HBO, the Guardian, Gawker, Viacom and
A&E Networks. Among the media customers for Cxense are the Wall Street Journal, Styria Media, El Universo, Russ Media, Singapore Press Holdings, Polaris Media, Borsen, Metro, JP Politiken, Deseret, Bonnier, El Pais, Alma Media and South China Morning Post.
How are companies engaging with DMP technology? DMPs are allowing publishers to eliminate the middleman from their digital ad serving operations. In the ad network model, an ad-vertiser may pay US$5 per thousand advertising impressions for their campaign on a premium publisher’s site. However, the middlemen take about $3 of that, especially the network (40 percent), agency (10 percent), data providers (5 percent), ad exchange (7 percent), and ad server (5 percent). Using a DMP, publishers control their own ad networks, eliminate all of the middlemen and retain 80 percent of all ad revenue, according to Chris O’Hara, vice president for solutions for da-ta-driven marketing at Krux, speaking at the INMA Congress in New York in May 2015.
DMPs are allowing publishers to identify and execute strategic advertising and content initiatives.
Shift from print to digital content consumption continues to accelerateAs traditional media usage declines, particularly newspapers and magazines, the Internet is taking over both on the revenue and usership sides. Internet represents 24 percent of time
21
DIGITAL CONTENT AND USERSHIP TRENDS 2015
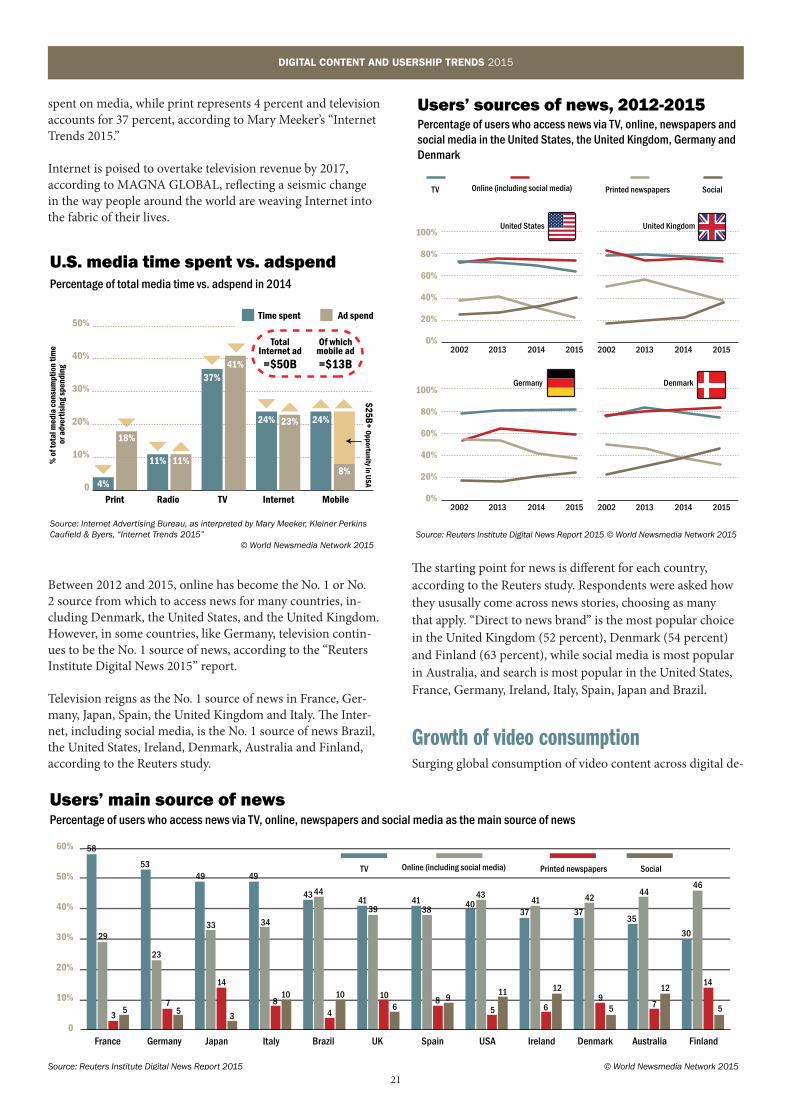
spent on media, while print represents 4 percent and television accounts for 37 percent, according to Mary Meeker’s “Internet Trends 2015.”
Internet is poised to overtake television revenue by 2017, according to MAGNA GLOBAL, reflecting a seismic change in the way people around the world are weaving Internet into the fabric of their lives.
Between 2012 and 2015, online has become the No. 1 or No. 2 source from which to access news for many countries, in-cluding Denmark, the United States, and the United Kingdom. However, in some countries, like Germany, television contin-ues to be the No. 1 source of news, according to the “Reuters Institute Digital News 2015” report.
Television reigns as the No. 1 source of news in France, Ger-many, Japan, Spain, the United Kingdom and Italy. The Inter-net, including social media, is the No. 1 source of news Brazil, the United States, Ireland, Denmark, Australia and Finland, according to the Reuters study.
The starting point for news is different for each country, according to the Reuters study. Respondents were asked how they ususally come across news stories, choosing as many that apply. “Direct to news brand” is the most popular choice in the United Kingdom (52 percent), Denmark (54 percent) and Finland (63 percent), while social media is most popular in Australia, and search is most popular in the United States, France, Germany, Ireland, Italy, Spain, Japan and Brazil.
Growth of video consumptionSurging global consumption of video content across digital de-
Users’ sources of news, 2012-2015Percentage of users who access news via TV, online, newspapers and social media in the United States, the United Kingdom, Germany and Denmark
Source: Reuters Institute Digital News Report 2015 © World Newsmedia Network 2015
2002 2013 2014 2015 2002 2013 2014 2015
100%
80%
60%
40%
20%
0%
TV Online (including social media) Printed newspapers Social
United KingdomUnited States
2002 2013 2014 2015 2002 2013 2014 2015
100%
80%
60%
40%
20%
0%
DenmarkGermany
18%
U.S. media time spent vs. adspendPercentage of total media time vs. adspend in 2014
Source: Internet Advertising Bureau, as interpreted by Mary Meeker, Kleiner Perkins Caufield & Byers, “Internet Trends 2015”
© World Newsmedia Network 2015
0
10%
20%
30%
40%
50%
4%
Time spent Ad spend
% o
f tot
al m
edia
con
sum
ptio
n tim
e o
r adv
ertis
ing
spen
ding
Internet
24% 23%
TV
37%41%
Radio
11% 11%
Mobile
24%
8%
TotalInternet ad
=$50B
Of whichmobile ad=$13B
$25B+ O
pportunity in USA
Users’ main source of newsPercentage of users who access news via TV, online, newspapers and social media as the main source of news
Source: Reuters Institute Digital News Report 2015 © World Newsmedia Network 2015
TV Online (including social media) Printed newspapers Social
0
10%
20%
30%
40%
50%
60%
France Germany Japan Italy Brazil UK Spain USA Ireland Denmark Australia Finland
58
29
35
53
23
75
49
33
14
3
49
34
810
43 44
4
10
4139
106
4138
8 9
4043
5
11
3741
6
12
37
42
95
35
44
7
12
30
46
14
5

22
DIGITAL CONTENT AND USERSHIP TRENDS 2015
vices is driving demand for publishers to produce high-quality video, which is opening the floodgates for high cost-per-thou-sand (CPM) advertising.
Billions of videos are viewed each day on a variety of digital devices, including short-form, long-form, television episode and movie-length videos, according to the “2014 Global Video Index” by video analytics firm Ooyala. The video genres are endless: news, arts, entertainment, sports, brand, do-it-your-self, educational and more. The opportunities to exploit video
as a traffic driver and a revenue producer is staggering.
Watching entertainment video clips online is an area that as grown exponentially from 565 million users in 2013 to 604 million users in 2014 worldwide, according to GlobalWebIn-dex’s report, “GWI Entertainment,” published in December 2014. Meanwhile, the number of people who watched a full-length film online grew from 408 million in 2013 to 444 million in 2014. The number of Internet users who watched television shows on demand grew from 379 million in 2013 to 408 million in 2014.
When looked at from another perspective, Internet users prefer watching videos, full-length films, on demand television shows and live streamed television shows on their PCs, three-to-one or two-to-one over their tablets, and slightly more than their mobiles, according to the same study by GlobalWebIn-dex.
The most common length of video people watch tends to be in the one to three minute range, across all devices. However, the largest category for share of time watched by online video viewers across devices is 10 minutes or more, according to Ooyala’s “Global Video Index” study in Q3 2014.
While publishers are still tweaking their optimal lengths for video production, studies have shown how much time is actually spent on short videos versus long videos, across all platforms.
According to the “Video Index Report,” the generalised con-clusion is, the larger the screen, the more time spent viewing longer-length video. For example, longform, or “premium” content is by far the most popular on Internet-connected television, with 80 percent of the viewers’ time spent on video longer than 10 minutes.
Connected or Internet TV (CTV) is traditional TV that is connected to the Internet with or without a peripheral de-vice, such as a video console or cable box. Meanwhile, tablet viewers spent 68 percent of their video time on videos of 10 minutes or more. And mobile viewers spent the least amount of time on long-form video and the most amount of time on
Starting points for newsPercentage of users who access news directly, or via search, social media, email and mobile alerts
Source: Reuters Institute Digital News Report 2015© World Newsmedia Network 2015
52% 36% 27% 26% 44% 54% 63% 20% 36% 15% 46% 33%
32% 40% 40% 45% 46% 29% 26% 66% 54% 54% 52% 49%
28% 35% 21% 20% 36% 38% 28% 33% 35% 14% 48% 41%
10% 25% 21% 15% 9% 24% 9% 17% 14% 15% 23% 20%
10% 13% 14% 9% 9% 9% 7% 7% 8% 7% 11% 9%
USA GERUK DEN FIN BRAJPNIRE AUSFRA ITA SPA
Direct to news brand
Search
Social media
Mobile notifications and alerts
565
472
454
408
379
326
322
280
273
604
515
499
444
408
346
348
305
300
2013 2014
Watched a video clip
Played an online game
Listened to music ona streaming service
Watched a full length film
Watched TV showson demand (not live)
Listened/watcheda podcast
Listened to LIVEradio online
Watched a full-lengthsports programme
Streamed a fulllength TV show live
Global growth of online entertainment access, 2013 to 2014
Source: GlobalWebIndex, “GWI Entertainment,” December 2014
In millions of users
© World Newsmedia Network 2015

23
DIGITAL CONTENT AND USERSHIP TRENDS 2015
video shorts, compared to the plat-forms with larger screens.
“Viewers watched video exceeding an hour in length [four times] more on connected TVs than on tablets, and almost [10 times] more than on mobile phones,” according to the global study.
The study shows that while videos under one minute and especially between one and three minutes are by far the most dominant in length, the videos of 10 minutes or more by far represent the highest share of time watching videos on all devices, especially Internet connected tele-vision, followed by tablets, desktop computers and smartphones. While these figures suggest actual time spent and are not an outright poll of users, these data suggest users are accessing shorter video of under three minutes most of the time, but are still investing most of their time watching videos of more than 10 minutes.
These data corroborate the sentiment from editors around the world: that length of video should be appropriate to the subject matter, but that users are willing to invest the time in video if the subject matter and quality are worth it. Mobile and tablet video plays surpassed 30 percent in late 2014, and is growing more than 20 percent each quarter, ac-cording to Ooyala’s Global Video Index report. The trajectory is expected to continue for the foreseeable future, as con-
Internet activities, by deviceIn percent of global Internet users who participated at least once per month in the following
activities, by device
Source: GlobalWebIndex, 2014 © World Newsmedia Network 2015
Watched a video clip
Played an online game
Watched a full length film
Listened to music on a music streaming service
Watched television shows on demand (not live)
Listened to LIVE radio online
Watched a full length sports programme
Listened to/watched a podcast
Streamed a full length TV show live
0% 10% 20% 30% 40% 50% 60% 70%
PC
Tablet
Mobile
Source: Ooyala, “Global Video Index Q3 2014”
Global engagement with video, by device
© World Newsmedia Network 2015
Share of plays by device and video length
Share of time watched by device and video length
Q3 2014
50%
25%
0%Desktop Phone Tablet CTV
Q3 2014
90%
45%
0%Desktop Phone Tablet CTV
0-1 minutes 1-3 minutes 3-6 minutes
6-10 minutes 10 minutes or more
Source: Ooyala, “Global Video Index Q3 2014”
Global longform video consumption
© World Newsmedia Network 2015
In share of time watched by device, and video length
60%
40%
20%
0%Desktop Phone Tablet CTV
Q3 2014
10-30 minutes 30-60 minutes 60 minutes or more

24
DIGITAL CONTENT AND USERSHIP TRENDS 2015
sumers spend more time on their mobile devices than their desktop and laptop PCs.
Video news consumption is growing across the world. From 2014 to 2015, online news users participating in the Reuters Institute Digital News 2015 study reported how they con-sumed news video in the last week. Respondents from the United States represented the only country where numbers remained stable at 30 percent in 2014 and 2015.
Meanwhile, other countries’ news video consumption grew:
Spain, from 17 percent to 27 percent; Italy, from 20 percent to 25 percent; Finland, from 18 percent to 22 percent; the United Kingdom, 16 percent to 21 percent; France, 15 percent to 19 percent; Denmark, 10 percent to 18 percent; Germany, 16 per-cent to 18 percent; and Japan, 10 percent to 15 percent. Three countries added to the survey in 2015 reported high video news consumption last week: Australia, 28 percent; Ireland, 27 percent; and Brazil, 26 percent.
Video viewing on Facebook grew exponentially between Q3 2014 and Q1 2015, from 1 billion to 4 billion video views per
Source: Ooyala, “Global Video Index Q3 2014”
Mobile+tablet plays surpassed 30% share in Q3, and maintains a 20% quarter-over-quarter growth
Smartphone, tablet share of video plays
© World Newsmedia Network 2015
Percent of global mobile video plays vs. online PC and television, 2012-2014
35%
30%
25%
20%
15%
10%
0%
JAN2012
SEP2012
MAY2013
JAN2014
SEP2014
Share of mobile video plays
News video consumption, by countryPercentage of users who consume news video, 2014 to 2015
Source: Reuters Institute Digital News Report 2015 © World Newsmedia Network 2015
USA GermanyUK DenmarkFinland FranceItalySpain
0
5%
10%
15%
20%
25%
30%
Japan
2014 2015
30 30
17
27
20
22
18
21
16
19
15
18
10
18
1615
10
25
Global Facebook video usagePercentage of Internet, mobile and smartphone users, 2008-2015
Source: Facebook, as reported by Mary Meeker, Kleiner Perkins Caufield & Byers, “Internet Trends 2015” © World Newsmedia Network 2015
Billi
ons
of vi
deo
view
s pe
r day
5
4
3
2
1
0Q3:14 Q4:14 Q1:15
50%+ Facebook DAUs =Watch 1 or more videosdaily, USA
53% of views = from shares
75% = on mobiles
Number of video views per day on Facebook, Q3 2014 to Q1 2015
Facebook video stats
25
DIGITAL CONTENT AND USERSHIP TRENDS 2015
day, mostly resulting from its video autoplay feature, and the ensuing high engagement from users. Because videos on Facebook have contributed to an increasing amount of traffic being driven to their websites, publishers have answered the trend by posting more videos to Facebook to promote their stories.
Change from whole issue consumption to article consumptionPrint media companies’ most basic atomic particle is the article. A headline, photos, infographics, text and references to content on digital platforms may accompany that article to form a multimedia pack-age. Atomisation seeks to unbundle the package into bite-sized bits.
Digitial media users’ habits are driving the need for breaking down content into smaller chunks: standalone headlines, Tweets, blogs, photos, videos, infographics, listicles and small bits of content culled from much larger articles.
The atomisation of content is gaining popularity in media companies, with the objectives of virality and engagement in mind. Atomising creates smaller nuggets of information that can be shared, dis-cussed and remixed with other content.
“To be a relevant media company means to under-stand how to reframe content atomically – to make it easier to share, repost, and append to other articles. This is by no means an easy endeavour, but provides for a range of opportunities,” stated the description of a panel discussion at SXSW media conference in Aus-tin in April.
Cir.ca, which was the in-novator in atomised news storytelling on mobile, shut down its news oper-ation in June 2015. While the start-up was unable to secure additional venture funding or to monetise its mobile content busi-ness with advertising, Cir.ca left behind a legacy of delivering stories in a new way: in bite-sized chunks rather than full narratives, in a way that was more palatable and “finishable” by media consumers. While its news service will shut down, Cir.ca plans to
sell its technology to enable news atom-serving technology to media customers. Media companies such as Yahoo!, the Econ-omist and Reddit are experimenting with atomised content by Cir.ca. Only five years ago, bookmarking and direct-to-homepage visits were by far the means by which readers accessed news-paper and magazine websites. Now social media and search are the predominant access points for these sites.
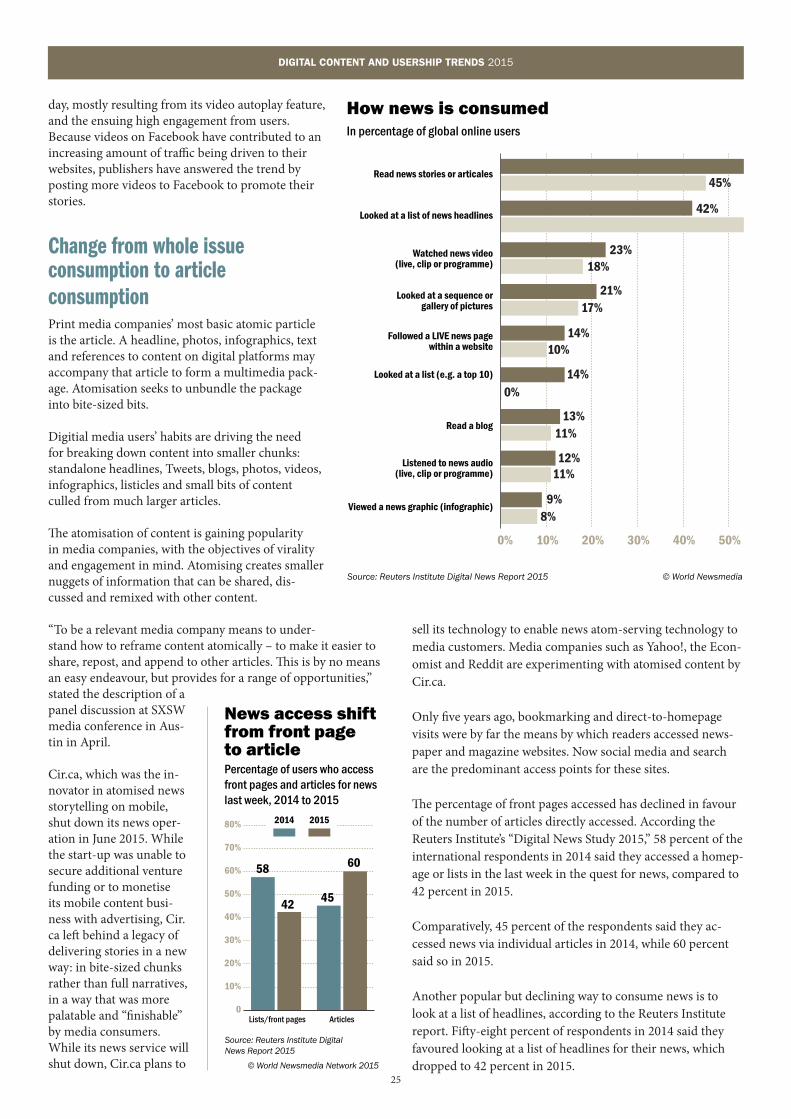
The percentage of front pages accessed has declined in favour of the number of articles directly accessed. According the Reuters Institute’s “Digital News Study 2015,” 58 percent of the international respondents in 2014 said they accessed a homep-age or lists in the last week in the quest for news, compared to 42 percent in 2015.
Comparatively, 45 percent of the respondents said they ac-cessed news via individual articles in 2014, while 60 percent said so in 2015.
Another popular but declining way to consume news is to look at a list of headlines, according to the Reuters Institute report. Fifty-eight percent of respondents in 2014 said they favoured looking at a list of headlines for their news, which dropped to 42 percent in 2015.
News access shift from front page to articlePercentage of users who access front pages and articles for news last week, 2014 to 2015
Source: Reuters Institute Digital News Report 2015
© World Newsmedia Network 2015
Lists/front pages Articles0
10%
20%
30%
40%
50%
60%
70%
80% 2014 2015
58
42 45
60
How news is consumedIn percentage of global online users
Source: Reuters Institute Digital News Report 2015 © World Newsmedia Network 2015
Read news stories or articales
Looked at a list of news headlines
Watched news video(live, clip or programme)
Looked at a sequence orgallery of pictures
Followed a LIVE news pagewithin a website
Looked at a list (e.g. a top 10)
Read a blog
Listened to news audio(live, clip or programme)
Viewed a news graphic (infographic)
0% 10% 20% 30% 40% 50% 60%
60%45%
58%
18%
17%
10%
0%
11%
11%
8%
42%
23%
21%
14%
14%
13%
12%
9%


39
GLOBAL SOCIAL MEDIA TRENDS 2015
the worldwide magazine media associationwww.!pp.com/Insight