


Fintech and Financial Big Data Analytics - WRDS · •Marketing (macro payments) •Disruptive to...
132
Fintech and Financial Big Data Analytics Rabih Moussawi Villanova School of Business, Finance Department Wharton Research Data Services, the Wharton School
Transcript of Fintech and Financial Big Data Analytics - WRDS · •Marketing (macro payments) •Disruptive to...
Fintech and Financial Big Data Analytics
Rabih Moussawi
Villanova School of Business, Finance Department
Wharton Research Data Services, the Wharton School

Skillset for a successful career Finance in 2018
• A well paying career in finance now requires a lot of technical skills
• Very quantitative: Math + statistical modeling
• Database knowledge: Traditional and New (Alternative) data
• Programming: R and Python are predominant languages
• Financial theory is still important, but not enough anymore

Unprecedent wave of innovation!
• Part 1: FinTech • “Fintech” a new wave of technological innovations is impacting a wide array of
financial services
• Fintech leverages the explosion of big data on individuals and firms
• Data Big Bang: Big Data / Alternative Data and AI/ML techniques to analyze it
• Part 2: Simplistic Example of Big Data Analytics• Intro to NLP/computational linguistics literature: basic concepts & terminology
• Intro to SEC Filings: huge regulatory repository + major source of financial/acct data
→ Tons Financial and Accounting applications: Similarity/cosine, clustering, machine learning, etc.

• The effect of Fintech disruption is becoming more visible (recall Blockbuster and Borders?)
• Zelle commercials instead of Bank of America!
• https://www.wsj.com/articles/banks-double-down-on-branch-cutbacks-1517826601?mod=searchresults&page=1&pos=10
What’s FinTech?
• A blanket term for disruptive technologies affecting the financial services industry.
• Describes the intersection between software and technology to deliver financial services.
• May refer to technical innovation applied in a traditional financial services context or to innovative financial services offerings that disrupt the existing financial services market.
• Technological developments and increased interest from new players is leading to a fundamental re-imagining of the processes and business model of the financial services industry.

FinTech Investment Trends
• Accelerating growth, with Fintech firms raising $5.19 billion from 251 deals in the three months ending in June 2017 (up from $3 billion for the same period the year before)
• As a search term, “fintech” has risen 1,300% on Google over the past year.
Sources of FinTech Room for Growth
• Entrenched banking system, with inefficient infrastructure that is difficult to overcome, which makes upgrades to the system difficult
• Outdated customer experience, that is not taking full advantage of: • Mobile connectivity: personalized, customizable and accessible
• Cost effective operational structure
• More efficient information sharing and contract management
• New Players leverage electronic data in innovative ways to create better, more customized, and more accessible digital financial inclusion

Disruption through innovation is inevitable
• More Efficiencies
• Cheaper Solutions
• Profitable Ideas

Blockchain revolution
• While trading has become increasingly more efficient, post-trade still relatively labor intensive in some markets
• Scope for improvements = Settlement Blockchain?
https://www.fnlondon.com/articles/top-hedge-fund-aqr-leads-the-way-as-blockchain-comes-of-age-20171120


Common theme: Automation through Technology Solutions• Mostly about automation of existing processes
• AI and Deep Learning enable greater level of automation• Tons of Data everywhere: unstructured data → use AI and Machine Learning to automate data analysis
• Fintech startups are stepping in between banks and their customers• Online Banks + Peer-to-peer lenders + Crowdfunding
• Payment services are going mobile
• Blockchain is streamlining processes throughout financial institutions
• Fintech start-ups are distributing insurance plans without using agents
• Robo-advisers are replacing human wealth advisors: ETF Revolution!
• Big Data: AI and Deep Learning enable greater level of automation eg. IBM Watson, Siri, Alexa, etc.

Blockchain
• Blockchain/Distributed Ledger is a technology that maintains a database between many participants without the need for a third party or reconciliation. It is a secured distributed ledger that holds a constantly expanding list of transaction record that are protected from modification and tampering.
• Revolutionary Technology: • really good for all ledger type transactions (trading, settlements, etc)• Blockchain has the potential to significantly reduce bank payments, securities trading and compliance costs
(about $20bn of annual savings are expected by 2022). E.g. R2 CEV
• CryptoCurrency: Bitcoin, Litecoin, Ethereum, etc might constitute currencies if the trading in them is regulated; also raises AML issues• Bitcoin is an open trustless network
• Industry applications focus on implementation of blockchain solutions in a closed and trusted network (known entities + restricted access)

Blockchain example

Cam Harvey’s “Concise” Blockchain Overview: https://vimeo.com/211662057Cam Harvey’s webpage at Duke: http://people.duke.edu/~charvey/
Blockchain Disruption
• Disruptive to finance and other fields:• Supply chain mechanics• Accounting: challenges to auditors• Marketing (macro payments)
• Disruptive to existing payment systems
• Not all blockchains are the same: different technologies and implementations (flawed Private block chains).
• Blockchain makes it impossible to counterfeit a digital currency: most important value (digital currency was introduced in the 1980s)

Are Cryptocurrencies Real Investments?
• Not suitable to store value
• Suitable for payments, transactions, and transfer of capital/wealth
• Substitute technology for gold and other precious materials, but lower transfer frictions (transaction costs lower than costs of transporting physical gold, or the 3% wire transfer fees)
• Powerful: can’t fully ban it because you can’t fully shut the internet
• Main objective now: circumvent capital controls • E.g. Capital flight from China due to local bank insolvency
• Going forward, capital controls would not be possible. Primarily due to blockchain…

From Transnational Cryptos to National Cryptos
• Microstructure issues:• Volatility + Transaction costs of bitcoin: .5 to $50• Traffic jams on the block chain. Scaling issues —> forks incidence• Exchanges of crypto currency: no protections and solvency issues• Might produce instability in its asset class and others• Exchange entities are unbanked/unbacked + Hacking/cybersecurity issues
• Solution: collateralize digital currency
• National cryptos: allow everyone to be banked directly with central bank. Circumvent bank runs and fractional reserve system

Four Ideas Bringing Computer Science into Finance
1. No trust is required: use innovation to value trust
2. New framework to value cryptocurrency
3. Correlation with existing factors: what would happen in a crises. Hedging properties. Risk of investing in cryptos (volatility) but equally interesting to look at correlation
4. Implications of Transaction costs going to zero: new classes of assets (pieces of traditional assets). → broaden portfolio optimization. Allowing everyone to be banked with own banks (2 billion people currently unbanked)

Signs of a Bubble?

Crypto Bubble?
• Difficult to gauge true fundamental value, but consensus that blockchain is valuable as a technology (i.e. medium to transact), and not as an investment class (i.e. to store value)
• Recent anecdotal evidence suggests a potential bubble, at least as of December 2017: e.g. https://www.nytimes.com/2017/12/21/technology/bitcoin-blockchain-stock-market.html?_r=1
• Excellent read on Bitcoin: Steven Johnson, “Beyond the Bitcoin Bubble,” NYT Jan 16, 2018 https://www.nytimes.com/2018/01/16/magazine/beyond-the-bitcoin-bubble.html

Revolution in the Insurance Industry
• Shift from Sales-based to Information-based
• The distribution of traditional insurance is especially inefficient because it relies on sales agents• 35,000 insurance agencies in the US with customers spending more than $25billion/year in agent
commissions• About 35% of insurance premiums are spent on costs, fees, and profits
• Insurance is increasingly commoditized and distributed online
• Cutting out sales agents will make the distribution process more efficient
• This could create cost-savings for insurance companies, which is then passed on to consumers
• Access information through creative technological solutions: e.g. Progressive Snapshot driving monitor (mobile app or plugin device)

Asset Management Shakeup
• Robo-adviser is the automated management of investments which doesn’t require a human advisor.• automated financial advice (computer based algorithms and decision trees)
• may be subject to adviser registration/regulation
• Examples: Nutmeg

Robo-Advisors and ETFs
• Go hand in hand: biggest innovation in decades
• Why? More (cost and tax) efficient! • Take advantage of innovative more efficient products (such as ETFs) and the
larger shift into cheaper index products
• Remove brokers but still generates solid returns, at a fraction of the cost
• Customizable, personalized, less idle cash, lower fees, & lower minimums
• Roboadvisers are growing more quickly than traditional players
2
years
1
$1 billion
years
1 2 3 4 5 6
$1 billion

ETFs: Fascinating innovation!!
• ETFs have been one of the most success stories in finance in recent times
• ETF = mutual fund + trade on stock market → more liquid than underlying basket→ but ETF Price ≠ Value of basket
• ETF are cheaper than mutual funds
• Most ETFs are index products
ETFs used by Robo-Advisors: Robo Advisors Take On Wall Street

ETF Products
• Various Exposures
• About 60% of ETFs are tracking US stocks, including about 15% tracking specific industries/styles
• 20% track International Stocks
• The rest are tracking bonds and other asset classes
• Inverse and leveraged ETFs are dangerous products!

ETFs growth: accelerating inflows
• Main ETF Families• iShares• Vanguard • State Street: Spiders or
SPDR
• Three main considerations for ETF investing
1. High ETF assets under management
2. Low expense ratio3. Physical ownership of
underlying stocks/bonds etc

Not All ETFs are Alike!
• ETNs invest in futures and not in stocks
• ETNs are very risky, and are not suitable long term investment products
• Beware, especially of exotic ETF/ETN products


Six Elements for a Smarter Company
Finally, we’re going through a change in the “climate” of technologyand work. We’re moving into a world where computers and algorithmscan analyze (reveal previously hidden patterns); optimize (tell a planewhich altitude to fly each mile to get the best fuel efficiency);prophesize (tell you when your elevator will break or what yourcustomer is likely to buy); customize (tailor any product or service foryou alone); and digitize and automatize more and more products andservices. Any company that doesn’t deploy all six elements will struggle,and this is changing every job and industry.
Thomas Friedman, New York Times, September 27th 2017

The Digital Universe doubles in size every 2 years
https://www.emc.com/leadership/digital-universe/2014iview/executive-summary.htm

Big Data Revolution
New Datasets
Internet of Things, Satellites, Mobile
Phones, Social Media, Images, News, etc.
Computing
Parallel/Distributed
Cheap Memory
Cloud Computing
Methods of Analysis
Machine Learning
Deep Learning
Artificial Intelligence

Big Data and Machine Learning Revolution
• Vast amount of data generated: informational advantage!• Higher frequency: monthly/quarterly to millisecond• Continuous flow of textual data contents: news, reports and other unstructured data• Massive amount of new data types: Big or Alternative data
• HFTs & Algos : monetizing faster/smarter reaction to new information• The quants run Wall Street now: https://www.wsj.com/articles/the-quants-run-wall-street-now-1495389108• How a trading Algo actually works: https://www.wsj.com/graphics/journey-inside-a-real-life-trading-algorithm/
• Increase in computing power capacity + cheaper storage + advancement in machine learning and open source algorithms
→Machine Learning to systematically analyze unstructured data
→Informational advantage of Big Data: the ability to collect large quantities of data and analyze them accurately in real time

Which Data is Big?
• Big Data has three characteristics:
1. Volume: The size of data collected and stored through records, transactions, tables, files, etc. is very large with the subjective lower bound for being called ‘Big’ being revised upward continually
2. Velocity: The speed with which data is sent or received often marks it as Big Data. • Data can be streamed or received in batch mode • it can come in real-time or near-real-time
3. Variety: Data is often received in a variety of formats • Structured (e.g. Records/ Transactions, SQL tables, XML, or CSV files) • Semi-structured (e.g. JSON or HTML) • or Unstructured (e.g. textual filing, report, news, blog post or video message)

Types of Big Data
• Human Generated • Data generated by individuals, and made more frequent with mobile connectivity• E.g. Social media (Twitter, Facebook, LinkedIn), product reviews (Yelp, Amazon), search trends
(Google Search Trends, Domestic Trends), etc.
• Process Generated• Data generated by business processes • Leading indicators for corporate metrics (future sales, earnings, capital expenditures, etc)• E.g. credit card data, commercial transaction records, shipping activities, order book, supermarket
scanner data, supply chain data, etc.
• Machine Generated • Data generated by sensors• Monitoring economic activities (construction, shipping, commodity production) and track traffic• E.g. satellite imaging, geolocation (mobile phones), foot and car traffic, etc.

Example: Data used by Retail Sector Analyst
• Forecast store specific sales data• Satellite imaging of parking lots• Volunteered customer geolocation data• E-receipts in customers’ inboxes• Tweets• News releases• Shipping containers from suppliers• Credit card data
• Different sources have different latencies, attributes, and predictive powers

https://spaceknow.com/
https://orbitalinsight.com


https://www.forbes.com/sites/hollieslade/2014/09/26/heres-how-slice-is-monetizing-over-two-million-peoples-every-online-receipt/#7891bb4768a6


Ravenpack

FinTech Sandbox is a Boston-based nonprofit that drives
global FinTech innovation and collaboration.


Machine Learning
• Machine Learning enables analysis of large and unstructured datasets
• Objective: enable computers to learn from their experience in certain tasks• A self-driving car, for example, learns from being initially driven around by a human driver. As it drives itself, it
reinforces its own learning and gets better with experience
• Types: • Supervised Learning (regressions, classifications): uncovering relationships between variables to predict future
outcomes
• Unsupervised Learning (factor analysis, clustering): statistical or data-driven analysis to recognize patterns in large data
• Artificial Neural Networks: novel techniques of Deep Learning using multi-layered networks to analyze unstructured data → most serious attempt, so far, to achieve Artificial Intelligence
• Deep Learning achieves recognition accuracy at higher levels than ever before• Already used in speech recognition (Siri, Amazon’s Echo and Google Home)• Key technology behind driverless car: accurately “recognize” and distinguish a pedestrian from a lamppost

Classification of Machine Learning Techniques

Big Data Workflow in Finance

Kensho – applying AI in corporate/government settings

Example of AI Deployment in the Banking Industry

Exponential Data Growth: mostly textual
Need to automate both:1. Quantifying “alternative” data2. Data analysis: big/alternative data

From Bag of Words to Deep Learning• Machine Learning: SVM/feature reduction/ Lasso / Ridge / Random
Forest…
• Deep Learning = Artificial Neural Networks

Unstructured Approach: Python demos
The Deep Learning Course by Google
• Google Research Initiative: https://research.googleblog.com/2016/01/teach-yourself-deep-learning-with.html?m=1
• Deep Learning Platform: https://www.tensorflow.org/
• Deep Learning Course: https://www.udacity.com/course/deep-learning--ud730
• Yes, it’s completely Free!!
But, in Finance…
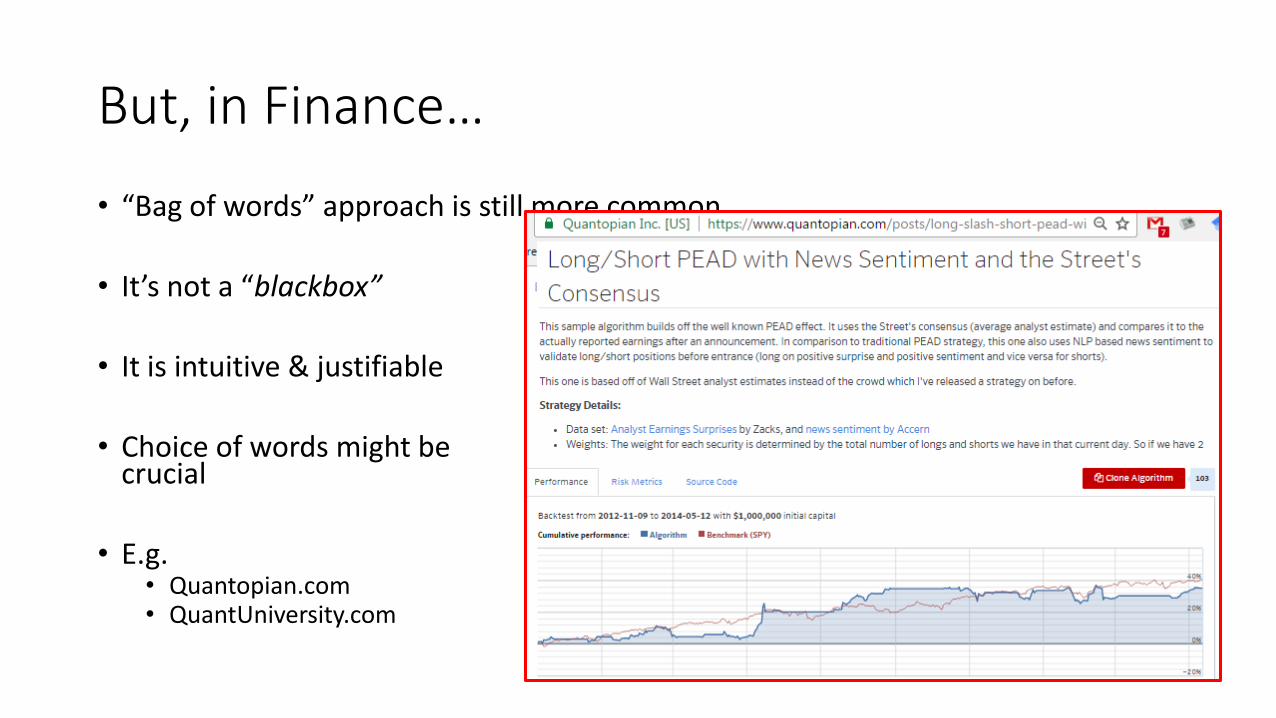
• “Bag of words” approach is still more common
• It’s not a “blackbox”
• It is intuitive & justifiable
• Choice of words might be crucial
• E.g. • Quantopian.com • QuantUniversity.com

Financial Sentiment Analysis Background and Simple Example
Rabih Moussawi, Ph.D.
Villanova School of BusinessFinance Department

Topics
• Introduction to Financial News and Textual Analytics
• Foundations of Sentiment Analysis
• Financial Lexicon: Essential Step for Financial Applications
• Overview of Corporate Regulatory Disclosures and SEC Filings Repository
• Demo of SEC’s EDGAR and WRDS SEC Analytics database
• Application: Sentiment Analysis on Valeant Pharmaceuticals’ SEC Filings

Introductory clips on Sentiment Analysis
• Dan Jurafsky: Stanford Professor and a leading expert in computational linguistics• https://www.youtube.com/watch?v=nfoudtpBV68&list=PL6397E4B26D00A26
9• Lecture on Introduction to Sentiment Analysis:
https://www.youtube.com/watch?v=sxPBv4Skj98&index=33&list=PL6397E4B26D00A269
• Ronen Feldman: Hebrew University Professor and a pioneer in text mining• Wolfram Alpha lecture on applications of sentiment analysis in Finance and
Marketing: https://www.youtube.com/watch?v=QXlCAFPtmbg

Sentiment Analysis: basic intro
• Sentiment Analysis is to extract and identify the polarity of sentiments expressed in texts: positive vs. negative
• Sentiment analysis is a subfield within:• Textual analysis• Natural language processing• Content analysis• Computational linguistics
• Increased interest attributable to:• Bigger, faster computers → faster processing of data (HFTs)• Availability of large quantities of text → better interpretation of information• New technologies derived from search engines → improve quality of information

Computer Trading on News: THOR vs. HTWR• April 4th, 2012: FDA announces that Thoratec recalls its Heartmate II left ventricular
assist system
• Heartware is a competitor…
Approximately 20% of hedge funds use news data.

Textual Analysis in Finance
• “Flash boys” era• High Frequency Trading and Lightening-fast news analysis tools to take
advantage on new info with very low latency (in milliseconds)• Investors who are more resourceful at finding and analyzing the news have
always had an edge, and now it is done at faster speeds
• Automatic analysis of news and textual information of companies, regardless of the source• Automate news analysis: Contents and Tone• Measurement of qualitative and quantitative attributes of these news:
• Major attributes: Sentiment, Relevance, Novelty• Other attributes: entity recognition, event categories, etc.

Examples of Data Sources• Corporate Reports
• SEC’s EDGAR: 1994-2015, 15+ million filings, annual and quarterly reports• Regulatory disclosures: annual and interim filings (10-K and 10-Q), correspondences,
IPO registration statements, etc.• Company Announcements: Websites, SEC 8-K filings, news feeds
▪ News: Newswires, articles, blogs…• WSJ News Archive: XML encapsulated, 2000 - present• SEC’s Current Report filings (8-K): any material new information• Audio transcripts of conference calls by top executives, earnings announcements..• Analyst ratings and research reports, investor surveys, investors’ activism campaigns
• Social Media, other sources• Twitter, Stocktwits, message boards, websites• Google searches (Google Analytics)• Patent Applications: http://patft.uspto.gov/netahtml/PTO/search-adv.htm and
https://patents.google.com/

Getting financially “sentimental”• Sentiment Analysis is to extract and identify the polarity of sentiments expressed in
texts: positive vs. negative
• Quantifying textual information (as numbers) permits trading on changes in these numbers
• Objective is not only “blazing speed”, but unearthing “additive” information and interpreting it accurately and “without behavioral biases” to predict future trends• Lately sentiment analysis has been widely applied to analyze news and trade based on
information available in unconventional sources virtually anywhere: news, articles, reviews/opinion, blogs, twitter, and regulatory documents
• High frequency Trading Algorithms vs. Low Frequency Investment Strategies
• Implications on Market Efficiency: Can machines outsmart humans? Will market prices more accurately and efficiently incorporate news and information that affect the true fundamental value of the stock?

Recent Linguistics-based research in Finance• Corporate disclosures in annual reports (10-K/10-Q): Demers and Vega (2010), Li
(2006), Li (2008), Li (2010), Loughran and McDonald (2011), Balakrishnan Qiu and Srinivasan (2010)
• Press releases and 8-K: Davis et al. (2007), Henry and Leone (2009)
• Media news such as Wall Street Journal and Capital IQ Key Development: Tetlock(2007), Tetlock Saar-Tsechansky and Macskassy (2008), Core, Guay and Larcker(2008)
• Internet message boards, twitter etc: Antweiler and Frank (2004), Das and Chen (2007)
• Conference call transcripts: Larcker and Zakolyukina (2011)

Major News Analytics Data Feeds used by HFTs
Thomson Reuters NewsScope Analytics Equity coverage and available data(i) Coverage(ii)Equity: All equities ............................34,037
(100.0%?)Active companies ................32,719 (96.1%)Inactive companies............. 1,318 (3.9%)
Equity coverage by region
Americas: ...............................14,785APAC: .....................................11,055EMEA:.......................................8,197
History: Available from January 2003
RavenPack News Analytics (based on Dow Jones Newsfeed)Equity Coverage by RegionAll equities...................................28,279 (100%)Americas: ...................................11,950 (42.24%)Asia: ............................................8,858 (31.31%)Europe:...................................... 5,859 (20.71%)Oceania: ....................................436 (5.08%)Africa: .........................................186 (0.66%)
Archive Range: Since Jan 1, 2005
Classification of News + Scoring News Impact+ Others: Predictive Signal, MarketPsych,
Capital IQ Key Developments, etc…
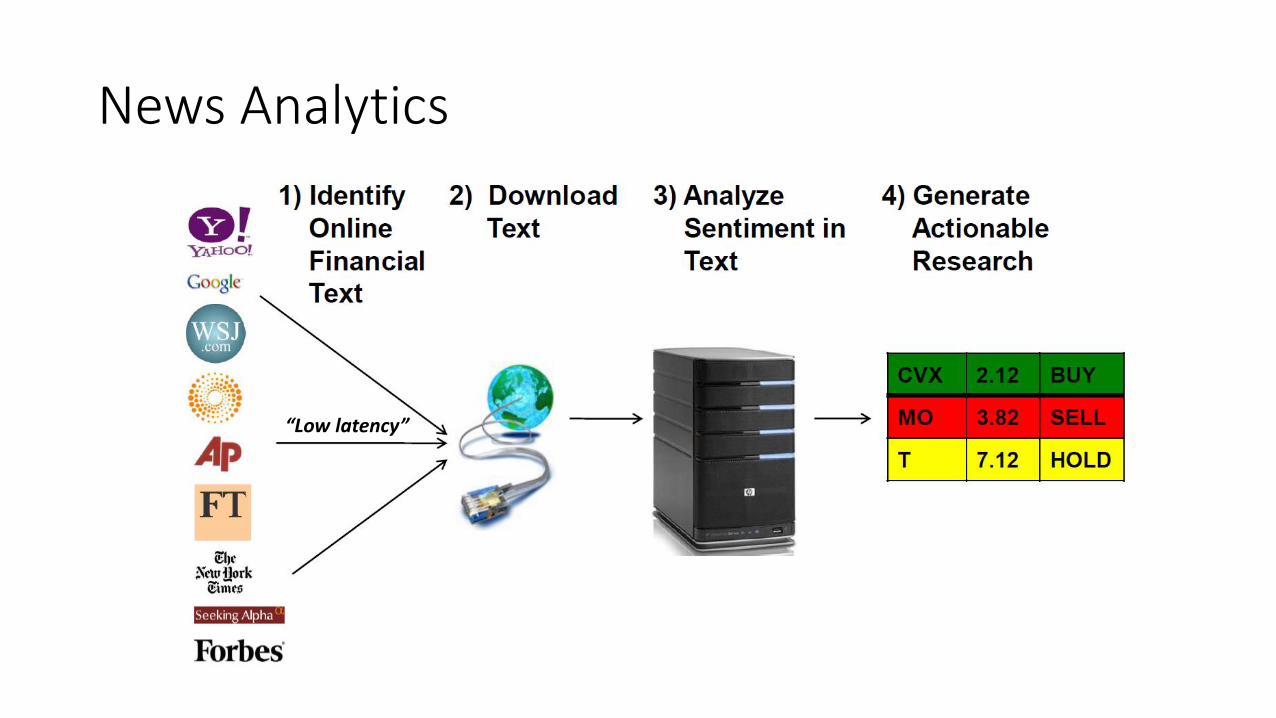
News Analytics
“Low latency”

Challenges to Sentiment Analysis1. Judgement of sentiment (existence, degree/granularity) is not clear-cut
2. Signal vs. Noise: Legal jargon in corporate disclosure that are written by lawyers, auditors…
3. Sentiments are dependent on the domains and contexts (e.g. “developments”)
4. Sentences with negations (“not”, “no”, “__n’t”, “did not benefit”, “not downgraded”,…)
5. Sentences with comparatives (“A is better than B, but still have problems”)
6. User texts contain spelling errors, irregular typography (e.g. emoticons), and ungrammatical sentences
7. Words/expressions that imply sentiments are subtle (sentiment lexicon)
8. Attempts by managers to obfuscate the text with less readable contexts: can be a signal by itself
9. Multiple sentiments could be expressed in one sentence/document
10.Possibility of sarcasm

Textual Analysis:
How?
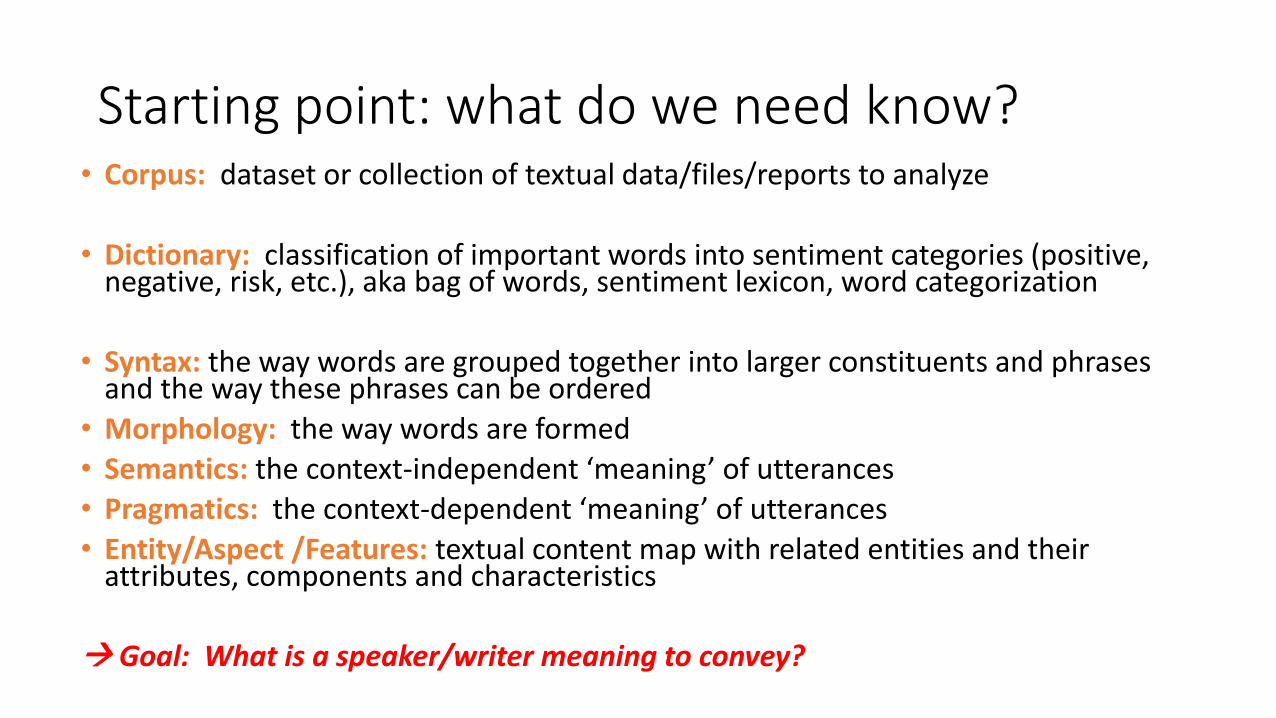
Starting point: what do we need know?• Corpus: dataset or collection of textual data/files/reports to analyze
• Dictionary: classification of important words into sentiment categories (positive, negative, risk, etc.), aka bag of words, sentiment lexicon, word categorization
• Syntax: the way words are grouped together into larger constituents and phrases and the way these phrases can be ordered
• Morphology: the way words are formed
• Semantics: the context-independent ‘meaning’ of utterances
• Pragmatics: the context-dependent ‘meaning’ of utterances
• Entity/Aspect /Features: textual content map with related entities and their attributes, components and characteristics
→ Goal: What is a speaker/writer meaning to convey?
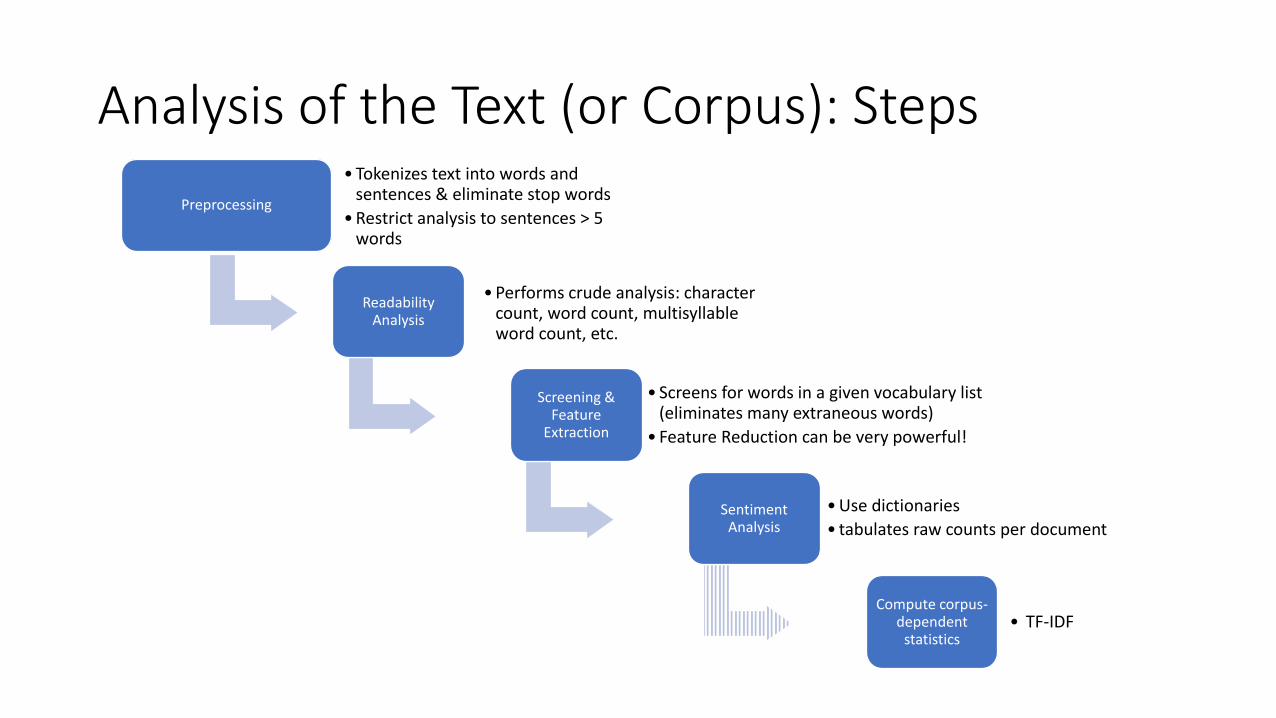
Analysis of the Text (or Corpus): Steps
Preprocessing
• Tokenizes text into words and sentences & eliminate stop words
• Restrict analysis to sentences > 5 words
Readability Analysis
• Performs crude analysis: character count, word count, multisyllableword count, etc.
Screening & Feature
Extraction
• Screens for words in a given vocabulary list (eliminates many extraneous words)
• Feature Reduction can be very powerful!
Sentiment Analysis
• Use dictionaries
• tabulates raw counts per document
Compute corpus-dependent
statistics• TF-IDF

Preprocessing
• Objective: Eliminate as much of the language dependent factors to clear the meaning from corpus
• Tokenizing• Splitting text into tokens: words, phrases, numbers and symbols• Use blank space and punctuation marks as separators• Input for feature extraction and other stages below
• Stop Word Removal• High frequency words without any significant information: I, The, a, etc• Generic (at, about,…), Names (e.g. John Smith), Dates and Numbers, Geographic (Lake,
Vegas, Texas), Currencies, etc.

Preprocessing: Stems vs. Inflections▪ Stemming: Reduction of a word from its inflected form to its root, stem or base form
▪ Important step in information retrieval but not necessary• When creating word lists, should we list root words (lexemes) and stem, or expand all
root words to include inflections?• Programmatically collapse words down to root lexeme: expensive, expensed, expensing =>
expense• Inflection: depreciate=>depreciated/depreciates/depreciating/depreciation
• Avoids morphologies like: blind / blinds; odd / odds; bitter / bitters
• The text processing literature shows that stemming does not in general improve performance. Essentially stemming does not work for morphologically rich languages.• Pro: reducing dimensionality of features which makes data less sparse and faster to
process• Con: might be harmful to the effectiveness of a text classifier

Feature Extraction• Feature sets are made from collection of words or “grams”• Unigrams:
• N-Grams of size one, i.e. single words• Bag of words or dictionary approach
• Bigrams:• N-Grams of size two• Contains more info than unigrams• Higher order features can greatly improve the quality of information retrieval
• Example:1. Analyst X has changed his recommendation for company Y from Sell to Buy2. Analyst Y has changed his recommendation for company X from Buy to Sell• Unigram representation is the same, • Bigrams (and thus sentiment/meaning) are not! Which are the useful bigrams?

Feature Reduction• Objective: reduce the number of features that represent a text document
• Statistical approaches: unsupervised vs. supervised (training) models
• Singular Value Decomposition (SVD) method used in Latent Semantic Analysis (LTA)• Matrix factorization that gets a reduced matrix with much of the same information as
the original matrix but with fewer dimensions
• Each dimension now represent document specific concepts and not only actual words
• Example: using News, and WSJ Articles to predict stock prices by Wong, Liu and Chiang (2014), Nagar and Hahsler (2012)
• Term Weighting: Term Frequency – Inverse Document Frequency (TF-IDF)

TF-IDF increases information retrieval power
• TF-IDF: Term Frequency-Inverse Document Frequency and is used in informational retrieval (search)• TF: For a given document, how frequently does the term occur in the document, scaled
by document length (count of word / total number of words)
• IDF: Over the entire corpus (collection), how many other documents contain the word? or analogously how many companies use a particular word in their filing?
• TF-IDF(Term) = TF x IDF : how important a feature/term is to a document• A high weight in TF-IDF is reached by a high term frequency (in the given document) and a low
document frequency of the term in the whole collection of documents; the weights hence tend to filter out common terms.
• Increase in proportion to the number of times a feature appears in a document but is offset by the number of documents it appears in

Supervised Sentiment• Classify documents into sentiment categories
(positive, negative, neutral, etc.)
• Goals/End Products:• Predictive models for sentiment categorization• “Important/relevant features” that determine the
sentiments→ look at features which are weighted heavier in the resulting model.
• Text Pre-processing:• Standard pre-processing –
stemming/lemmatizing, removing stop words• Part-of-speech tagging – often focus on adjectives
and nouns• Term weighting• N-grams or noun groups/phrases – unigram is too
small of a unit
• Common techniques (in machine learning):• Typical classification algorithms, such as SVM,
Decision Tree, KNN.• Naïve Bayes (as with general text classification)
▪ Typical goal is to mine opinions for features/aspects• Example: product features (e.g. “awesome
graphics”)• Features/aspects are often pre-defined (for specific
domains).• Sometimes (pre-defined) sentiment lexicons are also
used.• However, automatic identification of features or
sentiment lexicon could be possible as well.
▪ Text Pre-processing:• Standard pre-processing, POS-tagging and possible
n-grams (or noun groups) are applied.• Processing is done at the sentence-level – to get
narrower context.• Deeper NLP is often applied to extract
precise/accurate result.
▪ Common techniques:• Word Association/Collocations – PMI, Likelihood• Clustering – to obtain general topics of the opinions
in a corpus
Unsupervised Sentiment

Sentiment Analysis
Financial Lexicon

Outcome is very colorful!!

… “ ‘Cause you know sometimes words have two meanings.”
81
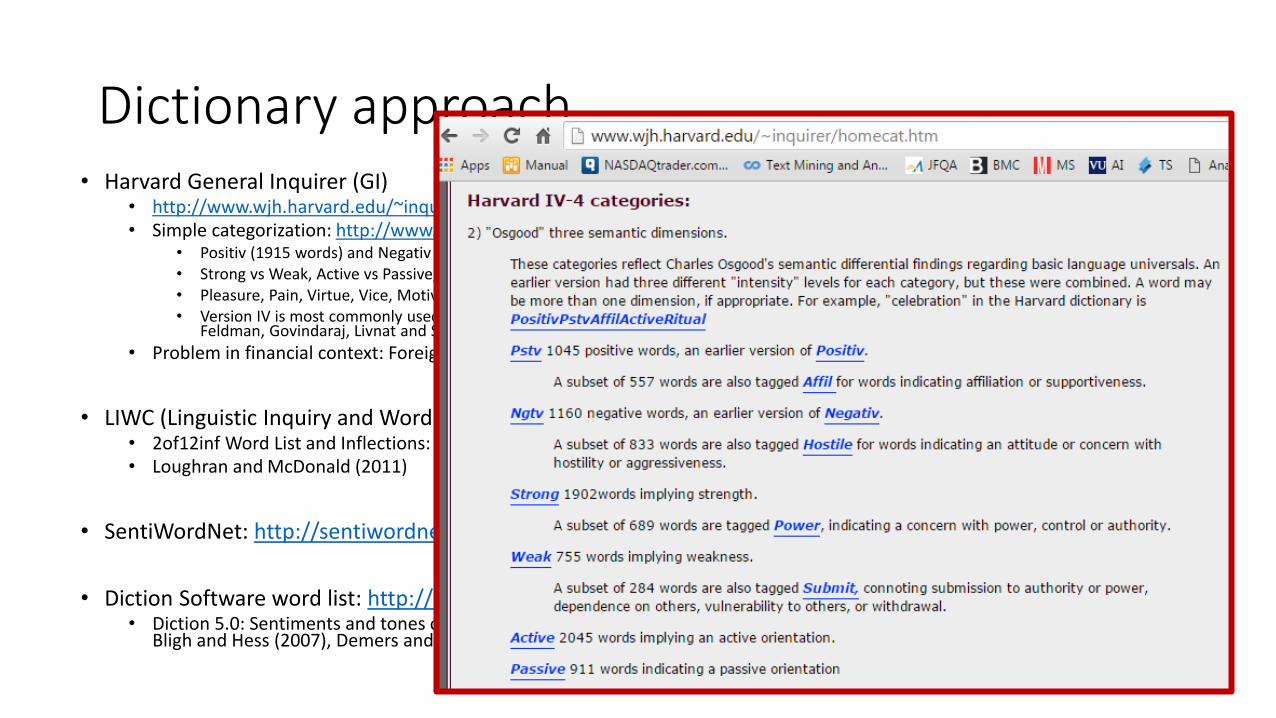
Dictionary approach• Harvard General Inquirer (GI)
• http://www.wjh.harvard.edu/~inquirer/• Simple categorization: http://www.wjh.harvard.edu/~inquirer/homecat.htm
• Positiv (1915 words) and Negativ (2291 words)• Strong vs Weak, Active vs Passive, Overstated versus Understated• Pleasure, Pain, Virtue, Vice, Motivation, Cognitive Orientation, etc• Version IV is most commonly used in finance: Kothari and Short (2003), Tetlock (2007), Tetlock, Saar-Tsechansky, and Macskassy (2008),
Feldman, Govindaraj, Livnat and Segal (2008), Engelberg (2008)
• Problem in financial context: Foreign, vice, cost, gross, depreciation
• LIWC (Linguistic Inquiry and Word Count): 2300 words, 70 classes, http://www.liwc.net• 2of12inf Word List and Inflections: http://wordlist.sourceforge.net/12dicts-readme.html• Loughran and McDonald (2011)
• SentiWordNet: http://sentiwordnet.isti.cnr.it/
• Diction Software word list: http://www.dictionsoftware.com/• Diction 5.0: Sentiments and tones of verbal message (certainty, activity, optimism, realism…): Davis, Piger and Sidor (2008),
Bligh and Hess (2007), Demers and Vega (2007), Henry (2007)

Early Sentiment Analysis in Finance:Tetlock et al study on WSJ articles
Tetlock et al. (2007) introduce “news” to a fundamental factor model: Event Study using corporate news and using Harvard Dictionary to classify sentiment
“information leakage”??
Tetlock et al. (2007) note there are three main sources of information• Analyst forecasts• Publicly disclosed accounting variables• Management description of operating environments

Decoding Sentiment: Risk and Uncertainty
• Li (2006) simple ranking procedure: identify stocks with positive and negative sentiment
• Dataset:• Annual Reports of Companies:
• 10-K SEC filings for non-financial firms• Focus on the Management Discussion and Analysis section• Period: 1994 – 2005
• Risk sentiment measure – count number of times words appear• risk, risks, risky, uncertain, uncertainty and uncertainties
• Strategy long in low risk sentiment stocks short in high risk sentiment stocks produces reasonable level returns

Additional Linguistics Metrics
• Recent interest in the use of language to convey (or obscure) information to the capital markets• Readability of annual report disclosures (Li 2008)• Deceptive language in conference calls (Larcker and Zakolyukina 2010)• “Tone” in corporate disclosures (Davis et al. 2010; Demers and Vega 2010;
Frankel et al. 2009; Price et al. 2010): optimism, pessimism, aggressiveness, conservatism, etc,
• Overall conclusion: tone conveys information beyond concurrent, quantifiable information• Market reaction to tone, controlling for current performance• But it is manager-specific: managerial style that affects semantic choice

Loughran and McDonald Financial Word List• Loughran and McDonald word list: www.nd.edu/~mcdonald/Word_Lists.html
, based on their JF 2011 publication• Sentiment dictionaries• Master dictionary• Lists of stop words• 1994-2011 10-X file summaries spreadsheet
• Use inflections instead of stemming
• Frequency counts of positive vs. negative words
• Create a dictionary of all words occurring in 10-Ks from 1994-2007.
• Classify words occurring in 5% or more of the documents.
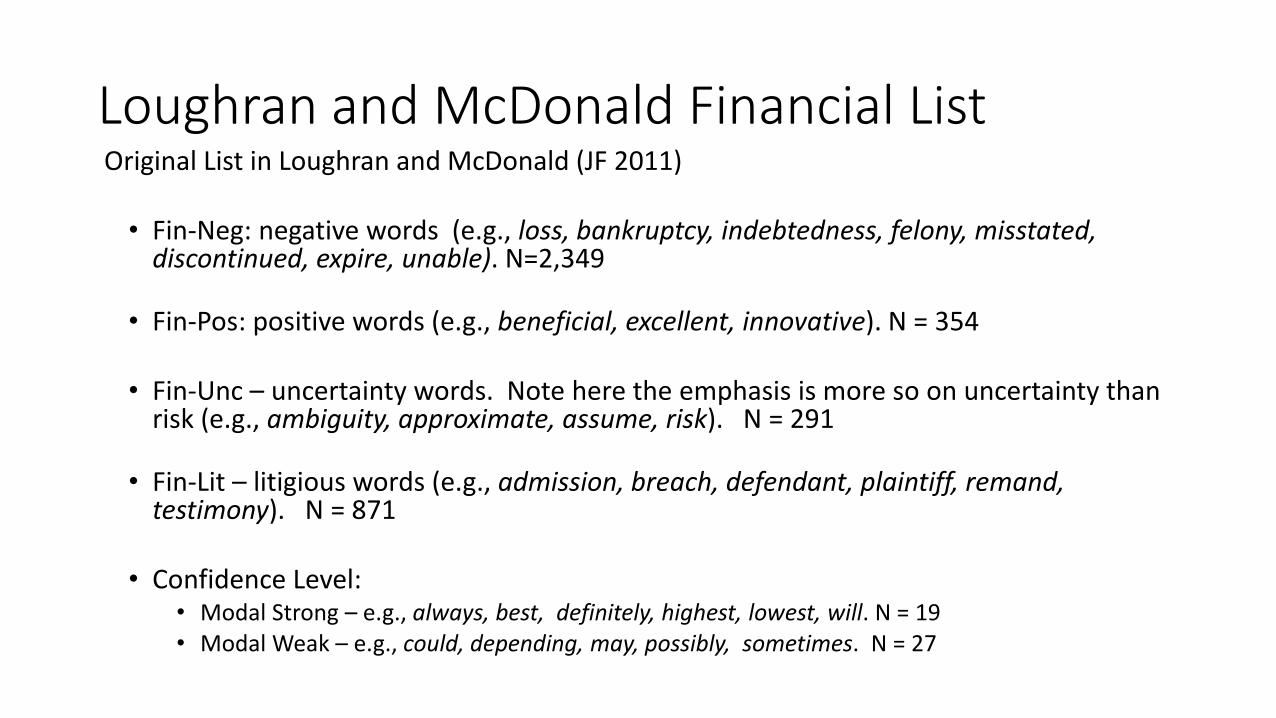
Loughran and McDonald Financial ListOriginal List in Loughran and McDonald (JF 2011)
• Fin-Neg: negative words (e.g., loss, bankruptcy, indebtedness, felony, misstated, discontinued, expire, unable). N=2,349
• Fin-Pos: positive words (e.g., beneficial, excellent, innovative). N = 354
• Fin-Unc – uncertainty words. Note here the emphasis is more so on uncertainty than risk (e.g., ambiguity, approximate, assume, risk). N = 291
• Fin-Lit – litigious words (e.g., admission, breach, defendant, plaintiff, remand, testimony). N = 871
• Confidence Level: • Modal Strong – e.g., always, best, definitely, highest, lowest, will. N = 19• Modal Weak – e.g., could, depending, may, possibly, sometimes. N = 27

Analysis of Annual Report: 10-K Filings
Entire Report
vs.
Management Discussion and Analysis Section
Loughran and McDonald List of words is more accurate for financial context thanThe Harvard IV 4 negative word list (H4N)

Sentiment analysis in Finance
“Content analysis stands or falls by its categories. Particular studies have been productive to the extent that the categories were clearly formulated and well adapted to the problem” Berelson (1952, p 92)
• Count Positive and Negative words:• Positive phrases co‐occur more with “excellent”• Negative phrases co‐occur more with “poor”
• Ziph’s law – the most frequent word will appear twice as often as the second most frequent word and three times as often as the third, etc. Much like the distribution of market cap in finance.
• Always look at the words driving your counts

Sentiment Programs• Programs
• Black boxes (Wordstat, Lexalytics, Diction, RavenPack, Semantria, RapidMiner …)
• Two critical components• Ability to download data and convert into string/character variable• Ability to parse large quantities of text
• Most modern languages provide for both of these functions:• R• Perl• Python: Natural Language Toolkit• SAS Text Miner• VB.net
• Parsing large quantities of text: REGEX• Regular expressions example• Regex that attempts to identify sentences
(?<=^|[\.!\?]\sti|\n{2,})[A-Z][^\.!\?\n]{20,}(?=([\.!\?](\s|$)))

Semantria: Sentiment Analysis

Trackur: Social Media

Solr Search

Example of Solr Search

Computational Landscape in Finance
e.g. http://www.wolfram.com/broadcast/video.php?c=249&v=935


Introduction to SEC Filings
Rabih Moussawi, Ph.D.
Villanova School of BusinessFinance Department

The Securities and Exchange Commission (SEC)
• Regulatory watchdog established in 1930 • Objective: to protect investors, maintain fair and efficient markets, and facilitate capital formation• Responsibility: collect and disseminate documents that disclose financial and other company information
• The SEC has the authority to require publicly-traded companies to file disclosure documents• All companies (including foreign entities) that publicly sell securities in the U.S. must be registered with the
SEC and comply with its filing requirements: 15,000+ entities• EDGAR: disclosure documents are then made available to the investing public via EDGAR, the SEC’s online
database of public company filings • Source of all accounting information (Bloomberg, Factset, Compustat, Datastream, WorldScope…) on
companies: www.sec.gov
• Filings are submitted on different frequencies depending on their types:• Regular schedule filings: Annual Reports (10-K), Interim or Quarterly Reports (10-Q) etc.• As-needed basis: Current Reports (8-K), IPO Registrations (S-1), insider filings, etc.

Corporate Filings: the Ultimate Big-Data
• Regulatory Filings are the main source of financial and accounting data: there are currently 400+ different forms reported electronically on EDGAR (130+ new forms adopted since 2002), and expect more to come → NEW SOURCES of INFO
• Information in periodical reports: filings with fundamental or accounting data contain way more information than the three main Accounting Tables and their footnotes→ MORE INFO & DIFFERENT TYPE of INFO
• On 01/30/2009, SEC mandated XBRL reporting for US companies and foreign issuers: XBRL = business data XML (spreadsheet-like)→ EASY MASS-ACCESS to NUMERICAL INFO

Financial Statements Primer
• Public companies required to publish 10K and 10Q and file with the SEC• 10K = Annual financial reports (audited)• 10Q = Quarterly financial reports (unaudited)
Income StatementBalance SheetStatement of Cash Flows
• Other important sections: • Risk Factors• Management Discussion and Analysis (MD&A)• Forward Looking statements• Footnotes: they are not actual footnotes
• Why do we care about these reports?

Apple Inc. Recent Annual Report: 10-K
• Filed on Oct 28, 2015, for fiscal year ending in September 2015:
• Form 10-K: http://www.sec.gov/Archives/edgar/data/320193/0001193125-15-356351-index.htm• 76 Pages• 700+ Paragraphs• 4,000+ Lines • 46,508 Words
• In contrast, it contains less than 500 useful numeric financial items, according to major fundamental (Accounting/Financial) databases

Why do we care about text in financial statements?• Prediction of future earnings is typically a function of information extracted
from financial statements
• But why text?• It’s the main medium of communication, and numbers are noisy, and may miss some
useful info• A key source of information for investors that don’t directly observe firms’ activities• Text can be forward-looking, whereas most financial statement numbers are backward-
looking.• The information is perhaps harder to process and the patterns are harder to detect
(limited attention and limited rationality of investors, Shleifer 2000)• Perhaps more orthogonal to numeric data (Fama and French 2005: many “anomalies”
are correlated with each other.)• The strategic nature of disclosure can be exploited (Sloan 1996).

10-K Filing StructureUp to 20 items, depending on year of filing (Regulation S-K): Each contains specific and different (additive) information on the company
1: Business. how they make money, competition, key customers, employees
1A: Risk Factors. economic issues, competition, new legal issues, hurricanes, any new additions, Quantitative and Qualitative Disclosure About Market Risk
2: Properties. real estates, leases, trends, geo presence, outsourcing to India,
3: Legal Proceedings. anything new, patterns change, language circumspect, use comparison tool (commitments and contingencies, legal issues)
7: Management Discussion and Analysis: detailed discussion of operations with comparisons → provides a reader an managerial overview of the operational issues and material changes in business
8: Financial Statements
15: Exhibits, especially start with 10 (material contracts)
99: catch all category
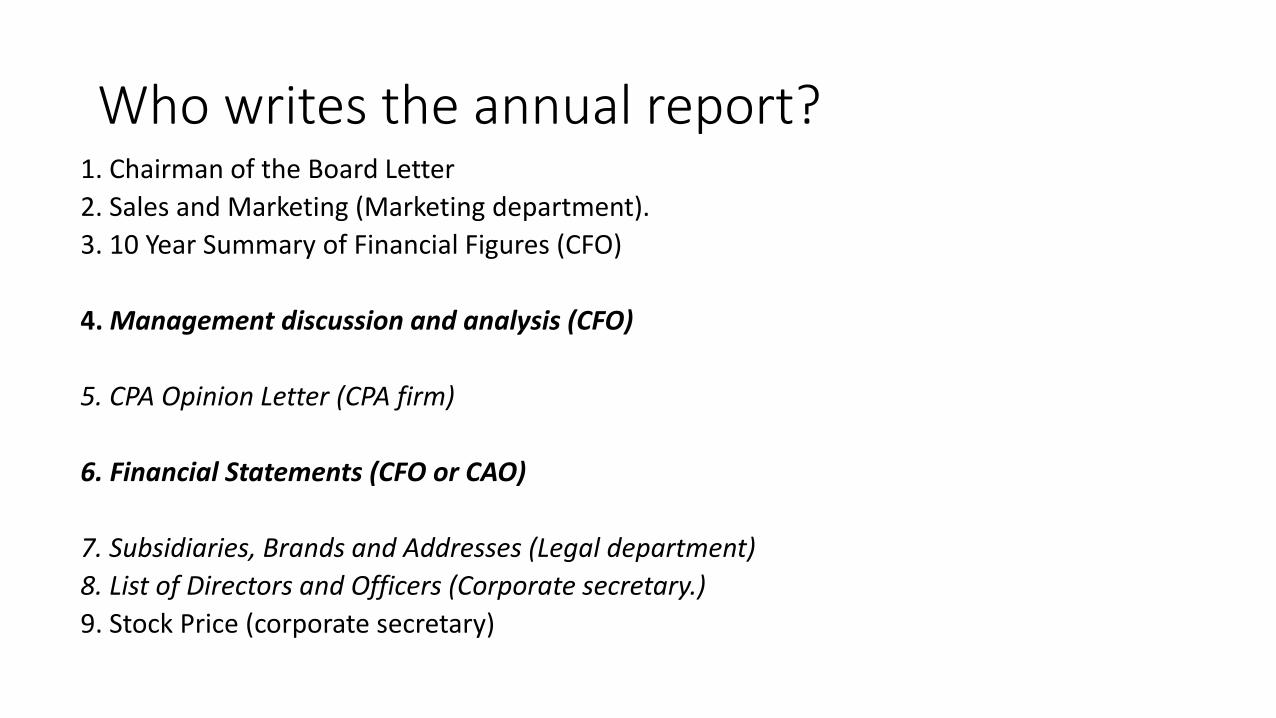
Who writes the annual report?1. Chairman of the Board Letter
2. Sales and Marketing (Marketing department).
3. 10 Year Summary of Financial Figures (CFO)
4. Management discussion and analysis (CFO)
5. CPA Opinion Letter (CPA firm)
6. Financial Statements (CFO or CAO)
7. Subsidiaries, Brands and Addresses (Legal department)
8. List of Directors and Officers (Corporate secretary.)
9. Stock Price (corporate secretary)

Crawling EDGAR
• EDGAR indices as a helpful resource for FTP retrieval:• Listings the following information for each filing: Company Name, Form Type, CIK,
Date Filed, and File Name (including folder path on EDGAR’s ftp site: ftp.sec.gov)• FNAME is the variable with the address (path) of the raw text filing, for example:
/edgar/data/<CIK> / 0123456789-AB-CDEFGH.txt
• Use SEC Database maintain by the Wharton School to download all SEC filings for a particular company using its own: • https://wrds-web.wharton.upenn.edu/wrds/ds/sec/wforms/filings.cfm• Class Account: MSA8310

MD&A Section
• Management Expectations, Sentiment, & Language Complexity
• New disclosures are rare white truffles: lawyers tell companies to include new info in their filings → must be a reason
• Researchers parse 10-Ks to individual sections, particularly to extract MD&A• Li (2006, 2008, 2010), Davis (2006), Kogan (2009), Loughran and McDonald (2011), and Wu
(2012) among others• Information is otherwise lost when the document is analyzed as a whole
• “Deals are more likely to appear on extreme positive days… [whereas] Legal events are more likely to coincide with extreme negative days.” (Boudoukh 2012)
• Quantifying qualitative textual information: computational linguistics

Textual Information Extraction
• Essentially, it’s a data reduction process.
• Two dimensions:• Complexity and Readability: Writing style analysis (How you say it)
• Textual Mining: Content and Sentiment analysis (What you say)
• Tools:• Natural language processing• Computational linguistics• Artificial intelligence / machine learning• And expertise on financial statement and disclosure!

Cleaning
Clean Text• Remove PDFs, graphics,
XBRL, unwanted XML
• Converts Unicode/HTML to ASCII
Build Parse Tree
• Identifies if the document is HTML formatted, treats self-closing tags correctly, builds tree
• For text-formatted documents, builds a simple one-<DOCUMENT> parse tree
Parse Tree Cleaning
• Remove tables, page numbers, exhibits (optional)
• This step is customizable
Parse Tree to String
• Outputs only the contents of tags, so all tags are dropped
• Attempt to preserve paragraph structure

Information Contents of the MD&A Section• Language Complexity and Readability of Filings
• Fog Index of Li (JAE, 2008): combines # of words per sentence and # of syllables per word, length of the report;• Loughran and McDonald (2008): parse the document into a vector of words and tabulate specific words and phrases as good and bad
according to the SEC documentation related to the plain English initiative• Word count, line count, # of pages;
• specific phrases such as “risk” & “uncertain” (Risk Sentiment in Li, 2006);
• social networks (cross referencing occurrences of company names, individual names, addresses, phone numbers, etc. à-la Kuhnen (2008)), language complexity, optimism…
• Text mining using lexical dictionaries to measure Tone and Sentiment• Does the tone change expressed verbally in the MD&A contain any additional information about stock prices beyond other documented
factors? • Count the number of “positive” (POS), “negative” words (NEG) and(POS-NEG)/(POS+NEG) as classified by the Harvard’s General Inquirer
• Harvard IV-4 Inquirer Dictionary: positive vs. negative wordsKothari and Short (2003), Tetlock (2007), Tetlock, Saar-Tsechansky, and Macskassy (2008), Engelberg (2008), Feldman, Govindaraj, Livnat and Segal (2008)
• Variations of Inquirer: Loughran and McDonald (JF 2011, 2014)
• Forward Looking Statements (& Capital Expenditures, Growth Projections, etc)
• Other applications• Product identification for textual based industry Linkages: Hoberg and Phillips (RFS 2010, 2011)• Forensic accounting: CEO lying and deceptive discussions during conference calls: Humpherys et al (2011), Larcker and Zakolyukina (2012)

Forward Looking Statements
• SEC encourages forward-looking information such as known material trends, events, commitments, and uncertainties
• Li (2010) defines a method for extracting FLS from MD&A• Lowers signal-to-noise ratio when using text sentiment to predict future outcomes• “The tone of the FLS is positively correlated with future performance and has explanatory power incremental
to other variables.” (Li 2010)• “…when managers warn in the MD&A about the future performance implications of accruals, accruals are less
likely to be mispriced by investors.” (Li 2010)
• Identifying MD&A• Filter sentences in MD&A based on the words they contain: “will,” “should,” “can,” “could,” “may,” “might,”
“expect,” “anticipate,” “believe,” “plan,” “hope,” “intend,” “seek,” “project,” “forecast,” “objective,” or “goal.” • Exclude the word “shall” in the searching process because it is usually associated with legal language and
boilerplate disclosures.• Retain a sentence only if it includes:
• at least 1 of a defined list of terms indicating future tense• but not 1 indicating past tense or legal jargon

Li (2006): Risk Sentiment in 10-Ks• Managers rarely use extremely pessimistic words in discussing future
outlook. A focus on “risks” likely conveys their pessimistic views about future performance.
• Managers also have incentives to disclose adverse information about future. (Skinner 1994, 1997)
• The measure: the number of risk-related words in an annual report.
• NRt – number of “risk” words in annual reports of year t, including “risk”, “risks”, “risky”, “uncertain”, “uncertainty”, and “uncertainties”.
• “volatility” is excluded in the count, b/c of ESO disclosure.
• Main variable uses change specification:• ∆RSt=ln(1+NRt)-ln(1+NRt-1)• Negative correlation between ∆NRt and Future earnings and future returns

Example: Ford Motors
fyear Filedate NRt ∆RSt Earnt Et RETt+1 ARETt+1
1997 18-Mar-98 28 0.53 6920 0.028 0.38 0.26
1998 17-Mar-99 29 0.03 22071 0.084 -0.16 -0.42
1999 16-Mar-00 30 0.03 7237 0.026 0.28 0.54
2000 22-Mar-01 99 1.17 5410 0.023 -0.39 -0.41
2001 28-Mar-02 95 -0.04 -5453 -0.020 -0.53 -0.29
2002 14-Mar-03 107 0.12 284 0.001 0.87 0.46
2003 12-Mar-04 126 0.16 921 0.003 -0.14 -0.22
Jump in Ford’s ∆RS in 2000 for two reasons:
Item 7A (“Quantitative and qualitative disclosure about market risk) increased from 2 pages to 6 pages: credit risks.
Litigation risk disclosure: Firestone Tires on Ford Explorer SUVs.

Example: Ford Motors

A more recent example: Netflix Risk Factors
Expansion of risk factor section in 10-K filed on February, 18, 2011
NFLX price dropped 10% in February, and kept sliding -65%
in the following months

Sentiment Analysis on 10-K Filings
For each stem, is there a statistically significant difference between the “positive” count and the “negative” count?
For each document in each class, tabulate the stem counts based on vocabulary
Skip words in the stoplist (“a”, “there”, etc.) and words <= 3 characters Skip proper nouns and words that describe the filer’s name
Assign classes to variables
Event classification (i.e. dividend increase/decrease)
Predictor of future event (i.e. earnings upgrade/downgrade)
Event period excess return (>1%/<1%)
Create vocabulary (word-stem dictionary)
i.e. “succeeded” and “succeeds” both map to “succeed”
Apply L&M wordlists on inflections Standardized dictionaryCustom wordlist (i.e. all words in corpus that occur
more than 5 times)

Process Overview
Download Filings
Clean Filings
Compute Features
Trading Strategy
SEC Filings Corpus Sentiment Dataset
Financial Data

Valeant Pharmaceuticals – Financial Lexicon
March 2015

Output: Generic Sentiment Components

Output: Generic Net Sentiment Trend

Output: Finance Specific Sentiment
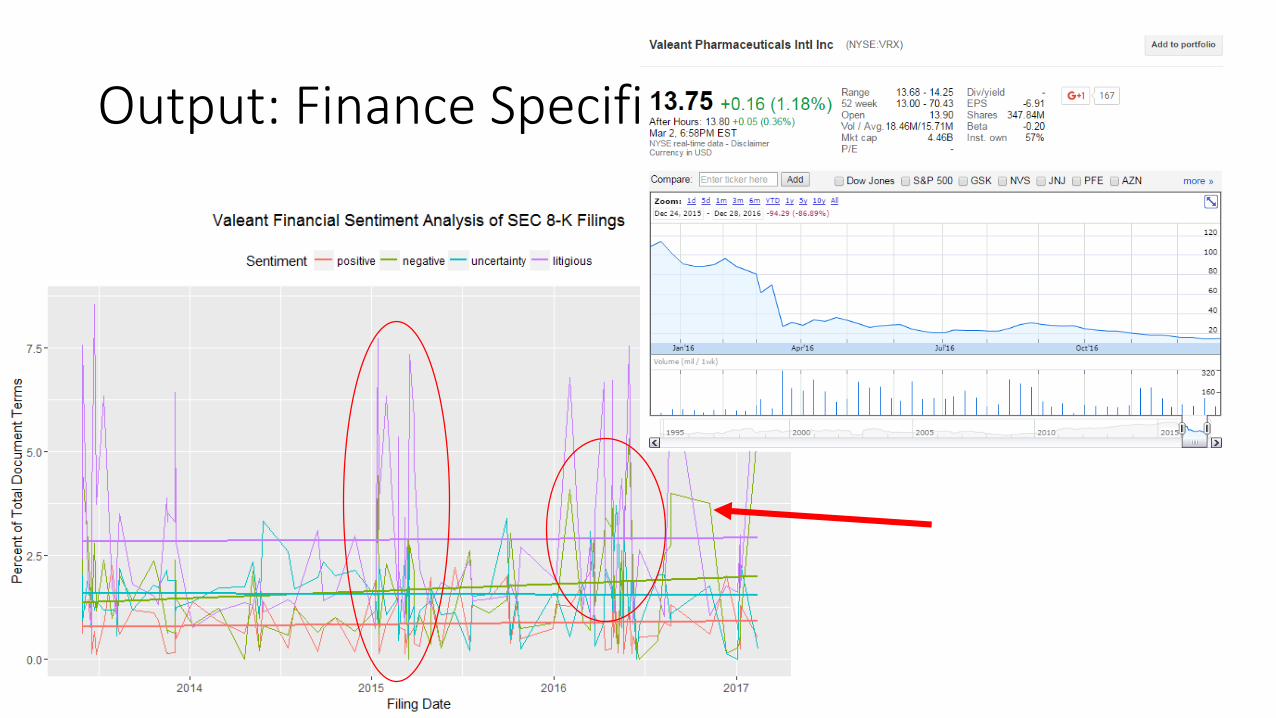
Output: Finance Specific Sentiment

Substantiating sentiment: Moving Averages
0.0%
0.5%
1.0%
1.5%
2.0%
2.5%
3.0%
3.5%
4.0%
fin.pos.percent fin.neg.percent fin.unc.percent fin.strong.percent fin.moderate.percent fin.weak.percent
Philidor false sales controversy CEO Resignation10-K reporting SEC investigation

Automation Checklist
1. Comparison: Compare the generic sentiment analysis with the one using financial lexicon (Loughran and McDonald dictionary)
• Run R Code using your company’s CIK. Download Graphs and Excel output. Merge stock price data + Create Moving Averages if necessary
• Provide your analysis on the output of both the generic sentiment analysis and the financial specific
2. Validation: Examine the determinant of the financial sentiment analysis, by looking at few recent filings with big spikes in sentiment
• Does the sentiment recent trend reflect the changes in the company-specific information environment? Examples from 8-K filings• Is it consistent with the price trend of the company? Analyst Forecasts? News announcements?
3. Predictability/Extrapolation: Open the most recent 10-K/10-Q of the company. • Provide few examples of “forward looking statements” in that recent 10-K. • Do you think the trends in the sentiment analysis are supported by the forward looking information disclosed by management?
4. Summary: Provide a report with your analysis as well as the plots of the various sentiment indicators, and substantiating examples

Additional Resources (optional)
• Word clouds: https://cran.r-project.org/web/packages/wordcloud/wordcloud.pdf• Example: https://georeferenced.wordpress.com/2013/01/15/rwordcloud/
• Cumulative sentiment trends• Example: https://www.r-bloggers.com/twitter-sentiment-analysis-with-r/
• Uniqueness/unusualness measures with • Maximum entropy: https://cran.r-project.org/web/packages/openNLP/openNLP.pdf• TF-IDF: https://cran.r-project.org/web/packages/tm/tm.pdf
• Louvain clustering: http://igraph.org/r/doc/cluster_louvain.html

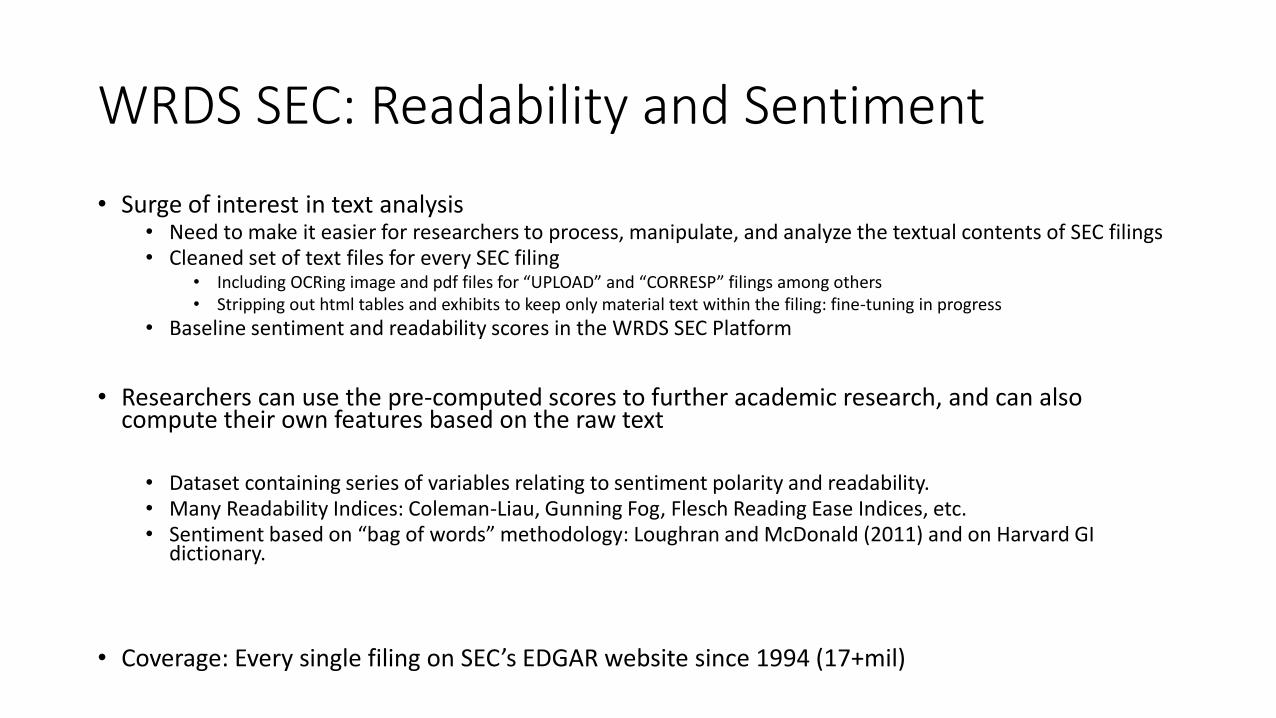
WRDS SEC: Readability and Sentiment
• Surge of interest in text analysis • Need to make it easier for researchers to process, manipulate, and analyze the textual contents of SEC filings• Cleaned set of text files for every SEC filing
• Including OCRing image and pdf files for “UPLOAD” and “CORRESP” filings among others• Stripping out html tables and exhibits to keep only material text within the filing: fine-tuning in progress
• Baseline sentiment and readability scores in the WRDS SEC Platform
• Researchers can use the pre-computed scores to further academic research, and can also compute their own features based on the raw text
• Dataset containing series of variables relating to sentiment polarity and readability. • Many Readability Indices: Coleman-Liau, Gunning Fog, Flesch Reading Ease Indices, etc. • Sentiment based on “bag of words” methodology: Loughran and McDonald (2011) and on Harvard GI
dictionary.
• Coverage: Every single filing on SEC’s EDGAR website since 1994 (17+mil)

WRDS SEC: Readability and SentimentFeature Description
Character count Total # of characters in document
Word count Total # of words in document
Sentence count Total # of sentences in document
Average Characters per Sentence Average # of characters per sentence
Average Words per Sentence Average # of words per sentence
Average Characters per Word Average # of characters per word
Complex word count Total # of 3 syllable or more words in document
Automated Readability Index 4.71(characters/words) + 0.5(words/sentences) - 21.43
Coleman-Liau Index 0.0588(avg characters/100 words) - 0.296(avg sentences/100 words) - 15.8
Gunning Fog Index 0.4 ((words/sentences)+100(complex words/words))
Flesch Reading Ease 206.835 - 1.015(total words/total sentences) - 84.6(total syllables/total words)
Flesch-Kincaid Grade Level 0.39(total words/total sentences) + 11.8(total syllables/total words) - 15.59
SMOG Index 1.043 * sqrt(complex words * 30 / sentences) + 3.1291
LIX words/(sentences marked by periods, colons, or capital first letter) + (words over 6 letters * 100)/words
Rea
dab
ility
Feature Description
Harvard GI Negative count Based on the Harvard General Enquirer negative word list
FinTerms_Postive count L&M word list
FinTerms_Negative count L&M word list
FinTerms_Uncertainty count L&M word list
FinTerms_Litigious count L&M word list
FinTerms_ModelStrong count L&M word list
FinTerms_ModalWeak count L&M word list
Sen
tim
ent

WRDS SEC Readability and Sentiment

Next Phase: Dissecting Filings
• Cohen, Malloy and Nguyen, 2015, Lazy Prices, present measures using distributional properties of words in corporate filings
• “Default” choice that firms make in their regular reporting practices: repeat what they most recently reported
• When firms make an active change → Very Negative Signal (22% underperformance)
• Construct measures for changes in filings
• Cosine Similarity =σ 𝑤𝑖×𝑤𝑗
σ𝑤𝑖2× σ 𝑤𝑗
2, where w is the # of word occurrences
• Jaccard Similarity =𝑊𝑖∩𝑊𝑗
𝑊𝑖∪𝑊𝑗
• MinEdit Similarity =𝑤𝑖−𝑤𝑗
max(σ 𝑤𝑖,σ 𝑤𝑗)

And, tons of exciting products in pipeline
• Python, PERL, and R Tools: “Build your own dataset” in any XML filings
• 13F Reports after June 2013• Complete holdings data• 13F Summary data (including other included managers)• Linking table between 13F CIK and Thomson-Reuters MGRNO• https://wrds-web.wharton.upenn.edu/wrds/ds/sec/13f/holdings.cfm?navId=499
• Current: • WRDS Bag of Words Platform: ETA Q1 2018• Financial Statement and Notes Data Sets: ETA Q2 2018
• XBRL data after 2009https://www.sec.gov/dera/data/financial-statement-and-notes-data-set.html
• Future: • Forms 3, 4, and 5 reports, including footnotes• Mutual Fund Reports: Forms N-CEN, N-PORT, and N-MFP• Schedule D, Exhibit 21, MIDAS, etc.

More automation beyond the WRDS SEC Platform• Centralized platform for ideas development and backtesting• Replicating and Backtesting signals in Table 6 of Yan and Zheng (2017)
“Fundamental Analysis and the Cross-Section of Stock Returns,” The Review of Financial Studies, Volume 30, No 4, 1382–1423.
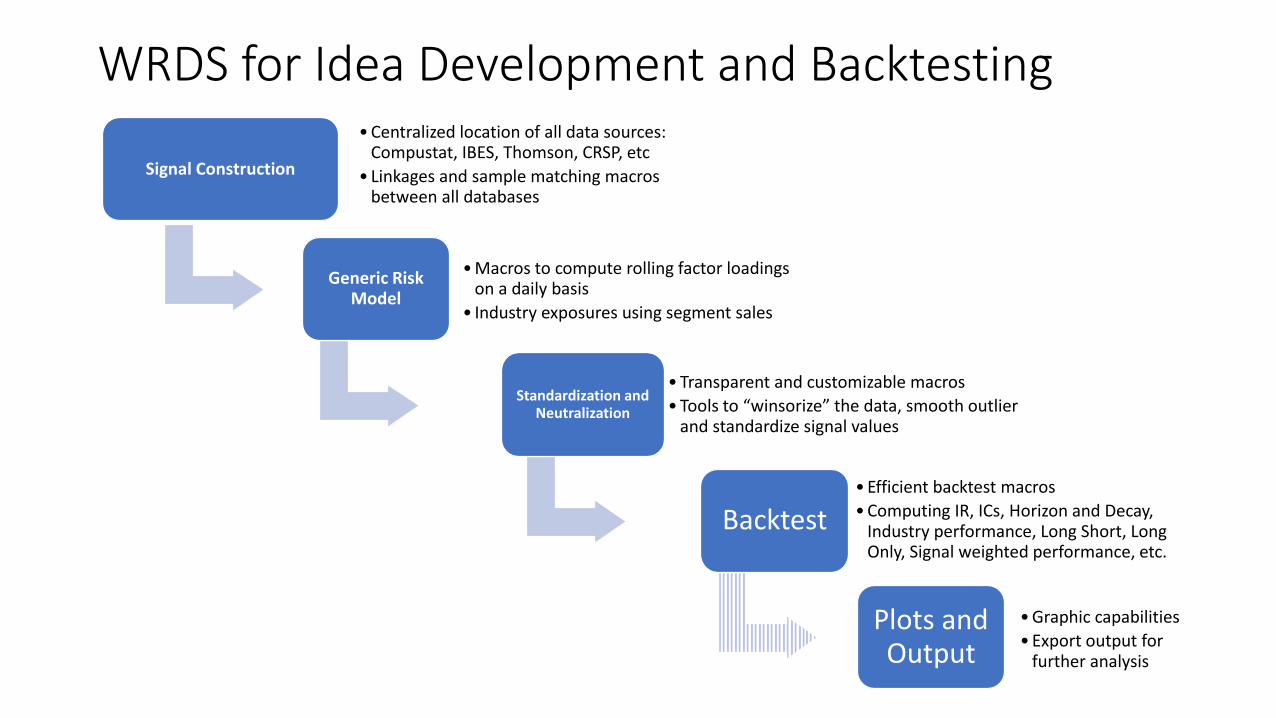
WRDS for Idea Development and Backtesting
Signal Construction
• Centralized location of all data sources: Compustat, IBES, Thomson, CRSP, etc
• Linkages and sample matching macros between all databases
Generic Risk Model
• Macros to compute rolling factor loadings on a daily basis
• Industry exposures using segment sales
Standardization and Neutralization
• Transparent and customizable macros
• Tools to “winsorize” the data, smooth outlier and standardize signal values
Backtest• Efficient backtest macros
• Computing IR, ICs, Horizon and Decay, Industry performance, Long Short, Long Only, Signal weighted performance, etc.
Plots and Output
• Graphic capabilities
• Export output for further analysis