Finsch Site Visit - Petra Diamonds · presentation. These Presentation Materials may contain...
44
Finsch Site Visit 1 February 2018
Transcript of Finsch Site Visit - Petra Diamonds · presentation. These Presentation Materials may contain...

Finsch Site Visit
1 February 2018

Important Notice
2
• These Presentation Materials are being supplied to you by Petra Diamonds Limited (the “Company”) solely for your information and use at thispresentation. These Presentation Materials may contain information that is confidential, legally privileged or otherwise protected by law. ThesePresentation Materials may not be reproduced in any form, redistributed or passed on, directly or indirectly, to any person or published, in whole or inpart, by any medium or for any purpose. Failure to comply with this restriction may constitute a violation of applicable securities law.
• These Presentation Materials are exclusively for the purposes of raising awareness about the Company. These Presentation Materials are not intendedto solicit the dealing in securities or securities financing nor do they form part of any invitation, offer for sale or subscription or any solicitation for any offerto buy or subscribe for any securities in the Company (“Company Securities”) nor shall they or any part of them form the basis of, or be relied upon inconnection therewith or act as any inducement to enter into, any contract or commitment with respect to Company Securities.
• These Presentation Materials must not be used or relied upon for the purpose of making any investment decision or engaging in an investment activity.Accordingly, neither the Company nor any of its subsidiary undertakings (as defined in the Bermuda Companies Act 2006) (together, the “Group”), norany of their respective directors, employees, agents or advisors makes any representation or warranty in respect of the contents of the PresentationMaterials or otherwise in relation to the Group or any of its businesses.
• The information contained in the Presentation Materials is subject to amendment, revision and updating, and such information may change materially.No person is under any obligation to update, or keep current, the information contained in these Presentation Materials, and any opinions expressed inrelation thereto are subject to change without notice. The Presentation Materials contain forward-looking statements which involve risk and uncertaintiesand actual results and developments may differ materially from those expressed or implied by these statements depending on a variety of factors. ThePresentation Materials have not been independently verified and no representation or warranty, express or implied, is made as to the fairness, accuracyor completeness of the information or opinions contained herein. The forward-looking information contained in these Presentation Materials is expresslyqualified by this cautionary statement.
• The delivery of these Presentation Materials shall not at any time or in any circumstance create any implication that there has been no adverse change,or any event reasonably likely to involve any adverse change, in the condition (financial or otherwise) of the Company or any other member of the Groupsince the date of these Presentation Materials.
• Any securities mentioned herein have not been and will not be registered under the United States Securities Act of 1933, as amended (the “SecuritiesAct”) or under the securities laws of any state or other jurisdiction of the United States and may not be offered, sold, resold or delivered, directly orindirectly, in or into the United States absent registration except pursuant to an exemption from, or in a transaction not subject to, the registrationrequirements of the Securities Act and applicable states securities laws. The distribution of these Presentation Materials in other jurisdictions may alsobe restricted by law, and persons into whose possession these materials come should inform themselves about, and observe, any such restrictions. Nopublic offering of securities is being made in the United States or any other jurisdiction.
• By attending this presentation or by accepting a copy of the Presentation Materials, you agree to be bound by the foregoing limitations and conditions.
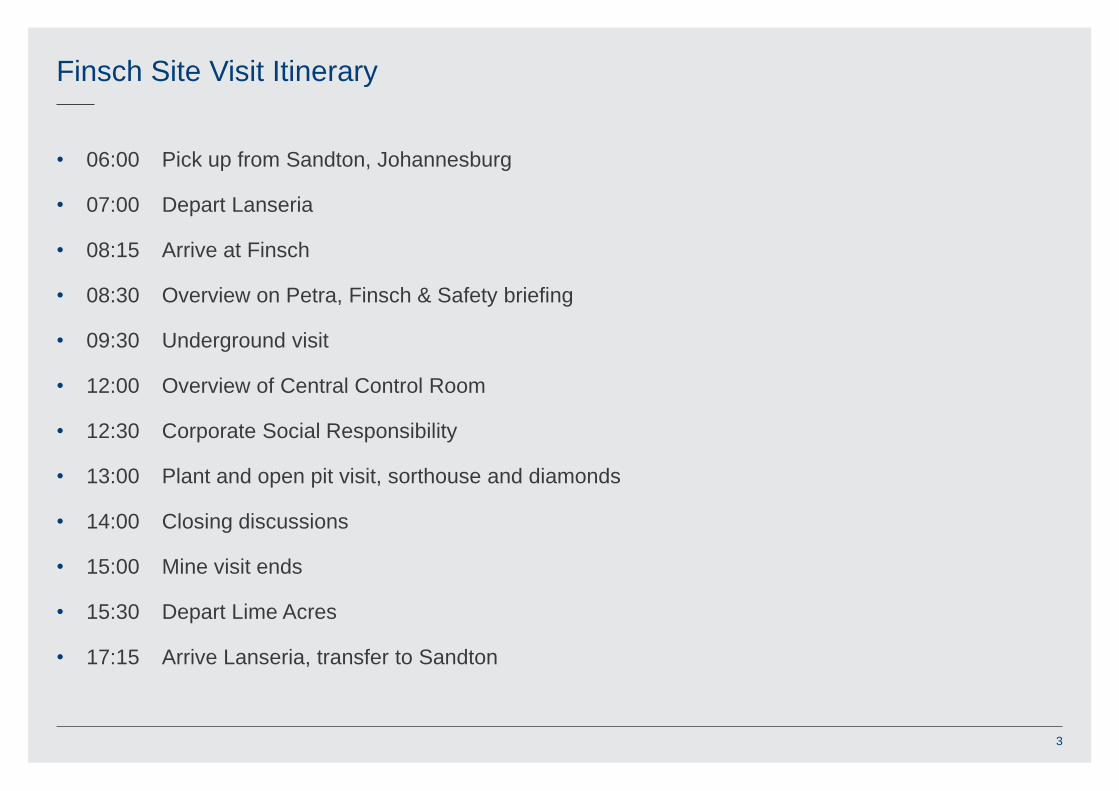
• 06:00 Pick up from Sandton, Johannesburg
• 07:00 Depart Lanseria
• 08:15 Arrive at Finsch
• 08:30 Overview on Petra, Finsch & Safety briefing
• 09:30 Underground visit
• 12:00 Overview of Central Control Room
• 12:30 Corporate Social Responsibility
• 13:00 Plant and open pit visit, sorthouse and diamonds
• 14:00 Closing discussions
• 15:00 Mine visit ends
• 15:30 Depart Lime Acres
• 17:15 Arrive Lanseria, transfer to Sandton
Finsch Site Visit Itinerary
3

About Finsch

Location within Petra Portfolio
5

• South Africa’s second largest diamond mine by production (after De Beers’ Venetia)
• Major Resource of 45.0 Mcts, incl. 26.0 Mcts Reserves as at 30 June 2017.
• World class operation with state-of-the-art infrastructure, modern plant and quality management
• Excellent safety and environmental record; strong social programmes and relationships
• Block cave and sub level cave mining (high volume, low cost)
• H1 FY 2018 production of 1.0 Mcts (0.9 Mcts ROM and 0.1 Mcts tailings) and revenue of US$100.8 million
• On track to deliver ca. 2.0 Mctpa for FY 2018
1961 1963 1978 1980 1990 2002 2008 2011
14 Sep 2011
Established Finsch
Diamonds
Full mining rights First stage
underground mining
Upgrade of treatment
plant
Open pit operation
ceased
Development of
Block 4 started
Second upgrade of
treatment plant
Change of ownership
& start of Block 5
development
1963
De Beers Consolidated Mines
assume full mining rights
1978
First stage of underground mining with
start of decline & construction of shaft
Fincham & Schwabel
established Finsch Diamonds
1961
Extensive modifications
treatment plant
1980
1990
Pit operation ceased - start of
underground operation
Opening of decline
2002
4.9 Million Tons
Start of development Block 4
Finsch Overview
6

The Petra Story Commences for Finsch – Oct 2011
7
The first single boom
Sandvik drill rig
arrives at Finsch Mine
The LOM Plan for
Finsch Mine at the
time

Mine Site Layout
1
2
3
45
6
7
8
9
1
2
Underground
Pre-79 TMR
3
4
Post-79 TD
Overburden Deposit
5
6
Waste rock dump
Britz FRD
7
8
FRD’s 1,2 and 3 and Infill Dam
Old Paddocks 8

Diamond Profile
• Rich in gem quality smaller diamonds
• Highly commercial goods of +5 carats
• Produces a number of +50 carat stones pa – both white and yellow diamonds
2.9cts
9
43cts53cts
Selection from tender 36cts & 43cts
2 classic models of 6-7.5cts

Safety Performance
*LTIFR = Nr of lost time injuries x 200,000 hrs / hrs worked
Highest LTIFR/nr = 2006FY: 0.39 / (12)
Lowest LTIFT/nr = 2014FY: 0.10 (2)
2004 = Previous time that development was done underground
2010 – current = Increase in activities, employees and projects both
underground and surface plant
10

11
SHE Achievements
OHSAS18001:2007 re-certification
January 2017
ISO14001:2004 re-certification January
2017
Achieved 3,000,000
Fatality Free Shifts
27 July 2016
Finsch was second place in the
Northern Cape Mine Managers’
Association (NCMMA) Awards, for the
underground mines safety category –
November 2016
AMMSA, SACMA, SAIMM
MineSAFE
“John T Ryan” Plaque for National
Winner
(Diamond Mining Category)
July 2016 and again in August
2017
Finsch was second place in the
Northern Cape Mine Managers’
Association (NCMMA) Awards, for the
underground mines safety category –
November 2017
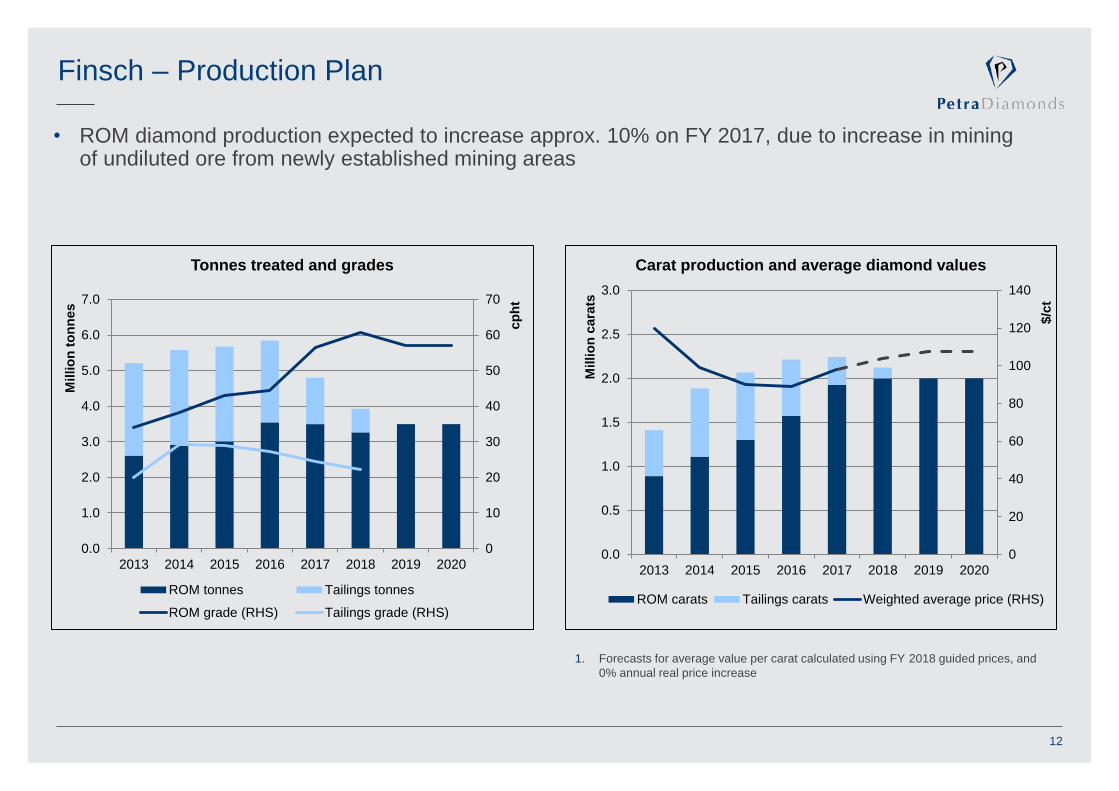
Finsch – Production Plan
12
• ROM diamond production expected to increase approx. 10% on FY 2017, due to increase in mining of undiluted ore from newly established mining areas
0
10
20
30
40
50
60
70
0.0
1.0
2.0
3.0
4.0
5.0
6.0
7.0
2013 2014 2015 2016 2017 2018 2019 2020
cp
ht
Millio
n t
on
nes
Tonnes treated and grades
ROM tonnes Tailings tonnes
ROM grade (RHS) Tailings grade (RHS)
0
20
40
60
80
100
120
140
0.0
0.5
1.0
1.5
2.0
2.5
3.0
2013 2014 2015 2016 2017 2018 2019 2020
$/c
t
Millio
n c
ara
ts
Carat production and average diamond values
ROM carats Tailings carats Weighted average price (RHS)
1. Forecasts for average value per carat calculated using FY 2018 guided prices, and
0% annual real price increase

Current Trading – H1 FY 2018 Results
13
Unit H1 FY 2018 H1 FY 2017 Variance FY 2017
Sales
Revenue US$m 100.8 99.3 +2% 216.7
Diamonds sold Carats 970,446 1,010,015 -4% 2,141,885
Average price per carat US$ 104 98 +6% 101
ROM Production
Tonnes treated Tonnes 1,559,280 1,498,449 +4% 3,212,169
Diamonds produced Carats 931,859 816,001 +14% 1,818,454
Grade Cpht 59.8 54.5 +10% 56.6
Tailings Production
Tonnes treated Tonnes 515,224 1,041,758 -51% 1,651,089
Diamonds produced Carats 104,737 215,559 -51% 331,442
Grade Cpht 20.0 20.7 -2% 20.1
Total Production
Tonnes treated Tonnes 2,074,503 2,540,207 -18% 4,863,258
Diamonds produced Carats 1,036,596 1,031,560 0% 2,149,896
Capex
Expansion Capex US$m 24.0 27.9 -14% 58.4
Sustaining Capex US$m 3.4 2.3 +48% 9.1
• ROM diamond production +14% to 931,859 carats, in line with the Company’s guidance, impacted by strikes (ca. 55,000 carats)
• Pre-79 tailings exceeding full year guidance; planned depletion of resource during H2 FY 2018
• ROM grade +10% to 59.8 cpht due to increased contribution from SLC, assisted by high grade ROM surface stockpiles
• Improving ROM grade in line with Company guidance of 58 cpht for FY 2018

Block 5 SLC
Mining and Development Programme

Geology
15
• Finsch pipe is hosted by banded ironstones at
surface and thereafter dolomites of the
Griqualand West Sequence of the Transvaal
Supergroup
• A Group II kimberlite pipe with an age of
118Ma
• 17.9ha on surface
• Main pipe tapers to 3.7ha and Precursor to
1.5ha at 880m
• Truncates earlier Precursors
• Total of 8 different kimberlite facies each with
unique characteristics and different grades
• 2 facies (F1 and F8) make up majority of the main
pipe
• Grade increases with depth (decrease in waste
dilution)

Finsch – Development Programme
• Expansion plan to take production to
ca. 2.0 Mctpa (ROM) by FY 2018
• Sub level cave
- tunnelling in host rock complete
- All 22 tunnels in production – first 2 levels
• New Block 5 Block Cave to be installed at 900m / 1000m
FY 2017 Development: Waste: 1,523 metres; Raiseboring:427 metres; Kimberlite 3,733 metresExpansion Plan
• Production from SLC – from H2 FY 2016
• Dedicated ore-handling infrastructure (to
transfer SLC ore to existing infrastructure at
650m) – end FY 2016
• Mining of South West Precursor from 610m
to 630m – H1 FY 2017
• 2nd crusher commissioned - end H1 FY 2018
• Decommissioning of Block 4 automated
ore-handling system – H2 FY 2018
• Pre 79 Tailings treated – end FY 2018
• Steady state ROM production – FY 2018
• Mining of overburden dumps – continue to
FY 2019 / FY 2020
• Block 5 Block Cave at 900m – from FY 2024/ FY 2025
Key Milestones
16

Underground Development
17
SLC rim intersection
70, 73, 75 & 78 level rim
drives complete
Sections 2,3 & 4 of
SLC ground handling
tunnels complete
BC Ground
Handling
SWPC
BC
63 Pillars
SLC Phase 2
SLC Phase 1

Sub-level Caving
18
• A cave where most of the
recovered rock is drilled,
charged and blasted
• The face must continuously
advance:
• To disturb the column
above
• To manage the damaged
brows
• Performance is highly
dependent on:
• Extraction sequencing and
disciplined following of it
• Drill and blast
• Draw control
• Expected ore recovery
• 66% to 80% on top level
• 90% to 130% on second
level
• 150% + on subsequent
levels
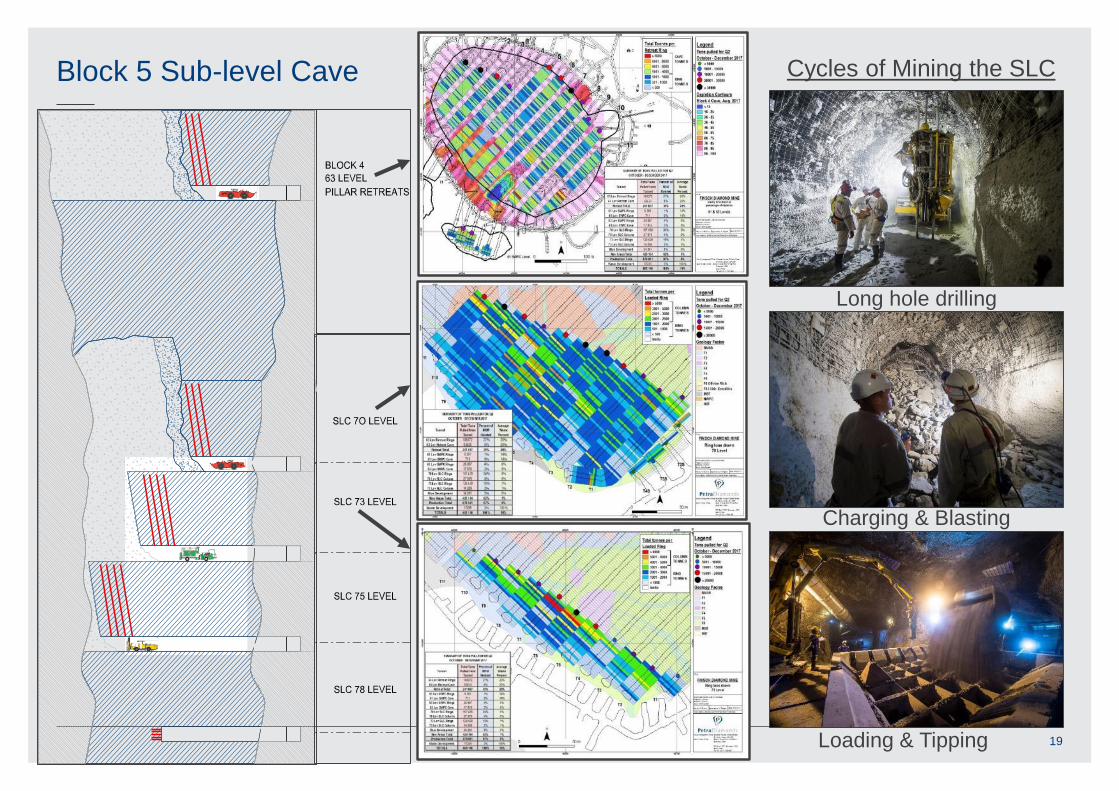
Block 5 Sub-level Cave
19
Long hole drilling
Charging & Blasting
Loading & Tipping
Cycles of Mining the SLC

Crushing & Conveyance
20
Complete
In Progress

0
10
20
30
40
50
60
70
-
50 000
100 000
150 000
200 000
250 000
300 000
Gra
de
(cp
ht)
Ton
s M
ine
d
Block 5 SLC & SWPC - Block 4 - Pillar Mining - Block 4 - Block Cave ROM Grade
Forecast
Production Ramp-up
21
Industrial
Action

Plant Overview

Plant Infrastructure
23
• Original plant built – 1964
• First upgrade completed – 1980
• Underground operation commence – 1990
• Introduced Pre-79 dump retreatment – 2003
• Full contops since 2005 – capacity of 5.7 Mtpa
• Treatment plant upgrade – predominantly the DMS,
recovery and recrush sections – 2003 to 2008
• Total project cost: ca. US$100 million
• Bulk sample plant acquired in late 2014 – capacity of ca.
0.6 Mtpa
Pre upgrade:
Post upgrade:

Plant Overview
24
Ore Preparation
Concentration
Mine Residue Disposal
Recovery
Ore Reception
WIFS

Simplified Process Flow
-22+ 1mm
Shaft
Primary Gyratory Crusher
Buffer
Stockpile
Jaw Crusher Boyo’s Bin
Primary Scrubbing &
Screening
To Fine Tailings
Disposal
-300mm
-150mm
+22mm
-1mm
-150mm
Feed Separation &
Secondary
Scrubbing
Secondary &
Tertiary Crushing
-22mm
Coarse DMS
Fines DMS
High Pressure
Rolls Crushing
Final Recovery
To Coarse
Tailings
Disposal
-8mm
-22+8mm
-8+1mm
Wet Infield Screening
(WIFS) -20 +1mm
Overspill
Bin
Loading ROM Loading Tailings
25

Treatment Profile
26
0
10
20
30
40
50
60
70
-
100 000
200 000
300 000
400 000
500 000
600 000
Gra
de
(cp
ht)
Ton
s
ROM Underground ROM Surface Stockpile Tailings Overall Grade
ForecastIndustrial
Action

Typical Production Layout
27

Operating Costs

Operating Cost History and Make-up
29
• Risk of rising electricity costs
managed through efficient
design of new infrastructure
• Maintenance and
management of new and old
infrastructure
• New designs cater for high
degree of automation
• Advancement of a Group
procurement strategy to yield
benefits related to economies
of scale
• Opportunities to optimize
plant configuration given
lower planned plant
throughput once tailings
depleted
0
50
100
150
200
250
300
350
400
FY'13a FY'14a FY'15a FY'16a FY'17a FY'18f FY'19f0
1
2
3
4
5
6
7
R/t
tre
ate
d
Millio
n t
on
nes t
reate
d
On-mine cash cost per tonne treated
Labour Power Services and Stores Other Total tonnes treated (RHS)
37% 39% 36% 33% 32%
14% 14% 15%15% 15%
36%39% 41% 43% 47%
13% 8% 8% 9% 6%
0%
20%
40%
60%
80%
100%
FY'13a FY'14a FY'15a FY'16a FY'17a
Operating cost break down
Labour Power Services and Stores Other

Labour Relations – Risk Mitigation
30
• Labour relations at Petra’s South African operations were stable for the three year period up to the negotiation of a new
three year deal in 2017
• September 2017: Finsch, Koffiefontein and KEM JV experienced labour disruption (contained to less than two weeks), but
none experienced at Cullinan
• New three year wage agreement with NUM by end September (+9 - 10% for year one and +8.5% for years two and three)
(effective to 30 June 2020)
• No migrant labour – 70% of employees come from local/provincial area to Finsch
• Strong focus on internal communications and engagement with employee representatives
Petra Diamonds
Limited
Finsch Diamond
Mine
Itumeleng Petra
Diamonds
Employee Trust
12% 14%74%
100%
Kago DiamondsLuxiano Trading
105 (Pty) Ltd
Finsch Ownership Structure
• Itumeleng Petra Diamonds Employee Trust
owns 12% of mine
• Annual IPDET distributions
commenced in December 2014

CSD
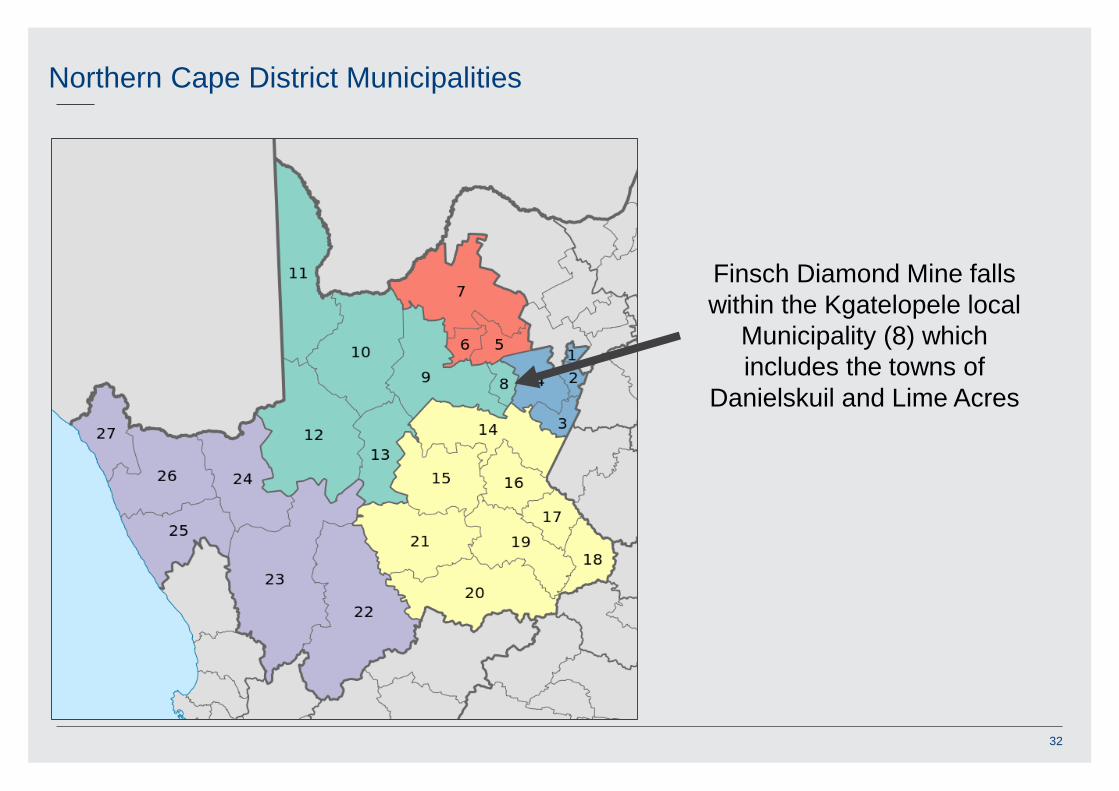
Northern Cape District Municipalities
32
Finsch Diamond Mine falls
within the Kgatelopele local
Municipality (8) which
includes the towns of
Danielskuil and Lime Acres

Corporate Social Responsibility Objective
Our main objective is to continue building effective relationships with employees,stakeholders and the community at large
Principles:
• Transparency
• Employee participation (committee members)
• Utilising of local suppliers and service providers
• Comply with legislation
o 2002 Mining Charter of South African Mining Industry
o S100 (2) (a) MPRDA as prescribed by the Department of Mineral Resources
33

Focus Areas
• Infrastructure
• Health Care Services
• Community Development and Support
• Education and Training:
• Early Childhood Development (ECD)
• Maths & Science
• Outreach programmes
• Sports, Arts and Culture
34

Water Infrastructure
35
Resident of Danielskuil next to the installed pre-paid
water meter and all water leakages fixed
Bulk water infrastructure and borehole upgrades at Danielskuil

Electrical infrastructure upgrade in partnership with two local mines (PPC Lime and Idwala Lime)
36
Electrical Infrastructure
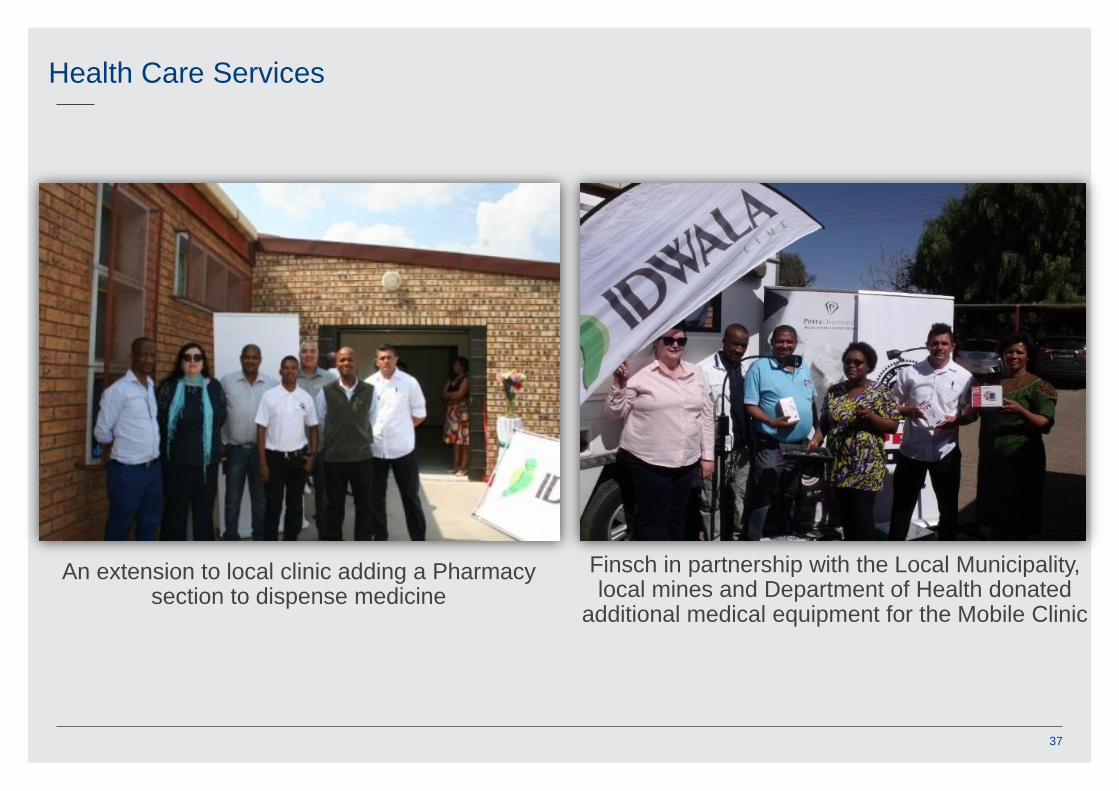
An extension to local clinic adding a Pharmacy section to dispense medicine
37
Health Care Services
Finsch in partnership with the Local Municipality, local mines and Department of Health donated
additional medical equipment for the Mobile Clinic

Community skills development programme to address skills shortages by unemployed youth to access opportunities.
• Drivers License Project
• 20 unemployed youth participated in the programme
• Portable Skills
• 10 unemployed youth took part in the programme
• Internship – based at the local Municipality
• Town Planner – now permanently employed at LM
• Project Technician
• Process controller
38
Community Development
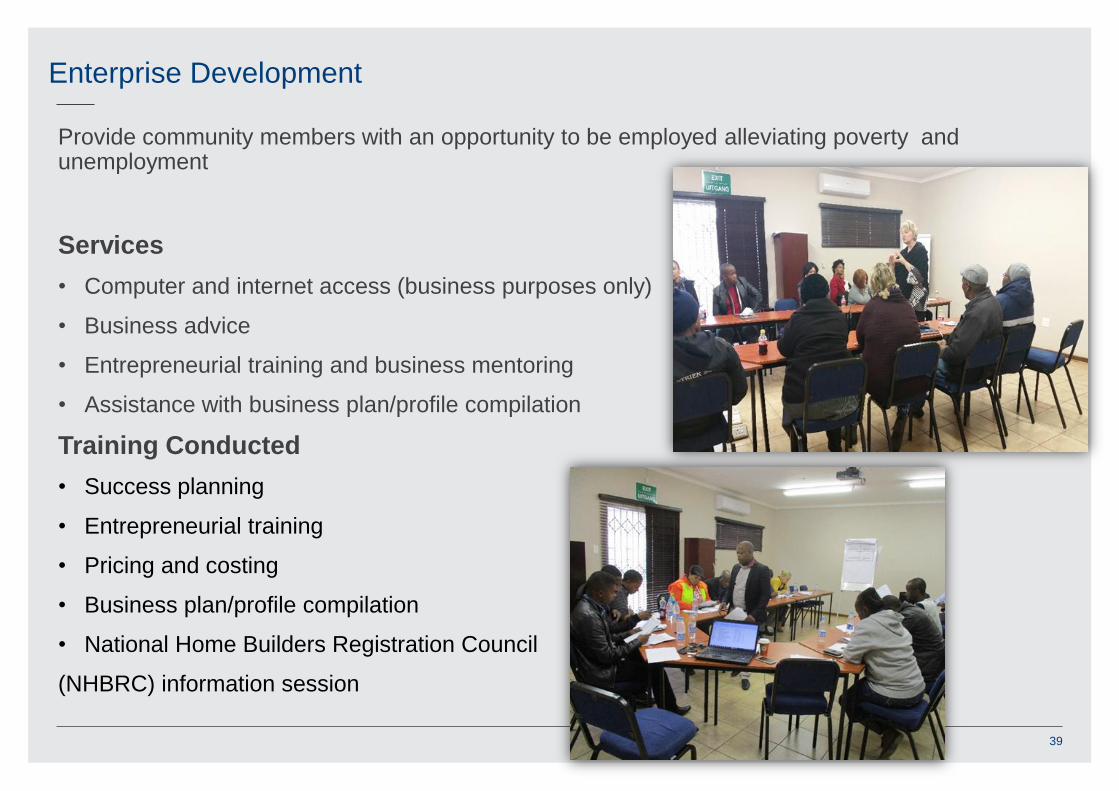
Provide community members with an opportunity to be employed alleviating poverty and unemployment
Services
• Computer and internet access (business purposes only)
• Business advice
• Entrepreneurial training and business mentoring
• Assistance with business plan/profile compilation
Training Conducted
• Success planning
• Entrepreneurial training
• Pricing and costing
• Business plan/profile compilation
• National Home Builders Registration Council
(NHBRC) information session
39
Enterprise Development
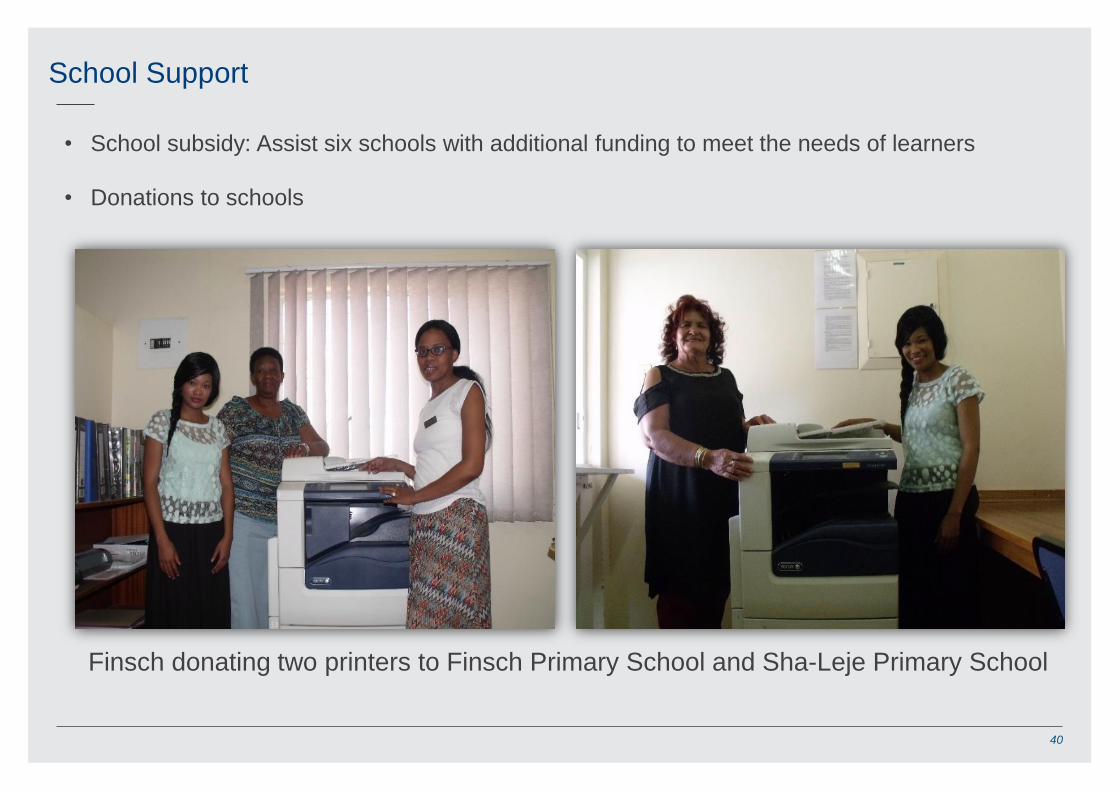
• School subsidy: Assist six schools with additional funding to meet the needs of learners
• Donations to schools
40
School Support
Finsch donating two printers to Finsch Primary School and Sha-Leje Primary School

Finsch sponsored Kgatelopele Social Development Forum with a new Gazebo.
41
Corporate Social Investment
Local sports teams sponsored sports equipment

Outlook

Finsch Outlook
43
• Transformation in production profile
• Depletion of lower value Pre-79 tailings resource planned during H2 FY 2018
• Ramp up of undiluted ore from new mining areas to contribute ca. 1.9 Mt in FY 2018
• Expected to lead to improving average product mix
• Improving mining costs
• Decommissioning of truck loop during H2 FY 2018
• Increasing extraction per ring blasted resulting in reduced drilling and blasting cost per tonne
• Opportunities to optimize plant configuration given lower planned plant throughput once tailings depleted
• Very robust economics
• FY 2017 EBITDA margin of 54%
• Longevity
• Potential to further extend life-of-mine plan beyond Block 5
• Finsch aims to generate value for all stakeholders and plays a vital role in its local communities
Putting in place a sustainable future for Finsch and its local communities