
Finnish Remote Sensing Days 2012 - Helsinki
62
Finnish Remote Sensing Days 2012: book of abstracts MATTI MÕTTUS (EDITOR) DEPARTMENT OF GEOSCIENCES AND GEOGRAPHY C7
Transcript of Finnish Remote Sensing Days 2012 - Helsinki

Finnish Remote Sensing Days 2012: book of abstracts
Matti MõttuS (eDitoR)
DepaRtMent oF GeoScienceS anD GeoGRaphy c7


Finnish Remote Sensing Days2012: book of abstracts
Matti Mõttus (editor)
DEPARTMENT OF GEOSCIENCES AND GEOGRAPHY C7 / HELSINKI 2012

Julkaisija / Publisher:Department of Geosciences and Geography PO Box 64FI-00014 Helsingin yliopisto
ISSN 1798-7938 (print)ISSN-L 1798-7938ISBN 978-952-10-8453-9 (pdf)http://helda.helsinki.fi/
Helsinki 2012

Remote Sensing Club of Finland is an informal body bringing together actors from both academic and commercial arenas. The position of
the chair rotates among members. One of the most visible tasks of the Club is arranging yearly Remote Sensing Days. The event is hosted
by the organization of the chair of the steering group. Thus, in 2012, Remote Sensing Days were held on the Kumpula campus of the
University of Helsinki (shown in false color on the back and front covers of this book as recorded by airborne AISA Eagle imaging
spectrometer in 2011).
The goal of the meeting is to facilitate nationwide exchange of information and ideas. Remote Sensing Days allow to obtain a quick
overview of the diverse remote sensing activities currently underway in Finland. However, the most important goal of the event is to bring
together the community involved in remote sensing research and development scattered among the many research institutions,
universities, and private companies.
This book is a collection of the abstracts of the presentations given at the 2012 Finnish Remote Sensing Days held in the Linus Torvalds
Auditorium in the Exactum building on October 25–26. It is a snapshot of remote sensing research in Finland in 2012 and, hopefully,
helps the reader to recollect the presentations given at the meeting and to find new contacts in the Finnish remote sensing community.
Members of the organizing committee for the 2012 Finnish Remote Sensing Days – and also the steering group of the Remote Sensing
Club of Finland in 2012 – were
Matti Mõttus (chair, University of Helsinki)
Alfred Colpaert (University of Eastern Finland)
Jaan Praks (Aalto University)
Kari Luojus (FMI)
Kirsikka Heinilä (SYKE)
Matias Takala (FMI)
Miia Salminen (SYKE)
Mika Karjalainen (FGI)
Robin Berglund (VTT)
Timo Kumpula (University of Eastern Finland)
Mõttus, Matti (editor) 2012. Finnish Remote Sensing Days 2012. Book of abstracts. Department of Geosciences and Geography C7. University of Helsinki, 58 pp.


Finnish Remote Sensing Days 2012 : Program
Finnish Remote Sensing Days 2012.Program
Thursday, 25 October
Plenary Session
Chair: Matti Mottus
09:00 Welcome
09:05 Jouni Pulliainen: Sodankyla satellite data centre: an initiative to establish real-time satellite data-aided services in Finland . . . . . . . . . . . . . . . . . . . . . . . . . . . . . . . . . . . . . . . . . . . . . . . . . . . . . . . . . . . . . . . . . . . 33
09:30 Tuomas Hame: The Sentinels will make a difference in remote sensing services
09:55 Erkki Kyrola: Studying atmospheric composition by satellite measurements . . . . . . . . . . . . . . . . . . . .34
10:20 Pauli Stigell: Finnish Earth Observation in European programmes. . . . . . . . . . . . . . . . . . . . . . . . . . . . .35
10:45 Coffee break
Remote Sensing of Snow and Ice
Chair: Kari Luojus
11:00 Kari Luojus: Overview of snow remote sensing R&D at FMI & SYKE – work towards NRT & longterm snow cover data records . . . . . . . . . . . . . . . . . . . . . . . . . . . . . . . . . . . . . . . . . . . . . . . . . . . . . . . . . . . . . . . 36
11:20 Marko Makynen: Sea ice remote sensing R&D at Finnish Meteorological Institute . . . . . . . . . . . . . . 37
11:40 Juha Karvonen: Sea Ice concentration retrieval based on dual-polarized C-Band SAR . . . . . . . . . . . 38
12:00 Robin Berglund: ICEMAR – a System for sea ice information delivery . . . . . . . . . . . . . . . . . . . . . . . . 39
12:20 Tuomo Smolander: Detection of soil moisture and soil freeze using microwave radars . . . . . . . . . . . 40
12:40 Lunch
Remote Sensing of Forests: General
Chair: Mika Karjalainen
13:30 Timo Vesala (invited presentation): From flux and concentration observations to greenhouse gas sinksand sources
14:00 Heikki Astola: EUFODOS – European forest downstream services improved information on foreststructure and damage – project presentation . . . . . . . . . . . . . . . . . . . . . . . . . . . . . . . . . . . . . . . . . . . . . . . . . . 41
7

Finnish Remote Sensing Days 2012 : Program
14:20 Paras Pant: Spectral characteristics of hypespectral and multispectral sensors for area based treespecies classification . . . . . . . . . . . . . . . . . . . . . . . . . . . . . . . . . . . . . . . . . . . . . . . . . . . . . . . . . . . . . . . . . . . . . . . 42
Poster Bazaar
Chair: Kirsikka Heinila
15:30 Coffee break. Posters on display
Krista Alikas: A robust Kd(490) algorithm for remote sensing of optically complex waters . . . . . . . . . . . . 13
Lea Hallik: Vegetation indices detecting the effect of climate change on vegetation . . . . . . . . . . . . . . . . . . . 14
Henna-Reetta Hannula: automatization of a spectroradiometer measurement system for satelliteimage validation. . . . . . . . . . . . . . . . . . . . . . . . . . . . . . . . . . . . . . . . . . . . . . . . . . . . . . . . . . . . . . . . . . . . . . . . . . .15
Pekka Hurskainen: Application of open-source GIS and live GPS tracking for land use / land cover fielddata collection in Kilimanjaro, Tanzania . . . . . . . . . . . . . . . . . . . . . . . . . . . . . . . . . . . . . . . . . . . . . . . . . . . . . 16
Iolanda Ialongo: Characterization of OMI tropospheric NO2 over the Baltic sea area . . . . . . . . . . . . . . . . . . 17
Jere Kaivosoja: UASI Potato Monitoring flight campaign preliminary results . . . . . . . . . . . . . . . . . . . . . . . . . 18
Rigel Kivi: Atmospheric composition measurements in northern Finland and comparison with space borneobservations . . . . . . . . . . . . . . . . . . . . . . . . . . . . . . . . . . . . . . . . . . . . . . . . . . . . . . . . . . . . . . . . . . . . . . . . . . . . . . 19
Lauri Korhonen: Modeling lidar-derived boreal forest crown cover with SPOT 4 HRVIR data . . . . . . . . . 20
Andres Kuusk: Reference panel for remote sensing studies at Jarvselja, Estonia . . . . . . . . . . . . . . . . . . . . . . 21
Petr Lukes: biomass and species composition are tightly related to forest albedo in the boreal zone . . . . . 22
Rami Piiroinen: Hyperspectral remote sensing in Taita Hills Kenya . . . . . . . . . . . . . . . . . . . . . . . . . . . . . . . . . 23
Eetu Puttonen: Ground point labeling in a terrestrial laser scanning configuration with utilization of scanner-centered coordinate system . . . . . . . . . . . . . . . . . . . . . . . . . . . . . . . . . . . . . . . . . . . . . . . . . . . . . . . . . . . . . . . . . 24
Svetlana Saarela: Model-assisted estimation of growing stock in a two-phase sampling survey utilizingALS sample and wall-to-wall satellite optical data . . . . . . . . . . . . . . . . . . . . . . . . . . . . . . . . . . . . . . . . . . . . 25
Tuure Takala: Canopy shadow fraction estimation from AISA Eagle using spectral unmixing . . . . . . . . . . 26
Tuomas Tikka: Aalto-2 – An atmospheric nanosatellite . . . . . . . . . . . . . . . . . . . . . . . . . . . . . . . . . . . . . . . . . . . . 27
Harold Weepener: Forecasting outbreaks of the brown locust using rainfall estimates, NOAA images andSPOT Vegetation images . . . . . . . . . . . . . . . . . . . . . . . . . . . . . . . . . . . . . . . . . . . . . . . . . . . . . . . . . . . . . . . . . . . 28
Xiaochen Zou: Using digital camera for measuring leaf inclination angle in crops . . . . . . . . . . . . . . . . . . . . 29
Commercial presenter: Specim OY
Remote Sensing of Forests and Land Cover Change
Chair: Mika Karjalainen
16:15 Urmas Peterson: cross-border comparison of forest area changes caused by clear-cutting and af-forestation of abandoned agricultural land using snow covered satellite imagery innortheastern Europe . . . . . . . . . . . . . . . . . . . . . . . . . . . . . . . . . . . . . . . . . . . . . . . . . . . . . . . . . . . . . . . . . . . . . . . 43
16:35 Timo Pitkanen: Tracing variations of deciduous component over grassland–forest continuum bysubpixel classification . . . . . . . . . . . . . . . . . . . . . . . . . . . . . . . . . . . . . . . . . . . . . . . . . . . . . . . . . . . . . . . . . . . . . . 44
16:55 Niina Kayhko: Consequences of land cover transitions on the sustainability of coral rag forests inZanzibar, Tanzania . . . . . . . . . . . . . . . . . . . . . . . . . . . . . . . . . . . . . . . . . . . . . . . . . . . . . . . . . . . . . . . . . . . . . . . . 45
8

Finnish Remote Sensing Days 2012 : Program
17:15 Laura Sirro: Forest crown cover estimation in northern boreal and temperateEuropean forest . . . . . . . . . . . . . . . . . . . . . . . . . . . . . . . . . . . . . . . . . . . . . . . . . . . . . . . . . . . . . . . . . . . . . . . . . . . 46
17:35 Timo Kumpula: Detecting landuse and landcover changes in reindeer pastures using multi-sourceremote sensing and GIS data . . . . . . . . . . . . . . . . . . . . . . . . . . . . . . . . . . . . . . . . . . . . . . . . . . . . . . . . . . . . . . . .47
18:00 Sauna at FMI
Friday, 26 October
New Technologies in Remote Sensing
Chair: Heikki Saari
09:45 Antti Nasila: Aalto-1 spectral imager: Design and mission . . . . . . . . . . . . . . . . . . . . . . . . . . . . . . . . . . . 48
10:05 Maria Gritsevich: A pioneer European airborne-based observation campaign of ameteor shower . . . . . . . . . . . . . . . . . . . . . . . . . . . . . . . . . . . . . . . . . . . . . . . . . . . . . . . . . . . . . . . . . . . . . . . . . . . . 49
10:25 Lingli Zhu: Using mobile laser scanning and UAV for 3D city models . . . . . . . . . . . . . . . . . . . . . . . . . 50
10:45 Eija Honkavaara: 3D hyperspectral reflectance signatures by light-weight UAVs for the monitoringand measuring the environment . . . . . . . . . . . . . . . . . . . . . . . . . . . . . . . . . . . . . . . . . . . . . . . . . . . . . . . . . . . . . . . . . . 51
11:05 Heikki Saari: UASI Summer 2012 UAV flight campaign results for forest and agriculture . . . . . . . .52
11:25 Coffee break
Remote Sensing of Forests: New Methods and Algorithms
Chair: Ilkka Korpela
11:50 Matthieu Molinier: Social Forest Planning project: summary of results 2010–2012 . . . . . . . . . . . . . 53
12:10 Paula Litkey: Automatic detection of storm damages in forests using airbornestereoscopic images . . . . . . . . . . . . . . . . . . . . . . . . . . . . . . . . . . . . . . . . . . . . . . . . . . . . . . . . . . . . . . . . . . . . . . . . . . . . 54
12:30 Jan Pisek: Estimating leaf inclination and G-function from leveled digital camera photography forbroadleaf tree and shrub species in Kaisaniemi and Kumpula botanical gardens, Helsinki . . . . . . . . . . . . . . 55
12:50 Lunch
Remote sensing of forests: forest structure and composition
Chair: Eija Honkavaara
13:40 Caner Demirpolat: Assessment of boreal forest cover properties from interferometricTanDEM-X data . . . . . . . . . . . . . . . . . . . . . . . . . . . . . . . . . . . . . . . . . . . . . . . . . . . . . . . . . . . . . . . . . . . . . . . . . . . . . . . 56
14:00 Joel Kuusk: BRF of forests . . . . . . . . . . . . . . . . . . . . . . . . . . . . . . . . . . . . . . . . . . . . . . . . . . . . . . . . . . . . . . . . 57
14:20 Ilkka Korpela: Directional reflectance signatures in aerial images – an aid to treespecies classification? . . . . . . . . . . . . . . . . . . . . . . . . . . . . . . . . . . . . . . . . . . . . . . . . . . . . . . . . . . . . . . . . . . . . . . 58
14:40 Wrap-up
9


Poster Presentations

A robust Kd(490) algorithm for remote sensing of optically complex waters Alikas, Krista(1), Kratzer, Susanne(2,3), Reinart, Anu(1)
(1)Tartu Observatory, Tartumaa, Toravere, 61602, Estonia; e-mail:[email protected]
(2)Stockholm University, Stockholm, Stockholm, SE-106 91, Sweden;
email: [email protected] (3)Brockmann Consult GmbH, Max-Planck-Str. 2, 21502 Geesthacht, Germany
We developed and compared different empirical and semi-analytical algorithms for optically complex waters to retrieve the diffuse attenuation coefficient of downwelling irradiance (Kd(490)) and tested them against an independent data set, in order to ultimately suggest a robust algorithm that is valid for optically complex water bodies with high concentrations of CDOM.
In the first approach, developed by [1], revisited by [2], Kd(490) was estimated from the empirical relation between Kd(490) and the ratio of remote-sensing reflectances at two wavelengths within the visible spectrum. Due to MERIS characteristics, several bands in the longer wavelengths (560, 620, 660, 710 nm) were available to retrieve better reference conditions over CDOM dominated coastal waters. Various sets of band ratios were tested to achieve the best estimate for Kd(490) where reflectance data was retrieved either using MERIS standard algorithms (MEGS) or an alternative processor for atmospheric correction and water quality parameters (FUB WeW). In the second approach, Kd(490) was expressed as a function of inherent optical properties (IOP) after the algorithms by [3] and [4]. The IOPs needed as an input for these algorithms were retrieved from MERIS level 2 products (algal_2, total_susp and yellow_subs) or taken from the literature.
We compared the MERIS derived Kd(490) values by various algorithms with values measured in optically complex coastal waters in the Baltic Sea which showed relatively good estimates in case of both methods. The results indicate that for empirical algorithm, the RMS (%) decreases and the coefficients of determination (R2) increases while using the longer wavelengths in the visible spectrum for the reference band. We found that the best estimates were retrieved by using the ratio of MERIS bands Rrs(490)/Rrs(710), which provides a promising approach (RMS 14%, R2=0.98, N=14) for estimating Kd(490) over wide range of values (0.2 - 2.5m-1).
References
[1] Austin, R. W. and T. J. Petzold, 1981. The determination of the diffuse attenuation coefficient of sea water using the Coastal Zone Color Scanner. In: Garver J. F. R. (ed.) Oceanography from Space. Springer, New York. p. 239-256.
[2] Mueller, J.L., 2000. SeaWiFS algorithm for the diffuse attenuation coefficient, K (490) using water-leaving radiances at 490 and 555 nm. In: SeaWiFS Postlaunch Calibration and Validation Analyses, Part 3, Hooker, S.B. and Firestone, E.R. (eds). Greenbelt, Maryland: NASA GSFC, pp. 24-27.
[3] Lee, Z. P., K. P. Du, and R. Arnone, 2005a. A model for the diffuse attenuation coefficient of downwelling irradiance, Journal of Geophysical Research, 110, C02016, doi:10.1029/2004JC002275.
[4] Kirk, J. T. O. (1994). Light and photosynthesis in aquatic ecosystems, 2nd Edition UK: Cambridge University Press 509 pp.
Finnish Remote Sensing Days 2012
13

Vegetation indices detecting the effect of climate change on vegetation
Lea Hallik(1), Joel Kuusk(2), Simone Mereu(3), Inger Kappel Schmidt(4)
(1)[email protected] Estonian University of Life Sciences, Estonia(2)[email protected] Tartu Observatory, Estonia
(3)[email protected] Università degli Studi di Sassari, Italy(4)[email protected], University of Copenhagen, Denmark
"INCREASE" infrastructure (funded by EU 7th Framework Programme) is designed for studying long-term effects of climate change on shrubland vegetation by field experiments. Climate manipulation techniques involve experimental drought and warming treatments in field conditions using sensor-controlled curtains. Plastic curtains controlled by rain sensor are used for extended summer drought, and night-time warming is achieved by covering the vegetation with IR-reflective curtains at night (controlled by a light sensor).
We conducted reflectance measurements in Porto Conte experimental site (Italy) during April 2011 and in Mols site (Denmark) in August 2011. Canopy level reflectance was measured from nadir at 1 m height above the canopy with Field Portable Spectroradiometer SVC HR-1024 using fiber optics (FoV 8 deg.).
Majority of vegetation indices we tested were capable to detect differences between treatments at canopy scale. Vegetation on control plots appeared less stressed than in drought and warming treatment plots by Photochemical Reflectance Index (PRI). Plant Senescing Reflectance Index (PSRI) also suggested that carotenoids to chlorophyll ratio was lower on control plots than treatment plots. Drought treatment plots had lower Anthocyanin Reflectance Index (ARI) and higher Normalized Difference Nitrogen Index (NDNI) values.
Finnish Remote Sensing Days 2012
14

Automatization of a Spectroradiometer Measurement System for Satellite Image Validation
Henna-Reetta Hannula(1), Veli-Pekka Halme(1), and Hanne Suokanerva(1)
(1)Finnish Meteorological Institute, Arctic Research, Tähteläntie 62, Sodankylä [email protected] (Finland)
[email protected] (Finland)
Accurate measurement data is vital to understand and assess the state and changes in the environment. Spectroscopy, mainly made by satellite instruments, is a well established field of research acquiring knowledge of spectral reflectance of Earth’s surface utilized in several environmental applications. However, the validation of satellite data for accurate research purposes is hampered due to atmospheric and vegetation effects, coarse image resolution, and the lack of regionally extensive in situ measurements. This is especially true in remote polar regions.
In project NorSEN (Nordkalotten Satellite Evaluation co-operation Network) an Analytical Spectral Devices (ASD) Field Spec Pro JR spectroradiometer was mounted on a 30-meter-high mast in Sodankylä northern Finland in 2006 [1]. Mast data is providing additional information to reduce the gap between remotely sensed and ground based measurements. The measurement lens installed at the end of a turning pole enables spectral measurements between 350–2500 nm from two different locations – a forest and a forest opening.
Measurement system has suffered several long measurement breaks due to device flaws and till now the measurement procedure has been very complicated. During summer 2012 the system has been automatized by Veli-Pekka Halme and measurements can now be executed by using a single computer and a scheduled script. At the moment, spectral measurements are executed automatically every half an hour between 6–12 UTC. Measurements will be used to validate satellite data retrieval algorithms and e.g. in snow research. Every component of the measurement equipment is controlled via its own Python module which hides the technical details of the communication. Thus, the end user will be able to write a new client software without a need to know, how the devices are controlled. Measurements are taken during months with high enough solar elevation angle. To avoid problems introduced by low temperatures, high winds, and clouds, weather thresholds are set. Nevertheless, the upcoming winter will test the tolerance of the automatization in extreme conditions, and the work to develop a system to gain high-quality and homogenous spectral data will be continued.
References
[1] T. Sukuvaara, J. Pulliainen, E. Kyrö, H. Suokanerva, P. Heikkinen, and J. Suomalainen, ”Reflectance spectroradiometer measurement system in 30 meter mast for validating satellite images,” IGARSS: 2007 IEEE International Geoscience and Remote Sensing Symposium, pp. 2885–2889, 2007.
Finnish Remote Sensing Days 2012
15
Application of Open-Source GIS and live GPS tracking for land use / land cover
field data collection in Kilimanjaro, Tanzania
Pekka Hurskainen(1), Mika Siljander
(1) ), Yelena Finegold(2)
(1)Department of Geosciences and Geography, University of Helsinki
P.O. Box 64, FI-00014 University of Helsinki, Finland
[email protected], [email protected]
2)Department of Geography, Clark University
950 Main Street, Worcester, MA 01610, USA
One of the key outputs of CHIESA project (Climate Change Impacts on Ecosystem Services and
Food Security in Eastern Africa) is the production of accurate and up-to-date land use / land
cover (LU/LC) maps of the project’s study areas. These maps will be used as inputs for
modeling various ecosystem services, SWAT analysis, as well as to detect historical and model
future LU/LC changes.
In April 2012, researchers from University of Helsinki and Clark University conducted field
work in the Southern slopes and surrounding plains of Kilimanjaro, where one of the research
transects is situated. The purpose of the trip was to collect ground control points for satellite
image (SPOT5) orthorectification and training areas for LU/LC classifications. GPS receivers
were used for real-time navigation, collection of waypoints and tracks, and taking geotagged
photographs. The satellite images were roughly georeferenced with old topographic maps before
the field work.
Traditionally in situ data collection for LU/LC mapping has been done with either a
combination of printed maps, satellite images and a hand-held GPS. Alternatively a more
sophisticated solution combines handheld data collector integrated with a GPS, and propriety
GIS software.
The first solution is simple and robust, and works in most situations, but the drawbacks are the
difficulties of positioning and orienteering with the paper prints, and being limited to the fixed
scale. Making remarks on the prints is also cumbersome. The second solution is more user-
friendly and effective, but the equipment and propriety software licenses are expensive and out
of reach for many researchers in the developing world.
A good compromise between the two solutions was tested and found to be very cost-effective
for this study case: A normal hand-held GPS was connected with an USB cable to a PC laptop,
which was running QuantumGIS free/open source GIS software. With the help of live tracking
integrated in the software, the car’s location on the satellite image could be seen and training
areas could be digitized from the satellite image straight away. Geotagged photographs taken
from different LU/LC types served as an additional reference.
Collection of ground control points was also made very easy with this setup: it could be easily
verified from the satellite image, if a particular road crossing was clearly visible in the image,
and had remained the same since the image was taken.
Because the study area was well covered with an extensive road network, the laptop stayed
inside the car at all times, and training area sampling was stratified close to the roads. The
downside of this particular setup is that it is not very portable. However, it would be possible to
connect the GPS to a lightweight tablet running Android OS with QuantumGIS.
We believe the above field data collection method works well especially in developing
countries, and it is very cost-effective since no expensive equipment or software is needed.
Finnish Remote Sensing Days 2012
16

Characterization of OMI tropospheric NO2 over the Baltic sea area
Ialongo I. (1) Hyttinen N. (1) Jalkanen J.-P. (1) Tamminen J. (1)
(1) Finnish Meteorological InstituteErik Palmenin aukio 1, 00560 Helsinki (Finland)
The tropospheric NO2 monitoring at high latitudes using satellite data is challenging because ofthe reduced light hours in winter and the snow-covered surface, which make the retrieval com-plex. The tropospheric NO2 content over land is mainly due to anthropogenic emissions (urbanor industrial areas), while ship emissions constitute the main source in the marine boundary layer.This work presents a characterization of the tropospheric NO2 distribution in the Baltic Sea and itscoastal area during summer months, using OMI (Ozone Monitoring Instrument) NO2 data. Therole of the transport by the wind, in both marine and urban boundary layer, is illustrated usingECMWF wind information. The results show that the NO2 spatial distribution is mainly deter-mined by the contribution of strong westerlies winds, which dominate the wind patterns duringsummer, especially over open sea areas.Fig.1 shows the seasonal NO2 emissions (left panel) from maritime traffic as derived from STEAMmodel (Ship Traffic Emission Assessment Model), based on the messages provided by the Auto-matic Identification System (AIS), which enable the positioning of ships with high spatio-temporalresolution. The emission data are compared with the tropospheric NO2 columns (Fig.1 - centralpanel) during July-August 2006-2011. NOx emission data (Fig.1 - left panel) show that the shipemission sources are mostly located along one main shipping lane along the direction from SW toNE, with some secondary branches. The time series of both NOx emissions and OMI NO2 tropo-spheric columns are shown in the right panel in Fig.1. The time series follows a similar behaviour,both showing a decrease in year 2009 which corresponds to the economical crisis.
2006 2007 2008 2009 2010 2011
6.4
6.6
6.8
7
7.2
7.4
x 105
NO
x e
mis
sio
n (
g/m
onth
)
OM
I N
O2 c
oncentr
ation (
mole
c./cm
2)
Time (years)
1.4
1.5
1.6
1.7
1.8
1.9
x 1015
16oE 17
oE 18
oE 19
oE 20
oE 21
oE
56oN
57oN
58oN
59oN
Jul−Aug 2006−2011
NOx emission (g/month)
0 1 2 3 4
x 106
16oE 17
oE 18
oE 19
oE 20
oE 21
oE
56oN
57oN
58oN
59oN
Jul−Aug 2006−2011
NO2 concentration (molec./cm
2)
1 1.5 2 2.5
x 1015
Figure 1: Comparison between STEAM NOx emissions and OMI NO2 tropospheric columnsduring the period 2006-2011. Left panel: July-August cumulative NOx emissions from STEAMmodel; central panel: July-August mean NO2 concentrations from OMI; right panel: time seriesof both NOx emissions and NO2 columns as derived from the mean value within the black boxesin the left and central panel, respectively.
Finnish Remote Sensing Days 2012
17
UASI Potato Monitoring flight campaign preliminary results
Jere Kaivosoja(1), Liisa Pesonen(1)
, Heikki Saari(2), Jussi Mäkynen(2), Altti Akujärvi(2), Jussi
Tuomisto(3), Jussi Knaapi(4), and Patrik Raski(5)
(1) MTT - Agrifood Research Finland, Helsinki, Finland (2) VTT Photonic devices and meas. sol., P.O.Box 1000, FI 02044 VTT, Espoo, Finland
(3) Potato Research Institute – PETLA, Alapääntie 104, FI-61400, Ylistaro, Finland (4) Jussi Knaapi, FI 61500, Isokyrö, Finland
(5) Eastern Post Oy, Ltd., Sommarbontie 71, FI-02440 Luoma, Finland
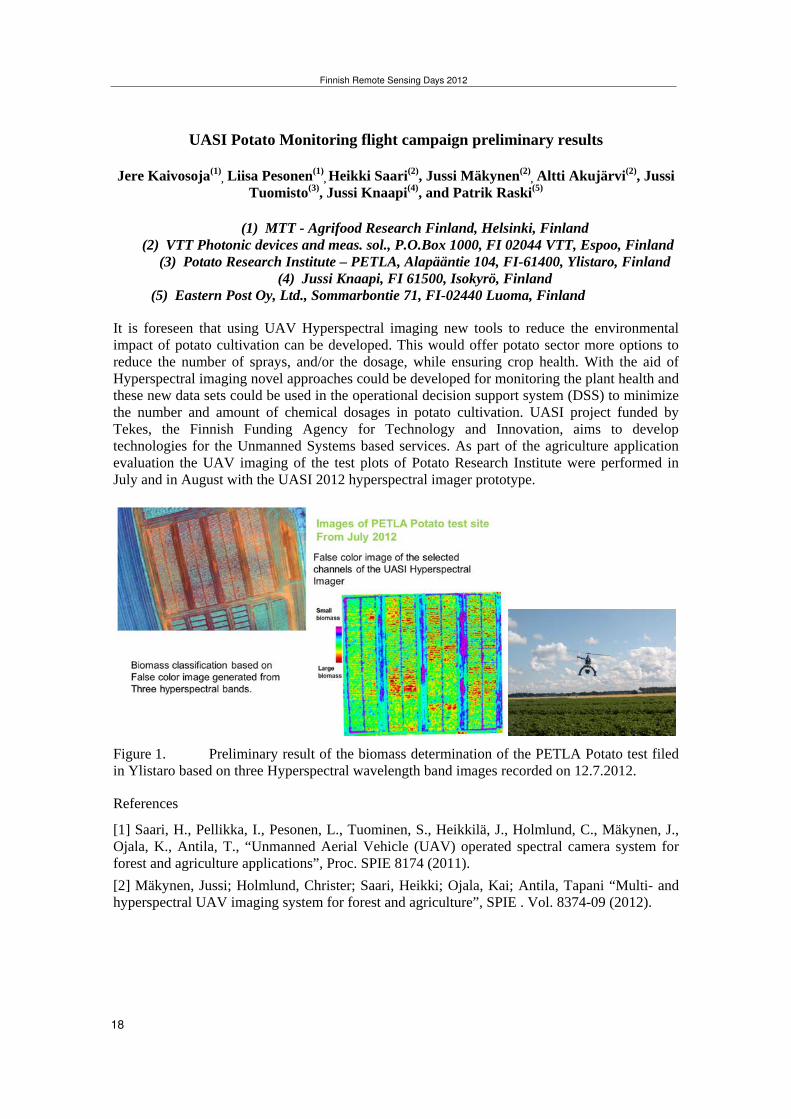
It is foreseen that using UAV Hyperspectral imaging new tools to reduce the environmental impact of potato cultivation can be developed. This would offer potato sector more options to reduce the number of sprays, and/or the dosage, while ensuring crop health. With the aid of Hyperspectral imaging novel approaches could be developed for monitoring the plant health and these new data sets could be used in the operational decision support system (DSS) to minimize the number and amount of chemical dosages in potato cultivation. UASI project funded by Tekes, the Finnish Funding Agency for Technology and Innovation, aims to develop technologies for the Unmanned Systems based services. As part of the agriculture application evaluation the UAV imaging of the test plots of Potato Research Institute were performed in July and in August with the UASI 2012 hyperspectral imager prototype.
Figure 1. Preliminary result of the biomass determination of the PETLA Potato test filed in Ylistaro based on three Hyperspectral wavelength band images recorded on 12.7.2012.
References
[1] Saari, H., Pellikka, I., Pesonen, L., Tuominen, S., Heikkilä, J., Holmlund, C., Mäkynen, J., Ojala, K., Antila, T., “Unmanned Aerial Vehicle (UAV) operated spectral camera system for forest and agriculture applications”, Proc. SPIE 8174 (2011).
[2] Mäkynen, Jussi; Holmlund, Christer; Saari, Heikki; Ojala, Kai; Antila, Tapani “Multi- and hyperspectral UAV imaging system for forest and agriculture”, SPIE . Vol. 8374-09 (2012).
Finnish Remote Sensing Days 2012
18

Atmospheric composition measurements in northern Finland and comparison with
space borne observations
R. Kivi, J. Kujanpää, O. Aulamo, P. Heikkinen, E. Kyrö, P. Ahonen
Finnish Meteorological Institute, Sodankylä, Finland
IASI instrument on board Metop-A satellite provides frequent measurements of greenhouse
gases over the Arctic region. Metop-A is the first of the polar orbiting satellites by
EUMETSAT. Currently IASI Level 2 processing includes water vapor, carbon monoxide,
methane and other gases. Confidence in these remote sensing observations is largely based on
ground based validation. For validation purposes we have used both remote sensing and in situ
techniques. Accurate water vapor profiles were measured by a research grade cryogenic frost
point hygrometer (CFH). The sonde launches were timed to Metop-A overpasses to minimize
the time gap between CFH and IASI measurements. The CFH data were collected during
various measurement campaigns since 2008. The greenhouse gas column measurements were
made by a Fourier Transform Infrared (FTIR) spectrometer. The FTIR instrument in Sodankylä,
Northern Finland is based on the Bruker HR125 spectrometer and it has been optimized for
greenhouse gas measurements. The greenhouse gas measurements started in February 2009,
thus we have more than 3 years of near simultaneous observations. The data from Sodankylä
were recently re-processed using an improved retrieval.
Finnish Remote Sensing Days 2012
19

Modeling lidar-derived boreal forest crown cover with SPOT 4 HRVIR data
Lauri Korhonen(1)
, Janne Heiskanen(2)
, Ilkka Korpela(2)
(1)University of Eastern Finland, School of Forest Sciences
PO Box 111, 80101 Joensuu, Finland
(2)University of Helsinki, Department of Forest Sciences
PO Box 27, 00014 University of Helsinki, Finland
Forest crown cover (CC), defined as the proportion of forest floor covered by the vertical
projection of the tree crowns, is a commonly used parameter in ecological modeling and it
also forms the basis for the international definition of forest. Recent results indicate that
airborne scanning lidars can produce accurate estimates for the CC. A simple fraction of
lidar pulses that hit the canopy above a specific height limit will produce a level of
precision that would otherwise require 30-60 minutes of field work per plot. However, the
scan zenith angle must not be too far from vertical, because oblique pulses may
overestimate CC as they have larger probability to hit the crowns from the side than the
vertical ones.
Airborne lidar data could be too expensive for covering large areas, so in many cases the
use of optical satellite images is more efficient. Two-level sampling schemes, where lidar
data is combined with field measurements to provide reference data for satellite-based
interpretation, are a cost-efficient method for large area inventories. In this study, we
calculated the CC for 64 sample plots in Hyytiälä, Finland, directly from the lidar data
obtained in July 2007. First echoes closer than 30 m to the plot center were included into
the CC calculation. A SPOT 4 HRVIR image with 20 m pixel size was obtained in July
2008. After rectification and atmospheric correction, BRF values were calculated for the
plots using average of the nine nearest pixels. Finally, the well known spectral vegetation
indices NDVI, SR and RSR were calculated for each plot.
Crown cover was predicted by fitting different single predictor regressions. RSR, which
utilizes also the short-wave infrared band in addition to the red and near-infrared bands,
provided the smallest absolute standard error: 8.1%. This result was obtained by fitting an
exponential curve through the origin using nonlinear regression. The best models obtained
with NDVI and SR were clearly worse with standard errors of 13.7% and 15.1%,
respectively. The results agree with an earlier study where RSR was found to predict the
boreal forest leaf area index with higher precision than the other indices.
In conclusion, the result indicates that boreal forest crown cover can be estimated fairly
reliably using a combination of airborne lidar data and medium resolution satellite images.
A common situation in CC modeling is that imprecision of the field data weakens the model
precision significantly. Our results show that this problem can be largely avoided by using
lidar-derived CC instead of quickly made field observations.
Finnish Remote Sensing Days 2012
20

Reference panel for remote sensing studies at Järvselja, Estonia
Joel Kuusk (1) Andres Kuusk (1)
(1) Tartu Observatory61602 Tõravere, Estonia
A reference panel for the support of spectroscopic remote sensing measurements was built atJärvselja, Estonia, 58◦16’5.98"N 27◦18’15.43"E in 2010 (Fig.1). There is no natural surface inEstonia which is large and homogeneous and stable enough to serve as a reference for remotesensing spectroscopic measurements. The Järvselja reference is a 10 m x 10 m horizontal concretepanel which is protected from weather conditions by a removable roof.
The reflectance of the panel surface has been measured on a 1m grid with a field spectroradiometerin the spectral range of 350..2500 nm.
Figure 1: The perspective view of the Järvselja reference taken onboard an UAV
Finnish Remote Sensing Days 2012
21

Biomass and Species Composition Are Tightly Related to Forest Albedo in the Boreal Zone
Petr Lukeš(1), Miina Rautiainen(1), Pauline Stenberg(1)
(1) Department of Forest Sciences, University of Helsinki, P.O. Box 27, FIN-00014, Helsinki, Finland
[email protected] (Finland)
Forests act as pools of carbon dioxide, thus mitigating global warming. On the other hand, some recent studies have demonstrated that the positive effect of forests in the boreal region on the mitigation of climate change can be canceled by the biophysical effects of low surface albedo and evapotranspiration [1]. The relationship between albedo and forest land is, however, complex and little is known about the driving factors of albedo in the boreal zone [2]. Using a radiative transfer model and an extensive forest inventory database, we simulated the albedo of forest stands of the most abundant tree species of Fennoscandia – Scots pine, Norway spruce and Silver birch, including both monospecific and mixed stands. The use of a physically-based radiative transfer model allowed us to uncouple the different factors driving the forest albedo. We analyzed separately how biomass, canopy cover, and species composition influence the shortwave albedo of a boreal forest. The albedos of monospecific forest stands differed significantly between species. The albedo generally decreased with increasing stand biomass. The sharpest decrease in albedo was observed at low biomass values (i.e. growth of a young stand), after which the albedo remained relative stable. Also, an increase in canopy cover was accompanied by a decrease in the albedo. Finally, a significant increase in the albedo of mixed spruce-birch stands was achieved already at a modest fraction of birch. Our results confirm that forest management practices have a significant influence on the albedo of the boreal biome.
References
[1] R. Betts, “Offset of the potential carbon sink from boreal forestation by decreases in surface albedo”, Nature, vol. 408, pp. 187-190, November 2000
[2] G. Bonan, “Forests and climate change: forcings, feedbacks, and the climate benefits of forests”, Science, vol. 320, pp. 1444-1449, June 2008
Finnish Remote Sensing Days 2012
22

Hyperspectral remote sensing in Taita Hills, Kenya
Rami Piiroinen ¹, Tuure Takala ¹, Petri Pellikka ¹, Arto Viinikka ¹
¹ Department of Geosciences and Geography,
P.O.Box 64, 00014 University of Helsinki, Finland,
[email protected] Taita Hills in southeastern Kenya is one of the target areas in CHIESA-project (Climate Change
Impacts on Ecosystem Services and Food Security in Eastern Africa). Projects main donor is
Ministry for Foreign Affairs of Finland. Project is divided in seven work packages and
hyperspectral remote sensing campaign was made by work package 2. Aim of the campaign is to
produce biogeophysical information of the target area for the use of other work packages and
develop classification methods of hyperspectral datasets [1].
The area was divided in low, middle and high zone transects based on the elevation to get optimal
spatial accuracy of 0.5 meters. Additional flights were flown above indigenous forest patches. Data
was collected with SPECIM:s AISA Eagle VNIR sensor in spectral range of 400 – 1000 nm.
Spectral range is divided to 64-channels with approximately 9.3 nm FWHM [2]. The flight
campaign was successful and the data is now under preprocessing, which includes radiometric,
geometric and atmospheric corrections. Georefenced reflectance data will be classified to different
land cover types and shared with other work packages. High spectral and spatial resolution makes it
possible to identify single trees and analyze the turgidity etc. of the target. The first results are
expected during the year 2013.
References
[1] CHIESA. http://chiesa.icipe.org. 2012.
[2] SPECIM. www.specim.fi. 2012.
Finnish Remote Sensing Days 2012
23

Ground point labeling in a terrestrial laser scanning configuration with utilization
of scanner-centered coordinate system
Eetu Puttonen(1)
, Harri Kaartinen(1)
, Antero Kukko(1)
, Sanna Kaasalainen(1)
(1)Department of Photogrammetry and Remote Sensing, Finnish Geodetic Institute
Geodeetinrinne 2, P.O. Box 15, 02431 Masala, Finland
Terrestrial laser scanning (TLS) has developed rapidly over the recent years allowing collection
of high resolution geospatial data from close-range targets.
Close-range scanning means that the intrinsic point cloud densities vary significantly when
compared to more established airborne laser scanning (ALS) data. Moreover, scanning distances
and angles differ from airborne scanning. Scanner location within the target area also means that
completely occluded viewing directions are probable. Also, the noise point number and
distribution differ from those in ALS. Finally, spatial distribution of collected points is heavily
concentrated around the immediate vicinity of the scanner. This can lead to excessively high
point cloud densities that become detrimental for the point cloud processing.
Terrestrial point clouds are usually processed so that their spatial coordinates are first
transformed into reference coordinates. Transformed point cloud information is then combined
with point clouds measured in other scannings. Common ways to create a ground model over
the whole combined data are a) laser point binning into a grid and then searching for the lowest
bin heights, and b) creation of a Triangulated Irregular Network (TIN) from low points in the
data. These approaches result in good quality ground models when distance variance of laser
returns is relatively small compared to the scanning range, i.e. in ALS. However, in a terrestrial
scanning configuration the point distance variance has the same scale as the scanning range.
Moreover, a large number of noise points may occur below ground level in terrestrial scanning
configurations. Presence of below-ground noise points complicates ground determination with
binning and triangulation techniques.
This presentation introduces a novel approach for ground level determination in a terrestrial
laser scanning geometry. The new technique uses scanning geometry information in ground
level determination. The technique uses an assumption that high point density close to the
scanner can be used for accurate initial ground level determination. When the point cloud is
represented in scanner-centered coordinates, the ground level can be estimated with iterative
binning. The iterative binning uses three preset parameters: bin width, rising angle, and layer
height. The parameters prevent inclusion of extreme height changes in cases where height
distributions of bin points change drastically.
The technique offers potential advantages over previous ground detection approaches in a
terrestrial scanning geometry. Firstly, the ground detection algorithm allows pseudo/quasi-
realtime data processing (ground classification can be performed during measurement or shortly
after it, well before actual analysis). Secondly, the use of scanner-centered coordinates makes it
straightforward to remove distant points and to decrease amount of noise coming behind
partially penetrable targets. Thirdly, distance-dependent errors are easier to account for in
scanner-centered coordinates. Finally, ground label information can be transferred directly to a
reference coordinate system with proper indexing.
We present the working principles of the ground detection algorithm in this article, and test its
performance in determining ground level in a forest site, which is scanned with a TLS setup.
Finnish Remote Sensing Days 2012
24
Model-assisted estimation of growing stock in a three-phase sampling survey utilizing ALS sample and wall-to-wall satellite optical data. (Poster)
Svetlana Saarela(1), Göran Ståhl(2), Alessandro Montaghi(3), Annika Kangas(4), Markus Holopainen(5), Sakari Tuominen(6), Juha Hyyppä(7)
(1,4,5)Department of Forest Sciences, University of Helsinki PO Box 27, FI-00014 Helsinki, FINLAND
(2)Department of Forest Resource Management, Swedish University of Agricultural Sciences SLU Skogsmarksgränd, SE-901 83 Umeå, SWEDEN
(3) Department of Agroecology, Aarhus University, Blichers Allé 20, building PV22, 8830, Tjele, DENMARK
(5)Finnish Forest Research Institute PO Box 18, FI-01301 Vantaa, FINLAND
(6) Finnish Geodetic Institute PO Box 15, FI-02431 Masala, FINLAND
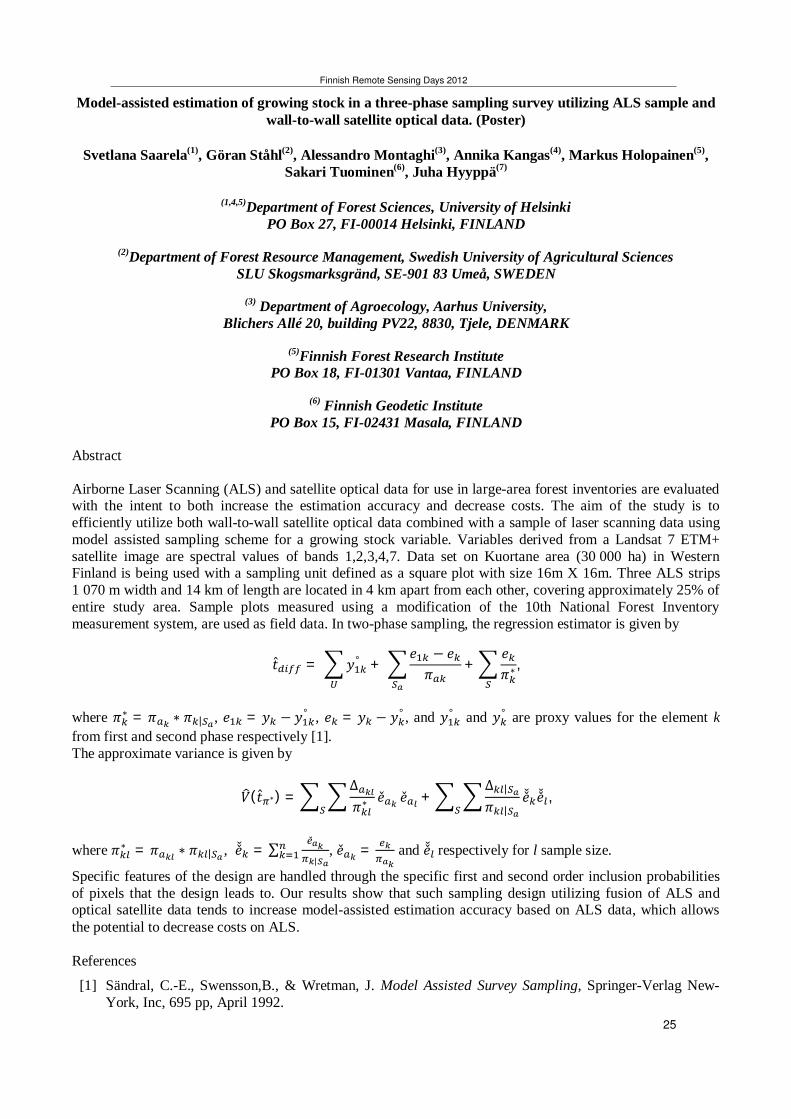
Abstract Airborne Laser Scanning (ALS) and satellite optical data for use in large-area forest inventories are evaluated with the intent to both increase the estimation accuracy and decrease costs. The aim of the study is to efficiently utilize both wall-to-wall satellite optical data combined with a sample of laser scanning data using model assisted sampling scheme for a growing stock variable. Variables derived from a Landsat 7 ETM+ satellite image are spectral values of bands 1,2,3,4,7. Data set on Kuortane area (30 000 ha) in Western Finland is being used with a sampling unit defined as a square plot with size 16m X 16m. Three ALS strips 1 070 m width and 14 km of length are located in 4 km apart from each other, covering approximately 25% of entire study area. Sample plots measured using a modification of the 10th National Forest Inventory measurement system, are used as field data. In two-phase sampling, the regression estimator is given by
= ° + + ,
where = | , = ° , = ° , and ° and ° are proxy values for the element k from first and second phase respectively [1]. The approximate variance is given by
( ) = + |
|,
where = | , =
|, = and respectively for l sample size.
Specific features of the design are handled through the specific first and second order inclusion probabilities of pixels that the design leads to. Our results show that such sampling design utilizing fusion of ALS and optical satellite data tends to increase model-assisted estimation accuracy based on ALS data, which allows the potential to decrease costs on ALS. References
[1] Sändral, C.-E., Swensson,B., & Wretman, J. Model Assisted Survey Sampling, Springer-Verlag New-York, Inc, 695 pp, April 1992.
Finnish Remote Sensing Days 2012
25

Canopy shadow fraction estimation from AISA Eagle using spectral unmixing
Tuure Takala (1)
, Matti Mõttus (1)
(1)Department of Geosciences and Geography,
P.O.Box 64, 00014 University of Helsinki, Finland,
In northern latitudes where the Sun remains in low elevations most of the year, forest canopies are affected by significant shadowing. Shadowed surfaces exhibit different spectral
characteristics than directly sunlit surfaces due to multiple scattering in the atmosphere and
inside the canopy itself. Accurate determination of forest productivity, biophysical variables and
structural parameters often require that we use sunlit and shadowed canopy fractions separately in the calculations, as well as take the magnitudes of both direct and diffuse radiation into
account. It is also essential to establish the magnitude of the shadowed background and separate
it from other components. In case of remote sensing measurements of forest canopies, high spatial resolution is required for an accurate distinction between the shaded and sunlit surfaces.
Since the reflected light in the optical domain can be considered a linear combination of different radiation signals, radiometric measurements can be decomposed to sunlit canopy,
sunlit background, shaded canopy and shaded background that are often referred to as scene
components [1]. The fractions of sunlit and shaded canopy can be calculated once their spectral
characteristics are known individually. By doing this, we will be able to retrieve the ratio of shadowed to total canopy area. This quantity known as canopy shadow fraction is in many ways
required for reliable determination of various biophysical and ecological variables
characterizing vegetation.
Based on our hyperspectral AISA Eagle II measurements of Hyytiälä forest stands, we will
review the methodology for decomposing spectral measurements into four scene components and calculation of canopy shadow fraction. We will focus on spectral mixture analysis, which
has previously been successfully used by [1], [2]. Validation work will be conducted later.
References
[1] P. Scarth, and S. Phinn, "Determining Forest Structural Attributes Using an Inverted
Geometric-Optical Model in Mixed Eucalypt Forests, Southeast Queensland, Australia", Remote Sensing of Environment, 71, pp. 141-157, 2000.
[2] Y. Zeng, M. E. Schaepman, B. Wu, J. G. P. W. Clevers, and A. K. Bregt, "Quantitative
forest canopy structure assessment using an inverted geometric-optical model and up-scaling",
International Journal of Remote Sensing, 30 (6), pp. 1385-1406, 2009.
Finnish Remote Sensing Days 2012
26

Aalto-2 – An Atmospheric Nanosatellite
Tuomas Tikka, Jaan Praks, Antti Kestila, Osama Khurshid, Martti Hallikainen
Aalto University School of Electrical Engineering, Department of Radio Science and
Engineering, P.O. Box 13000, FI-00076 AALTO, FINLAND, [email protected]
Aalto-2 is an atmospheric nanosatellite designed to be part of the QB50 international satellite
network project. The satellite is being built under the coordination of the Department of Radio
Science and Engineering of Aalto University School of Electrical Engineering and is funded by
the Finnish Funding Agency for Technology and Innovation (TEKES). It is designed to be a
two-unit (2U) CubeSat, and it will be mostly built in-house by students of the university.
QB50 will be a network of 50 CubeSats in a ‘string-of-pearls’ configuration, launched to a
circular low Earth orbit at 320 km altitude [1]. The satellites will carry standardized sensors for
multi-point, in-situ, long-duration measurements in the largely unexplored lower thermosphere
and ionosphere. Due to atmospheric drag, the satellites will decay to lower orbits allowing
exploration of lower altitudes. The constellation is planned to be launched in 2015 and the
lifetime of individual satellites is estimated to be about three months.
The main goal of the Aalto-2 project is to advance space technology education and cooperation
in Finland, and help carry out the QB50 scientific mission [2]. The Aalto-2 satellite will be
fitted with the QB50 sensor kit and the design of the rest of the satellite is based on the heritage
received from the Aalto-1 project. Additional payloads are also planned: A highly miniaturized
radiation detector to continue the measurements started with Aalto-1 and a small lightning
sensor to demonstrate lightning detection feasibility from small satellites. The preliminary
subsystem configuration is presented in Fig.1.
Apart from the QB50 scientific experiment, a formation flight experiment is proposed with the
Tartu University ESTELLE satellite [2]. This allows reference measurements for the QB50
scientific measurements as well as the cold gas propulsion experiment of the ESTELLE
satellite. An inter-satellite link is planned to be established with VHF/UHF radios.
Figure 1: Overview of the Aalto-2 system (10*10*22.7 cm).
References
[1] Von Karman Institute of Fluid Dynamics (VKI), Call for CubeSat Proposals for QB50.
Available at: https://www.qb50.eu/call_proposals_QB50.pdf [Accessed 5. Sept. 2012]
[2] A. Kestilä, T. Tikka, O. Khurshid, S. Lan, S.B. Cheikh, J. Praks, A. Näsilä, Aalto-2
Standard QB50 Atmospheric CubeSat preliminary design. [Unpublished]
Finnish Remote Sensing Days 2012
27

Forecasting Outbreaks of the Brown Locust Using Rainfall Estimates,
NOAA Images and SPOT Vegetation Images
Harold Weepener
(1), Margaret Kieser
(2), Anneke Thackrah
(1)
(1)ARC-Institute for Soil, Climate and Water, Private Bag X79, Pretoria, 0001, South Africa.
[email protected] (2) ARC- Plant Protection Research Institute, Private Bag X134, Queenswood 0121, Pretoria,
South Africa. [email protected]
Previous research into modelling outbreaks of the Brown Locust (Locustana pardalina) was
conducted by the Agricultural Research Council (ARC) and Greenwich University from July
2000 to July 2003. The aim of this study is to present a clear outline of the model to define
whether there will be a large outbreak or a plague and to benchmark the outcome of the model
against additional actual reports.
The Brown Locust is endemic to the semi-arid Karoo areas of South Africa and southern
Namibia, and population fluctuations are closely related to climatic and habitat variability. The
high outbreak frequency zones of the Brown Locust in South Africa were first defined in 1937
by Faure and Marais and subsequently confirmed by Lea in 1958 [1]. Due to a significant
westward shift in the eastern boundary between 1937/1958 and 2001, the area was redefined by
Kieser in 2001. Brown locust feeds mainly on grasses and staple foods (maize, wheat) and have
the potential to devastate agriculture throughout Southern Africa.
Rainfall estimate surfaces and vegetation condition surfaces are used to predict locust outbreaks in a long-term (18 month) scenario. The Normalized Difference Vegetation Index (NDVI),
calculated from NOAA and SPOT Vegetation images, is used for vegetation condition. The
model is based on four conditions that have to be true in order to have a large outbreak or
plague.
Condition 1
If the quantity of vegetation was sufficient in the late summer, two years earlier, then there will
be a plague condition.
Condition 2
If the winter rain two years earlier is too high, then no plague will develop.
Condition 3
If sufficient rain is received in the early summer of the current season AND there were plague
conditions before, then a plague condition will develop.
Condition 4
If sufficient rain is received in the late summer of the current season then a plague will develop.
The model gave a correct forecast for 13 of the 15 years from 1992 to 2006.
References
[1] KIESER ME, THACKRAH A. and ROSENBERG J, 2002, Changes in the outbreak region
of the brown locust in southern Africa. Grootfontein Agric, Vol.4, 2002, pp 20-23.
Finnish Remote Sensing Days 2012
28

Using digital camera for measuring leaf inclination angle in crops
Xiaochen Zou, Tuure Takala, Matti Mõttus, Petri Pellikka
Department of Geosciences and Geography, University of Helsinki
P.O. Box 64 (Gustaf Hällströmin katu 2a) FI-00014, Helsinki, Finland
Leaf angle distribution (LAD) is a key parameter for simulating radiation transmission through a
vegetation canopy and for characterizing canopy structure. It plays an import role in controlling
energy and mass exchange in ecosystems [1]. In most studies, however, LAD is assumed to be
spherical as the actual LAD is difficult to estimate. Recently, a simple and reliable method to measure
LAD based on digital photography was developed and validated for various broadleaf tree species [2,
3]. The canopy structure and leaf shape for many common agricultural crops differ significantly from
that of broadleaves. The performance of this promising LAD measurement method in crops has not
been investigated yet. Thus, we present here our results on applying the digital camera LAD
measurement protocol in an agricultural field in Viikki, Helsinki.
Nikon D1x camera on a tripod was used for taking photographs. The camera was levelled using a
bubble level in the flash shoe of the camera. Seven species were measured. Five to six photographs
were taken for each species with a distance about 1 m between crop and camera lens. To record the
shape of the leaves, we scanned 20 fresh leaves of each species in the field using a portable document
scanner. We also recorded the LAI and average leaf angle using the LAI-2000 plant canopy analyser.
Leaves oriented approximately perpendicular to the viewing direction were selected from the
photographs and the angles were estimated by angle measurement tool in ImageJ software. For
straight and flat leaves, angles could be measured directly. However, the long, narrow and curved
leaves angles could be only for leaf sections. Later, the leaf angle distributions for these species were
reconstructed using the measured leaf shapes.
After the data processing, leaf inclination angle distribution functions were built for all species. The
photographically determined LADs were compared with those determined from LAI-2000
measurements. Finally, the functions were used in radiative transfer simulations of Viikki test fields
and the modelled canopy reflectance factors were compared with those measured using an ASD
Handheld field spectroradiometer and an airborne AISA imaging spectrometer in 2011.
References:
[1] W.M. Wang, Z.L. Li, H.B. Su, “Comparison of leaf angle distribution functions: effects on
extinction coefficient and sunlit foliage”, Agricultural and Forest Meteorology, Vol. 143, pp. 106-
122. 2007
[2] Y. Ryu, O. Sonnentag, T. Nilson, R. Vargas, H. Kobayashi, R. Wenk, D.D. Baldocchi , How to
quantify tree leaf area index in a heterogeneous savanna ecosystem: a multi-instrument and multi-
model approach, Agricultural and Forest Meteorology, Vol. 150, pp. 63-76,2010.
[3] J.Pisek, Y.Ryu, K.Alikas, Estimating leaf inclination and G-function from levelled digital camera
photography in broadleaf canopies, Trees, Vol. 25, pp. 919-924, 2011
Finnish Remote Sensing Days 2012
29


Oral Presentations


Sodankylä Satellite Data Centre: An Initiative to Establish Real-Time Satellite
Data-Aided Services in Finland
Jouni Pulliainen, Jyri Heilimo, Petteri Ahonen(1)
(1)Finnish Meteorological Institute, Arctic Research
Tähteläntie 62, FI-996000, Sodankylä, Finland
The overall objective of the initiative is to establish basis for the development of sustainable
Finnish satellite data-aided monitoring and forecasting services. The work is primarily
performed by Finnish research institutes (Finnish Meteorological Institute (FMI) together with
other relevant organizations). However, the aim is to outline, develop, promote and demonstrate
services that are also linked (a) to co-operation with the Finnish industry and (b) to commercial
end-use applications (public-private partnership). A special focus is in applications related to
security (marine, terrestrial and aviation). The activity is also directly linked to the international
co-operation within the fields of space and Arctic activities. This includes the contribution of
Finland to the European Space Agency (ESA) and the EUMETSAT, as well as bi-lateral
initiatives of co-operation.
The development work is largely based on the investments that the Finnish Meteorological
Institute (FMI) carried out during the years 2009-2012 to establish the national Satellite Service
Centre at Sodankylä. The total level of infrastructure investments was 6 M€. A major part of the
investment was the procurement of new 7.3 meter X-band high-capacity satellite receiving
antenna and the construction of the data processing and product archiving/delivery facility. With
satellite receiving station FMI enhances the satellite reception activities at Sodankylä and targets
to increase the user base of satellite products in Finland. Also participation to international
satellite missions as a ground station facility and remote sensing instrument calibration and
validation reference site is important part of future plans
Utilization of satellite imagery and data has not developed in Finland according to the
possibilities available. Possibly on for that has been the availability, difficulty of access and/or
price of the data. The goal here is the increase the utilization of the satellite imagery and data in
its own operations and in Finnish society in general. With its new satellite reception station,
FMI can provide the right satellite products to end-users in time and reliably. Currently
Sodankylä Satellite Data Centre receives data from several spacecrafts: EOS-Aura, EOS-Terra,
Suomi NPP, FengYun-3. Activities stating during 2013 include COSMO-SkyMed SAR-data
reception, data processing and data retail.
Finnish Remote Sensing Days 2012
33

Studying atmospheric composition by satellite measurements
Erkki Kyrölä (1)
(1) Finnish Meteorological InstituteP. O. Box 503, 00101 Helsinki, Finland)
Satellite measurements are essential for monitoring changes in the distribution of ozone and othertrace gases in the troposphere, stratosphere and mesosphere. Both the natural variation and an-thropogenic change of trace gases are strongly dependent onaltitude and latitude. The best globalmeasurements of these changes can be obtained from space using limb viewing instruments. In thispresentation we focus on ESA’s GOMOS instrument and Canadian OSIRIS instrument. Finnishscientists and industry have participated for preparationand operations of both these instruments.
OSIRIS (Optical Spectrograph and Infrared Imager System) is one of the two instruments onboard the Swedish Odin satellite, launched in February 2001. The spectrograph part of the instru-ment measures limb-scattered solar light (radiance) in thewavelength region of 280–800 nm witharound 1 nm spectral resolution. Odin scans toward the Earth’s limb from 7 to 110 km througha controlled nodding motion. The effective Field of View (FOV) is 1–2 km. In turn, the FOV issampled discretely with 1–3 km vertical spacing. OSIRIS is the first dedicated satellite instrumentto measure continuously the vertical composition of the atmosphere using the limb scatter tech-nique and by recording the full spectrum from UV to visible wavelengths with a good spectralresolution.
GOMOS (Global Ozone Monitoring by Occultation of Stars) on board ESA’s ENVISAT satellitemeasures attenuation of stellar light in occultation geometry. Daytime measurements also recordscattered solar light from the atmosphere in the same way as OSIRIS. The wavelength regionsare the ultraviolet-visible band 248–690 nm and two infrared bands at 755–774 nm and at 926–954 nm. From UV-Visible and IR spectra the vertical profiles of O3, NO2, NO3, H2O, O2 andaerosols can be retrieved. In addition there are two 1 kHz photometers at blue 473–527 nm andred 646–698 nm wavelengths. Photometer data are used to correct spectrometer measurementsfor scintillations and to retrieve high resolution temperature profiles as well as gravity wave andturbulence parameters. Measurements cover altitude region 5–150 km. Atmospherically valid dataare obtained in 15–100 km. GOMOS measured nearly one millionozone profiles during its tenyears of operation 2002-2012.
Finnish Remote Sensing Days 2012
34

Finnish Earth Observation in European programmes
Pauli Stigell(1)
(1)Tekes, Finnish Funding Agency for Technology and Innovation
Kyllikinportti 2, 00100 Helsinki, Finland)
Finland started to use aerial photography early. The use of the Finnish air force aircraft fostered
many natural resources measurements in Finland especially from the 1950’s to the 1970’s. In
the 1970’s satellite data was becoming to be utilised. Meteorology with its European and global
connections was the first Finnish user but research on the use of satellite images on forestry
soon followed. The advent of the SAR radar satellite was helping factor in a country where the
weather is always cloudy.
In the 1980’s Finland joined EUMETSAT and European Space Agency, which lead to a more
coordinated national effort to develop satellite remote sensing both in spacecraft instrumentation
development and in applications research.
ESA’s ENVISAT and its French-Finnish GOMOS instrument and NASA’s Dutch-Finnish OMI
instrument were - and still are - major efforts in measuring and studying atmospheric ozone.
ESA’s SMOS satellite in especially measuring soil moisture and the onset of freezing and
thawing of the ground has shown the value of collaboration of satellite, in situ and aircraft
measurements. Finland has had a role in all ESA’s Earth Observation satellites that have been
developed during Finland’s participation in ESA. ESA’s programmes have also been an
important forum for research and to some extent business development in EO applications.
ESA’s ministerial meeting in November 2012 will define the volume of ESA’s Earth
Observation programmes for next several years. The European economy may lead into
decisions where programmes shrink in size. However, ESA plans to hold its following
ministerial meeting in two years when global economy is likely to be in a growing mode again.
In 1995 Finland joined European Union. European Commission’s Framework Programmes in
research have been valuable for Finnish EO community at least since “FP5”. The current
seventh programme is ends with the call with a deadline of 21 November 2012. Finnish research
teams have fared well in the previous calls in GMES, Global Monitoring of Environment and
Security. A Finnish company is building major parts of SAR radars for Sentinel 1 satellite that
is commonly developed by ESA and European Union, and for similar satellites for Germany
and Spain. Finnish researchers are participating in GMES projects on water, ice, snow, climate,
atmosphere, and leading a project on forests and deforestation.
During the period 2014-2020 European Union’s space programmes will change remarkably.
The overall volume of EU’s space activities can increase to 2 billion euro annually, whereas
ESA’s budget is 3.7 billion euro. GMES is likely to become a large independent EU programme
with a budget of 5.8 billion euro for seven years. The 8th Framework Programme has been given
the name “Horizon 2020” – its Space programme will have a budget of order for 1.7 billion
euro. Its contents is still to be defined.
The many European level changes in space progammes’ goals, funding and contents are threats
and opportunities for Finnish Earth Observation.
On national level the Finnish space strategy for years 2013-2020 is being currently defined.
Finnish Remote Sensing Days 2012
35

OBSERVATIONAL ASSESSMENT OF SNOW ACCUMULATION ON
NORTHERN HEMISPHERE IN CMIP5 CLIMATE MODEL SIMULATIONS
AND GLOBSNOW SATELLITE-BASED DATA RECORD
Kari Luojus
(1,*, Jouni Pulliainen
(1, Matias Takala
(1 ,Juval Cohen
(1, Jaakko Ikonen
(1 and Jouni Räisänen
(2
1)
Finnish Meteorological Institute (FMI), P.O.Box 503, Helsinki, Finland. (*e-mail: [email protected]) 2)
Department of Physics, University of Helsinki, Finland
ABSTRACT
The European Space Agency (ESA) GlobSnow project has produced a daily hemisphere-scale satellite-
based snow water equivalent (SWE) data record spanning more than 30-years. The GlobSnow SWE record, based
on methodology by Pulliainen [1] utilizes a data-assimilation based approach for the estimation of SWE which
was shown to be superior to the approaches depending solely on satellite-based data [2]. The GlobSnow SWE
data record is based on the time-series of measurements by two different space-borne passive radiometers
(SMMR and SSM/I) measuring in the microwave region, spanning from 1979 to present day. The sensors utilized
provide data at K- and Ka-bands (19 GHz and 37 GHz respectively) at a spatial resolution of approximately 25
km. The GlobSnow SWE data record is available through the GlobSnow web-pages (www.globsnow.info).
The GlobSnow satellite-based dataset is inter-compared with climate model simulations from the CMIP5
archive. The objective of this work is to investigate the performance of the CMIP5 models in capturing the
evolution of hemispheric scale snow conditions for the period of 1980 to 2010. The climate model simulations on
snow cover extent, snow depth and snow water equivalent are evaluated against the GlobSnow SWE record and
other existing independent ground-based reference data. The eventual goal is to assess the performance of the
CMIP5 models to simulate snow conditions for the time-period that is covered by satellite-based observations.
The results obtained so far indicate a clear decreasing trend in total hemispherical snow mass for the
period of 1980 to 2010 in the remote-sensing based data record. The inter-comparison of satellite-based record
and climate model simulations show notable differences in capturing the evolution of Hemispherical scale snow
conditions. Similar trends of decreasing snow cover are also seen in the investigated CMIP5 models, although
there are notable differences between the various climate models. Some of the models capture the overall
hemispherical snow mass more accurately than others. In general the winter months (December, January and
February) seem to be rather well captured, while the spring season, (March, April and May) appears more
challenging for the climate models.
REFERENCES
[1] Pulliainen, J. Mapping of snow water equivalent and snow depth in boreal and sub-arctic zones by
assimilating space-borne microwave radiometer data and ground-based observations. Remote Sensing of
Environment. 101: 257-269. DOI: 10.1016/j.rse.2006.01.002.
[2] Takala, M., Luojus, K., Pulliainen, J., Derksen, C., Lemmetyinen, J., Kärnä, J.-P, Koskinen, J., Bojkov, B.,
“Estimating northern hemisphere snow water equivalent for climate research through assimilation of space-borne
radiometer data and ground-based measurements”, Remote Sensing of Environment, Vol. 115, Issue 12, 15
December 2011, Pages 3517-3529, ISSN 0034-4257, DOI: 10.1016/j.rse.2011.08.014.
Finnish Remote Sensing Days 2012
36

Sea ice remote sensing R&D at Finnish Meteorological Institute
Marko Mäkynen, Markku Similä, Juha Karvonen, Bin Cheng, Eero Rinne, Ari Seinä
Finnish Meteorological Institute, Marine Research Unit P.O. Box 503, FI-00101 Helsinki, Finland
The presence of sea ice has large practical and economical importance in several countries and regions in the world. Satellite based timely information on sea ice condition and its variability is
essential for all operations in ice-covered areas. In the Baltic Sea ice information is mainly
needed for ship navigation and planning of icebreaker operations, but in the Arctic marginal seas like Barents and Kara Seas also for off-shore operations and fishery. Sea ice information is
also input data for numerical weather prediction models and it can be assimilated to sea ice
models for better short-term prediction of ice conditions.
As a part of Marine Research Unit the Ice Research Group conducts research and development of sea ice products based on satellite data and sea ice models. The main target area has been the
Baltic Sea where satellite data in ice monitoring and R&D has been operational since 1978, and SAR data since 1992. In recent years we have also developed sea ice products for the Barents
and Kara Seas based on earlier Baltic Sea products and also on some new methods. The main
source for the sea ice products are SAR images due to their fine resolution (10-100 m) and independence of cloud cover. Other satellite data utilized includes radiometer and optical data.
Here we give overview of the current operational sea ice products: e.g. Baltic Sea level ice
thickness chart and ice drift chart showing also convergence/divergence ice zones, delivered through Polar View (ESA) and MyOcean (EC) project web-portals, and some products under
development, e.g. sea ice thickness chart for the Barents and Kara Seas based on a sea ice
thermodynamic model and multisensor satellite data, see Fig. 1. The sea ice products are derived with automatic algorithms incorporating statistical relationships between sea ice
characteristics and satellite signatures, modelled sea ice parameters, image processing and
pattern recognition.
Fig. 1. Sea ice thickness chart on 15 Jan 2010 based on ENVISAT ASAR WSM, AMSR-E and
a sea ice thermodynamic model data. The chart covers part of the Barents and Kara Seas. Each grid cell represents the mean thickness over the cell. The grid size is 1x1 km. The ice thickness
range is from 0 to 1 m.
Finnish Remote Sensing Days 2012
37

Sea Ice Concentration Retrieval Based on Dual-Polarized C-Band SAR
Juha Karvonen (1)
(1) Finnish Meteorological Institute (FMI)PB 503, FI-00101, Helsinki, Finland
email: [email protected]
Ice concentration is defined as the proportion of the ice covered area over a given area. High-resolution ice concentration information are required for navigation, validating ice models anddata assimilation. The currently available operational ice concentration products are based on mi-crowave radiometer data and their typical resolution is several kilometers. For example Universityof Bremen delivers operational (global) ice concentration products based on AMSR-E and SSMI/Sdata using an algorithm called the ASI algorithm [1]. However, also data from SAR instrumentscover large sea and ocean areas with a much higher precision than that of the radiometer data,and they are not very efficiently utilized in operational monitoring of the ice concentration yet. In[2] we have shown that the local autocorrelation can be used to distinguish between open waterand sea ice for HH-polarized C-band data. Recently we have also studied the estimation of theice concentration based on the C-band SAR HH-channel autocorrelation distributions [3]. In thispresentation we also include the cross-polarized (HV) channel, and study whether the concen-tration estimates can significantly be improved by including the cross-polarized channel. In thisexperiment we use the HH-channel concentration estimate of [3] as a starting point. Then we addi-tionally include two features based on the HV-channel: the HV channel backscattering coefficientσ0HV , and the polarization ratio P = (σ0HH−σ0HV )/(σ
0HH+σ0HV ). The HH-channel estimate and
the two new features with the incidence angle value are used as inputs of a multi-layer perceptron(MLP) neural network with the error backpropagation training algorithm. The incidence angle isused as one input to avoid the explicit modelling of the incidence angle dependence of σ0HV . Thenew concentration estimates are computed for the same data set as used in [3], and the perfor-mances of the single-polarization and dual-polarization algorithms can thus directly be compared.The data set consists of 31 dual-polarized wide swath mode Radarsat-2 images over the BalticSea, acquired during the first half of March 2011. The data set includes both dry snow cover andwet snow cover cases. The reference data used in training and testing of the algorithm are the iceconcentrations of the gridded Finnish Ice Service ice charts. We also make a comparison with theASI algorithm concentrations over the Baltic Sea area.
References
[1] G. Spreen, L. Kaleschke, G. Heygster, "Sea Ice Remote Sensing Using AMSR-E 89GHzChannels", Journal of Geophysical Research, v. 113, n. C2, 2008.
[2] J. Karvonen, M. Similä, M. Mäkynen, "Open Water Detection from Baltic Sea Ice Radarsat-1SAR Imagery", IEEE Geoscience and Remote Sensing Letters, v. 2, n. 3, pp. 275-279, 2005.
[3] J. Karvonen, "Baltic Sea Ice Concentration Estimation Based on C-Band HH-polarized SARData", IEEE Journal of Selected Topics in Applied Earth Observations and Remote Sensing,in press, 2012.
Finnish Remote Sensing Days 2012
38

ICEMAR – a System for Sea Ice Information Delivery
Robin Berglund(1)
, Renne Tergujeff(1)
, Antti Pesonen(1)
, Teppo Veijonen(1)
, Ari Seinä(2)
(1)VTT Technical Research Centre of Finland, Vuorimiehentie 3, Espoo, Finland
(2) Finnish Meteorological Institute, Erik Palme'nin aukio 1, Helsinki Finland
The sea ice in the Arctic seems to be diminishing at an accelerating pace. This opens up
opportunities for transportation in the Arctic area. Still the conditions are extreme and a
prerequisite for safe shipping is the availability of good forecasts of the sea- and ice state. There
are many national ice services providing ice information, but delivering this information to ships
in the Arctic area is challenging and often requires polling of many sources, which is
cumbersome and time consuming.
In ICEMAR, a project funded by the European Commission, a consortium consisting of system
providers, a satellite service provider, ice chart producers and maritime educators, a system is
built that acts as an automated ordering and delivery portal for sea ice information for on board
use. Project coordinator of the consortium is Kongsberg Satellite Services (KSAT) in Norway.
The ICEMAR User sets up a profile defining area of interest, products of interest and on board
display and communications capabilities. This information is then utilized by a server acting as
the common hub that gathers products (ice charts, satellite images and iceberg information)
from different producers in real time. Based on the user specific profile parameters enhanced
with information about the current position of the ship, the ICEMAR server selects, converts
and subsets the products to be delivered to the user over existing telecommunications channels.
VTT develops the on board part of the system, the so called ICEMAR Manager (IMM), which
communicates with the ICEMAR server using XML based messages. On reception of the
ordered products the IMM automatically decompresses the packages and puts the products in a
predefined folder for export to an on board viewing application such as ViewIce or as an
additional layer to an ECDIS system.
The system will be piloted on some ships in the Arctic area. The main trial period will be after
May 2013. Trials will also be performed in the Baltic Sea in the ice season of 2013.
Fig 1. The ICEMAR system
Finnish Remote Sensing Days 2012
39

Detection of Soil Moisture and Soil Freeze Using Microwave Radars
Tuomo Smolander, Jouni Pulliainen
Finnish Meteorological Institute
PL 503
00101 HELSINKI
Finland
A method for detection of soil moisture and soil freeze using microwave radar measurements is
presented. The detection is based on an inversion method presented by Pulliainen et al. in [1]. It
employs a semiempirical backscattering model that describes the dependence of radar
backscattering of forest as a function of stem volume, soil moisture, vegetation canopy
moisture, surface roughness and incidence angle. The backscattering model was developed
using C- and X-band airborne HUTSCAT scatterometer data. The backscattering of soil is
determined using model presented in [2]. The inversion is made using a constrained least-
squares algorithm.
The method gives an estimate of soil moisture. It can be used to detect soil freeze by
determining a treshold value below which the soil is considered to be frozen. This method can
be used with both low resolution scatterometer measurements and higher resolution SAR-radars.
We are applying it to space borne ASCAT and ASAR instruments. The main validation site is
FMI Sodankylä-Pallas supersite.
References
[1] Jouni T. Pulliainen, Terhikki Manninen, and Martti T. Hallikainen, “Application of ERS-1
Wind Scatterometer Data to Soil Frost and Soil Moisture Monitoring in Boreal Forest
Zone,” IEEE Transactions on Geoscience and Remote Sensing, vol. 36, no. 3, pp. 849-
863, May 1998.
[2] Yisok Oh, Kamal Sarabandi, and Fawwaz T. Ulaby, “An Empirical Model and an
Inversion Technique for Radar Scattering from Bare Soil Surfaces,” IEEE Transactions on
Geoscience and Remote Sensing, vol. 30, no. 2, pp. 370-381, March 1992.
Finnish Remote Sensing Days 2012
40
EUFODOS - European Forest Downstream Services Improved Information on Forest Structure and Damage - Project presentation
Mathias Schardt (1), Granica, Klaus (1), Astola, Heikki (2)
(1) Joanneum Research, Steyrergasse 17, Graz, 8010, AUSTRIA (2) VTT, Technical Research Centre of Finland, P.O.Box 1000, 02044-VTT, Espoo, Finland
Forests play a key role in the European economy and environment. This role incorporates ecological as well as economic functions which can be affected by the occurrence of insect infestations, storms or windfall events. Local or regional authorities thus require detailed information on the degradation status of their forests to be able to take appropriate countermeasures against forest damage and to ensure sustainable forest management. The EUFODOS project will use state-of-the-art satellite and laser scanning technology to provide forest authorities with cost-effective, timely and comprehensive information on forest structure and damage. EUFODOS is carried out within the GMES programme and is scheduled to run from January 2011 to the end of 2013. The main goals The European Earth Observation Programme GMES provides data useful in tackling a range of issues including climate change and citizens’ security. The purpose of GMES is to deliver information which corresponds to user needs. The Forest Downstream Services (FDS) to be developed within EUFODOS include in particular the assessment of forest damage and the measurement of functional parameters for commercial and protective forests. For example the latter has an important function to maintain the safety of settlements and infrastructure in alpine areas. The assigned monitoring services, urgently required by regional European forest authorities, will be developed to an operational level by a consortium of research organisations and commercial service providers from Austria, Germany, Finland, Italy, Bulgaria and Poland. The benefits The use of space- and air-borne sensor platforms allows data to be acquired at short time intervals and in a cost effective way. The Forest Downstream Services will thus provide fast and reliable information for effective damage assessment and sustainable forest management on a regional scale. The data can be utilized by users in a wide range of applications:
Effective damage assessment and countermeasures: identification of damaged areas – due to storm, fire or insect infestations – in order to enable proper countermeasures, compensation payments and reforestation planning
Sustainable management of protective forests: targeted management of protective forests in order to maintain and enhance their protective function against natural hazards
Sustainable management of commercial forests: wood procurement planning and strategic investment planning for commercial forests
Reporting: revision of forest maps and inventories, compilation of regular reports and annual statistics (e.g. changes in forested area), establishment of forest damage information systems
EUFODOS involves an extensive user community well connected to other related GMES User Groups. This construction will facilitate the roll-out of the services and will create a strong socio-economic benefit.
The research leading to these results has received funding from the European Union Seventh Framework Programme (FP7/2007-2013) under grant agreement n° 262786.
Finnish Remote Sensing Days 2012
41

Spectral Characteristics of Hypespectral and Multispectral Sensors for Area BasedTree Species Classification
Paras Pant1, Ville Heikkinen1, Aarne Hovi2, Ilkka Korpela2, Markku Hauta-Kasar1, and TimoTokola3
1School of Computing, POB 111, 80101, University of Eastern Finland,(Finland)2Department of Forest Sciences, POB 27, 00014 University of Helsinki, (Finland)
3School of Forest Sciences, POB 111, 80101, University of Eastern Finland, (Finland)
Area based tree species classification using spectral characteristics of hyperspectal (HS) sensorand the simulated spectral characteristics of four band Vexcel UltraCam-D (UCD) and UltraCam-X (UCX) multispectral sensors was studied. Airborne hyperspectral images of the tree canopywere acquired in Hyytiälä forest [1] using SPECIM, AisaEAGLE line scanning hyperspectralcamera. The flight campaign was organized on July 22, 2011 from 6:44 to 7:38 GMT. HS imageswith 64 spectral bands were acquired in the wavelength region 400 nm to 1000 nm using spectralsampling of 9.3 nm. The pixel size at ground was approximately 0.5 m. The camera field of view(FOV) was 35.8◦. The forest was imaged in nine strips. Strips were radiometrically calibrated toradiance and geometrically rectified into WGS84 UTM zone 35 projected coordinate system [2].In total, 577 forest plots (each plot has single species) of three tree species (254 pines, 177 sprucesand 146 birches) visible in HS image strips were identified by an expert using previously acquiredLiDAR and other aerial images. For each plot 21× 21 pixels window (10.5m2 area) was extractedfrom HS image, the mean spectrum was calculated and used as a feature in classification process.The quadratic discriminant analysis (QDA) was used as the classifier. To measure the classificationperformance of the sensors the classification rate (CR) and the kappa value (KA) were calculated.Leave-One-Out classification results for spectral characteristics of HS sensor and the simulatespectral characteristics of UCD, UCX sensors (for the 577 plots extracted from 9 strips) are shownin Table.1. There are no significant differences in the classification results between the UCD andUCX sensors both were around 89.5% and kappa 0.84. The HS sensor gives the best classificationaccuracy (98.4%). With HS sensor, there is around 16% increment in pine class and 5% in spruceclass. These high classification accuracies are partly due to limited view-illumination geometriesand short measurement time intervals between the strips.
Table 1: Leave-One-Out classification results for the simulate spectral characteristics of UCD,UCX sensors and spectral characteristics of HS sensor for the 577 plots extracted from 9 strips.
SensorTotal Pine Spruce Birch
CR [%] KA CR [%] CR [%] CR [%]UCD 89.4 0.84 83.1 89.8 100.0UCX 89.6 0.84 83.5 89.8 100.0HS 98.4 0.98 100.0 94.9 100.0
References
[1] I. Korpela, H. O. Orka, M. Maltamo, T. Tokola, and J. Hyyppä, Tree Species ClassificationUsing Airborne LiDAR - Effects of Stand and Tree Parameters, Downsizing of Training Set,Intensity Normalization, and Sensor Type, SilvaFennica, vol. 44, no. 2, pp. 319 -339, 2010.
[2] L. Markelin, E. Honkavaara, T. Takala, D. Schläpfer, J. Suomalainen and P. Pellikka, A NovelApproach For The Radiometric Correction Of Airborne Hyperspectral Image Data, ISPRS,vol. 3, no. 3, pp. 1451-1460, 2012.
Finnish Remote Sensing Days 2012
42

Cross-Border Comparison of Forest Area Changes Caused by Clear-Cutting and
Afforestation of Abandoned Agricultural Land Using Snow Covered Satellite
Imagery in northeastern Europe
Urmas Peterson
(1), Mait Lang
(1), Jaan Liira
(2) and Tiit Nilson
(1)
(1)
Tartu Observatory, Tõravere Tartumaa EE61602, Estonia;
Institute of Forestry and Rural Engineering, Estonian University of Life Sciences,
Kreutzwaldi 5, Tartu, EE51014, Estonia. (2)
Institute of Ecology and Earth Sciences, University of Tartu, Lai 40, Tartu, EE51005,
Estonia
Boreal and northern temperate forests cover substantial parts of European land area.
These forests are subjected to several kinds of tree removal disturbances, dominated by clear-cut
logging. There is a need for quick and cost-efficient remote sensing methods to provide an
independent means of detecting disturbances and recording the history of disturbances both at
regional, national as well as at European level.
The forests at northern latitudes are characterized by winters in which snow cover remains for
some months of the year. Winter images are particularly suitable for change detection, while
snow provides a uniformly bright background that accentuates tree crowns and their shadows
and provides remarkable conditions for separating forested from non-forested areas. Winter
images are particularly appropriate for monitoring gradual changes on lands that were formerly
in agricultural use, that have been abandoned and are in places growing into forests.
We highlight a methodological approach of remote sensing based mapping of forest
patches, forest disturbances and regrowth of forests on formerly non-forested land in the Baltic
and Russian regions. Satellite imagery used are multi-temporal winter imagery, obtained from
medium spatial resolution satellite scanners onboard Landsat and SPOT and from scanner Aster
together with more high resolution Quickbird images. The mapping examples cover the areas in
Eastern Europe in Estonia, Latvia and western parts of Russia. The time period covered is from
1987 to 2011.
Results show that a very simple approach using winter images is useful in mapping
forest patches, canopy removal disturbances in forests and appearance of new forest patches
within the context of agricultural lands in the situation of abandonment of agricultural land. We
conclude that the use of snow-covered satellite images for forest change detection can be very
efficient alternative to the use of summer images.
Finnish Remote Sensing Days 2012
43

Tracing variations of deciduous component over
grassland–forest continuum by subpixel classification
Skånes, Helle(1)
, Pitkänen, Timo(2)
, Käyhkö, Niina(2)
(1)Department of Physical Geography and Quaternary Geology, Stockholm University, 106 91
Stockholm, Sweden (2)
Department of Geography and Geology, University of Turku, 20014 Turku, Finland
Land cover classifications based on satellite imagery has traditionally paid little attention to
fragmented and complex components of the landscape, such as grasslands and deciduous
forests. They are typically treated as spectral noise between more robust and major classes and
as such they are obliterated from the final classification through post-classification procedures.
However, the deciduous component, including deciduous forests, wooded grasslands and
spontaneous deciduous forests succession on former grasslands, is generally pinpointed as the
main carrier of biodiversity in the rural landscape [1][2] and must therefore be treated in any
future satellite based environmental monitoring process.
In this paper, we test the possibilities of using mid-resolution satellite imagery (Landsat TM and
SPOT) in the detection and quantification of transitional deciduous component. As the
component is highly heterogeneous in terms of spectral characteristics, we have selected a
hybrid classification which combines supervised and spectral unmixing approaches, assisted by
high precision acquisition of training data from CIR aerial photographs. The rationale behind
the procedure is to narrow down the complexity of the target and utilize the advantages of
different classification methods thus gaining a reliable estimate of the deciduous
characterization of grassland–forest continuum. As a result, a three-level product including pure
grassland component, pure deciduous forest component and mixed transitional component with
further categorization is presented. Furthermore, landscape ecological consequences of the
classification as well as its relation to land use history are discussed.
Preliminary results indicate that as expected, detection of pure components is fairly
straightforward compared to the classification of the mixed component. Spectral unmixing
approach offers a promising way of making detailed observations on fractional elements and has
previously been tested e.g. to detect urban mixed vegetation [3] and cypress canopies [4], but
workflow also includes the specification of multitudinous parameters which make the results
prone to unintentional misinterpretations. However, if accomplished carefully and subjected to
detailed verification, results may be highly applicable for detection and stratification of
transitional deciduous component in a way significant for landscape ecological approaches.
References
[1] Käyhkö, N., Skånes, H., 2006. Change trajectories and key biotopes – Assessing landscape dynamics
and sustainability. Landscape Urban Plan. 75, 300-321.
[2] Käyhkö, N., Skånes, H., 2008. Retrospective land cover/land use change trajectories as drivers behind
the local distribution and abundance patterns of oaks in south-western Finland. Landscape Urban
Plan. 88, 12–22.
[3] Myint, S.W. 2006. Urban vegetation mapping using sub-pixel analysis and expert system rules: A
critical approach. International Journal of Remote Sensing 27, 2645-2665.
[4] Wang, J. and Lang, P.A. 2009. Detection of Cypress Canopies in the Florida Panhandle Using
Subpixel Analysis and GIS. Remote Sensing 1, 1028-1042.
Finnish Remote Sensing Days 2012
44

Consequences of land cover transitions on the sustainability of coral
rag forests in Zanzibar, Tanzania
Niina Käyhkö(1)
, Markus Kukkonen(1)
, Nora Fagerholm(1)
(1)Geography Division, Department of Geography and Geology
University of Turku, 20014 Turku, Finland
Forests are complex socio-ecological systems, which are overused especially in the tropicalregions. It has been estimated that about 6 million hectares of primary forest is lost globallyeach year due to agriculture, logging and other human activities [1]. For many decades,governments and global community have tried to tackle the issue of forest deterioration, but themechanisms leading into forest degradation relate to complex dynamics of physical, social,economic and cultural factors [2]. At local scales, these changes relate closely to values andpreferences set on different land use strategies and materialise as various temporary andpermanent land use and land cover transitions [3]. At broader scales, land cover transitions aremanifestations of the overall land use developments and changes in biophysical and socio-economic factors [4].We have studied land cover and land use transitions in a tropical island ofZanzibar at local and regional scales using contemporary and historical remote sensing dataover the last 50 years. We used spatio-temporal change trajectory analysis [5] on a set ofconsecutive aerial images (1953-1978-1989-2005) at local scales and post-classification changedetection techniques on Landsat TM (2009) and SPOT XS (1996) images at regional scale todetect major land cover and forest transitions. The outcomes of regional level change detectionwere linked to biophysical factors through regression analyses to explain happened and topredict future changes [4]. Our results show that Zanzibar is deforesting with annual pace of0.8–1.1%, but within the rural land use regimes significant part of the changes are temporaryand forest have capacity to re-establish at local scales. Rates and causes of deforestation seem todiffer between the eastern coral rag and the western deep soil areas. At landscape scale, recentdeforestation concentrates to the vicinity of the coastline, roads and Zanzibar Town, where alsothe future risk of deforestation is highest. Deforestation is a direct result of agricultural andurban expansion, but shifting cultivation, fuel wood collection, logging, grazing and extractionof coral cause more subtle forest degradation. Detecting changes at multiple spatial andtemporal scales shows the complexity of land cover transitions where forest losses aresimultaneously coupled with forest gains and where forests are not simply lost but experiencedifferent level of degradation. Since we used two different classification schemes at regionalscale, we were able to establish range of deforestation rates rather than one single figure.
References
[1] FAO (Food and Agriculture Organization of the United Nations), “Global Forest ResourcesAssessment 2010, Main Report,” FAO Forestry Paper 163, 2010.
[2] A.B. Brink, and H.D. Eva, “Monitoring 25 years of land cover change dynamics in Africa: Asample based remote sensing approach,” Applied Geography, vol. 29, pp. 501–512, 2009.
[3] E.F. Lambin, and P. Meyfroidt, “Land use transitions: Socio-ecological feedback versussocio-economic change,” Land Use Policy, vol. 27, pp. 108–118, 2010.
[4] A. Veldkamp, and E. Lambin, “Predicting land use change. Agriculture, Ecosystem and
Environment,” vol. 85, pp. 1–6, 2001.
[5] N. Käyhkö, and H. Skånes, ”Change trajectories and key biotopes – assessing landscape
dynamics and sustainability, “ Landsc. Urban. Plan. vol. 75, pp. 300–321.
Finnish Remote Sensing Days 2012
45

Forest crown cover estimation in northern boreal and temperate European forest
Laura Sirro, Tuomas Häme, Heikki Ahola, Anne Lönnqvist
VTT Technical Research Centre of Finland, P.O. Box 1000, 02044 VTT, Finland
Forest crown cover that is defined as the percentage of the forest area covered by vertically
projected tree crowns is a versatile indicator of forest’s structure and condition. The most used
definitions of forested areas are based on crown cover percentage. Crown cover reflects forest’s
productivity and carbon assimilation. Decrease of crown cover may indicate forest degradation.
While it is laborious and expensive to assess crown cover on ground, earth observation provides
a cost efficient alternative for the fieldwork. For independent accuracy assessment of the crown
cover estimates, reference data can be collected by visual interpretation of very high resolution
optical earth observation data with a reasonable effort.
A method for forest crown cover estimation using high resolution optical earth observation data
was developed and tested at four study sites in Europe. Crown cover was estimated using the
probability estimation method of VTT and Image2006 data. The accuracy of the crown cover
predictions was assessed using reference data that were collected by visual interpretation of very
high resolution aerial and space borne imagery.
The average crown cover values in the reference data varied from 17 % to 86 % and in the
predictions from 18 % to 80 %. The absolute root mean square error of the crown cover
predictions varied between 14 % and 33 %. The results of the study showed that it is possible to
map forest crown cover with twenty to thirty meter spatial resolution optical earth observation
data using the single pixel values. However, understanding the variable results at different sites
requires further investigation. To support this, a more comprehensive set of validation data is
being collected and analyzed.
The study was part of Geoland2 project that has received funding from the European Union
Seventh Framework Programme (FP7/2007-2013) under grant agreement n° 218795. This
presentation is based on the conference paper that was given in Sentinel-2 Preparatory
Symposium in April 2012.
Finnish Remote Sensing Days 2012
46

Detecting landuse and landcover changes in reindeer pastures using multi-sourceremote sensing and GIS data
Timo Kumpula1 and Sonja Kivinen2
1Department of Geographical and Historical Studies, University of Eastern Finland, FI-80101Joensuu, Finland, E-mail: [email protected]
2Department of Geography, University of Oulu, P.O. Box 3000, FI-90014 University of Oulu,Finland, E-mail: [email protected]
We are investigating land use and land cover changes and their effects on reindeer husbandry in theLappi reindeer herding district in eastern Lapland over the past six decades. Forestry, hydropowercontsruction, tourism, nature conservation, and recently mining are major drivers of land use/coverchanges in the research area. There have been conflicts between other land use forms and reindeerhusbandry because of resource utilization for different purposes and subsequent adverse effects oneach other. A series of Landsat MSS, TM and ETM+images (1972, 1987, 1993 2005, 2011) andCorona images (1977) were used to detect land cover changes in a study area of 4553 km2. Moredetailed analyses of land cover changes were carried out in three locations within the study area usinga series of aerial photography from late 1950’s to 2000’s. Information on forest logging history weregained from Forest Government (Metsähallitus) logging plans (1950’s) and follow up maps. This datawas transformed into GIS database. Information of reindeer herding system and its changes in thestudy region were derived from old maps and interviews with reindeer herders.
The results highlight various changes in land cover/use resulting from clear-cutting, road construction,use of herbicides and the construction of artificial lakes. The area of young forests had significantlyincreased in the landscape. Old forests were mainly found in protected areas (national and natureparks, wilderness areas). Further, the density of the road network had noticeably increased as a resultof the construction of forestry roads and tourism. From the reindeer husbandry viewpoint the numberand the extent of disturbances in the landscape have increased during the past decades. Forestry hasmainly negative effects on reindeer husbandry through the reduced amount of ground-growing andarboreal lichens. Artificial lakes have reduced the area of suitable pastures and disturbed pasturerotation system. Further, increased tourism in the vicinity of Saariselkä skiing resort park havedisturbed reindeer herding in fjell areas. Cumulative impacts of land use and land cover changes arereflected to the spatio-temporal land use of reindeer husbandry as reindeer herding system tries toadapt to new conditions and shrinking pasture land
Finnish Remote Sensing Days 2012
47

Aalto-1 Spectral Imager: Design and Mission
Antti Näsilä, Kai Viherkanto, Heikki Saari, Jarkko Antila, Rami Mannila, Christer
Holmlund, Jussi Mäkynen, Ismo Näkki, Uula Kantojärvi, Tapani Antila, Hans Toivanen
VTT Technical Research Centre of Finland
P.O. Box 1000, FI-02044 VTT, Finland
The Aalto-1 Spectral Imager (AaSI) is a miniaturized spectral imager capable of recording
images at 20+ selectable wavelength bands between 500 and 900 nanometers.
VTT has developed tunable Fabry-Pérot interferometer (FPI) modules based on piezo or
electrostatic actuation. A spectral imager can be built by combining this kind of a tunable FPI
and an RGB CMOS or CCD sensor. AaSI will have an RGB CMOS sensor consisting of
1024x1024 pixels, which allows the minimum ground pixel size of ca. 100 meters. These technologies enable extremely lightweight spectrometers and spectral imagers (< 500 g) which
are suitable for small unmanned aerial vehicles and different space applications.
AaSI will be developed as a part of the ESA activity “MEMS Fabry-Perot interferometer
technology for miniaturized hyperspectral imagers and microspectrometers”, which has started in autumn 2012. This project will perform space qualification testing (vibration, thermal and
thermal vacuum) for piezo-actuated and MEMS FPI’s. The spectral, radiometric and spatial
performance of the instrument will be tested on the Aalto-1 nanosatellite mission. As Aalto-1
will have limited downlink capacity, the amount of measured spectral bands has been reduced. However, the instrument itself can measure 60+ spectral bands, and this feature may still be
tested during the mission. In-orbit spectral calibration is planned to be done by using known
bright spectral features (e.g. Sahara) and measuring the spectrum around strong absorption peaks (e.g. O2 absorption at 750-760 nm). AaSI will also include a normal RGB camera (ca.
1000 x 1000 pixels) with wider field of view. The images taken by this camera will be used as a
georeference for the spectral images.
The main advantages of the AaSI concept are the small size and the spectral programmability,
which provides flexibility and reduced data rate when the application is well defined. A successful space qualification and orbit demonstration will enable more advanced instruments
based on piezo and MEMS Fabry-Pérot interferometer technologies.
Main specifications for AaSI:
Across the flight FOV: 10° (105 km swath width at 600 km altitude)
Along the flight FOV: 10°
Spectral image size: 512 x 512 pixels (2x2 binning)
Wavelength range: 500 – 900 nm
Spectral resolution: 10 – 30 nm (FWHM)
SNR (20 ms & 20 nm FWHM): > 50 (0.3 albedo near Finland in June)
Amount of spectral bands: > 20
Volume: 90 x 96 x 48mm3
Mass: 500 g
Finnish Remote Sensing Days 2012
48

A Pioneer European Airborne-Based Observation Campaign of a Meteor Shower
Maria Gritsevich(1), Jeremie Vaubaillon(2), Pavel Koten(3), Jouni Peltoniemi(1), Detlef Koschny(4), Joe Zender(4), Jonathan McAuliffe(5)
(1)Department of Remote Sensing and Photogrammetry, Finnish Geodetic Institute (FGI) (2)Institut de Mecanique Celeste et de Calcul des Ephemerides (IMCCE), France
(3)Ond ejov Observatory, Academy of Sciences of the Czech Republic (4) European Space Agency, European Space Research and Technology Centre (ESTEC),
Noordwijk, The Netherlands
(5) European Space Agency, European Space Astronomy Centre (ESAC), Madrid, Spain
We provide overview and preliminary results of the successful international airborne-based observation campaign held on October 8, 2011. During the campaign the team had two research-dedicated aircrafts, Safire (CNRS) and Falcon 20E (DLR), flying in tandem over Scandinavia (mainly Finland), equipped with wide and narrow field of view cameras and other instrumentation. The goal of the project was to record and analyze exceptional outburst of the Draconids meteor shower predicted for 2011 [1, 2]. This was the first time when such a campaign was organized in Europe by European organizations. Remote sensing of meteors can be used to measure their parent comet’s main element composition, grain size distribution of its component dust particles, bulk and grain density - parameters that cannot be obtained in other way. The Earth’s passage through a recently ejected comet dust trail, from the width, peak time and strength of the shower, also provides insight into where along the comet orbit this dust was ejected, the speed of ejection, and the past orbit of the comet. Thus the recorded outburst of Draconids was our first opportunity to field modern observing techniques to study the dust particles of comet 21P/Giacobini-Zinner. It was also the only opportunity in coming decades since there will be no showers of such high activity expected until at least 2050 [2]. The comet was passed and studied by the NASA’s International Comet Explorer (ICE) spacecraft in 1985 (it was also first historical comet flyby). Here we present the first results obtained in frame of the project, in particular we provide pre-atmospheric particles mass and other parameters obtained by method developed in [3] and its further extension [4]. Along with a number of ground based observations, the Draconids are found to be a small particles with initial mass in the order of 0.01 g, exceptionally fragile, disintegrating at high altitudes and not penetrating deep into the Earth’s atmosphere and they may therefore represent the most primitive, loosely packed material in the Solar System. Ejected particles survive in the comet’s dust stream for thousands of years. As former part of a comet, this matter is among the most pristine material known, and therefore is of extreme value to increase our knowledge of the physical and chemical conditions in the early Solar System. The presentation will include introductory part and thus we will keep it understandable and interesting almost for everyone.
References
[1] Vaubaillon, J., Colas, F., and Jorda, L., A new method to predict meteor showers: I. Description of the model, Astronomy and Astrophysics, 439(2), pp. 751-760, 2005.
[2] Vaubaillon, J., Colas, F., and Jorda, L., A new method to predict meteor showers. II. Application to Leonids, Astronomy and Astrophysics, 439(2), pp.761-770, 2005.
[3] Gritsevich, M., Determination of parameters of meteor bodies based on flight observational data, Advances in Space Research, 44(3), pp. 323-334, 2009.
[4] Gritsevich, M., and Koschny, D., Constraining the luminous efficiency of meteors, Icarus, 212(2), pp. 877-884, 2011.
Finnish Remote Sensing Days 2012
49

Using mobile laser scanning and UAV for 3D city models
Lingli Zhu, Juha Hyyppä
Finnish Geodetic Institute P.O. Box 15, FI-02431 Masala, Finland
E-Mail: [email protected]
3D city model has been paid high attention for recent ten years, especially when many new
applications e.g. location-based services, navigation, tourism, urban planning, require advanced
visualization from the real scene. According to CityGML standard, the levels of detail (LoD) of
the models are grouped to five categories. The detail definitions can be found from www.
citygml.org. However, usually we also refer to two groups according to the distance and height
from the target objects: models for fly-through views and models for walk-through views.
Models for fly-through view can be regarded as an overview of the scene, the distance between
the view point and the target is usually further than 100 m and the height is beyond the height of
the objects. As regards with walk-through view, the distance can vary usually from half meter to
one hundred meters. Models for walk-through view offer a sense that you were walking in the
real scene. Therefore model reconstruction for walk-through view requires higher visual quality
than for fly-through view since small errors or distortions or the rough surfaces can be clearly
presented in front of you. The level of detail for walk-through view models can be referred to
LoD 4 and LoD 5 according to CityGML standard.
As the sensor technology development, the increasing availability in multiple data sources
acquired by different sensor platforms has provided the great advantages for detailed model
achievement. This paper proposes the use of both MLS data and UAV images for 3D model
reconstruction. Mobile laser scanning (MLS) has been commercialized for almost ten years.
Since then due to the disadvantage in one-side (without backside information) data collection, it
results in the limitation of applications. However the rise of the unmanned aerial vehicle (UAV)
offers an alternative complementary for the disadvantages of MLS. As we know that 3D city
models are reconstructed, the information from both building facades and roofs is needed. MLS
can provide high resolution point clouds in building facades, whereas UAV images can offer
detailed information in building roofs. The data fusion of MLS and UAV images can generate a
complete high resolution 3D model for walk-through views. Methods are performed by four
steps: i) Building facades are extracted from MLS data; ii) UAV images are referenced to MLS
and extract building roof information from UAV images; iii) Data fusion of building facades
building roofs; iv) Complete building model generation. By the above four steps, the desired
models are achieved and the results are analyzed.
Finnish Remote Sensing Days 2012
50

3D hyperspectral reflectance signatures by light-weight UAVs for the monitoring
and measuring the environment
Eija Honkavaara(1)
, Teemu Hakala(1)
, Lauri Markelin(1)
(1)Finnish Geodetic Institute
Geodeetinrinne 2, 02430 Masala Finland
Light-weight UAV imaging techniques have developed rapidly. Currently, the UAV based
methods are efficient in measurement projects covering small areas, typically less than 1 km2.
There are many potential applications for this novel data due to the increasing need of accurate
environmental information.
One of the challenging parts of the UAV image data utilization is to process the data so that
reliable information of the object geometry and radiometry is obtained. The FGI has been
developing processing methods for UAV imagery to provide accurate 3D hyperspectral
information [1,2]. The steps in the rigorous processing include radiometric and geometric sensor
calibration, controlled flight campaign, georeferencing by self-calibrating bundle block
adjustment technology, point cloud generation using novel dense matching technologies and
finally a radiometric adjustment and reflectance transformation. This processing provides 3D
hyperspectral reflectance point clouds, digital surface models and hyperspectral image mosaics,
with a high geometric and radiometric accuracy, and high spatial resolution. These can be
utilized in various environmental remote sensing applications, such as precision agriculture,
water monitoring, forest damage detection and environmental impact assessment.
The approach has been demonstrated by using low-cost consumer cameras as well as with the
novel Fabry-Perot hyperspectral imager (FPI) developed by the VTT Technical Research Center
[3]. The FPI technology provides a new concept for environmental measurement, by providing
hyperspectral data cubes in a frame image format. Frame images are suitable for providing 3D
object information and for stereoscopic interpretation.
In the presentation we will present our approach and results concerning accurate environmental
measurements by the novel UAV technology.
More details about our recent activities are given in the Internet:
http://www.fgi.fi/fgi/research/researchgroups/spectrophotogrammetry
References
[1] Honkavara, E., Hakala, T., Saari, H., Markelin, L., Mäkynen, J., Rosnell, T., 2012. A
process for radiometric correction of UAV image blocks. Photogrammetrie,
Fernerkundung, Geoinformation (PFG) 2/2012.
[2] Honkavaara, E., Kaivosoja, J., Mäkynen, J., Pellikka, I., Pesonen, L., Saari, H., Salo, H.,
Hakala, T., Marklelin, L., and Rosnell, T., 2012: Hyperspectral reflectance signatures and
point clouds for precision agriculture by light weight UAV imaging system, ISPRS Ann.
Photogramm. Remote Sens. Spatial Inf. Sci., I-7, 353-358, doi:10.5194/isprsannals-I-7-
353-2012, 2012.
[3] Saari, H., Pellikka, I., Pesonen, L., Tuominen, S., Heikkilä, J., Holmlund, C., Mäkynen, J.,
Ojala, K., Antila, T., 2011. Unmanned Aerial Vehicle (UAV) operated spectral camera
system for forest and agriculture applications, Proc. SPIE 8174.
Finnish Remote Sensing Days 2012
51

UASI Summer 2012 UAV flight campaign results for forest and agriculture
applications
Heikki Saari(1)
, Ilkka Pölönen(2)
, Heikki Salo(2)
, Sakari Tuominen(3)
, Jere Kaivosoja(4)
, Jani
Heikkilä(5)
, Jussi Mäkynen(1)
, Christer Holmlund(1)
,
(1) VTT Photonic devices and meas. sol., P.O.Box 1000, FI 02044 VTT, Espoo, Finland
(2) Department of Mathematical Information Tech., University of Jyväskylä, Finland
(3) Finnish Forest Research Institute, Vantaa, Finland
(4) MTT - Agrifood Research Finland, Helsinki, Finland
(5) Pieneering Ltd., Helsinki, Finland
Innovative and compact system consisting of CIR (Color Infrared) and hyperspectral imagers integrated into a very light UAS (unmanned aerial system) with modern classification algorithms provides significantly improved ways for remote sensing for forest and agriculture applications. Tekes, the Finnish Funding Agency for Technology and Innovation, has granted a funding for this large cooperation research project of four research institutes and several companies. The project is coordinated by University of Jyväskylä. The objective of the project is to be able to evaluate forest and agriculture biomass changes. The project started in 2011 and several flight campaigns were carried out in summer 2011. The new Hyperspectral imager prototype was designed and built for the summer 2012 flight campaigns based on the analysis of the 2011 imaging data. The UASI 2012 imaging system consisted of the 4 Mpix CIR camera and hyperspectral imager with spatial resolution of either 2048 x 1296 or 1024 x 648 pixels in the wavelength range 500 – 900 nm at a resolution of 10…30 nm @ FWHM. In 2012 the Hyperspectral imager and CIR camera were flown together. The UASI system has been tried in summer 2012 in Southern Finland for the forest and agricultural areas. The design and calibration of the hyperspectral imager will be shortly explained. The test UASI 2012 flight campaigns on forest and crop fields and their preliminary results are also presented.
Figure 1. Infotron IT-180 UAV helicopter with both the CIR camera and Hyperspectral imager payload and flight configuration of UASI 2012 hyperspectral Imager.
References
[1] Saari, H., Pellikka, I., Pesonen, L., Tuominen, S., Heikkilä, J., Holmlund, C., Mäkynen, J., Ojala, K., Antila, T., “Unmanned Aerial Vehicle (UAV) operated spectral camera system for forest and agriculture applications”, Proc. SPIE 8174 (2011).
[2] Mäkynen, Jussi; Holmlund, Christer; Saari, Heikki; Ojala, Kai; Antila, Tapani “Multi- and hyperspectral UAV imaging system for forest and agriculture”, SPIE . Vol. 8374-09 (2012).
Finnish Remote Sensing Days 2012
52

Social Forest Planning project : summary of results 2010-2012
Matthieu Molinier (1) , Tuomas Häme (1) , Yrjö Rauste, Kaj Andersson (1) , Ilkka Korpela (2) ,Aarne Hovi (2) , Ismo Hippi (3) , Jussi Rasinmäki (4)
(1) VTT Technical Research Centre of Finland - Digital Information SystemsP.O. 1000 - VM3, 02044 VTT, Finland - [email protected]
(2) University of Helsinki - Faculty of Agriculture and Forestry, Department of ForestResource Management, 00014 Helsinki, Finland - [email protected]
(3) MosaicMill OyTeknobulevardi 3-5, 01530 Vantaa, Finland - [email protected]
(4) Simosol OyAsema-aukio 2, 11130 Riihimäki, Finland - [email protected]
The overall objective of the Social Forest Planning project is to develop and demonstrate a novelsystem for forest management planning and updating of present plans. The system combinesimages from cellular phones with remote sensing data to predict forest variables. The variablesare input to a Planner Engine that outputs forest resources information for every forest stand andfeeds them into a Geographical Information System (GIS). The GPS location tag in the imagesmakes it possible to use them easily as in-situ reference data. The main technical developmentgoal of Social Forest is to develop automatic and interactive methods for the cell phone imageanalysis. The automatic methods were presented in Remote Sensing Days 2010 [2], and interactivedelineation of tree stems for computing basal area in Remote Sensing Days 2011 [3]. This papergives an overview of results of the whole processing chain, including :
• methods for automatic and interactive tree stem detection from the cell phone images
• methods for the transmission and archiving of the cell phone images through the internet
• methods for the processing and analysis of UAV images
• use of the cell phone-based data as reference to UAV and satellite image analysis to predictthe forest variable values wall-to-wall
• system introducing the stand-wise predictions of forest variables and the cell phone plot datainto the Planner Engine that outputs the forest management plan.
Latest results include stand-wise predictions of forest variables from satellite and cell-phone im-ages and analyzed cell-phone images as a reference data.
References
[1] W. Bitterlich, "The Relascope Idea: Relative Measurements in Forestry", 1984, Common-wealth Agricultural Bureaux, Farnham Royal.
[2] T. Häme, I. Korpela, A. Hovi, I. Hippi, J. Rasinmäki, M. Molinier, K. Andersson, "SocialForest Planning", presented at the Finnish Remote Sensing Days 2010, November 2010,Espoo, Finland.
[3] M. Molinier, T. Häme, K. Andersson, I. Korpela, A. Hovi„ "Interactive Basal Area Esti-mations from Mobile Phone Images", presented at the Finnish Remote Sensing Days 2011,November 2011, Espoo, Finland.
Finnish Remote Sensing Days 2012
53

Automatic detection of storm damages in forests using airborne stereoscopic images
Paula Litkey(1)
, Kimmo Nurminen(1) )
, Eija Honkavaara(1)
(1)Finnish Geodetic Institute
Geodeetinrinne 2, 0243,0 Masala Finland
Risks of storms causing damages in forests are increasing due to the climate change. Fast and
reliable detection of fallen trees, assessment of their amount and their efficient collection are of
great importance for the economical and environmental reasons.
In Finland, the Ministry of Agriculture and Forestry defined a strategy for the fast detection of
storm damages. Airborne photogrammetry was selected as the basic remote sensing method, and the
image collection flights should be carried out immediately after the storm.
Visual storm damage detection and delineation from images can be a slow and error prone process.
It is expected that the methods based on comparisons of digital surface models (DSMs) collected
before and after storm could be efficient for automating the storm damage detection. This is a
potential approach with airborne images as well, because the novel dense matching methods have
provided promising results in DSM generation (Honkavaara et al., 2012).
One of the challenges in the process is the great variability of the input data. Characteristic to the
storm damage detection process is that storms can occur at any season, which also influences the
properties of the input data. Also low solar altitudes at autumn-winter periods can be challenging,
because the low amount of light and shadows can deteriorate quality of image matching.
Furthermore, the camera properties can cause variability on the data. (Honkavaara et al., 2012)
The objectives of this investigation were to develop an automated method for storm damage
detection and to investigate its performance in detection of storm damages in wintry images
collected using a high performance photogrammetric mapping camera.
Serious winter storms took place in Finland in 26.12.2011 and 27.12.2011. Photogrammetric
imagery were collected in less than two weeks time after the storms. Data were collected over an
area of 1620 km2 from a flying altitude of 5400 m, which provided a ground sample distance of 0. 3
m. The national laser scanning data was used to create the before-storm DSM. After-storm DSM
was computed using automatic image matching provided by the Socet Set NGATE software.
The DSM extraction by image matching was successful in wintry imagery. Visual inspection of the
storm damage detection results indicated that the automatic method correctly found changed areas.
In the future we will carry out further studies on the performance of the method, including
influences of atmospheric conditions, season, sensor and image matching algorithm.
Literature
[1] Honkavaara, E., Markelin, L., Rosnell, T., Nurminen, K, 2012.. Influence of solar elevation
in radiometric and geometric performance of multispectral photogrammetry. ISPRS Journal
of Photogrammetry and Remote Sensing. 67, 13-26.
http://www.sciencedirect.com/science/article/pii/S0924271611001110
Finnish Remote Sensing Days 2012
54

Estimating leaf inclination and G-function from leveled digital camera photography for broadleaf tree and shrub species in Kaisaniemi and Kumpula
botanical gardens, Helsinki
Jan Pisek(1), Xiaochen Zou (2)
(1)Tartu Observatory, [email protected]
(2) Department of of Geosciences and Geography, University of Helsinki, [email protected]
Directional distribution of leaves is one primary parameter for determining the radiation transmission through the canopy. When inverting canopy transmittance measurements for estimating the leaf area index (LAI) or foliage clumping, incorrect assumptions on leaf angles may lead to considerable errors. Often spherical distribution of leaf normals is assumed, i.e. leaf normals are assumed to have no preferred direction in situations where no measurement data are available. Here we examined if a spherical leaf angle distribution and the resulting isotropic G-function (G≡0.5) is indeed a valid assumption for temperate and boreal tree and shrub species. Leaf angle distributions were measured for 62 deciduous broadleaf species in Kaisaniemi and Kumpula botanical gardens in Helsinki in August 2012. The studied species are commonly found in temperate and boreal ecoclimatic regions. The leaf inclination angles were obtained by sampling the complete vertical extent of trees and shrubs using a recently introduced technique based on digital photography [1,2]. It is found a spherical leaf angle distribution is not a valid assumption for both tree and shrub species in temperate and boreal ecoclimatic regions.Given the influence of leaf angle distribution on inverting clumping, LAI estimates and other paprameters from canopy transmittance measurements or reflectances obtained from remote sensing, it is recommended to use planophile or plagiophile leaf angle distribution as more appropriate for modeling radiation transmission in temperate and boreal ecoclimatic regions when no actual leaf inclination angle measurements are available.
References
[1] Y. Ryu, O. Sonnentag, T. Nilson, R. Vargas, H. Kobayashi, R. Wenk, and D. Baldocchi, “ How to quantify tree leaf area index in a heterogeneous savanna ecosystem: a multi-instrument and multimodel approach, ” Agricultural and Forest Meteorology, vol. 150, pp. 63–76, 2010.
[2] J. Pisek, Y. Ruy, and K. Alikas, “Estimating leaf inclination and G-function from leveled digital camera photography in broadleaf canopies,” Trees – Structure and Function, vol. 25, pp. 919-924, 2011.
Finnish Remote Sensing Days 2012
55

Assessment of Boreal Forest Cover Properties from Interferometric TanDEM-X
Data
Caner Demirpolat(1)
, Jaan Praks(1)
, Oleg Antropov(2)
, Martti Hallikainen(1)
(1) Aalto University, P.O. Box 13000 FI-007 AALTO Finland, e-mail:
VTT Technical Research Centre of Finland, P.O. Box 1000, 02044 VTT, Finland, e-mail:
Recently launched TanDEM-X mission offers new interesting possibilities for interferometric
analysis of terrain and evaluation of vertical structure of forest canopy. Location of
interferometric Scattering Phase Center (SPC) inside the forest canopy (and canopy penetration
depth) can be effectively used to characterize and monitor boreal forests with Synthetic
Aperture Radar interferometry (InSAR). Seasonal, monthly or even shorter term variations in
these InSAR-derived parameters can provide distinctive information specific to the different
tree structure and species that can be useful for their discrimination.
In this study, 5 sets of dual-polarimetric (HH/VV) TanDEM-X coregistered single-look slant-
range complex products were processed. The imagery was acquired primarily during autumn
2011 over Kirkkonummi region near Helsinki, Finland. For each interferometric pair, the
Canopy Height Models (CHM) were derived from the interferometric coherence phase. As the
reference and auxiliary data CHM and Digital Terrain Model (DTM) measured by LIDAR were
used. Using the land cover CLC2006 data, temporal variations in average SPC heights and
penetration depths were mapped with respect to coniferous, deciduous and mixed forest classes.
For all classes, the SPC heights relative to the treetop were found to be decreasing from early
September until late October. As expected, mean penetration depths were found to be increasing
in this time interval. The biggest temporal variations were observed for deciduous forest, while
mixed forest and coniferous forest were found to be less affected. HH-pol signals were found to
have higher penetration depths and lower relative SPC heights than VV-pol signals for all
acquisitions. Also, temporal variations in parameters of interest were higher for HH-pol data.
Some of the aforementioned dependencies are shown in Figures 1 and 2.
Fig 1. HH-pol variation of average SPC location Fig 2. VV-pol variation of average SPC location
Finnish Remote Sensing Days 2012
56

BRF of forests
Andres Kuusk (1) Joel Kuusk (1) Mait Lang (1) (2)
(1) Tartu Observatory61602 Tõravere, Estonia
(2) Estonian University of Life SciencesKreutzwaldi 1, 51014 Tartu, Estonia
For the study of forest reflectance a special airborne spectrometer system UAVSpec3 [1] was de-signed and built at Tartu Observatory. UAVSpec3 is an autonomous spectrometer system whichdoes not need operator’s intervention during measurement.Its main components are a spectrome-ter module which measures VNIR reflectance in the nadir direction and a bidirectional reflectancefactor (BRF) sensor which records angular distribution of reflectance in one narrow spectral bandon a transect along the flight path.
Angular distribution of hemispherical-directional reflectance of forests at Järvselja test-site inSouth-East Estonia has been measured in flight campaigns in July-August of 2007-2011. TheBRF sensor measures the angular distribution of reflectanceat the azimuth angle determined bythe flight direction. The red filter (660 nm) was used in 2007, 2008, 2010, and 2011. In 2009the NIR filter (850 nm) was used. As the share of diffuse incident radiation is small at thesewavelengths, the measured reflectance distribution is almost BRF.
The BRF of three stands at Järvselja which are described in the Järvselja data-base [2] has beenmeasured several times and at various azimuths.
References
[1] J. Kuusk and A. Kuusk, "Autonomous lightweight airbornespectrometers for ground re-flectance measurements,"in Proceedings of the 2nd Workshop on Hyperspectral Image andSignal Processing: Evolution in Remote Sensing (WHISPERS ’10), IEEE, June 2010.
[2] A. Kuusk, J. Kuusk, and M. Lang, "A dataset for the validation of reflectance models,"Remote Sens. Environ., vol. 113, pp. 889-892, May 2009.
Finnish Remote Sensing Days 2012
57

Directional reflectance signatures in aerial images - an aid to tree species classification?
Ilkka Korpela(1), Anne Seppänen(2), Lauri Mehtätalo(2), Lauri Markelin(3), Annika Kangas(1)
(1) Department of Forest Sciences, University of Helsinki (2) Faculty of Science and Forestry, University of Easter Finland
(3) Finnish Geodetic Institute
Keywords: Individual tree, BRDF, Mixed-effects modeling, Monte-Carlo simulation, Scandinavia
Tree species identification is a bottleneck in remote sensing of Scandinavian boreal forests. Airborne
LiDAR gives acceptable estimates of the total growing stock, while species-specific estimates remain less
accurate. Aerial images are widely used as a alleviating data source. Image observations include directional
effects from trees and the atmosphere, which has traditionally been considered a nuisance. We estimated
species-, band-, and illumination-specific anisotropy models to assist tree species classification in real and
simulated image data. Multispectral Leica ADS40 line-sensor data from Finland (62 N, 24 E) were
analyzed using mixed-effects modeling. This allowed the division of the reflectance variation between
directional anisotropy, tree and image effect, and the residual. The anisotropy models and the covariance
structures were then utilized in a Monte-Carlo simulation, which aimed at quantifying the gain from
directional signatures under different assumptions for reflectance calibration accuracy. A simple classifier
employing Mahalanobis distance was implemented to classify the multiangular directional signatures. In
real data, directional signatures suffered from reflectance calibration inaccuracy, and no gain was obtained
in classification performance compared to averaged spectral features and discriminant analysis. Simulations
however implied that directional signatures comprise an improvement provided that the reflectance
calibration is accurate. The gain from using the directional signatures was however low, less than 5% in
overall classification accuracy. The optimal selection of the flying direction with respect to the solar
azimuth was influenced by the classification strategy. Species classification accuracy of dominant co-
dominant Scots pine, Norway spruce and birch seems to saturate at 85 90% even in multiangular data
owing to the strong within-species variation and correlation of the spectra in individual trees. These factors
relate to the inherent structural variation in trees and constitute a natural upper bound.
An example (1-dimensional cut) of anisotropy
models (reflectance) for GRN band and direct
illumination along the solar principal plane
( 32 to +32 ). The relative brightness of pine
varies and the classifier considers these
between species differences.
Finnish Remote Sensing Days 2012
58


Department of Geosciences and Geography CISSN-L 1798-7938ISSN 1798-7938 (print)ISBN 978-952-10-8453-9 (PDF)http://helda.helsinki.fi/ I
Helsinki University PressHelsinki 2012
Finnish Remote Sensing Days is an annual event organized by the Remote Sensing Club of Finland, an informal body bringing together actors inthe field of remote sensing. In 2012, Remote Sensing Days were held on the Kumpula campus of the University of Helsinki on October 25–26.This book is a collection of the abstracts of the 43 presentations given during the two exciting days.