FiniteElementModeling of FatigueCrack Growth in Curved ... · this concept, an ANSYS input file...
14
Copyright c 2005 Tech Science Press SID, vol.1, no.3, pp.171-184, 2005 Finite Element Modeling of Fatigue Crack Growth in Curved-Welded Joints Using Interface Elements M. S. Alam 1 , and M.A. Wahab 1, 2 Abstract: Fatigue life of curved structural joints in ship structures under constant amplitude cyclic loading has been studied in this research. A new approach for the simulation of fatigue crack growth in welded joints has been developed and the concept has been applied to welded curved butt-joints. The phenomena of crack propagation and interface debonding can be regarded as the formation of new surfaces. Thus, it is possible to model these problems by introducing the mechanism of surface formation. In the proposed method, the forma- tion of new surface is represented by interface element based on the interface surface potential energy. The properties of this interface element represent the bonding strength of the material. As the cyclic load continues, the bonding strength decreases between the interacting sur- faces and the crack starts to propagate slowly. Based on this concept, an ANSYS input file has been written for the simulation of crack propagation in the curved welded butt-joints. Using this code, the fatigue crack growth rate and fatigue crack propagation life of 3-D FEM (finite el- ement method) models of welded curve butt-joints and 2-D models for T-joints for different stress/load ratios have been analyzed. The variations of crack-opening- displacement (COD) and crack- tip- strain over crack-tip- stress have also been calculated. For the validation of the simulation, experiments have been conducted and gener- ally good agreement has been achieved. The simulation method is relatively simple compared to other conven- tional FEM method and effective in many applications. keyword: Interface elements, Interface potential, Fa- tigue crack growth rate, Finite element method, Curved- butt-joint. 1 Department of Mechanical Engineering, Louisiana State Univer- sity, Baton Rouge, LA 70803, USA 2 Corresponding author. Tel.:1- 225-578-5823, Fax:1- 225-578- 5924, E-mail: [email protected] Nomenclature a half crack length for a central crack a f final crack length a o initial crack length C material dependent constant da/dN crack growth rate (crack length per cycle) E modulus of elasticity f load vector h tangent modulus k stiffness matrix K stress intensity factor (MPa √ m) K crit critical stress intensity factor (MPa √ m) ∆K range of stress intensity factor ∆K th range of threshold stress intensity factor m material dependent constant n shape parameter N number of cycles N i shape function N p fatigue crack propagation life R stress ratio r o scale parameter u o nodal displacement U s interface energy during crack propagation W potential of external load w i nodal displacement normal to the surface α a constant Π total energy δ crack opening displacement ε strain φ surface potential γ surface energy per unit area η natural coordinate
Transcript of FiniteElementModeling of FatigueCrack Growth in Curved ... · this concept, an ANSYS input file...

Copyright c© 2005 Tech Science Press SID, vol.1, no.3, pp.171-184, 2005
Finite Element Modeling of Fatigue Crack Growth in Curved-Welded Joints UsingInterface Elements
M. S. Alam1, and M.A. Wahab1,2
Abstract: Fatigue life of curved structural joints inship structures under constant amplitude cyclic loadinghas been studied in this research. A new approach forthe simulation of fatigue crack growth in welded jointshas been developed and the concept has been appliedto welded curved butt-joints. The phenomena of crackpropagation and interface debonding can be regarded asthe formation of new surfaces. Thus, it is possible tomodel these problems by introducing the mechanism ofsurface formation. In the proposed method, the forma-tion of new surface is represented by interface elementbased on the interface surface potential energy. Theproperties of this interface element represent the bondingstrength of the material. As the cyclic load continues, thebonding strength decreases between the interacting sur-faces and the crack starts to propagate slowly. Based onthis concept, an ANSYS input file has been written forthe simulation of crack propagation in the curved weldedbutt-joints. Using this code, the fatigue crack growth rateand fatigue crack propagation life of 3-D FEM (finite el-ement method) models of welded curve butt-joints and2-D models for T-joints for different stress/load ratioshave been analyzed. The variations of crack-opening-displacement (COD) and crack- tip- strain over crack-tip-stress have also been calculated. For the validation of thesimulation, experiments have been conducted and gener-ally good agreement has been achieved. The simulationmethod is relatively simple compared to other conven-tional FEM method and effective in many applications.
keyword: Interface elements, Interface potential, Fa-tigue crack growth rate, Finite element method, Curved-butt-joint.
1 Department of Mechanical Engineering, Louisiana State Univer-sity, Baton Rouge, LA 70803, USA2 Corresponding author. Tel.:1- 225-578-5823, Fax:1- 225-578-5924, E-mail: [email protected]
Nomenclature
a half crack length for a central crack
a f final crack length
ao initial crack length
C material dependent constant
da/dN crack growth rate (crack length per cycle)
E modulus of elasticity
f load vector
h tangent modulus
k stiffness matrix
K stress intensity factor (MPa√
m)
Kcrit critical stress intensity factor (MPa√
m)
∆K range of stress intensity factor
∆Kthrange of threshold stress intensity factor
m material dependent constant
n shape parameter
N number of cycles
Ni shape function
Np fatigue crack propagation life
R stress ratio
ro scale parameter
uo nodal displacement
Us interface energy during crack propagation
W potential of external load
wi nodal displacement normal to the surface
α a constant
Π total energy
δ crack opening displacement
ε strain
φ surface potential
γ surface energy per unit area
η natural coordinate
172 Copyright c© 2005 Tech Science Press SID, vol.1, no.3, pp.171-184, 2005
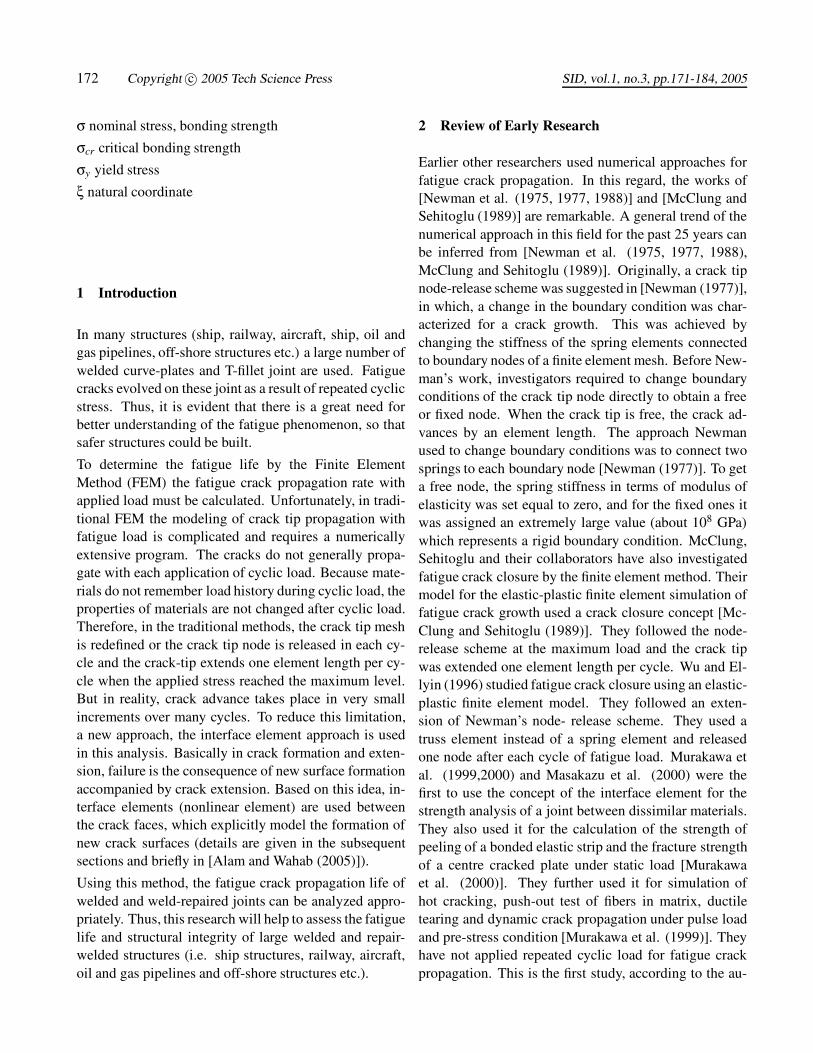
σ nominal stress, bonding strength
σcr critical bonding strength
σy yield stress
ξ natural coordinate
1 Introduction
In many structures (ship, railway, aircraft, ship, oil andgas pipelines, off-shore structures etc.) a large number ofwelded curve-plates and T-fillet joint are used. Fatiguecracks evolved on these joint as a result of repeated cyclicstress. Thus, it is evident that there is a great need forbetter understanding of the fatigue phenomenon, so thatsafer structures could be built.
To determine the fatigue life by the Finite ElementMethod (FEM) the fatigue crack propagation rate withapplied load must be calculated. Unfortunately, in tradi-tional FEM the modeling of crack tip propagation withfatigue load is complicated and requires a numericallyextensive program. The cracks do not generally propa-gate with each application of cyclic load. Because mate-rials do not remember load history during cyclic load, theproperties of materials are not changed after cyclic load.Therefore, in the traditional methods, the crack tip meshis redefined or the crack tip node is released in each cy-cle and the crack-tip extends one element length per cy-cle when the applied stress reached the maximum level.But in reality, crack advance takes place in very smallincrements over many cycles. To reduce this limitation,a new approach, the interface element approach is usedin this analysis. Basically in crack formation and exten-sion, failure is the consequence of new surface formationaccompanied by crack extension. Based on this idea, in-terface elements (nonlinear element) are used betweenthe crack faces, which explicitly model the formation ofnew crack surfaces (details are given in the subsequentsections and briefly in [Alam and Wahab (2005)]).
Using this method, the fatigue crack propagation life ofwelded and weld-repaired joints can be analyzed appro-priately. Thus, this research will help to assess the fatiguelife and structural integrity of large welded and repair-welded structures (i.e. ship structures, railway, aircraft,oil and gas pipelines and off-shore structures etc.).
2 Review of Early Research
Earlier other researchers used numerical approaches forfatigue crack propagation. In this regard, the works of[Newman et al. (1975, 1977, 1988)] and [McClung andSehitoglu (1989)] are remarkable. A general trend of thenumerical approach in this field for the past 25 years canbe inferred from [Newman et al. (1975, 1977, 1988),McClung and Sehitoglu (1989)]. Originally, a crack tipnode-release scheme was suggested in [Newman (1977)],in which, a change in the boundary condition was char-acterized for a crack growth. This was achieved bychanging the stiffness of the spring elements connectedto boundary nodes of a finite element mesh. Before New-man’s work, investigators required to change boundaryconditions of the crack tip node directly to obtain a freeor fixed node. When the crack tip is free, the crack ad-vances by an element length. The approach Newmanused to change boundary conditions was to connect twosprings to each boundary node [Newman (1977)]. To geta free node, the spring stiffness in terms of modulus ofelasticity was set equal to zero, and for the fixed ones itwas assigned an extremely large value (about 108 GPa)which represents a rigid boundary condition. McClung,Sehitoglu and their collaborators have also investigatedfatigue crack closure by the finite element method. Theirmodel for the elastic-plastic finite element simulation offatigue crack growth used a crack closure concept [Mc-Clung and Sehitoglu (1989)]. They followed the node-release scheme at the maximum load and the crack tipwas extended one element length per cycle. Wu and El-lyin (1996) studied fatigue crack closure using an elastic-plastic finite element model. They followed an exten-sion of Newman’s node- release scheme. They used atruss element instead of a spring element and releasedone node after each cycle of fatigue load. Murakawa etal. (1999,2000) and Masakazu et al. (2000) were thefirst to use the concept of the interface element for thestrength analysis of a joint between dissimilar materials.They also used it for the calculation of the strength ofpeeling of a bonded elastic strip and the fracture strengthof a centre cracked plate under static load [Murakawaet al. (2000)]. They further used it for simulation ofhot cracking, push-out test of fibers in matrix, ductiletearing and dynamic crack propagation under pulse loadand pre-stress condition [Murakawa et al. (1999)]. Theyhave not applied repeated cyclic load for fatigue crackpropagation. This is the first study, according to the au-

Finite Element Modeling of Fatigue Crack Growth in Curved-Welded Joints Using Interface Elements 173
thors’ knowledge, that cyclic loads have been applied tostudy crack propagation using interface concepts, espe-cially for welded joints.
It should be pointed out that the past use of finite ele-ment analyses had certain shortcomings and tremendousimprovements have been made in recent versions andhave removed many of these limitations. For example,to avoid numerical instability, schemes such as releas-ing the crack-tip node at the bottom of a loading cyclewere adopted in certain studies, for example study con-ducted by McClung and Sehitoglu [McClung and Sehi-toglu (1989)]. They have not considered element bond-ing stress and surface energy, which are associated withcrack formation and crack extension. They also did notconsider the changes in material properties during cyclicloads. They applied symmetric boundary conditions atthe crack plane and also assumed that the crack can onlypropagate in symmetric planes. In this study, it is shownthat a crack can propagate in both symmetric and anti-symmetric planes about the applied load.
3 Mathematical Relation
The crack is formed when the applied stress exceeds thecritical bonding strength of the material. The bondingstrength decreases with cyclic load and progressively be-comes weak. Finally the bond loses its strength andbreaks; and cracks form and extend slowly. The totalstiffness of the material decreases with the decrease ofbonding strength. As the cyclic load continues, the stiff-ness decreases and the crack propagate slowly. There-fore, there is a close relationship between the bond-ing strength and crack propagation. To analyze crackpropagation under cyclic load, a method using the inter-face element, which characterizes the element bonding-strength, has been proposed. In this method, the forma-tion and the propagation of the crack are modeled by us-ing the interface element. The mechanical behavior ofthe interface element is governed by the interface poten-tial, φ per unit area of the crack surface. There are widechoices for such a potential [Murakawa et al. (1999),Masakazu et al. (2000)]. In this analysis, the Lennard-Jones type potential φ [Masakazu et al. (2000)] is em-ployed because it explicitly involves the surface energyγ, which is necessary to form a new surface. The sur-face potential per unit of crack surface area φ defined byLennard-Jones is:
φ(δ) = 2γ
{(ro
ro +δ
)2n
−2
(ro
ro +δ
)n}
(1)
where γ, ro n and δ are surface energy per unit area, scaleparameter, shape parameter and crack opening displace-ment respectively. The surface energy γsghich is requiredto form the new surface is a material constant. The val-ues of the surface energy and the other parameters n androare found experimentally. Thus the surface potential φis a continuous function of opening displacement δ.
The derivative of interface potential φ with respect tocrack opening displacement δ gives the bonding stressσ on the crack surface.
σ =∂φ∂δ
=4γnro
{(ro
ro +δ
)n+1
−(
ro
ro +δ
)2n+1}
(2)
Further, the bonding strength per unit area becomes amaximum under the following condition.
δro
=
{(2n+1n+1
) 1n
}−1 (3)
The maximum bonding strength σcr is given by,
σcr =4γnro
{(n+1
2n+1
) n+1n
−(
n+12n+1
) 2n+1n
}(4)
To find the stress intensity factor, K from the crack open-ing displacement δ, the following expressions can beused:
δ = (8σyaπE
) lnsecπσ2σy
(5)
When σ/σy << 1
δ =K2
σyE(6)
where a is crack length, σ is remotely applied stress andσy is the yield stress. To find crack- tip opening displace-ment any commercial FEM software can be used.
174 Copyright c© 2005 Tech Science Press SID, vol.1, no.3, pp.171-184, 2005
Further the stress intensity factor for a particular load-ing and crack conditions can be calculated by using theANSYS code and in this study this approach has beenadopted. As a condition of crack-tip extension (i.e. cri-terion of crack tip extension), the equation (4) is used inauthors’ written ANSYS code.
After evaluating the stress intensity factor K, the fatiguecrack growth rate can be calculated using the Griffith–Irwin empirical equation [www.utm.edu] that fits the en-tire crack growth region.
dadN
=C(∆K −∆Kth)m
(1−R)Kcrit −∆K(7)
where R is the stress ratio, equal to σmin/ σmax, Kcrit iscritical stress intensity factor, m and C are material de-pendent constants, ∆Kth is threshold stress intensity fac-tor. The essential part of this equation (7) is to calcu-late the stress intensity factor range, ∆K. Since there isno closed form solution of ∆K, an empirical equation ofthe form ∆K = α∆σ
√πais usually assumed to relate the
range of stress intensity factor, with the nominal stressrange, ∆σ and with the crack length, a; and α is a factorrelated to the specific geometry in question.
In order to appropriately assess fatigue crack propaga-tion in welded joints it is necessary to obtain accurate re-sults for stress intensity factor solution in the crack prop-agation phase. Generally the stress intensity factor for acrack in a welded joint depends on the global geometry ofthe joint, which include the weld profile, crack geometry,residual stress condition, the properties of HAZ (heat-affected-zone) material and the type of loading. There-fore, the calculation of the stress intensity factor, even forsimple types of weldments, requires detailed analysis ofseveral geometric parameters and loading systems. Thetwo approaches that have mostly been used till now forassessing stress intensity factors for crack in weldmentsare weight function method [Bueckner (1970)] and thefinite element method.
The FEM enables the analysis of complicated weld ge-ometry due to its great versatility. It is able to use elastic-plastic elements to include crack tip plasticity. In FEMthe stress intensity factor can be calculated directly fromthe stress field or from the displacement field around thecrack tip. In this study FEM has been used for calculationof stress intensity factor.
After integrating the above expression, the fatigue crack
propagation life Np is obtained by the following expres-sion,
Np =Z a f
ao
(1−R)Kcrit −∆KC (∆K −∆Kth)
m da (8)
The debonding model and the fracture mechanics crackgrowth model are essentially the same. The debondingmodel is used for the calculation of range of stress in-tensity factor ∆K in equation (7) using the concept ofdebonding (equation (4)) and using equations (7) and (8)fatigue crack growth rate and propagation life is calcu-lated. All other values in Equation (7) are known orassumed. This equation (7) is applicable for the entirethree regions of the crack growth curve. Crack initiationgrowth rate or initiation life has not been modeled in thisanalysis. This model is being used for the calculation ofcrack propagation life, taken just after the range of thethreshold stress intensity factor, ∆Kth.
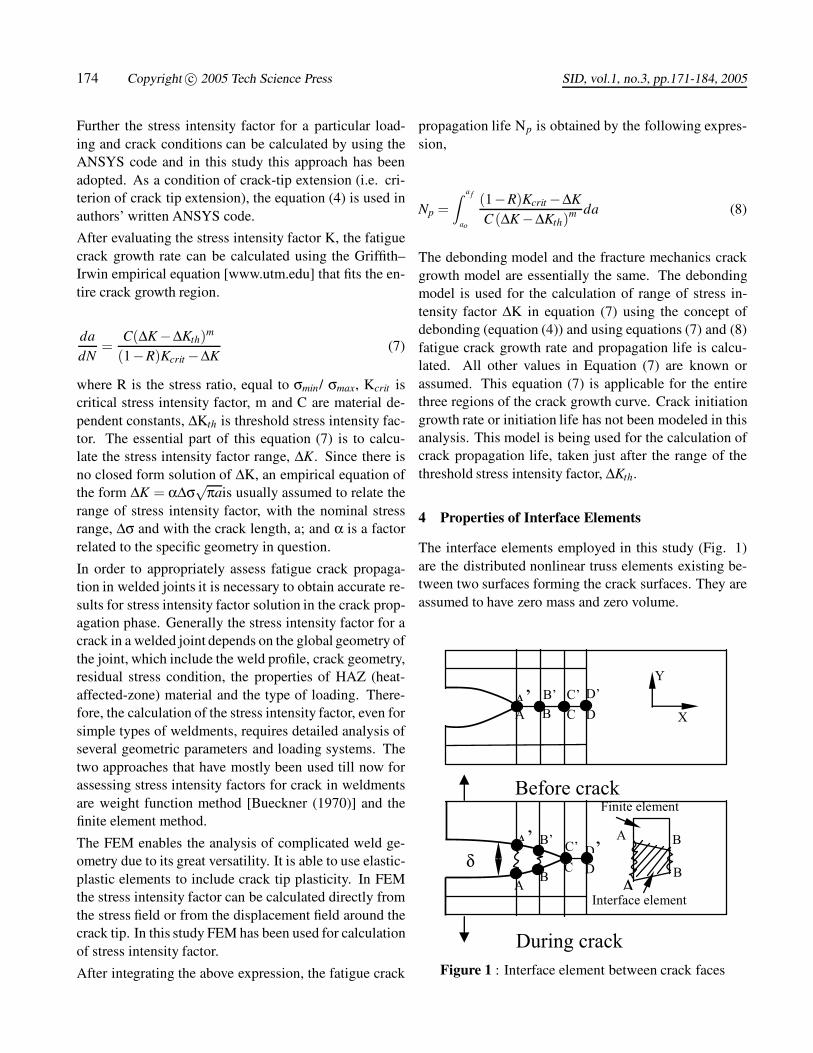
4 Properties of Interface Elements
The interface elements employed in this study (Fig. 1)are the distributed nonlinear truss elements existing be-tween two surfaces forming the crack surfaces. They areassumed to have zero mass and zero volume.
DCA’ D’B’ C’
A B
Y
X
D’C’B’A’
BA
C Dδ
A
A B
B
Interface element
Finite element
Before crack
During crack
Figure 1 : Interface element between crack faces

Finite Element Modeling of Fatigue Crack Growth in Curved-Welded Joints Using Interface Elements 175
Figure 2 represents a model of two linearly connectedelements. The top element represents an elastic-plasticcontinuum, which represents the plastic zone near thecrack tip. The non-linear truss element represents a po-tential failure surface.
The relation between the bonding stress (σ) and crackopening displacement (δ) is shown in Fig. 3. When theopening displacement is small, the bonding between thetwo surfaces is maintained. As the opening displacementincreases, the bonding stress increases until it reachesa maximum value σcr. With further increase in δ, thebonding strength is rapidly lost and the surfaces are com-pletely separated.
F
Elastic-plasticelement
Non-lineartruss element
Figure 2 : Interface element as a combination of non-linear truss and elastic-plastic elements
The mechanical properties of these two non-linear ele-ments are characterized by the following sets of parame-ters, (γ, ro) and (E, σy, h), respectively. The parameter γand ro are the surface energy and the scale parameter ofthe interface.
The parameters E, σy, and h are Young’s modulus, theyield stress and the tangent modulus (slope of plastic por-tion of stress-strain curve) for a multilinear or bilinearmaterial respectively. The mechanical behavior of theidealized elastic-plastic continuum can be represented byFig.4.
5 Equilibrium Equation of the System
For simplicity, the outline of the mathematical formula-tion is presented for crack propagation in an elastic solid.
Crack Opening Displacement ( )
(2 , 2ro)
( , ro)
Bonding
Stress (σ)
Figure 3 : Mechanical properties of interface elements
Strain (ε)
y h: tangent
modulus
Stress (σ)
E: modulus of
elasticity
Figure 4 : Mechanical properties of elastic-plastic con-tinuum
When the material is elastic, the equilibrium equation canbe derived based on the principle of minimum potentialenergy.
The total energy Π of the elastic body with a propagat-ing crack can be described [Masakazu, Hisashi and Mu-rakawa (2000)] as the sum of the strain energy U, thepotential of external load W and the interface energy ofthe newly formed surface during crack propagation Us,i.e.
Π = U +Us +W (9)
In the finite element method, the elastic body to be ana-lyzed is subdivided into small elements and the displace-ments in each element are interpolated by nodal displace-ment uo. The total energy is described as
Π = Π(uo) = U(uo)+Us(uo)+W (uo) (10)

176 Copyright c© 2005 Tech Science Press SID, vol.1, no.3, pp.171-184, 2005
Further, U(uo),Us(uo),W(uo) can be represented asthe sum of the contributions from each elementUe(ue
o),Ues (ue
o),W(ueo), i.e.
Π(Uo) = Σ{Ue(ueo),U
es (ue
o),W(ueo)} (11)
where ueo is the nodal displacement vector for each ele-
ment extracted from the nodal displacement vector of thewhole system uo.
Once the total energy Π is given as in Eq. (11), the equi-librium equation in incremental form can be derived inthe following manner. Denoting the nodal displacementat the present step and its increment to the next step as uo
and ∆uo, the total energy Π can be described as a func-tion of uo +∆uo and can be expanded in a Taylor’s series,i.e.
Π(uo +∆uo) = Π(uo)+∆1Π(∆uo)+∆2Π(∆uo)
= Π(uo)−{∆uo}T{ f}+12{∆uo}T [K]{∆uo} (12)
where∆1Π and ∆2Π are the first and second terms in ∆uo,i.e.
∆1Π(∆uo) = −{∆uo}T{ f} (13)
∆2Π(∆uo) =12{∆uo}T [K]{∆uo} (14)
Further, the equilibrium equation can be derived as thestationary condition of Π(uo +∆uo) with respect to ∆uo,
∂∏(uo +∆uo)/∂∆uo = −{ f}+[k]{∆uo}
or
[k]{∆uo} = { f} (15)
where [k] and {f} are the tangent stiffness matrix and theload vector, respectively.
6 Stiffness Matrix and Force Vector of Interface El-ement
The stiffness matrix and the load vector of the interfaceelement can be derived in basically the same manner asthat for the whole system. The two surfaces separatewhen the load is applied. The opening displacement isdenoted by δs the surface area of the interface elementis Se and the interface energy for an element Ue
s(ueo) is
given by the following equation [Murakawa and Zhengqi(1999)].
Use(ue
o) =Z
φ(δ)dSe (16)
where δ is the crack opening displacement at an arbitrarypoint on the surface that can be interpolated using an in-terpolation function Ni(ξsη), i.e.
δ(ξ,η) = ΣNi(ξ,η)(wi+4−wi) (17)
where
N1(ξ,η) = 0.25(1+ξ)(1−η),
N2(ξ,η) = 0.25(1+ξ)(1+η),
N3(ξ,η) = 0.25(1−ξ)(1+η),
N4(ξ,η) = 0.25(1−ξ)(1−η)
and wi is the nodal displacement normal to the surface.These interpolations are for a 3-D model where the inter-face elements are 2-D. But for a 2D model the interfaceelement is 1-D and the shape functions are given by:
N1(ξ) = 0.5ξ(ξ−1), N2(ξ) = −(ξ+1)(ξ−1),
N3(ξ) = 0.5ξ(ξ+1)
Finally, the tangent stiffness matrix [ke] and the load vec-tor {fe} of the interface element can be derived by ex-panding Ue
s(ueo + ∆ue
o) with respect to ∆ueo in the follow-
ing manner.

Finite Element Modeling of Fatigue Crack Growth in Curved-Welded Joints Using Interface Elements 177
Ues (ue
o +∆ueo) =
Zφ(δ+∆δ)dse
=Z
φ(δ)dse +Z
dφ(δ)dδ
∂δ∂ue
o∆ue
odse
+12
Zd2φ(δ)
dδ2 (∂δ∂ue
o∆ue
o)2dse
+higherorderterms (18)
where
Zdφ(δ)
dδ∂δ∂ue
o∆ue
odse = −{ f e}T{∆ueo} (19)
and
12
Zd2φ(δ)
dδ2 (∂δ∂ue
o∆ue
o)2ds2 =
12{∆ue
o}T [ke]{∆ueo} (20)
Since the interface element has no volume or mass, thesame formulation can be applied to both static and dy-namic problems. By arranging the interface elementsalong the crack extension path in the simple model, crackpropagation problems can be analyzed.
7 FEM Simulation of Fatigue Crack Growth
A new approach for crack propagation by killing or“death” elements (deactivate the element properties) isintroduced in this analysis (birth and death option in An-sys 7.1). A bundle of non-linear truss elements as shownin Fig. 5, each having different material properties (mod-ulus of elasticity, yield stress and tangent modulus) isused to connect to each boundary node ahead of the ini-tial crack tip.
These values are lower to higher order from the crack tipto the other end. These elements have the same cross-sectional area and have capabilities to take both tensionand compression loads. The stiffness of each truss ele-ment in terms of modulus of elasticity has different val-ues from an extremely large value (210 GPa) (other endfrom the crack tip) to a value near the yield stress (280MPa) (near crack tip). During each cycle of loading andunloading, the stiffness of each truss element is decreasedby a certain amount (depends on total number of inter-face elements) using the MPCHG (ANSYS command to
Crack Tip
FEM
Mesh
Non-
linear
truss
element
Figure 5 : A schematic views of the truss elements con-nected between two surfaces of separate mild steel plateshaving same material properties.
change properties) command. After each cycle of load-ing and unloading, the elemental axial stress is calcu-lated. When any element’s stress exceeds the criticalbonding stress that element is killed (deactivated mate-rial property) by using EKILL command. At the sametime the element material properties from the crack tip tothe other end is moved (changed) successively. Similarly,after ten cycles, the stress intensity factor at the crack tip(next to the killed element) is calculated by defining thecrack path and using the KCALC command. From thestress intensity factor, the crack growth rate is calculatedusing equation (7) and the crack propagation life usingequation (8).
This method has several advantages compared to otheravailable numerical methods. The node release by killingelements can be performed at any time during a cyclicloading process irrespective of the magnitude of the de-formation caused by the release of the nodes. Further-more, several elements can be killed simultaneously, e.g.during a single overload cycle (which is higher than theyield strength of the material). This method overcomesthe limitation of crack propagation of one element lengthduring each cycle of loading. In this method, the crackpropagates automatically when the element’s stress ex-ceeds the bonding stress of the element. Here a crackcan propagate in more than one direction but a limitationis that the possible directions have to be determined ear-lier depending on the physical crack configuration, load-ing and material homogeneity. For bi-axial (multi load)loading where the crack directions are not obvious, thismethod may be suitable.
7.1 Overall Methodology for Fatigue Life Calculation
The critical stress intensity factor for short-term fractureKcrit , material constants C and m, and the threshold stress

178 Copyright c© 2005 Tech Science Press SID, vol.1, no.3, pp.171-184, 2005
intensity factor range ∆Kth(R) as a function of R for thematerial to be analyzed is determined or collected fromliterature (∆Kth(R) as a function of R could be found[Anderson (1994)]).
The values of the surface energy per area γ, the scale pa-rameter ro,andtheshape parameter, n for the material aredetermined experimentally or collected from literature.
The Finite Element model is created and the interface el-ements are introduced in the possible crack propagationdirections (maximum stress concentration, weld defect,etc). The critical bonding stress, σcr of the interface el-ements is determined using the equation (4). The plasticzone radius is calculated using the standard equation andthe elastic-plastic material properties are applied to theelements within the plastic zone.
The cyclic load for a particular stress ratio is applied tothe model and after each cycle of loading the interfaceelement-stress is calculated. When any element stressexceeds the critical bonding strength, (which was calcu-lated using equation (4)), that element is killed. Thus af-ter some cycles (10 to 20 cycles or more) the crack prop-agation is viewed (only the active elements are viewedand killed elements are kept hidden) and the final cracklength is determined. For the same crack length andstress conditions, the stress intensity factor is calculatedusing Authors’ ANSYS input files. All the works in steps3 and 4 of this section are computed using authors’ writ-ten ANSYS input files. In written code, equation (4) isused as a condition of crack extension which affect thecrack-tip region and eventual calculations of stress inten-sity factor. The crack tip front region is simulated us-ing interface element and its properties. The crack willonly propagate when the interface “element-stress” nearthe crack tip exceeds the critical bonding stress calcu-lated using equation (4). Furthermore, the displacementfield around the crack tip is influenced by the propertiesof the interface elements (since the crack tip front regionis simulated using interface element and its properties),and consequently, the stress intensity factor will also beinfluenced by interface elements’ properties. The mate-rial properties of the interface elements are changed aftereach cycle.
The fatigue crack growth rate and the fatigue life are cal-culated using equation (7) and (8).
8 Case Studies
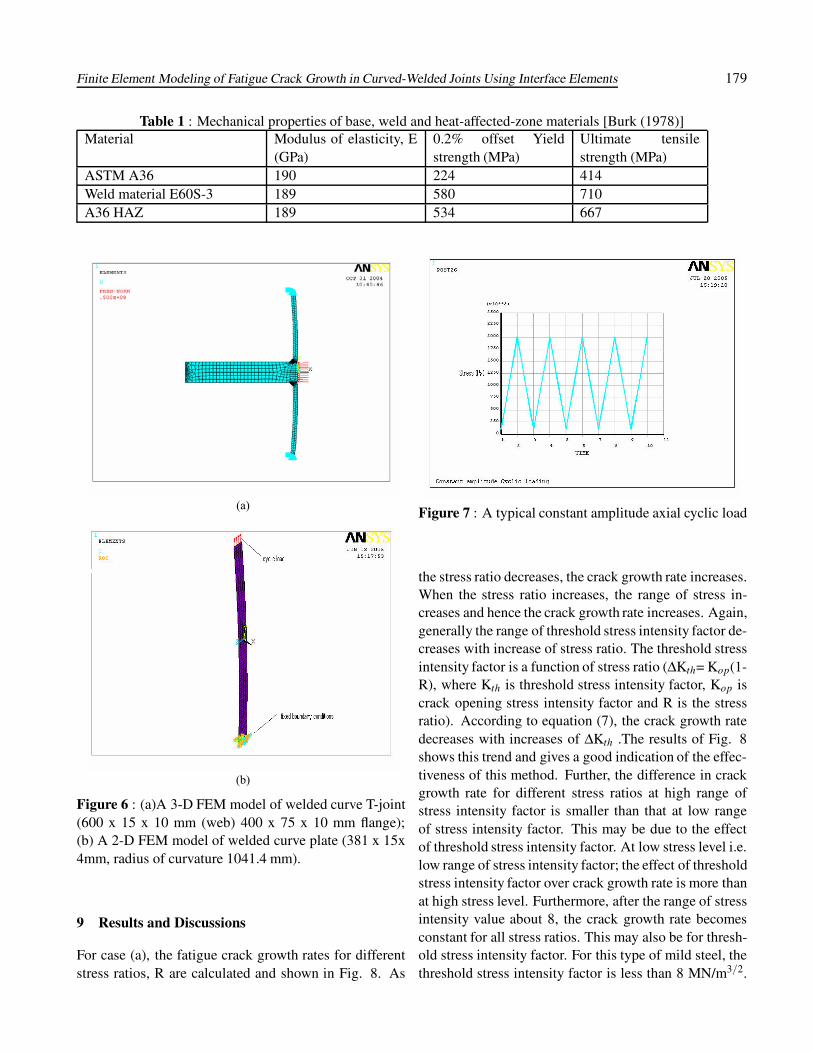
Two cases are considered here: Case (a) A 2-D finite el-ement model of a curve T-joint (600 x 15 x 10 mm (web)400 x 75 x 10 mm flange) (Fig 6a) and Case (b) A 3-Dfinite element model of a curve plate (381 x 15x 4mm,radius of curvature 1041.4 mm) (Fig 6b) are created andinterface elements as described above are applied in thecrack faces. In curve plate, the applied stress producesmoment, which can not be represented in 2-D model.Therefore a 3-D model is created and shells 181 elementswhich have bending capacity is used in the model.
The curve T- joint represents the connection of shell platewith transverse girder of ship/aircraft structures. Thisjoint experiences fluctuating wave load in the case ofship. The top and bottom side of both models are fixed inall degrees of freedom and a cyclic load is applied at theright side. The amplitudes of cyclic loads (minimum 10MPa, maximum 200 MPa) shown in Fig. 7 are applied tothe model. The model is created and analyzed by writingANSYS input files as mentioned in Section 7.
The mechanical properties of base, weld and heat-affected-zone (HAZ) materials as shown in Table 1 areapplied to the model. The Paris’ crack growth rate con-stants for steel are assumed as: C = 3 x10⁻¹¹, m = 4. The∆Kth values were taken as 4, 5, 6 MN/m3/2 for stress ra-tios of 0.3, 0.2 and 0.1 respectively, from Fig.10.9 in [An-derson (1994)] for this particular weld. The critical stressintensity factor Kcrit is taken as 150 MN/m3/2 which isan average value of the critical stress intensity factor formild steel. The value of the critical stress intensity factorfor mild steel are reported to be in the range from 100to 200 MN/m3/2. Therefore, it is reasonable to take anaverage value of 150 MN/m3/2. In addition, the residualstresses of different magnitudes at different weld regionsare applied. The residual stress values varied from 120MPa (tension) to –120 MPa (compression) from the cen-ter to the edge of weld as found in [Glinka(1994)]. Itis assumed that for this welded joint the crack initiationphase is very short and insignificant due to the presenceof initial welding defects. Initial crack length has beenassumed to be 4 mm. An axial cyclic load near the yieldstrength of the material is applied for various cycles, andthe corresponding stress intensity factor and crack open-ing displacement are calculated from the FEM analysis.Then using equation (7) and (8), the fatigue crack growthrate and fatigue crack propagation life are calculated.
Finite Element Modeling of Fatigue Crack Growth in Curved-Welded Joints Using Interface Elements 179
Table 1 : Mechanical properties of base, weld and heat-affected-zone materials [Burk (1978)]Material Modulus of elasticity, E
(GPa)0.2% offset Yieldstrength (MPa)
Ultimate tensilestrength (MPa)
ASTM A36 190 224 414Weld material E60S-3 189 580 710A36 HAZ 189 534 667
(a)
(b)
Figure 6 : (a)A 3-D FEM model of welded curve T-joint(600 x 15 x 10 mm (web) 400 x 75 x 10 mm flange);(b) A 2-D FEM model of welded curve plate (381 x 15x4mm, radius of curvature 1041.4 mm).
9 Results and Discussions
For case (a), the fatigue crack growth rates for differentstress ratios, R are calculated and shown in Fig. 8. As
Figure 7 : A typical constant amplitude axial cyclic load
the stress ratio decreases, the crack growth rate increases.When the stress ratio increases, the range of stress in-creases and hence the crack growth rate increases. Again,generally the range of threshold stress intensity factor de-creases with increase of stress ratio. The threshold stressintensity factor is a function of stress ratio (∆Kth= Kop(1-R), where Kth is threshold stress intensity factor, Kop iscrack opening stress intensity factor and R is the stressratio). According to equation (7), the crack growth ratedecreases with increases of ∆Kth .The results of Fig. 8shows this trend and gives a good indication of the effec-tiveness of this method. Further, the difference in crackgrowth rate for different stress ratios at high range ofstress intensity factor is smaller than that at low rangeof stress intensity factor. This may be due to the effectof threshold stress intensity factor. At low stress level i.e.low range of stress intensity factor; the effect of thresholdstress intensity factor over crack growth rate is more thanat high stress level. Furthermore, after the range of stressintensity value about 8, the crack growth rate becomesconstant for all stress ratios. This may also be for thresh-old stress intensity factor. For this type of mild steel, thethreshold stress intensity factor is less than 8 MN/m3/2.

180 Copyright c© 2005 Tech Science Press SID, vol.1, no.3, pp.171-184, 2005
1.0E-09
1.0E-08
1.0E-07
1.0E-06
1.0E-05
1.0E-04
1.0E+00 1.0E+01 1.0E+02
Range of stress intensity factor(MPam^.5)
Cra
ck g
row
th r
ate
(m
/cycle
)
R=0.1
R=0.2
R=0.3
Figure 8 : Fatigue crack growth rate with the range ofstress intensity factor (for case a).
Therefore, there is less effect of threshold stress intensityfactor on fatigue crack growth rate after 8 MN/m3/2.
1.E+00
1.E+01
1.E+02
1.E+00 1.E+02 1.E+04 1.E+06 1.E+08 1.E+10 1.E+12
Fatigue life (cycle)
Ran
ge o
f str
ess in
ten
sit
y f
acto
r( M
Pam
^.5
)
R=0.1
R=0.2
R=0.3
Figure 9 : Variation of fatigue life with range of stressintensity factor (for case a)
The variation of fatigue life with range of stress intensityfactor for three stress ratios is shown in Fig.9. The fa-tigue life increases at low stress intensity factor and thetrend is to become infinity below threshold stress inten-sity factor. Because at low stress level, the accumulationof fatigue crack growth is very low and the fatigue lifeincreases toward infinity. On the other hand, the fatiguelife decreases with the increase of stress intensity factor.For a particular range of stress intensity factor 10, the fa-tigue life decreases about 20 % at stress ratio 0.2 and 38% at stress ratio 0.3 comparing to that at stress ratio 0.1.
The variation of crack opening displacement with cracktip stress is shown in Fig. 10. The crack opening dis-
0.0E+00
5.0E-05
1.0E-04
1.5E-04
2.0E-04
2.5E-04
3.0E-04
3.5E-04
4.0E-04
0.E+00 5.E+07 1.E+08 2.E+08 2.E+08 3.E+08
Crack tip stress (Pa)
CO
D (
m)
R=0.1
R=0.2
R=0.3
Figure 10 : Variation of crack tip opening displacement(COD) with crack tip stress (for case a)
0.0E+00
5.0E-03
1.0E-02
1.5E-02
2.0E-02
2.5E-02
3.0E-02
0.0E+00 5.0E+07 1.0E+08 1.5E+08 2.0E+08 2.5E+08
Crack tip stress (Pa)
Cra
ck t
ip s
train
(m
m/m
m)
R=0.3
R=0.2
R=0.1
Figure 11 : Variation of strain at crack tip with crack tipstress (for case a)
placement (COD) increases with crack tip stress. Fora particular crack tip stress, the COD increase with in-creases of stress ratios. In this case, load amplitude wasconstant; increasing both minimum and maximum loadhas changed the stress ratios. Therefore, the stress ratioincreases with the increases of maximum stress. The re-sults shown here are for the maximum load only. For thisreason, the COD increases with the increase of stress ra-tio. Further at low stress, the variation of COD is less(0.03 mm) comparing to high stress level (0.15 mm).The crack tip stress increases with the increases of cracklength. So the COD increases with the increases of cracktip stress.
The variation of strain in the y-direction at the crack tipwith crack tip stress is shown in Fig. 11. The strain in-

Finite Element Modeling of Fatigue Crack Growth in Curved-Welded Joints Using Interface Elements 181
1.0E-09
1.0E-08
1.0E-07
1.0E-06
1.0E-05
1.0E-04
1.0E-03
1.0E+01 1.0E+02 1.0E+03
Range of stress intensity factor(MPam^.5)
Cra
ck g
row
th r
ate
(m
/cycle
)
R=0.1
R=0.2
R=0.3
Figure 12 : Fatigue crack growth rate with the range ofstress intensity factor (for case b).
1.E+00
1.E+01
1.E+02
1.E+00 1.E+02 1.E+04 1.E+06 1.E+08 1.E+10
Fatigue life (cycle)
Ran
ge o
f str
ess in
ten
sit
y f
acto
r(
MP
am
^.5
)
R=0.1
R=0.2
R=0.3
Figure 13 : Variation of fatigue life with range of stressintensity factor (case b)
creases with crack tip stress. At low crack tip stress, thechange in strain for different stress ratios is less com-paring to that in high crack tip stress. The crack tipstress increases with increases of crack length. As thecrack length increases, the material stiffness decreasesand crack tip stress increases, and hence the strain in-creases.
For case (b), the fatigue crack growth rate for differentstress ratios, R is shown in fig. 12. For case (b), thecrack growth rate is higher than that in case (a). Becausein case (b), the bending effect may accelerates the crackgrowth rate.
The crack growth rate increases rapidly above the startingpoint of the fast fracture. At the fast fracture, the materiallosses stiffness and stability and the crack growth rateincreases rapidly.
The variation of fatigue life with range of stress intensity
5.0E-03
5.5E-03
6.0E-03
6.5E-03
7.0E-03
7.5E-03
8.0E-03
8.5E-03
9.0E-03
9.5E-03
1.0E-02
1.E-03 2.E+09 4.E+09 6.E+09 8.E+09 1.E+10 1.E+10 1.E+10 2.E+10
Crack tip stress (Pa)
CO
D (
m)
R=0.1
R=0.2
R=0.3
Figure 14 : Variation of crack tip opening displacement(COD) with crack tip stress (case b)
0.05
0.1
0.15
0.2
0.25
0.3
0.E+00 2.E+09 4.E+09 6.E+09 8.E+09 1.E+10 1.E+10 1.E+10 2.E+10
Crack tip stress (Pa)
Cra
ck t
ip s
trainR=0.3
R=0.2
R=0.1
Figure 15 : Variation of strain at crack tip with crack tipstress (case b)
factor for case (b) is shown in Fig.13. For the same rea-son i.e. the bending effect, in case (a) the fatigue crackgrowth rate is less comparing to that in case (b). There-fore the fatigue life increases in case (a) comparing tocase (b). At low range of stress intensity factor the fa-tigue life increases rapidly and its trend is toward infin-ity. At low stress level, the accumulation of fatigue crackgrowth is very low (1E-9 m/cycle) and the fatigue lifeincreases toward infinity.
The variation of crack opening displacement with cracktip stress for case (b) is shown in Fig. 14. The crack
opening displacement (COD) increases with theincreases of crack tip stress. Since in case (b), the
bending stress accelerates the crack growth, the COD incase (a) decreases comparing to that in case (b).
The variation of strain at the crack tip with crack tip stress

182 Copyright c© 2005 Tech Science Press SID, vol.1, no.3, pp.171-184, 2005
for case (b) is shown in Fig. 15. The strain increases withcrack tip stress. At low crack tip stress, the change instrain for different stress ratios is less comparing to thatin high crack tip stress. The crack tip stress increaseswith increases of crack length. As the crack length in-creases, the material stiffness decreases and hence thestrain increases. Further for similar reason, the strain incase (a) decreases comparing to that in case (b).
9.1 Traditional FEM Model for Fatigue Crack Prop-agation
Traditional FEM model for an edge-cracked plate isshown Fig. 16. In the lower edge of the plate sym-metric boundary condition is applied and in the upperedge cyclic stress loading is applied. In traditional FEM,the crack tip is extended one element length per cyclewhen the applied stress reached the maximum level. Foreach increment of the crack extension, a stress analysisis carried out and the stress intensity factors are evalu-ated. Similarly in this traditional model one crack tipnode (from left side) is released (degrees of freedom isdeleted or stiffness is set zero) after each cycle and stressintensity factor is calculated.
The comparison of fatigue crack propagation life be-tween new (Interface Model) and traditional FEM modelis shown in Fig. 17. It is found that in the traditionalmethod, the fatigue crack propagation life is less com-paring to that in the new proposed method. Since forthe same stress level the displacement field around thecrack tip is influenced by the properties of the interfaceelement near the crack tip, the stress intensity factor hasbeen changed due to interface elements’ properties. Fur-ther, the final crack lengths are also found different in thismethod for the same cycle of applied load. Furthermore,the difference in fatigue life at low stress range is morethan in the high stress range, because at higher stress cy-cles, crack initiation occurs much faster.
9.2 Comparison with Experimental Results
For validation, the predictions have been compared withthe experimental results obtained using universal MTStesting machine for curve plates. The experimental re-sults are for a single-V butt welded curve plate joint ofthe dimensions (381 x 15 x 4 mm) as shown in Figure 18.The mechanical properties of the weld material are thesame as shown in Table 1. Similar model (same geomet-ric and mechanical properties) has been analyzed using
Figure 16 : Traditional FEM model for fatigue crackpropagation
the authors’ computer program and ANSYS code. Thestress ratios for both the cases (experimental and predic-tion) are the same (R= 0) and the maximum loads are alsothe same (150, 180, 200, 220, 250 MPa respectively).The initial crack lengths for both the cases are consid-ered to be 4 mm. The comparison is shown in Fig 19.At low and high stress range, the trend of both the resultsis different but at medium stress range, the difference islow. At 2x 10⁶cycles,the percentage change in the stressrange is about 6.
This difference may be due to a different threshold stressintensity factor. The threshold stress intensity factor usedin this analysis is collected from the literature [Anderson(1994)] available in the field and an average value de-pendent on stress ratio was assigned. In the experiment,threshold stress intensity factor need not to be consideredseparately and it is counted automatically. Another rea-son for this slight deviation may be the effect of residualstress. The residual stresses used in the prediction modelare in the range from –120 MPa to 120 MPa but in theexperiment these values may be slightly different. Fur-ther during welding of curve plate, the radius of curvaturemay be changed. Furthermore the mechanical propertiesalso might be slight different from values collected fromliterature.
10 Conclusions
The proposed simulation of fatigue crack propagationusing an interface element is simple in formulation, ef-

Finite Element Modeling of Fatigue Crack Growth in Curved-Welded Joints Using Interface Elements 183
1
10
100
1.E+00 1.E+02 1.E+04 1.E+06 1.E+08 1.E+10 1.E+12
Fatigue life (cycle)
Ran
ge o
f str
ess in
ten
sit
y f
acto
r(
MP
am
^.5
)
From Traditional FEM, R=0.1
From New FEM, R=0.1
Figure 17 : Comparison of fatigue crack propagation lifefrom new and traditional FEM model for center crackplate
fective in practice, and numerically less intensive. Thismethod can be applied in T- and curve plate butt-joints.The method can be applied for symmetric and anti-symmetric planes under cyclic load and also for bendingloading. This method overcomes the limitation of cracktip extension at a rate of one element length per cycle. Inthis method the crack propagates only when the appliedload reaches the critical bonding strength.
Acknowledgement: The authors wish to acknowledgethe support received from the Louisiana State EconomicDevelopment Grant and Louisiana Board of Regent’sLaSpace Consortium Project # 127404104 and LouisianaState University Mechanical Engineering Department forproviding the facilities for this research.
References
Alam M.S. and Wahab M.A. (2005): Modeling of Fa-tigue Crack Growth and Propagation Life of Joint of TwoElastic Materials Using Interface Elements, InternationalJournal of Pressure Vessel and Piping, 82, pp. 105-113.
Anderson T.L. (1994): Fracture Mechanics, Fundamen-tals and applications, 2nd edition, CRC press, Boston,USA.
Bueckner H.F. (1970): A novel principle for the compu-tation of stress intensity 0factors, Zeitschrift AngewandteMathematik and Mechanick, 50, pp. 129-146.
Figure 18 : Specimen size of curve plate
100
1000
1.E+02 1.E+03 1.E+04 1.E+05 1.E+06 1.E+07 1.E+08 1.E+09 1.E+10
Failure life (Cycles)
Ran
ge o
f S
tress (
MP
a)
From proposed FEM simulation
From experimental results
Figure 19 : Comparison of prediction and experimentalresults
Burk J. D. (1978): Fatigue crack initiation and propa-gation life estimates, Ph.D thesis, Department of Met-allurgy and Mining, University of Illinois, Urbana-Champaign, Illinois, USA.
Chermahini R.G., Shivakumar K.N. and NewmanJ.C. (1988): Three dimensional finite element simula-tions of fatigue crack growth and closure, ASTM STP982, Philadelphia, PA, pp. 398-401.
Masakazu S., Hisashi S. and Murakawa H. (2000): Fi-nite element method for hot cracking using temperaturedependent interface element (report II), Journal of Weld-ing Research Institute, 29 (1), pp. 59-64.
McClung R.C. and Sehitoglu H. (1989): On the finiteelement analysis of fatigue crack closure-I, basic model-ing issue, Journal of Engineering Fracture Mechanics, 3,pp. 237-252.

184 Copyright c© 2005 Tech Science Press SID, vol.1, no.3, pp.171-184, 2005
Murakawa, M., Hisashi S. and Zhengqi W. (2000):Strength analysis of joints between dissimilar materialsusing interface elements, Journal of Welding ResearchInstitute, 29(2), pp. 71-75.
Murakawa H. and Zhengqi W. (1999): Computer sim-ulation method for crack growth using interface elementemploying Lennard Jones type potential function, Mate-rial Science Research International, 5(3), pp. 195-201.
Newman J.C., and Harry A. J. (1975): Elastic-plasticanalysis of a propagating crack under cyclic loading,Journal of AIAA, 13, pp. 1017-2023.
Newman J.C. (1977): Finite-element analysis of crackgrowth under monotonic and cyclic loading, ASTM STP637, Philadelphia, PA, pp. 56-80.
The University of Tennessee at Martin :http://www.utm.edu/departments/engin /lemaster/Machine%20 Design/Lecture%2012.pdf
Wu J. and Ellyin F. (1996): A study of fatiguecrack closure by elastic-plastic finite element analysisfor constant-amplitude loading, International Journal ofFracture, 82, pp. 43-65.