FINITE ELEMENT ANALYSIS IN OFFSHORE GEOTECHNICS ELEMENT ANALYSIS IN OFFSHORE GEOTECHNICS –A...
32
FINITE ELEMENT ANALYSIS IN OFFSHORE GEOTECHNICS – A 30-YEAR RETROSPECTIVE J. S. Templeton, III SAGE USA, Inc. SIMULIA Community Conference Providence, Rhode Island May 15-17, 2012. 1
-
Upload
truongcong -
Category
Documents
-
view
216 -
download
0
Transcript of FINITE ELEMENT ANALYSIS IN OFFSHORE GEOTECHNICS ELEMENT ANALYSIS IN OFFSHORE GEOTECHNICS –A...

FINITE ELEMENT ANALYSIS
IN OFFSHORE GEOTECHNICS– A 30-YEAR RETROSPECTIVE
J. S. Templeton, III
SAGE USA, Inc.
SIMULIA Community Conference
Providence, Rhode Island
May 15-17, 2012.
1

2
FINITE ELEMENT ANALYSIS
IN OFFSHORE GEOTECHNICS
Outline
•Milestones
•Piles and Well Conductors
- Performance under lateral loading
- Suction Foundations, total stress analysis
- Suction Foundations, long term holding
•Jack-up Rigs
- Performance in Severe Storms
- Performance in Earthquakes
•Conclusions
•Further Developments
•Acknowledgements

3
MILESTONES
(global)
• 1962, First published foundation FEA (Clough and Wilson)
(the second published paper to have “Finite Element” in the title)
• 1968, Roscoe and Burland modified Cam Clay theory of Critical
State Soil Mechanics (Schofield and Wroth).
• 1970, Hibbitt, Marcal and Rice (1970) established rigorous basis
for large strain FEA. McMeeking and Rice (1975) further elucidated.
• 1974, Nagtegaal, Parks and Rice (1974), resolved the problem of
shear locking of finite elements under large deformations.
• 1978-9, Miller, Murff and Kraft, as well as Carter, Randolph and Wroth
applied Modified Cam Clay to the problem of pile setup.
• 1980, Nystrom proposed incorporation of soil mechanics
capabilities into Abaqus.
• 1981, Abaqus soil mechanics capabilities released.

4
MILESTONES
(personal)
• 1967, Dynamic FEA of Saturn-Apollo vehicles in pre-NASTRAN era
• 1974, Studied Critical State Soil Mechanics,
via Tulane/Cambridge collaboration.
• 1981, Early Abaqus foundation analyses
• 1985, Analysis of geologic history of Mississippi Canyon soils
• 1986, First Abaqus analysis of offshore GBS foundation consolidation
• 1991, First Abaqus analysis of offshore subsidence effects.
• 1992, First FEA analysis to explain observed pile skin friction in sand
• 1996, Abaqus continuum dynamic FEA of wave propagation in soils
• 2002, Defined role of FEA in suction pile design.
• 2003, First FEA for offshore foundation under vortex-induced vibration
• 2004, First FEA of long term holding uplift capacity for suction caissons
• 2006, Standard setting publication on use of Abaqus for jack-up rigs
• 2008, First published FEA of continuum soil and structure EQ response
• 2009, Abaqus analysis plus centrifuge tests changed lateral pile practice.
• 2011, First dynamic FEA to match jack-up hurricane wave response
including foundation hysteretic damping effects
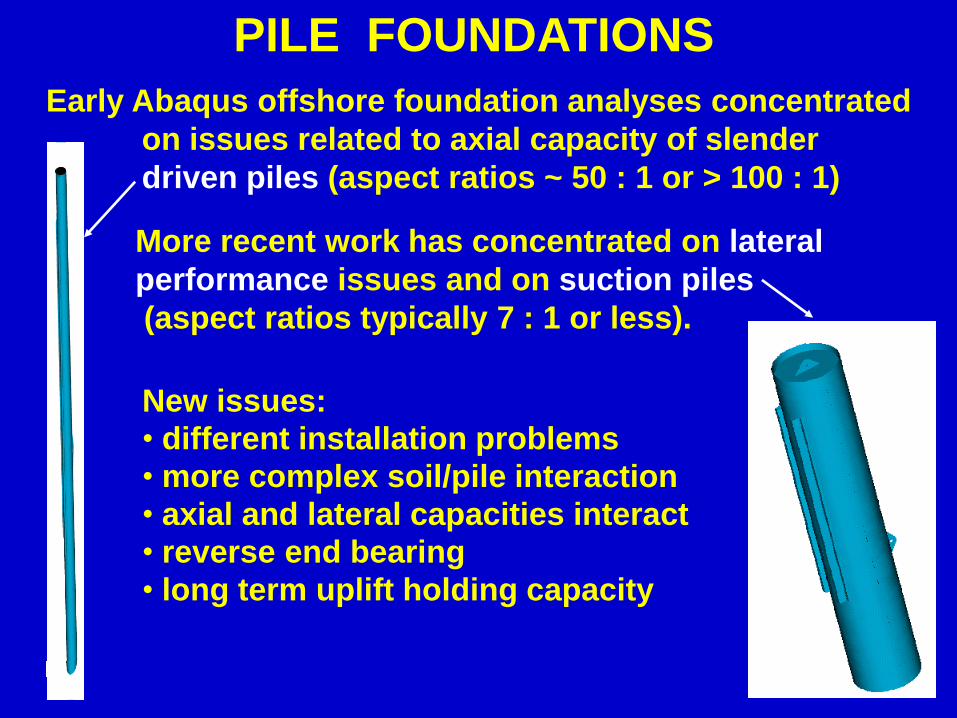
PILE FOUNDATIONS
More recent work has concentrated on lateral
performance issues and on suction piles
(aspect ratios typically 7 : 1 or less).
Early Abaqus offshore foundation analyses concentrated
on issues related to axial capacity of slender
driven piles (aspect ratios ~ 50 : 1 or > 100 : 1)
New issues:
• different installation problems
• more complex soil/pile interaction
• axial and lateral capacities interact
• reverse end bearing
• long term uplift holding capacity

LATERAL PERFORMANCE OF
SLENDER PILES AND WELL CONDUCTORS IN CLAY
0 0.1 0.20
2
4
6
8
10
12
14
16
API WSD 21st
API WSD 21st Errata
FEA
Centrifuge
test 1 - 24ft - FEA @ 23.3ft and 25ft
Lateral Displacement / Diameter, Y/D
Res
ista
nce
/ S
hear
Str
en
gth
, P
/Su
DOUBLE-BLIND Abaqus analysis and centrifuge test results
agreed extremely well, but both indicated substantially
greater capacity than current recommended practice.

SUCTION FOUNDATIONS
SUCTION CAISSONSSUCTION PILES
Installation by suction gets progressively more
effective as water depth increases, while driving
becomes more problematic and more expensive.

0
5000
10000
15000
20000
25000
0.0 0.2 0.4 0.6 0.8 1.0 1.2
Vertical (pullout) displacement at anchor point, m
Lo
ad
, kN
Anchor pointpenetration = 6.4 m
Anchor pointpenetration = 8.0 m
Anchor pointpenetration = 9.2 m
Anchor pointpenetration = 11.0 m

Abaqus results with pile loaded
above midpoint and low water depth
resulted in little separation and
negligible effect on performance.
With a high attachment
point, and an inclined load,
soil can separate from pile
here - even in clay, if water
is not too deep.
10
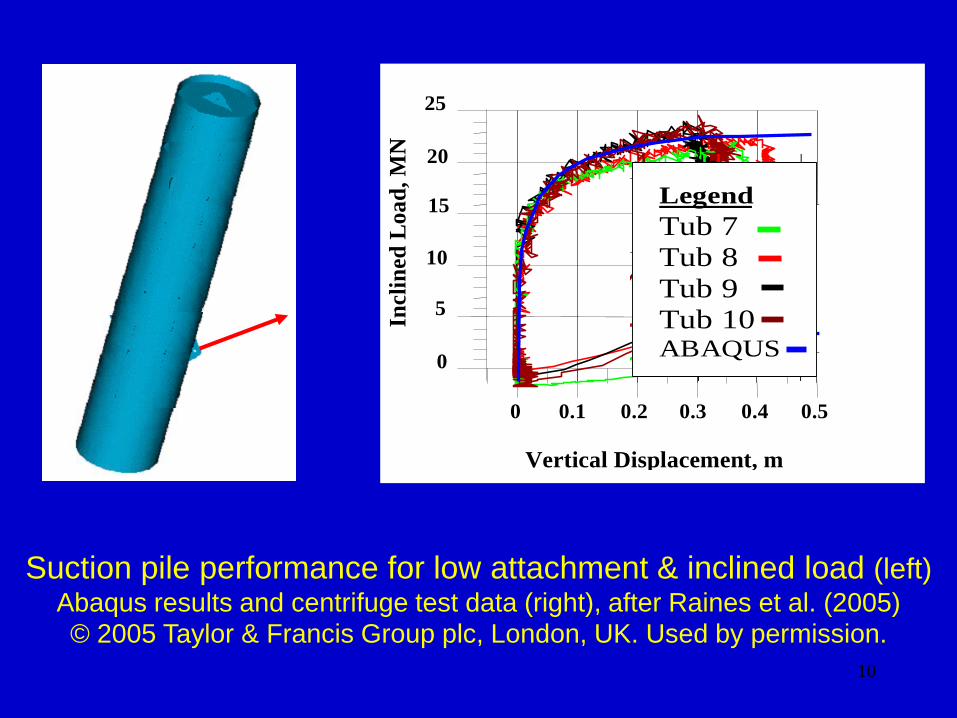
0 0.1 0.2 0.3 0.4 0.5
0
5
10
15
20
25
Fig. 6. ABAQUS Results Compared to
Inclined Load Test Data
Vertical Displacement, m
Incl
ined
Lo
ad
, M
N
Legend
Tub 7
Tub 8
Tub 9
Tub 10 ABAQUS
0 0.1 0.2 0.3 0.4 0.5
0
5
10
15
20
25
Fig. 6. ABAQUS Results Compared to
Inclined Load Test Data
Vertical Displacement, m
Incl
ined
Loa
d, M
N
Legend
Tub 7
Tub 8
Tub 9
Tub 10 ABAQUS
Suction pile performance for low attachment & inclined load (left)Abaqus results and centrifuge test data (right), after Raines et al. (2005)© 2005 Taylor & Francis Group plc, London, UK. Used by permission.

Finite Element Results for OTRC Workshop Straw Problem
Load elevation angle = 26 degrees
0
1000
2000
3000
4000
5000
0 1 2 3 4 5 6 7 8 9 10
Vertical displacement, ft
Lo
ad
re
su
ltan
t, K
ips
Program C, small deformation theory
Program A, small deformation theory
Program A, large deformation theory
Program C, large deformation theory
Workshop solution, ax. cap. limiting, unfactored, e. b. cap. fac.= 9, excl. weights
Results from Abaqus (A) and comparison
program (C) for pullout performance of
suction pile with 5 : 1 aspect ratio, 26-degree
inclined load and low (3/4) attachment point

Pore Pressure Dissipation with time near tip of pile
during long term hold of uplift load
At start of hold After 11,000 days

13
0.60
0.65
0.70
0.75
0.80
0.85
0.90
0.95
1.00
1 10 100 1000 10000 100000
Hold time, t (days)
Q/Q
ult
FEA parametric study , NC GOM clay, L/D = 5.3
UWA centrifuge test, kaolin, L/D=3.9
C-Core centrifuge test, Alw hite kaolin, L/D=4.8
FEA design case, GOM site 1, L/D=5
FEA design case, GOM site 2, L/D=5
FEA design case, GOM site 2, L/D=7
FEA par. study adjusted for alpha = 0.8
FEA par. study, adjusted for Cv/2 and L/D=7
FEA par. study, adjusted for alpha = 0.8, Cv*2 and L/D = 4
displacement = 5% D
displacement = 10% D
displacement = 5% D
10%
7%
7%
6%
6%
Results for Uplift Holding Capacity vs. Hold Time

JACK-UP RIGS(Bottom Founded Mobile Offshore Drilling Units)
Independent Leg Mat Supported

EPJoints
MODELS FOR
JACK-UP RIG
ANALYSIS
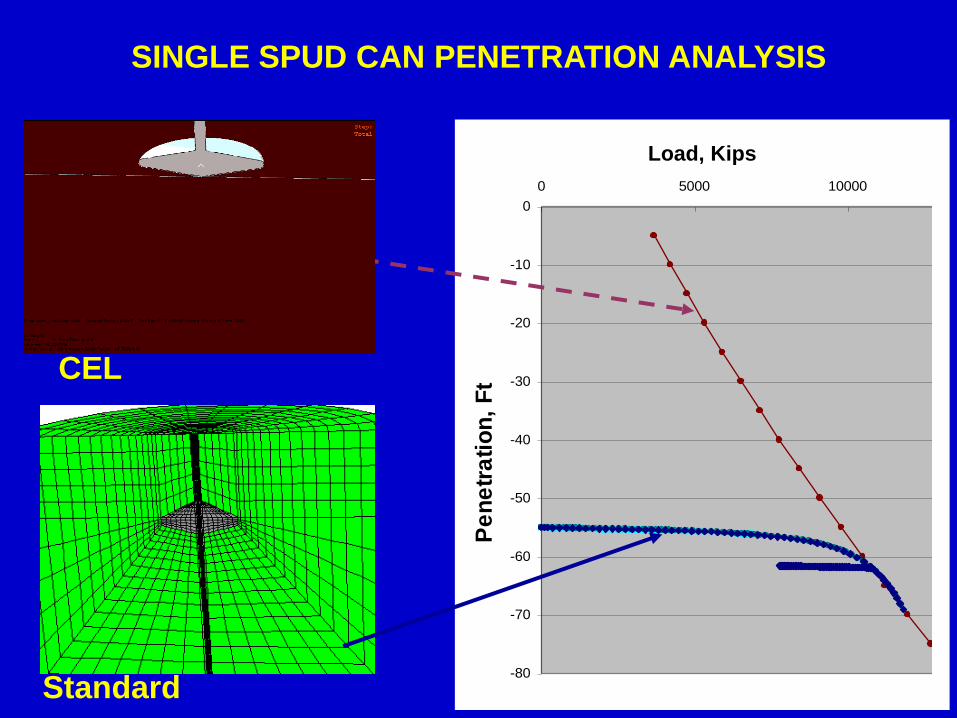
Finite Element Penetration Analysis
ML 116 C, initially embedded at 55 ft
preloaded to 62 ft, debalasted and reloaded
-80
-70
-60
-50
-40
-30
-20
-10
0
0 5000 10000 15000 20000 25000
Vertical Load, kips
Pe
ne
tra
tio
n,
Ft
PenetrationCurve, Example,GOM Clay
F. E. Analysis
Load, Kips
Finite Element Penetration Analysis
ML 116 C, initially embedded at 55 ft
preloaded to 62 ft, debalasted and reloaded
-80
-70
-60
-50
-40
-30
-20
-10
0
0 5000 10000 15000 20000 25000
Vertical Load, kips
Pe
ne
tra
tio
n,
Ft
PenetrationCurve, Example,GOM Clay
F. E. Analysis
SINGLE SPUD CAN PENETRATION ANALYSIS
CEL
Standard
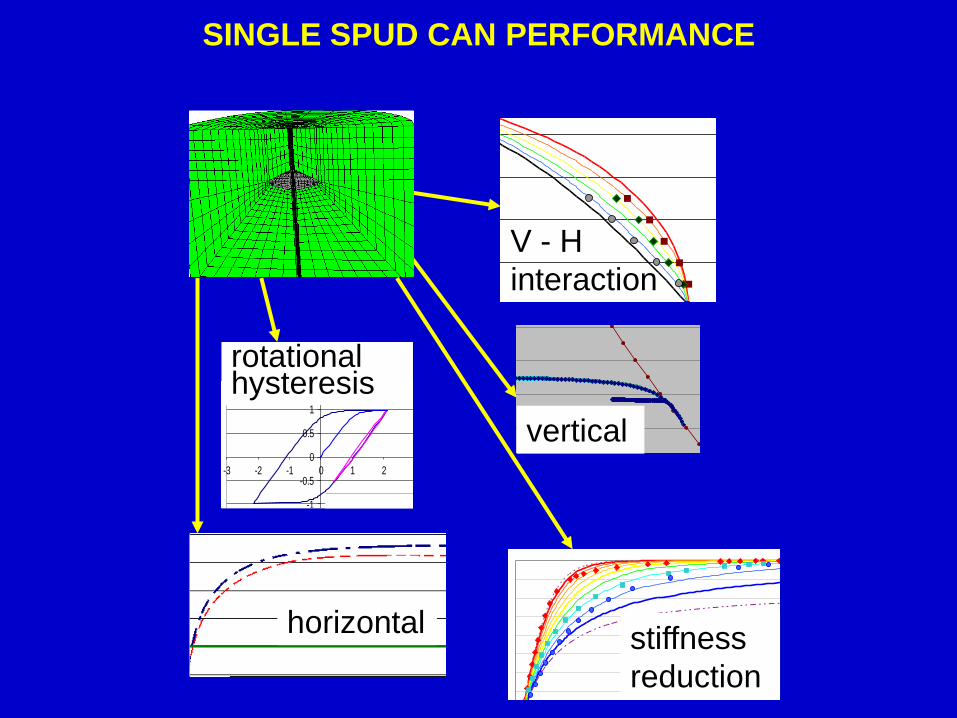
SINGLE SPUD CAN PERFORMANCEForce and Moment Capacity Interaction
FEA Results Compared to Interpolation from Parabola to Ellipse
0
0.2
0.4
0.6
0.8
1
0.5 0.6 0.7 0.8 0.9 1 1.1
Verticalal Force Capacity, Relative to Maximum
Mom
ent
Cap
acity
, R
elat
ive
to M
axim
um
FEA Results, D/B = 1.7
FEA Results, D/B = 1.2
FEA Results, D/B = 0.3
b = 1, Ellipse
b = 0.8
b = 0.6
b = 0.4
b = 0.2
b = 0, Bulletin 5-5 Parabola
0
0.1
0.2
0.3
0.4
0.5
0.6
0.7
0.8
0.9
1n = -1.25 (N/A)
n = -1.0 (maximum sharpness), hyperbolic tangent
-0.75
-0.5
-0.25
n = 0, sand per original Bulletin 5-5, exponential
function
0.25
0.5
0.75
n = 1.0, clay per orig. Bul. 5-5 (min. sharpness),
hyperbola
n = 1.25 (N/A)
SAGE FEA, work hardening GOM clay, with vertical
load and preload
SAGE FEA, work hardening GOM clay, with vertical
load but no preload
SAGE FEA, work hardening GOM clay, with no
preload or vertical load
n =
Finite Element Penetration Analysis
ML 116 C, initially embedded at 55 ft
preloaded to 62 ft, debalasted and reloaded
-80
-70
-60
-50
-40
-30
-20
-10
0
0 5000 10000 15000 20000 25000
Vertical Load, kips
Pe
ne
tra
tio
n,
Ft
PenetrationCurve, Example,GOM Clay
F. E. Analysis
vertical
horizontal
V - H
interaction
stiffness
reduction
-1.5
-1
-0.5
0
0.5
1
1.5
-3 -2 -1 0 1 2 3
Mo
me
nt
/ M
ax M
om
en
t
Rotation / Refence Rotation
Cyclic FEA Analysis Results
Complete Cyclic Reversal:Low Stiffness, High Damping
Partial Cyclic Reversal: HighStiffness, Low Damping
rotational hysteresis

SINGLE SPUD CAN PERFORMANCE
INTO SIMPLIFIED SPUD CAN FOUNDATION MODEL
Force and Moment Capacity Interaction
FEA Results Compared to Interpolation from Parabola to Ellipse
0
0.2
0.4
0.6
0.8
1
0.5 0.6 0.7 0.8 0.9 1 1.1
Verticalal Force Capacity, Relative to Maximum
Mom
ent
Cap
acity
, R
elat
ive
to M
axim
um
FEA Results, D/B = 1.7
FEA Results, D/B = 1.2
FEA Results, D/B = 0.3
b = 1, Ellipse
b = 0.8
b = 0.6
b = 0.4
b = 0.2
b = 0, Bulletin 5-5 Parabola
0
0.1
0.2
0.3
0.4
0.5
0.6
0.7
0.8
0.9
1n = -1.25 (N/A)
n = -1.0 (maximum sharpness), hyperbolic tangent
-0.75
-0.5
-0.25
n = 0, sand per original Bulletin 5-5, exponential
function
0.25
0.5
0.75
n = 1.0, clay per orig. Bul. 5-5 (min. sharpness),
hyperbola
n = 1.25 (N/A)
SAGE FEA, work hardening GOM clay, with vertical
load and preload
SAGE FEA, work hardening GOM clay, with vertical
load but no preload
SAGE FEA, work hardening GOM clay, with no
preload or vertical load
n =
Finite Element Penetration Analysis
ML 116 C, initially embedded at 55 ft
preloaded to 62 ft, debalasted and reloaded
-80
-70
-60
-50
-40
-30
-20
-10
0
0 5000 10000 15000 20000 25000
Vertical Load, kips
Pe
ne
tra
tio
n,
Ft
PenetrationCurve, Example,GOM Clay
F. E. Analysis
vertical
horizontal
V - H
interaction
stiffness
reduction
-1.5
-1
-0.5
0
0.5
1
1.5
-3 -2 -1 0 1 2 3
Mo
me
nt
/ M
ax M
om
en
t
Rotation / Refence Rotation
Cyclic FEA Analysis Results
Complete Cyclic Reversal:Low Stiffness, High Damping
Partial Cyclic Reversal: HighStiffness, Low Damping
rotational hysteresis
NEW
STANDARD
ISO 19905
19
Adriatic III ( ) on Hurricane Rita
path ( ). Map, courtesy of
Transocean and Ken Schaudt
Adriatic III Adriatic VII
86889092949698
GSF Rigs
Hurricane Rita track
Adriatic III during Hurricane Rita
(map courtesy of Transocean and Ken Schaudt)
+
LeTourneau 116-C rig,
Adriatic class
Photo, courtesy of Transocean
Deck accelerations were recorded on independent
leg jack-up rig, Adriatic III, during it’s exposure to
severe storm conditions in Hurricane Rita
20
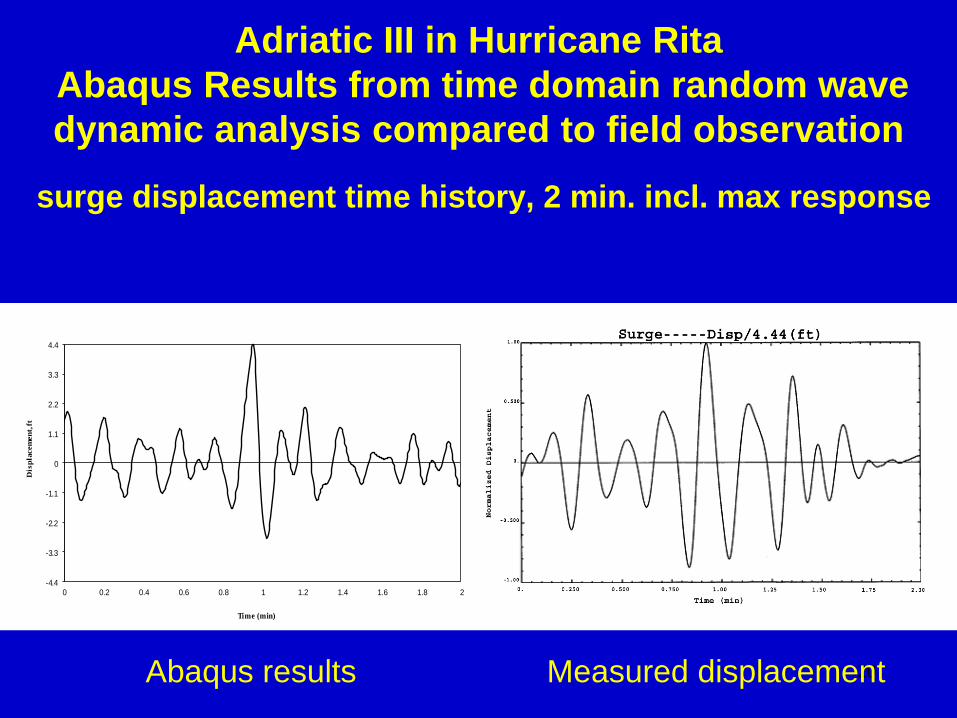
Adriatic III in Hurricane Rita
Abaqus Results from time domain random wave
dynamic analysis compared to field observation
surge displacement time history, 2 min. incl. max response
-4.4
-3.3
-2.2
-1.1
0
1.1
2.2
3.3
4.4
0 0.2 0.4 0.6 0.8 1 1.2 1.4 1.6 1.8 2
Dis
pla
cem
en
t, f
t
Time (min)
Surge displacement
Abaqus results Measured displacement

Time Domain Earthquake Analysis of Mat
Supported Jack-Up Structure on Soft Clay
Maleo Producer, a Bethlehem 250
Mat supported jack-up,offshore,
Indonesia, photo courtesy of
Stewart Technology and Global
Process Systems
“Soil Island” model for 3-D time domain
nonlinear analysis of unified site soil
response, soil-structure interaction and
structural dynamic response

3-D Response to two times DLE 1 motions, Maleo Producer, Final Soils
Contours of plastic strain on deformed mesh with 40x magnification
Burgundy = 0.5% strain or greater; Navy Blue = .01% or less
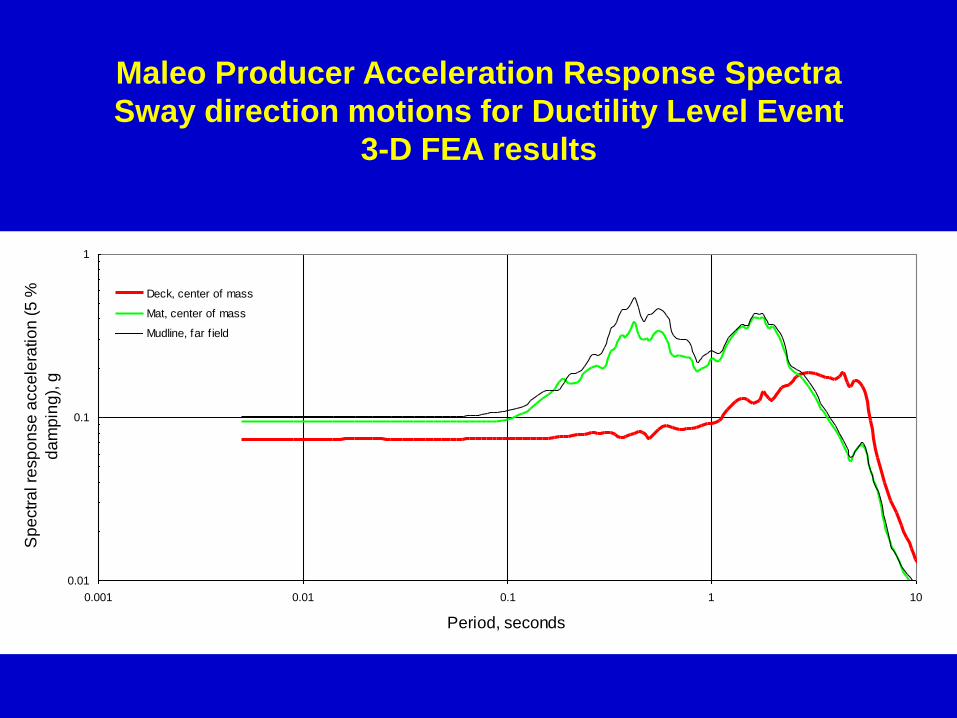
Maleo Producer Acceleration Response Spectra
Sway direction motions for DLE2 (based on El Centro)
3-D FEA results
0.01
0.1
1
0.001 0.01 0.1 1 10
Period, seconds
Sp
ectr
al re
sp
on
se
acce
lera
tio
n (
5 %
da
mp
ing
), g
Deck, center of mass
Mat, center of mass
Mudline, far f ield
Maleo Producer Acceleration Response Spectra
Sway direction motions for Ductility Level Event
3-D FEA results

24
CONCLUSION
After over 30 years, Abaqus is still the leading program for
high-end finite element geotechnical work
Top 10 reasons:
1. General quality.
2. History of successful use.
3. Extensive material behavior library.
4. Selection of element types and features..
5. Worldwide leadership in nonlinear FE analysis.
6. Rigorous large strain capabilities.
7. Unlimited 3-D feature applicability.
8. No program-imposed problem size limitations.
9. Level of program documentation, verification and
technical support.
25
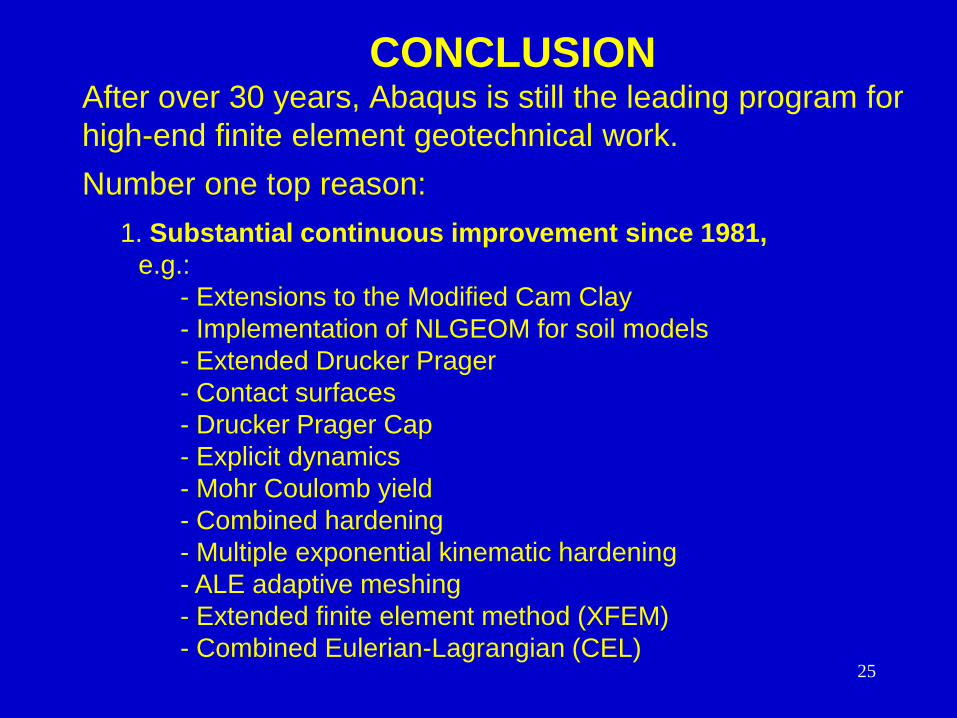
CONCLUSIONAfter over 30 years, Abaqus is still the leading program for
high-end finite element geotechnical work.
Number one top reason:
1. Substantial continuous improvement since 1981,
e.g.:
- Extensions to the Modified Cam Clay
- Implementation of NLGEOM for soil models
- Extended Drucker Prager
- Contact surfaces
- Drucker Prager Cap
- Explicit dynamics
- Mohr Coulomb yield
- Combined hardening
- Multiple exponential kinematic hardening
- ALE adaptive meshing
- Extended finite element method (XFEM)
- Combined Eulerian-Lagrangian (CEL)

26
FURTHER IMPROVEMENTS
NEEDED
• First order (Nagtegaal) elements in Explicit (and CEL)
• Pore pressure-enabled elements in Explicit (and CEL)
• Creep in combination with the parabolic yield surface in Drucker Prager
• Creep in combination with K values other than 1.0 in Drucker Prager
• Creep in combination with the extended finite element method (XFEM)
• Sub-yield kinematic hardening, in Drucker Prager and clay plasticity ls
• Update of Pi plane shape function in Drucker Prager and Clay Plasticity
• Update of the formulations in the Spud Can option of Elastic-Plastic
Joint elements to conform with the new ISO 19905-1.
With developments like these, Abaqus seems likely
to maintain its leadership position in geotechnical
FEA well into the future.

The American Petroleum Institute, The International
Association of Drilling Contractors, ExxonMobil, BP Americas,
Freeport McMoRan, The French Institute for Marine Research,
Global Process Systems, Lewis Engineering, Matthews-
Daniel, Stewart Technology, Transocean and SAGE USA
Former colleagues at Exxon Production Research and
McClelland Engineers
Present and former SAGE colleagues, M. K. Hossain, PhD.,
P.E., F. B. Biegler, Z. M. Oden Duffy, PhD., E. L. Templeton-
Barrett, PhD., M. J. Barrett, A. A. Rahim, PhD., P.E. and X.
Long, PhD., P.E. (on loan from GEMS)
Principals and staff of HK&S and Dassault Systèmes,
particularly H. D. Hibbitt, E. P. Sorensen, J. C. Nagtegaal, and
D. Datye
ACKNOWLEDGEMENTS


30


Abaqus Effective Stress Analysis of long term uplift capacity for suction piles/caissons
Soil modeled as
elastic-plastic
porous material with
Modified Cam Clay
constitutive theory.
Pile / Caisson modeled
as elastic material
with Young’s modulus
and Poisson’s ratio
representative of steel.