Finished Theory on Simple Linear Regression Pathologies and Traps in Linear Regression and...
58
Finished Theory on Simple Linear Finished Theory on Simple Linear Regression Regression Pathologies and Traps Pathologies and Traps in Linear Regression and Correlation in Linear Regression and Correlation Relationships between Relationships between Categorical Variables Categorical Variables Last Time: Last Time:
-
Upload
melvin-ellis -
Category
Documents
-
view
225 -
download
1
Transcript of Finished Theory on Simple Linear Regression Pathologies and Traps in Linear Regression and...
Finished Theory on Simple Linear Finished Theory on Simple Linear RegressionRegression
Pathologies and TrapsPathologies and Trapsin Linear Regression and Correlationin Linear Regression and Correlation
Relationships between Relationships between Categorical VariablesCategorical Variables
Last Time:Last Time:
22
22
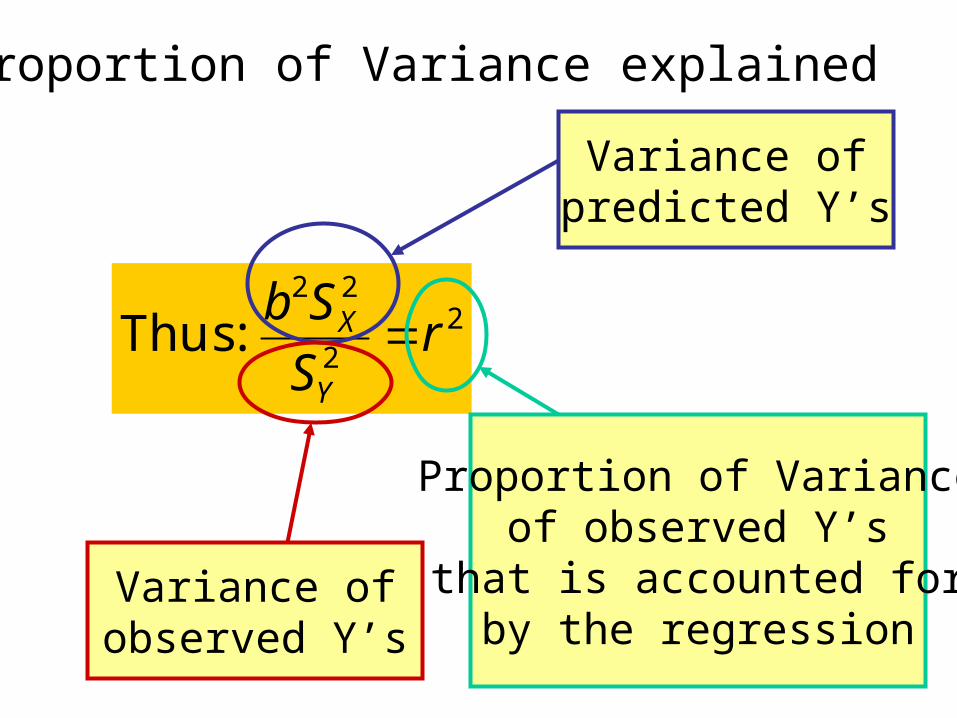
:Thus rS
Sb
Y
X
Variance ofpredicted Y’s
Variance ofobserved Y’s
Proportion of Varianceof observed Y’s
that is accounted forby the regression
Proportion of Variance explained
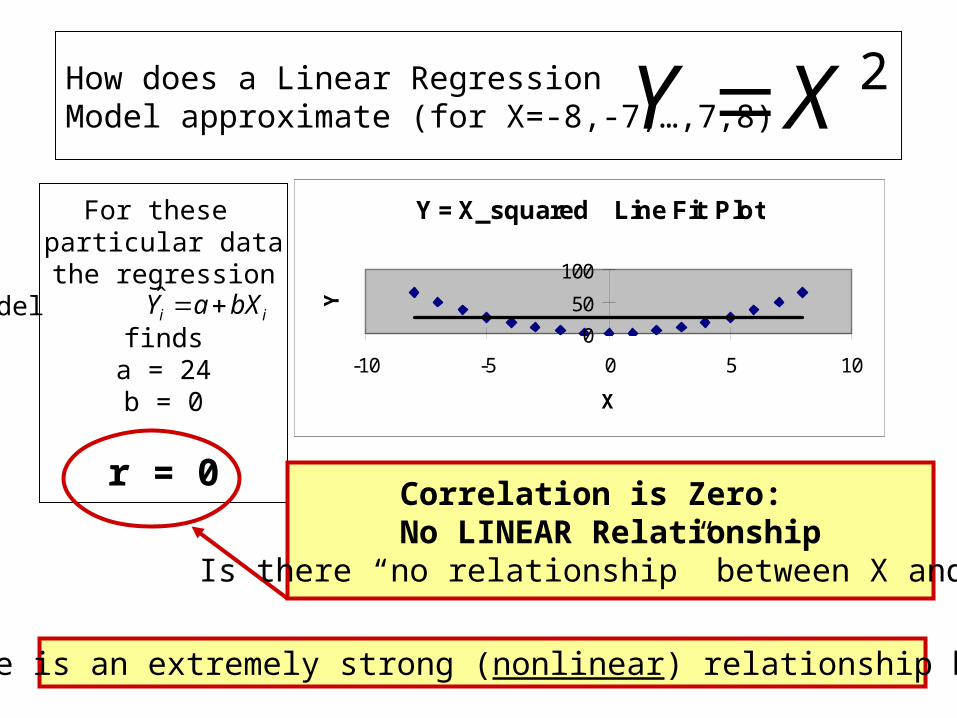
2XY How does a Linear RegressionModel approximate (for X=-8,-7,…,7,8)
For these particular datathe regression
model finds
a = 24b = 0
r = 0
Y = X_squared Line Fit Plot
0
50
100
-10 -5 0 5 10
X
Y
Correlation is Zero: No LINEAR Relationship
Is there “no relationship” between X and Y?
There is an extremely strong (nonlinear) relationship here!
ii bXaY ˆ
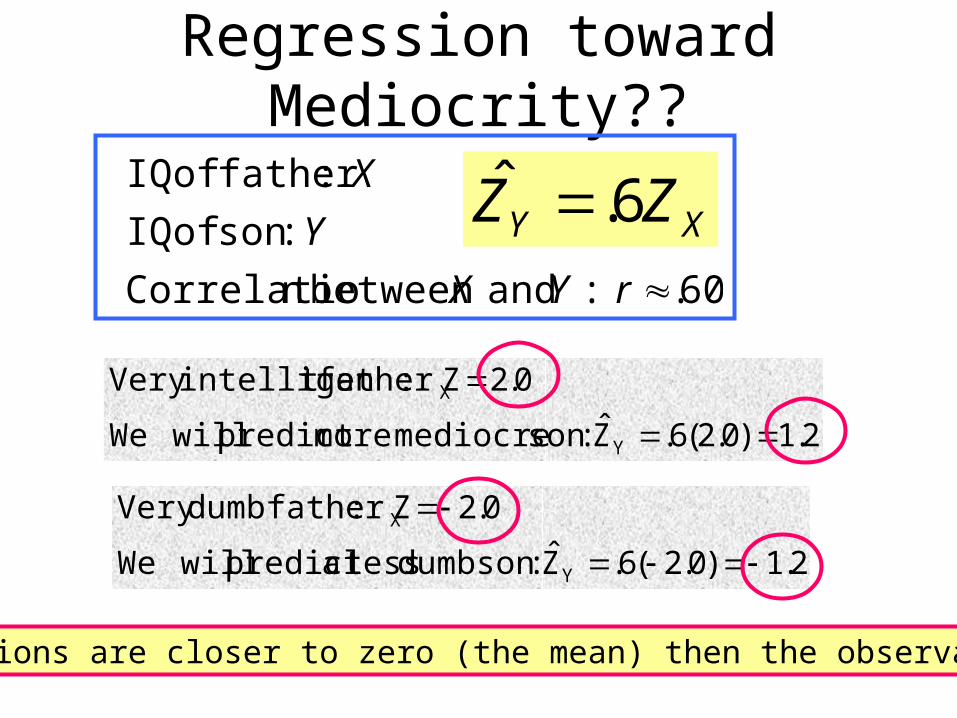
Regression toward Mediocrity??
60. : and between n Correlatio
:son of IQ
:father of IQ
rYX
Y
XXY ZZ 6.ˆ
2.1)0.2(6.Z :son mediocre morepredict willWe
0.2 Z:fathert intelligenVery
Y
X
2.1)0.2(6.Z :son dumb less apredict willWe
0.2 Z:father dumbVery
Y
X
Predictions are closer to zero (the mean) then the observations!!
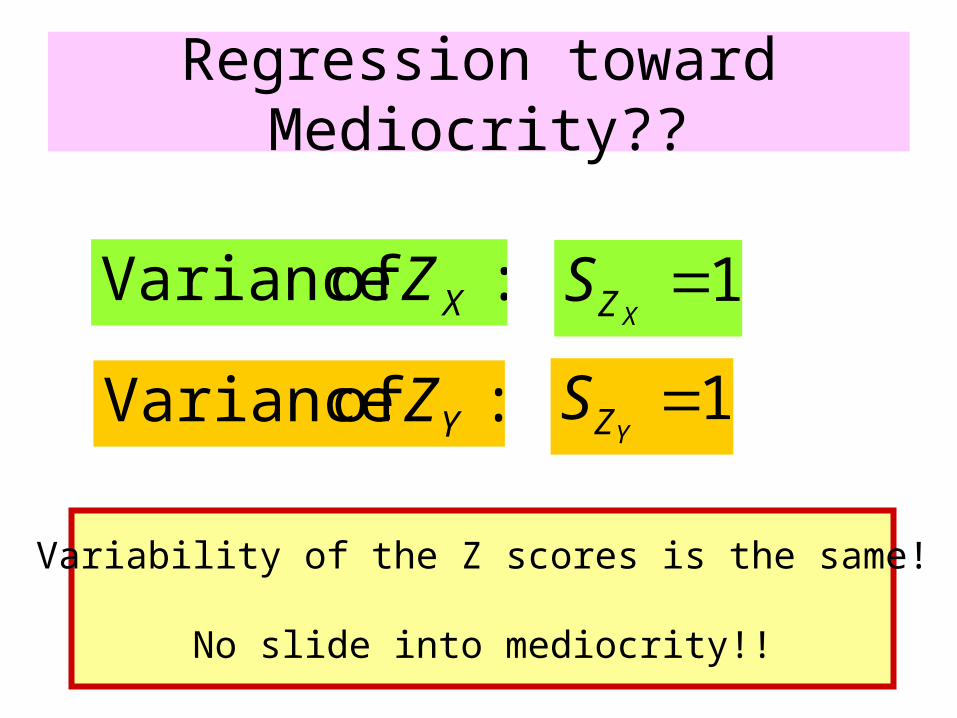
Regression toward Mediocrity??
: of Variance XZ
: of Variance YZ
1XZ
S
1YZ
S
Variability of the Z scores is the same!
No slide into mediocrity!!
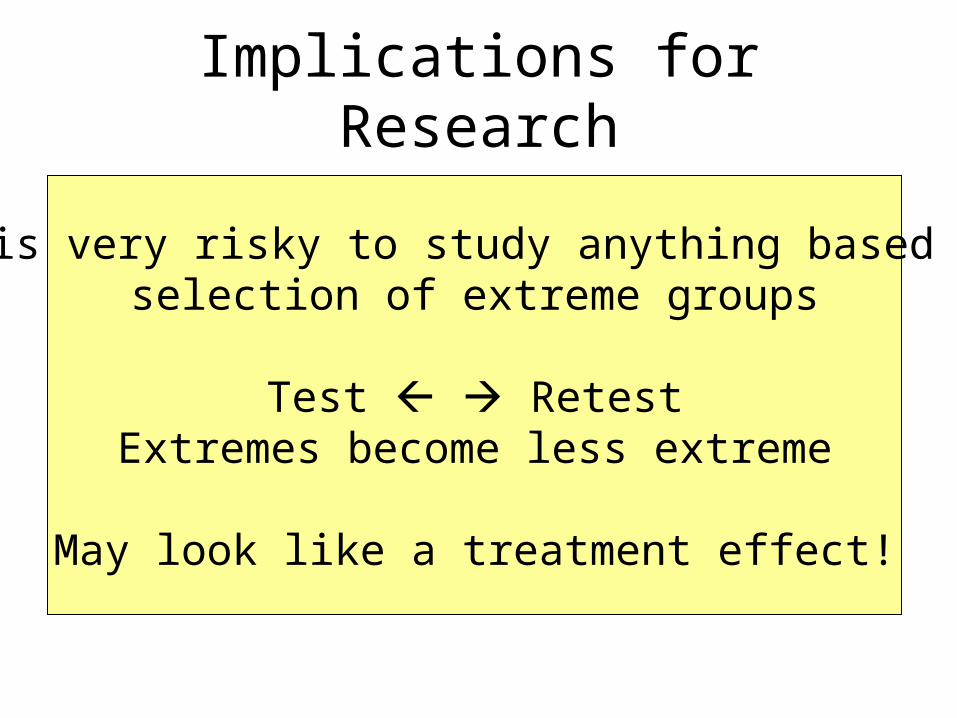
Implications for Research
It is very risky to study anything based on selection of extreme groups
Test RetestExtremes become less extreme
May look like a treatment effect!
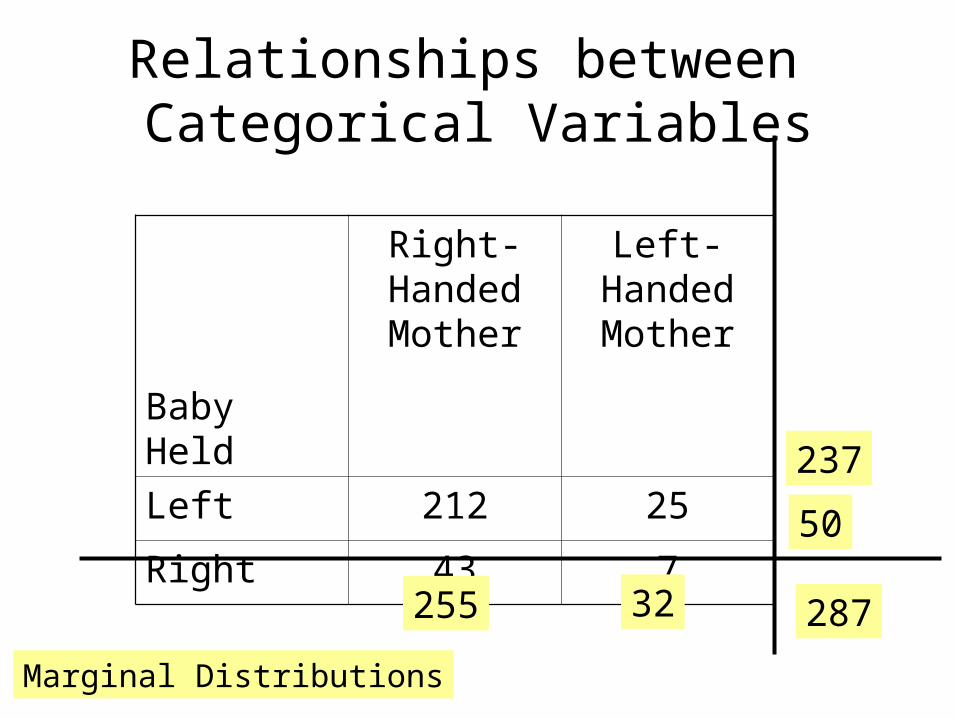
Relationships between Categorical Variables
Baby Held
Right-Handed Mother
Left-Handed Mother
Left 212 25
Right 43 7
237
50
255 32 287
Marginal Distributions
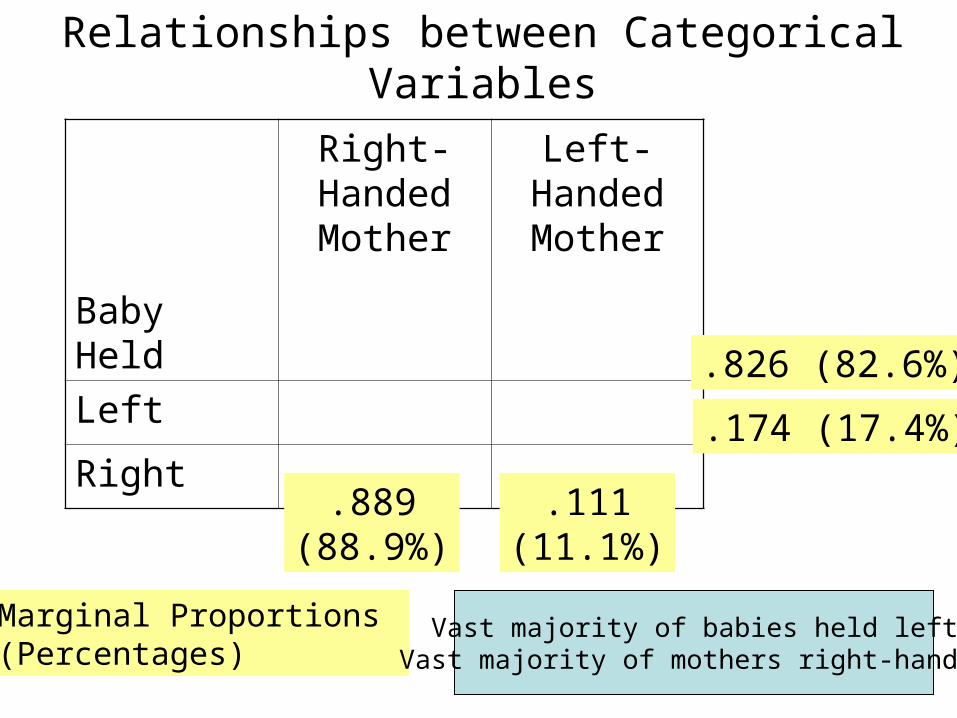
Relationships between Categorical Variables
Baby Held
Right-Handed Mother
Left-Handed Mother
Left
Right
.826 (82.6%)
.174 (17.4%)
.889(88.9%)
.111(11.1%)
Marginal Proportions (Percentages)
Vast majority of babies held leftVast majority of mothers right-handed
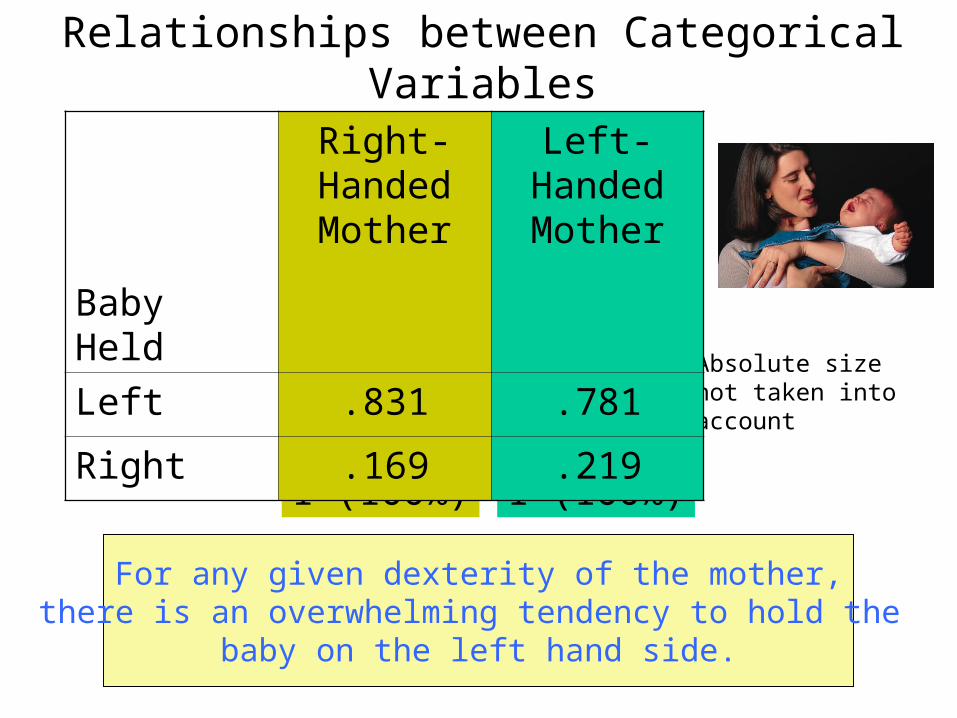
Relationships between Categorical Variables
1 (100%) 1 (100%)
For any given dexterity of the mother,there is an overwhelming tendency to hold the
baby on the left hand side.
Absolute size not taken into account
Baby Held
Right-Handed Mother
Left-Handed Mother
Left .831 .781
Right .169 .219
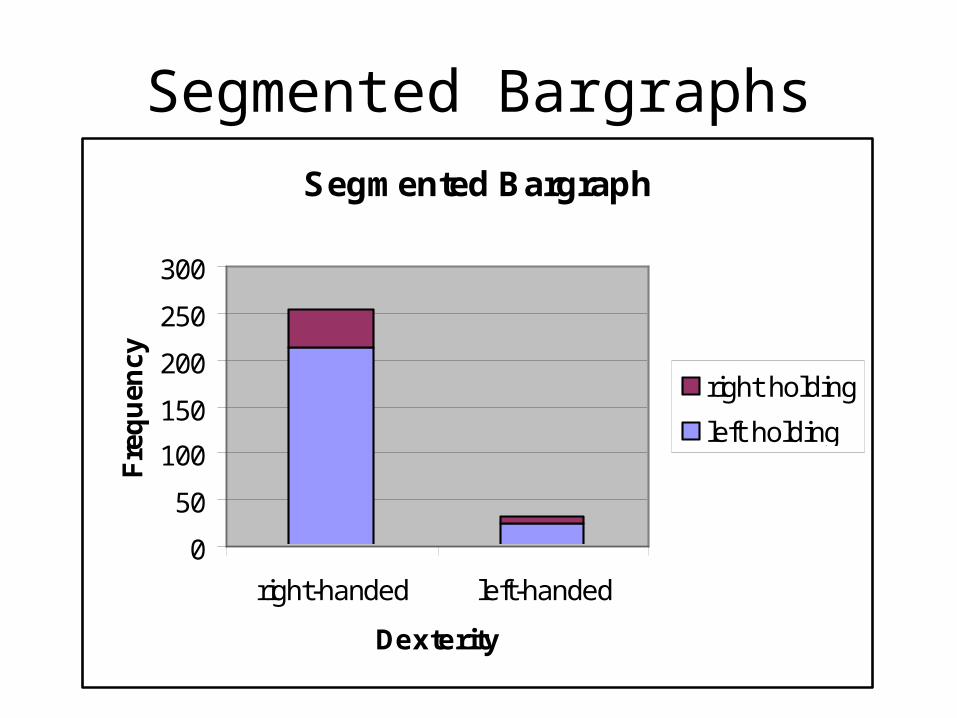
Segmented BargraphsSegmented Bargraph
0
50
100
150
200
250
300
right-handed left-handed
Dexterity
Fre
qu
ency
right holding
left holding
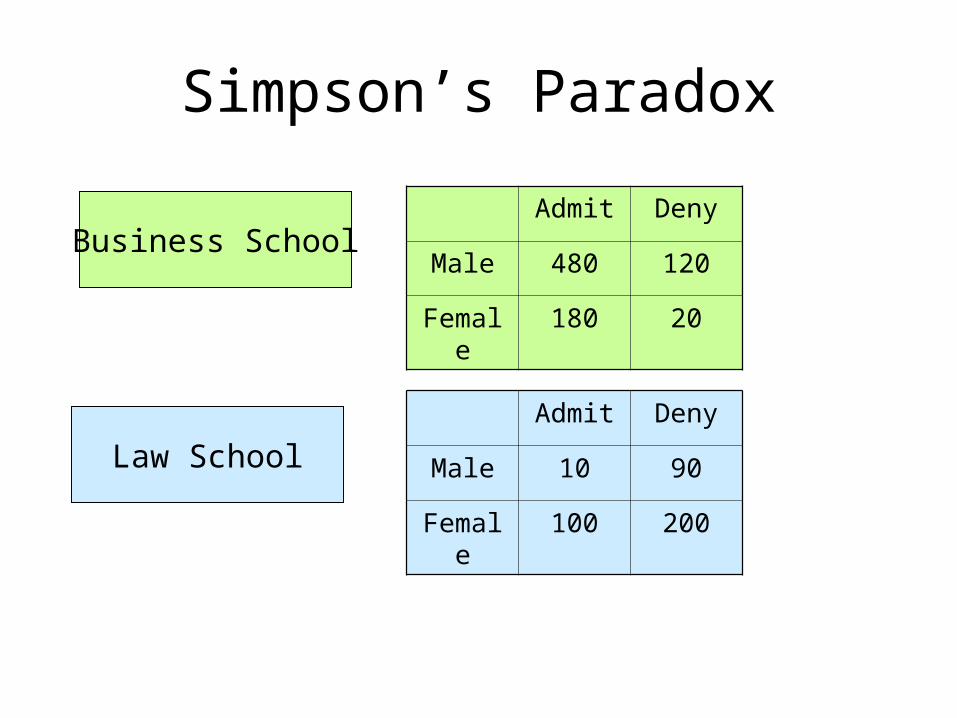
Simpson’s Paradox
Admit Deny
Male 480 120
Female 180 20
Admit Deny
Male 10 90
Female 100 200
Business School
Law School
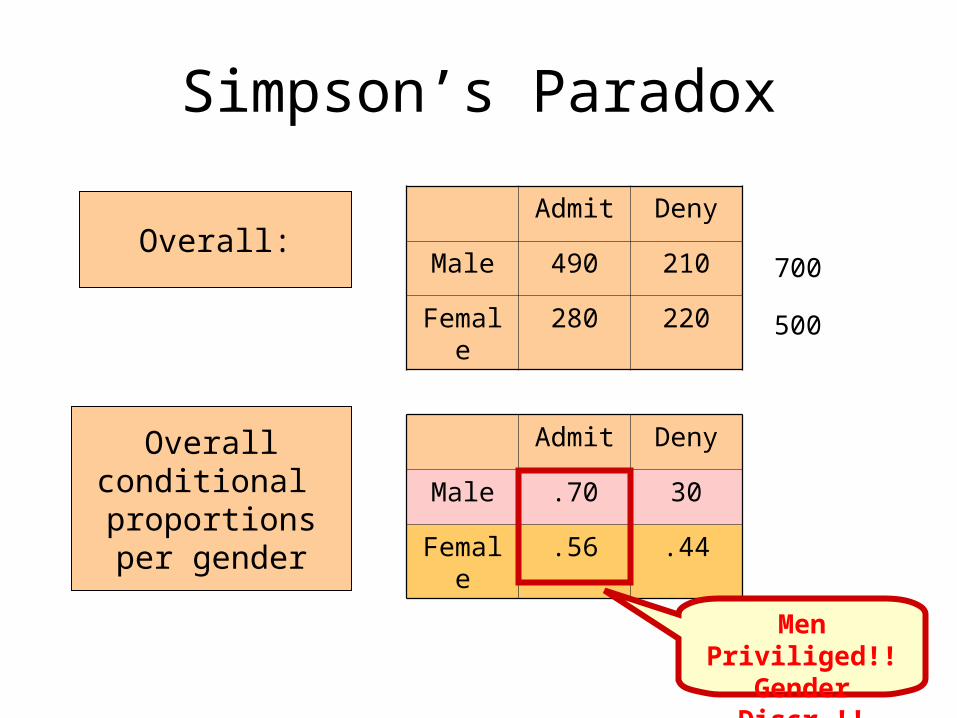
Simpson’s Paradox
Admit Deny
Male 490 210
Female 280 220
Admit Deny
Male .70 30
Female .56 .44
Overall:
Overallconditional proportionsper gender
700
500
Men Priviliged!!Gender Discr.!!
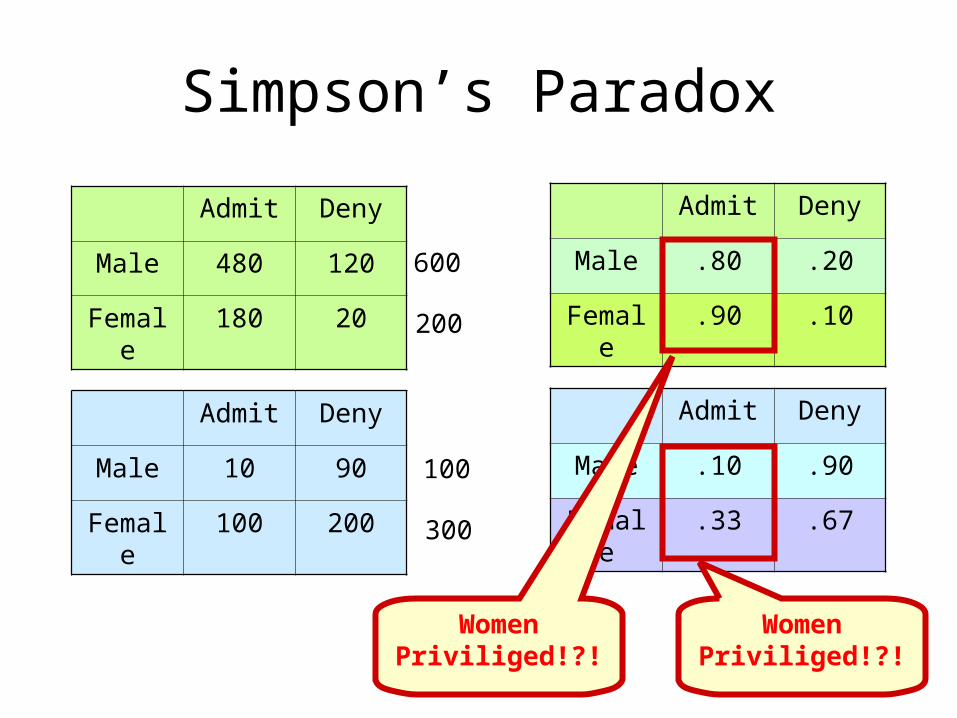
Simpson’s Paradox
Admit Deny
Male 480 120
Female 180 20
Admit Deny
Male 10 90
Female 100 200
Admit Deny
Male .80 .20
Female .90 .10
Admit Deny
Male .10 .90
Female .33 .67
600
200
100
300
WomenPriviliged!?!
WomenPriviliged!?!
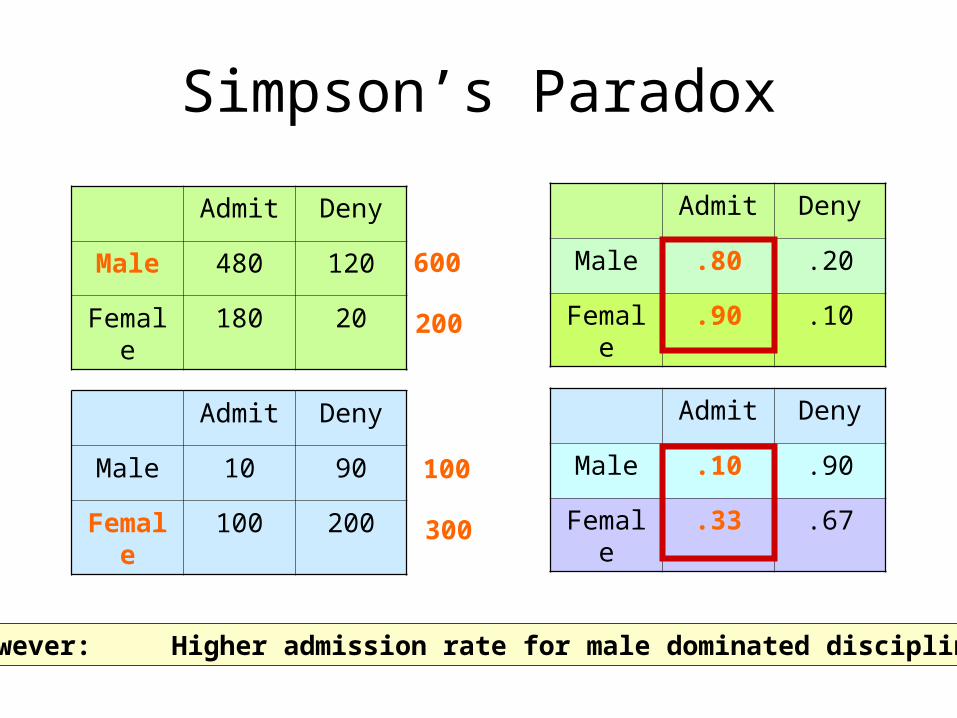
Simpson’s Paradox
Admit Deny
Male 480 120
Female 180 20
Admit Deny
Male 10 90
Female 100 200
Admit Deny
Male .80 .20
Female .90 .10
Admit Deny
Male .10 .90
Female .33 .67
600
200
100
300
However: Higher admission rate for male dominated discipline
Chapter 3Chapter 3
Producing DataProducing Data
Today:Today:
Where do data come from?
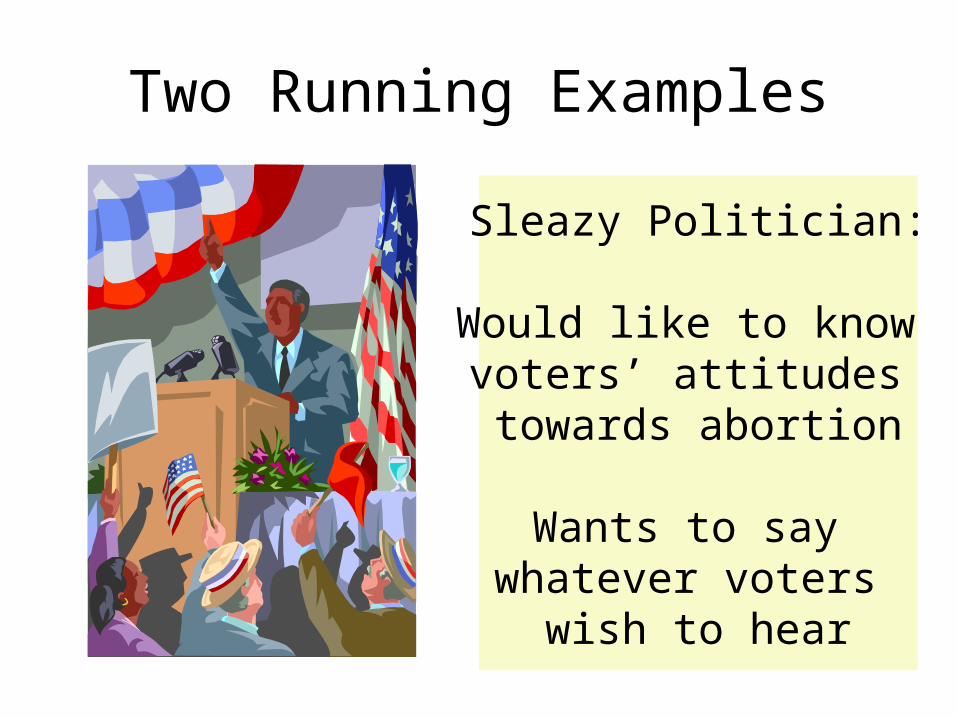
Two Running Examples
Sleazy Politician:
Would like to know voters’ attitudes towards abortion
Wants to say whatever voters
wish to hear
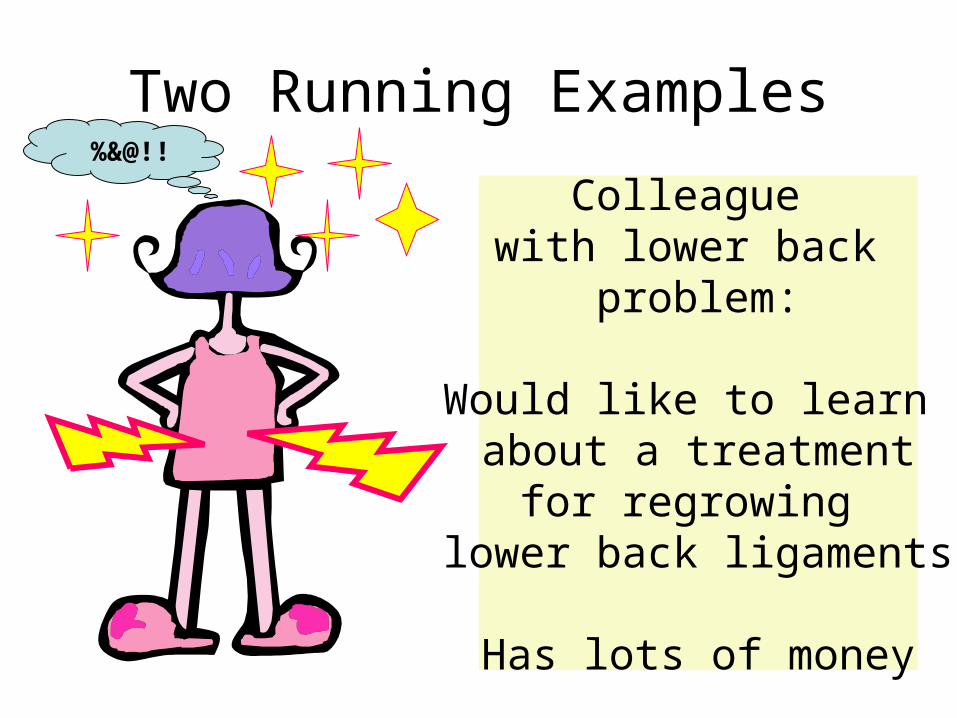
Two Running Examples
Colleague with lower back
problem:
Would like to learn about a treatment
for regrowing lower back ligaments
Has lots of money
%&@!!
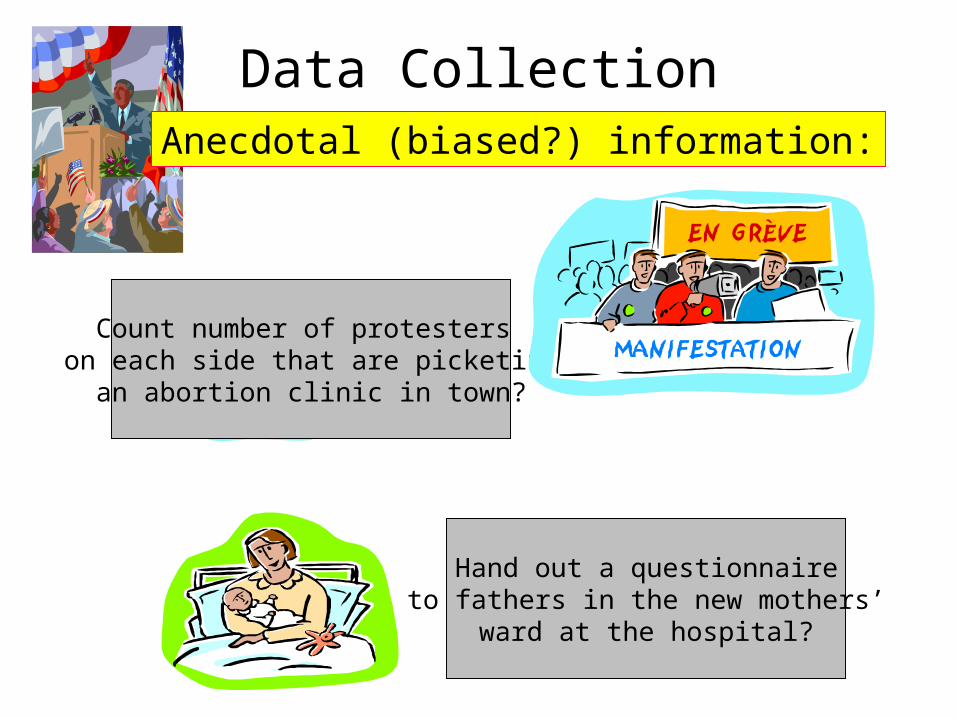
Data Collection
Count number of protesters on each side that are picketing
an abortion clinic in town?
Hand out a questionnaireto fathers in the new mothers’
ward at the hospital?
Anecdotal (biased?) information:
Data CollectionAnecdotal (biased?) information:
Call a person who was in bed for 2 yearsbecause of back problems, had the treatment,and is now better? Ask this person whether
the treatment helped?
Heard about this person in the news.
Ask the person for names of other peoplewho recovered dramatically?
Data Collection
Problems with Anecdotal Information:
• Possibly biased (not representative of the overall trend)
• Tends to be dramatized and even inaccurate
• May be confounded with other variables
Problems with Anecdotal Information:(e.g. from Mass Media)
• Possibly biased (not representative of the overall trend)
• Tends to be dramatized and even inaccurate
• May be confounded with other variables
Example from my personal life:
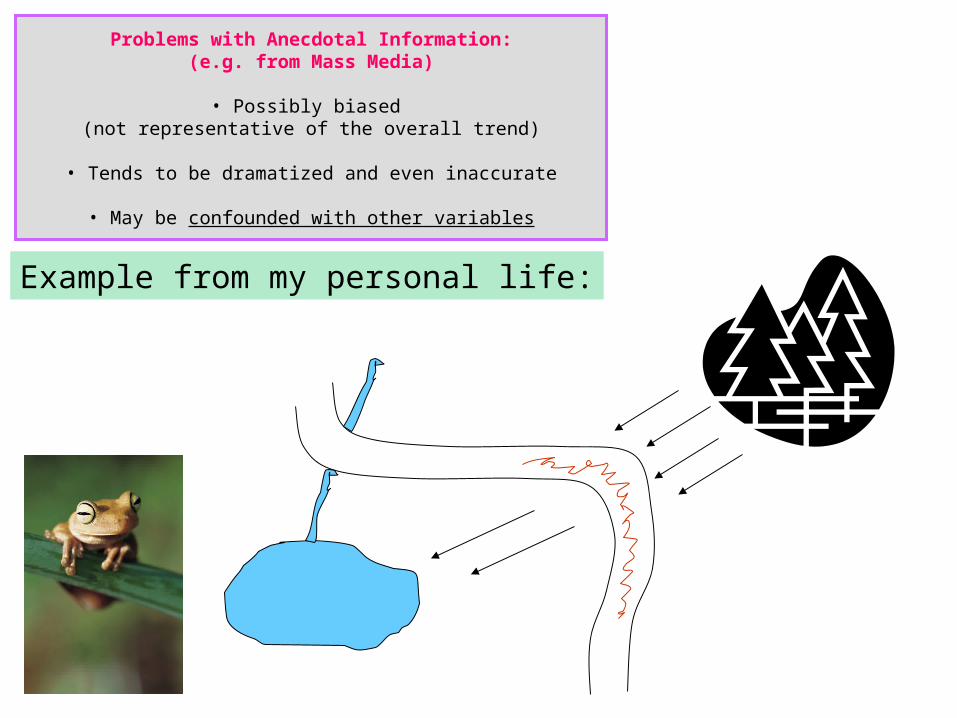
Problems with Anecdotal Information:(e.g. from Mass Media)
• Possibly biased (not representative of the overall trend)
• Tends to be dramatized and even inaccurate
• May be confounded with other variables
Example from my personal life:
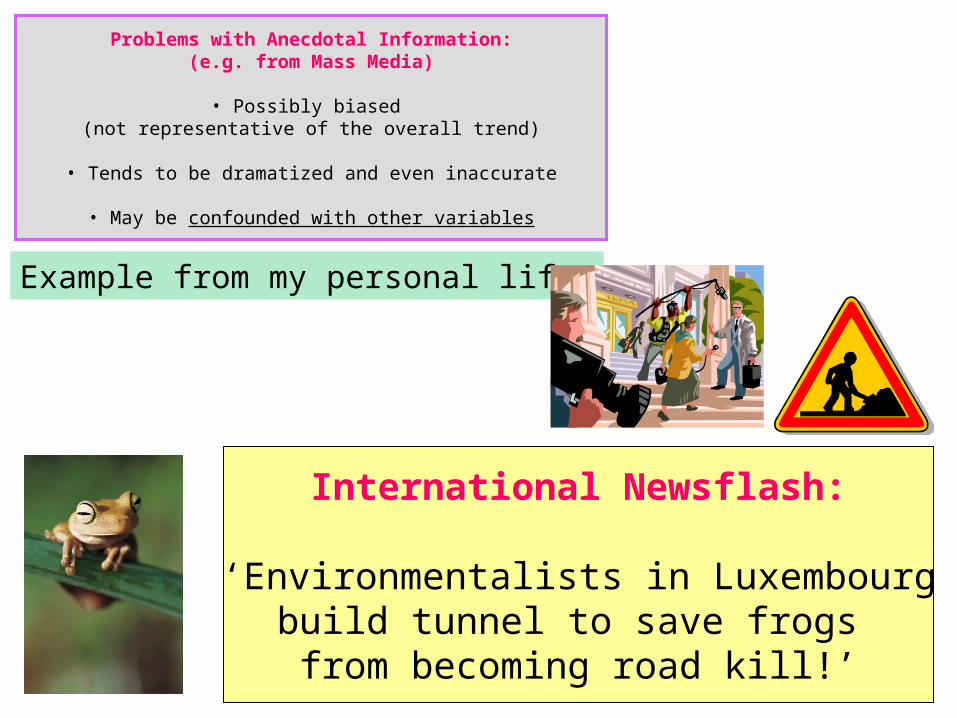
International Newsflash:
‘Environmentalists in Luxembourgbuild tunnel to save frogs from becoming road kill!’
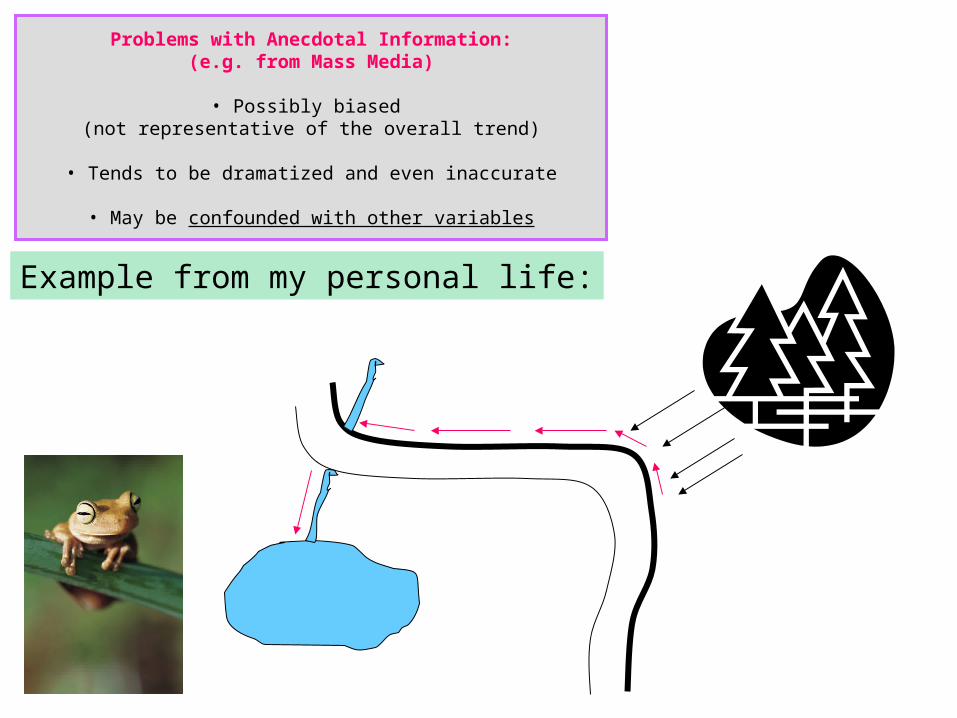
Problems with Anecdotal Information:(e.g. from Mass Media)
• Possibly biased (not representative of the overall trend)
• Tends to be dramatized and even inaccurate
• May be confounded with other variables
Example from my personal life:
Problems with Anecdotal Information:(e.g. from Mass Media)
• Possibly biased (not representative of the overall trend)
• Tends to be dramatized and even inaccurate
• May be confounded with other variables
Note:
This story was anecdotal too!
It does not imply that the mass media are always inaccurate or biased
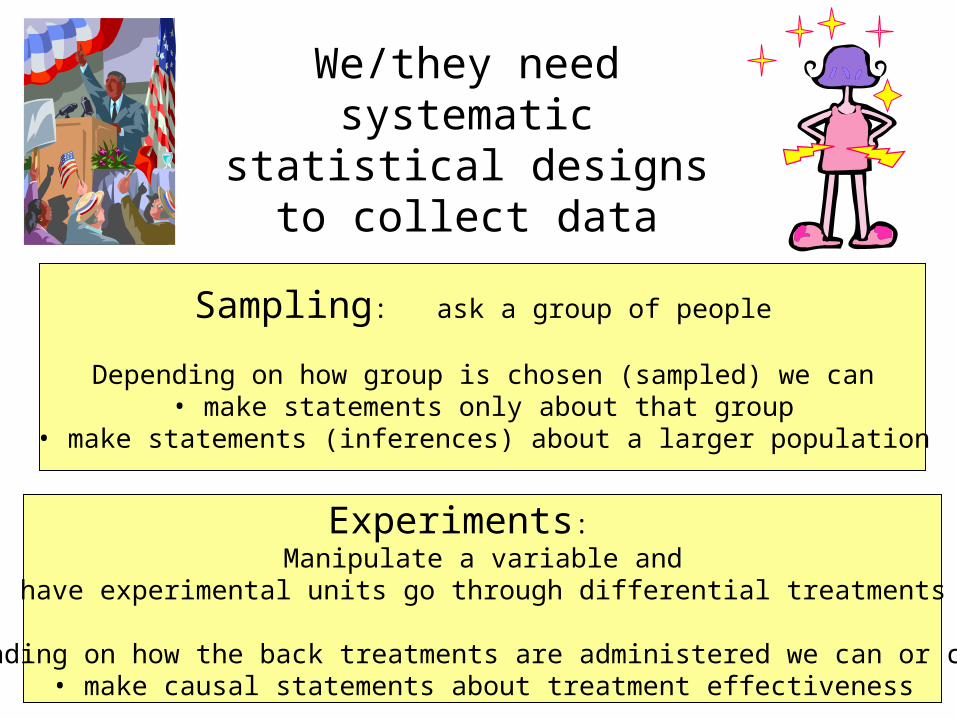
We/they needsystematic statistical designs
to collect data
Sampling: ask a group of people
Depending on how group is chosen (sampled) we can• make statements only about that group
• make statements (inferences) about a larger population
Experiments: Manipulate a variable and
have experimental units go through differential treatments
Depending on how the back treatments are administered we can or cannot• make causal statements about treatment effectiveness
We/they needsystematic statistical designs
to collect data
Goal: Draw Conclusions • about the population of potential/likely voters• about the effectiveness of the back treatment
i.e. make a statistical inference
from a carefully collected set of datato a larger population
andprovide a statement about
how confident we can be in the stated conclusions.
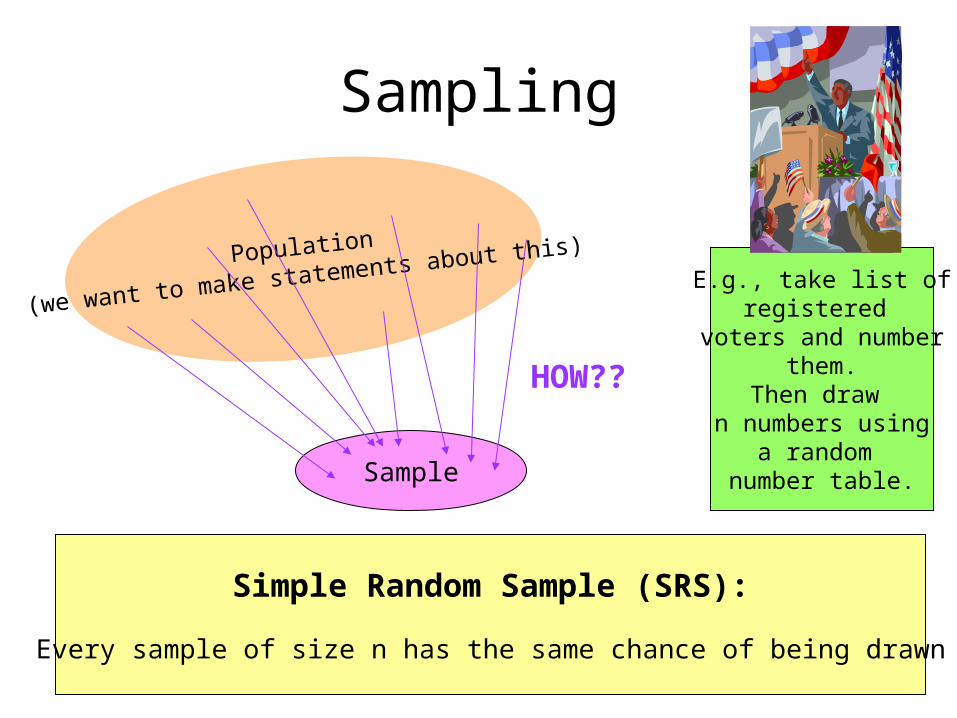
Sampling
Population
(we want to make statements about this)
Sample
HOW??
Simple Random Sample (SRS):
Every sample of size n has the same chance of being drawn
E.g., take list ofregistered
voters and numberthem.
Then draw n numbers using
a random number table.
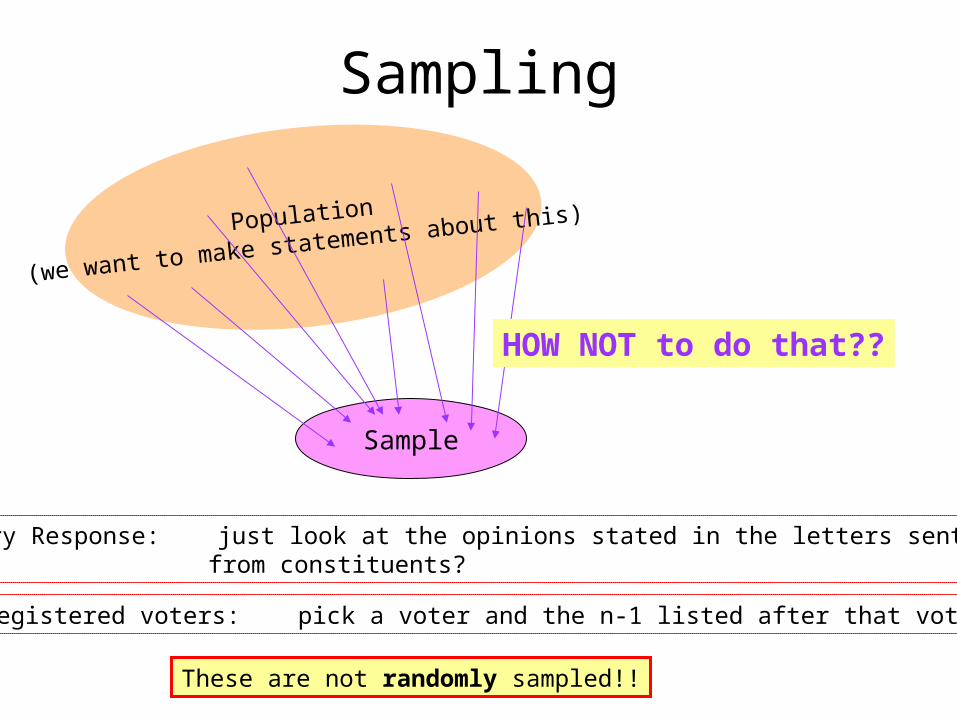
Sampling
Population
(we want to make statements about this)
Sample
HOW NOT to do that??
Voluntary Response: just look at the opinions stated in the letters sent from constituents?
List of registered voters: pick a voter and the n-1 listed after that voter?
These are not randomly sampled!!
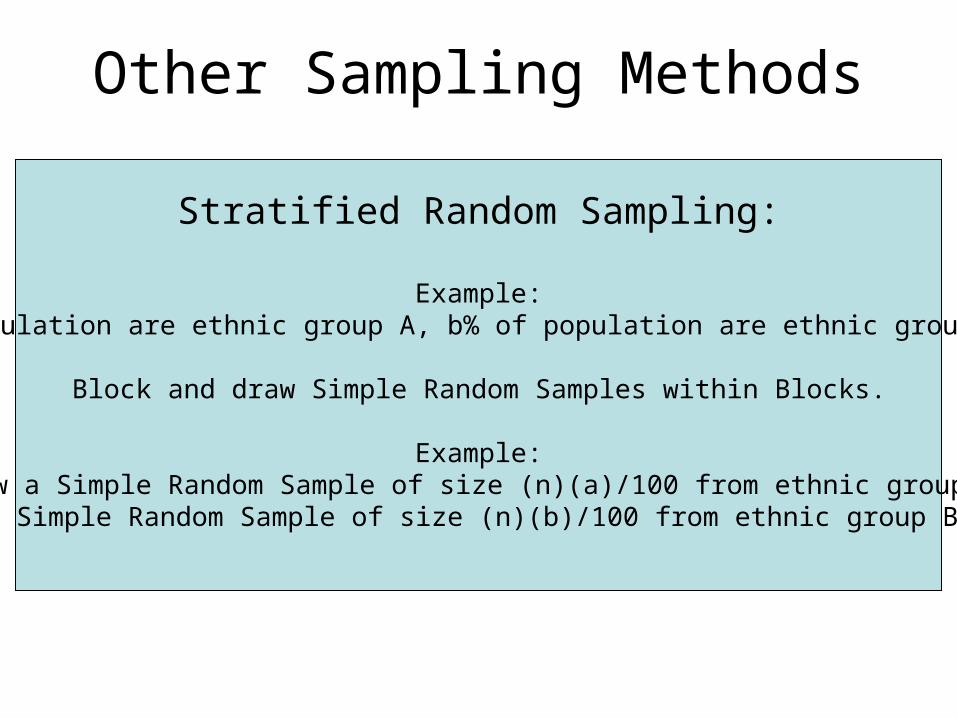
Other Sampling Methods
Stratified Random Sampling:
Example:a% of population are ethnic group A, b% of population are ethnic group B, etc.
Block and draw Simple Random Samples within Blocks.
Example:Draw a Simple Random Sample of size (n)(a)/100 from ethnic group A,
draw a Simple Random Sample of size (n)(b)/100 from ethnic group B, etc.
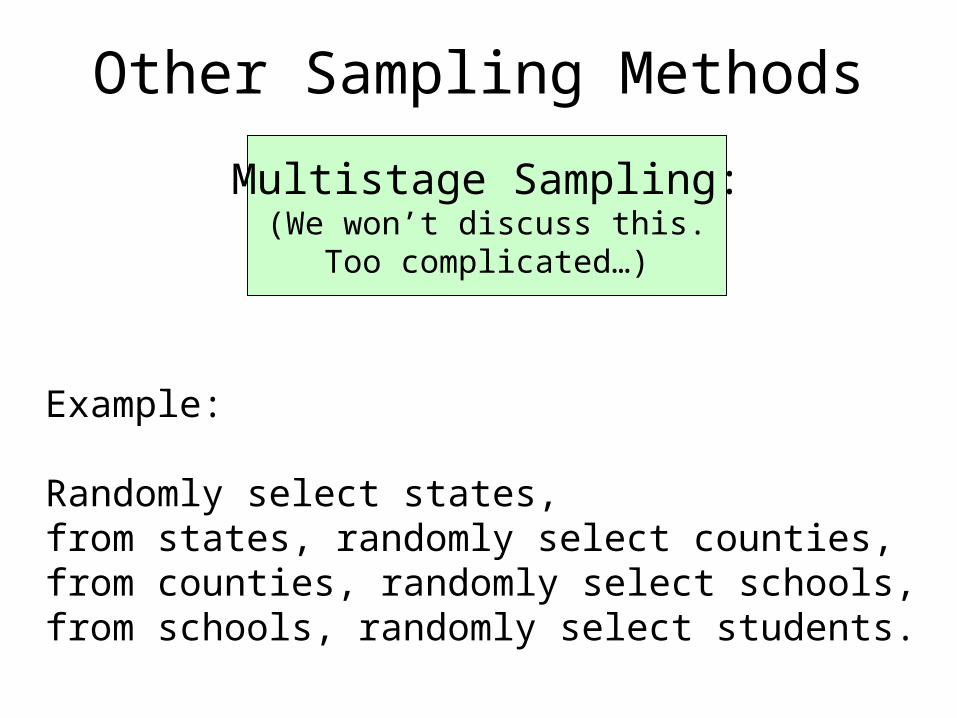
Other Sampling Methods
Multistage Sampling:(We won’t discuss this.
Too complicated…)
Example:
Randomly select states,from states, randomly select counties,from counties, randomly select schools,from schools, randomly select students.
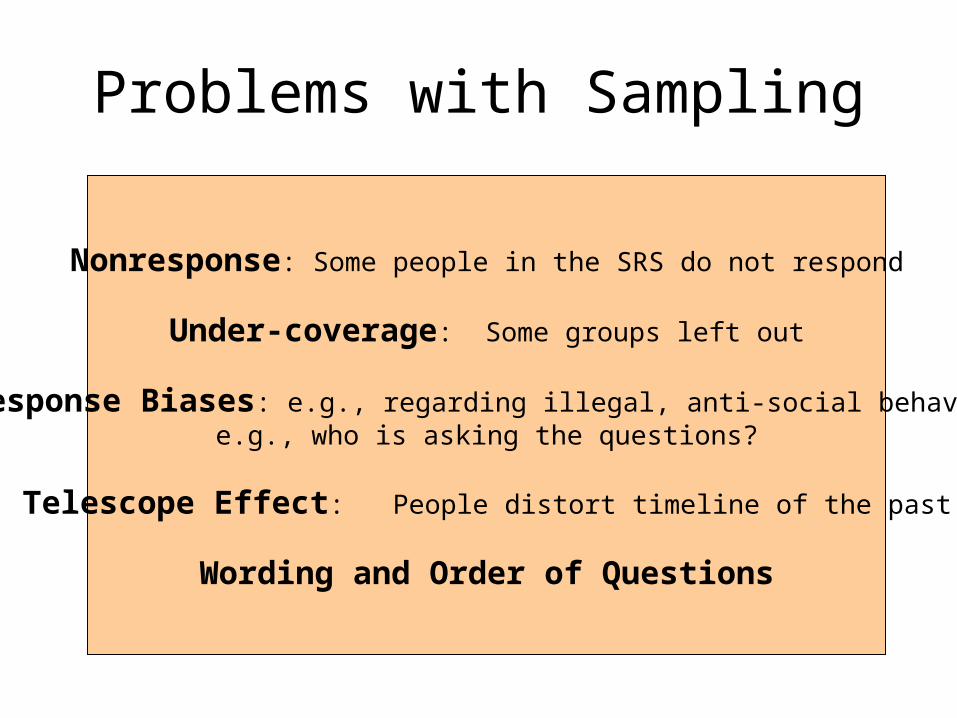
Problems with Sampling
Nonresponse: Some people in the SRS do not respond
Under-coverage: Some groups left out
Response Biases: e.g., regarding illegal, anti-social behaviore.g., who is asking the questions?
Telescope Effect: People distort timeline of the past
Wording and Order of Questions
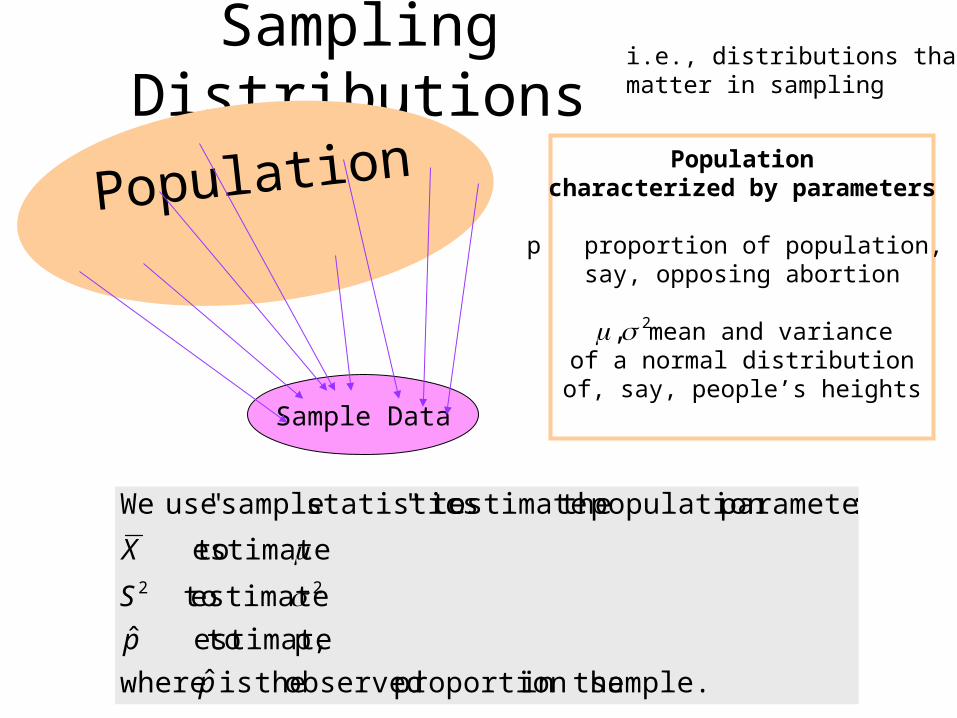
Sampling Distributions
Population
Sample Data
Populationcharacterized by parameters
p proportion of population, say, opposing abortion
mean and varianceof a normal distribution
of, say, people’s heights
2,
sample. in the proportion observed theis ˆ where
p, estimate toˆ
estimate to
estimate to
:parameters population theestimate to"statistics sample" use We
22
p
p
S
X
i.e., distributions thatmatter in sampling
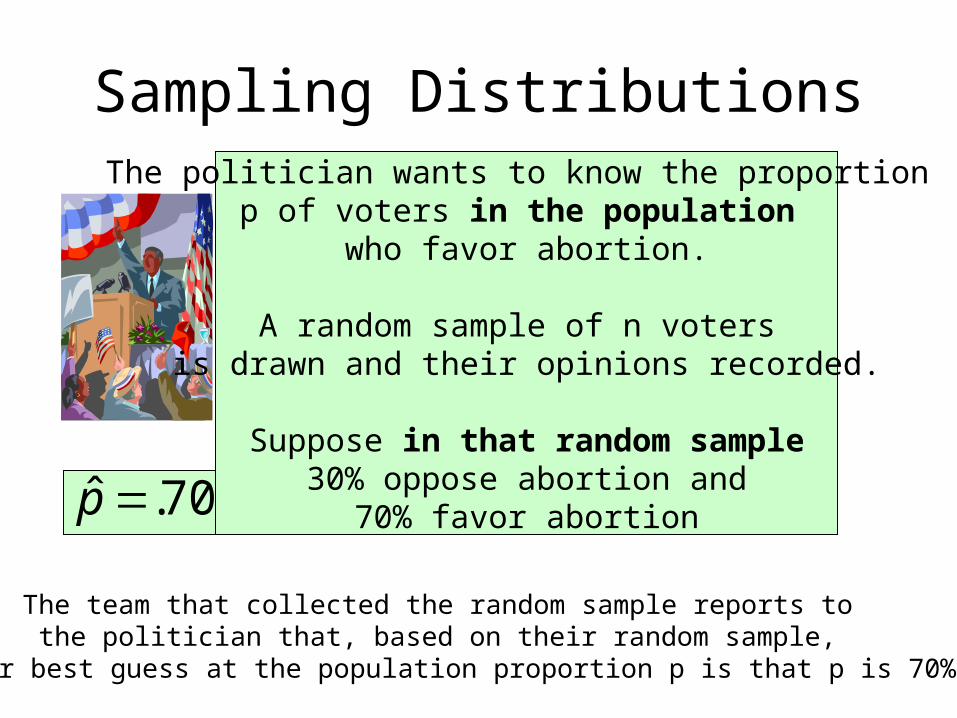
Sampling DistributionsThe politician wants to know the proportion
p of voters in the population who favor abortion.
A random sample of n voters is drawn and their opinions recorded.
Suppose in that random sample30% oppose abortion and
70% favor abortion70.ˆ p
The team that collected the random sample reports to the politician that, based on their random sample,
their best guess at the population proportion p is that p is 70%
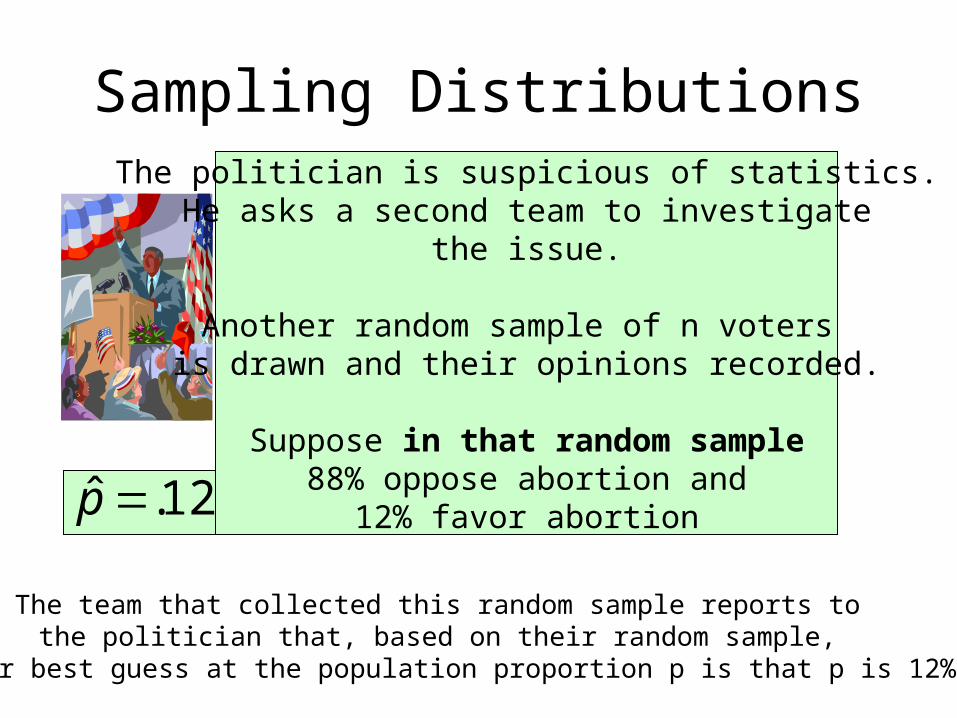
Sampling DistributionsThe politician is suspicious of statistics.He asks a second team to investigate
the issue.
Another random sample of n voters is drawn and their opinions recorded.
Suppose in that random sample88% oppose abortion and
12% favor abortion12.ˆ p
The team that collected this random sample reports to the politician that, based on their random sample,
their best guess at the population proportion p is that p is 12%
Sampling Distributions
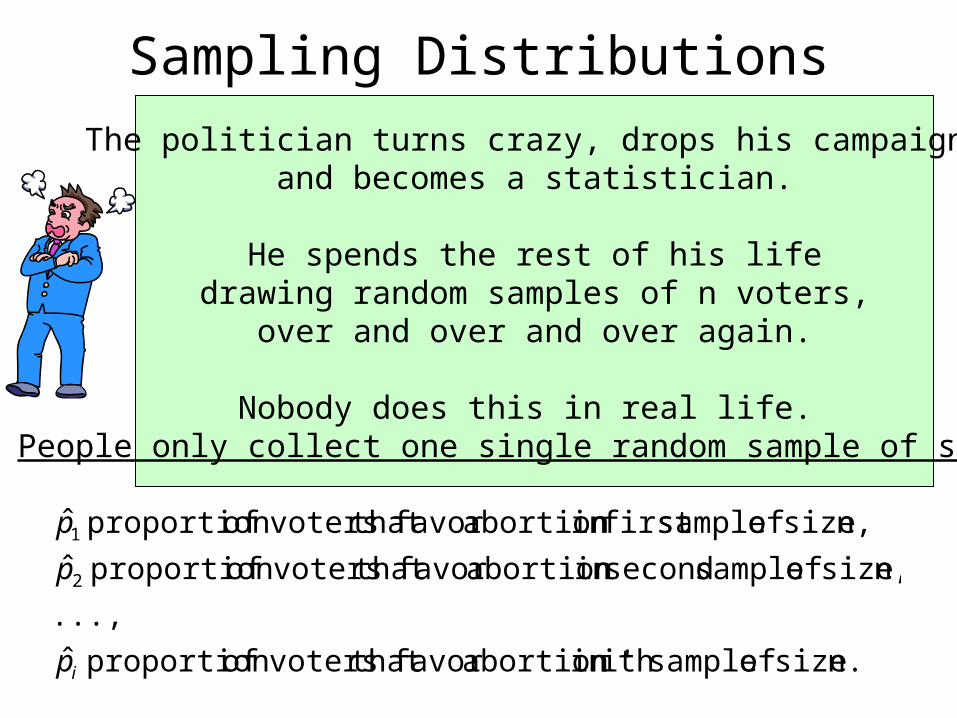
The politician turns crazy, drops his campaign and becomes a statistician.
He spends the rest of his lifedrawing random samples of n voters,
over and over and over again.
Nobody does this in real life. People only collect one single random sample of size n
n. size of sampleth i'in abortion favor that votersof proportion ˆ
...,
n, size of sample secondin abortion favor that votersof proportion ˆ
n, size of samplefirst in abortion favor that votersof proportion ˆ
2
1
ip
p
p
Crazy Politician Turned Statistician
• Realizes that, when his sample size n is “small”, then the sample proportions vary a lot over repeated random samples of size n.
• Because he was trying to save money, his 2 original random samples had only interviewed a few people each.
• When his sample size n is large, then the sample proportions are all very similar, so, he could just have used a single random sample of (large) size n.
• Decides to resume his campaign….
Sampling Distributions
0
5
10
15
20
25
0.1 0.3 0.5 0.7 0.9
Number of results
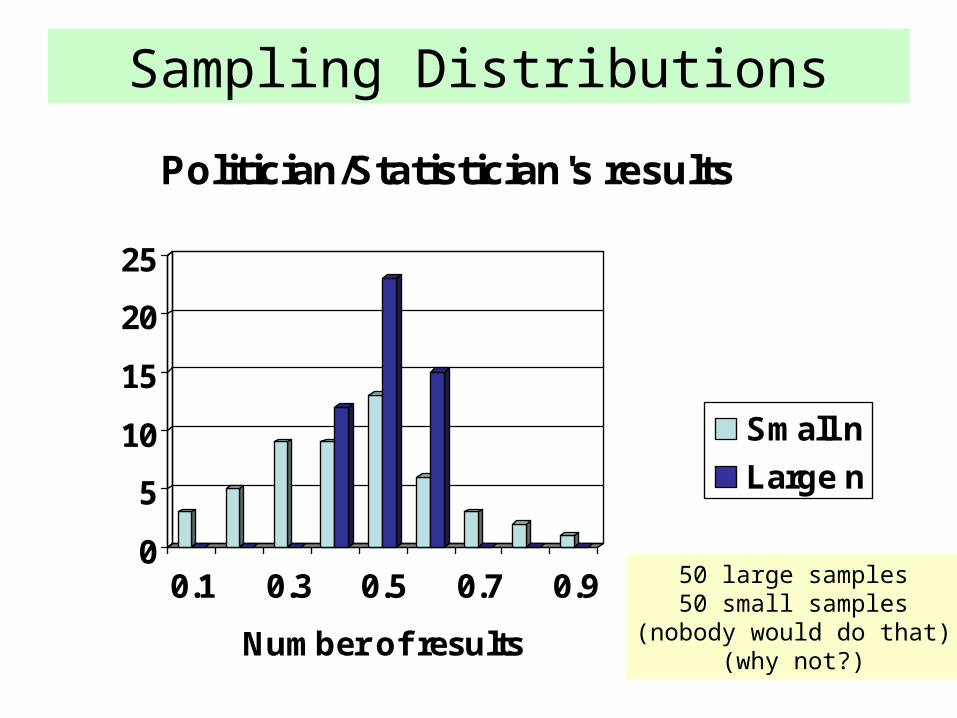
Politician/Statistician's results
Small n
Large n
50 large samples50 small samples
(nobody would do that)(why not?)
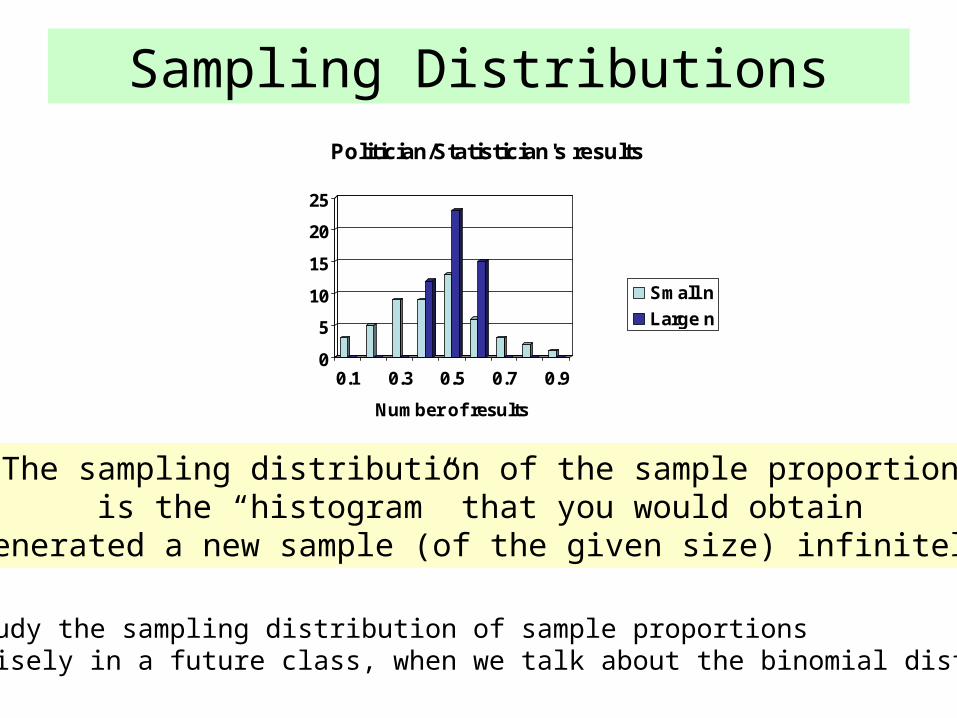
Sampling Distributions
We will study the sampling distribution of sample proportions more precisely in a future class, when we talk about the binomial distribution.
0
5
10
15
20
25
0.1 0.3 0.5 0.7 0.9
Number of results
Politician/Statistician's results
Small n
Large n
The sampling distribution of the sample proportion is the “histogram” that you would obtain
if you generated a new sample (of the given size) infinitely often.
Statistics
• A statistic is something that you calculate from a random sample.
• The value of the statistic varies from one random sample (of size n) to another random sample (also of size n).
• Over infinitely many samples (each of size n) the statistic has a distribution.
• Many statistics have a normal distribution.
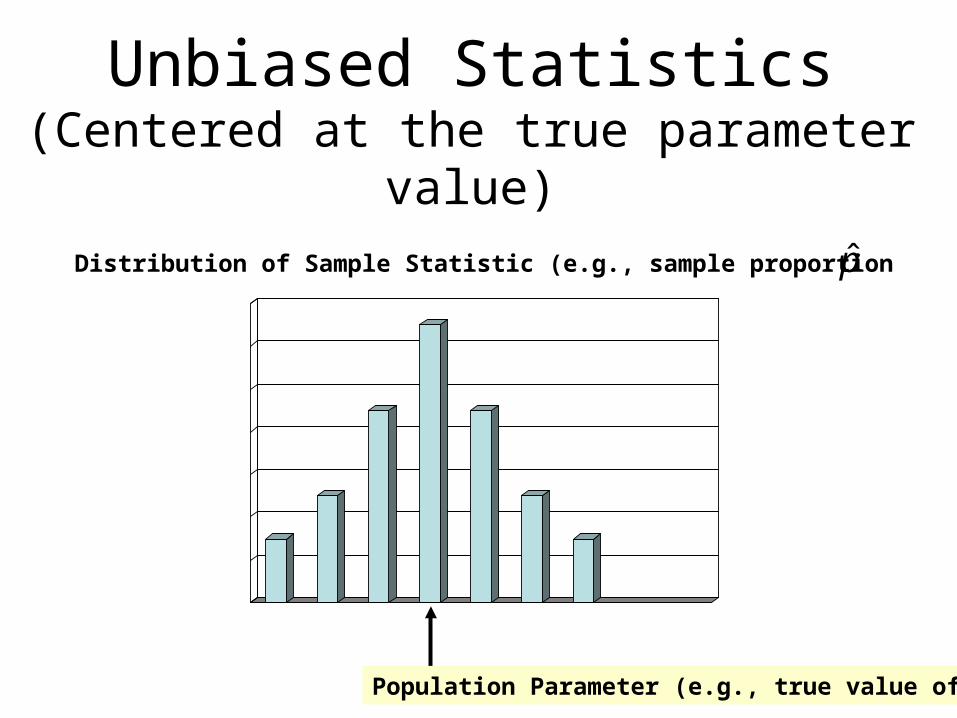
Unbiased Statistics(Centered at the true parameter value)
Population Parameter (e.g., true value of p)
Distribution of Sample Statistic (e.g., sample proportion )p
Variability of a Statistic
• Depends only on sample size and true parameter value(s). Larger sample sizes provide smaller variability of the sample statistics. Larger (more expensive) samples provide more accurate assessment of the true population parameter.
• Does not depend on size of the population that we are making inferences about.
Hey, while you are talking about sampling…
My back keeps hurting!!
Let’s design an experiment
to study that back treatment!
Experimental units/subjects/respondents:
Finds 120 people in his hometown who have the back problem, and who
• are considered “hopeless” cases• have no litigation pending• never had back surgery
Collects some information using a pain questionnaire (dependent measure)
How about … giving each of these 120 people the treatment
to see how it works?
• Regression toward the Mean(as a whole, the group might improve even without any treatment)
• Placebo Effect(favorable response on questionnaire even though the treatment
might have no effect,
trust in experimenter and expectation of a cure)
We need a comparison group (control group) against which to compare/assess the results of the treatment group:
Control group has • no treatment or
• a different treatment
Control theinfluence of
outside variables
Who gets into which group?
How about …
• women get the treatment, men don’t?
• people with worst pain get treatment, others don’t?
• people who travel less to get to the hospital get the treatment, others don’t?
• people who get treatment pay, others get paid?
Need Random Assignment: We do not wish results to be biased
We want to conclude that differences between groups are caused by the treatment.
For that, we need random assignment to experimental groups.
Later we will see how toprecisely state how confident we can be
that the differences between experimental groupsare indicative of real differences in the population:
Could the observed differences have arisen by chance?How likely? How unlikely?
If observed differences are unlikely a chance event,then they are called statistically significant.
Why not just one subject/respondent in each group?
Replication:
We want enough respondents in each group,so that the true differences, if they are there,
are visible.
We want the differences between people (that are not due to the treatment)
to “wash out” across members of each group.
How to randomize?
• Assign numbers to all experimental participants.
• Use a random generator / random number table to assign subjects to experimental groups.
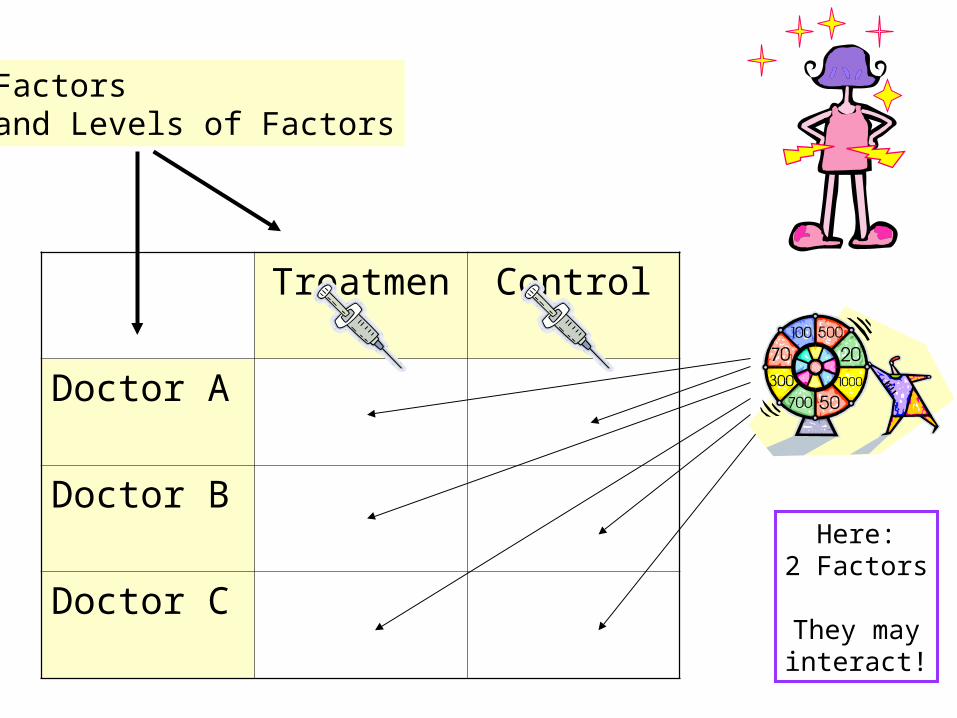
Treatment Control
Doctor A
Doctor B
Doctor C
Factorsand Levels of Factors
Here:2 Factors
They mayinteract!
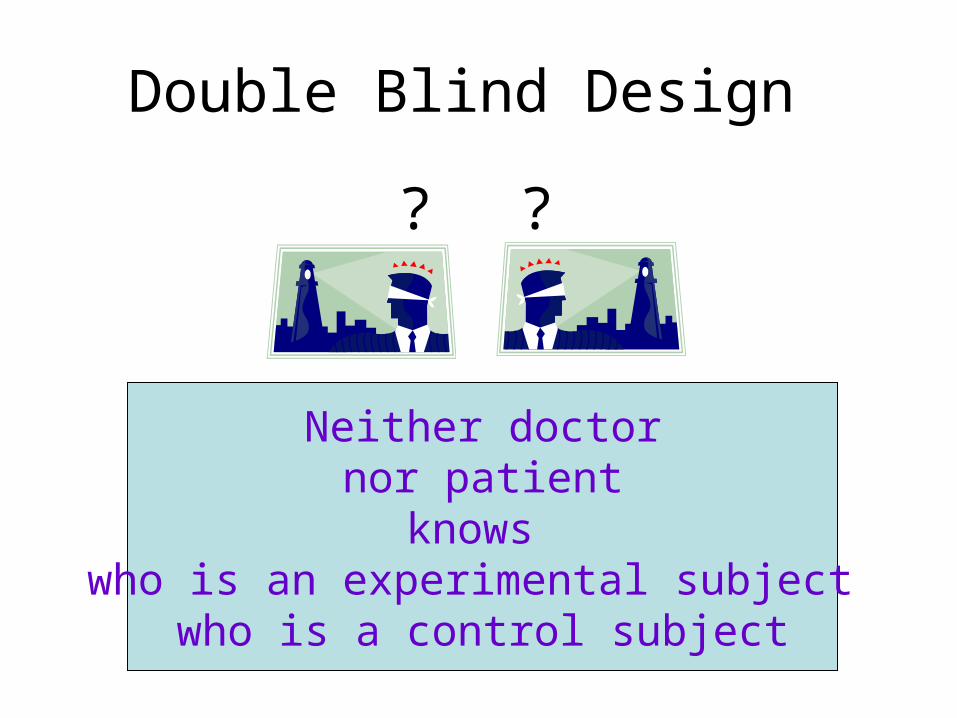
Double Blind Design
Neither doctornor patient
knows who is an experimental subject
who is a control subject
? ?
Ecological Validity
• Would doctors apply treatment the same way outside the experimental study?
• Would patients outside the experiment be comparable to the ones in the study?
• Would the treatment effects found in the study generalize to the “real world”?
• Are the conclusions drawn about the participants of the study generally true for patients who did not participate?
To randomize or to control?
We don’t always want to completely randomize!
Hey! Make up your mind!
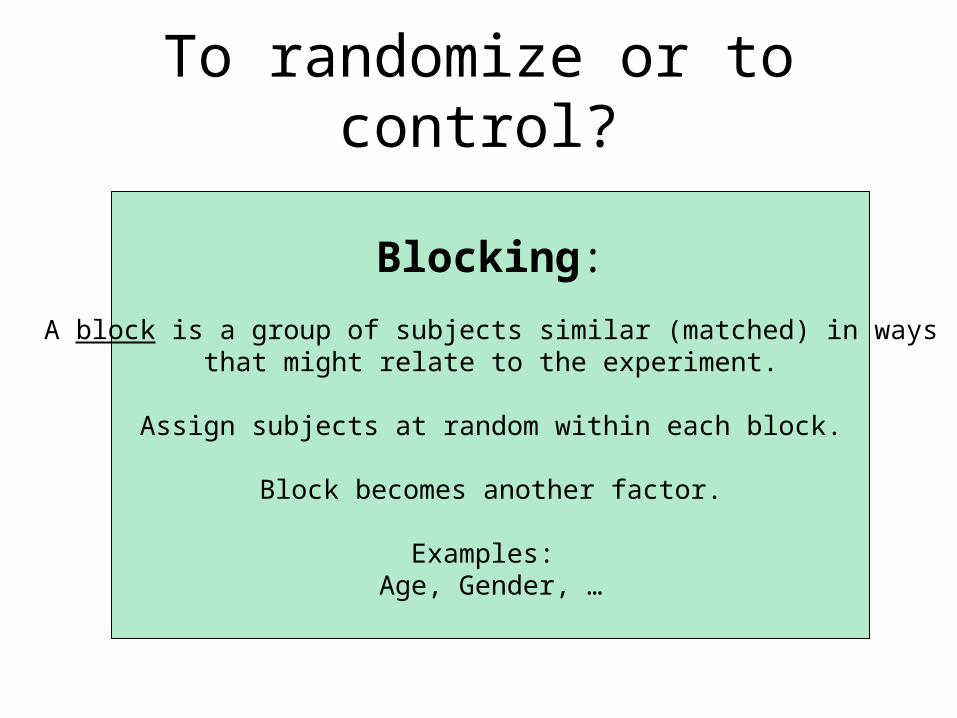
To randomize or to control?
Blocking:
A block is a group of subjects similar (matched) in waysthat might relate to the experiment.
Assign subjects at random within each block.
Block becomes another factor.
Examples: Age, Gender, …
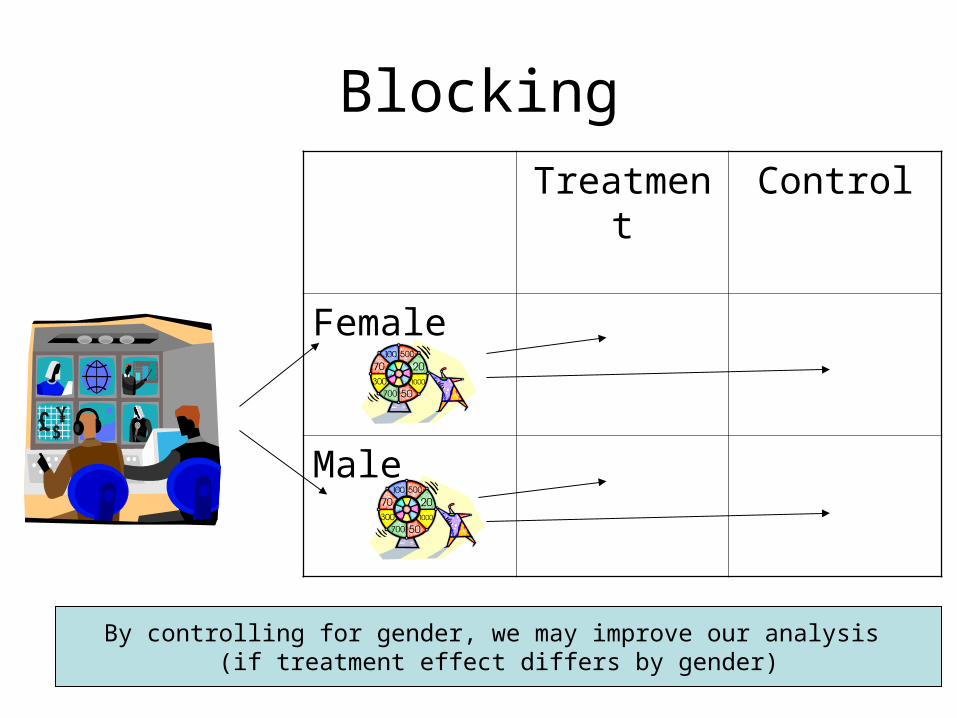
Blocking
Treatment Control
Female
Male
By controlling for gender, we may improve our analysis (if treatment effect differs by gender)
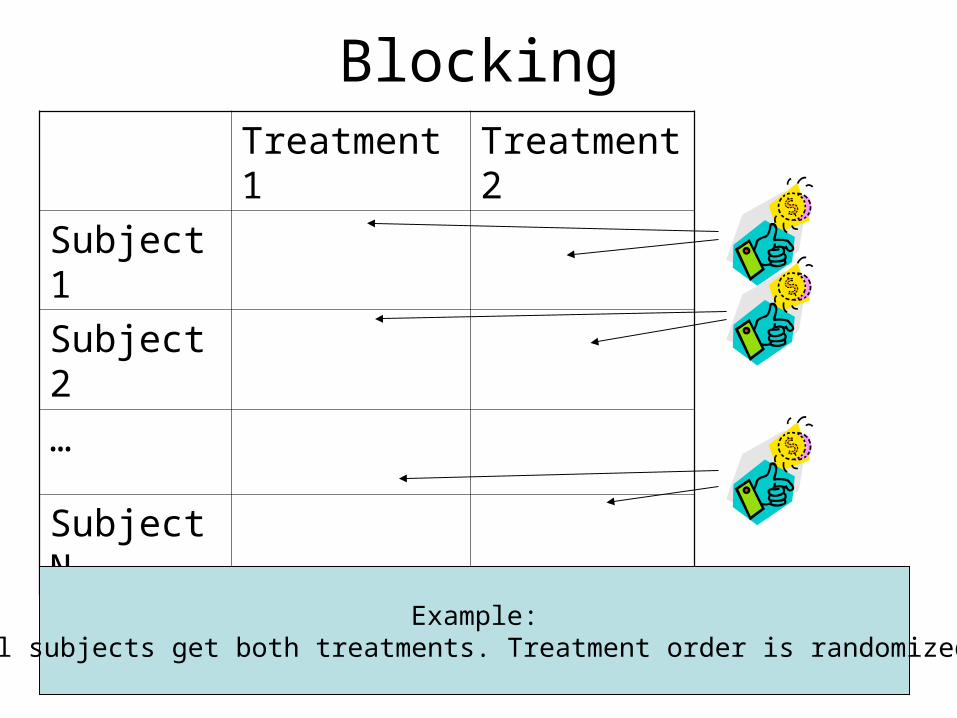
BlockingTreatment 1 Treatment 2
Subject 1
Subject 2
…
Subject N
Example:All subjects get both treatments. Treatment order is randomized.