
125cc-180cc Aprilia SR Dragster Runner Typhoon Skipper Machines Tuning Guide
HUNGARIAN JOURNAL OF INDUSTRY AND CHEMISTRY
VESZPRÉM Vol. 41(1) pp. 47–50 (2013)
FINE TUNING OF AUTOMATED ASSEMBLY MACHINES USING VIDEO ANALYSIS
ALÍZ KATONA1!, VIKTOR KOVÁCS2, DÓRA TASNER3, AND ZOLTÁN KOVÁCS3
1 Transmoduls , József A. u. 9., Veszprém, HUNGARY 2 Department of Automation and Applied Informatics, Budapest University of Technology and Economics, Magyar
Tudósok krt. 2., Budapest, 1117, HUNGARY 3 Department of Supply Chain Management, University of Pannonia, Egyetem u. 10, Veszprém, 8200, HUNGARY
!E-mail: [email protected]
Human/machine interaction is of still importance in the age of automation. Automated assembling devices are customizable products that need basic settings before installation. Capabilities of operators have to be taken into consideration in this process. This paper presents a procedure based on video recording to determine time data for machine settings. It allows the engineers to forecast the expected capacity of individual workstation and the entire production line. A case study from industry is used to illustrate the application of the system.
Keywords: automated assembly machine, human/machine interaction, method time measurement, MAYNARD operation sequence technique, video based process analysis
Introduction
Stopwatch, photo and film technologies were used commonly in factories to study how humans work. Analogue video technology had some disadvantages compared to traditional film, which contributed to opening a gap in their applications. The advent of digital age in video technology eliminated most drawbacks. Today videos have numerous benefits over the film and old videos including framing feature, easy to access and wide spread, affordable equipment, no additional personnel or lab needed, and software supported processing is possible. Due to the convergence of the technology, recordings became files that can be acquired by a wide variety of equipment including handheld devices.
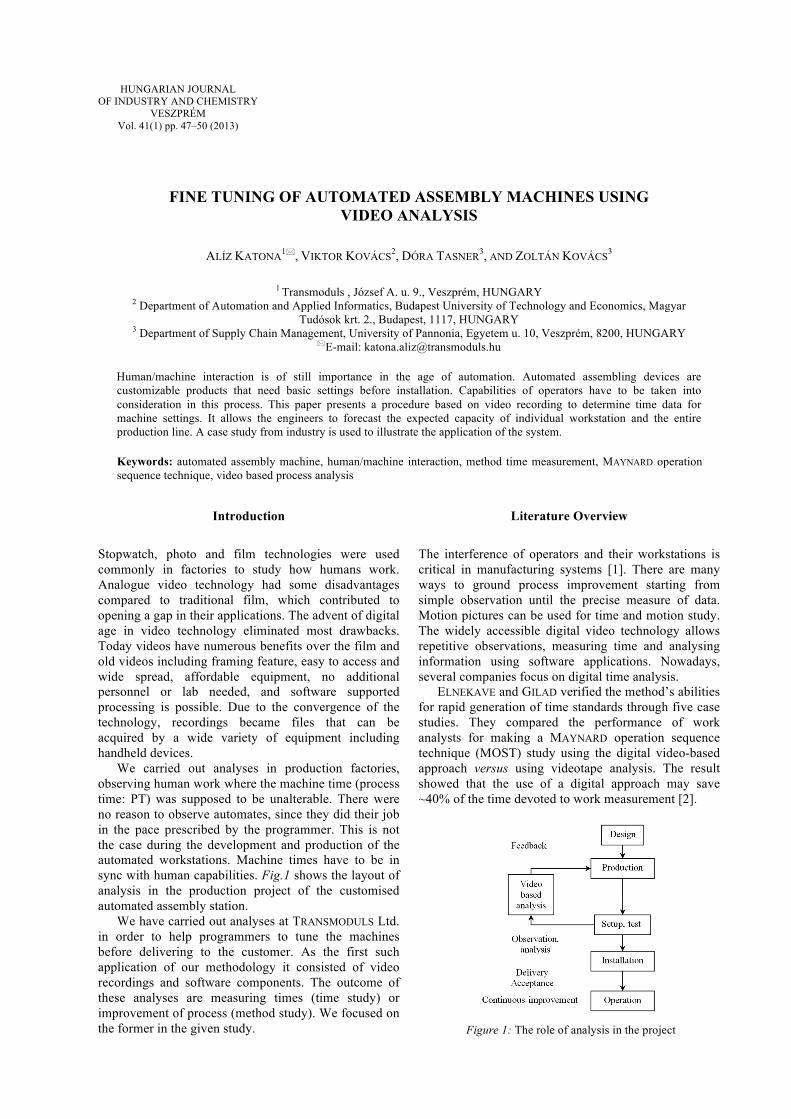
We carried out analyses in production factories, observing human work where the machine time (process time: PT) was supposed to be unalterable. There were no reason to observe automates, since they did their job in the pace prescribed by the programmer. This is not the case during the development and production of the automated workstations. Machine times have to be in sync with human capabilities. Fig.1 shows the layout of analysis in the production project of the customised automated assembly station.
We have carried out analyses at TRANSMODULS Ltd. in order to help programmers to tune the machines before delivering to the customer. As the first such application of our methodology it consisted of video recordings and software components. The outcome of these analyses are measuring times (time study) or improvement of process (method study). We focused on the former in the given study.
Literature Overview
The interference of operators and their workstations is critical in manufacturing systems [1]. There are many ways to ground process improvement starting from simple observation until the precise measure of data. Motion pictures can be used for time and motion study. The widely accessible digital video technology allows repetitive observations, measuring time and analysing information using software applications. Nowadays, several companies focus on digital time analysis.
ELNEKAVE and GILAD verified the method’s abilities for rapid generation of time standards through five case studies. They compared the performance of work analysts for making a MAYNARD operation sequence technique (MOST) study using the digital video-based approach versus using videotape analysis. The result showed that the use of a digital approach may save ~40% of the time devoted to work measurement [2].
Figure 1: The role of analysis in the project
48
As an example, the usage of video-based time and motion study is common in health care. A study was conducted to identify ambulance- and operator factors affecting cardiopulmonary resuscitation device in such environment. The aim was to improve the quality of resuscitation in ambulance [3]. Furthermore, a new technique demonstrates the feasibility of tracking workers from statistically placed and dynamically moving cameras [4]. This study reviewed existing techniques to monitor workforce and describe areas, where a work may be improved in engineering application. Typical construction site video is processed and analysed to determine the most appropriate tracking method for the video.
MA et al. proposed a new framework on the basis of motion-tracking and digital human simulation technique for motion-time analysis of manual operations. They track the worker’s operation during completion of a task. Then the motion data are transferred to computer for real-time digital human simulation. The data are used for motion type recognition and analysis [5].
Furthermore, video technique is used for observing business life in Japan with great efficiency. It gives help in developing ergonomic methods, statistical methods and technology. Using this approach, the individual user's everyday behaviour is observed as well as employees' collective work, for example during fixing of gas pipelines [6]. As possible outcomes, the satisfaction of consumers and the creation of safe work environment can be increased at the same time.
Video recordings were made during the picking processes in car industry, when several hours of work were recorded [7]. The aim of the recording was to allow employees to mark specific motions in the evaluating program called VIDAR that caused them pain or made them feel uncomfortable. The results showed that after the company received the data they were able to change processes successfully from the ergonomic analysis of complex work.
The video-based method can be applied in all cases, where the goal is to better understand the workflow related processes. The camera-based method has advantages and disadvantages, thus its use needs to be evaluated whether it provides the best solution.
The measurement framework
Goal setting and planning
We designed a process for addressing the questions, such as when we the measured to be done, how and where the measurement can be done for these intervals, what the benefits of the collected information are, and what information we want from the recordings During our research, we based our measurements on a technique utilizing video recordings. Video was recorded of the examined processes and offline analysis was carried out afterwards to extract the required information. The planning phase included decisions on the aforementioned questions, most importantly what to
record, how to perform the recording without interfering with the processes and how much captured information is needed to extract certain data.
Implementation
Videos were recorded using commercial HDV camcorders. HDV/AVCHD (1080i50) provides benefit over DV (576i50) due to the higher resolution. Higher image resolution offers more details for analysis. Both systems are capable of interlaced video recording, which offers doubled number of samples at the expense of resolution (row count is halved). This is a practical feature that balances high resolution and larger frame rates. In order to extract accurate time information in both fields of the video may be used.
The recorded videos were transferred to the PC. Tape based camcorders require an IEEE 1394 port to capture the video stream, while recent flash drive based camcorders offer simple file copying mechanism to download video clips. These video files may be transformed and compressed further for archiving purposes or simply fit them to the capacity of the PC used for analysis. We compressed all source videos to a common MPEG4 format to ease software dependencies for decoding.
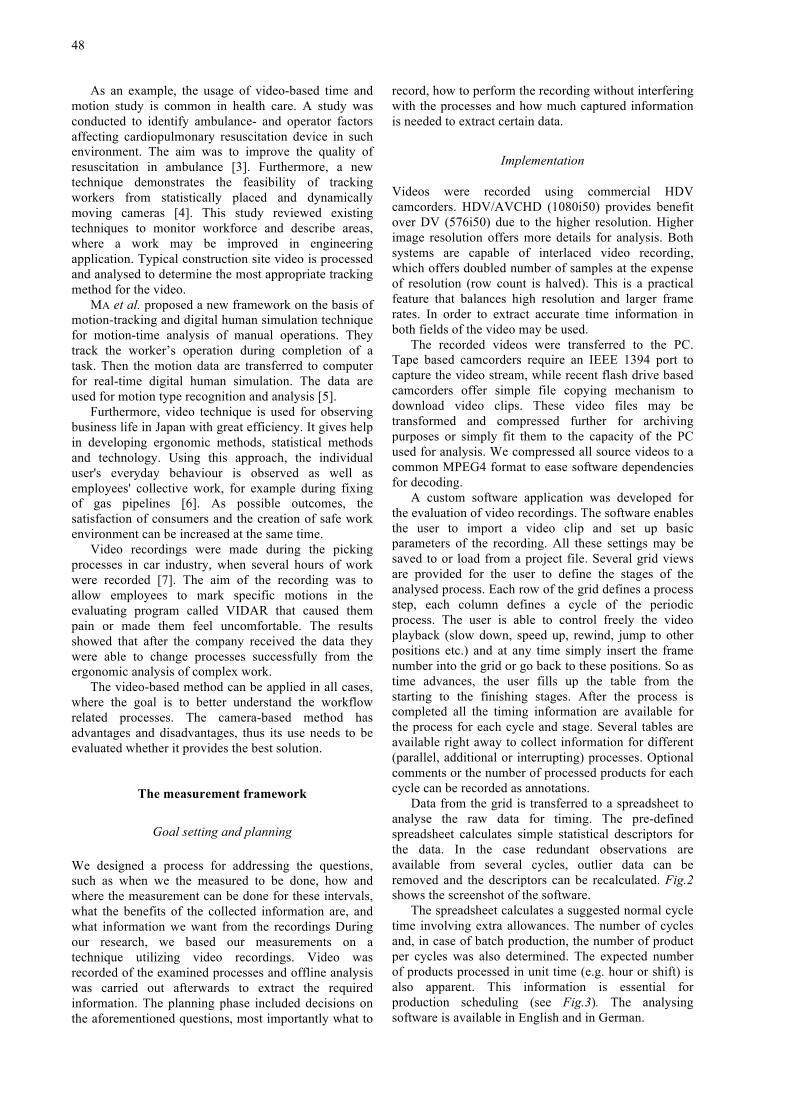
A custom software application was developed for the evaluation of video recordings. The software enables the user to import a video clip and set up basic parameters of the recording. All these settings may be saved to or load from a project file. Several grid views are provided for the user to define the stages of the analysed process. Each row of the grid defines a process step, each column defines a cycle of the periodic process. The user is able to control freely the video playback (slow down, speed up, rewind, jump to other positions etc.) and at any time simply insert the frame number into the grid or go back to these positions. So as time advances, the user fills up the table from the starting to the finishing stages. After the process is completed all the timing information are available for the process for each cycle and stage. Several tables are available right away to collect information for different (parallel, additional or interrupting) processes. Optional comments or the number of processed products for each cycle can be recorded as annotations.
Data from the grid is transferred to a spreadsheet to analyse the raw data for timing. The pre-defined spreadsheet calculates simple statistical descriptors for the data. In the case redundant observations are available from several cycles, outlier data can be removed and the descriptors can be recalculated. Fig.2 shows the screenshot of the software.
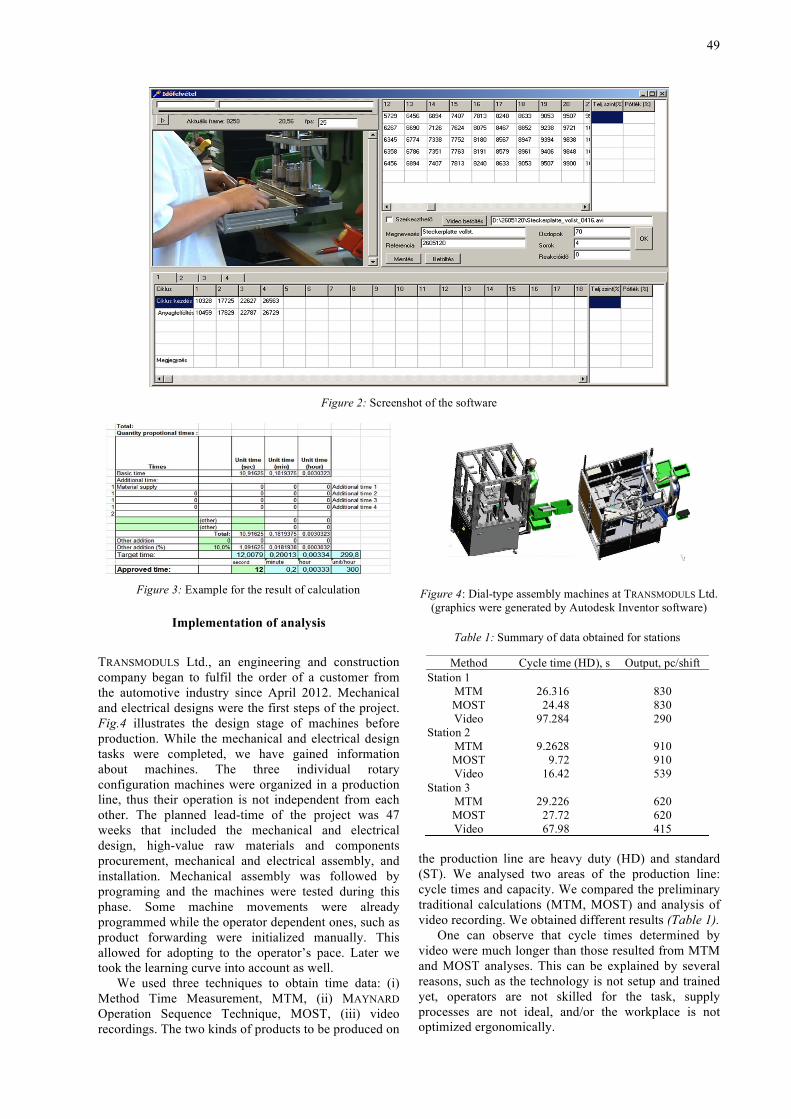
The spreadsheet calculates a suggested normal cycle time involving extra allowances. The number of cycles and, in case of batch production, the number of product per cycles was also determined. The expected number of products processed in unit time (e.g. hour or shift) is also apparent. This information is essential for production scheduling (see Fig.3). The analysing software is available in English and in German.
49
Implementation of analysis
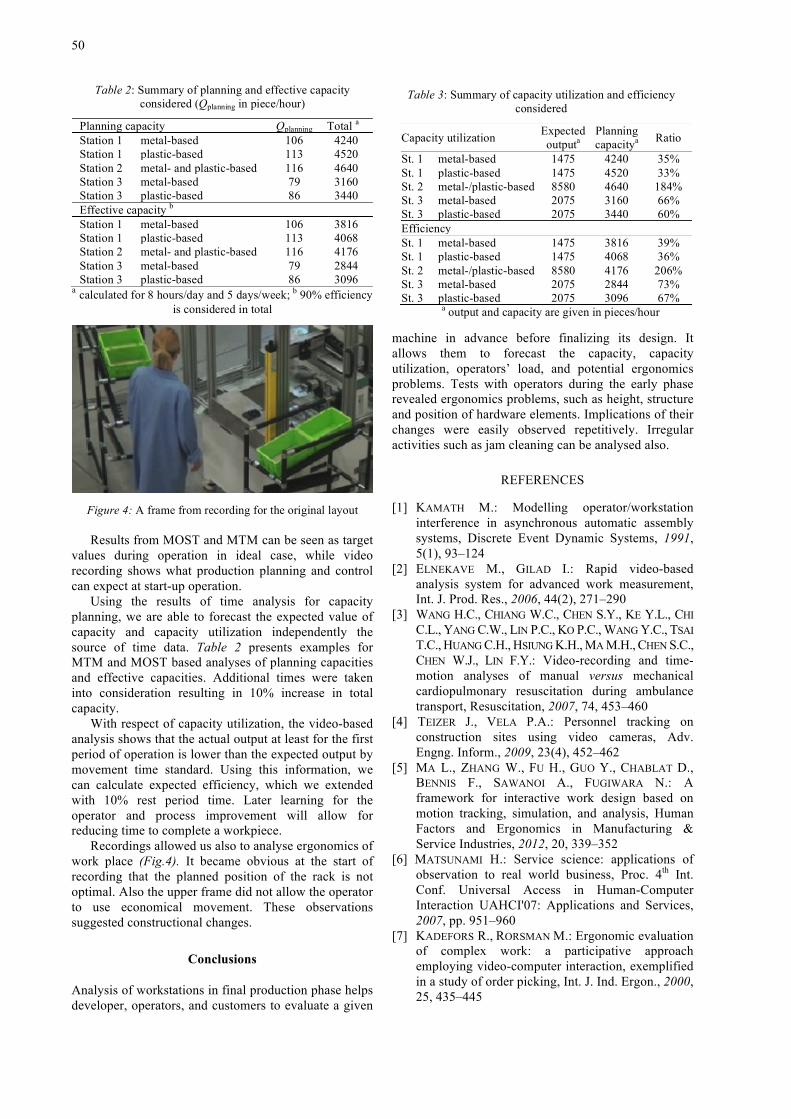
TRANSMODULS Ltd., an engineering and construction company began to fulfil the order of a customer from the automotive industry since April 2012. Mechanical and electrical designs were the first steps of the project. Fig.4 illustrates the design stage of machines before production. While the mechanical and electrical design tasks were completed, we have gained information about machines. The three individual rotary configuration machines were organized in a production line, thus their operation is not independent from each other. The planned lead-time of the project was 47 weeks that included the mechanical and electrical design, high-value raw materials and components procurement, mechanical and electrical assembly, and installation. Mechanical assembly was followed by programing and the machines were tested during this phase. Some machine movements were already programmed while the operator dependent ones, such as product forwarding were initialized manually. This allowed for adopting to the operator’s pace. Later we took the learning curve into account as well.
We used three techniques to obtain time data: (i) Method Time Measurement, MTM, (ii) MAYNARD Operation Sequence Technique, MOST, (iii) video recordings. The two kinds of products to be produced on
the production line are heavy duty (HD) and standard (ST). We analysed two areas of the production line: cycle times and capacity. We compared the preliminary traditional calculations (MTM, MOST) and analysis of video recording. We obtained different results (Table 1).
One can observe that cycle times determined by video were much longer than those resulted from MTM and MOST analyses. This can be explained by several reasons, such as the technology is not setup and trained yet, operators are not skilled for the task, supply processes are not ideal, and/or the workplace is not optimized ergonomically.
Figure 2: Screenshot of the software
Figure 3: Example for the result of calculation
Figure 4: Dial-type assembly machines at TRANSMODULS Ltd. (graphics were generated by Autodesk Inventor software)
Table 1: Summary of data obtained for stations
Method Cycle time (HD), s Output, pc/shift Station 1
MTM 26.316 830 MOST 24.48 830 Video 97.284 290
Station 2 MTM 9.2628 910 MOST 9.72 910 Video 16.42 539
Station 3 MTM 29.226 620 MOST 27.72 620 Video 67.98 415
50
Results from MOST and MTM can be seen as target values during operation in ideal case, while video recording shows what production planning and control can expect at start-up operation.
Using the results of time analysis for capacity planning, we are able to forecast the expected value of capacity and capacity utilization independently the source of time data. Table 2 presents examples for MTM and MOST based analyses of planning capacities and effective capacities. Additional times were taken into consideration resulting in 10% increase in total capacity.
With respect of capacity utilization, the video-based analysis shows that the actual output at least for the first period of operation is lower than the expected output by movement time standard. Using this information, we can calculate expected efficiency, which we extended with 10% rest period time. Later learning for the operator and process improvement will allow for reducing time to complete a workpiece.
Recordings allowed us also to analyse ergonomics of work place (Fig.4). It became obvious at the start of recording that the planned position of the rack is not optimal. Also the upper frame did not allow the operator to use economical movement. These observations suggested constructional changes.
Conclusions
Analysis of workstations in final production phase helps developer, operators, and customers to evaluate a given
machine in advance before finalizing its design. It allows them to forecast the capacity, capacity utilization, operators’ load, and potential ergonomics problems. Tests with operators during the early phase revealed ergonomics problems, such as height, structure and position of hardware elements. Implications of their changes were easily observed repetitively. Irregular activities such as jam cleaning can be analysed also.
REFERENCES
[1] KAMATH M.: Modelling operator/workstation interference in asynchronous automatic assembly systems, Discrete Event Dynamic Systems, 1991, 5(1), 93–124
[2] ELNEKAVE M., GILAD I.: Rapid video-based analysis system for advanced work measurement, Int. J. Prod. Res., 2006, 44(2), 271–290
[3] WANG H.C., CHIANG W.C., CHEN S.Y., KE Y.L., CHI C.L., YANG C.W., LIN P.C., KO P.C., WANG Y.C., TSAI T.C., HUANG C.H., HSIUNG K.H., MA M.H., CHEN S.C., CHEN W.J., LIN F.Y.: Video-recording and time-motion analyses of manual versus mechanical cardiopulmonary resuscitation during ambulance transport, Resuscitation, 2007, 74, 453–460
[4] TEIZER J., VELA P.A.: Personnel tracking on construction sites using video cameras, Adv. Engng. Inform., 2009, 23(4), 452–462
[5] MA L., ZHANG W., FU H., GUO Y., CHABLAT D., BENNIS F., SAWANOI A., FUGIWARA N.: A framework for interactive work design based on motion tracking, simulation, and analysis, Human Factors and Ergonomics in Manufacturing & Service Industries, 2012, 20, 339–352
[6] MATSUNAMI H.: Service science: applications of observation to real world business, Proc. 4th Int. Conf. Universal Access in Human-Computer Interaction UAHCI'07: Applications and Services, 2007, pp. 951–960
[7] KADEFORS R., RORSMAN M.: Ergonomic evaluation of complex work: a participative approach employing video-computer interaction, exemplified in a study of order picking, Int. J. Ind. Ergon., 2000, 25, 435–445
Table 2: Summary of planning and effective capacity considered (Qplanning in piece/hour)
Planning capacity Qplanning Total a Station 1 metal-based 106 4240 Station 1 plastic-based 113 4520 Station 2 metal- and plastic-based 116 4640 Station 3 metal-based 79 3160 Station 3 plastic-based 86 3440 Effective capacity b Station 1 metal-based 106 3816 Station 1 plastic-based 113 4068 Station 2 metal- and plastic-based 116 4176 Station 3 metal-based 79 2844 Station 3 plastic-based 86 3096
a calculated for 8 hours/day and 5 days/week; b 90% efficiency is considered in total
Table 3: Summary of capacity utilization and efficiency considered
Capacity utilization Expected outputa
Planning capacitya Ratio
St. 1 metal-based 1475 4240 35% St. 1 plastic-based 1475 4520 33% St. 2 metal-/plastic-based 8580 4640 184% St. 3 metal-based 2075 3160 66% St. 3 plastic-based 2075 3440 60% Efficiency St. 1 metal-based 1475 3816 39% St. 1 plastic-based 1475 4068 36% St. 2 metal-/plastic-based 8580 4176 206% St. 3 metal-based 2075 2844 73% St. 3 plastic-based 2075 3096 67%
a output and capacity are given in pieces/hour
Figure 4: A frame from recording for the original layout


