Findings of the MEFMI Study on Contingent Liabilities Liabilities... · Findings of the MEFMI Study...
26
Findings of the MEFMI Study on Contingent Liabilities Debt Management Stakeholders’ Forum 3 rd –4 th June 2015 Manila, Philippines
Transcript of Findings of the MEFMI Study on Contingent Liabilities Liabilities... · Findings of the MEFMI Study...

Findings of the MEFMI Study on Contingent Liabilities
Debt Management Stakeholders’ Forum
3rd – 4th June 2015
Manila, Philippines

Outline• Introduction
• Objectives of the Study
• Scope of the Study
• Methodology
• Findings
o Legal and institutional framework
o Data compilation, recording, reporting and
dissemination methodologies
o Magnitude of contingent liabilities
• Challenges
• Recommendations and Way forward

Introduction• Contingent liabilities have become a bigger fiscal risk to govts. Key
reasons for this include:
o The transformation of the role of the state from a supplier of
goods and services to a facilitator through, for instance,
extending guarantees to the public and private sector, thus
creating contingent liabilities.
o Economic and financial crises e.g. the recent global crisis which
resulted in govts bailing out their economies through guarantees
and off-budget commitments.
o Adoption of public private partnerships (PPPs).
o The absence of fully funded pension schemes (pay-as-you go),
thereby making future pension payments be contingent
liabilities.
• These have changed the nature of the financial burden of the fiscal
authorities to include increasing obligations arising from CLs.
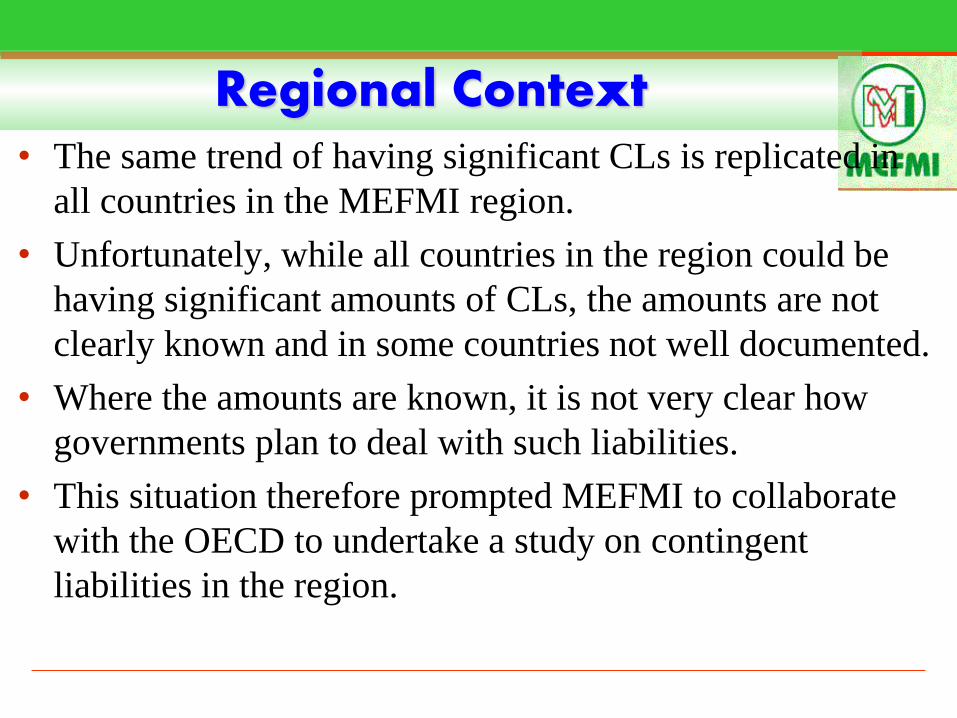
Regional Context• The same trend of having significant CLs is replicated in
all countries in the MEFMI region.
• Unfortunately, while all countries in the region could be
having significant amounts of CLs, the amounts are not
clearly known and in some countries not well documented.
• Where the amounts are known, it is not very clear how
governments plan to deal with such liabilities.
• This situation therefore prompted MEFMI to collaborate
with the OECD to undertake a study on contingent
liabilities in the region.

Objectives of the Study
• To assess govt approaches in managing the CLs;
• To determine the stock of CLs by quantifying both
explicit and implicit CLs;
• Assess the legal and institutional arrangements for
managing CLs in the region
• Come up with a sound framework for recording,
monitoring and managing the risks arising from the CLs.

Scope and Methodology• Covered 12 MEFMI member countries: Botswana, Kenya,
Lesotho, Malawi, Mozambique, Namibia, Rwanda,
Swaziland, Uganda, Zambia and Zimbabwe.
• Preceded by pilot study in Zambia in the first half of 2013.
Tanzania conducted its study in 2014.
• Entailed field surveys using a structured questionnaire to
collect data.
• Questionnaires administered by practitioners mainly in the
Ministries of Finance or Central Banks.
• Each practitioner analysed the data and prepared country
report.

Country Responses
• The study was successfully completed for 9 countries:
Kenya, Lesotho, Malawi, Mozambique, Namibia, Rwanda,
Tanzania, Uganda and Zambia. The rest were unable to
submit the complete set of information required
• The individual countries’ findings are being consolidated for
the region - summarizing the findings, challenges and
proposed way forward.

PRELIMINARY FINDINGS
Legal Framework
Institutional Arrangements
Measurement, Budgeting and Reporting
The magnitude of CLs

Findings on Legal Framework• Almost all countries have legislation on CLs particularly those arising
from state guarantees. These authorize the Minister responsible for
Finance to issue guarantees.
• In a few countries (e.g. Uganda, Zambia) the national constitutions
have articles authorizing guarantees.
• Some countries require authorization by Parliament (Uganda), others
Cabinet (Lesotho, Malawi) or both e.g. Lesotho where the purpose
and amount requires Cabinet approval (on recommendation of the
Minister) and the terms of each loan guarantee are reported to
National Assembly for approval.
• Some have guarantee limits on outstanding balance (Mozambique).
• Some have annual fee charged on guarantees, or risk premium and all
costs incurred by the Government in the process (Lesotho &
Mozambique), fixed rate of 2% p.a.(Namibia &Zambia).

Other Findings on Legal Framework• Most countries have adopted PPPs with laws to support these:
o Many countries have enacted laws on PPPs e.g. Zambia (2009),
Malawi (2010), Tanzania (2010), Mozambique (2011), and Kenya (2013).
o But, there are a few countries implementing PPPs without
explicit legal backing e.g. Lesotho and Rwanda
• Almost all countries practice on-lending to SOEs implementing
infrastructure projects deemed of national interest – though without
adequate legal backing in all countries.
o In some countries, on-lending agreements attract a margin above the
original agreement rate to cover expenses including bank
charges/commissions (Mozambique & Namibia).
• To complement the legal framework, some countries have
developed detailed policies and guidelines on issuance and
management of contingent liabilities e.g. Malawi, Namibia

Institutional Arrangements for CLs• In most countries, guarantees are handled within Ministries of
Finance – though many departments within are involved
o Uganda has established a Unit in MoF to manage contingent liabilities.
• The debt mgt committees are also involved in the process
especially in the analysis of guarantees before issuance.
• In some countries the PPP Acts established committees/units to
foresee PPPs e.g. Kenya, Malawi, Mozambique, etc
• In Kenya for instance the Act establishes the PPP Facilitation
Fund which among others is expected to cater for contingent
liabilities arising from PPP activities.
• Generally, active mgt of CLs is limited. CLs are dealt with on an ad
hoc basis. In addition, there are weak institutional frameworks for
managing CLs.

Measurement of CLs• Information on contingent liabilities is collected through
audited financial reports.
o SOEs and private companies regularly (by semester) provide
financial balance sheets along with details of the amount of
guaranteed loans they have outstanding.
o However, analysis is not detailed unless there is a special need to
do so for a particular entity
• There are data challenges for other types of CLs,
particularly on implicit liabilities including those arising
from litigation.
• In other countries, there are no formalised structures for
collecting information on CL in general. The available data
on CLs are mainly estimates.

Measurement of CLs
• A few countries compile guarantees data (explicit
guarantees) in the same manner as other debt instruments,
o E.g. Lesotho records CLs in CS-DRMS in the same way as other
loans.
• Explicit guarantees are recorded on face value at the time
the guarantee is issued and does not require further
quantifications.
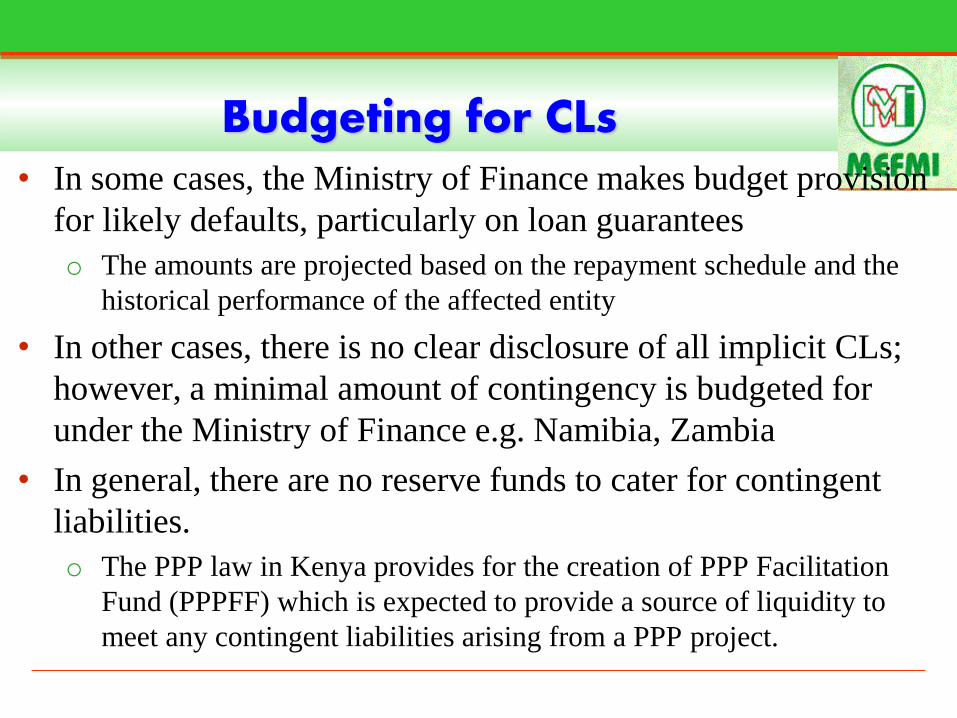
Budgeting for CLs• In some cases, the Ministry of Finance makes budget provision
for likely defaults, particularly on loan guarantees
o The amounts are projected based on the repayment schedule and the
historical performance of the affected entity
• In other cases, there is no clear disclosure of all implicit CLs;
however, a minimal amount of contingency is budgeted for
under the Ministry of Finance e.g. Namibia, Zambia
• In general, there are no reserve funds to cater for contingent
liabilities.
o The PPP law in Kenya provides for the creation of PPP Facilitation
Fund (PPPFF) which is expected to provide a source of liquidity to
meet any contingent liabilities arising from a PPP project.
Reporting of CLs
• In general, there are no specific laws on reporting of
contingent liabilities. Reporting is mainly guided by
organic laws for public institutions to report on contingent
liabilities through financial statements.
• Some institutions report on the existing CLs through their
publications such as Central Bank Reports.
• In general, debt management reports do not provide
comprehensive coverage of contingent liabilities apart
from government guarantees.
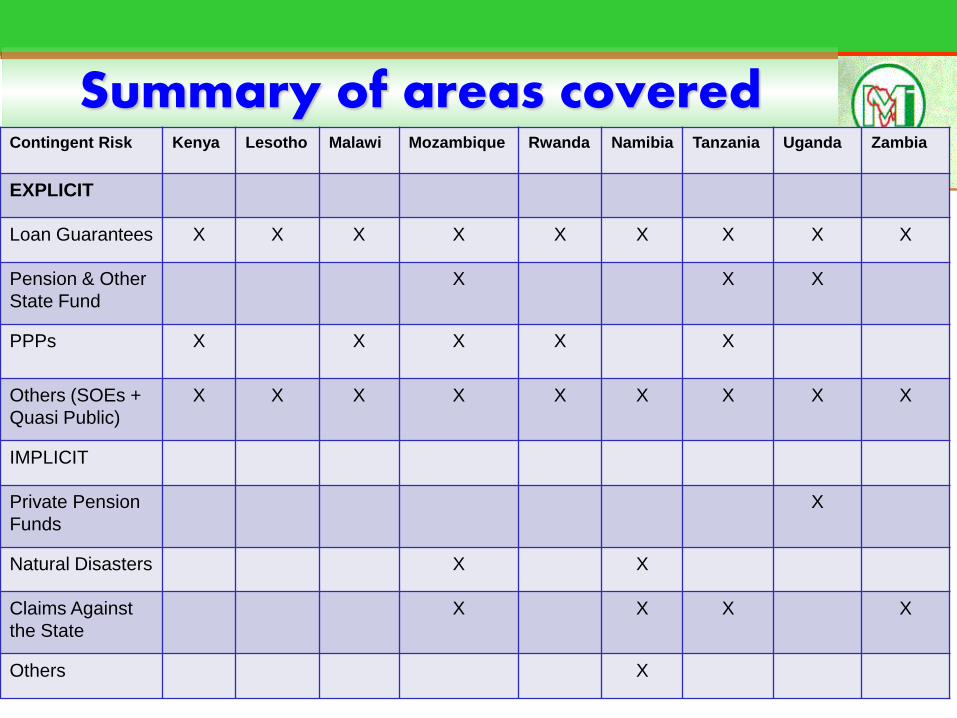
Summary of areas coveredContingent Risk Kenya Lesotho Malawi Mozambique Rwanda Namibia Tanzania Uganda Zambia
EXPLICIT
Loan Guarantees X X X X X X X X X
Pension & Other
State Fund
X X X
PPPs X X X X X
Others (SOEs +
Quasi Public)
X X X X X X X X X
IMPLICIT
Private Pension
Funds
X
Natural Disasters X X
Claims Against
the State
X X X X
Others X

Magnitude Of CLs
Total PPG Debt Contingent Liabilities CL/PPG
Country Period
Nominal
(US$ m) % GDP
Nominal
(US$ m) %GDP %
Kenya Jun-12 19,265.55 49.5% 1,606.97 4.1% 8.3%
Lesotho Sep-13 910.50 40.8% 176.20 7.9% 19.3%
Namibia Mar-13 3,473.9 25.1% 585.5 4.2% 16.9%
Uganda Jun-13 6,402.9 30.8% 2,845.0 13.7% 44.4%
Tanzania Jun-14 15,367.0 42.0% 5,778.2 15.8% 37.6%
Zambia Dec-10 4,032.0 25.2% 4,967.0 31.1% 123.2%
Total/Average
49,451.8 36.5% 15,958.9 12.8% 41.6%
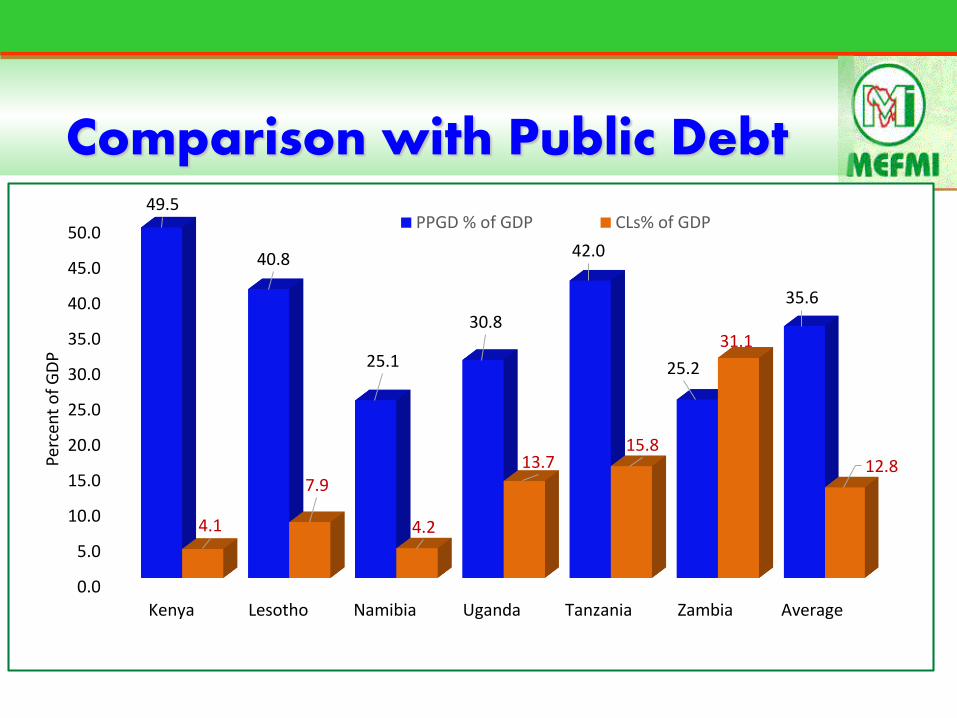
Comparison with Public Debt
0.0
5.0
10.0
15.0
20.0
25.0
30.0
35.0
40.0
45.0
50.0
Kenya Lesotho Namibia Uganda Tanzania Zambia Average
49.5
40.8
25.1
30.8
42.0
25.2
35.6
4.1
7.9
4.2
13.715.8
31.1
12.8Perc
ent
of
GD
P
PPGD % of GDP CLs% of GDP

CLs as % of Total Public Debt
8.3
19.3
44.437.6
123.2
16.9
46.6
0.0
20.0
40.0
60.0
80.0
100.0
120.0
140.0
Kenya Lesotho Uganda Tanzania Zambia Namibia Average
Perc
ent
The most
accurate??
We think so

Cost of CLs vs Domestic revenue• Budget provision/payment and gov’t assumption of
implicit CLs remains relatively low:o Kenya paid Ksh 961.3 million (About US$11 million, 0.12% of domestic
revenue) in 2011/12. In the last 21 years, Kenya has paid a cumulative Ksh
22,109 million (about US$253 million)
o Lesotho assumed M 205.5 million (US$20.6 million, 1.7% of domestic
revenue) of implicit contingent liabilities in 2012/13
o Namibia assumed implicit contingent liabilities amounting to N$420.5
millions (US$42.3 million, 2% of domestic revenue) as at end of 2012/13
o Zambia allocated ZMK 44.588 million (0.14% of the total budget, around
0.03% of the expected GDP) in 2013
o Uganda - PV of Implicit Contingent Liabilities is about 205% domestic
revenue and 16.5% of GDP.
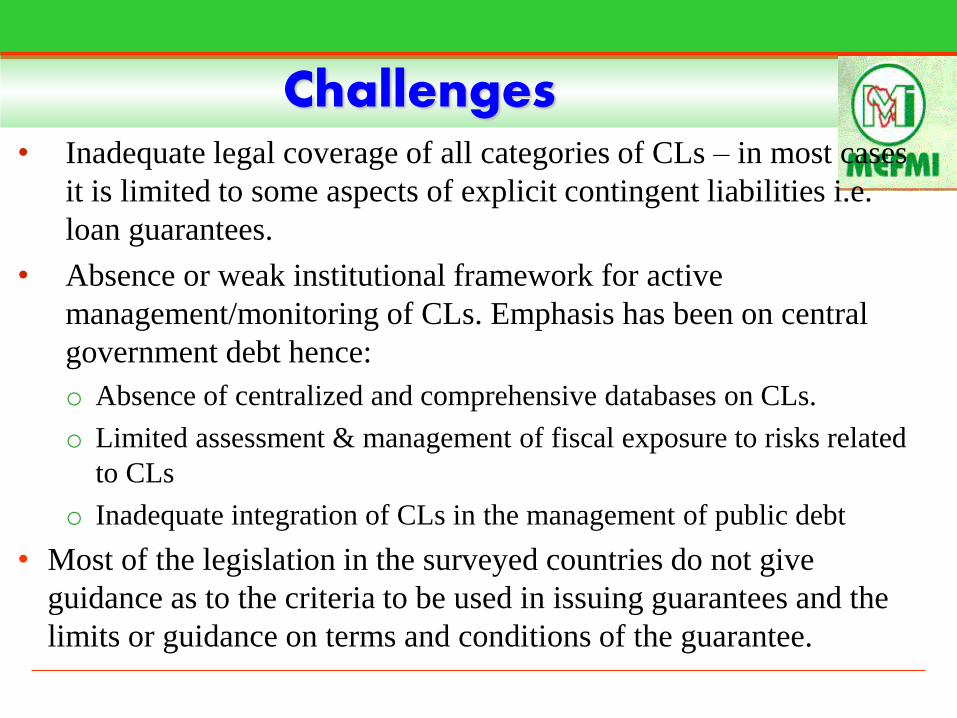
Challenges• Inadequate legal coverage of all categories of CLs – in most cases
it is limited to some aspects of explicit contingent liabilities i.e.
loan guarantees.
• Absence or weak institutional framework for active
management/monitoring of CLs. Emphasis has been on central
government debt hence:
o Absence of centralized and comprehensive databases on CLs.
o Limited assessment & management of fiscal exposure to risks related
to CLs
o Inadequate integration of CLs in the management of public debt
• Most of the legislation in the surveyed countries do not give
guidance as to the criteria to be used in issuing guarantees and the
limits or guidance on terms and conditions of the guarantee.

Challenges• While collecting data on contingent liabilities the following challenges
were faced in almost all countries:
o Lack of transparency in SOEs financial operations – resulting in
implicit contingent liabilities without adequate provisions in the
govt. annual budgets.
o There is no formal requirement for reporting of contingent
liabilities in most countries (Except for Uganda where the law
requires that loan guarantees are reported in the “Loans, Grants
and Guarantees Report”) This, however, has not been done in practice and payments disclosure is not explicitly required
The legislation lacks requirement for statutory preliminary analysis and risk assessment before issuing
guarantees
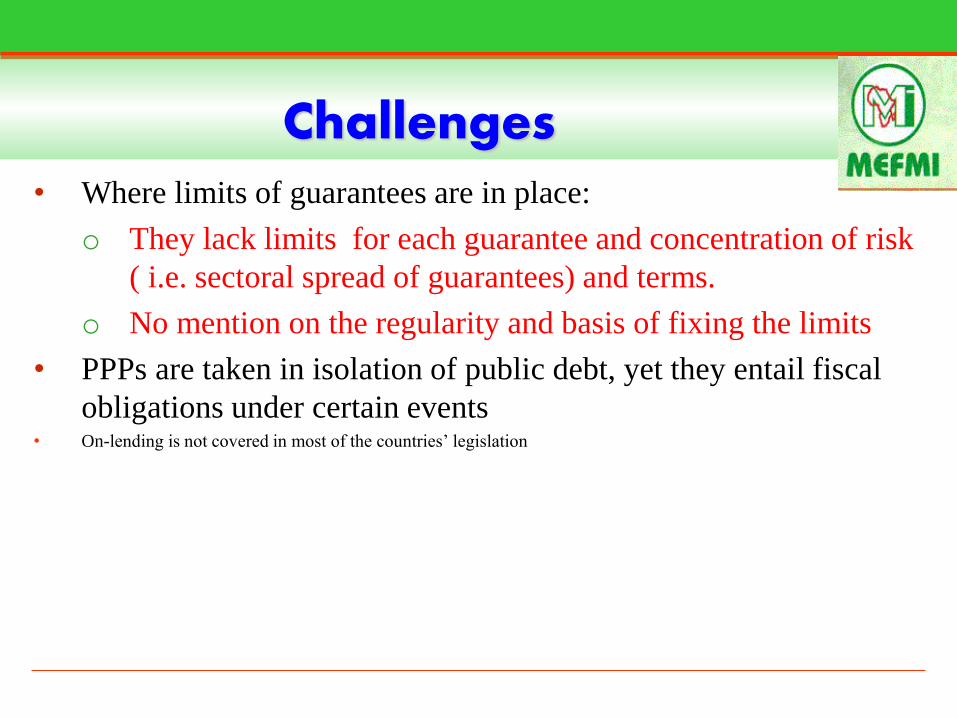
Challenges• Where limits of guarantees are in place:
o They lack limits for each guarantee and concentration of risk
( i.e. sectoral spread of guarantees) and terms.
o No mention on the regularity and basis of fixing the limits
• PPPs are taken in isolation of public debt, yet they entail fiscal
obligations under certain events • On-lending is not covered in most of the countries’ legislation
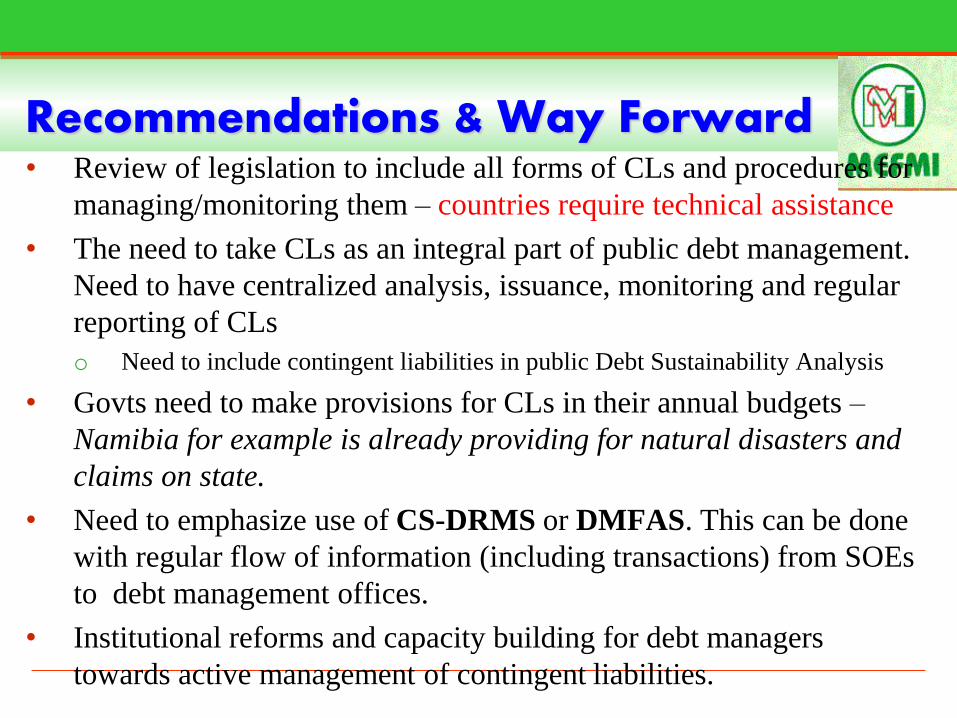
Recommendations & Way Forward• Review of legislation to include all forms of CLs and procedures for
managing/monitoring them – countries require technical assistance
• The need to take CLs as an integral part of public debt management.
Need to have centralized analysis, issuance, monitoring and regular
reporting of CLs
o Need to include contingent liabilities in public Debt Sustainability Analysis
• Govts need to make provisions for CLs in their annual budgets –
Namibia for example is already providing for natural disasters and
claims on state.
• Need to emphasize use of CS-DRMS or DMFAS. This can be done
with regular flow of information (including transactions) from SOEs
to debt management offices.
• Institutional reforms and capacity building for debt managers
towards active management of contingent liabilities.

Namibia
2006/07 2007/08 2008/09 2009/10 2010/11 2011/12 2012/13
(In Namibian dollar million, end period)
(i) Total outstanding guarantees 3767.6 3413.3 3029.0 2634.9 2012.7 1730.3 2471.6
of which
(a) Domestic guarantees 1760.9 1229.8 1070.0 1211.4 1072.2 944.0 1329.4
(b) External gurantees 2006.7 2183.5 1959.0 1423.5 940.5 786.3 1142.2
(ii) Realised cost to government 116.5 0 255 218.1 11.4 260 131.6
(Ratios as per cent of)
(iii) Key Indicators
Total guarantees to GDP 6.7 5.3 4.1 3.4 2.4 1.8 2.2
Total guarantees to Revenue 24.1 16.4 12.8 10.9 8.9 5.8 6.7Default ratio (Default payments/
Outstanding guarantees)3.1 0.0 8.4 8.3 0.6 15.0 5.3
(iv) Composition
Domestic Total guarantees 46.7 36.0 35.3 46.0 53.3 54.6 53.8
External to Total guarantees 53.3 64.0 64.7 54.0 46.7 45.4 46.2
Fiscal Years 2006/07 2007/08 2008/09 2009/10 2010/11 2011/12 2012/13(est)
In millions N$ dollar, unless otherwise stated
Claims against the state 13.3 11.2 13.1 18.3 19.4 22.6 25.1
Contingency Provision 112.7 179.8 268.9 222.2 372.8 234.7 395.5
Total Implicit Guarantees 126.1 191.1 281.9 240.5 392.2 257.3 420.5
Outstanding Explicit Contingent Liabilities
Materialised Implicit Contingent Liabilities
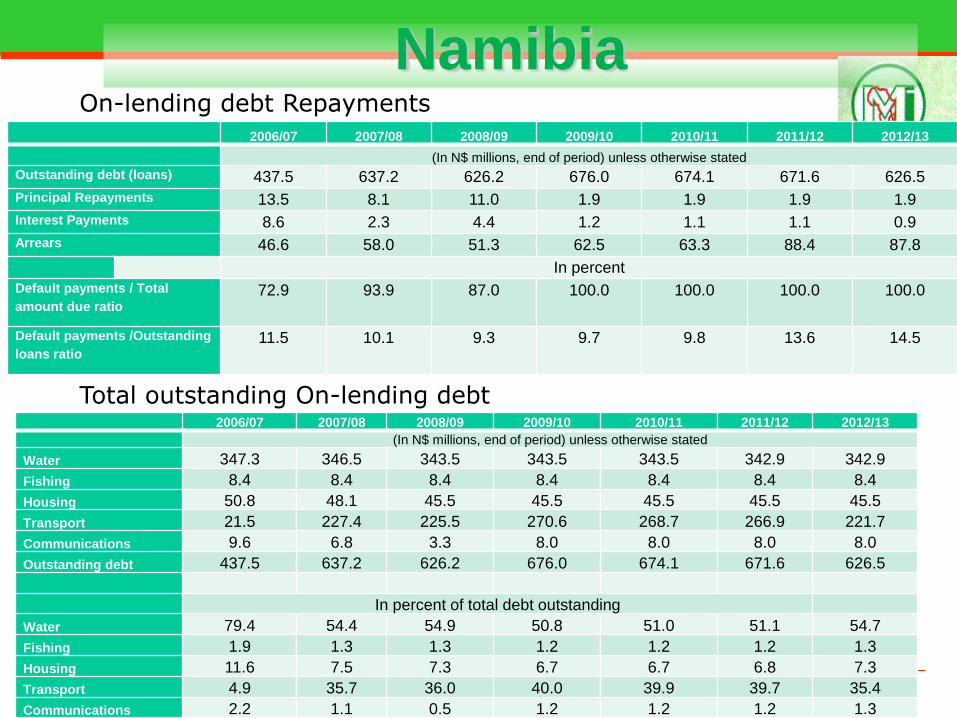
Namibia
2006/07 2007/08 2008/09 2009/10 2010/11 2011/12 2012/13
(In N$ millions, end of period) unless otherwise stated
Outstanding debt (loans) 437.5 637.2 626.2 676.0 674.1 671.6 626.5
Principal Repayments 13.5 8.1 11.0 1.9 1.9 1.9 1.9
Interest Payments 8.6 2.3 4.4 1.2 1.1 1.1 0.9
Arrears 46.6 58.0 51.3 62.5 63.3 88.4 87.8
In percent
Default payments / Total
amount due ratio72.9 93.9 87.0 100.0 100.0 100.0 100.0
Default payments /Outstanding
loans ratio11.5 10.1 9.3 9.7 9.8 13.6 14.5
On-lending debt Repayments
2006/07 2007/08 2008/09 2009/10 2010/11 2011/12 2012/13
(In N$ millions, end of period) unless otherwise stated
Water 347.3 346.5 343.5 343.5 343.5 342.9 342.9
Fishing 8.4 8.4 8.4 8.4 8.4 8.4 8.4
Housing 50.8 48.1 45.5 45.5 45.5 45.5 45.5
Transport 21.5 227.4 225.5 270.6 268.7 266.9 221.7
Communications 9.6 6.8 3.3 8.0 8.0 8.0 8.0
Outstanding debt 437.5 637.2 626.2 676.0 674.1 671.6 626.5
In percent of total debt outstanding
Water 79.4 54.4 54.9 50.8 51.0 51.1 54.7
Fishing 1.9 1.3 1.3 1.2 1.2 1.2 1.3
Housing 11.6 7.5 7.3 6.7 6.7 6.8 7.3
Transport 4.9 35.7 36.0 40.0 39.9 39.7 35.4
Communications 2.2 1.1 0.5 1.2 1.2 1.2 1.3
Total outstanding On-lending debt