Finding Thing Out: Geology/Earth History -...
103
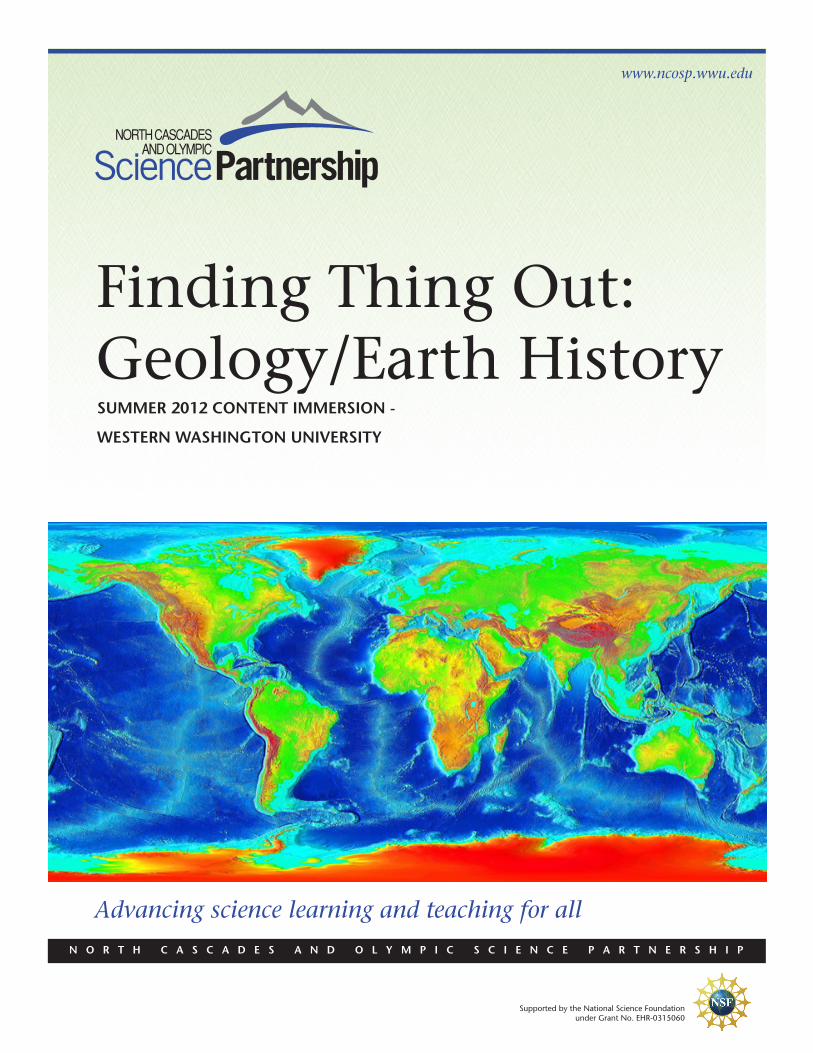
N O R T H C A S C A D E S A N D O L Y M P I C S C I E N C E P A R T N E R S H I P Supported by the National Science Foundation under Grant No. EHR-0315060 www.ncosp.wwu.edu SUMMER 2012 CONTENT IMMERSION - WESTERN WASHINGTON UNIVERSITY Advancing science learning and teaching for all Finding Thing Out: Geology/Earth History
Transcript of Finding Thing Out: Geology/Earth History -...
N O R T H C A S C A D E S A N D O L Y M P I C S C I E N C E P A R T N E R S H I P
Supported by the National Science Foundationunder Grant No. EHR-0315060
www.ncosp.wwu.edu
SUMMER 2012 CONTENT IMMERSION -
WESTERN WASHINGTON UNIVERSITY
Advancing science learning and teaching for all
Finding Thing Out: Geology/Earth History

!
SUMMER 2012 CONTENT IMMERSION How Do We Know About Earth’s History?
OVERVIEW In previous cycles, we investigated Earth systems and processes of change, but we have not established Earth’s age or the relative amounts of time necessary for these changes. We will find out that the rates of change are in many cases quantifiable. The ability to put ages on events and ultimately create a timeline has helped all scientific disciplines further their understanding of all living and non-living systems. In this cycle, we will examine how we can infer the order of events in Earth’s history, and how to put exact numbers on Earth events. INITIAL IDEAS Your group will need:
! Length of string (4 m long) ! Index cards with the Earth events written on them ! Paper clips
1. How old is the Earth? On your own, write your answer below. If you have specific evidence
for your answer, be sure to explain it in detail. ______________________________________________________________________________
______________________________________________________________________________
______________________________________________________________________________
2. With your group, organize the following list of major events in Earth history in order from
oldest to most recent. You will have cards at your table with these events listed on each to organize and reorganize as you discuss. Once you have a final order, record it below.
Extinction of Dinosaurs
First oxygen in the atmosphere
Oldest land plant fossils formed
First Homo Sapiens fossils formed
Formation of Earth
Your instructor is born
Atlantic Ocean first opens
Oldest fish fossils formed
Ice Age begins
Oldest dated crustal rocks formed
The first microfossils formed (blue-green algae)
Oldest land animal fossils formed
2
My Group’s Order of Events:
1.
2.
3.
4.
5.
6.
7.
8.
9.
10.
11.
12.
What evidence did you discuss to help you formulate your order? ________________________________________________________________________________________________________________________________________________________________________________________________________________________________________________________________________________________________________________________ My Group’s Spacing of Events: If you compared the age of Earth to an hour, with 0 minutes as the beginning of the Earth and 60 minutes as now, estimate when each event took place within the span of one hour.
Event Time (0 to 60 minutes) 1. 2. 3. 4. 5. 6. 7. 8. 9. 10. 11. 12.
When you are done with this estimate, place your events on a string, assuming the string represents your entire “hour” of Earth history. Make sure you place the events at the right “time”. KEEP THIS TIMELINE STRING POSTED UNTIL THE END OF THE CYCLE.
Place your ordered events and time onto a whiteboard and be ready to share your timeline with your class. Be sure to write down below any questions you would like answered during the course of this cycle.
Class Discussion
3
ACTIVITY 1: Relative Dating & Biostratigraphy PURPOSE In this activity we will start thinking about how Earth has changed over time, and when those changes may have occurred. For example, we’ve all heard of the extinction of the dinosaurs. But when did that extinction happen? Was it before the super-continent of Pangea broke up? Was it before the ice age? How would we figure out the relative timing? We’ll learn in this activity the basic tools that geologists use to figure out a relative time scale for Earth events. Q. How do we know that the Earth has changed over time? Can Earth be “read” like an open book? Can a geologic history of an area be inferred by looking at rocks? !EXPERIMENT 1. Principles of Relative Dating INITIAL IDEAS!
1. Have you ever noticed layers of rock exposed in a beach cliff? In a road cut? In a canyon cut by a river? Describe what you saw and make a sketch in the space below.
4
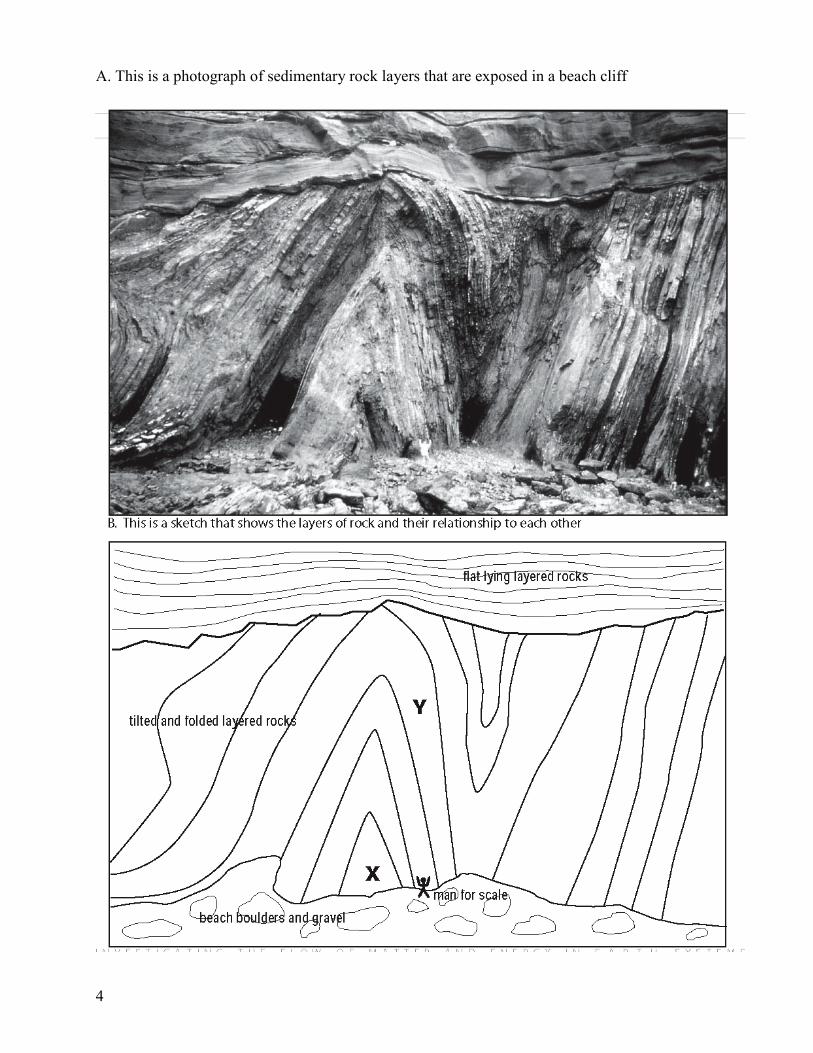
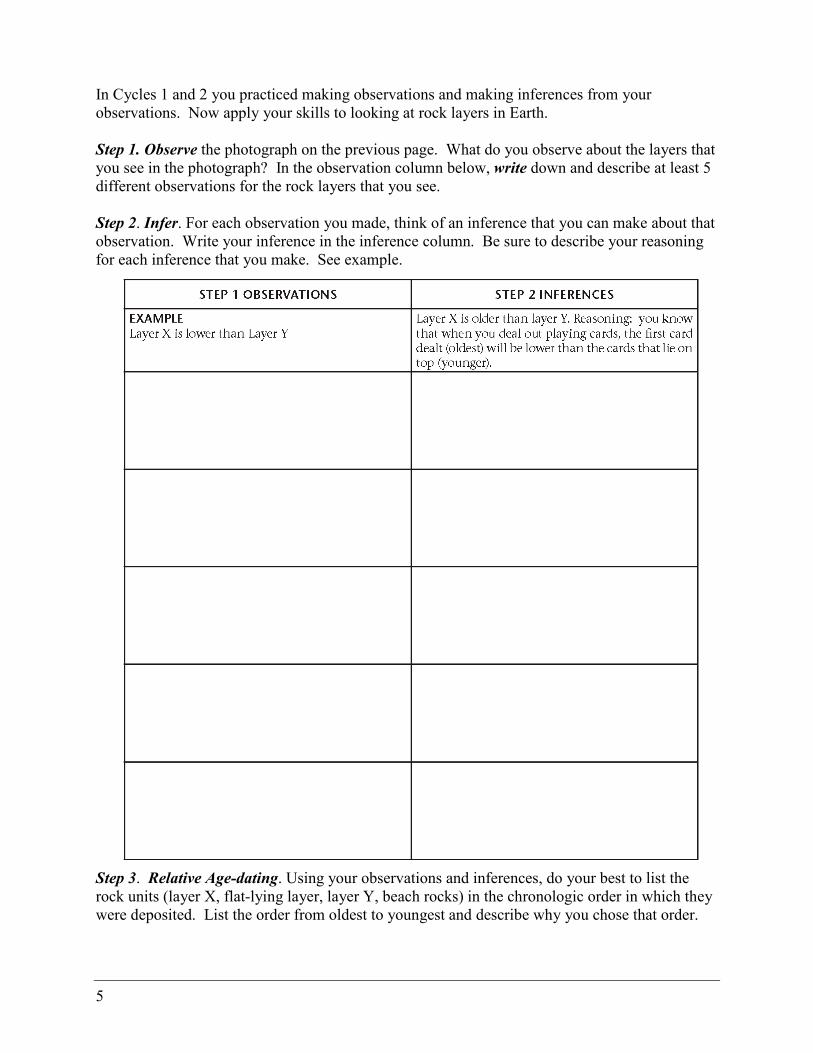
A. This is a photograph of sedimentary rock layers that are exposed in a beach cliff
5
In Cycles 1 and 2 you practiced making observations and making inferences from your observations. Now apply your skills to looking at rock layers in Earth. Step 1. Observe the photograph on the previous page. What do you observe about the layers that you see in the photograph? In the observation column below, write down and describe at least 5 different observations for the rock layers that you see. Step 2. Infer. For each observation you made, think of an inference that you can make about that observation. Write your inference in the inference column. Be sure to describe your reasoning for each inference that you make. See example.
Step 3. Relative Age-dating. Using your observations and inferences, do your best to list the rock units (layer X, flat-lying layer, layer Y, beach rocks) in the chronologic order in which they were deposited. List the order from oldest to youngest and describe why you chose that order.
6
A
B
C
Rock B
C
D
E D Fault
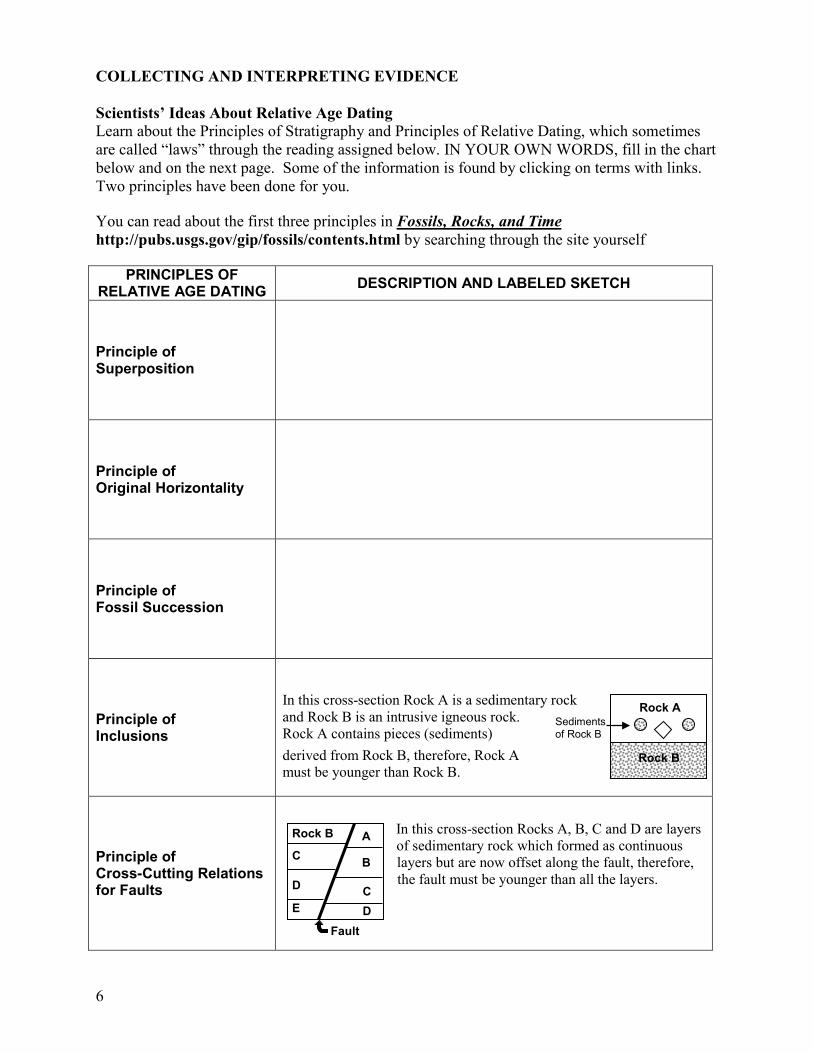
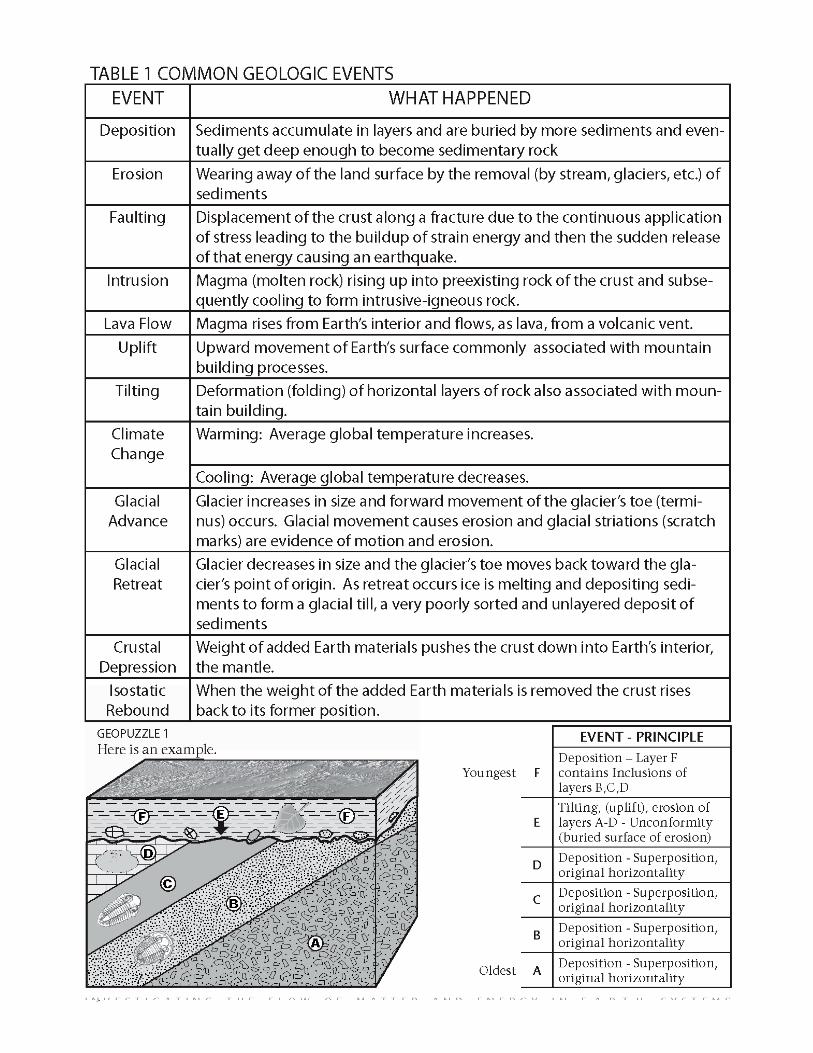
COLLECTING AND INTERPRETING EVIDENCE Scientists’ Ideas About Relative Age Dating Learn about the Principles of Stratigraphy and Principles of Relative Dating, which sometimes are called “laws” through the reading assigned below. IN YOUR OWN WORDS, fill in the chart below and on the next page. Some of the information is found by clicking on terms with links. Two principles have been done for you. You can read about the first three principles in Fossils, Rocks, and Time http://pubs.usgs.gov/gip/fossils/contents.html by searching through the site yourself
PRINCIPLES OF RELATIVE AGE DATING DESCRIPTION AND LABELED SKETCH
Principle of Superposition
Principle of Original Horizontality
Principle of Fossil Succession
Principle of Inclusions
In this cross-section Rock A is a sedimentary rock and Rock B is an intrusive igneous rock. Rock A contains pieces (sediments) derived from Rock B, therefore, Rock A must be younger than Rock B.
Principle of Cross-Cutting Relations for Faults
In this cross-section Rocks A, B, C and D are layers of sedimentary rock which formed as continuous layers but are now offset along the fault, therefore, the fault must be younger than all the layers.
Rock A
Rock B
Sediments of Rock B
7
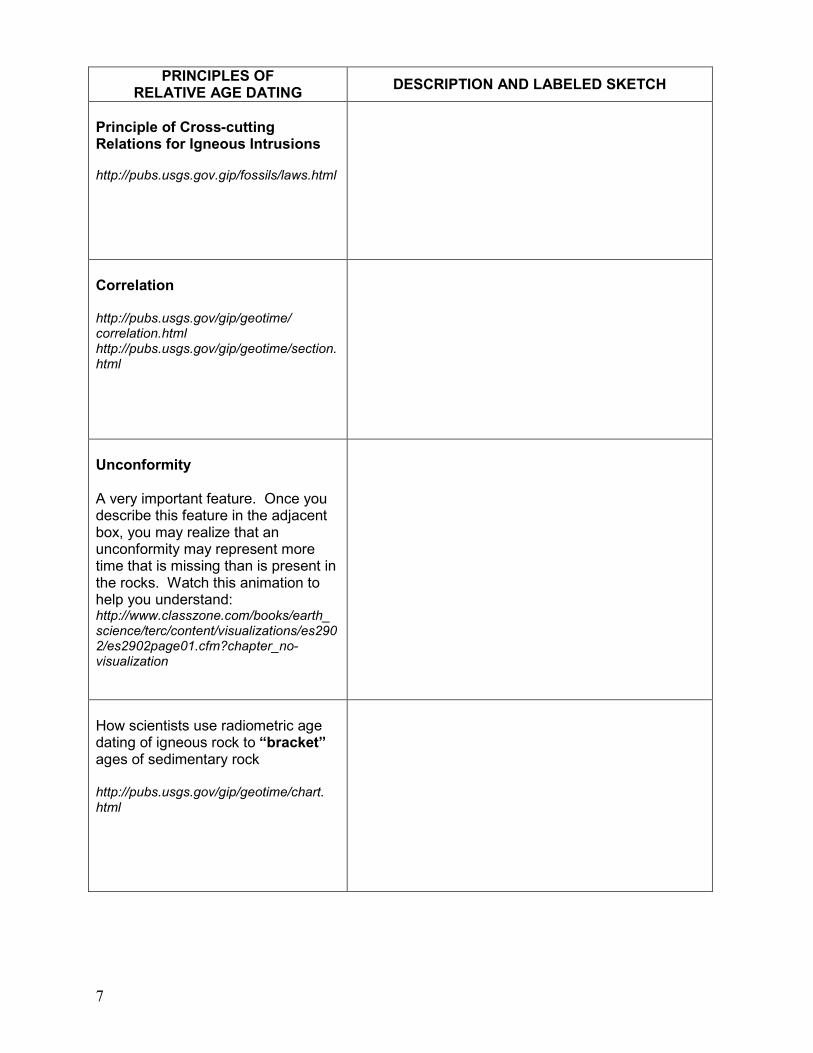
PRINCIPLES OF RELATIVE AGE DATING DESCRIPTION AND LABELED SKETCH
Principle of Cross-cutting Relations for Igneous Intrusions http://pubs.usgs.gov.gip/fossils/laws.html
Correlation http://pubs.usgs.gov/gip/geotime/ correlation.html http://pubs.usgs.gov/gip/geotime/section.html
Unconformity A very important feature. Once you describe this feature in the adjacent box, you may realize that an unconformity may represent more time that is missing than is present in the rocks. Watch this animation to help you understand: http://www.classzone.com/books/earth_ science/terc/content/visualizations/es2902/es2902page01.cfm?chapter_no-visualization
How scientists use radiometric age dating of igneous rock to “bracket” ages of sedimentary rock http://pubs.usgs.gov/gip/geotime/chart. html
8
Class discussion: Your instructor will assign your group one of the principles to whiteboard and share with the class. Write down below or in your table on the previous pages any new information you learned about these principles
Class Discussion
9
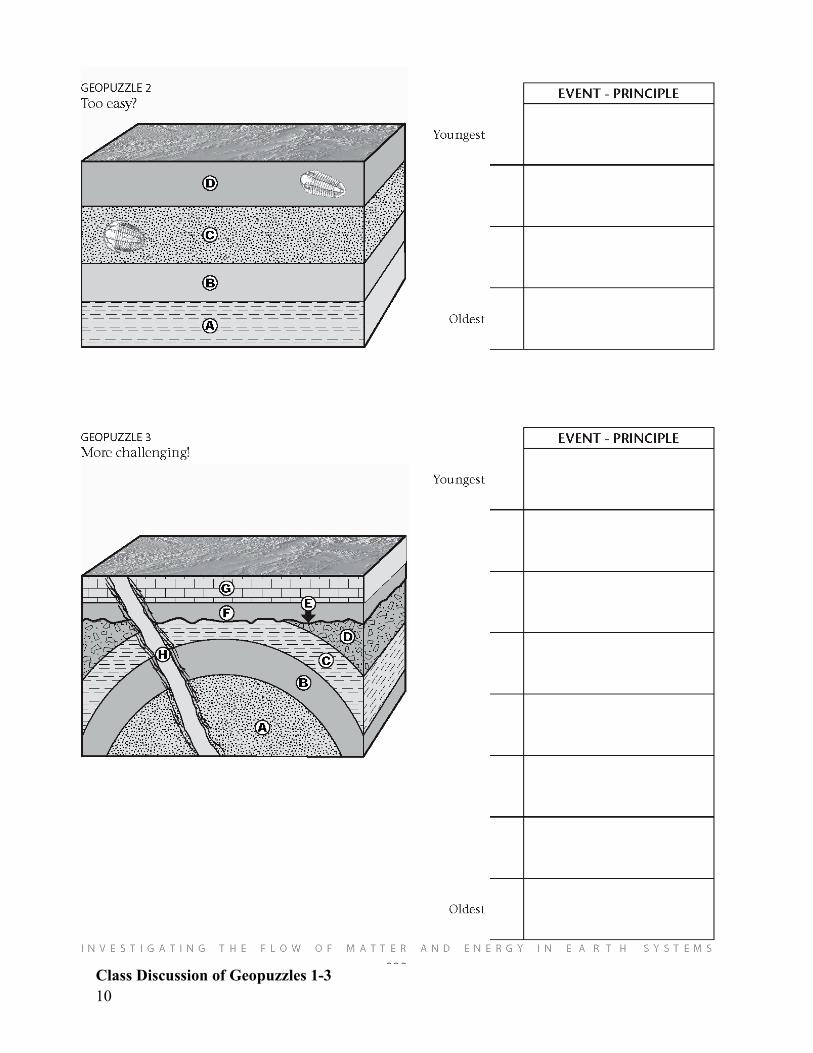
10 Class Discussion of Geopuzzles 1-3
11
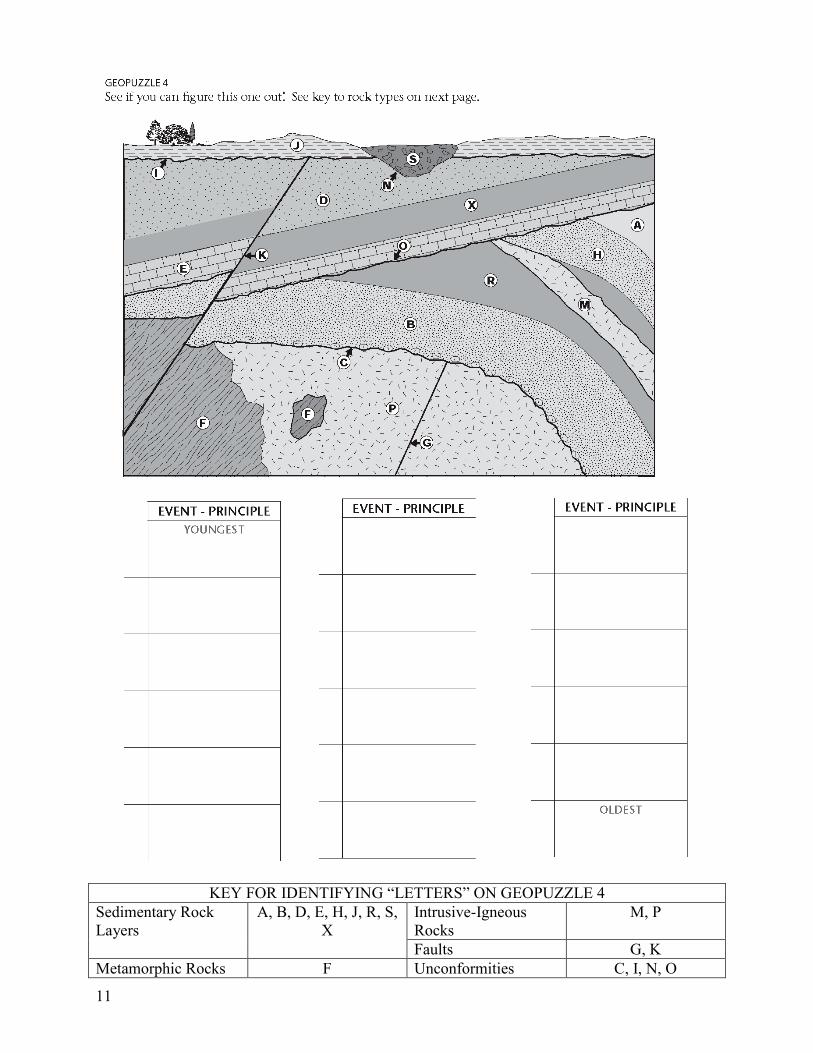
KEY FOR IDENTIFYING “LETTERS” ON GEOPUZZLE 4 Sedimentary Rock Layers
A, B, D, E, H, J, R, S, X
Intrusive-Igneous Rocks
M, P
Faults G, K Metamorphic Rocks F Unconformities C, I, N, O
12
Class discussion: Your instructor will ask you to whiteboard your geopuzzle 4 results. Write down below any changes to your understanding after the group and class discussion.
SUMMARIZING QUESTIONS
Revisit Step 3 from Initial Ideas Relative Age Dating for the Rock Units shown in the photograph Apply what you have learned about the Principles of Relative Dating. Write down the chronologic order of events that took place in order to form the sequence that you see in the beach cliff photograph from the initial ideas. Describe the principles that you used as evidence.
Did your ideas about chronologic order change from your initial ideas? If not the order, how about your evidence? Explain how your ideas changed or how they did not change.
Class Discussion
13
EXPERIMENT 2: Using fossils for relative dating and correlation of rock units PURPOSE: In Part 1 of this Activity, we saw that stratigraphy allows us to determine the relative ages of sedimentary rocks. However, we can also use fossils to help us with relative ages. Throughout time, the remains of living organisms have been buried and included in sedimentary rocks. They are then preserved as fossils. If we can observe and describe the fossil evidence, then we can make inferences about relative ages of rock outcrops in different locations. In this activity, we will use fossils to match ages of rock outcrops separated by large geographic distances. Q. How can we use fossils to correlate ages of rocks in different locations? INITIAL IDEAS We can use the type of sediments in sedimentary rock to say something about the environment where those sediments formed. What are some places where you have seen sediments being deposited? ________________________________________________________________________________________________________________________________________________________________________________________________________________ ________________________________________________________________________________________________________
14
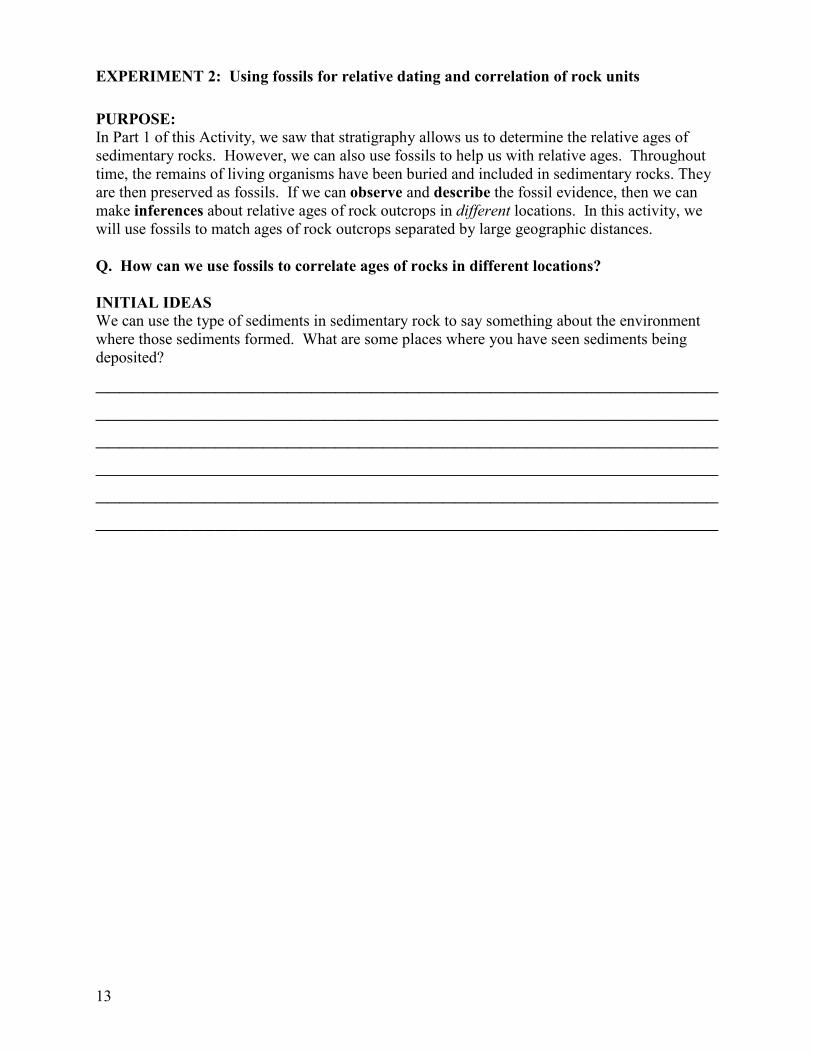
Imagine sediments being deposited on the deep ocean floor. What kind of organisms or remains of organisms might you find in these sediments? ________________________________________________________________________________________________________________________________________________________________________________________________________________ ________________________________________________________________________________________________________ Imagine you are examining some sedimentary rock layers and you infer that they formed on the ocean floor. You see skeletons of microscopic marine organisms (plankton) in some of these layers. How do you think those fossils got there? ________________________________________________________________________________________________________________________________________________________________________________________________________________ ________________________________________________________________________________________________________ We know how to compare one layer of rock to another from Part 1 of this activity. How do you think scientists could use the fossil remains in the rock to compare layers in the rock? ________________________________________________________________________________________________________________________________________________________________________________________________________________ ________________________________________________________________________________________________________
15
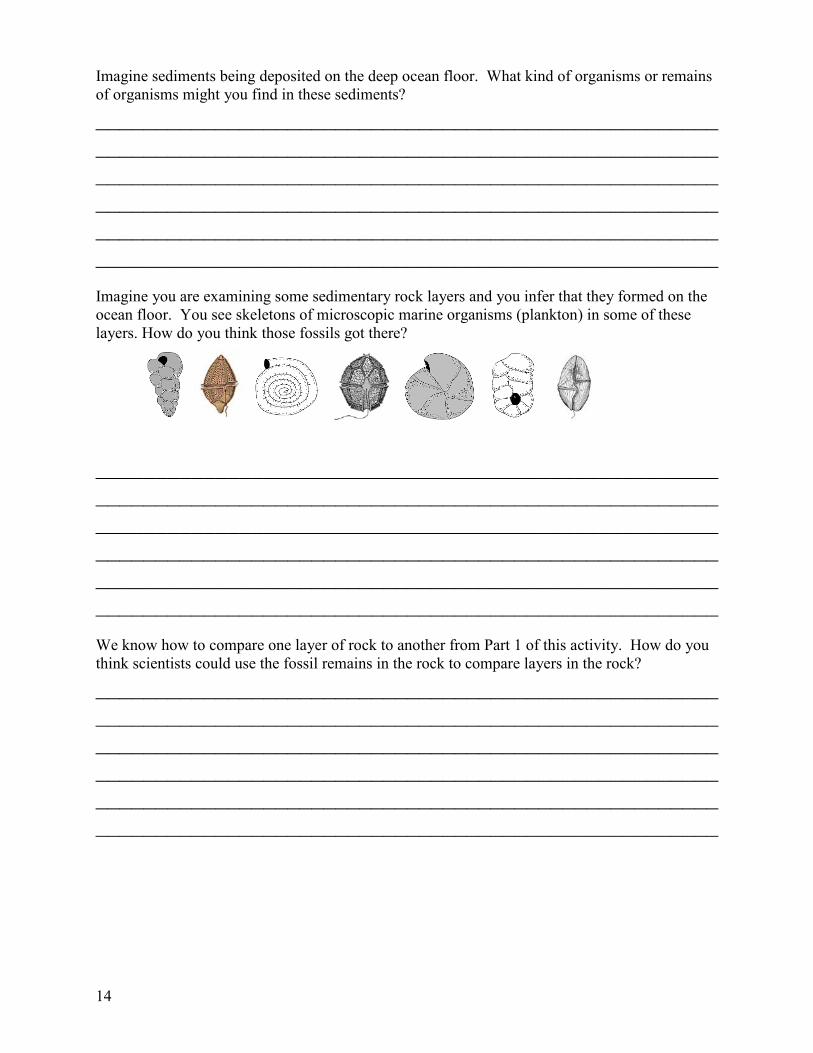
USEFUL BACKGROUND INFORMATION Small plankton with thin shells live near the surface of the ocean (where there’s light). Some species of plankton can be found over vast areas of the ocean surface because the environment is uniform and ocean currents can transport the plankton long distances. When plankton die, their shells settle to the seafloor to become part of the sediment that is deposited on the sea floor. Despite being thin and small, the shells of these plankton can be preserved in the low energy environment of the seafloor. COLLECTING AND INTERPRETING EVIDENCE Q. Can we determine whether layers of marine sedimentary rock found in Colorado are the same age as marine sedimentary layers in Texas?
Do you think it is possible that the same kind of plankton fossils are preserved in these marine rocks in Colorado and Texas? Explain your thinking. ________________________________________________________________________________________________________________________________________________________________________________________________________________ ________________________________________________________________________________________________________
Texas Colorado
= ?
16
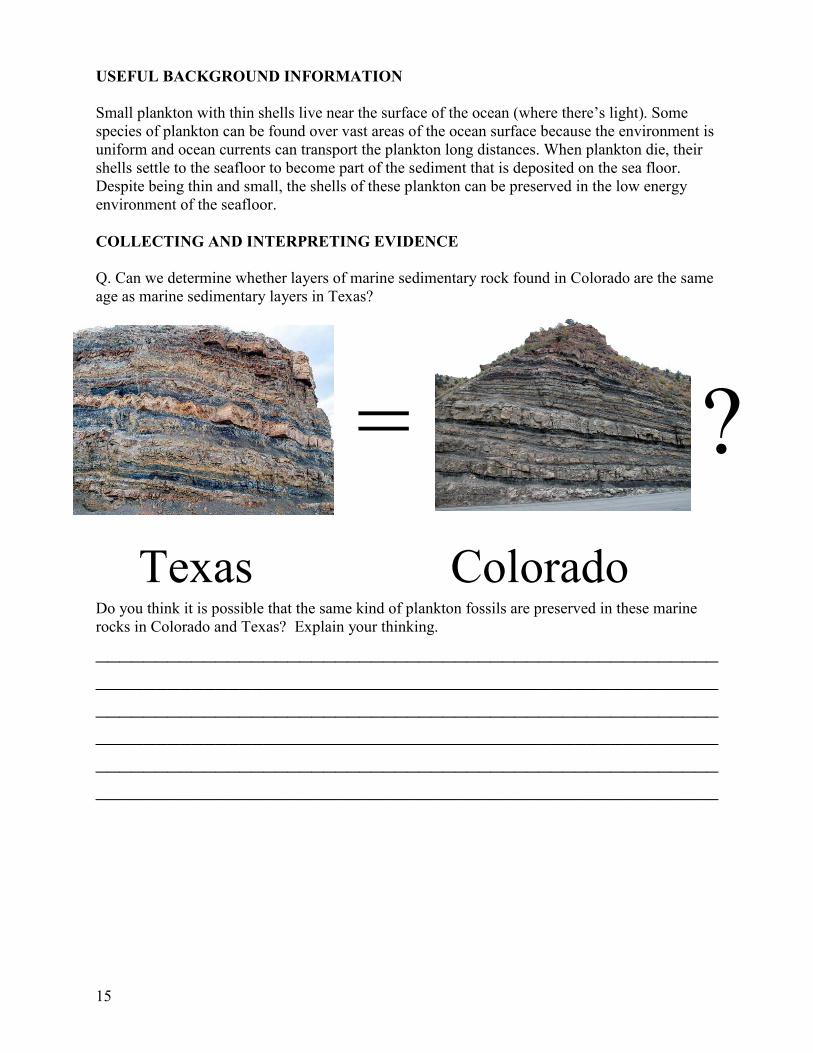
If there are fossils preserved in these rocks, why might a particular fossil species appear in some layers and not in others (i.e., the middle but not the top or bottom)? See if you can think of 2 or 3 reasons. ________________________________________________________________________________________________________________________________________________________________________________________________________________ Imagine that a particular fossil species is found in all the layers from both states. Can you infer that the formations are the same age? Why or why not? ________________________________________________________________________________________________________________________________________________________________________________________________________________ Fossils that represent organisms that lived only for limited time in the past are called “index fossils”. The process is called “biostratigraphy” because biological remains allow us to link rocks that are otherwise very different in location or appearance. You compare the Texas outcrop to the outcrop in Colorado. An index fossil called dinoflagellate U is found in sedimentary layers only above the white line in the Texas outcrop (show below in Figure A1.1), but only below the white line in the Colorado outcrop. Figure A1.1
Dinoflagellate “U”
Texas Colorado
17
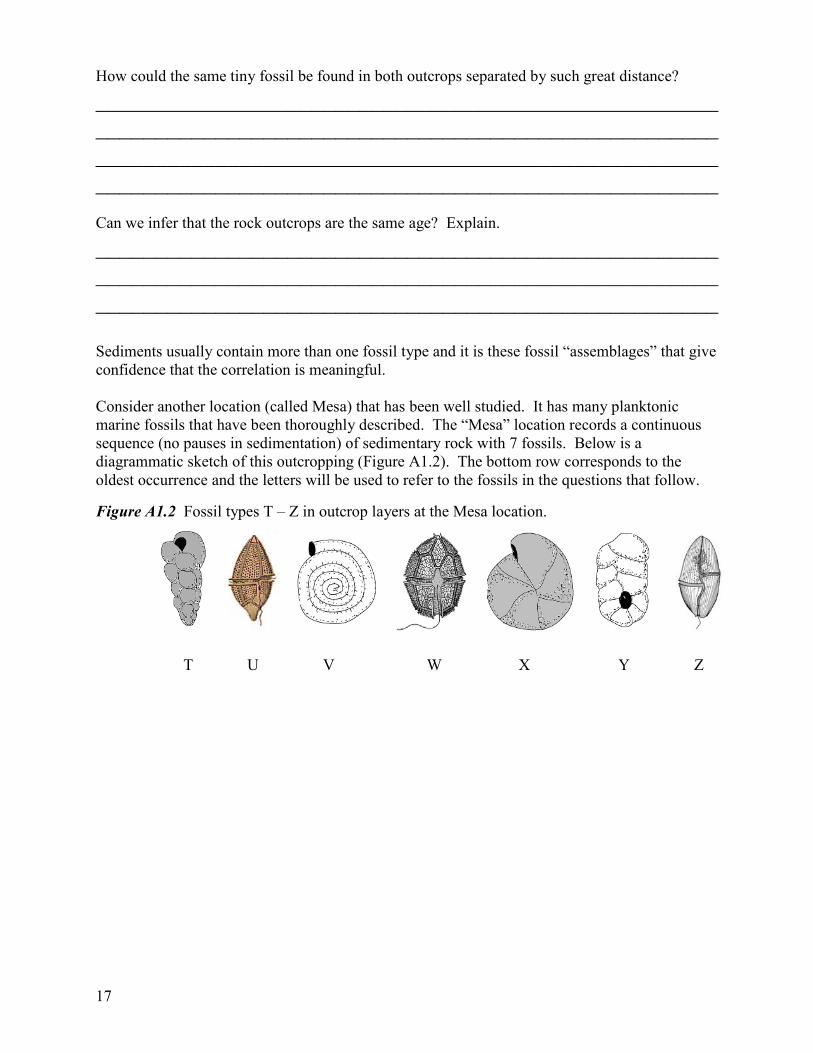
How could the same tiny fossil be found in both outcrops separated by such great distance? ________________________________________________________________________________________________________________________________________________________________________________________________________________ Can we infer that the rock outcrops are the same age? Explain. ____________________________________________________________________________________________________________________________________________________________ Sediments usually contain more than one fossil type and it is these fossil “assemblages” that give confidence that the correlation is meaningful. Consider another location (called Mesa) that has been well studied. It has many planktonic marine fossils that have been thoroughly described. The “Mesa” location records a continuous sequence (no pauses in sedimentation) of sedimentary rock with 7 fossils. Below is a diagrammatic sketch of this outcropping (Figure A1.2). The bottom row corresponds to the oldest occurrence and the letters will be used to refer to the fossils in the questions that follow.
Figure A1.2 Fossil types T – Z in outcrop layers at the Mesa location.
T U V W X Y Z
18
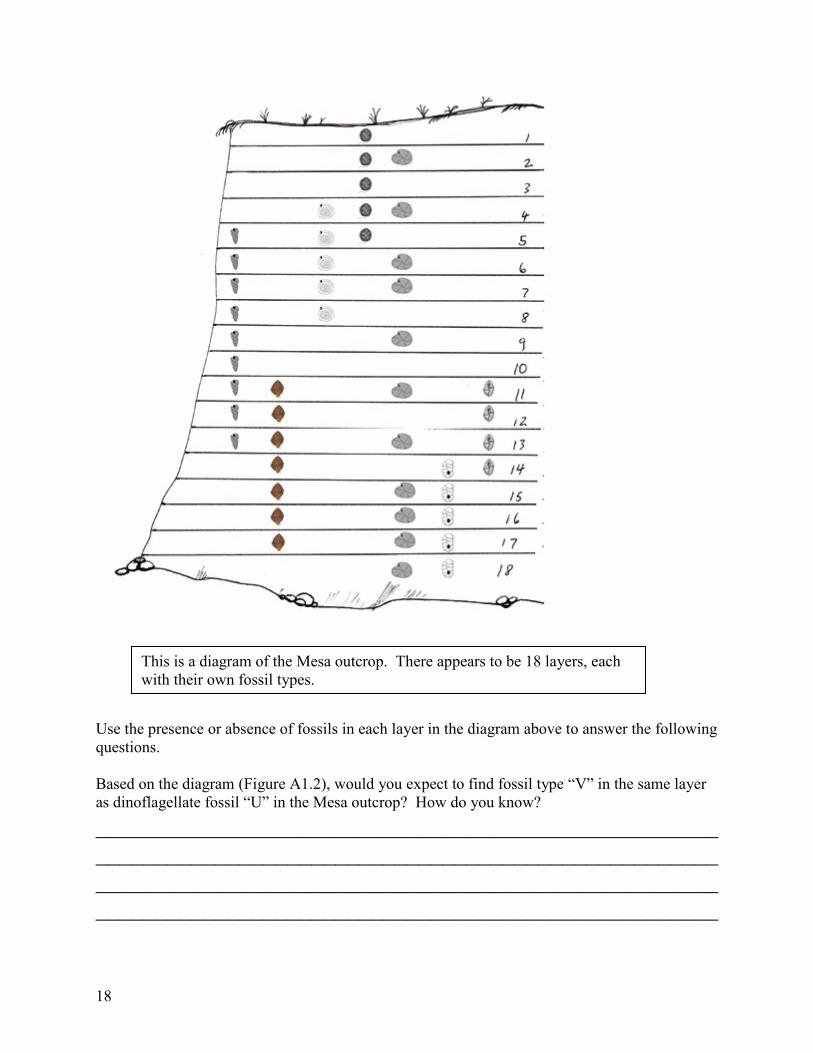
Use the presence or absence of fossils in each layer in the diagram above to answer the following questions. Based on the diagram (Figure A1.2), would you expect to find fossil type “V” in the same layer as dinoflagellate fossil “U” in the Mesa outcrop? How do you know? ________________________________________________________________________________________________________________________________________________________________________________________________________________
This is a diagram of the Mesa outcrop. There appears to be 18 layers, each with their own fossil types.
19
Now, given what is observed at the Mesa outcrop in Figure A1.2, can you predict what fossils are likely to be found with dinoflagellate “U” in the Texas outcrop in Figure A1.1?(note that the white line in the Texas outcrop is the uppermost layer that the dinoflagellate is found) ________________________________________________________________________________________________________________________________________________________________________________________________________________ Can you predict which fossils are likely to be found with dinoflagellate “U” in the Colorado outcrop in Figure A1.1? ________________________________________________________________________________________________________________________________________________________________________________________________________________ Why might the fossils found with the dinoflagellate “U” in the Texas outcrop differ from those with the dinoflagellate “U” in the Colorado outcrop? (use Figure A1.2 for this!) ____________________________________________________________________________________________________________________________________________________________ By comparing marine rocks from many different locations scientists determine that both species X and Z are very geographically widespread. Does X or Z make the better fossil to compare ages of outcrops? Why? ________________________________________________________________________________________________________________________________________________________________________________________________________________ In the Mesa outcrop in Figure A1.2, how many layers contain both T and U?_____, both V and W? _____, both T and Z?_____ . If each layer represents the same amount of time, what combination(s) represents the least amount time? ____________________________________________________________________________________________________________________________________________________________
20
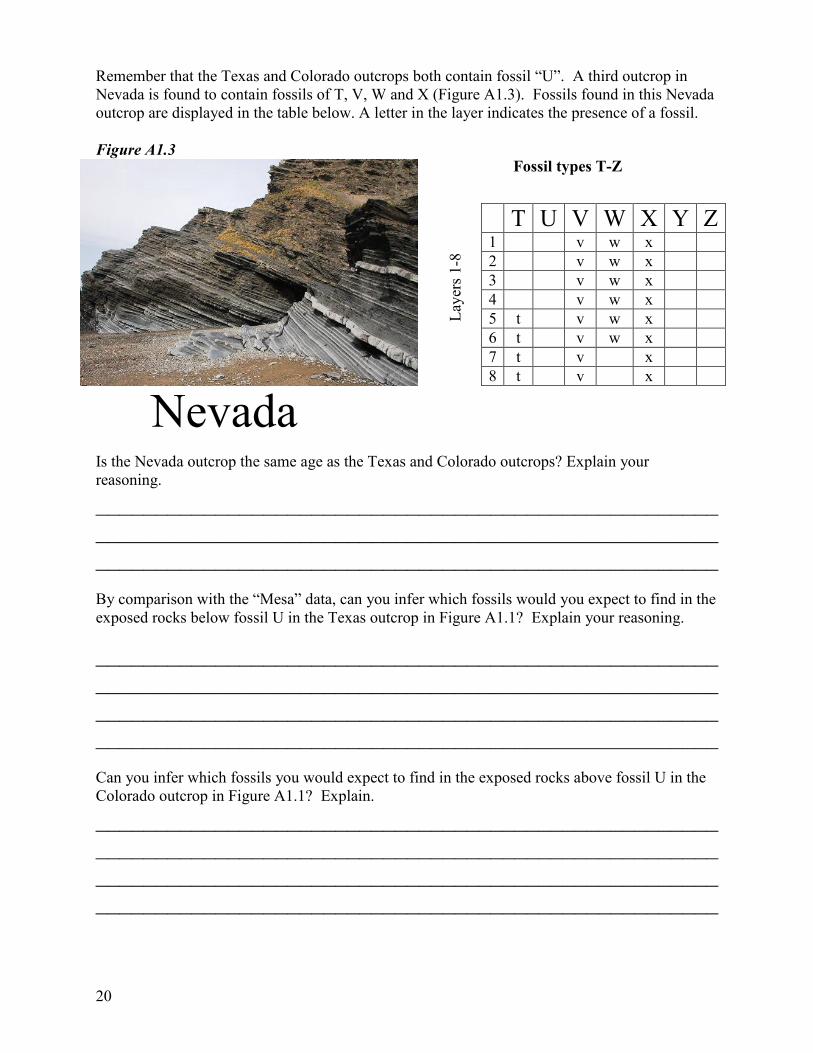
Remember that the Texas and Colorado outcrops both contain fossil “U”. A third outcrop in Nevada is found to contain fossils of T, V, W and X (Figure A1.3). Fossils found in this Nevada outcrop are displayed in the table below. A letter in the layer indicates the presence of a fossil. Figure A1.3 Is the Nevada outcrop the same age as the Texas and Colorado outcrops? Explain your reasoning. ____________________________________________________________________________________________________________________________________________________________ By comparison with the “Mesa” data, can you infer which fossils would you expect to find in the exposed rocks below fossil U in the Texas outcrop in Figure A1.1? Explain your reasoning.
________________________________________________________________________________________________________________________________________________________________________________________________________________ Can you infer which fossils you would expect to find in the exposed rocks above fossil U in the Colorado outcrop in Figure A1.1? Explain. ________________________________________________________________________________________________________________________________________________________________________________________________________________
T U V W X Y Z 1 v w x 2 v w x 3 v w x 4 v w x 5 t v w x 6 t v w x 7 t v x 8 t v x
Nevada La
yers
1-8
Fossil types T-Z
21
SUMMARIZING QUESTIONS Why might biostratigraphy have been important to geologists and paleontologists before the discovery of absolute dating techniques (using the decay of radioactive isotopes for example)? ________________________________________________________________________________________________________________________________________________________________________________________________________________ In what circumstances might biostratigraphy still be useful today? ________________________________________________________________________________________________________________________________________________________________________________________________________________
Class Discussion: With your group, sketch and describe on your whiteboard how you used the Mesa outcrop to determine the relative ages of the outcrops in Texas, Colorado, and Nevada.
Your facilitator will lead a class discussion. Write down below any new understanding you gained during this discussion.
Class Discussion
22
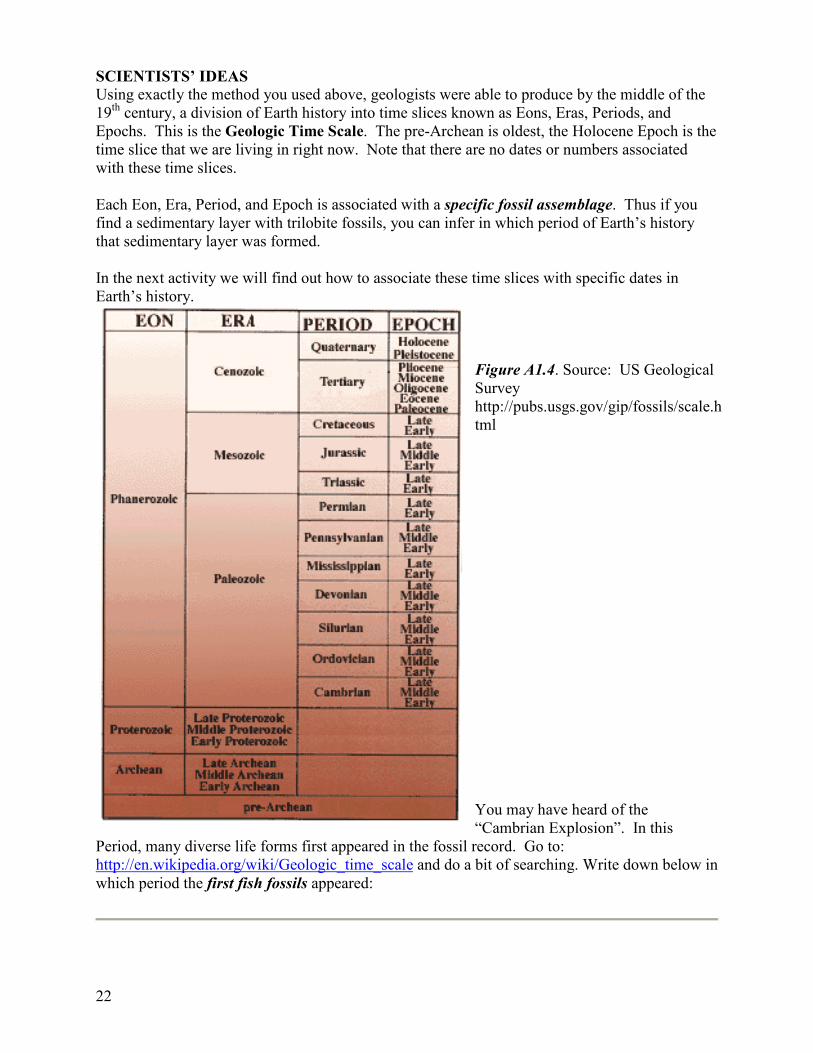
SCIENTISTS’ IDEAS Using exactly the method you used above, geologists were able to produce by the middle of the 19th century, a division of Earth history into time slices known as Eons, Eras, Periods, and Epochs. This is the Geologic Time Scale. The pre-Archean is oldest, the Holocene Epoch is the time slice that we are living in right now. Note that there are no dates or numbers associated with these time slices. Each Eon, Era, Period, and Epoch is associated with a specific fossil assemblage. Thus if you find a sedimentary layer with trilobite fossils, you can infer in which period of Earth’s history that sedimentary layer was formed. In the next activity we will find out how to associate these time slices with specific dates in Earth’s history.
Figure A1.4. Source: US Geological Survey http://pubs.usgs.gov/gip/fossils/scale.html
You may have heard of the “Cambrian Explosion”. In this
Period, many diverse life forms first appeared in the fossil record. Go to: http://en.wikipedia.org/wiki/Geologic_time_scale and do a bit of searching. Write down below in which period the first fish fossils appeared:
23
ACTIVITY 2: Early Attempts at Absolute Dating of Age of Earth PURPOSE So far we have worked with relative dating where we know one layer is older than another because of their position. Early geologists used this method extensively, but when it came to saying how old Earth was, they generally agreed with James Hutton (1726-1797, AKA the 'founder of modern geology) who said he saw "no vestige of a beginning, no prospect of an end". By the mid-19th century, though, geologists and physicists tried to apply their understanding of rates of physical processes to infer how long those processes might have been active. In this activity you will use estimates for the rates of three specific processes: sedimentary rocks and sedimentation rates, salinity of the oceans and salinization rates, and geothermal gradient (temperature increase with depth) and cooling of Earth. You will use these features and rates to try to determine an actual number of years for the age of Earth. By the way, this is also a great story about how scientific ideas change over time due to new observations, new ways of thinking, and new technologies. Q. How can we use rates of Earth processes to determine the age of the Earth? INITIAL IDEAS How old do you think Earth is? ________________________________________________________________________________________________________________________________________________________________________________________________________________ How do you think scientists determine the absolute age of Earth? What evidence or examples do you have to support your thinking? ________________________________________________________________________________________________________________________________________________________________________________________________________________ COLLECTING AND INTERPRETING EVIDENCE Early attempts at absolute dating Earth’s age using rates – Jigsaw Activity Directions For this jigsaw activity, you will be placed into Home Groups of 3 students. You will then join a Specialty Group that will explore one of the three early methods for determining the age of the Earth (Sedimentation rates, Salinization rates or Heat Loss). Your role in the Specialty Group will be to become an expert on one particular method by completing the appropriate section below. Once all your group members have become experts on the method used to
24
calculate the absolute age of the Earth, you will return to your Home Group. You will then share your ideas in this heterogeneous group so that everyone in class understands the different methods used as early attempts to give an absolute age to the Earth. After all group members have had the opportunity to share their expertise you will complete the final section of this experiment discussing possible sources of error. Finally, we will end this activity with a classroom discussion.
EXPERIMENT 1: Calculating the age of the Earth from Sedimentation Rates
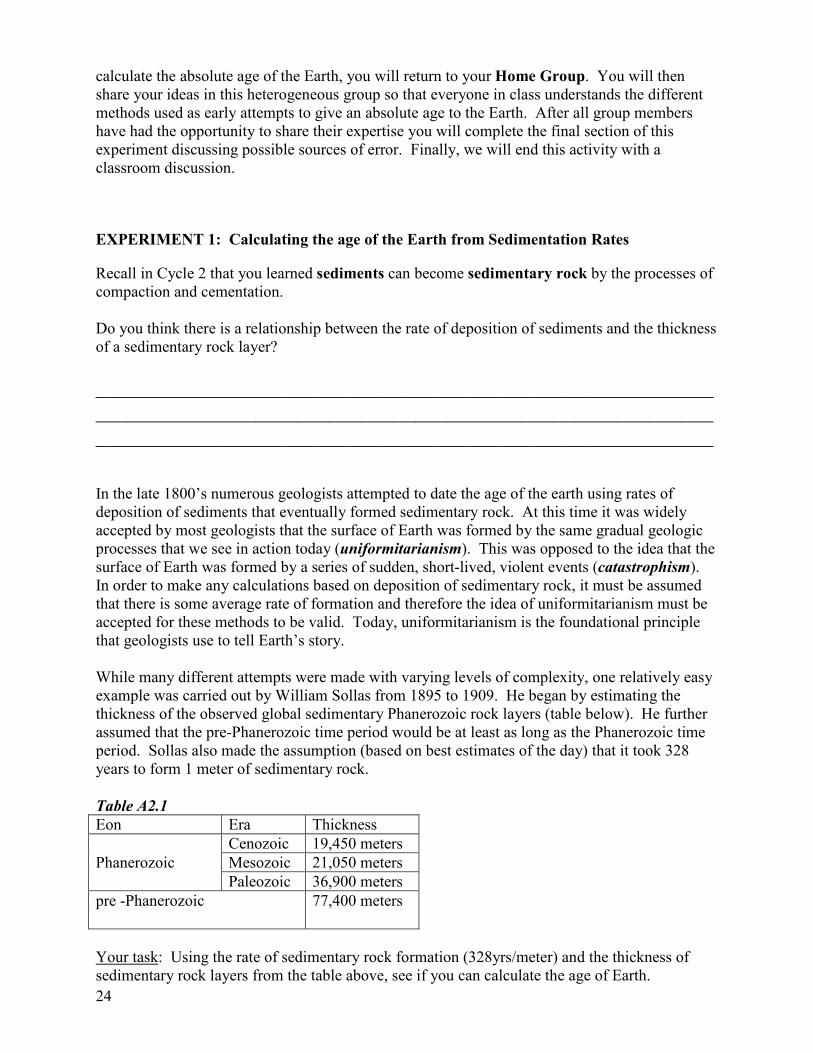
Recall in Cycle 2 that you learned sediments can become sedimentary rock by the processes of compaction and cementation. Do you think there is a relationship between the rate of deposition of sediments and the thickness of a sedimentary rock layer? ______________________________________________________________________________________________________________________________________________________________________________ In the late 1800’s numerous geologists attempted to date the age of the earth using rates of deposition of sediments that eventually formed sedimentary rock. At this time it was widely accepted by most geologists that the surface of Earth was formed by the same gradual geologic processes that we see in action today (uniformitarianism). This was opposed to the idea that the surface of Earth was formed by a series of sudden, short-lived, violent events (catastrophism). In order to make any calculations based on deposition of sedimentary rock, it must be assumed that there is some average rate of formation and therefore the idea of uniformitarianism must be accepted for these methods to be valid. Today, uniformitarianism is the foundational principle that geologists use to tell Earth’s story. While many different attempts were made with varying levels of complexity, one relatively easy example was carried out by William Sollas from 1895 to 1909. He began by estimating the thickness of the observed global sedimentary Phanerozoic rock layers (table below). He further assumed that the pre-Phanerozoic time period would be at least as long as the Phanerozoic time period. Sollas also made the assumption (based on best estimates of the day) that it took 328 years to form 1 meter of sedimentary rock. Table A2.1 Eon Era Thickness
Phanerozoic Cenozoic 19,450 meters Mesozoic 21,050 meters Paleozoic 36,900 meters
pre -Phanerozoic 77,400 meters
Your task: Using the rate of sedimentary rock formation (328yrs/meter) and the thickness of sedimentary rock layers from the table above, see if you can calculate the age of Earth.
25
You will first need to calculate the overall thickness of sedimentary rock that Sollas measured.
Total thickness (in meters) of sedimentary rock: _______________________
His calculation for the age of Earth was: ___________ meters x _______ years/meter = __________ years
With this information, Sollas was able to estimate the age of the Earth to be around 51 million years. Now you will get a chance to try this in another region – from the sequence of rocks in the Grand Canyon.
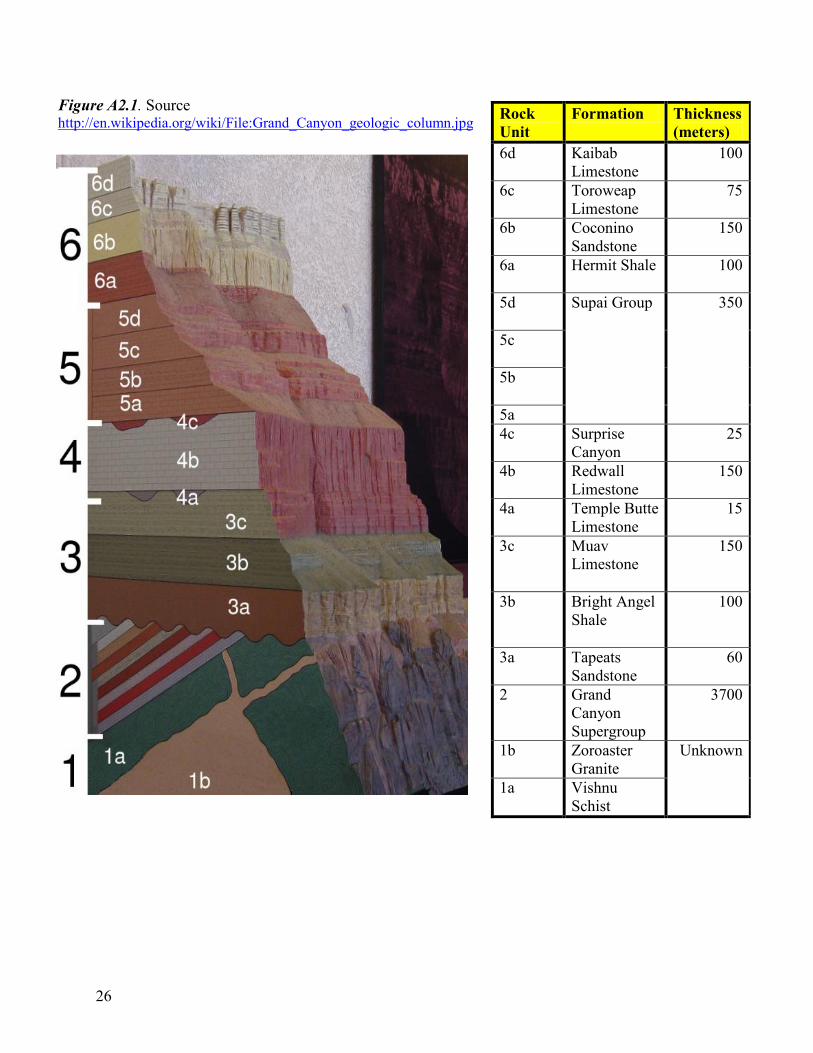
The Grand Canyon is made up of many layers of rock that are several kilometers thick. Fossils in these rocks and other correlational arguments suggest that rocks at the bottom of the Grand Canyon were formed in the pre-Phanerozoic and rocks at the top were deposited in the Permian Period (go back to Figure A1.4 for time scale names). This means that the rocks were deposited over a very long span of time, but still relatively short compared to the total age of Earth. Let us use the principles that Sollas used to come up with a minimum of just how much time it took for these layers in the Grand Canyon to be formed. This small portion of Earth history gives us another minimum age of Earth. The diagram and table below contains information about the layers of rock in the Grand Canyon. Use this information to complete the activities.
26
Rock Unit
Formation Thickness (meters)
6d Kaibab Limestone
100
6c Toroweap Limestone
75
6b Coconino Sandstone
150
6a
Hermit Shale 100
5d
Supai Group 350
5c 5b 5a 4c Surprise
Canyon 25
4b
Redwall Limestone
150
4a Temple Butte Limestone
15
3c
Muav Limestone
150
3b
Bright Angel Shale
100
3a
Tapeats Sandstone
60
2
Grand Canyon Supergroup
3700
1b Zoroaster Granite
Unknown
1a
Vishnu Schist
Figure A2.1. Source http://en.wikipedia.org/wiki/File:Grand_Canyon_geologic_column.jpg
27
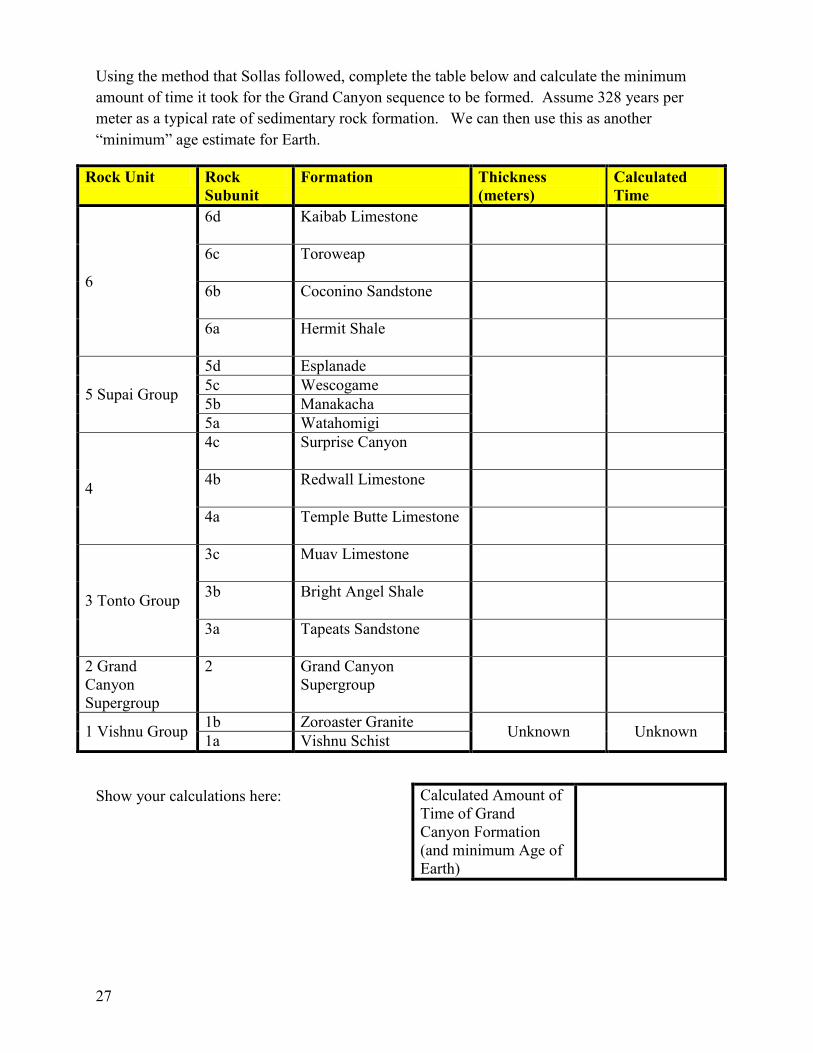
Using the method that Sollas followed, complete the table below and calculate the minimum amount of time it took for the Grand Canyon sequence to be formed. Assume 328 years per meter as a typical rate of sedimentary rock formation. We can then use this as another “minimum” age estimate for Earth.
Rock Unit Rock Subunit
Formation Thickness (meters)
Calculated Time
6
6d Kaibab Limestone
6c Toroweap
6b Coconino Sandstone
6a Hermit Shale
5 Supai Group
5d Esplanade 5c Wescogame 5b Manakacha 5a Watahomigi
4
4c Surprise Canyon
4b Redwall Limestone
4a Temple Butte Limestone
3 Tonto Group
3c Muav Limestone
3b Bright Angel Shale
3a Tapeats Sandstone
2 Grand Canyon Supergroup
2 Grand Canyon Supergroup
1 Vishnu Group 1b Zoroaster Granite Unknown Unknown 1a Vishnu Schist Show your calculations here:
Calculated Amount of Time of Grand Canyon Formation (and minimum Age of Earth)
28
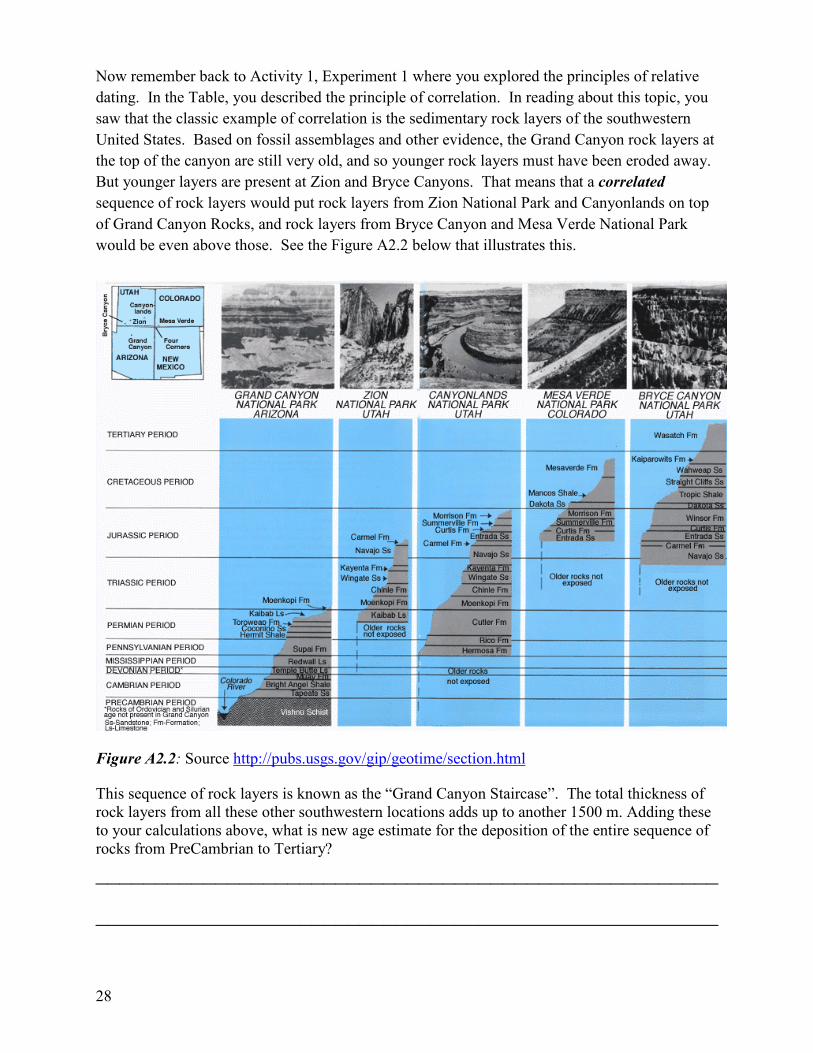
Now remember back to Activity 1, Experiment 1 where you explored the principles of relative dating. In the Table, you described the principle of correlation. In reading about this topic, you saw that the classic example of correlation is the sedimentary rock layers of the southwestern United States. Based on fossil assemblages and other evidence, the Grand Canyon rock layers at the top of the canyon are still very old, and so younger rock layers must have been eroded away. But younger layers are present at Zion and Bryce Canyons. That means that a correlated sequence of rock layers would put rock layers from Zion National Park and Canyonlands on top of Grand Canyon Rocks, and rock layers from Bryce Canyon and Mesa Verde National Park would be even above those. See the Figure A2.2 below that illustrates this.
Figure A2.2: Source http://pubs.usgs.gov/gip/geotime/section.html This sequence of rock layers is known as the “Grand Canyon Staircase”. The total thickness of rock layers from all these other southwestern locations adds up to another 1500 m. Adding these to your calculations above, what is new age estimate for the deposition of the entire sequence of rocks from PreCambrian to Tertiary? ____________________________________________________
____________________________________________________
29
____________________________________________________
____________________________________________________ Reflection 1. Are you surprised by the numbers your group has arrived at in estimating the age of Earth
using the thickness of sedimentary rock deposits? Why or why not? How close are the calculated values to your prior understanding of the age of the Earth (compare to your Initial Ideas)?
____________________________________________________
____________________________________________________
____________________________________________________
____________________________________________________ 2. What assumptions were made in using the thickness of sedimentary rock as a method to date
the age of Earth? ____________________________________________________
____________________________________________________
____________________________________________________
____________________________________________________
How do you think this story relates to the nature of science? Is scientific knowledge static or can scientific ideas (facts, theories) change?
With your Specialty Group, prepare a whiteboard (or a section of board in the front of the room) that shows your classmates the method you used to come up with a minimum age for Earth. Be sure to include any assumptions that are made in this calculation.
Class Discussion
30
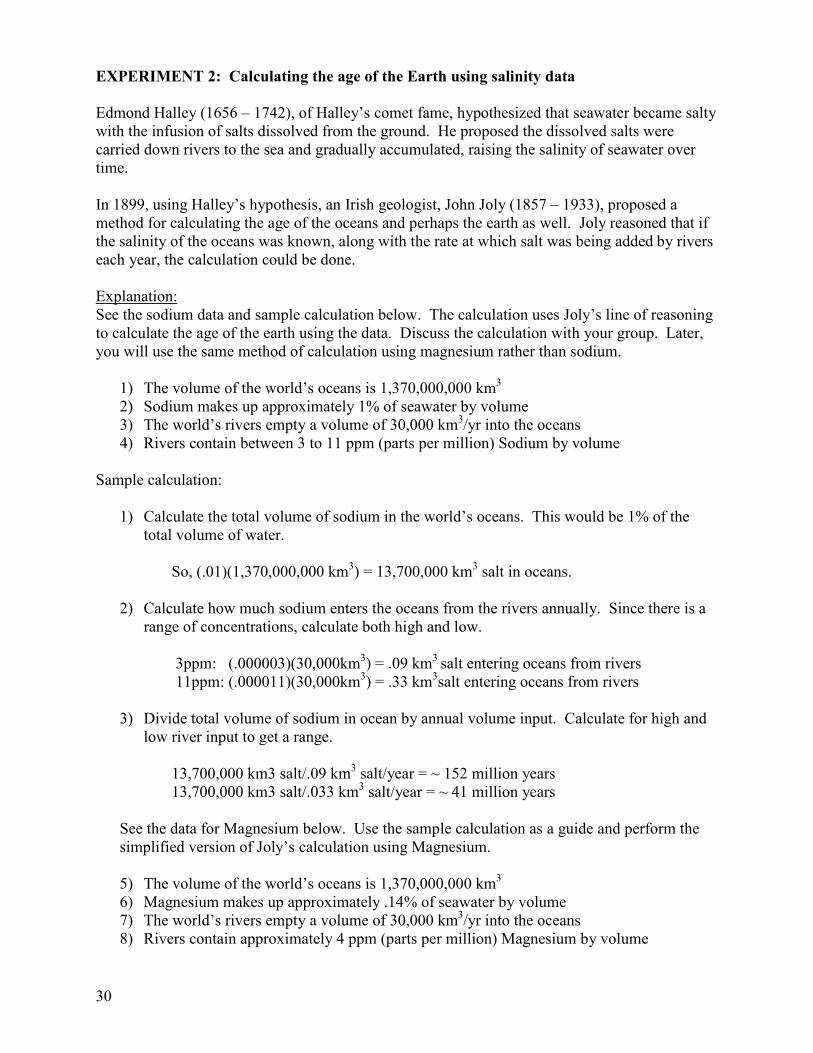
EXPERIMENT 2: Calculating the age of the Earth using salinity data Edmond Halley (1656 – 1742), of Halley’s comet fame, hypothesized that seawater became salty with the infusion of salts dissolved from the ground. He proposed the dissolved salts were carried down rivers to the sea and gradually accumulated, raising the salinity of seawater over time. In 1899, using Halley’s hypothesis, an Irish geologist, John Joly (1857 – 1933), proposed a method for calculating the age of the oceans and perhaps the earth as well. Joly reasoned that if the salinity of the oceans was known, along with the rate at which salt was being added by rivers each year, the calculation could be done. Explanation: See the sodium data and sample calculation below. The calculation uses Joly’s line of reasoning to calculate the age of the earth using the data. Discuss the calculation with your group. Later, you will use the same method of calculation using magnesium rather than sodium.
1) The volume of the world’s oceans is 1,370,000,000 km3 2) Sodium makes up approximately 1% of seawater by volume 3) The world’s rivers empty a volume of 30,000 km3/yr into the oceans 4) Rivers contain between 3 to 11 ppm (parts per million) Sodium by volume
Sample calculation:
1) Calculate the total volume of sodium in the world’s oceans. This would be 1% of the total volume of water.
So, (.01)(1,370,000,000 km3) = 13,700,000 km3 salt in oceans.
2) Calculate how much sodium enters the oceans from the rivers annually. Since there is a
range of concentrations, calculate both high and low.
3ppm: (.000003)(30,000km3) = .09 km3 salt entering oceans from rivers 11ppm: (.000011)(30,000km3) = .33 km3salt entering oceans from rivers
3) Divide total volume of sodium in ocean by annual volume input. Calculate for high and low river input to get a range. 13,700,000 km3 salt/.09 km3 salt/year = ~ 152 million years 13,700,000 km3 salt/.033 km3 salt/year = ~ 41 million years
See the data for Magnesium below. Use the sample calculation as a guide and perform the simplified version of Joly’s calculation using Magnesium. 5) The volume of the world’s oceans is 1,370,000,000 km3 6) Magnesium makes up approximately .14% of seawater by volume 7) The world’s rivers empty a volume of 30,000 km3/yr into the oceans 8) Rivers contain approximately 4 ppm (parts per million) Magnesium by volume
31
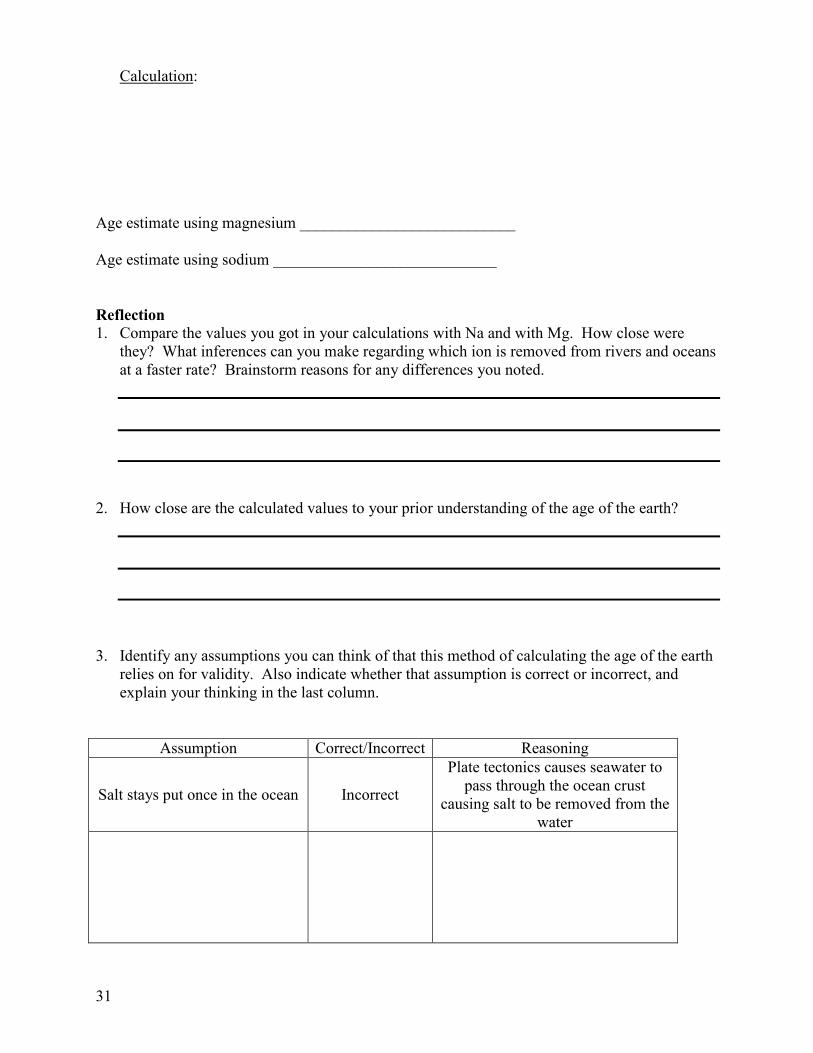
Calculation:
Age estimate using magnesium ___________________________ Age estimate using sodium ____________________________ Reflection 1. Compare the values you got in your calculations with Na and with Mg. How close were
they? What inferences can you make regarding which ion is removed from rivers and oceans at a faster rate? Brainstorm reasons for any differences you noted.
2. How close are the calculated values to your prior understanding of the age of the earth?
3. Identify any assumptions you can think of that this method of calculating the age of the earth
relies on for validity. Also indicate whether that assumption is correct or incorrect, and explain your thinking in the last column.
Assumption Correct/Incorrect Reasoning
Salt stays put once in the ocean Incorrect
Plate tectonics causes seawater to pass through the ocean crust
causing salt to be removed from the water
32
Scientist ideas: Joly’s attempt to calculate the age of the earth was innovative at the time, however his reasoning is based on some faulty assumptions leading to a significant underestimate of the age of the earth. A better way to describe the values obtained through this calculation is as “residence time,” or the time that salt stays in oceans before being removed through one of many processes. Sodium and Magnesium are removed through different processes and thus at different rates, accounting for the varying values obtained using each ion. The main assumption that Joly made that led to the underestimate of the earth’s age is his assumption that salt stays in the oceans once deposited. There are several processes that remove salt from the oceans including the process of plate tectonics that causes salt removal from seawater as it passes through the ocean’s crust. Salt is also removed from deposition of salt in sediments on the sea floor, and through transfer onto land from sea spray. The method also assumes that the influx of salt in to the oceans has been constant over time. Weather rates have been known to change drastically throughout geologic time, so this assumption is likely false. Magnesium is removed from seawater by various processes that differ from sodium’s removal. For example, magnesium reacts with calcium carbonate in coral islands, through this process, the magnesium becomes incorporated into the coral and thus is removed from the ocean water. The rate at which magnesium is removed is higher, than the removal of sodium, resulting in a larger underestimate of the age of the earth using this calculation method with magnesium as the ion under consideration.
33
Discuss your responses to #1-3 and the scientists’ ideas above with your group. Would you change any of your answers? Explain your thinking.
How do you think this story relates to the nature of science? Is scientific knowledge static or can scientific ideas (facts, theories) change?
With your Specialty Group, prepare a whiteboard (or a section of board in the front of the room) that shows your classmates the method you used to come up with a minimum age for Earth. Be sure to include any assumptions that are made in this calculation.
Class Discussion
34
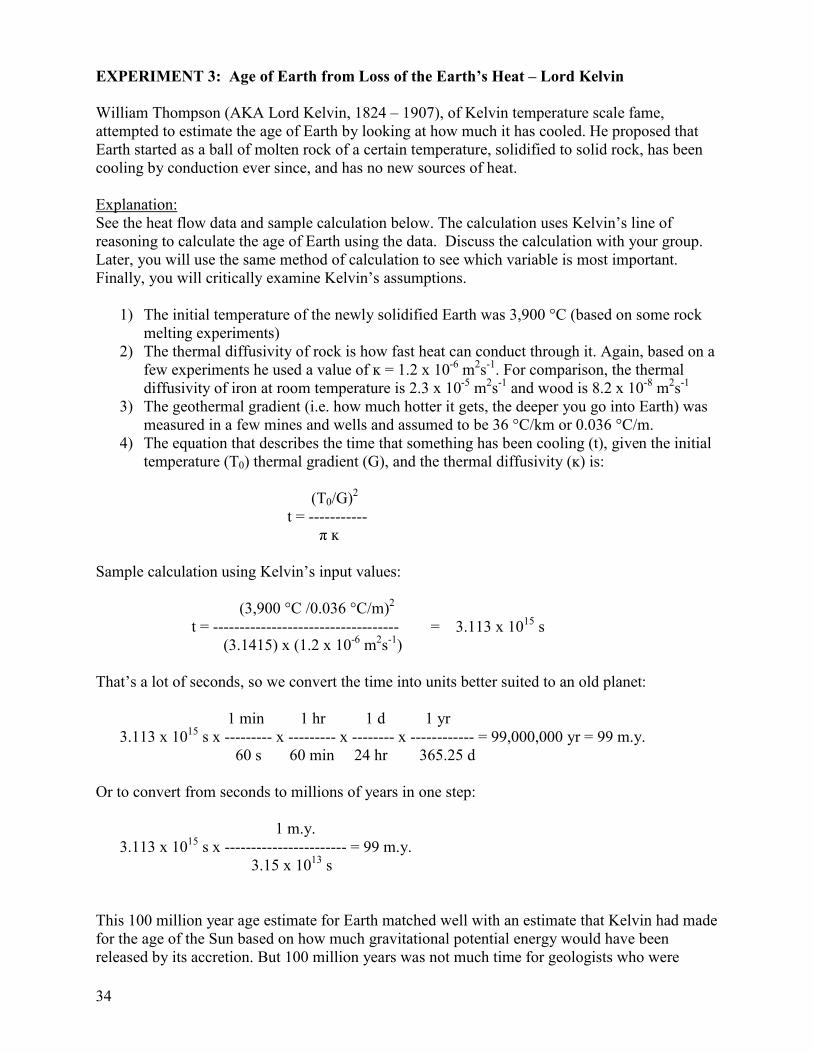
EXPERIMENT 3: Age of Earth from Loss of the Earth’s Heat – Lord Kelvin William Thompson (AKA Lord Kelvin, 1824 – 1907), of Kelvin temperature scale fame, attempted to estimate the age of Earth by looking at how much it has cooled. He proposed that Earth started as a ball of molten rock of a certain temperature, solidified to solid rock, has been cooling by conduction ever since, and has no new sources of heat. Explanation: See the heat flow data and sample calculation below. The calculation uses Kelvin’s line of reasoning to calculate the age of Earth using the data. Discuss the calculation with your group. Later, you will use the same method of calculation to see which variable is most important. Finally, you will critically examine Kelvin’s assumptions.
1) The initial temperature of the newly solidified Earth was 3,900 °C (based on some rock melting experiments)
2) The thermal diffusivity of rock is how fast heat can conduct through it. Again, based on a !"#$"%&"'()"*+,$-"$.,"/$0$102."$3!$4$5$678$%$69-6 m2s-1. For comparison, the thermal diffusivity of iron at room temperature is 2.3 x 10⁻⁵ m2s-1 and wood is 8.2 x 10⁻⁸ m2s-1
3) The geothermal gradient (i.e. how much hotter it gets, the deeper you go into Earth) was measured in a few mines and wells and assumed to be 36 °C/km or 0.036 °C/m.
4) The equation that describes the time that something has been cooling (t), given the initial temperature (T0:$+-"')02$;'0/("*+$<=:>$0*/$+-"$+-"')02$/(!!.,(1(+?$<4:$(,@
(T0/G)2 t = -----------
A$4 Sample calculation using Kelvin’s input values:
(3,900 °C /0.036 °C/m)2 t = ----------------------------------- = 3.113 x 10¹⁵ s
(3.1415) x (1.2 x 10-6 m2s-1) That’s a lot of seconds, so we convert the time into units better suited to an old planet:
1 min 1 hr 1 d 1 yr 3.113 x 10¹⁵ s x --------- x --------- x -------- x ------------ = 99,000,000 yr = 99 m.y. 60 s 60 min 24 hr 365.25 d
Or to convert from seconds to millions of years in one step: 1 m.y. 3.113 x 10¹⁵ s x ----------------------- = 99 m.y. 3.15 x 10¹³ s
This 100 million year age estimate for Earth matched well with an estimate that Kelvin had made for the age of the Sun based on how much gravitational potential energy would have been released by its accretion. But 100 million years was not much time for geologists who were
35
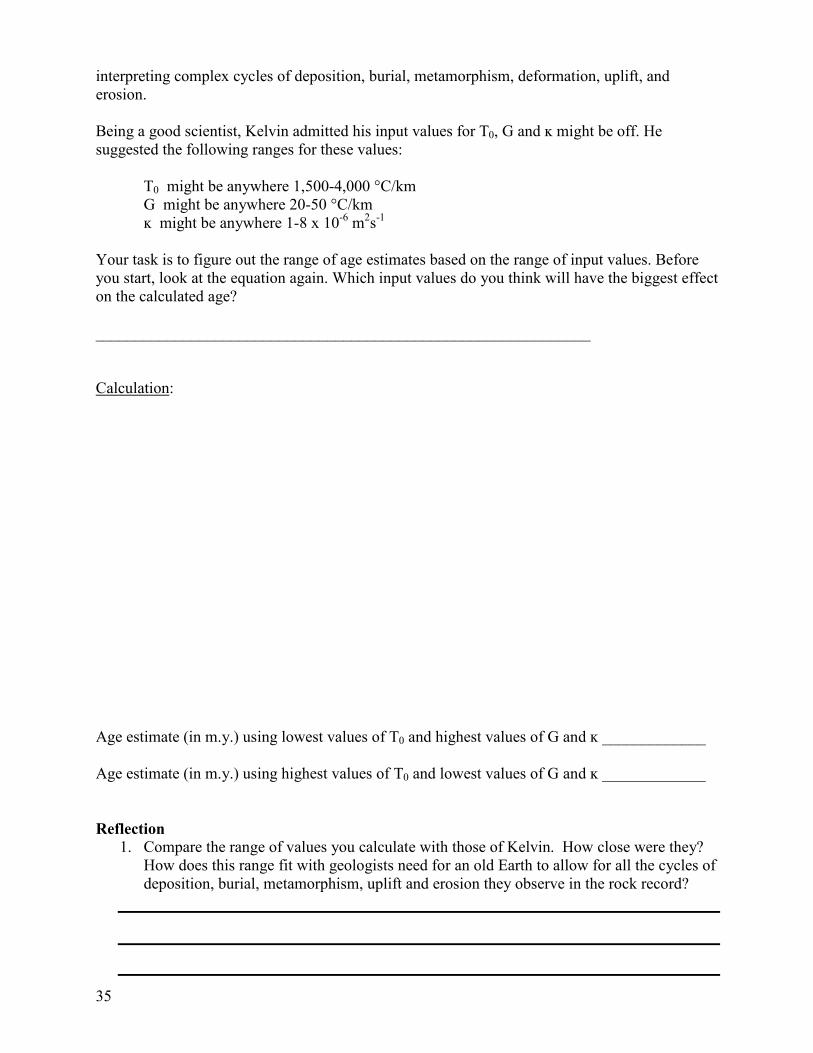
interpreting complex cycles of deposition, burial, metamorphism, deformation, uplift, and erosion. Being a good scientist, Kelvin admitted his input values for T0>$=$0*/$4$)(;-+$B" off. He suggested the following ranges for these values:
T0 might be anywhere 1,500-4,000 °C/km G might be anywhere 20-50 °C/km 4$$)(;-+$B"$0*?#-"'"$6-8 x 10⁻⁶ m2s-1
Your task is to figure out the range of age estimates based on the range of input values. Before you start, look at the equation again. Which input values do you think will have the biggest effect on the calculated age? ______________________________________________________________ Calculation:
Age estimate (in m.y.) using lowest values of T0 0*/$-(;-",+$102.",$3!$=$0*/$4$CCCCCCCCCC___ Age estimate (in m.y.) using highest values of T0 0*/$23#",+$102.",$3!$=$0*/$4$C____________ Reflection
1. Compare the range of values you calculate with those of Kelvin. How close were they? How does this range fit with geologists need for an old Earth to allow for all the cycles of deposition, burial, metamorphism, uplift and erosion they observe in the rock record?
36
2. How close are the calculated values to your prior understanding of the age of the earth?
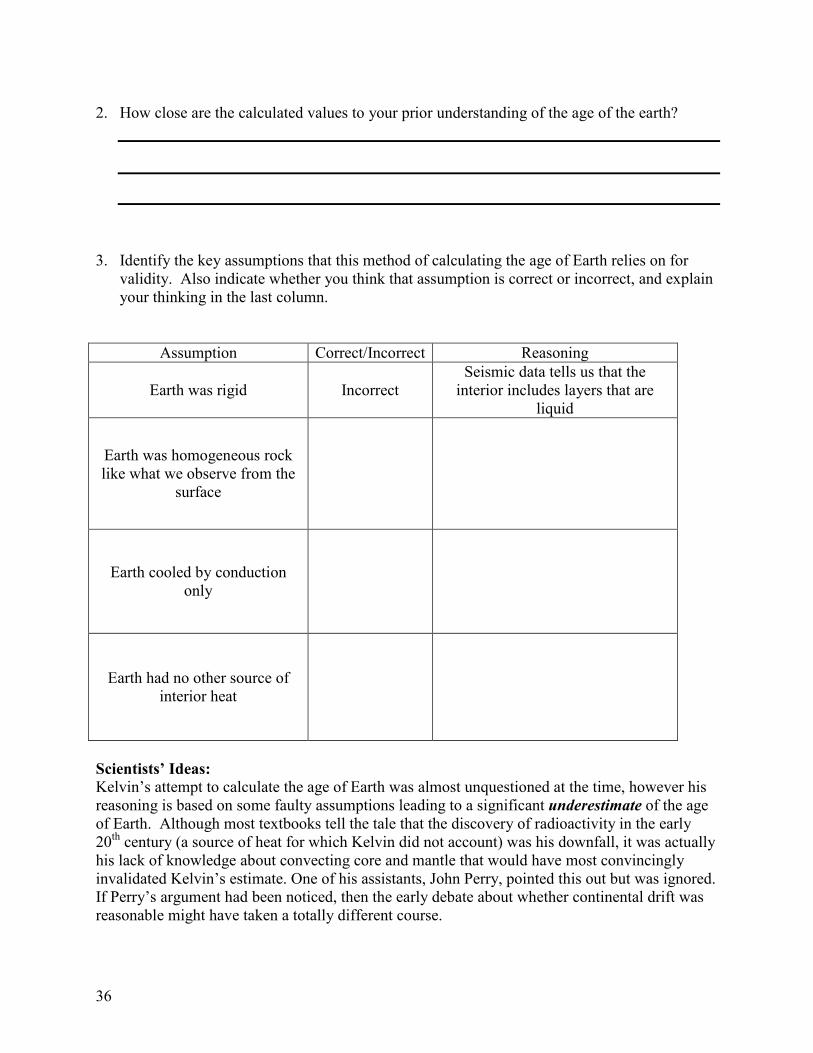
3. Identify the key assumptions that this method of calculating the age of Earth relies on for
validity. Also indicate whether you think that assumption is correct or incorrect, and explain your thinking in the last column.
Assumption Correct/Incorrect Reasoning
Earth was rigid Incorrect Seismic data tells us that the
interior includes layers that are liquid
Earth was homogeneous rock like what we observe from the
surface
Earth cooled by conduction only
Earth had no other source of interior heat
Scientists’ Ideas: Kelvin’s attempt to calculate the age of Earth was almost unquestioned at the time, however his reasoning is based on some faulty assumptions leading to a significant underestimate of the age of Earth. Although most textbooks tell the tale that the discovery of radioactivity in the early 20th century (a source of heat for which Kelvin did not account) was his downfall, it was actually his lack of knowledge about convecting core and mantle that would have most convincingly invalidated Kelvin’s estimate. One of his assistants, John Perry, pointed this out but was ignored. If Perry’s argument had been noticed, then the early debate about whether continental drift was reasonable might have taken a totally different course.
37
How do you think this story relates to the nature of science? Is scientific knowledge static or can scientific ideas (facts, theories) change?
With your Specialty Group, prepare a whiteboard (or a section of board in the front of the room) that shows your classmates the method you used to come up with a minimum age for Earth. Be sure to include any assumptions that are made in this calculation.
Class Discussion
38
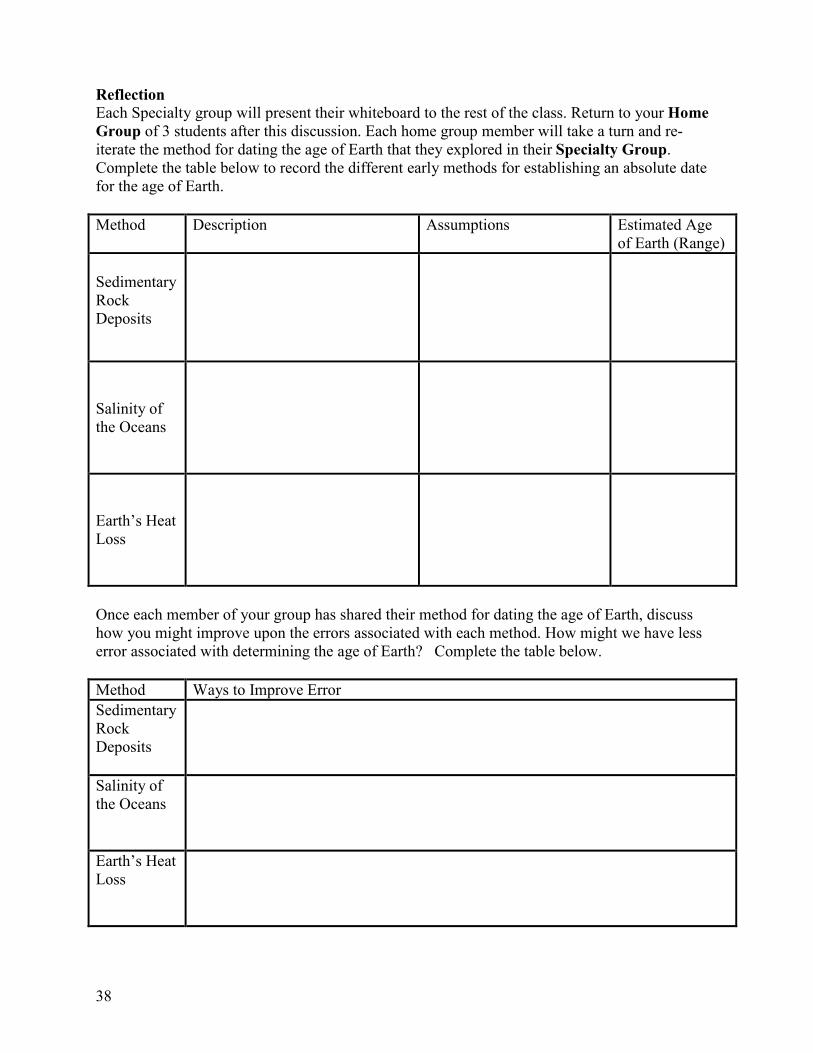
Reflection Each Specialty group will present their whiteboard to the rest of the class. Return to your Home Group of 3 students after this discussion. Each home group member will take a turn and re-iterate the method for dating the age of Earth that they explored in their Specialty Group. Complete the table below to record the different early methods for establishing an absolute date for the age of Earth. Method Description Assumptions Estimated Age
of Earth (Range) Sedimentary Rock Deposits
Salinity of the Oceans
Earth’s Heat Loss
Once each member of your group has shared their method for dating the age of Earth, discuss how you might improve upon the errors associated with each method. How might we have less error associated with determining the age of Earth? Complete the table below. Method Ways to Improve Error Sedimentary Rock Deposits
Salinity of the Oceans
Earth’s Heat Loss
39
Class Discussion: Brainstorm with your group other ideas for determining the age of the Earth. Can you think of other rates that would be useful? Other processes? Whiteboard these ideas, then share them with the rest of the class.
Class Discussion
40
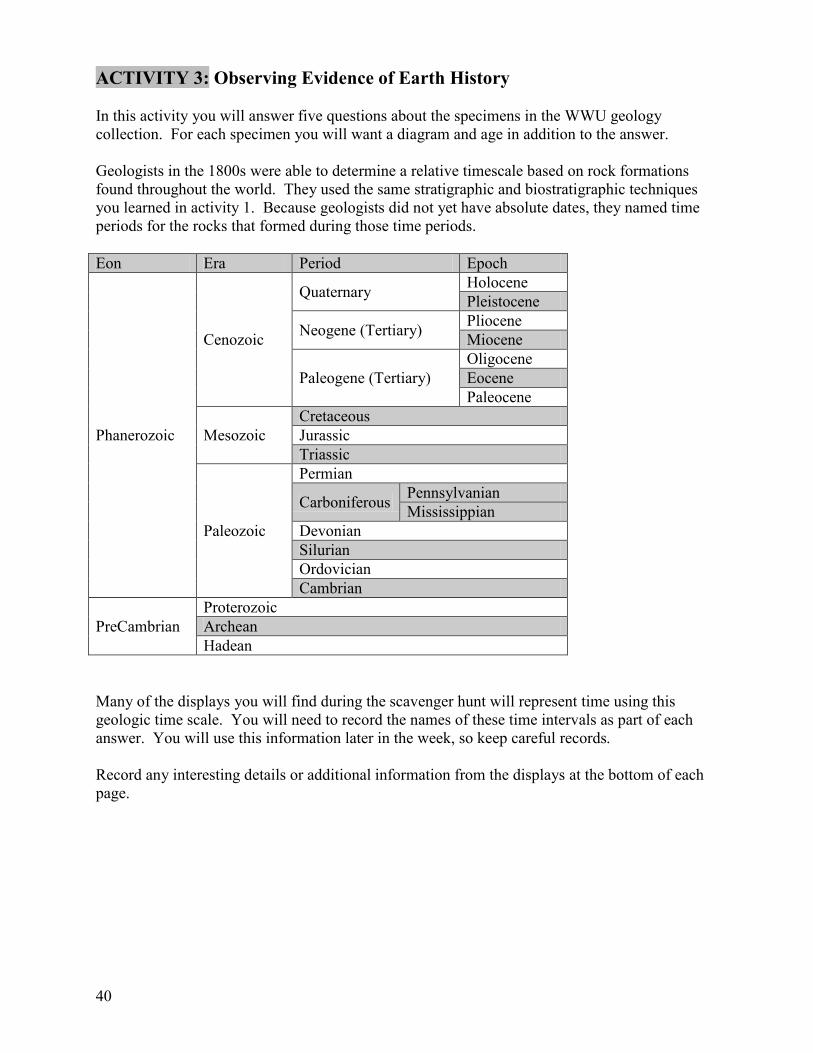
ACTIVITY 3: Observing Evidence of Earth History In this activity you will answer five questions about the specimens in the WWU geology collection. For each specimen you will want a diagram and age in addition to the answer. Geologists in the 1800s were able to determine a relative timescale based on rock formations found throughout the world. They used the same stratigraphic and biostratigraphic techniques you learned in activity 1. Because geologists did not yet have absolute dates, they named time periods for the rocks that formed during those time periods. Eon Era Period Epoch
Phanerozoic
Cenozoic
Quaternary Holocene Pleistocene
Neogene (Tertiary) Pliocene Miocene
Paleogene (Tertiary) Oligocene Eocene Paleocene
Mesozoic Cretaceous Jurassic Triassic
Paleozoic
Permian
Carboniferous Pennsylvanian Mississippian
Devonian Silurian Ordovician Cambrian
PreCambrian Proterozoic Archean Hadean
Many of the displays you will find during the scavenger hunt will represent time using this geologic time scale. You will need to record the names of these time intervals as part of each answer. You will use this information later in the week, so keep careful records. Record any interesting details or additional information from the displays at the bottom of each page.

41
Question #1: Answer: Specimen description: Labeled Diagram of Specimen: Age: (years or time period) Additional information:

42
Question #2: Answer: Specimen description: Labeled Diagram of Specimen: Age: (years or time period) Additional information:
43
Question #3: Answer: Specimen description: Labeled Diagram of Specimen: Age: (years or time period) Additional information:

44
Question #4: Answer: Specimen description: Labeled Diagram of Specimen: Age: (years or time period) Additional information:

45
Question #5: Answer: Specimen description: Labeled Diagram of Specimen: Age: (years or time period) Additional information:
46
ACTIVITY 4: Absolute Dating – Radiometric Dating PURPOSE: In Activity 1 you saw that there are numerous techniques to compare the age of one rock (or layer) to another rock (or layer) through relative age dating. However, none of these techniques gave us actual numbers. In Activity 2, you worked through early attempts using rates to come up with real numbers, but those efforts were fraught with error. This activity will help you appreciate another, more accurate, application of rates (of radioactive decay) to determine ages or rocks. You will make the same observations and engage in the same processes that scientists use in order to establish the age of a rock. Q. How do scientists know that a rock is 1.2 billion years old (or any age for that matter)? INITIAL IDEAS 1. You go to a museum, where several rocks are on display. Underneath each rock is a placard
that states the type of rock, and its age. How do you think the age of the rock is determined?
2. In the life cycle of a human, age is defined as time since birth. What do we mean by the
“age” of a rock? Think back to ideas of the rock cycle. Should there be different definitions for “age” for different rock types? If so, please elaborate.
Age of Igneous Rock =
Age of Sedimentary Rock =
Age of Metamorphic Rock =
3. Of the three rock types, rank them from the type that would have the “most clearly defined
age” to the “least clearly defined age.” Explain your thinking.
4. Use Figure A1.2 from Activity 1 to answer the following questions:
a. Order the fossils from youngest to oldest. How do you know?
47
b. Can you tell how much older one fossil is than another? Explain.
c. You saw how early scientists used rates of various processes to estimate Earth’s age.
Can you design a method to determine the difference in ages between one fossil and another?
COLLECTING AND INTERPRETING EVIDENCE EXPERIMENT 1. Modeling Radioactive Decay In this experiment, you will see that atoms can change via a process called radioactive decay. These atomic changes occur at a specific RATE, dependent on the element. Remember that in the last activity you used rates of processes to calculate an age. Now we will use rates of radioactive decay to determine the age of the rock that contains those atoms. Part 1. Background Information: Modern Atomic Theory. In 1803, John Dalton proposed the foundations of modern atomic theory: that all matter is composed of indivisible and unchangeable atoms. Subsequent studies furthered Dalton’s original ideas, helping scientists create a model for the inner structures of the atom. However, until the late 1890s, there was no evidence that atoms ever changed. In other words, there was no reason to believe that a Carbon atom was ever, or will ever be, anything other than a Carbon atom.1 Take a moment to think about that. The matter in your skin, the desk in front of you, the air you breathe, is composed of atoms, the very same atoms that have existed since Earth formed. Think about a Carbon atom in your body. Write a quick biography to invent the life of that Carbon atom. Share your work with the class.
"!#$%!&$%'!()*$%&+,($)!+-$.,!+,$&(/!,0'$%12!3''!0,,4566')78(9(-$$937$%:68(9(6;')'%+<=>0'&(3,%16?,$&(/=@,%./,.%'6A(3,$%1=$*=?,$&(/=@,%./,.%'!
48
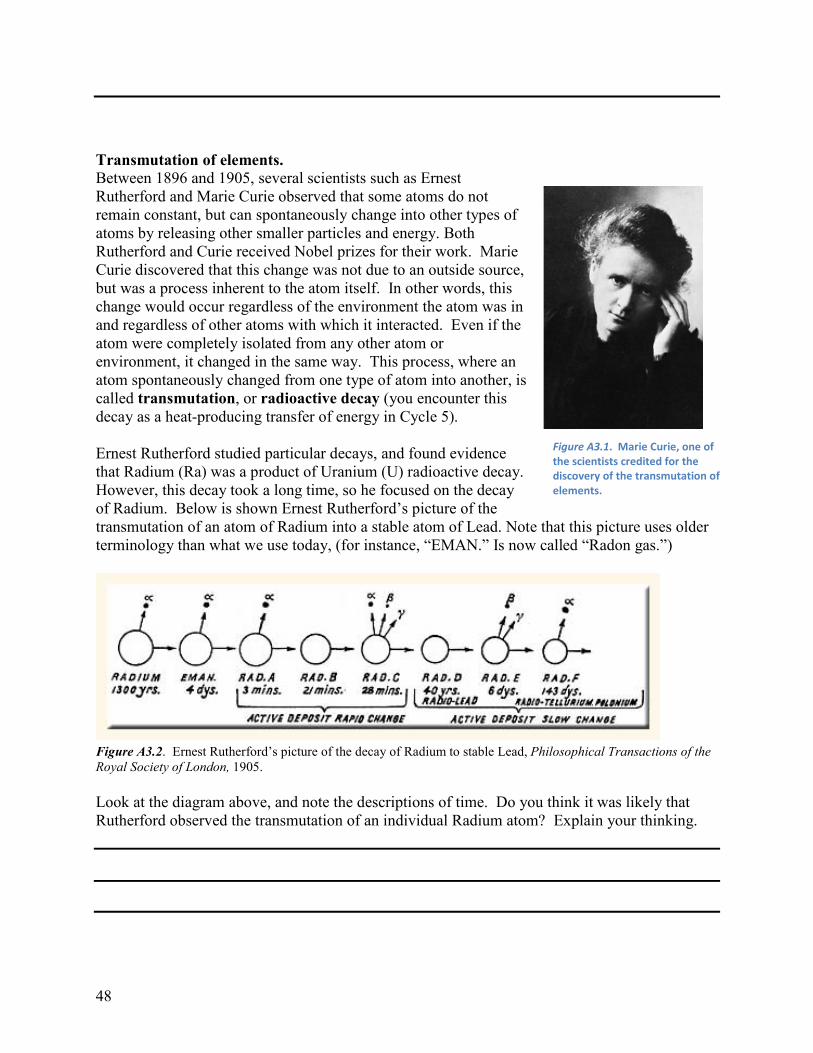
Transmutation of elements. Between 1896 and 1905, several scientists such as Ernest Rutherford and Marie Curie observed that some atoms do not remain constant, but can spontaneously change into other types of atoms by releasing other smaller particles and energy. Both Rutherford and Curie received Nobel prizes for their work. Marie Curie discovered that this change was not due to an outside source, but was a process inherent to the atom itself. In other words, this change would occur regardless of the environment the atom was in and regardless of other atoms with which it interacted. Even if the atom were completely isolated from any other atom or environment, it changed in the same way. This process, where an atom spontaneously changed from one type of atom into another, is called transmutation, or radioactive decay (you encounter this decay as a heat-producing transfer of energy in Cycle 5). Ernest Rutherford studied particular decays, and found evidence that Radium (Ra) was a product of Uranium (U) radioactive decay. However, this decay took a long time, so he focused on the decay of Radium. Below is shown Ernest Rutherford’s picture of the transmutation of an atom of Radium into a stable atom of Lead. Note that this picture uses older terminology than what we use today, (for instance, “EMAN.” Is now called “Radon gas.”)
Figure A3.2. Ernest Rutherford’s picture of the decay of Radium to stable Lead, Philosophical Transactions of the Royal Society of London, 1905. Look at the diagram above, and note the descriptions of time. Do you think it was likely that Rutherford observed the transmutation of an individual Radium atom? Explain your thinking.
!"#$%&'()*+"!!#$%&'!()%&'*!+,'!+-!./'!01&',.&0.0!1%'2&.'2!-+%!./'!2&01+3'%4!+-!./'!.%$,05).$.&+,!+-!'6'5',.0"!
49
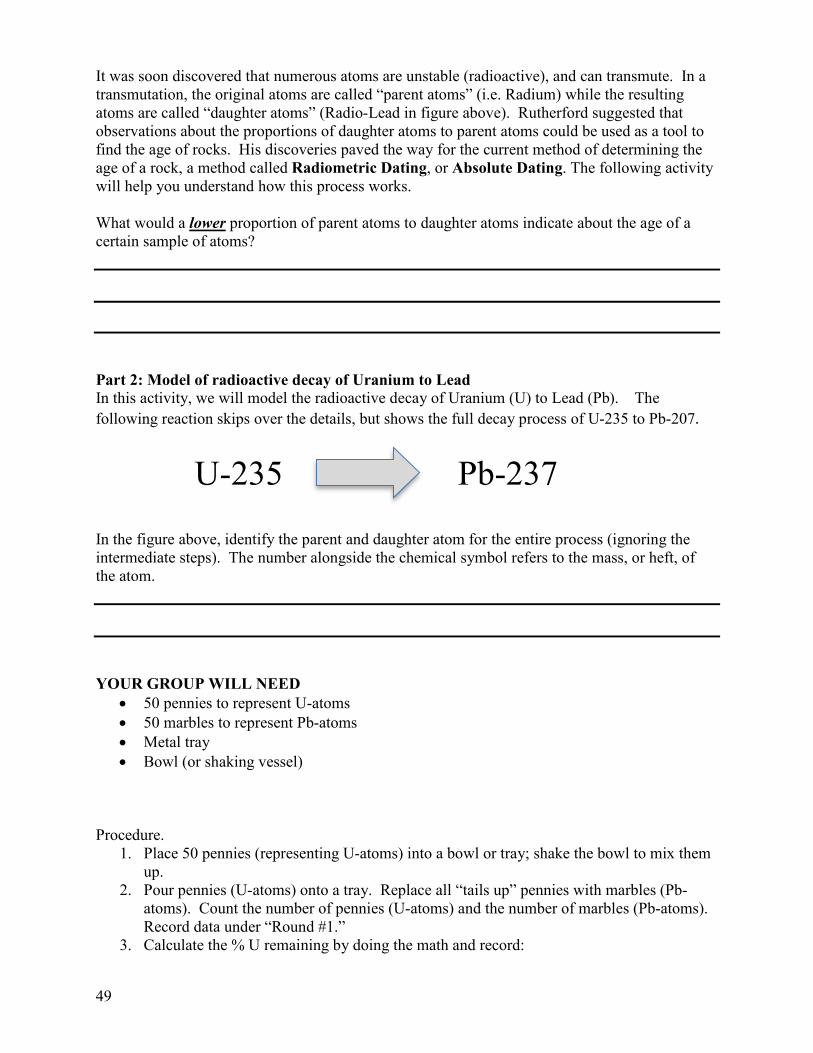
It was soon discovered that numerous atoms are unstable (radioactive), and can transmute. In a transmutation, the original atoms are called “parent atoms” (i.e. Radium) while the resulting atoms are called “daughter atoms” (Radio-Lead in figure above). Rutherford suggested that observations about the proportions of daughter atoms to parent atoms could be used as a tool to find the age of rocks. His discoveries paved the way for the current method of determining the age of a rock, a method called Radiometric Dating, or Absolute Dating. The following activity will help you understand how this process works. What would a lower proportion of parent atoms to daughter atoms indicate about the age of a certain sample of atoms?
Part 2: Model of radioactive decay of Uranium to Lead In this activity, we will model the radioactive decay of Uranium (U) to Lead (Pb). The following reaction skips over the details, but shows the full decay process of U-235 to Pb-207!"""
" In the figure above, identify the parent and daughter atom for the entire process (ignoring the intermediate steps). The number alongside the chemical symbol refers to the mass, or heft, of the atom.
YOUR GROUP WILL NEED
! 50 pennies to represent U-atoms ! 50 marbles to represent Pb-atoms ! Metal tray ! Bowl (or shaking vessel)
Procedure.
1. Place 50 pennies (representing U-atoms) into a bowl or tray; shake the bowl to mix them up.
2. Pour pennies (U-atoms) onto a tray. Replace all “tails up” pennies with marbles (Pb-atoms). Count the number of pennies (U-atoms) and the number of marbles (Pb-atoms). Record data under “Round #1.”
3. Calculate the % U remaining by doing the math and record:
U-235 Pb-237
50
4. Pour the mixture of pennies and marbles back into the bowl. Shake the bowl to mix them up, and pour back onto the tray.
5. Replace all “tails up” pennies (U-atoms) with marbles (Pb-atoms). Count the number of pennies (U-atoms) and the number of marbles (Pb-atoms). Record data under the next round. Calculate the % U remaining.
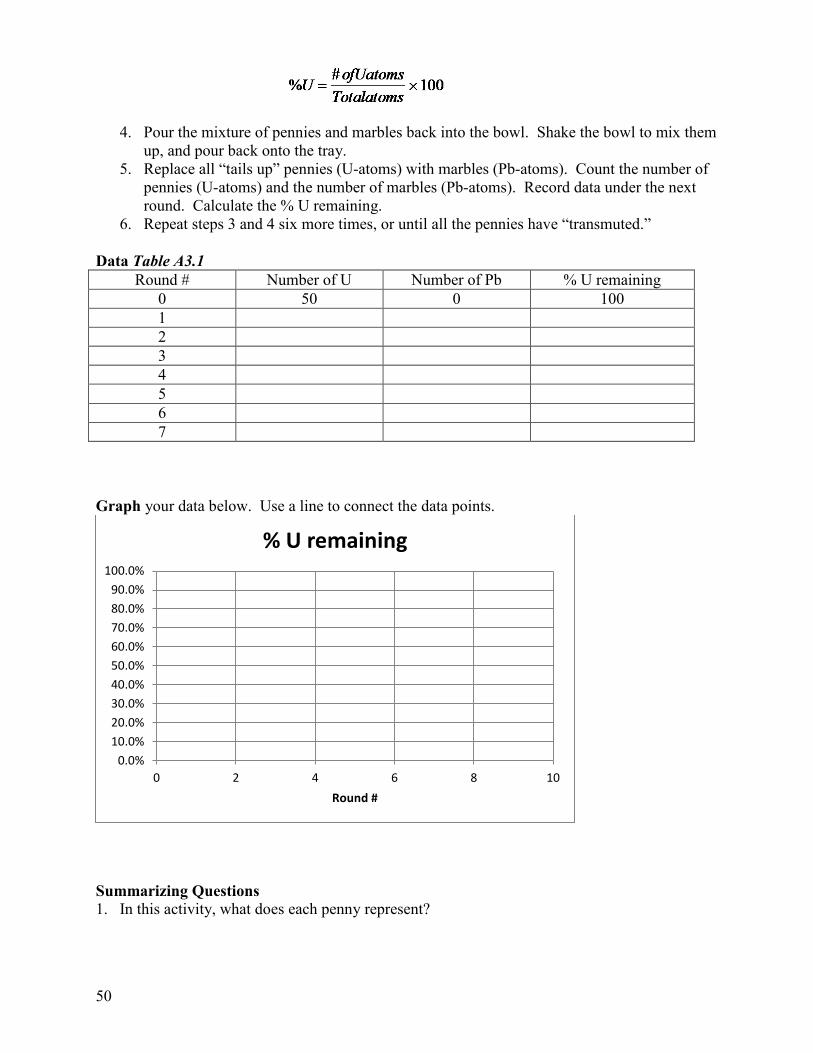
6. Repeat steps 3 and 4 six more times, or until all the pennies have “transmuted.” Data Table A3.1
Round # Number of U Number of Pb % U remaining 0 50 0 100 1 2 3 4 5 6 7
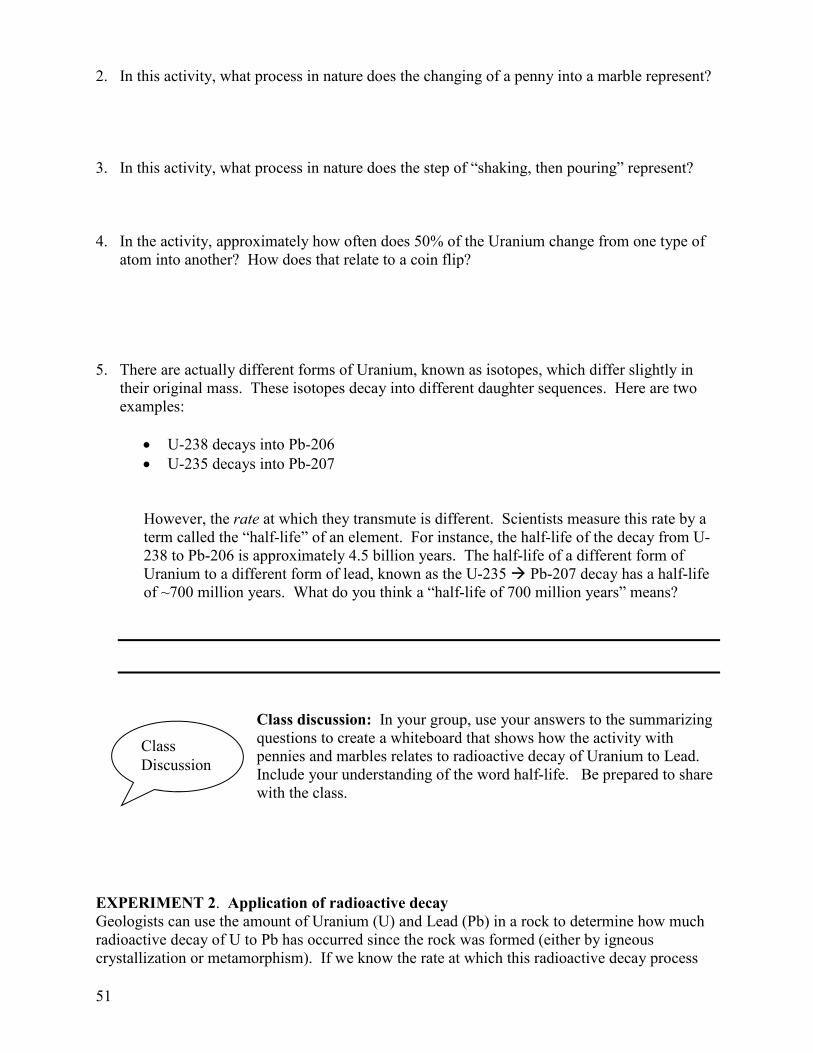
Graph your data below. Use a line to connect the data points.
Summarizing Questions 1. In this activity, what does each penny represent?
B7BC"B7BCDB7BCEB7BCFB7BCGB7BCHB7BCIB7BCJB7BCKB7BC
"BB7BC
B D F H J "B7+),2!8!
9!:!%'5$&,&,;!
51
2. In this activity, what process in nature does the changing of a penny into a marble represent? 3. In this activity, what process in nature does the step of “shaking, then pouring” represent? 4. In the activity, approximately how often does 50% of the Uranium change from one type of
atom into another? How does that relate to a coin flip? 5. There are actually different forms of Uranium, known as isotopes, which differ slightly in
their original mass. These isotopes decay into different daughter sequences. Here are two examples:
! U-238 decays into Pb-206 ! U-235 decays into Pb-207
However, the rate at which they transmute is different. Scientists measure this rate by a term called the “half-life” of an element. For instance, the half-life of the decay from U-238 to Pb-206 is approximately 4.5 billion years. The half-life of a different form of Uranium to a different form of lead, known as the U-235 ! Pb-207 decay has a half-life of ~700 million years. What do you think a “half-life of 700 million years” means?
Class discussion: In your group, use your answers to the summarizing questions to create a whiteboard that shows how the activity with pennies and marbles relates to radioactive decay of Uranium to Lead. Include your understanding of the word half-life. Be prepared to share with the class.
EXPERIMENT 2. Application of radioactive decay Geologists can use the amount of Uranium (U) and Lead (Pb) in a rock to determine how much radioactive decay of U to Pb has occurred since the rock was formed (either by igneous crystallization or metamorphism). If we know the rate at which this radioactive decay process
Class Discussion
52
occurs (the half life), and we measure the relative amounts of parent and daughter elements present today in the rock, we can determine the age of the rock. To do this, geologists use specific minerals within the rock that have a lot of U. A great example of this is the mineral zircon. If formed at the same time (such as cooling of an igneous rock), zircon in a given rock should have the same proportion of Uranium to Lead. In this activity, we will use the decay series of U-235 to Pb-207, with a half-life of ~700 million years. You will need:
! One set of “rock samples” per group (each “set” is a bag of 4 items with a different proportion of U to Pb in them; at least two of them with the ratio 2:9, with different multiples)
Part 1: Establishing the Method Imagine you have a rock that contains zircon. You are able to isolate and measure the number of U-235 atoms and Pb-207 atom that exist in the rock today. You find:
! 150 trillion atoms of U-235, and 450 trillion atoms of Pb-207. Using that observation and what you learned from the activity above about radioactive decay, answer the questions below to make inferences about the history of the rock. 1. Assuming that all of the Pb-207 atoms came from U-235, how many U-235 atoms were there
to begin with? 2. How many times has one-half (or 50%) of the sample of original U-235 atoms transmuted to
Lead? Explain. (this will take a bit of logical thinking) 3. Using the half-life given above of 700 million years, and your understanding of the ideas of
radioactive decay, how old would scientists conclude that this rock was? Explain your reasoning.
Part 2. Using your own “rock” sample. Obtain a set of 6 “rock samples” from the supply table. For each sample, you will determine the age of the “rock” by first recording observations in Table 1, and then inferring ages in Table 2.
53
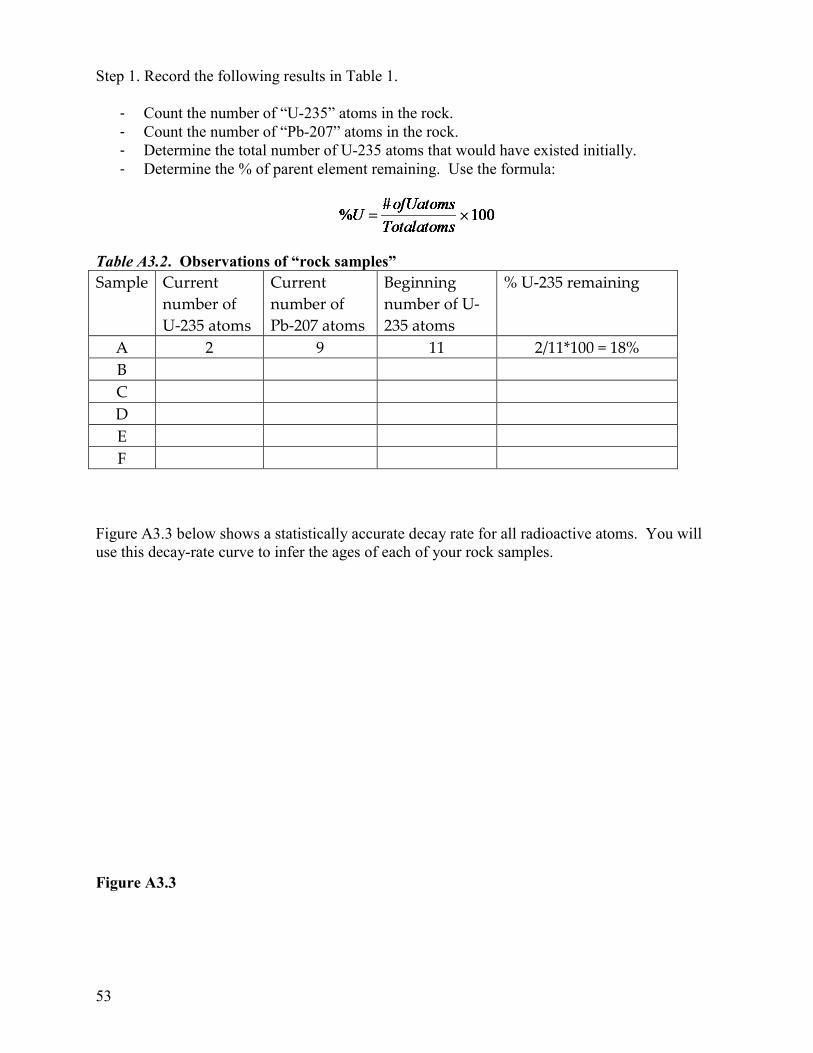
Step 1. Record the following results in Table 1.
! Count the number of “U-235” atoms in the rock. ! Count the number of “Pb-207” atoms in the rock. ! Determine the total number of U-235 atoms that would have existed initially. ! Determine the % of parent element remaining. Use the formula:
Table A3.2. Observations of “rock samples” #$%&'(" )*++(,-"
,*%.(+"/0"12345"$-/%6"
)*++(,-",*%.(+"/0"7.2389"$-/%6"
:(;<,,<,;",*%.(+"/0"12345"$-/%6"
="12345"+(%$<,<,;"
>" 3" ?" @@" 3A@@B@88"C"@D=":" " " " ")" " " " "E" " " " "F" " " " "G" " " " "
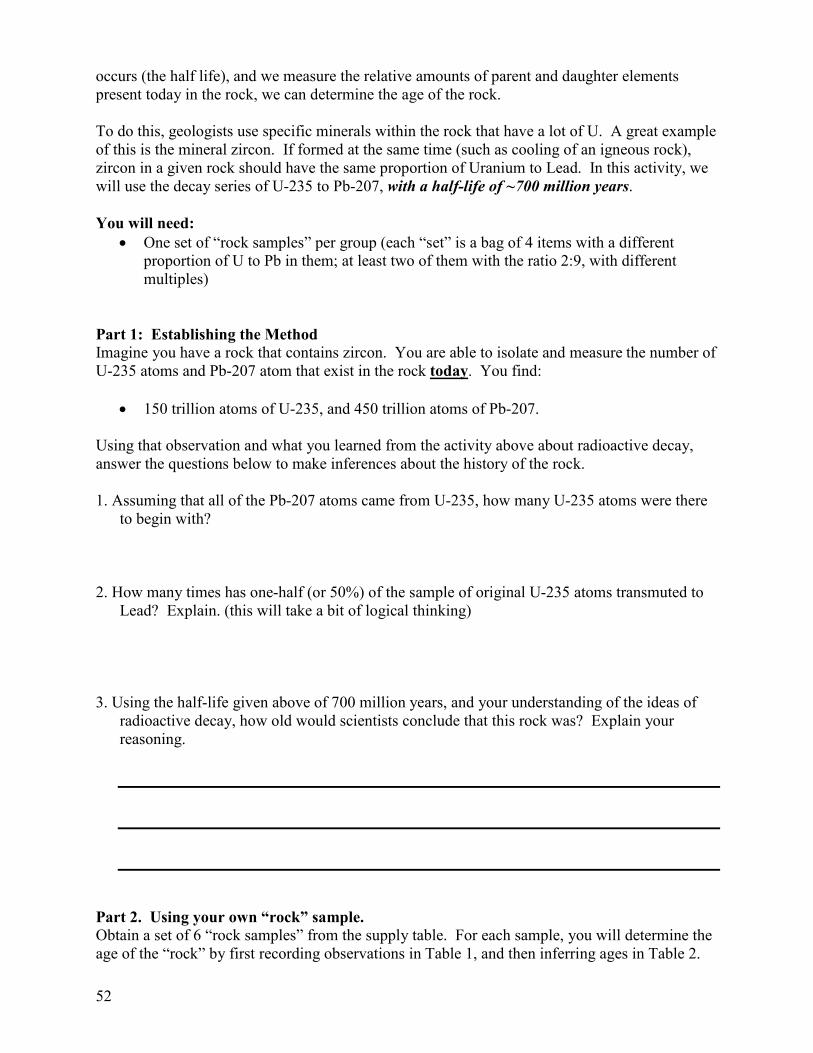
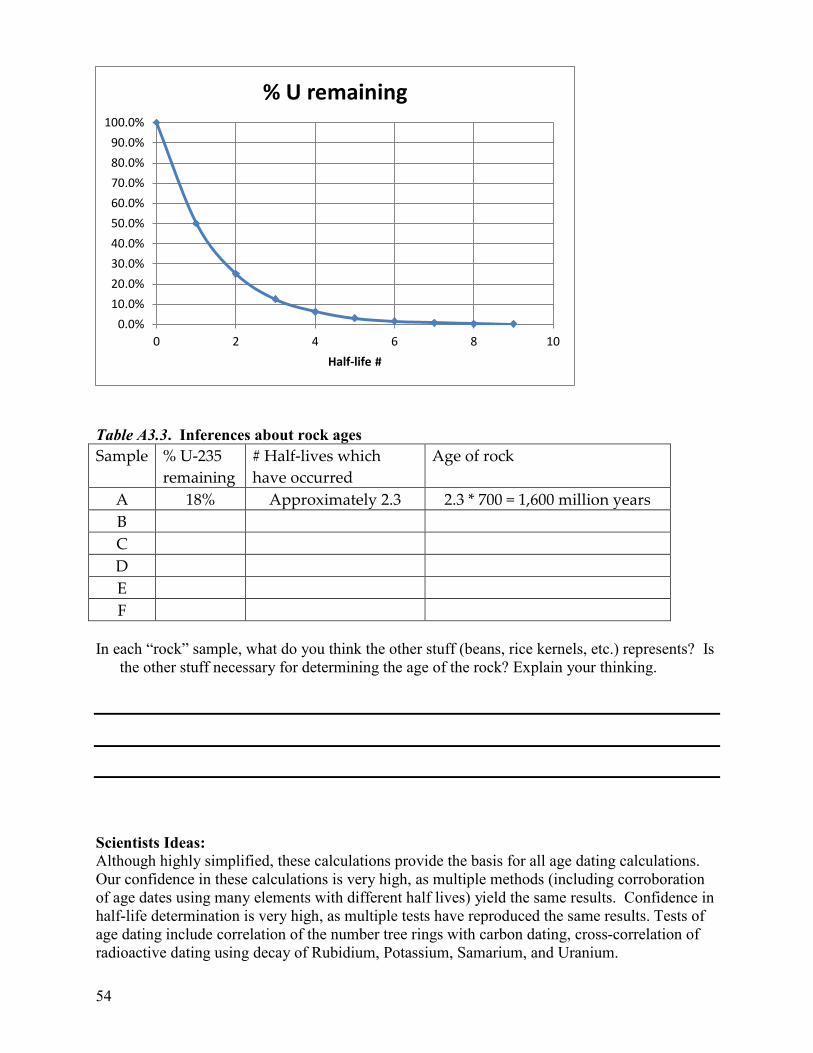
Figure A3.3 below shows a statistically accurate decay rate for all radioactive atoms. You will use this decay-rate curve to infer the ages of each of your rock samples. Figure A3.3
54
Table A3.3. Inferences about rock ages #$%&'(" ="12345"
+(%$<,<,;"H"I$'02'<J(6"KL<ML"L$J("/MM*++(N"
>;("/0"+/MO"
>" @D=" >&&+/P<%$-('Q"3!4" 3!4"B"988"C"@RS88"%<''</,"Q($+6":" " " ")" " " "E" " " "F" " " "G" " " "
In each “rock” sample, what do you think the other stuff (beans, rice kernels, etc.) represents? Is
the other stuff necessary for determining the age of the rock? Explain your thinking.
Scientists Ideas: Although highly simplified, these calculations provide the basis for all age dating calculations. Our confidence in these calculations is very high, as multiple methods (including corroboration of age dates using many elements with different half lives) yield the same results. Confidence in half-life determination is very high, as multiple tests have reproduced the same results. Tests of age dating include correlation of the number tree rings with carbon dating, cross-correlation of radioactive dating using decay of Rubidium, Potassium, Samarium, and Uranium.
B7BC"B7BCDB7BCEB7BCFB7BCGB7BCHB7BCIB7BCJB7BCKB7BC
"BB7BC
B D F H J "B<$6-=6&-'!8!
9!:!%'5$&,&,;!
55
You will see in Activity 4 how we use these same calculations in Earth rocks and in meteorites to determine the age of Earth
Class Discussion: Prepare a whiteboard with your group that explains how the proportions of U and Pb are used to determine the age of a rock. Compare the “rate” used in radioactive decay to the rates used in Activity 2. Which do you think is more reliable? Be prepared to share your whiteboard.
Activity 4 Summarizing Questions. 1. Look at your answers to the initial ideas, questions # 1-3, at the beginning of this activity.
Reflect upon your ideas from the beginning of this cycle. Would you make any changes to your answers? Why or why not?
2. You’ve now learned about relative dating and absolute dating. Which dating method may be appropriate to answer the following questions?
a. Which fossil species roamed the planet before another?
b. How old is the Earth?
c. How much time elapsed between two adjacent layers of rock where there is an unconformity?
References and links: Figure 1, Marie Curie. http://www.radiochemistry.org/nuclearmedicine/pioneers/curie_m.shtml Figure 2, Rutherford’s Diagram of transmutation of Radium. http://www.aip.org/history/curie/unstable.htm Decay series of U-235 to Pb-207. http://uni-leipzig.de/~energy/ef/18.htm Name ________________________ Date________________________________
Class Discussion
56
!"#$%&'()$*+#"($,-+.%&'/%)0+
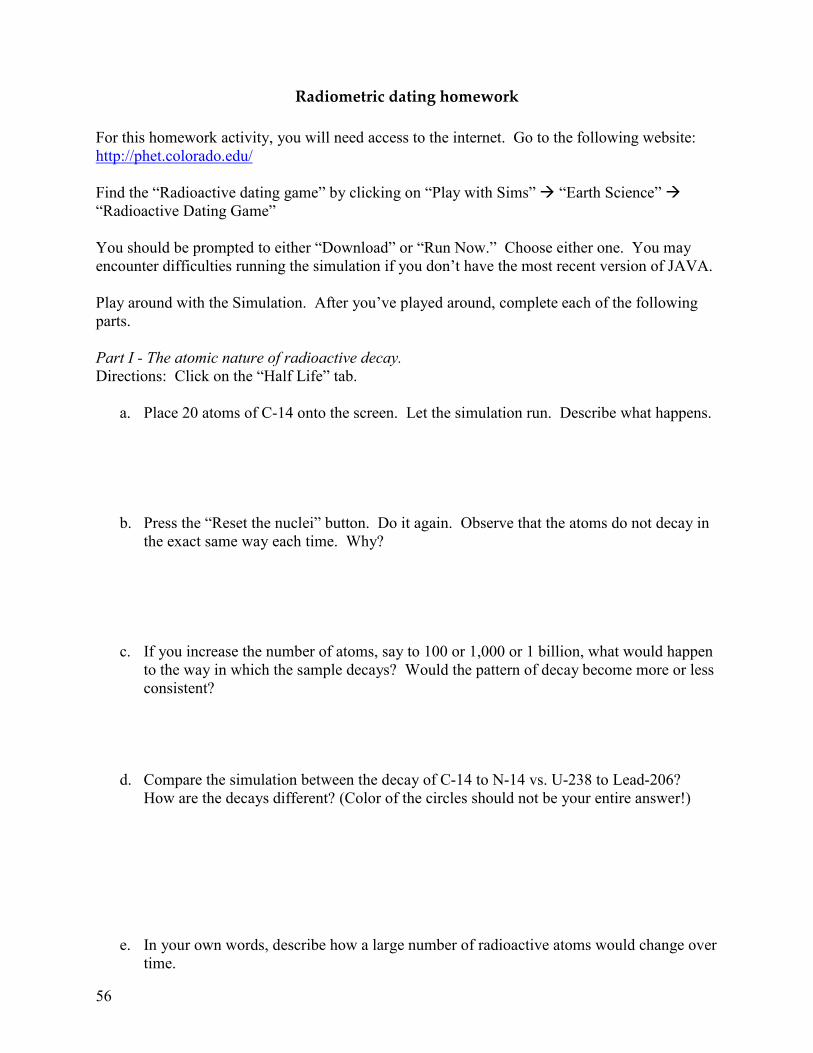
"For this homework activity, you will need access to the internet. Go to the following website: http://phet.colorado.edu/ Find the “Radioactive dating game” by clicking on “Play with Sims” ! “Earth Science” ! “Radioactive Dating Game” You should be prompted to either “Download” or “Run Now.” Choose either one. You may encounter difficulties running the simulation if you don’t have the most recent version of JAVA. Play around with the Simulation. After you’ve played around, complete each of the following parts.
Part I - The atomic nature of radioactive decay. Directions: Click on the “Half Life” tab.
a. Place 20 atoms of C-14 onto the screen. Let the simulation run. Describe what happens.
b. Press the “Reset the nuclei” button. Do it again. Observe that the atoms do not decay in the exact same way each time. Why?
c. If you increase the number of atoms, say to 100 or 1,000 or 1 billion, what would happen to the way in which the sample decays? Would the pattern of decay become more or less consistent?
d. Compare the simulation between the decay of C-14 to N-14 vs. U-238 to Lead-206? How are the decays different? (Color of the circles should not be your entire answer!)
e. In your own words, describe how a large number of radioactive atoms would change over time.
57
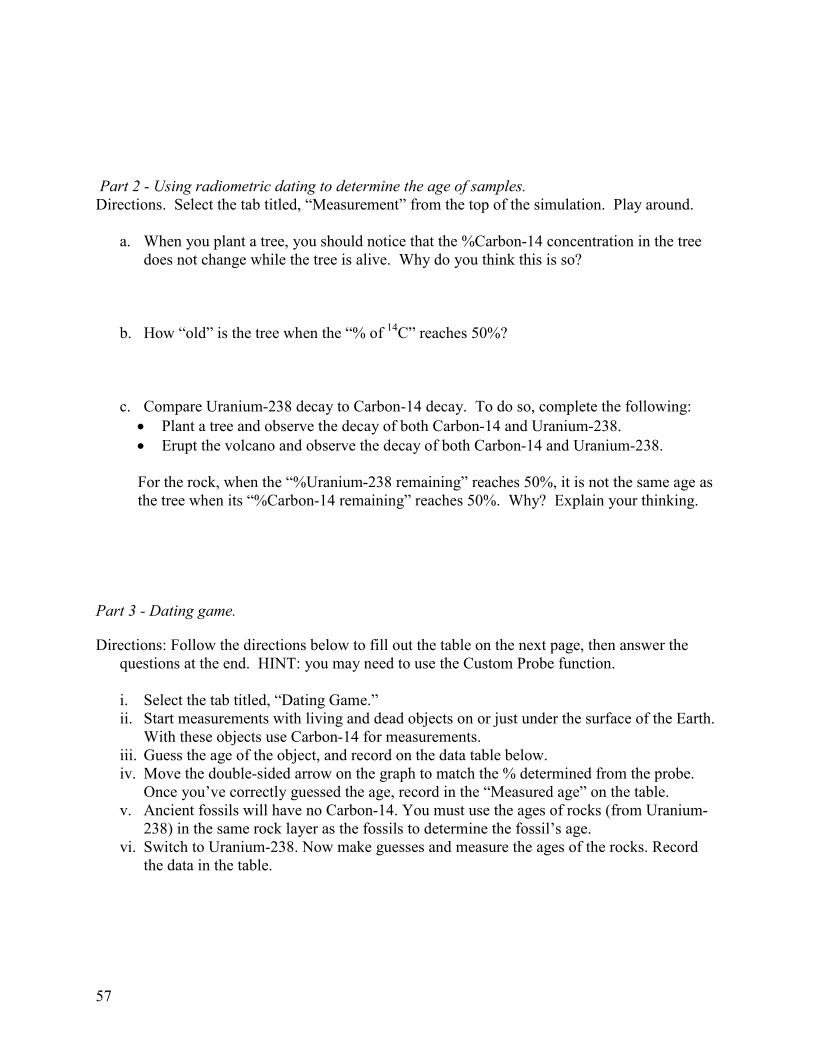
Part 2 - Using radiometric dating to determine the age of samples. Directions. Select the tab titled, “Measurement” from the top of the simulation. Play around.
a. When you plant a tree, you should notice that the %Carbon-14 concentration in the tree does not change while the tree is alive. Why do you think this is so?
b. How “old” is the tree when the “% of 14C” reaches 50%?
c. Compare Uranium-238 decay to Carbon-14 decay. To do so, complete the following: ! Plant a tree and observe the decay of both Carbon-14 and Uranium-238. ! Erupt the volcano and observe the decay of both Carbon-14 and Uranium-238. For the rock, when the “%Uranium-238 remaining” reaches 50%, it is not the same age as the tree when its “%Carbon-14 remaining” reaches 50%. Why? Explain your thinking.
Part 3 - Dating game.
Directions: Follow the directions below to fill out the table on the next page, then answer the questions at the end. HINT: you may need to use the Custom Probe function.
i. Select the tab titled, “Dating Game.” ii. Start measurements with living and dead objects on or just under the surface of the Earth.
With these objects use Carbon-14 for measurements. iii. Guess the age of the object, and record on the data table below. iv. Move the double-sided arrow on the graph to match the % determined from the probe.
Once you’ve correctly guessed the age, record in the “Measured age” on the table. v. Ancient fossils will have no Carbon-14. You must use the ages of rocks (from Uranium-
238) in the same rock layer as the fossils to determine the fossil’s age. vi. Switch to Uranium-238. Now make guesses and measure the ages of the rocks. Record
the data in the table.
58
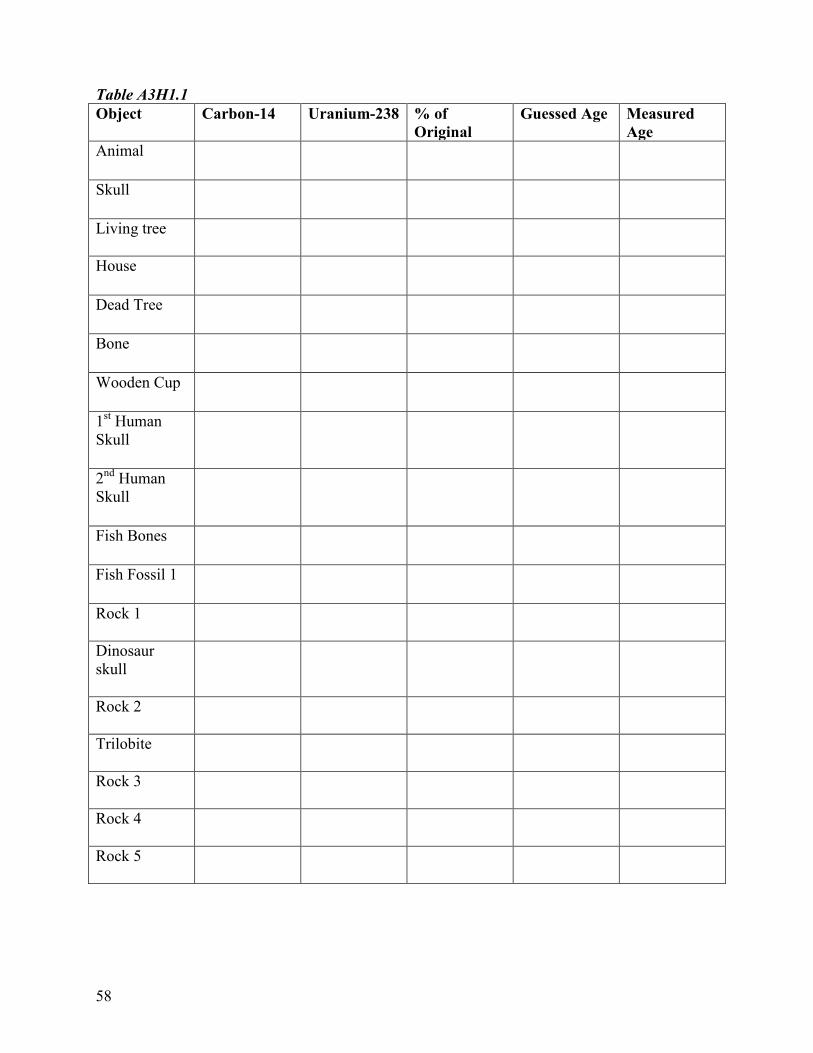
Table A3H1.1 Object! Carbon-14! Uranium-238! % of
Original!Guessed Age! Measured
Age!Animal !
! ! ! ! !
Skull !
! ! ! ! !
Living tree
! ! ! ! !
House !
! ! ! ! !
Dead Tree !
! ! ! ! !
Bone !
! ! ! ! !
Wooden Cup !
! ! ! ! !
1st Human Skull !
! ! ! ! !
2nd Human Skull !
! ! ! ! !
Fish Bones !
! ! ! ! !
Fish Fossil 1 !
! ! ! ! !
Rock 1
! ! ! ! !
Dinosaur skull
! ! ! ! !
Rock 2
! ! ! ! !
Trilobite
! ! ! ! !
Rock 3
! ! ! ! !
Rock 4
! ! ! ! !
Rock 5
! ! ! ! !
!
59
Answer in complete sentences.
a. Why can the “age” of both the house and dead tree be determined with Carbon-14 dating, yet the living trees cannot?
b. Which object did you find the most challenging to find the age? Why?
c. Do the ages of the objects in the simulation match your understanding of aging objects
through relative dating (principles of stratification)?
d. Carbon dating isn’t a valid technique for dating fossils beyond a certain age. It also is not
useful for dating inorganic items (such as rocks). How did you overcome its limitations?
e. What are two limits of using Uranium -238 in dating the age of objects?
f. How might scientists overcome to limitations of using Uranium-238 to date the age of objects?
60
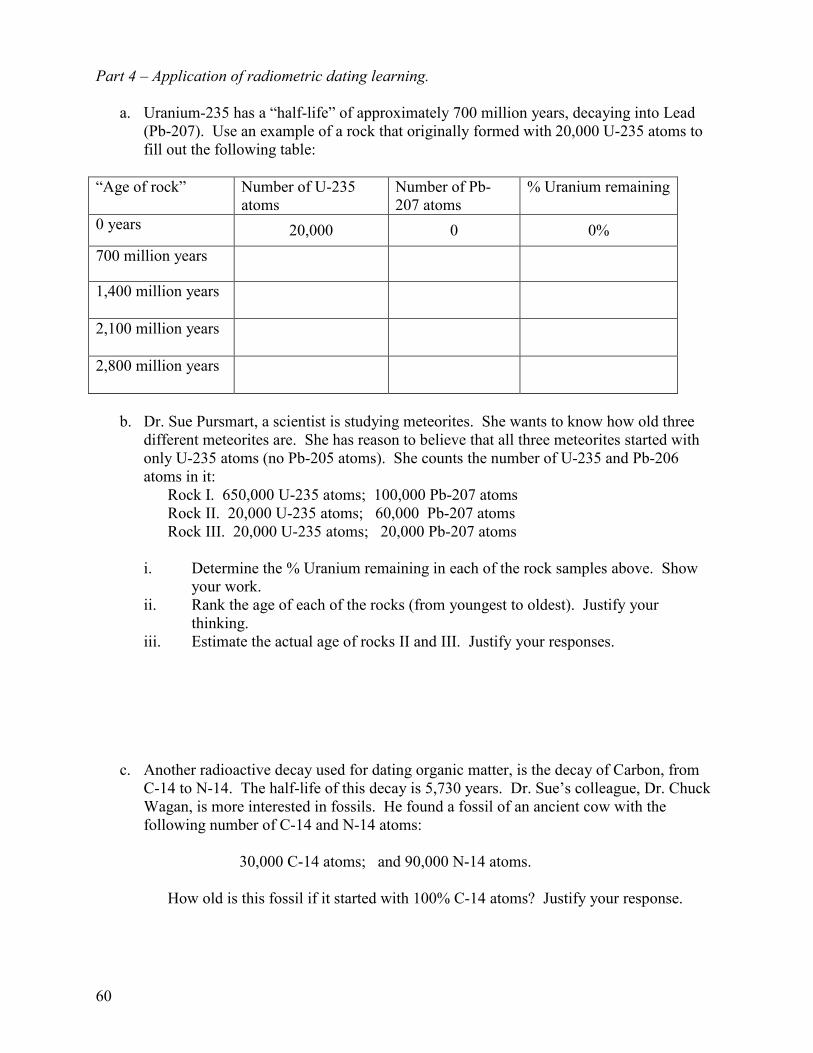
Part 4 – Application of radiometric dating learning.
a. Uranium-235 has a “half-life” of approximately 700 million years, decaying into Lead (Pb-207). Use an example of a rock that originally formed with 20,000 U-235 atoms to fill out the following table:
“Age of rock” Number of U-235
atoms Number of Pb-207 atoms
% Uranium remaining
0 years 20,000 0 0% 700 million years
1,400 million years
2,100 million years
2,800 million years
b. Dr. Sue Pursmart, a scientist is studying meteorites. She wants to know how old three
different meteorites are. She has reason to believe that all three meteorites started with only U-235 atoms (no Pb-205 atoms). She counts the number of U-235 and Pb-206 atoms in it:
Rock I. 650,000 U-235 atoms; 100,000 Pb-207 atoms Rock II. 20,000 U-235 atoms; 60,000 Pb-207 atoms Rock III. 20,000 U-235 atoms; 20,000 Pb-207 atoms
i. Determine the % Uranium remaining in each of the rock samples above. Show
your work. ii. Rank the age of each of the rocks (from youngest to oldest). Justify your
thinking. iii. Estimate the actual age of rocks II and III. Justify your responses.
c. Another radioactive decay used for dating organic matter, is the decay of Carbon, from
C-14 to N-14. The half-life of this decay is 5,730 years. Dr. Sue’s colleague, Dr. Chuck Wagan, is more interested in fossils. He found a fossil of an ancient cow with the following number of C-14 and N-14 atoms:
30,000 C-14 atoms; and 90,000 N-14 atoms.
How old is this fossil if it started with 100% C-14 atoms? Justify your response.
61
Part 5 – Extension questions.
a. When the remains of a tree or rock are aged with radioactive dating, age zero is defined by the formation of the object (the death of the organism or formation of the rock (i.e. cooling of igneous rock). Do you think radioactive dating would be useful to determine the age of sedimentary layers of rock? Explain your thoughts.
b. (optional) In some circles, radiometric dating is argued to be an unreliable method for determining the age of objects. Research the internet to determine one reason why some people do not trust radiometric dating, as well as a counter-point by a scientist. State the sources of all of your research. Two possible resources could be: i. http://www.answersingenesis.org/articles/nab/does-radiometric-dating-prove
(arguments against trusting radiometric dating) ii. http://www.asa3.org/ASA/resources/wiens.html (counter-arguments for trusting
radiometric dating).
""""" "
62
ACTIVITY 5: The Earth’s Story PURPOSE In this activity you will be inferring the timing of some of the big events in Earth’s history and using them to populate your timeline. However, instead of being told specific dates, you will reason through different scenarios to understand how we know some of what we do about Earth’s history. Q. What are the major events in the Earth’s history and when did they happen? INITIAL IDEAS Go back to the list of events in the initial ideas on the first page of this cycle. Would you re-order anything? Final order:
1.
2.
3.
4.
5.
6.
7.
8.
9.
10.
11.
12.
What evidence did you discuss to help you revise your order?
Again, thinking about the age of Earth as an hour, with 0 minutes as the beginning of the Earth and 60 minutes as now, do you have a revision of your estimate of the time that each event took place?
Event Time (0 to 60 minutes) 1. 2. 3. 4. 5. 6. 7. 8. 9. 10. 11. 12.
63
COLLECTING AND INTERPRETING EVIDENCE Inferring and locating important events on Earth’s Timeline YOU WILL NEED:
! String (4 m long) ! Event cards from initial ideas ! Blank index cards
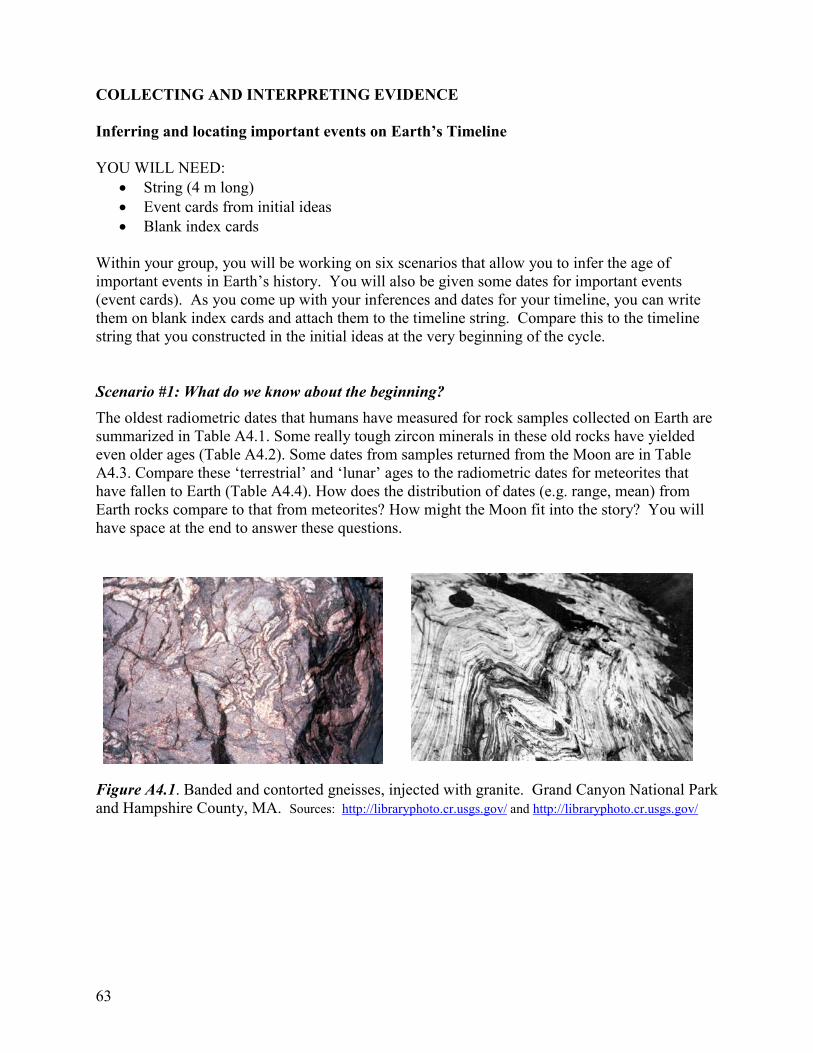
Within your group, you will be working on six scenarios that allow you to infer the age of important events in Earth’s history. You will also be given some dates for important events (event cards). As you come up with your inferences and dates for your timeline, you can write them on blank index cards and attach them to the timeline string. Compare this to the timeline string that you constructed in the initial ideas at the very beginning of the cycle. Scenario #1: What do we know about the beginning? The oldest radiometric dates that humans have measured for rock samples collected on Earth are summarized in Table A4.1. Some really tough zircon minerals in these old rocks have yielded even older ages (Table A4.2). Some dates from samples returned from the Moon are in Table A4.3. Compare these ‘terrestrial’ and ‘lunar’ ages to the radiometric dates for meteorites that have fallen to Earth (Table A4.4). How does the distribution of dates (e.g. range, mean) from Earth rocks compare to that from meteorites? How might the Moon fit into the story? You will have space at the end to answer these questions.
Figure A4.1. Banded and contorted gneisses, injected with granite. Grand Canyon National Park and Hampshire County, MA. Sources: http://libraryphoto.cr.usgs.gov/ and http://libraryphoto.cr.usgs.gov/
64
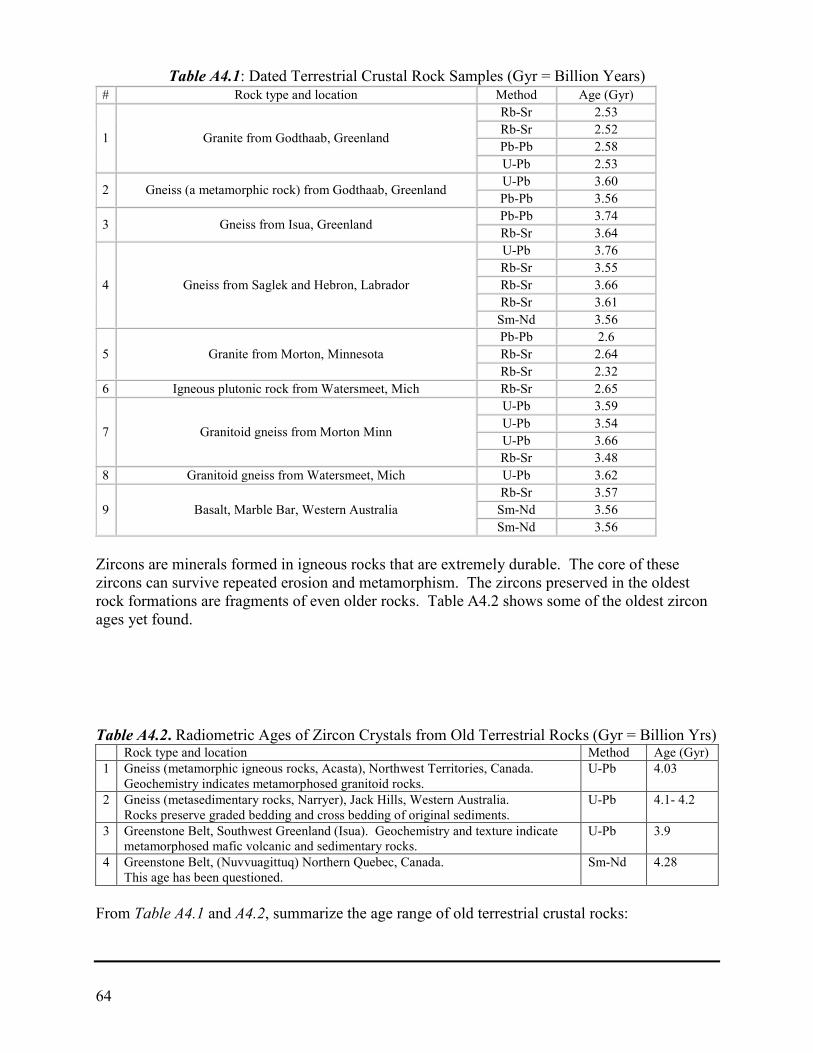
Table A4.1: Dated Terrestrial Crustal Rock Samples (Gyr = Billion Years) # Rock type and location Method Age (Gyr)
1 Granite from Godthaab, Greenland
Rb-Sr 2.53 Rb-Sr 2.52 Pb-Pb 2.58 U-Pb 2.53
2 Gneiss (a metamorphic rock) from Godthaab, Greenland U-Pb 3.60 Pb-Pb 3.56
3 Gneiss from Isua, Greenland Pb-Pb 3.74 Rb-Sr 3.64
4 Gneiss from Saglek and Hebron, Labrador
U-Pb 3.76 Rb-Sr 3.55 Rb-Sr 3.66 Rb-Sr 3.61
Sm-Nd 3.56
5 Granite from Morton, Minnesota Pb-Pb 2.6 Rb-Sr 2.64 Rb-Sr 2.32
6 Igneous plutonic rock from Watersmeet, Mich Rb-Sr 2.65
7 Granitoid gneiss from Morton Minn
U-Pb 3.59 U-Pb 3.54 U-Pb 3.66 Rb-Sr 3.48
8 Granitoid gneiss from Watersmeet, Mich U-Pb 3.62
9 Basalt, Marble Bar, Western Australia Rb-Sr 3.57
Sm-Nd 3.56 Sm-Nd 3.56
Zircons are minerals formed in igneous rocks that are extremely durable. The core of these zircons can survive repeated erosion and metamorphism. The zircons preserved in the oldest rock formations are fragments of even older rocks. Table A4.2 shows some of the oldest zircon ages yet found.
Table A4.2. Radiometric Ages of Zircon Crystals from Old Terrestrial Rocks (Gyr = Billion Yrs)
Rock type and location Method Age (Gyr) 1 Gneiss (metamorphic igneous rocks, Acasta), Northwest Territories, Canada.
Geochemistry indicates metamorphosed granitoid rocks. U-Pb 4.03
2 Gneiss (metasedimentary rocks, Narryer), Jack Hills, Western Australia. Rocks preserve graded bedding and cross bedding of original sediments.
U-Pb 4.1- 4.2
3 Greenstone Belt, Southwest Greenland (Isua). Geochemistry and texture indicate metamorphosed mafic volcanic and sedimentary rocks.
U-Pb 3.9
4 Greenstone Belt, (Nuvvuagittuq) Northern Quebec, Canada. This age has been questioned.
Sm-Nd 4.28
From Table A4.1 and A4.2, summarize the age range of old terrestrial crustal rocks:
65
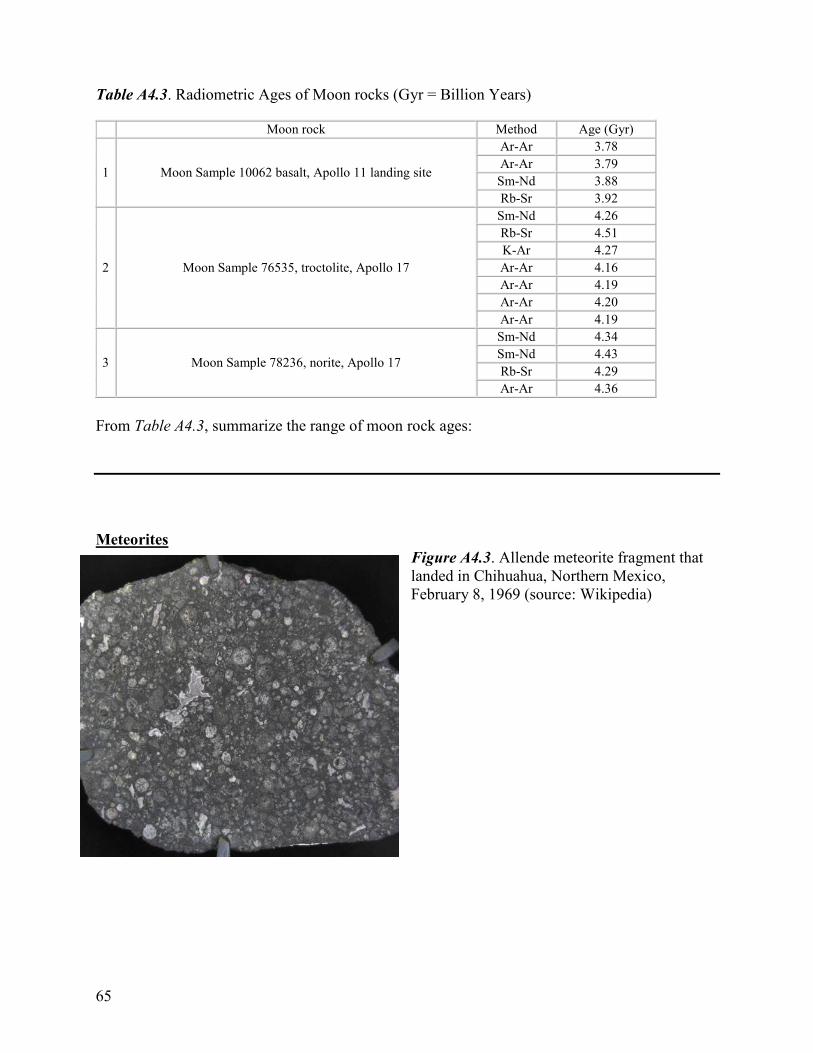
Table A4.3. Radiometric Ages of Moon rocks (Gyr = Billion Years)
Moon rock Method Age (Gyr)
1 Moon Sample 10062 basalt, Apollo 11 landing site
Ar-Ar 3.78 Ar-Ar 3.79 Sm-Nd 3.88 Rb-Sr 3.92
2 Moon Sample 76535, troctolite, Apollo 17
Sm-Nd 4.26 Rb-Sr 4.51 K-Ar 4.27 Ar-Ar 4.16 Ar-Ar 4.19 Ar-Ar 4.20 Ar-Ar 4.19
3 Moon Sample 78236, norite, Apollo 17
Sm-Nd 4.34 Sm-Nd 4.43 Rb-Sr 4.29 Ar-Ar 4.36
From Table A4.3, summarize the range of moon rock ages:
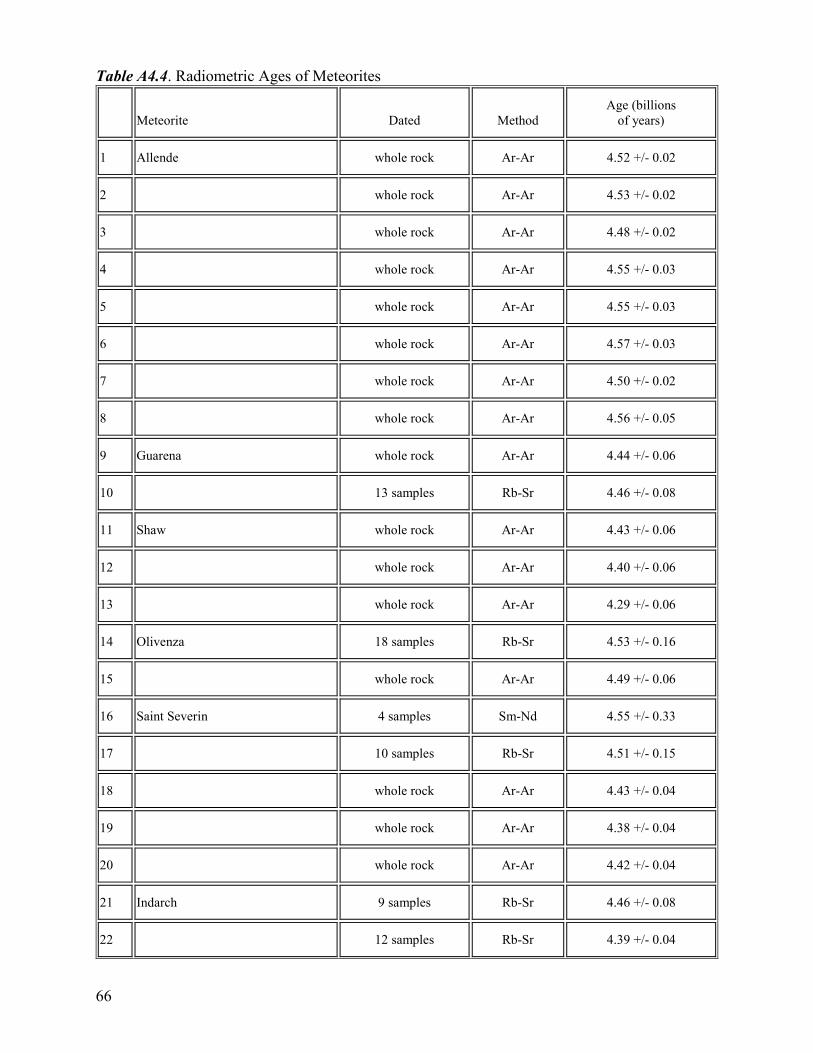
Meteorites
Figure A4.3. Allende meteorite fragment that landed in Chihuahua, Northern Mexico, February 8, 1969 (source: Wikipedia)
66
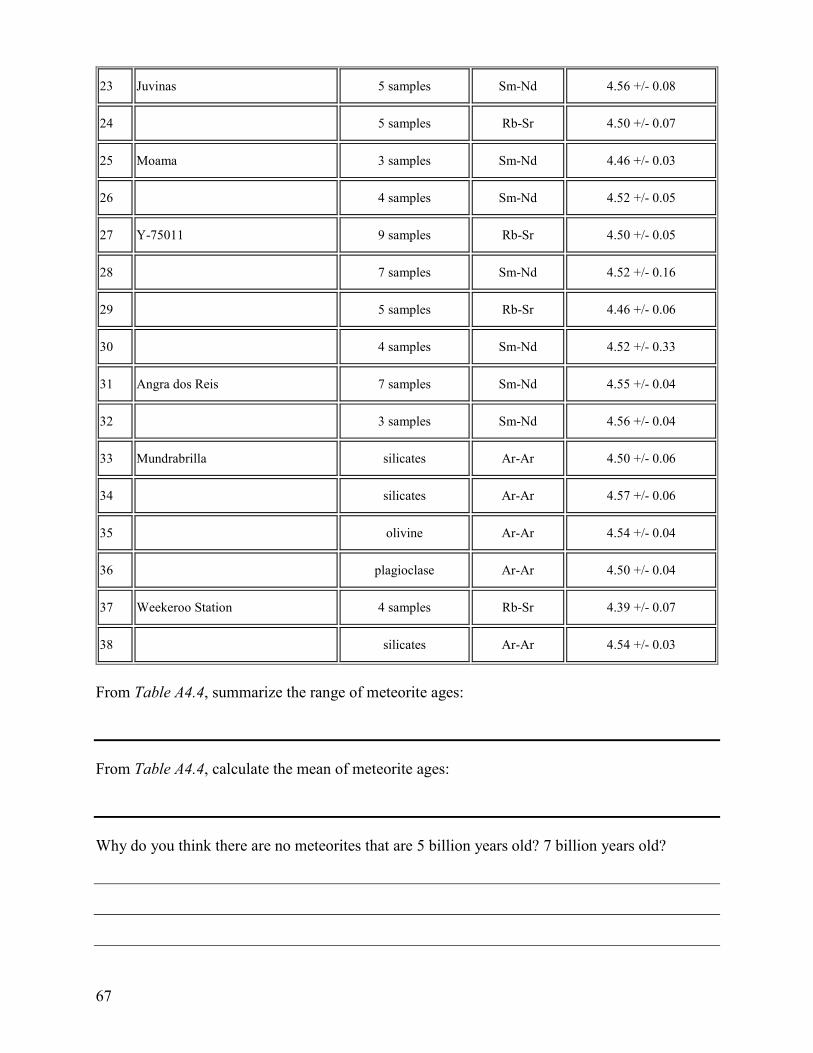
Table A4.4. Radiometric Ages of Meteorites
Meteorite Dated Method
Age (billions of years)
1 Allende whole rock Ar-Ar 4.52 +/- 0.02
2
whole rock Ar-Ar 4.53 +/- 0.02
3
whole rock Ar-Ar 4.48 +/- 0.02
4
whole rock Ar-Ar 4.55 +/- 0.03
5
whole rock Ar-Ar 4.55 +/- 0.03
6
whole rock Ar-Ar 4.57 +/- 0.03
7
whole rock Ar-Ar 4.50 +/- 0.02
8
whole rock Ar-Ar 4.56 +/- 0.05
9 Guarena whole rock Ar-Ar 4.44 +/- 0.06
10
13 samples Rb-Sr 4.46 +/- 0.08
11 Shaw whole rock Ar-Ar 4.43 +/- 0.06
12
whole rock Ar-Ar 4.40 +/- 0.06
13
whole rock Ar-Ar 4.29 +/- 0.06
14 Olivenza 18 samples Rb-Sr 4.53 +/- 0.16
15
whole rock Ar-Ar 4.49 +/- 0.06
16 Saint Severin 4 samples Sm-Nd 4.55 +/- 0.33
17
10 samples Rb-Sr 4.51 +/- 0.15
18
whole rock Ar-Ar 4.43 +/- 0.04
19
whole rock Ar-Ar 4.38 +/- 0.04
20
whole rock Ar-Ar 4.42 +/- 0.04
21 Indarch 9 samples Rb-Sr 4.46 +/- 0.08
22
12 samples Rb-Sr 4.39 +/- 0.04
67
23 Juvinas 5 samples Sm-Nd 4.56 +/- 0.08
24
5 samples Rb-Sr 4.50 +/- 0.07
25 Moama 3 samples Sm-Nd 4.46 +/- 0.03
26
4 samples Sm-Nd 4.52 +/- 0.05
27 Y-75011 9 samples Rb-Sr 4.50 +/- 0.05
28
7 samples Sm-Nd 4.52 +/- 0.16
29
5 samples Rb-Sr 4.46 +/- 0.06
30
4 samples Sm-Nd 4.52 +/- 0.33
31 Angra dos Reis 7 samples Sm-Nd 4.55 +/- 0.04
32
3 samples Sm-Nd 4.56 +/- 0.04
33 Mundrabrilla silicates Ar-Ar 4.50 +/- 0.06
34
silicates Ar-Ar 4.57 +/- 0.06
35
olivine Ar-Ar 4.54 +/- 0.04
36
plagioclase Ar-Ar 4.50 +/- 0.04
37 Weekeroo Station 4 samples Rb-Sr 4.39 +/- 0.07
38
silicates Ar-Ar 4.54 +/- 0.03
From Table A4.4, summarize the range of meteorite ages:
From Table A4.4, calculate the mean of meteorite ages:
Why do you think there are no meteorites that are 5 billion years old? 7 billion years old?
68
What do you think the narrow range of meteorite ages means for the formation of the solar system? (in fact, every meteorite ever dated that isn’t from Mars or the Moon falls within this narrow age range)
Given all this age data, tell a story about Earth’s early history. Things to think about:
1. What do meteorites tell us about the age of the solar system and the age of Earth? 2. Earth’s interior is presently layered (core, mantle, crust). Was it always? 3. Earth’s crust is divided into continents and ocean basins. Was this distinction always
present? 4. How do the ages of the oldest rocks and minerals on Earth relate to the overall age of the
Earth? 5. Earth’s surface hosts a giant ocean. Was there always liquid water?
69
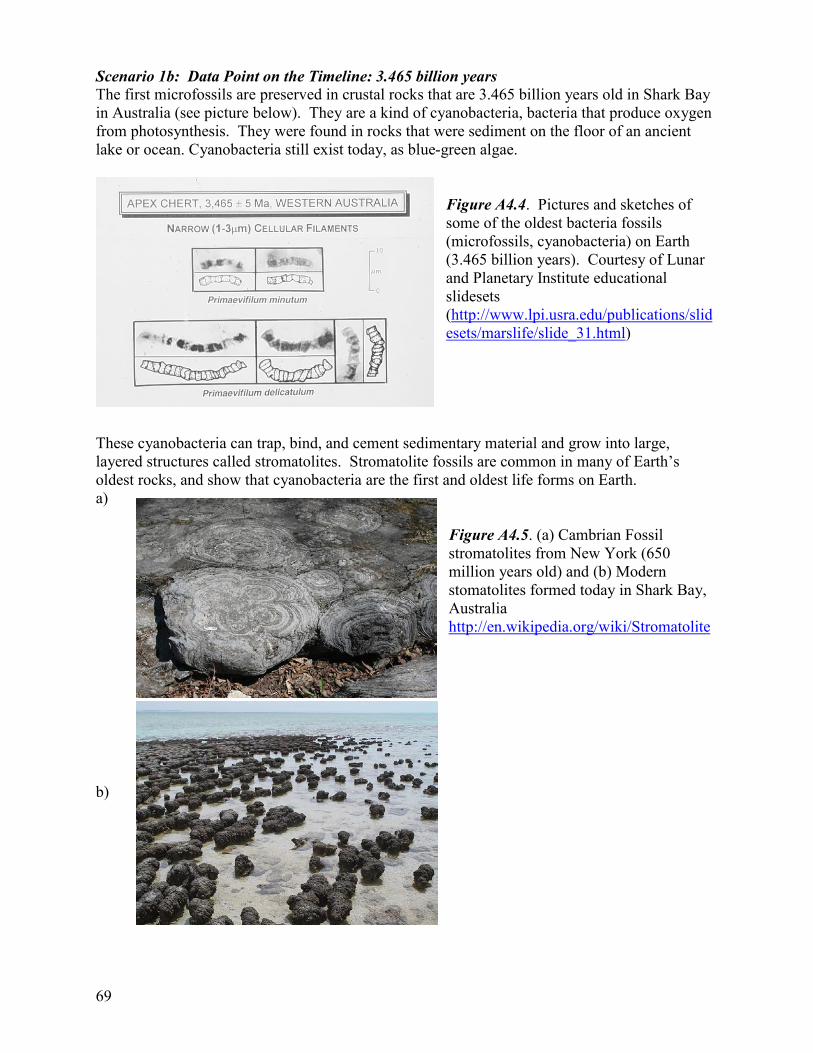
Scenario 1b: Data Point on the Timeline: 3.465 billion years The first microfossils are preserved in crustal rocks that are 3.465 billion years old in Shark Bay in Australia (see picture below). They are a kind of cyanobacteria, bacteria that produce oxygen from photosynthesis. They were found in rocks that were sediment on the floor of an ancient lake or ocean. Cyanobacteria still exist today, as blue-green algae.
Figure A4.4. Pictures and sketches of some of the oldest bacteria fossils (microfossils, cyanobacteria) on Earth (3.465 billion years). Courtesy of Lunar and Planetary Institute educational slidesets (http://www.lpi.usra.edu/publications/slidesets/marslife/slide_31.html)
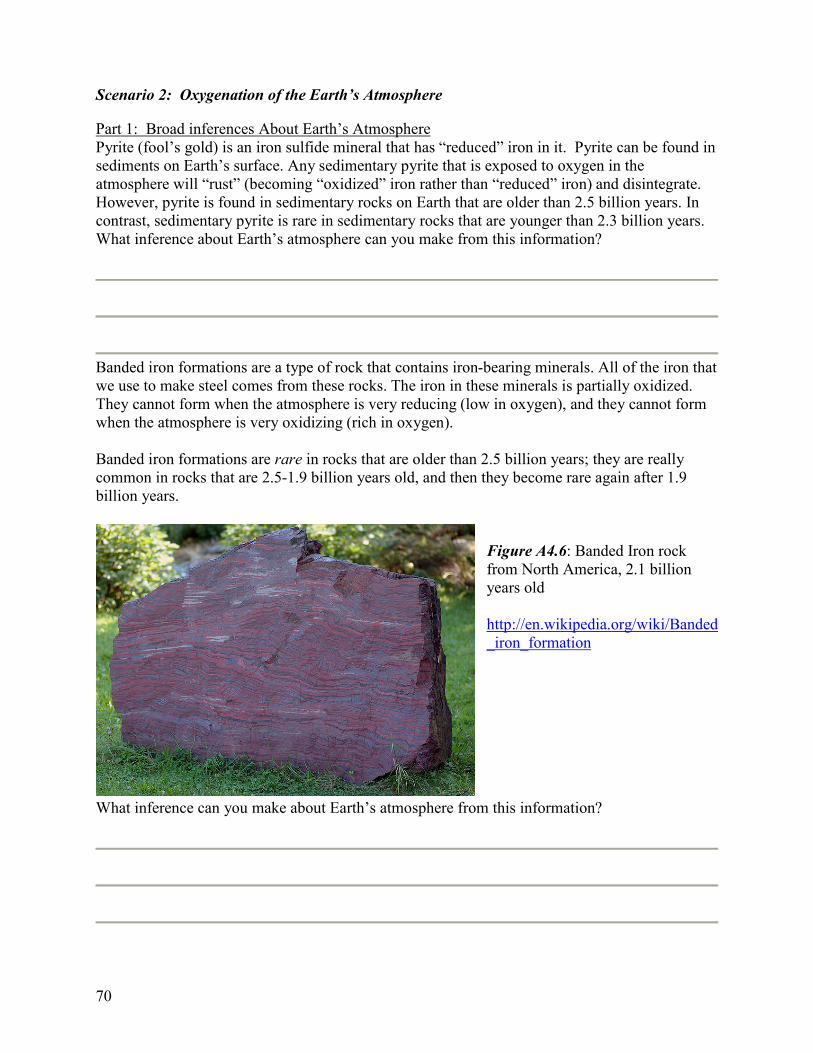
These cyanobacteria can trap, bind, and cement sedimentary material and grow into large, layered structures called stromatolites. Stromatolite fossils are common in many of Earth’s oldest rocks, and show that cyanobacteria are the first and oldest life forms on Earth. a)
Figure A4.5. (a) Cambrian Fossil stromatolites from New York (650 million years old) and (b) Modern stomatolites formed today in Shark Bay, Australia http://en.wikipedia.org/wiki/Stromatolite
b)
70
Scenario 2: Oxygenation of the Earth’s Atmosphere
Part 1: Broad inferences About Earth’s Atmosphere Pyrite (fool’s gold) is an iron sulfide mineral that has “reduced” iron in it. Pyrite can be found in sediments on Earth’s surface. Any sedimentary pyrite that is exposed to oxygen in the atmosphere will “rust” (becoming “oxidized” iron rather than “reduced” iron) and disintegrate. However, pyrite is found in sedimentary rocks on Earth that are older than 2.5 billion years. In contrast, sedimentary pyrite is rare in sedimentary rocks that are younger than 2.3 billion years. What inference about Earth’s atmosphere can you make from this information?
Banded iron formations are a type of rock that contains iron-bearing minerals. All of the iron that we use to make steel comes from these rocks. The iron in these minerals is partially oxidized. They cannot form when the atmosphere is very reducing (low in oxygen), and they cannot form when the atmosphere is very oxidizing (rich in oxygen). Banded iron formations are rare in rocks that are older than 2.5 billion years; they are really common in rocks that are 2.5-1.9 billion years old, and then they become rare again after 1.9 billion years.
Figure A4.6: Banded Iron rock from North America, 2.1 billion years old http://en.wikipedia.org/wiki/Banded_iron_formation
What inference can you make about Earth’s atmosphere from this information?
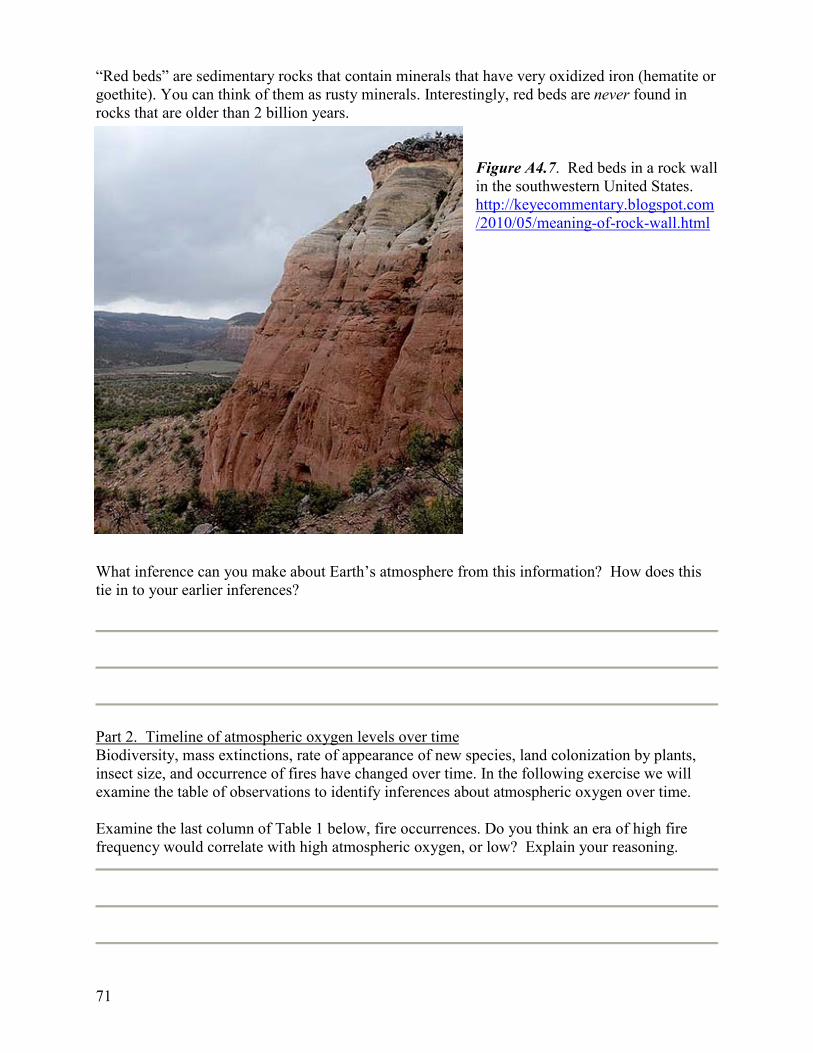
71
“Red beds” are sedimentary rocks that contain minerals that have very oxidized iron (hematite or goethite). You can think of them as rusty minerals. Interestingly, red beds are never found in rocks that are older than 2 billion years.
Figure A4.7. Red beds in a rock wall in the southwestern United States. http://keyecommentary.blogspot.com/2010/05/meaning-of-rock-wall.html
What inference can you make about Earth’s atmosphere from this information? How does this tie in to your earlier inferences?
Part 2. Timeline of atmospheric oxygen levels over time Biodiversity, mass extinctions, rate of appearance of new species, land colonization by plants, insect size, and occurrence of fires have changed over time. In the following exercise we will examine the table of observations to identify inferences about atmospheric oxygen over time. Examine the last column of Table 1 below, fire occurrences. Do you think an era of high fire frequency would correlate with high atmospheric oxygen, or low? Explain your reasoning.
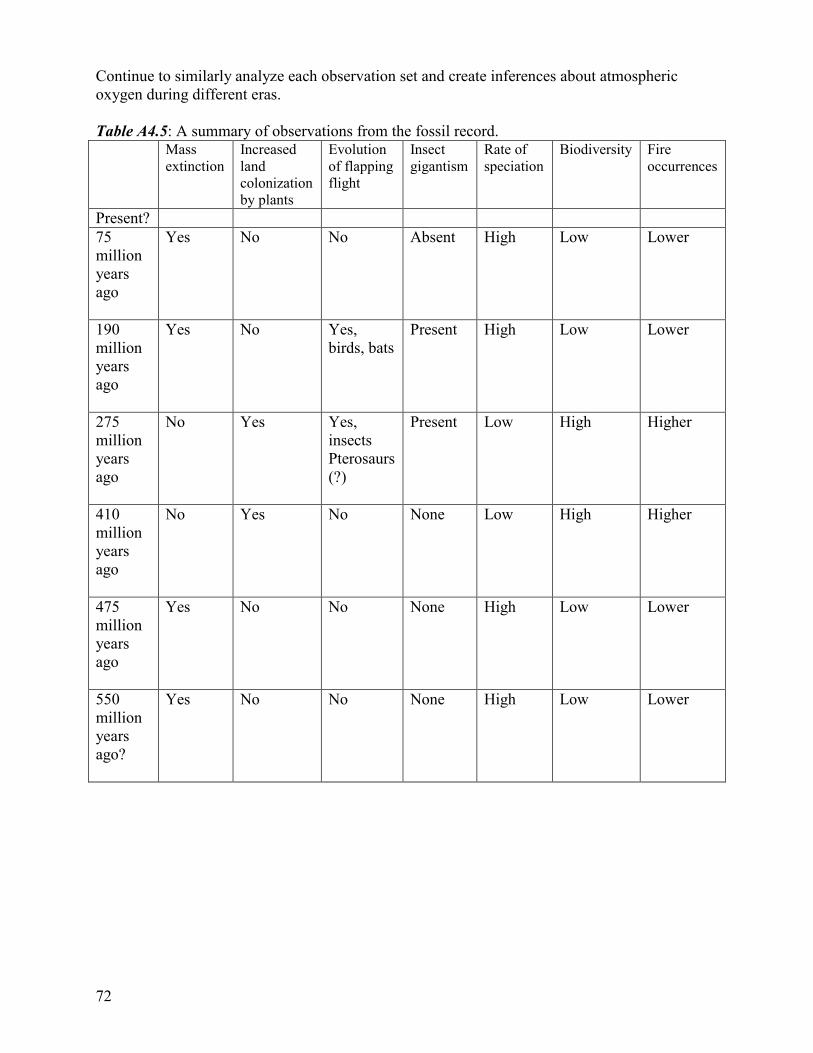
72
Continue to similarly analyze each observation set and create inferences about atmospheric oxygen during different eras. Table A4.5: A summary of observations from the fossil record. Mass
extinction Increased land colonization by plants
Evolution of flapping flight
Insect gigantism
Rate of speciation
Biodiversity Fire occurrences
Present? 75 million years ago
Yes No No Absent High Low Lower
190 million years ago
Yes No Yes, birds, bats
Present High Low Lower
275 million years ago
No Yes Yes, insects Pterosaurs (?)
Present Low High Higher
410 million years ago
No Yes No None Low High Higher
475 million years ago
Yes No No None High Low Lower
550 million years ago?
Yes No No None High Low Lower
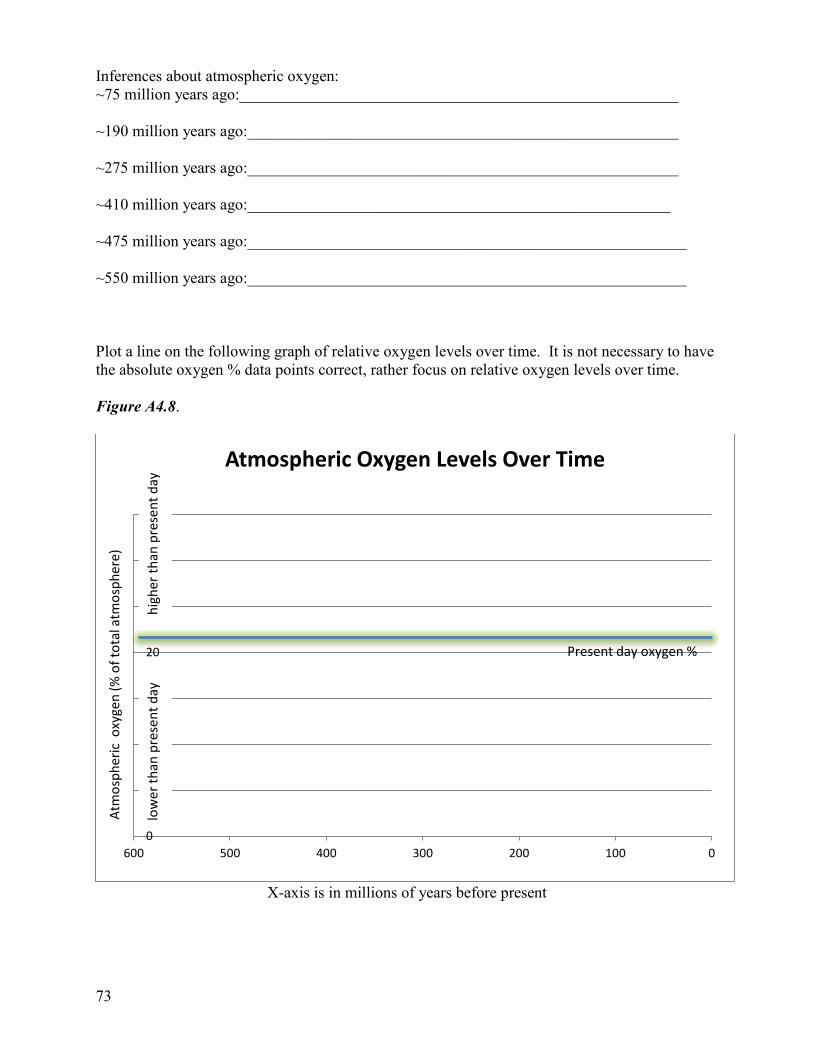
73
Inferences about atmospheric oxygen: ~75 million years ago:_______________________________________________________ ~190 million years ago:______________________________________________________ ~275 million years ago:______________________________________________________ ~410 million years ago:_____________________________________________________ ~475 million years ago:_______________________________________________________ ~550 million years ago:_______________________________________________________ Plot a line on the following graph of relative oxygen levels over time. It is not necessary to have the absolute oxygen % data points correct, rather focus on relative oxygen levels over time. Figure A4.8.
X-axis is in millions of years before present
B
G
"B
"G
DB
DG
EB
EG
B"BBDBBEBBFBBGBBHBB
>.5+0?/'%&1!@A4;',!B'3'60!@3'%!C&5'!
?,&$340
'%(/!!$L1:')!MC
!$*!,$,+<!+,&
$340
'%'N!
!
O%'3'),!P+1!$L1:')!C!
0(:0'%!,0
+)!4%'3'),!P+1!
<$8'%!,0
+)!4%'3'),!P+1!

74
Scientists’ Ideas: Atmospheric oxygen fluctuations throughout Earth’s history have coincided with many large-scale changes in biota. In general, during times of increased atmospheric oxygen, species are more diverse, larger, and more complex. Below are explanations of how each phenomenon in the data table are affected by atmospheric oxygen levels. Insect gigantism: The limiting factor controlling insect body size is oxygen perfusion to the tissues throughout the body. The bigger the insect, the more oxygen is necessary to adequately perfuse all tissues Therefore, high oxygen environments better support larger insect bodies. Very large insects such as a dragonfly with a 30-inch wingspan are known from fossils of the Carboniferous time. Biodiversity: Throughout time, all mass extinctions have coincided with sharp drops in atmospheric oxygen levels. Species that evolve to be adapted to higher atmospheric oxygen levels are unable to adequately perfuse tissues with oxygen in lower oxygen environments, leading to high rates of extinction, and corresponding lower biodiversity. Closely tied to this is the trend that low oxygen environments coincide with higher rates of speciation. Lower biodiversity opens up niches allowing for the evolution of new low oxygen environment tolerant species, to fill those niches. Evolution of flight: flying insects and birds have some of the highest metabolic rates of any animals in order to support the energy demands of flight. Higher metabolic rates necessitate higher rates of oxygen intake. Periods of relatively high atmospheric oxygen facilitate increased oxygen intake, allowing for increased evolution of flight. Also, the addition of more oxygen to the atmosphere increases the overall gas pressure of the atmosphere resulting in increased lift during flight. Fire frequency: Flammability is closely related to atmospheric oxygen levels. Various atmospheric oxygen concentrations yield the following results: 15% oxygen is too low for fires to spread, 25% - 30% oxygen is high enough for even wet plants to burn, and oxygen levels of 30-35% is enough for fires to be frequent and catastrophic. Increased land colonization by plant: During this era, a greater proportion of the planet’s biomass was terrestrially based (on the continents). Since plants photosynthesize, they tend to raise atmospheric Oxygen. However, much of this oxygen reacts in the decaying of those plants, resulting in no net change to the atmospheric concentration. This balance is disrupted if the plants are being buried before decomposing. When more of the biomass is terrestrial, global burial rates of dead plant tissue increase, reducing the amount of oxygen required to decay the carbon based material. Overall, this results in a net increase of atmospheric oxygen levels. Small group discussion. Share the most surprising thing you discovered about how the connection between Oxygen and life over time on the Earth. _______________________________________________________________________ _______________________________________________________________________ _______________________________________________________________________
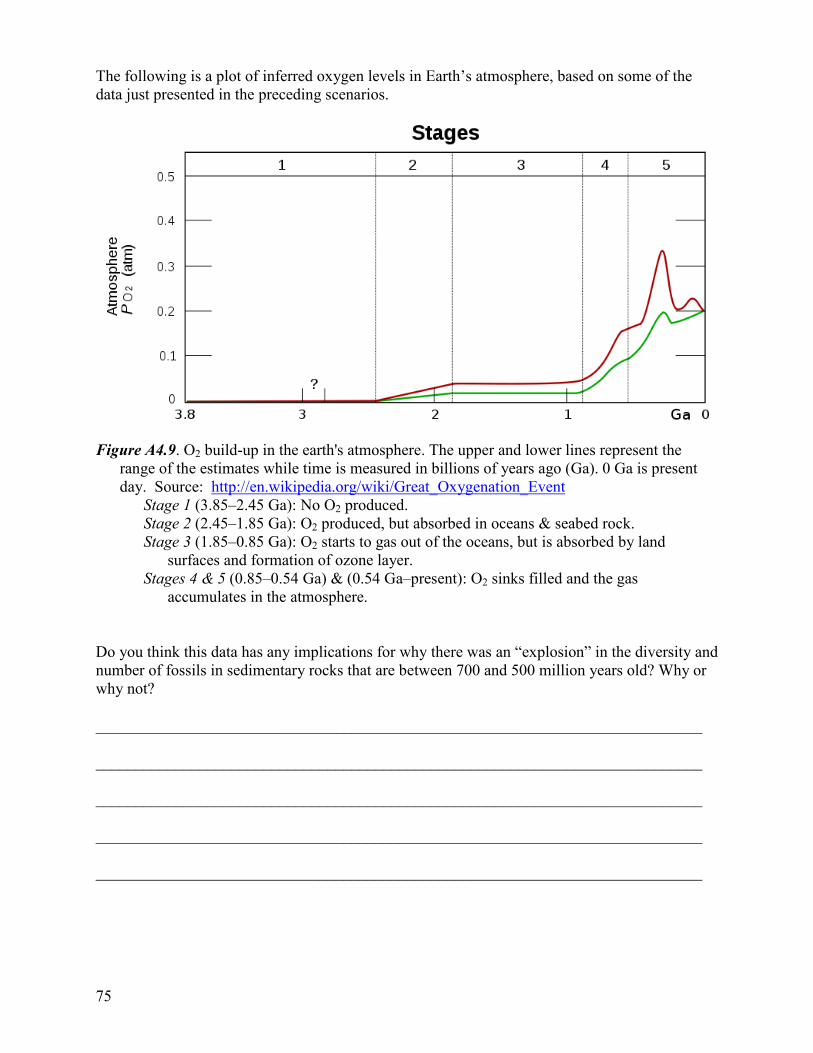
75
The following is a plot of inferred oxygen levels in Earth’s atmosphere, based on some of the data just presented in the preceding scenarios.
Figure A4.9. O2 build-up in the earth's atmosphere. The upper and lower lines represent the
range of the estimates while time is measured in billions of years ago (Ga). 0 Ga is present day. Source: http://en.wikipedia.org/wiki/Great_Oxygenation_Event
Stage 1 (3.85–2.45 Ga): No O2 produced. Stage 2 (2.45–1.85 Ga): O2 produced, but absorbed in oceans & seabed rock. Stage 3 (1.85–0.85 Ga): O2 starts to gas out of the oceans, but is absorbed by land
surfaces and formation of ozone layer. Stages 4 & 5 (0.85–0.54 Ga) & (0.54 Ga–present): O2 sinks filled and the gas
accumulates in the atmosphere. Do you think this data has any implications for why there was an “explosion” in the diversity and number of fossils in sedimentary rocks that are between 700 and 500 million years old? Why or why not? ____________________________________________________________________________ ____________________________________________________________________________ ____________________________________________________________________________ ____________________________________________________________________________ ____________________________________________________________________________
76
Scenario 3: Colonization of Land As we saw in Activity 1, fossils are remains of living things found preserved in sedimentary rock. Fossils are most commonly bones or shells from animals and leaves or stems from plants. Occasionally, other parts of living things (skin, flowers, seeds, etc.) are preserved as well. Fossils are found in rocks that have been deposited over hundreds of millions of years, so they allow us to see how plants and animals have changed over time. Using what you know about biostratigraphy, the layering of the fossils will tell you the relative ages of the fossils. Make a prediction about whether the earliest land plant fossils or the earliest land animal fossils will be found in lower layers in the rock outcroppings (remember from the principle of superposition that lower layers are older than higher layers). Explain your reasoning. ____________________________________________________________________________________________________________________________________________________________ ____________________________________________________ Geologists studying the relative stratigraphic positions of land plant fossils (vascular plants) and land animal fossils (tetrapods) have found that land animal fossils are never found in rock layers anywhere on Earth older than late Devonian (~375 million years ago), whereas land plant fossils begin to be abundant in Silurian rocks (~450 million years) and younger (but they are never found in rocks older than Ordovician). What does this tell you about which evolved first on Earth? Land plants or Land animals? Why do you think this might be? ____________________________________________________________________________________________________________________________________________________________ ____________________________________________________ Why do you think land plants developed before land animals? ____________________________________________________________________________________________________________________________________________________________ ____________________________________________________ Describe what the Cambrian land surface (~500 million years ago) might have looked like (make sure to review information on the previous page). ____________________________________________________________________________________________________________________________________________________________ ____________________________________________________

77
In thinking of how the colonization of land plants and animals fits into the order of things, what do you think had to happen in order for plants to colonize the land? ____________________________________________________________________________________________________________________________________________________________ ____________________________________________________
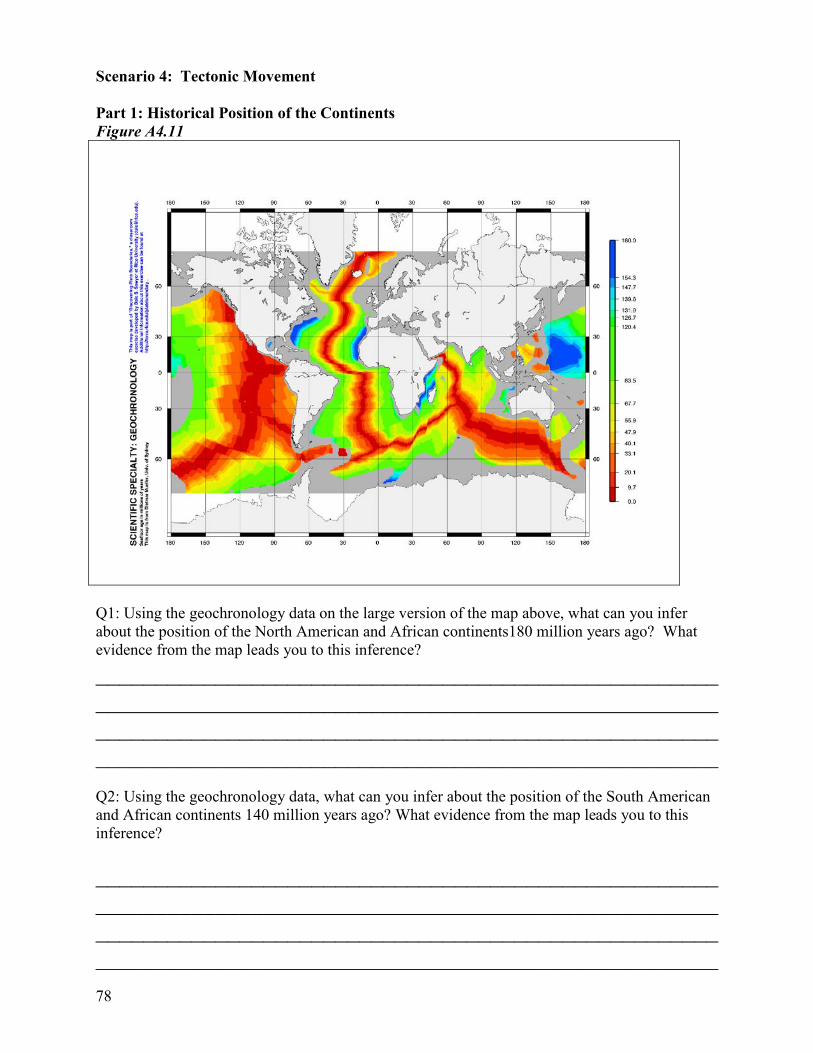
78
Scenario 4: Tectonic Movement Part 1: Historical Position of the Continents Figure A4.11
Q1: Using the geochronology data on the large version of the map above, what can you infer about the position of the North American and African continents180 million years ago? What evidence from the map leads you to this inference? ________________________________________________________________________________________________________________________________________________________________________________________________________________ Q2: Using the geochronology data, what can you infer about the position of the South American and African continents 140 million years ago? What evidence from the map leads you to this inference? ________________________________________________________________________________________________________________________________________________________________________________________________________________
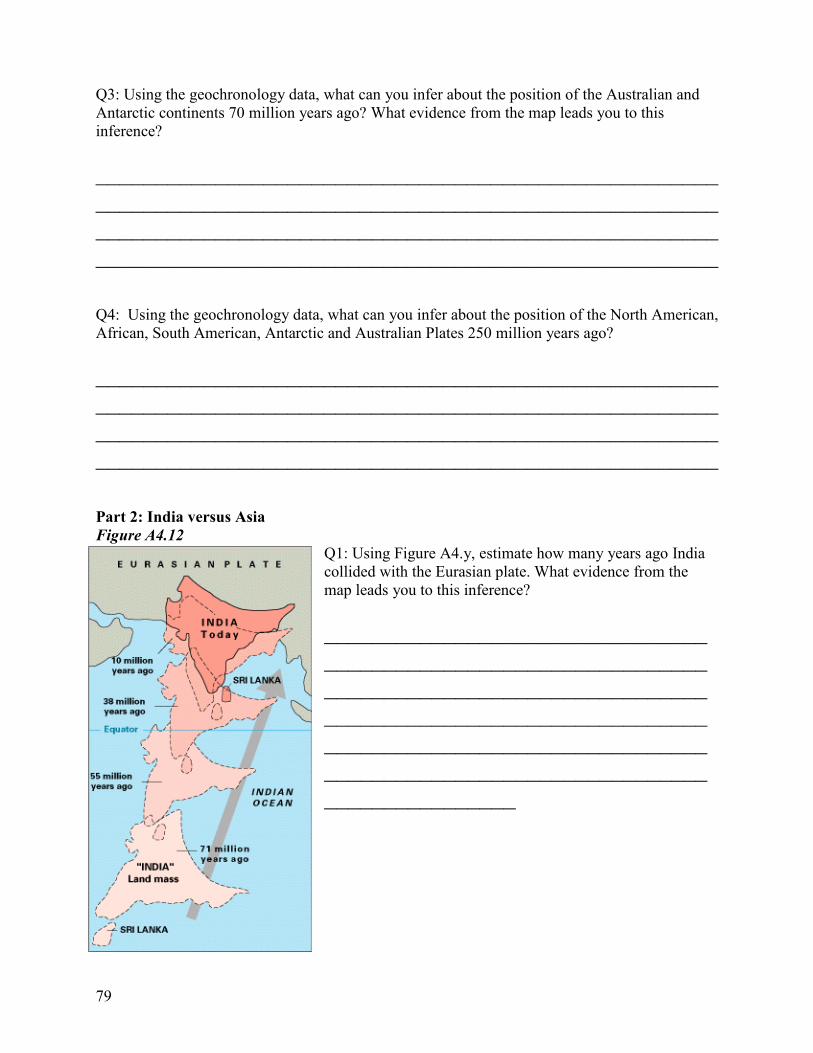
79
Q3: Using the geochronology data, what can you infer about the position of the Australian and Antarctic continents 70 million years ago? What evidence from the map leads you to this inference? ________________________________________________________________________________________________________________________________________________________________________________________________________________ Q4: Using the geochronology data, what can you infer about the position of the North American, African, South American, Antarctic and Australian Plates 250 million years ago? ________________________________________________________________________________________________________________________________________________________________________________________________________________ Part 2: India versus Asia Figure A4.12
Q1: Using Figure A4.y, estimate how many years ago India collided with the Eurasian plate. What evidence from the map leads you to this inference? ________________________________________________________________________________________________________________________________________________________________________________________________________________
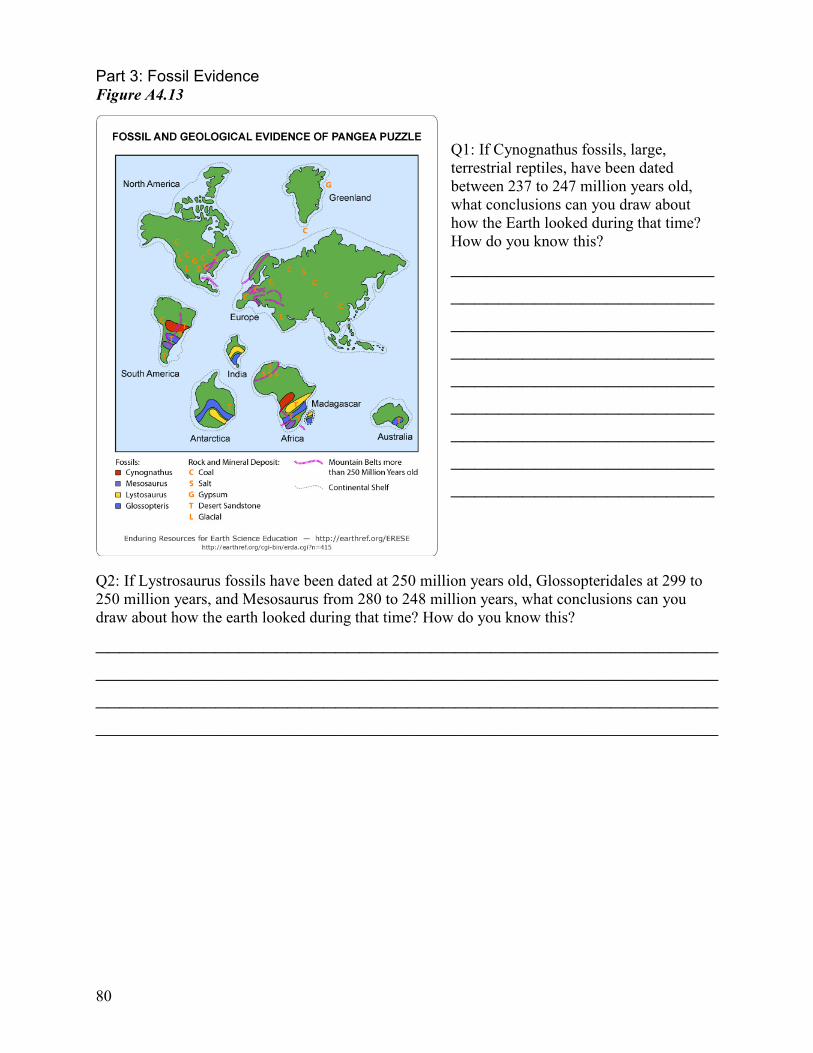
80
Part 3: Fossil Evidence Figure A4.13
Q1: If Cynognathus fossils, large, terrestrial reptiles, have been dated between 237 to 247 million years old, what conclusions can you draw about how the Earth looked during that time? How do you know this? ______________________________________________________________________________________________________________________________________________________________________________________________________
Q2: If Lystrosaurus fossils have been dated at 250 million years old, Glossopteridales at 299 to 250 million years, and Mesosaurus from 280 to 248 million years, what conclusions can you draw about how the earth looked during that time? How do you know this? ________________________________________________________________________________________________________________________________________________________________________________________________________________
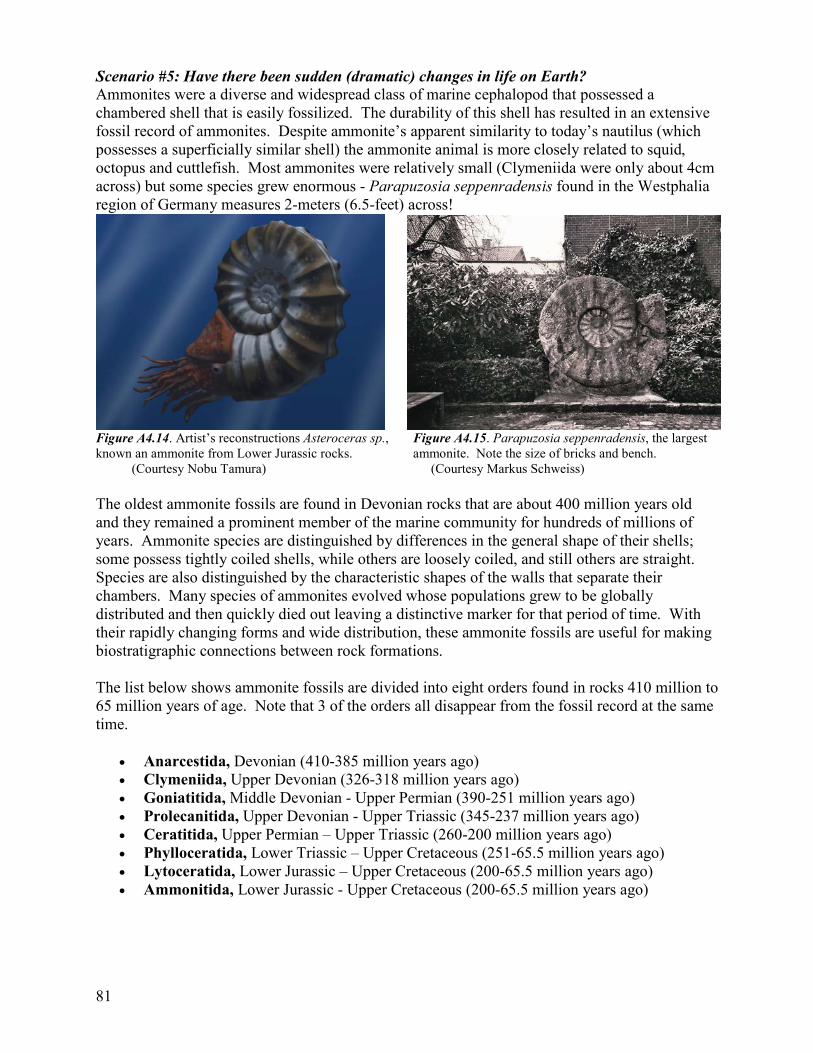
81
Scenario #5: Have there been sudden (dramatic) changes in life on Earth? Ammonites were a diverse and widespread class of marine cephalopod that possessed a chambered shell that is easily fossilized. The durability of this shell has resulted in an extensive fossil record of ammonites. Despite ammonite’s apparent similarity to today’s nautilus (which possesses a superficially similar shell) the ammonite animal is more closely related to squid, octopus and cuttlefish. Most ammonites were relatively small (Clymeniida were only about 4cm across) but some species grew enormous - Parapuzosia seppenradensis found in the Westphalia region of Germany measures 2-meters (6.5-feet) across!
Figure A4.14. Artist’s reconstructions Asteroceras sp., Figure A4.15. Parapuzosia seppenradensis, the largest known an ammonite from Lower Jurassic rocks. ammonite. Note the size of bricks and bench. (Courtesy Nobu Tamura) (Courtesy Markus Schweiss) The oldest ammonite fossils are found in Devonian rocks that are about 400 million years old and they remained a prominent member of the marine community for hundreds of millions of years. Ammonite species are distinguished by differences in the general shape of their shells; some possess tightly coiled shells, while others are loosely coiled, and still others are straight. Species are also distinguished by the characteristic shapes of the walls that separate their chambers. Many species of ammonites evolved whose populations grew to be globally distributed and then quickly died out leaving a distinctive marker for that period of time. With their rapidly changing forms and wide distribution, these ammonite fossils are useful for making biostratigraphic connections between rock formations. The list below shows ammonite fossils are divided into eight orders found in rocks 410 million to 65 million years of age. Note that 3 of the orders all disappear from the fossil record at the same time.
! Anarcestida, Devonian (410-385 million years ago) ! Clymeniida, Upper Devonian (326-318 million years ago) ! Goniatitida, Middle Devonian - Upper Permian (390-251 million years ago) ! Prolecanitida, Upper Devonian - Upper Triassic (345-237 million years ago) ! Ceratitida, Upper Permian – Upper Triassic (260-200 million years ago) ! Phylloceratida, Lower Triassic – Upper Cretaceous (251-65.5 million years ago) ! Lytoceratida, Lower Jurassic – Upper Cretaceous (200-65.5 million years ago) ! Ammonitida, Lower Jurassic - Upper Cretaceous (200-65.5 million years ago)
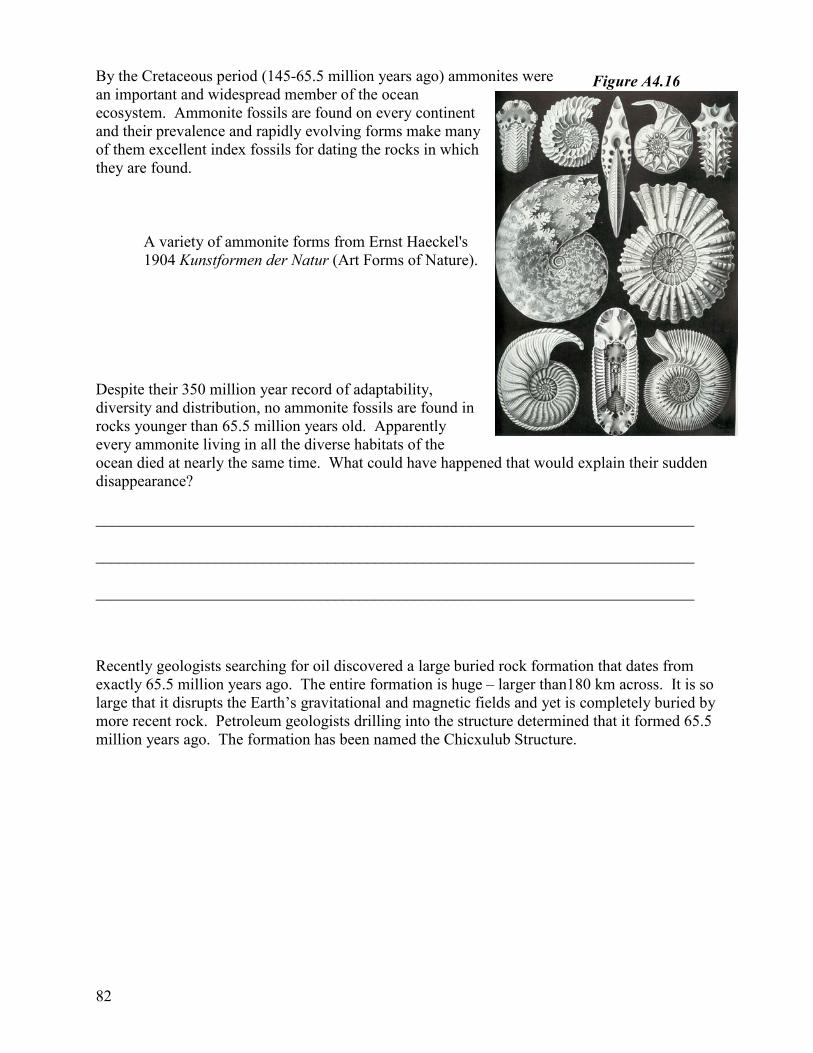
82
By the Cretaceous period (145-65.5 million years ago) ammonites were an important and widespread member of the ocean ecosystem. Ammonite fossils are found on every continent and their prevalence and rapidly evolving forms make many of them excellent index fossils for dating the rocks in which they are found.
A variety of ammonite forms from Ernst Haeckel's 1904 Kunstformen der Natur (Art Forms of Nature).
Despite their 350 million year record of adaptability, diversity and distribution, no ammonite fossils are found in rocks younger than 65.5 million years old. Apparently every ammonite living in all the diverse habitats of the ocean died at nearly the same time. What could have happened that would explain their sudden disappearance?
___________________________________________________________________________
___________________________________________________________________________
___________________________________________________________________________
Recently geologists searching for oil discovered a large buried rock formation that dates from exactly 65.5 million years ago. The entire formation is huge – larger than180 km across. It is so large that it disrupts the Earth’s gravitational and magnetic fields and yet is completely buried by more recent rock. Petroleum geologists drilling into the structure determined that it formed 65.5 million years ago. The formation has been named the Chicxulub Structure.
Figure A4.16
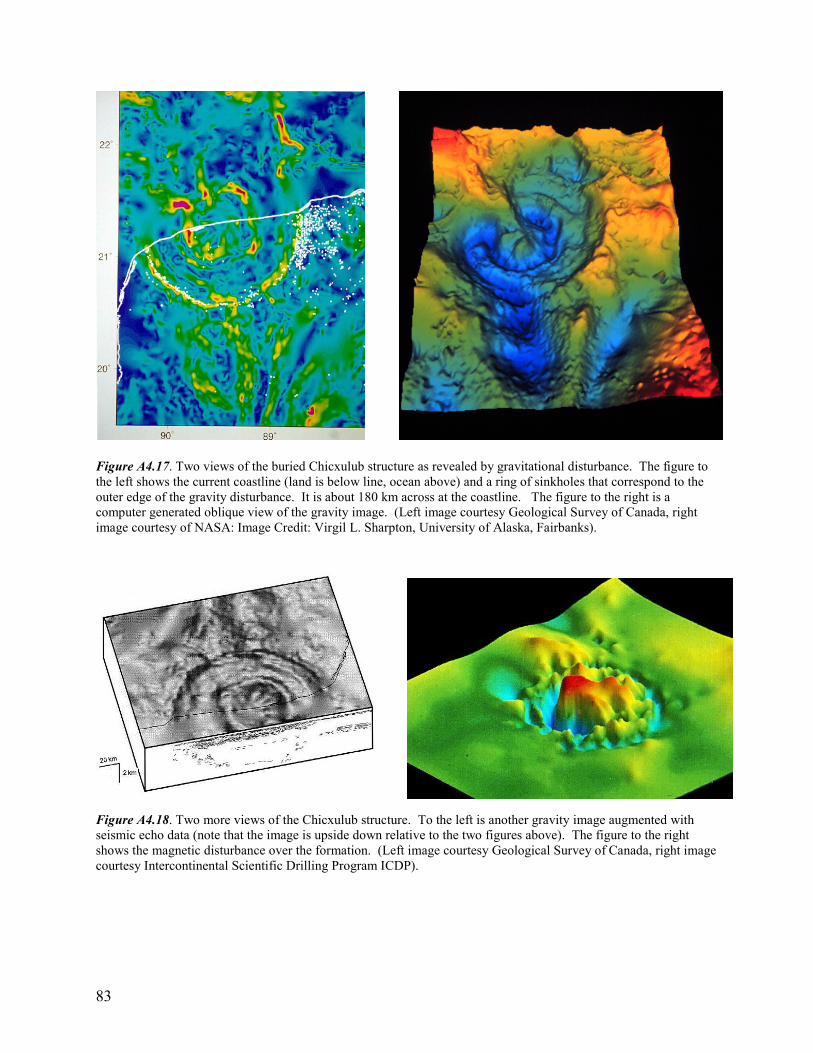
83
Figure A4.17. Two views of the buried Chicxulub structure as revealed by gravitational disturbance. The figure to the left shows the current coastline (land is below line, ocean above) and a ring of sinkholes that correspond to the outer edge of the gravity disturbance. It is about 180 km across at the coastline. The figure to the right is a computer generated oblique view of the gravity image. (Left image courtesy Geological Survey of Canada, right image courtesy of NASA: Image Credit: Virgil L. Sharpton, University of Alaska, Fairbanks).
Figure A4.18. Two more views of the Chicxulub structure. To the left is another gravity image augmented with seismic echo data (note that the image is upside down relative to the two figures above). The figure to the right shows the magnetic disturbance over the formation. (Left image courtesy Geological Survey of Canada, right image courtesy Intercontinental Scientific Drilling Program ICDP).
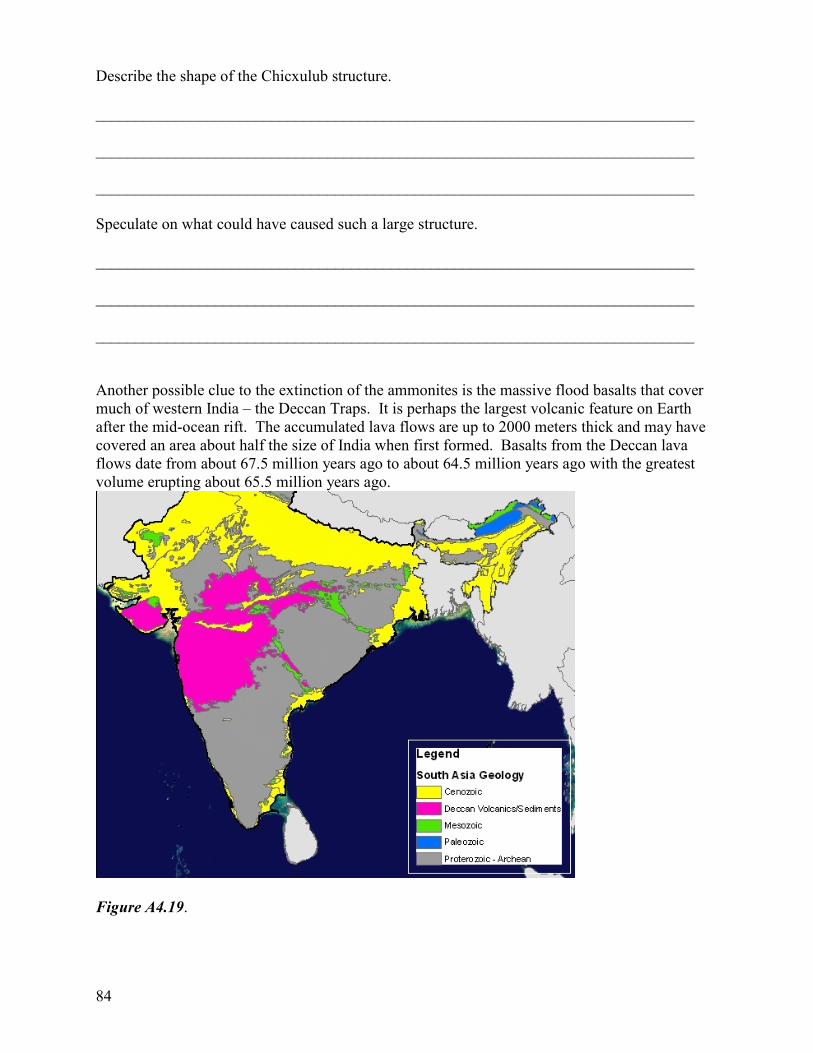
84
Describe the shape of the Chicxulub structure.
___________________________________________________________________________
___________________________________________________________________________
___________________________________________________________________________
Speculate on what could have caused such a large structure.
___________________________________________________________________________
___________________________________________________________________________
___________________________________________________________________________
Another possible clue to the extinction of the ammonites is the massive flood basalts that cover much of western India – the Deccan Traps. It is perhaps the largest volcanic feature on Earth after the mid-ocean rift. The accumulated lava flows are up to 2000 meters thick and may have covered an area about half the size of India when first formed. Basalts from the Deccan lava flows date from about 67.5 million years ago to about 64.5 million years ago with the greatest volume erupting about 65.5 million years ago.
Figure A4.19.
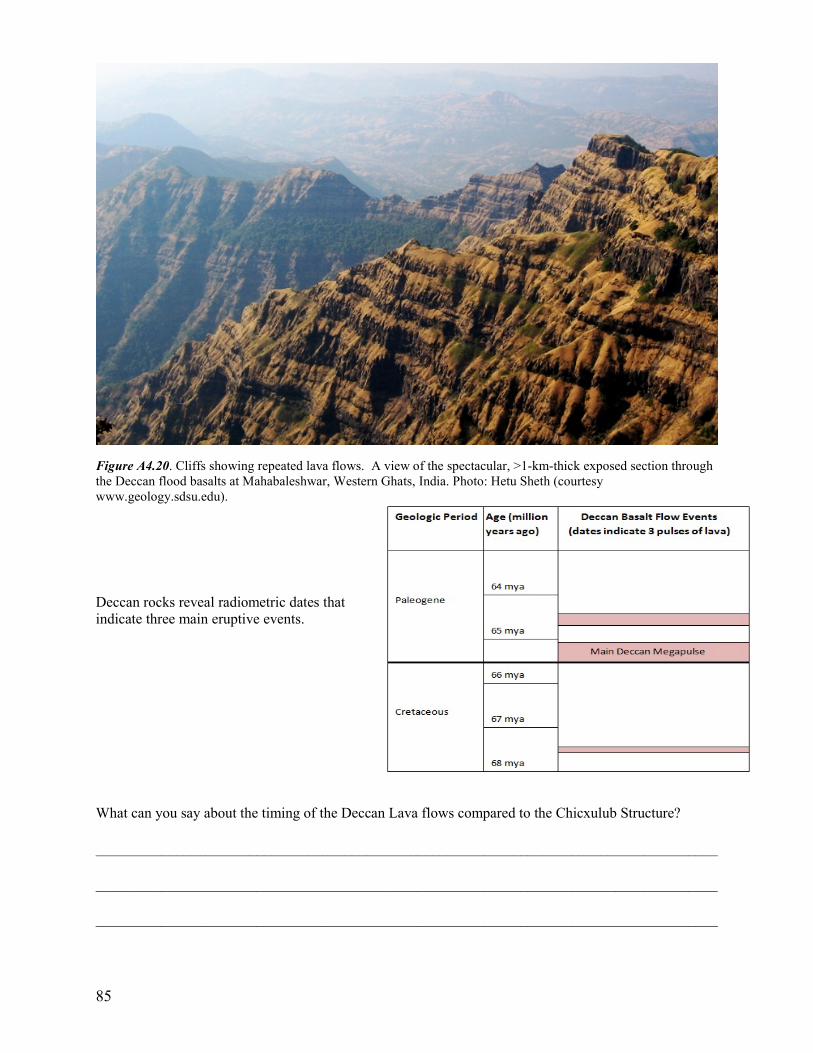
85
Figure A4.20. Cliffs showing repeated lava flows. A view of the spectacular, >1-km-thick exposed section through the Deccan flood basalts at Mahabaleshwar, Western Ghats, India. Photo: Hetu Sheth (courtesy www.geology.sdsu.edu).
Deccan rocks reveal radiometric dates that indicate three main eruptive events.
What can you say about the timing of the Deccan Lava flows compared to the Chicxulub Structure?
_____________________________________________________________________________________
_____________________________________________________________________________________
_____________________________________________________________________________________
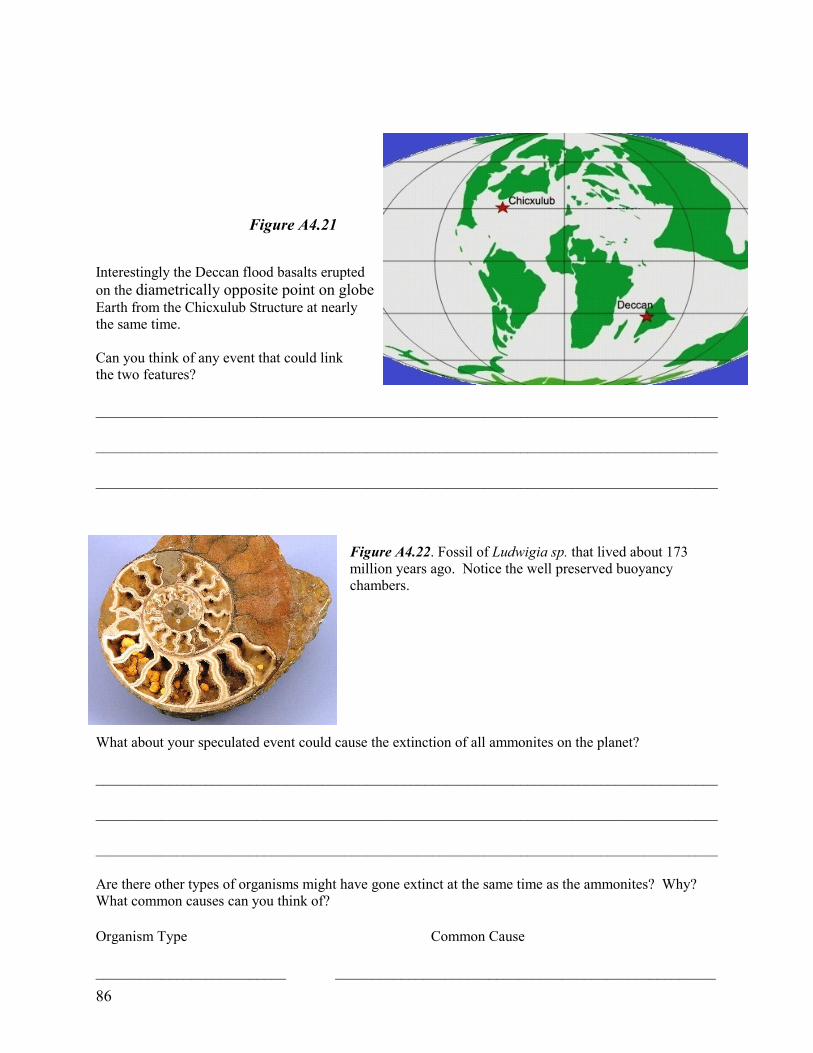
86
Interestingly the Deccan flood basalts erupted on the diametrically opposite point on globe Earth from the Chicxulub Structure at nearly the same time. Can you think of any event that could link the two features?
_____________________________________________________________________________________
_____________________________________________________________________________________
_____________________________________________________________________________________
Figure A4.22. Fossil of Ludwigia sp. that lived about 173 million years ago. Notice the well preserved buoyancy chambers.
What about your speculated event could cause the extinction of all ammonites on the planet?
_____________________________________________________________________________________
_____________________________________________________________________________________
_____________________________________________________________________________________
Are there other types of organisms might have gone extinct at the same time as the ammonites? Why? What common causes can you think of?
Organism Type Common Cause
__________________________ ____________________________________________________
Figure A4.21

87
__________________________ ____________________________________________________
__________________________ ____________________________________________________
__________________________ ____________________________________________________
Homework: Write and illustrate a short story of the sequence of events surrounding the extinction of the ammonites. Include other organisms you have included in the list above.
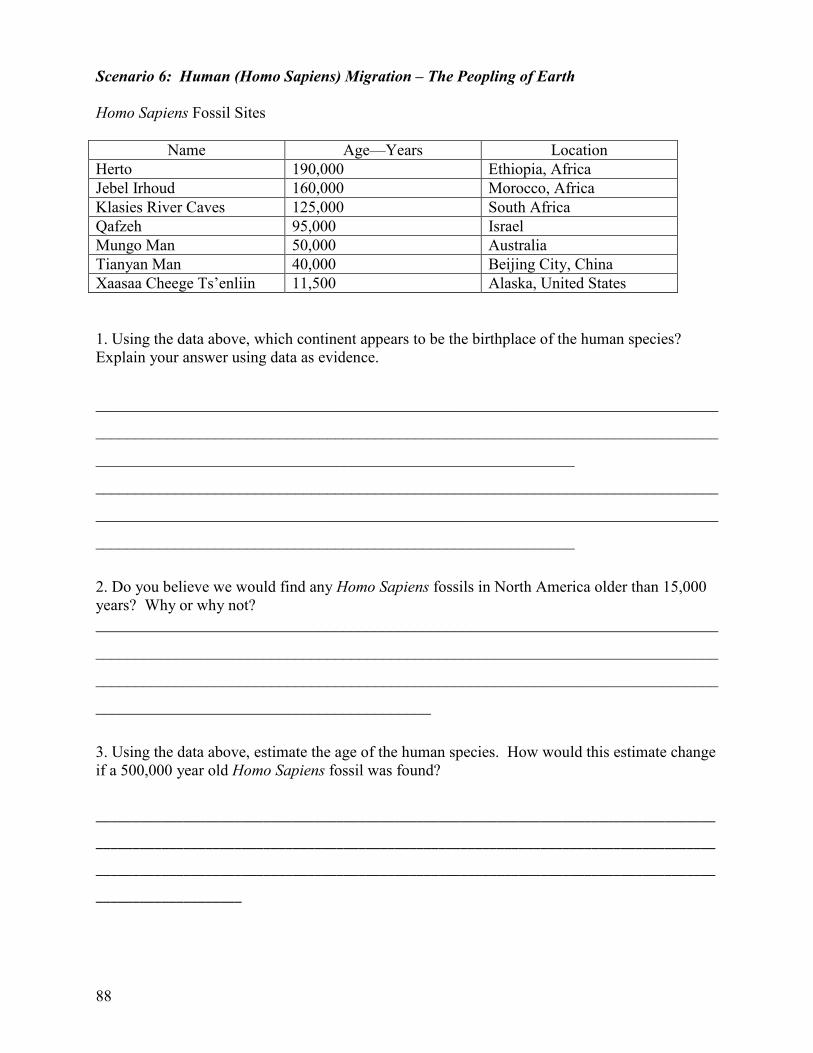
88
Scenario 6: Human (Homo Sapiens) Migration – The Peopling of Earth Homo Sapiens Fossil Sites
Name Age—Years Location Herto 190,000 Ethiopia, Africa Jebel Irhoud 160,000 Morocco, Africa Klasies River Caves 125,000 South Africa Qafzeh 95,000 Israel Mungo Man 50,000 Australia Tianyan Man 40,000 Beijing City, China Xaasaa Cheege Ts’enliin 11,500 Alaska, United States 1. Using the data above, which continent appears to be the birthplace of the human species? Explain your answer using data as evidence.
______________________________________________________________________________
______________________________________________________________________________
____________________________________________________________
______________________________________________________________________________
______________________________________________________________________________
____________________________________________________________
2. Do you believe we would find any Homo Sapiens fossils in North America older than 15,000 years? Why or why not? ______________________________________________________________________________
______________________________________________________________________________
______________________________________________________________________________
__________________________________________
3. Using the data above, estimate the age of the human species. How would this estimate change if a 500,000 year old Homo Sapiens fossil was found? !
=====================================================================================!
=====================================================================================!
=====================================================================================
====================
89
Activity 5 Homework Read the NPR article at the following address: http://www.npr.org/blogs/krulwich/2010/09/14/129858314/my-grandson-the-rock After reading the article, listen to the audio by either clicking the speaker button to listen in your web browser or download the file to listen away from the computer. The audio is approximately 7 minutes long. Now answer the following questions about the reading and audio.
1. Why would a dry Mercury and a dry moon contain less minerals than Earth if they were formed around the same time?
2. Why would mars have more minerals than Mercury or our Moon, but less than Earth? 3. Mineral evolution began with the emergence of rocky planets. planets are engines of
mineral formation. Why? What features would accelerate mineral changes? 4. Geo-sphere and biosphere have continued to co-evolve, why are life and rocks so
intertwined with each other? What life event led to the proliferation of minerals on Earth? 5. How could we use minerals for identifying the possibility of life on other planets? 6. What did you find to be the most interesting piece of information from this article? What
surprised you the most?
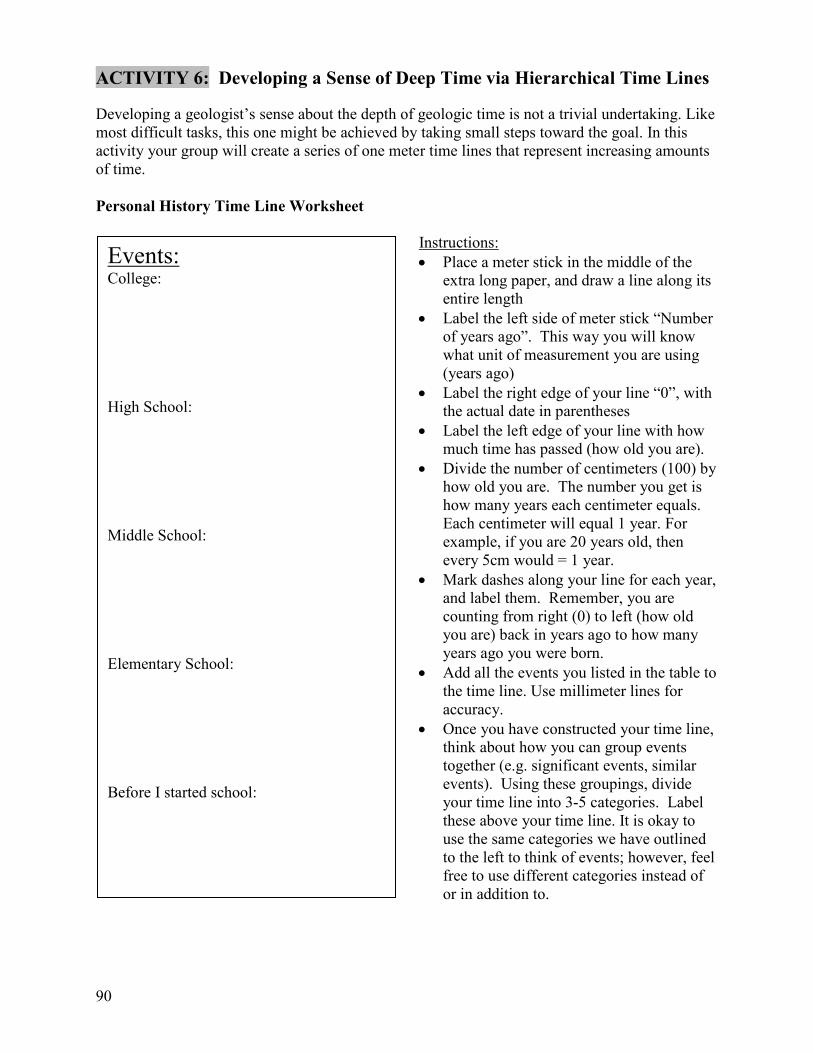
90
ACTIVITY 6: Developing a Sense of Deep Time via Hierarchical Time Lines
Developing a geologist’s sense about the depth of geologic time is not a trivial undertaking. Like most difficult tasks, this one might be achieved by taking small steps toward the goal. In this activity your group will create a series of one meter time lines that represent increasing amounts of time. Personal History Time Line Worksheet Instructions:
! Place a meter stick in the middle of the extra long paper, and draw a line along its entire length
! Label the left side of meter stick “Number of years ago”. This way you will know what unit of measurement you are using (years ago)
! Label the right edge of your line “0”, with the actual date in parentheses
! Label the left edge of your line with how much time has passed (how old you are).
! Divide the number of centimeters (100) by how old you are. The number you get is how many years each centimeter equals. Each centimeter will equal 1 year. For example, if you are 20 years old, then every 5cm would = 1 year.
! Mark dashes along your line for each year, and label them. Remember, you are counting from right (0) to left (how old you are) back in years ago to how many years ago you were born.
! Add all the events you listed in the table to the time line. Use millimeter lines for accuracy.
! Once you have constructed your time line, think about how you can group events together (e.g. significant events, similar events). Using these groupings, divide your time line into 3-5 categories. Label these above your time line. It is okay to use the same categories we have outlined to the left to think of events; however, feel free to use different categories instead of or in addition to.
Events: College: High School: Middle School: Elementary School: Before I started school:
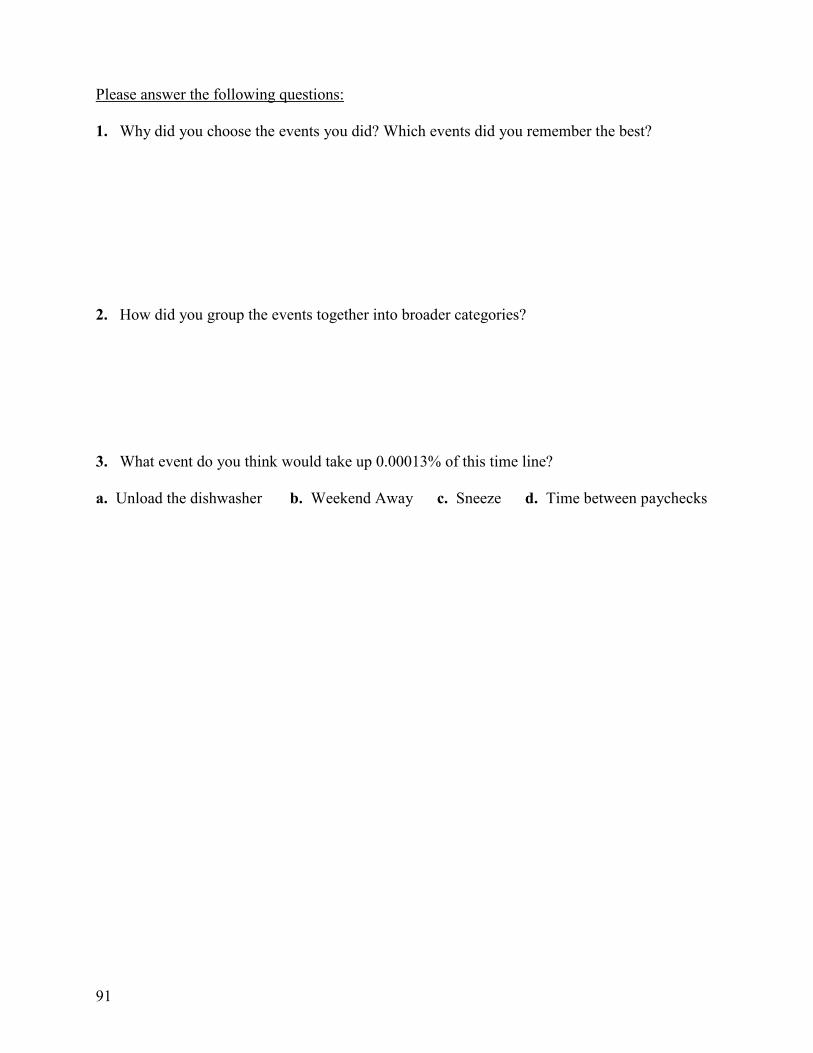
91
Please answer the following questions: 1. Why did you choose the events you did? Which events did you remember the best?
2. How did you group the events together into broader categories? 3. What event do you think would take up 0.00013% of this time line? a. Unload the dishwasher b. Weekend Away c. Sneeze d. Time between paychecks
92
Human Lifespan Time Line Worksheet Instructions
! This time line is of a human lifespan. You can pretend this time line is of what your life might be like, or that it is of someone you may know.
! What are human lives usually measured in (months, years, decades)? __________________
! What is the average human life expectancy? _____________________ Setting up your time line:
! Human life expectancy is usually counted in number of years. Label the left side with “Number of years ago”, so you will know what unit of measurement the time line uses.
! Label the right side with “0” (present day) ! The average human life expectancy in the United States is around 75 years old. This time
line is using that as its length. Label the left side with how much time has passed (75 years).
! Calculate how much each centimeter equals, like you did for your personal time line, and label accordingly.
Labeling your time line
! Locate on your time line and label how many years ago you think the person: o Got married o Traveled to Europe o Lost their first tooth o Retired from work
! Label the appropriate levels with “eon”, “era”, period”, “epoch”, and “events” ! Draw a vertical line on this time line that represents how long and when your personal
time line would have occurred. Please answer the following questions:
1.) What happened to your personal timeline? Why did this happen?
2.) How much time does one centimeter equal? Is this same/different than the previous time lines? If there was a change, why did it occur?
3.) Why are developmental events (e.g. losing a tooth, going through puberty) good markers for age? What are good makers for geologic age? How are these ideas similar?
4.) What event do you think would take up 0.00013% of this time line? a. Unload the dishwasher b. Weekend Away c. Sneeze d. Time between paychecks
93
American History Time Line Worksheet Instructions
! This time line is of American History, dating back to when Columbus first landed in 1492.
Setting up your time line:
! Label the appropriate side “Number of years ago” ! Labeling the appropriate side with “0” (present day), and the other side with how much
time has passed. ! Calculate how much each centimeter equals, and label accordingly.
Labeling your time line
! Label the appropriate levels with “eon”, “era”, period”, “epoch”, and “events” ! Draw a vertical line on this time line where each of the previous time lines would have
occurred Please answer the following questions:
1.) What happened to each timeline? Why?
2.) How much time does one centimeter equal? Is this same/different than the previous time lines? If there was a change, why did it occur?
3.) What event do you think would take up 0.00013% of this time line?
a. Doing laundry b. Weekend Away c. Attending class d. Planning a wedding
4.) Label when the USA launched its first satellite into space on the time line. How do you know when this occurred? If you did not know for sure, how did you come up with an answer?
5.) Why did the Stock Market have to occur prior to the Great Depression? What geologic principle is this related to?
6.) For the level you labeled ‘eras’, how are these divisions made?
94
Recorded History Time Line Worksheet Instructions
! NOTE: Time before common error (BCE) are moving in an opposite direction of time as common error (CE). BCE is counting number of years before common error, and CE is counting the number of years since common error. This is similar to a number line with negative (BCE) and positive (CE) numbers, where the start of common error is at 0.
! Recorded history dates back to approximately 3500 BCE. Setting up your time line:
! Label the appropriate side “Number of years ago” ! Labeling the appropriate side with “0” (present day), and the other side with how much
time has passed. Remember, to calculate how much time has passed, you will need to take into account the different directions BCE and CE are moving.
! Calculate how much each centimeter equals, and label accordingly. Labeling your time line
! Label the appropriate levels with “eon”, “era”, period”, “epoch”, and “events” ! Draw a vertical line on this time line where each of the previous time lines would have
occurred Please answer the following questions:
1.) What happened to each timeline? Why?
2.) How much time does one centimeter equal? Is this same/different than the previous time lines? If there was a change, why did it occur?
3.) What event do you think would take up 0.00013% of this time line?
a. Doing laundry b. Football game c. Time between paychecks d. Planning a wedding
4.) Which events were easy to remember? Do you think it would be easier or harder to remember events before or after recorded history? Why?
5.) What do you think will happen between the relationships between all the previous time lines if five thousand years is added? Five million?
95
Human Evolution Time Line Worksheet Instructions
! This time line dates back to when the chimps and the humans first split lineages 6 million years ago.
Setting up your time line:
! Label the appropriate side “Number of years ago” ! Labeling the appropriate side with “0” (present day), and the other side with how much
time has passed. ! Calculate how much each centimeter equals, and label accordingly.
Labeling your time line
! Label the appropriate levels with “eon”, “era”, period”, “epoch”, and “events” ! Draw a vertical line on this time line where each of the previous time lines would have
occurred Please answer the following questions:
1.) What happened to each timeline? Why?
2.) How much time does one centimeter equal? How is this same/different than the previous time lines? If there was a change, why did it occur?
3.) What eon did these events occur in? Era? Period? Epoch? What categorizes each division of time?
4.) When did human begin eating meat? How do you know when this occurred? If you did not know for sure, how did you come up with an answer?
96
Cenozoic (individual era) Time Line Worksheet Instructions
! Use your text book to figure out when the Cenozoic era began. Setting up your time line:
! Label the appropriate side “Number of years ago” ! Labeling the appropriate side with “0” (present day), and the other side with how much
time has passed. ! Calculate how much each centimeter equals, and label accordingly.
Labeling your time line
! Label the appropriate levels with “eon”, “era”, period”, “epoch”, and “events”. Note that the time line itself is an era.
! Draw a vertical line on this time line where each of the previous time lines would have occurred
Please answer the following questions:
1.) What happened to each timeline? Why?
2.) How much time does one centimeter equal? How is this same/different than the previous
time lines? If there was a change, why did it occur?
3.) Did you label a time division with the term “eon”? Why/Why not? 4.) How long did the longest event take on this time line? How long was the shortest event?
How are these two events related? How do these events relate to the longest/shortest events on the personal history time line?
97
Eons Time Lines Worksheet Instructions:
So far we have worked with time lines with an increasing amount of time (personal history to human lifespan to American history, and so on). You are going to make four new time lines, each with an increasing amount of time. The first time line will extend back to the start of the Phanerozoic eon, then the Proterozoic eon, the Archean eon, and finally the Hadean eon. This last time line includes all of geologic time. Phanerozoic ! Place a meter stick in the middle of the extra
long paper, and draw a line along its entire length
! Label the left side of meter stick “MYA”. MYS stands for millions of years ago. This way you will know what unit of measurement you are using (millions of years ago)
! Label the right edge of your line “0”, with the actual date in parentheses
! Label the left edge of your line with how much time has passed since the beginning of the Phaerozoic eon. If you do not know when the Phanerozoic eon began, you can look it up in your text book.
! Divide the number of centimeters (100) by how much time has passed. The number you get is how many MYA each centimeter equals. Label accordingly.
! Use your text book and the event box to the left to add events and time divisions to the time line. Use millimeter lines for accuracy
! Draw a vertical line on this time line where each of the previous time lines would have occurred
Proterozoic, Archean, and Hadean time lines ! Repeat the steps outline above for setting up
each of these time line. ! For each time line, the right edge should
mark present day. The left edge should mark the beginning of each respective eon.
Events: *needs to be filled in
98
Please answer the following questions: 1.) What happened to each timeline? Why?
2.) How did you measure (e.g. what unit of measurement) how much time has passed for these timelines? What did you use for previous timeline? Are these the same? Why does it make sense to use the one(s) you used?
3.) What types of events categorize the Phanerozoic? Proterozoic? Archean? Hadean? 4.) The Devonian period is a division in the Paleozoic era, which is a division in the
Phanerozoic eon. What is the relationship between these divisions? Meaning, what do they have in common? Why does it make sense they are divisions of each other?
5.) Question number 4 give one example of the hierarchical relationships between time
divisions. Give an example of another explaining how they are related.
6.) Are all the eons the same amount of time? Eras? Periods? Why might this be! How are these divisions made? Which eon is the largest? Which is the smallest?
7.) Compare the final time line (of all geologic history) with the geologic time scale from
your text book. How are they the same? How are they different? For both, why is more space given to one eon over another?
Technology Extension
http://www.pbs.org/wgbh/evolution/change/deeptime/index.html ! !
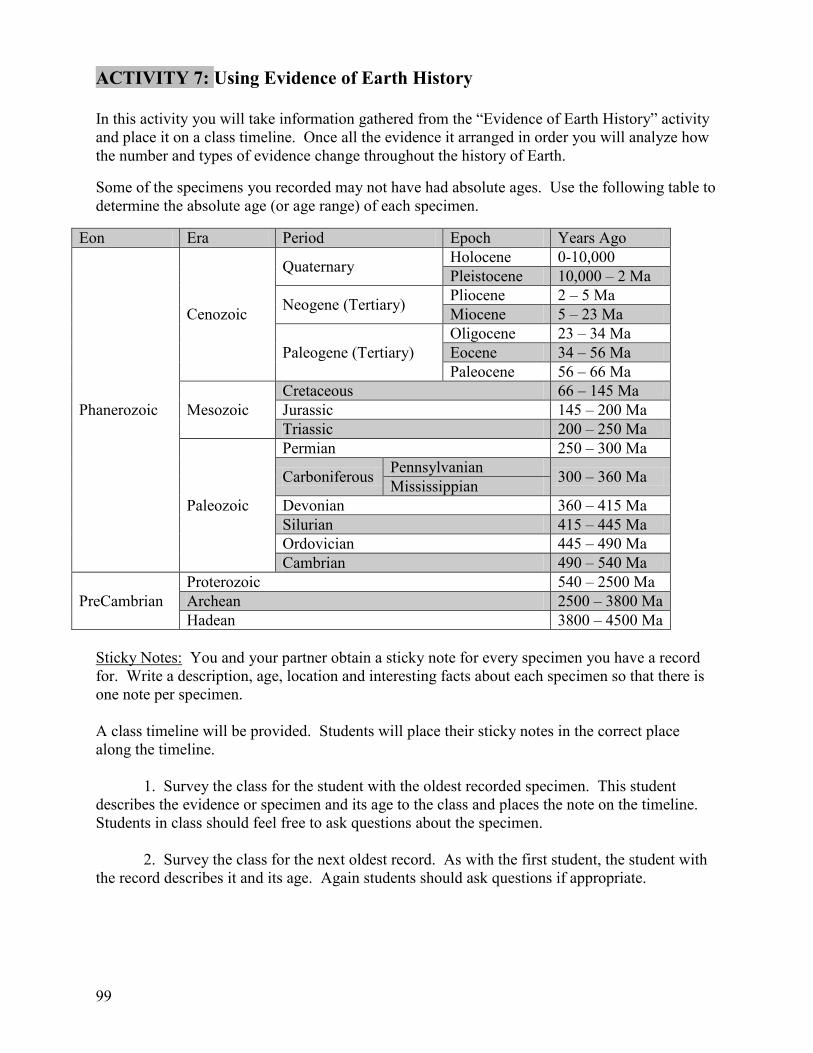
99
ACTIVITY 7: Using Evidence of Earth History In this activity you will take information gathered from the “Evidence of Earth History” activity and place it on a class timeline. Once all the evidence it arranged in order you will analyze how the number and types of evidence change throughout the history of Earth.
Some of the specimens you recorded may not have had absolute ages. Use the following table to determine the absolute age (or age range) of each specimen.
Eon Era Period Epoch Years Ago
Phanerozoic
Cenozoic
Quaternary Holocene 0-10,000 Pleistocene 10,000 – 2 Ma
Neogene (Tertiary) Pliocene 2 – 5 Ma Miocene 5 – 23 Ma
Paleogene (Tertiary) Oligocene 23 – 34 Ma Eocene 34 – 56 Ma Paleocene 56 – 66 Ma
Mesozoic Cretaceous 66 – 145 Ma Jurassic 145 – 200 Ma Triassic 200 – 250 Ma
Paleozoic
Permian 250 – 300 Ma
Carboniferous Pennsylvanian 300 – 360 Ma Mississippian Devonian 360 – 415 Ma Silurian 415 – 445 Ma Ordovician 445 – 490 Ma Cambrian 490 – 540 Ma
PreCambrian Proterozoic 540 – 2500 Ma Archean 2500 – 3800 Ma Hadean 3800 – 4500 Ma
Sticky Notes: You and your partner obtain a sticky note for every specimen you have a record for. Write a description, age, location and interesting facts about each specimen so that there is one note per specimen. A class timeline will be provided. Students will place their sticky notes in the correct place along the timeline. 1. Survey the class for the student with the oldest recorded specimen. This student describes the evidence or specimen and its age to the class and places the note on the timeline. Students in class should feel free to ask questions about the specimen. 2. Survey the class for the next oldest record. As with the first student, the student with the record describes it and its age. Again students should ask questions if appropriate.
100
3. Repeat this procedure for each younger specimen until all are placed on the timeline. Compare the class timeline with the timelines from activity 6. How does the class timeline differ from those from activity 6? How can this difference affect our impression of the amount of information for Earth’s history?
What do you notice about the density of information throughout Earth’s history?
How would the pattern of information change it the timeline scale were constant along its entire length?
Is there anything to add to the timeline?
Class Discussion: Does the presence of fossils change the precision with which we can estimate the timing of events in Earth’s history? Record below any new ideas that occur to you during the discussion.
Class Discussion
101
Earth History Cycle Summarizing Questions Go back to the list of events you created in the initial ideas on the first page of this cycle. Now would you re-order anything? Final order:
1.
2.
3.
4.
5.
6.
7.
8.
9.
10.
11.
12.
What evidence did you discuss to help you revise your order? ________________________________________________________________________________________________________________________________________________________________________________________________________________ Again, thinking about the age of Earth as an hour, with 0 minutes as the beginning of the Earth and 60 minutes as now, do you have a revision of your estimate of the time that each event took place?
Event Time (0 to 60 minutes) 1. 2. 3. 4. 5. 6. 7. 8. 9. 10. 11. 12.
Be prepared to share your timeline and your analogy of a 60-minute Earth history. What differences did your group have in the final timeline compared to your initial ideas? Make sure to add any new information to your timeline string from the scenarios you just worked on.
Class Discussion