FINANCING THE POST-2015 DEVELOPMENT FRAMEWORK · PDF filepost-2015 development framework ......
38
FINANCING THE POST-2015 DEVELOPMENT FRAMEWORK A DRAFT TO BE SUBMITTED TO THE BALI HIGH LEVEL PANEL OF EMINENT PERSONS: POST-2015 CONSULTATION AND OUTREACH 25 March 2013 Mahmoud Mohieldin World Bank President’s Special Envoy This presentation was prepared by the World Bank Group Post-2015 Working Group, with comments from UNDESA, IMF, Asian Development Bank, and Homi Kharas, Lead Author and Executive Secretary, HLP on Post-2015.
Transcript of FINANCING THE POST-2015 DEVELOPMENT FRAMEWORK · PDF filepost-2015 development framework ......

FINANCING THE POST-2015 DEVELOPMENT FRAMEWORK
A DRAFT TO BE SUBMITTED TO THE BALI HIGH LEVEL PANEL OF EMINENT PERSONS: POST-2015 CONSULTATION AND OUTREACH 25 March 2013 Mahmoud Mohieldin World Bank President’s Special Envoy This presentation was prepared by the World Bank Group Post-2015 Working Group, with comments from UNDESA, IMF, Asian Development Bank, and Homi Kharas, Lead Author and Executive Secretary, HLP on Post-2015.

Lessons from the existing MDGs framework
• The original MDGs were articulated independently of a financing framework (Monterrey 2002).
• In a context of fiscal consolidation, discussion of post-2015 goals must be integrated with consideration of supporting financing.
• No quantity of financing, whether grant, concessional, or non-concessional, can achieve the development goals without supporting policies and a credible commitment to combating poverty.
• Costing MDGs requires too many assumptions (WDR 2004), and is not the objective of this exercise.
2

A two-pronged approach to supporting a post-2015 development framework
Increase impact of available resources
Leverage additional resources
Good policies and credible institutions enhance the impact of available resources and leverage additional resources from
both domestic and foreign sources.
Good policies and credible institutions to:
3

Parameters to consider in the post-2015 financing framework
What can developing countries do?
What can the international community do?
• Design targeted,
evidence-based policies and
support sound institutions
• Generate more revenues
• Ensure efficient public
spending
• Promote financial deepening
and inclusion
• Maximize the impact of ODA
• Support new development
partners
• Leverage the private sector
• Tap into new sources of finance
• Deliver global public goods
4

DESIGN targeted, evidence-based policies and SUPPORT
effective institutions
GENERATE more revenues
ENSURE efficient public spending
PROMOTE financial deepening and inclusion
5

Design targeted, evidence-based policies and support effective institutions
Real income per capita is closely correlated with institutional quality
Source: World Economic Outlook, IMF, April 2003
6
This index measures the overall quality of governance, including the degree of corruption, political rights, public sector efficiency, and
regulatory burdens.

Generate more revenues Taxation capacity improving in MICs, progress needed in LICs
21.2
28.4 28.4 29.3
18.8 17.1
19 19.3
11.3 10 10.5
13.6
0
5
10
15
20
25
30
35
1994 1998 2003 2009
High Income Middle Income Low Income
Tax Revenue (in % of GDP) by Income Groups, 1994-2009
Source: World Development Indicators

Generate more revenues Taxation capacity improving in MICs, progress needed in LICs
Tax Revenue as % of GDP 2004-2011
Average Tax Effort (1994-2001)
Average Tax Effort (2002-2009)
Tax effort difference
LIC: Negative Tax Effort
Congo, Republic of 9.3 0.47 0.45 -0.02
Ethiopia 9.4 1.05 0.87 -0.18
Uganda 10.6 0.89 0.87 -0.02
Zambia 18.0 1.11 1.07 -0.04
Bangladesh 7.6 0.83 0.8 -0.03
Pakistan 12.3 1.31 1.03 -0.28
Sri-Lanka 16.0 1.13 0.98 -0.15
MIC: Positive Tax Effort
Colombia 11.0 0.73 0.79 0.06
Bulgaria 26.7 0.91 1.04 0.13
Vietnam 24.9 1.26 1.44 0.18
South Africa 21.8 1.47 1.57 0.1
Ukraine -- 0.8 1.02 0.22
Source: World Development Indicators
Tax effort indicates how well a country is doing in terms of tax collection, relative to what could be reasonably expected given its economic potential. It is calculated by dividing actual tax share by an estimate of how much tax the country should be able to collect given the structural characteristics of its economy.

Generate more revenues Raising revenues from natural resources: potential and challenges of resource-for-
infrastructure deals in fragile states
• RfI deals can help overcome obstacles related to limited capital market access and limited domestic capacity to implement large infrastructure projects
• Significant potential as a financing source, but carries considerable risks and challenges both on the private sector and government sides
9
Private sector perspective
- Investments add to the high initial sunk costs involved in mine and offshore oil field development (frequently running into the billions of dollars)
- Future revenue streams backing these investments subject to political, market, geological and other types of risk
- On infrastructure side, risks of cost overruns
Government perspective
- Without appropriate valuation both on mining and infrastructure side, country risks forgoing significant share of potential benefits from the extractive project
- Assuming that appropriate valuation is undertaken, still risks arising from uncertainty of future commodity prices and of geological estimates of oil and mineral reserves
- Essential that financing commitments be complemented by appropriate extractives tax and royalty regimes

Ensure efficient public spending Fossil fuel subsidies do not target the poor
Source: World Energy Outlook, IEA, 2011
Subsidies are an inefficient means of assisting the poor: only 8% of the $409 billion spent on fossil-fuel subsidies in 2010 went to the poorest 20% of the population. Fossil fuel consumption subsidies measure what developing countries spend to provide below-cost fuel to their citizens. High-income countries offer support to energy production in the form of tax credits or loan guarantees, which are not included in these calculations since they are directed towards production rather than consumption of the fuel.
10

Ensure efficient public spending Conditional cash transfers do target the poor
11
Source: Conditional Cash Transfers, World Bank, 2009
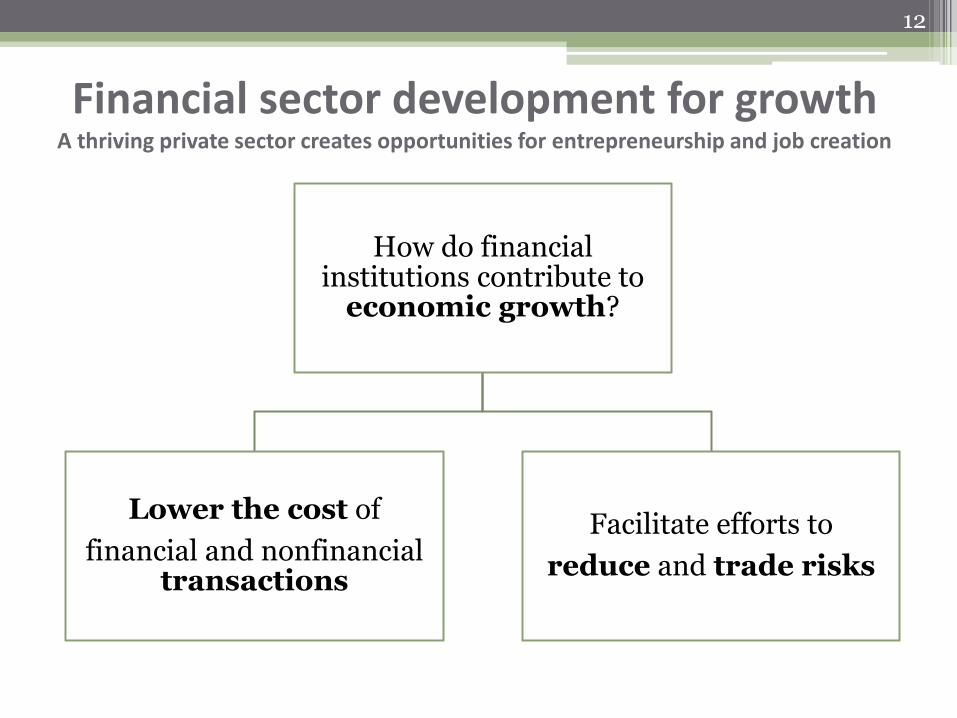
Financial sector development for growth A thriving private sector creates opportunities for entrepreneurship and job creation
How do financial institutions contribute to
economic growth?
Lower the cost of
financial and nonfinancial transactions
Facilitate efforts to
reduce and trade risks
12

Financial Deepening Using local currency bond markets to develop the domestic investor base and mobilize
domestic savings to support investment in productive assets
13
Emerging market fixed income fund inflows by hard and local currency
LCBMs foster financial sector development by:
Providing pricing benchmarks for private sector instruments
Reducing risk management through greater asset liability matching
Enabling diversification from bank financing
Providing safer, more liquid savings vehicles for individuals and institutions

Financial Inclusion Access to finance is a major constraint to growth for entrepreneurs in LICs
14
21 9 3 10
# Total MSMEs (formal and informal)
# with Checking account # with Loan/Overdraft # Unserved + Underserved
52
25 13
27
# Total MSMEs (formal and informal)
# with Checking account # with Loan/Overdraft # Unserved + Underserved
20 12 6 10
# Total MSMEs (formal and informal)
# with Checking account # with Loan/Overdraft # Unserved + Underserved
188
62
23
92
# Total MSMEs (formal and informal)
# with Checking account # with Loan/Overdraft # Unserved + Underserved
78
34 11
36
# Total MSMEs (formal and informal)
# with Checking account # with Loan/Overdraft # Unserved + Underserved
40 18
4 22
# Total MSMEs (formal and informal)
# with Checking account # with Loan/Overdraft # Unserved + Underserved
LAC
MNA
ECA EAP
SAR
AFR
# of MSMEs (in Mn)
# Total MSMEs(formal and
informal)
# with Checkingaccount
# withLoan/Overdraft
# Unserved +Underserved
Source: Two trillion and counting, IFC & McKinsey, 2010

15
MAXIMIZE the impact of ODA
COLLABORATE with new development partners
LEVERAGE the private sector
TAP INTO new sources of finance
DELIVER global public goods
Source: MDG Gap Taskforce Report, 2012
0.00 0.20 0.40 0.60 0.80 1.00 1.20
United States
Germany
United Kingdom
France
Japan
Netherlands
Sweden
Canada
Australia
Norway
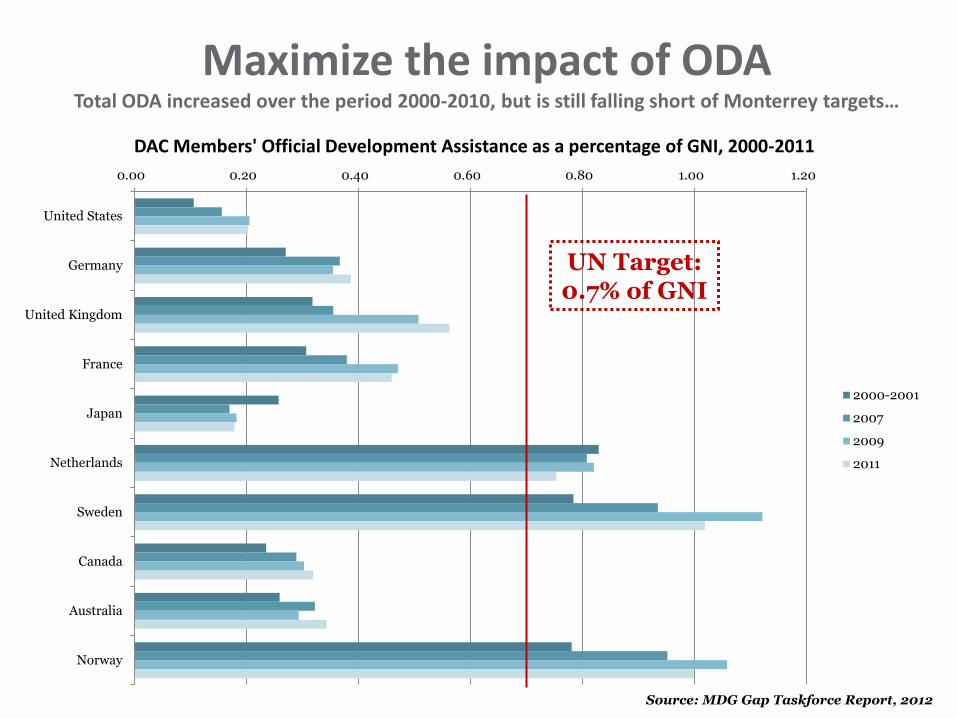
DAC Members' Official Development Assistance as a percentage of GNI, 2000-2011
2000-2001
2007
2009
2011
UN Target: 0.7% of GNI
Maximize the impact of ODA Total ODA increased over the period 2000-2010, but is still falling short of Monterrey targets…
16

Maximize the impact of ODA ODA is a critical tool to leverage other sources of financing
“Official development assistance (ODA) plays an essential role as a complement to other sources of financing for development, especially in those countries with the least capacity to attract private direct investment… For many countries in Africa, least developed countries, small island developing States and landlocked developing countries, ODA is still the largest source of external financing and is critical to the achievement of the development goals and targets of the Millennium Declaration and other internationally agreed development targets.”
Monterrey Declaration, 2002
17
Source: OECD DAC Database
0.00
0.02
0.04
0.06
0.08
0.10
0.12
0.14
1990 1994 1998 2002 2006 2010
US
$ m
illi
on
s p
er
ca
pit
a (
20
10
pr
ice
s)
Fragile States Small States Heavily Indebted Poor Countries

Progress in Implementing the Paris Declaration
Maximize the impact of ODA Limited progress on certain aid modalities but improvement still needed on most indicators
Source: MDG Gap Taskforce Report, 2012
18
Percentage of countries

Collaborate with new development partners Emerging donors, led by China, provide relatively limited aid as defined by the OECD, but
contribute to development through other external flows and in-kind assistance
Source: World Bank CFP Working Paper No. 8, Finance for Development
19
For the purpose of comparison, in 2009, net ODA from DAC members was 119.8 bn USD.
0.00
0.50
1.00
1.50
2.00
2.50
3.00
3.50
4.00
4.50
2003 2004 2005 2006 2007 2008 2009
Estimated aid from BRICS, 2003-2009 (USD billion)
China India Russia Brazil South Africa

Collaborate with new development partners Private philanthropy is growing in importance and playing a complementary role
• Global funds: trust funds that pool resources for specific issues of global importance ▫ Global Partnership for Education ▫ GAVI Alliance (formerly the Global Alliance for Vaccine and Immunization) ▫ Global Fund to Fight AIDS, Tuberculosis and Malaria (GFATM) ▫ Global Environment Fund (GEF)
• Scattered data – available estimates for private aid to developing countries in 2009 range from USD 22 billion to USD 53 billion
• Low estimate is equivalent to 16 percent of ODA from all donors in the same year, and up from 2005 (12 percent of ODA)
• Private philanthropy to fragile states increasing in recent years
• South-South philanthropy also on the rise, especially in the Arab world
• Philanthropic giving highly sensitive to factors such as media coverage, timing, geopolitical considerations

International flows to developing countries International capital flows to developing countries dominated by foreign direct investment
Total capital inflows in 2012: USD 1,007 billion
21
Remittances, which are not part of capital inflows but are an important source of foreign currency for developing countries, were an estimated USD 399 bn in 2012. Inflows refer to flows from non-residents to developing countries. FDI inflows are net of disinvestments by non-residents. Debt inflows are debt disbursements net of repayments. Official flows include bilateral and multilateral lending and are not equivalent to ODA. Data on official capital inflows are “debt enhancing official assistance” and, thus, not the same as ODA, which is concessional in character with a grant element.
Source: Long-term financing for growth and development. G20 Umbrella Paper, Feb. 2013 and Global Economic Prospects 2013, World Bank.
FDI inflows, 600.1, 60%
Portfolio equity inflows, 44.4, 4%
Bonds, 143.3, 14%
Banks, 71.5, 7%
Short-term debt flows, 126.7, 13%
Other private, 7.1, 1%
Official (World Bank, IMF, and other), 14.1,
1%

The official sector has a particularly important role to play in LICs and fragile states
22
0.9
6.4
7.8
Net official capital flows and transfers, 2012 (% of GDP)
Emerging market countries Low-income countries Fragile states
Source: Global Monitoring Report 2013, World Bank
The classification of countries is the one used in the IMF‘s World Economic Outlook. Emerging market and developing countries are those countries that are not designated as advanced countries. Countries that are eligible for financial assistance under the IMF‘s Poverty Reduction and Growth Trust
constitute a subset of emerging market and developing countries; these countries are denoted low-income countries although eligibility is based on other considerations in addition to income levels. Emerging market and developing countries that are not eligible for financial assistance under the Poverty Reduction and Growth Trust are designated as emerging market countries. Fragile states are countries included in the World Bank‘s list of Fragile and
Conflict-Affected States as of early 2013.
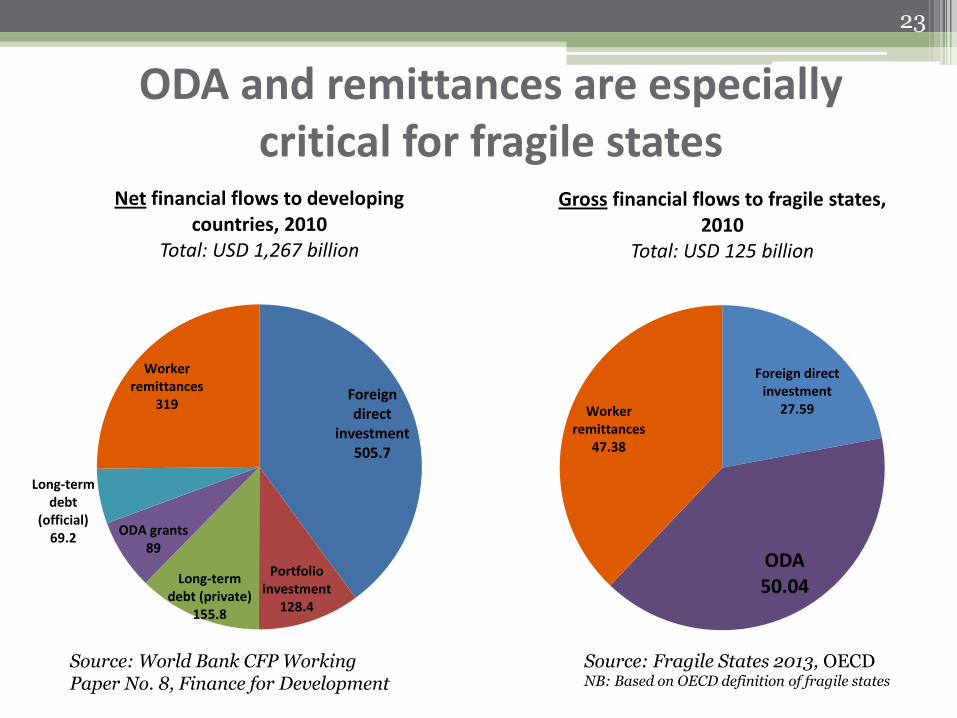
ODA and remittances are especially critical for fragile states
23
Foreign direct
investment 505.7
Portfolio investment
128.4
Long-term debt (private)
155.8
ODA grants 89
Long-term debt
(official) 69.2
Worker remittances
319
Net financial flows to developing countries, 2010
Total: USD 1,267 billion
Foreign direct investment
27.59
ODA 50.04
Worker remittances
47.38
Gross financial flows to fragile states, 2010
Total: USD 125 billion
Source: World Bank CFP Working Paper No. 8, Finance for Development
Source: Fragile States 2013, OECD NB: Based on OECD definition of fragile states

24
1.50%
2.58% 2.92%
4.76% 4.17%
3.55% 4.26%
-1%
0%
1%
2%
3%
4%
5%
6%
7%
8%
2000 2005 2006 2007 2008 2009 2010
Foreign direct investment Portfolio investment Long-term debt
3.00%
5.17% 5.70%
6.69%
4.69%
3.47% 3.92%
-1%
0%
1%
2%
3%
4%
5%
6%
7%
8%
2000 2005 2006 2007 2008 2009 2010
Net private flows to MICs (% of GDP)
Net private flows to LICs (% of GDP)
Source: Finance for Development - Trends and Opportunities in a Changing Landscape, CFP, 2011 and WDI

Leverage the private sector: partnerships Well-structured initiatives with a diverse range of partners help governments raise the large sums of capital required to meet infrastructure needs and consequently spur development
25
Maharashtra & Tamil Nadu, India
CLIFF COMMUNITY SANITATION PROJECT
Total initial investment: $7.2 million
- Homeless International
- SPARC (NGO in India)
- Community-based Organizations
Kenya
PRIVATE SECTOR POWER GENERATION PROJECT
Total initial investment: $623 million
- Kenya Power and Lighting Company
- IFC
- MIGA
- Commercial Banks
Sao Paulo, Brazil
METRO LINE 4
Total initial investment: $450 million
- Companhia do Metropolitano de Sao Paolo
- 5 Equity Sponsors
- IDB
- Commercial Banks
Lake Kivu, Rwanda
KIVU WATT
Total initial investment: $142.25 million
- ContourGlobal
- Energy Authority of Rwanda
- MIGA
- Emerging Africa Infrastructure Fund
- FMO
- AfDB
- Belgian Development Bank
Source: Emerging Partnerships, IFC, 2013 and World Bank, Africa Region.
Emerging Partnerships

4%
29%
25%
13%
22%
41%
6%
14%
23%
8%
21% 24%
0%
5%
10%
15%
20%
25%
30%
35%
40%
45%
1 to 5 years 5 to 10 years 10+ years
Percent of international syndications to the private sector in developing countries where an IFI participated, by income level and maturity, 2007-2010
Lower Lower middle Upper middle BRICT
Leverage the private sector: syndications IFI participation in syndications contributes to extending maturities of private flows to
developing countries and therefore financing long-term productive investments
Source: International Finance Institutions and Development through the Private Sector, IFC, 2011
26

Leverage the private sector: guarantees Using MDB status and financial structures to help investors obtain funding sources on
more advantageous terms and conditions
• Official status and financial structures enables MDBs to absorb more default and political interference risk
• Particularly useful in early stages of deals
• Draw private capital into long-term projects in destinations where the market perceives high risks (inexperienced institutions, regulatory and judicial weakness)
• Provide coverage to financially and economically viable projects that would be challenging without protection against non-commercial risks
• Enables investors to obtain access to funding sources on more advantageous terms and conditions.
TYPES OF POLITICAL RISK ELIGIBLE FOR
MDB INSURANCE
Currency inconvertibility and transfer restriction
Expropriation
War, terrorism, and civil disturbance
Breach of contract
Non-honoring of sovereign financial
obligations

Leverage the private sector: advance market commitments
Innovative, results-based mechanisms can contribute to addressing market failures
AgResults Initiative International Finance Facility
for Immunization (IFFIm)
Inputs increasing
yields
Outputs post harvest
management
Livestock Nutrition
28
Linking spending to actual development outcomes

Tap into new sources of finance Attracting even a fraction of institutional investor resources can scale up development finance
29
Total assets by type of institutional investors in the OECD, 1995-2011 (USD trillions)
1. Other forms of institutional savings include foundations and endowment funds, non-pension fund money managed by banks, private investment partnership and other forms of institutional investors.

30
Tap into new sources of finance Harnessing diasporas for development: lowering transfer costs and issuing diaspora
bonds to mobilize resources

31
TRADE for growth and development
DATA and statistical capacity-building

Global public goods • Global public goods lie at the intersection of national development
priorities and global interests
• The under-provision of GPGs disproportionately affects the poor
• GPGs are at the center of the post-2015 agenda:
▫ International financial architecture
▫ Trade
▫ Peace and security
▫ Environmental commons
▫ Communicable diseases
▫ Knowledge for development
▫ Statistical capacity-building
32

Trade for growth and development Full duty-free quota-free access could increase national incomes in LICs by 0.5% of GDP. These income
gains could rise to 1% of GDP if a DFQF initiative is complemented by transparent, simple rules of origin.
33
0.69
4.71
0.16
1.73
2.33
1.36 1.16 1.12
2.49
6.87
0.85
1.20
7.56
0.24
1.54
-0.07 0.2
1.12
0.43
-1.59
-0.13 0.26
1.75
-0.5 -0.41
4.5
-2
-1
0
1
2
3
4
5
6
7
8
Bangladesh Cambodia Laos Myanmar Kyrgyzstan Mozambique Tanzania Uganda Zambia Zimbabwe Madagascar Ethiopia Malawi
Real Low Skilled Wages, & change Real High Skilled Wages, & change
Source: Opening Markets for the Poorest Countries: Assessing the Effects of Duty-free Quota-free Access to the G20, World Bank, 2011

34
Data gaps as obstacles to development
GNI per capita (Atlas method)
Sta
tis
tic
al
ca
pa
cit
y i
nd
ica
tor
Source: Statistical Development and Partnership Team, DEC, World Bank

Data gaps as obstacles to development For MDG indicators, there have been
improvements, but some way to go
Low/middle income countries with poverty estimate < 5 years old (%)
For Poverty, data is less up-to-date

What will it take to improve statistics?
• Identification of high priority indicators and design of
statistical development plans
• Funding of the above
• Collaboration between statistical agencies and policy
makers
• Open data, and innovative sources and IT solutions
• Stronger international inter-agency collaboration
36

Key Messages • Promote targeted policies and support accountable, efficient institutions
• Mobilize domestic resources for development through:
▫ Broader tax coverage
▫ Increased taxation capacity
▫ Greater accountability
▫ Efficient public spending
▫ Natural resource revenue
• The international community must use ODA and other resources to:
▫ Leverage more private resources
▫ Deliver global public goods
▫ Draw on emerging and innovative sources of finance
• Financial instruments have different properties and comparative advantages. Selecting the right combination of instruments to meet a given goal, in a given country context, might be one of the most important tasks ahead to enable full implementation of the next development framework post-2015.
37