
Financial Viability Assessment - London Borough of ... · FINANCIAL VIABILITY ASSESSMENT FOR...
46
LB Richmond Upon Thames Christopher Marsh & Co Ltd _____________________________________________________________________ 1 FINANCIAL VIABILITY ASSESSMENT FOR AFFORDABLE HOUSING THRESHOLDS AND EMPLOYMENT REDEVELOPMENT 1.0 Introduction 1.1 As part of the preparation of the Local Development Framework at the London Borough of Richmond Upon Thames (LBRT), Christopher Marsh & Co Ltd (Sustainable Property Consultants) were commissioned on Feb 23 rd , 2007 as follows: Aims: a. To test the impact on the economics of house building of revised affordable housing thresholds (or no threshold), percentage requirements and tenure splits; b. To consider the practicality of defining affordable housing requirements on small sites; c. To assess and provide commentary on the impact of affordable housing and other developer contributions (i.e. S106 agreements) recently revised, on the delivery of house building within the Borough. d. To consider the viability of redeveloping employment sites for employment purposes and mixed use development; e. To report the findings to the Council. While LBRT commissioned two financial viability assessments, they are clearly interlinked for various reasons including; a. In many Boroughs, residential redevelopment sites including affordable housing are often former employment sites, but are feasible because of significant value differentials; b. Current very strong property yields which have increased existing use values and thus highlighted viability issues; c. The requirement in PPS3 Housing (para.29) for Affordable Housing Viability Studies with particular reference to proposed threshold changes; and d. The increasing requirement for mixed use developments incorporating residential and employment generating uses and arguments about the relative viability of different ratios of such uses. We have therefore dealt with these commissions jointly. In terms of methodology, we adopted standard residual valuation approaches to make appropriate comparisons and evaluations. It should however be stressed at the outset that the extent and range of financial variables involved in such
Transcript of Financial Viability Assessment - London Borough of ... · FINANCIAL VIABILITY ASSESSMENT FOR...

LB Richmond Upon Thames Christopher Marsh & Co Ltd _____________________________________________________________________
1
FINANCIAL VIABILITY ASSESSMENT FOR AFFORDABLE HOUSING THRESHOLDS
AND EMPLOYMENT REDEVELOPMENT
1.0 Introduction 1.1 As part of the preparation of the Local Development Framework at the London
Borough of Richmond Upon Thames (LBRT), Christopher Marsh & Co Ltd (Sustainable Property Consultants) were commissioned on Feb 23rd, 2007 as follows:
Aims:
a. To test the impact on the economics of house building of revised affordable
housing thresholds (or no threshold), percentage requirements and tenure splits;
b. To consider the practicality of defining affordable housing requirements on small sites;
c. To assess and provide commentary on the impact of affordable housing and other developer contributions (i.e. S106 agreements) recently revised, on the delivery of house building within the Borough.
d. To consider the viability of redeveloping employment sites for employment purposes and mixed use development;
e. To report the findings to the Council. While LBRT commissioned two financial viability assessments, they are clearly
interlinked for various reasons including;
a. In many Boroughs, residential redevelopment sites including affordable housing are often former employment sites, but are feasible because of significant value differentials;
b. Current very strong property yields which have increased existing use values and thus highlighted viability issues;
c. The requirement in PPS3 Housing (para.29) for Affordable Housing Viability Studies with particular reference to proposed threshold changes; and
d. The increasing requirement for mixed use developments incorporating residential and employment generating uses and arguments about the relative viability of different ratios of such uses.
We have therefore dealt with these commissions jointly. In terms of
methodology, we adopted standard residual valuation approaches to make appropriate comparisons and evaluations. It should however be stressed at the outset that the extent and range of financial variables involved in such

LB Richmond Upon Thames Christopher Marsh & Co Ltd _____________________________________________________________________
2
calculations and individual site characteristics which are often unique, mean that blanket requirements and conclusions must always be tempered by a level of flexibility in application.
Background / Experience 1.2 Having been involved in advising local planning authorities regarding planning
and development packages on over 230 major projects, CM/SPC are well versed in the requirements of such commissions and recently have carried out similar benchmarking exercises for the London Thames Gateway Development Corporation and a number of local authorities.
Context 1.3 The Policy Context. It is widely acknowledged both in the Council’s Housing
Needs Survey, planning policy statements and by local market sources that the Borough is one of the most expensive places to live in the country. The result is an acute problem of affordable housing. However, in practice, affordable housing provision has only reached 27% in recent years despite a 40% target in the policy, a record not particular to LBRT; indeed, actual affordable housing provision across London is approximately 31% despite the policy requirements of the London Plan.
The Council’s approach therefore has been to seek to ensure that the supply of affordable housing meets as much of the need as possible by maximising provision on suitable sites. In principle, there are two main ways in which this can be done; a) Lower the site/development size thresholds above which affordable and/or
Planning Obligations are sought; and /or, b) Raise the overall affordable housing (and potentially Planning Obligation)
requirements. Pursuing such approaches can inevitably raise a dilemma, in that maintaining local employment opportunities, not least in the interests of sustainability, is often an equally important objective.
1.4 Thresholds. While Government have applied size thresholds to affordable
housing for some time, no such threshold has applied to Planning Obligations. Indeed, the new Obligations Circular (05/05) makes clear that small schemes can be required to contribute planning obligations.
However, the case for reducing size thresholds regarding affordable housing is
addressed in recent Government statements including revisions to PPS3 Housing (Dec. 2005) which enables local planning authorities to justify a case for reduction. Starting from the evidence, namely that the Council’s current policies deliver affordable housing on qualifying sites, the question is, will reducing thresholds / and/or raising affordable housing targets produce more affordable housing units? The Council are making such a case on the basis of the proportion of housing sites below 10 dwellings. However, this inevitably raises

LB Richmond Upon Thames Christopher Marsh & Co Ltd _____________________________________________________________________
3
questions of viability. Can smaller sites meet affordable housing requirements in the same way that larger sites can? Can sites over 10 units deliver 50% affordable units including a 80-20% tenure split in favour of social renting? These questions have to be addressed via financial testing, not least because obvious economies of scale which apply to large sites may not arise on small sites.
The main sections of this report therefore review the potential for policy changes
with specific reference to financial viability. In doing so, we have sought to compare potential outcomes with the ability to retain employment generating sites and their value either as existing uses or as redeveloped employment sites.
2.0 Methodology 2.1 While our methodology is consistent and follows standard development appraisal
conventions, it should be emphasised that local market and planning policy circumstances are always different. Consequently, not only are such viability exercises particular to each authority, they are also specific to the time when they are undertaken and should of course be regularly reviewed to reflect revised policies, new market conditions, changes in the affordable housing regime and of course, the outcome of Circular 05/05 on Planning Obligations.
As will become clear, we have taken account as far as is practicable, of all these variables in carrying out these Reviews.
The Approach to Financial Viability
2.2 Development Appraisal models are in essence simple and can be summarised via the following equation;
Completed Development Value
Minus
Total Construction Costs
Minus
Developers Profit
=
Residual Land Value
Residual Value – what the landowner receives – will normally be the critical variable. If a proposal generates sufficient positive land value, it will be implemented; if not, unless, there are alternative funding sources to bridge the ‘gap’ (and these will normally be particular to regeneration areas via public bodies such as English Partnerships) , the proposal will not go ahead.
LB Richmond Upon Thames Christopher Marsh & Co Ltd _____________________________________________________________________
4
The problems with Development Appraisals all stem from the requirement to identify the key variables – values, costs etc.- with some degree of accuracy in advance of implementation. Even on the basis of the standard convention, namely that current values and costs are adopted (not values and costs on completion), this can be very difficult.
2.3 Problems with key variables can be summarised as follows:
• Values attached to Completed Development Value are largely dependent on comparable evidence which requires sufficient new development in the locality of a similar size and type, to provide a realistic value base.
• Development costs are subject to extensive national and local monitoring and can be reasonably accurately assessed in ‘normal’ circumstances. Increasingly however, with restrictions on greenfield developments and a greater emphasis on brownfield sites, ‘exceptional’ costs such as decontamination are becoming more common. Such costs can be very difficult to anticipate before detailed site surveys, although these circumstances are less common in the Borough area than elsewhere.
• Development value and costs will also be significantly affected by assumptions about the nature and type of affordable housing provision and other Planning Obligations and on major projects, assumptions about development phasing and infrastructure triggers. In essence, where the cost of affordable units and/or Obligations are deferred, the less the real cost to the applicant.
• While Developer’s Profit has to be assumed in any appraisal, its level is closely correlated with risk. The greater the risk, the greater the profit level, in part as a contingency against the unexpected.
• Ultimately, the landowner holds the key and will make a decision on implementing the project or not on the basis of return and the potential for market change and thus alternative developments. The landowner’s ‘bottom line’ will be achieving ‘development value’ that sufficiently exceeds ‘existing use value’ to make development worthwhile.
What in essence therefore is a simple equation - the development appraisal calculation – is in reality fraught with problems. The following two diagrams summarise the outcomes.

LB Richmond Upon Thames Christopher Marsh & Co Ltd _____________________________________________________________________
5
24
COMPLETED DEVELOPMENT VALUE
-
CONSTRUCTION COSTS, FEES ETC.
PLANNING OBLIGATIONS
-
DEVELOPER’S PROFIT
=
RESIDUAL LAND VALUE
(Must exceed Existing Use Value)
The standard appraisal calculation shown above is, subject to the problems noted earlier, reasonably clear cut. The delivery of Planning Obligations and in particular the provision of affordable housing however, below, complicates the calculation by reducing Completed Development Value depending on the percentage, tenure and funding of affordable housing and thus Residual Land Value and that is the essence of much of this debate.
24
COMPLETED DEVELOPMENT VALUE
-
CONSTRUCTION COSTS, FEES ETC.
PLANNING OBLIGATIONS
AFFORDABLE HOUSING
-
DEVELOPER’S PROFIT
=
RESIDUAL LAND VALUE
(Must exceed Existing Use Value)
% / Tenure Split
Reduction
The result is predictable in several respects;
a) When negotiating with the landowner, the prudent developer will invariably negotiate an option to purchase which put crudely, will enable any additional costs arising (Planning obligations and affordable housing for example) to be passed on to the landowner. Ultimately, the landowner pays; and/or,
b) The developer will build in sufficient contingency into the development appraisal to offset risks including for example, the availability of grant support for affordable housing. In some authorities, this variable is to a

LB Richmond Upon Thames Christopher Marsh & Co Ltd _____________________________________________________________________
6
degree removed by a no grant policy regime (although this may reduce the level of affordable housing delivered).
3.0 The Development Industry’s Approach
3.1 In some areas, local developers have, not entirely unreasonably, complained about lack of ‘certainty’ , despite the obvious hedges against risk noted above, when trying to carry out development appraisal calculations. This is hardly uncommon and indeed was one reason why Government explored the notion of a development ‘tariff’ rather than Planning Obligations. (The writer was a member of the ODPM advisory team which after much debate dismissed a ‘tariff’ as unworkable).
3.2 In some instances, developers have suggested a ‘solution’ founded on the notion of a hypothetical ‘Gross Land Value’, from which various deductions for affordable housing and Planning Obligations are made, to then leave a ‘Net Land Value’ which is adequate to meet landowners expectations. This is convenient and to a degree understandable, in that it would attempt to ‘price-fix’ and thus be certain, but in essence is nonsense. Fixing the land value and then arguing the proposal cannot be viable and that Planning Obligations and affordable housing must be scaled down is effectively attempting to carry out the Residual Valuation in reverse
3.3 Some Developers suggest a further step, namely to agree a ‘formula’ in advance
of any particular scheme. The obvious requirements would be that it was equitable (not least to the local planning authority), robust in planning terms (meeting policy ), and be workable.
Several points are noteworthy;
a) Despite guidance to the contrary in Circular 1/97, Planning Obligations (at least at the mathematical end of the spectrum – e.g. Education, health, libraries etc), have become increasingly formulaic and rightly so. Government has recognised this in Circular 05/05 which now strongly advocates the use of formula. However, at the ‘softer’ end of the Obligations agenda – e.g. Environmental and social costs - mitigation measures cannot be easily converted into fixed formulae and will continue to be negotiated, again recognised in the Circular.
b) Even where formulae can be determined, a host of practical difficulties will remain – how are formulae to be fixed; how would they vary in different development situations; how would they apply to different land uses and on what basis would they be reviewed. Any certainty provided by formulae could be quickly undermined and for those reasons amongst many, the so-called ‘Tariff’ was abandoned by Government.
c) Formulaic approaches have also been attempted with regard to affordable housing, most notably by the Greater London Authority, but again the original ‘requirement’ for 50% provision in inner Boroughs and 35% in outer Boroughs had to be downgraded to a Borough wide aspiration. Indeed, more recently, the GLA’s Supplementary Planning Guidance on Affordable Housing (para.7.13) makes clear that financial considerations, where proven

LB Richmond Upon Thames Christopher Marsh & Co Ltd _____________________________________________________________________
7
via Independent Assessment, may arise which prevents the full policy expectation being delivered.
The implications of these limitations for an ‘area-based’ policy (considered by
some Councils) in LBRT where base values do vary significantly are all too obvious. Overall, while formulae can provide useful guidance, that’s all they are and ultimately every case must continue to be assessed on its merits albeit within a strong policy framework. Specifically, if a development project cannot meet its consequential infrastructure costs – and it is important to differentiate between those costs which are literally development necessities such as access works and those impact mitigation costs, many of which will also be necessities but may be negotiable to a degree - then it is the wrong proposal. If it can meet its Planning Obligations but cannot then meet its affordable housing requirements, then the proponents must demonstrate why not. It may for example be a contaminated site where genuine exceptional costs arise. Three possibilities result; a) A robust financial explanation is accepted (or not) by the authority and
exceptionally and in the interest of broader planning and community interests, policy requirements are compromised; or,
b) Contributions and/or affordable housing are deferred in order to improve cashflow and discount the real costs of provision; or,
c) Gap funding is necessary to cover the financial shortfall.
It is clearly prudent for the authority in developing its policy stance – not least at the area level - to ‘test’ in general and as far as is possible given the unpredictability of some financial variables, how practical the policy position actually is across its area /sub areas where values will obviously vary. This report provides that general benchmarking to the Council with particular reference to employment sites and their value.
4.0 The Benchmarking Exercise 4.1 Key Modelling Variables are as follows and are worthy of explanation in
principle.
a) Sales Values by area. Sales values – residential and commercial – will vary in all local authority areas and of course are in a constant state of flux. Developers will obviously try to complete schemes in a rising market but ultimately, this is a development ‘risk’ which the developer must accept. It is not for the authority to compromise because of market fluctuations.
b) Density. Density is an increasingly important determinant of development value, albeit with commensurate effects on development costs, planning obligations and thus residual land value.
c) Gross to net floor space. Clearly, the greater the density, the higher the gross to net floor space ratio – that is, for example, in high rise flatted schemes, more floor space is taken up by common areas and services and
LB Richmond Upon Thames Christopher Marsh & Co Ltd _____________________________________________________________________
8
thus less space is available for renting/sale - and this will adversely affect the appraisal calculation.
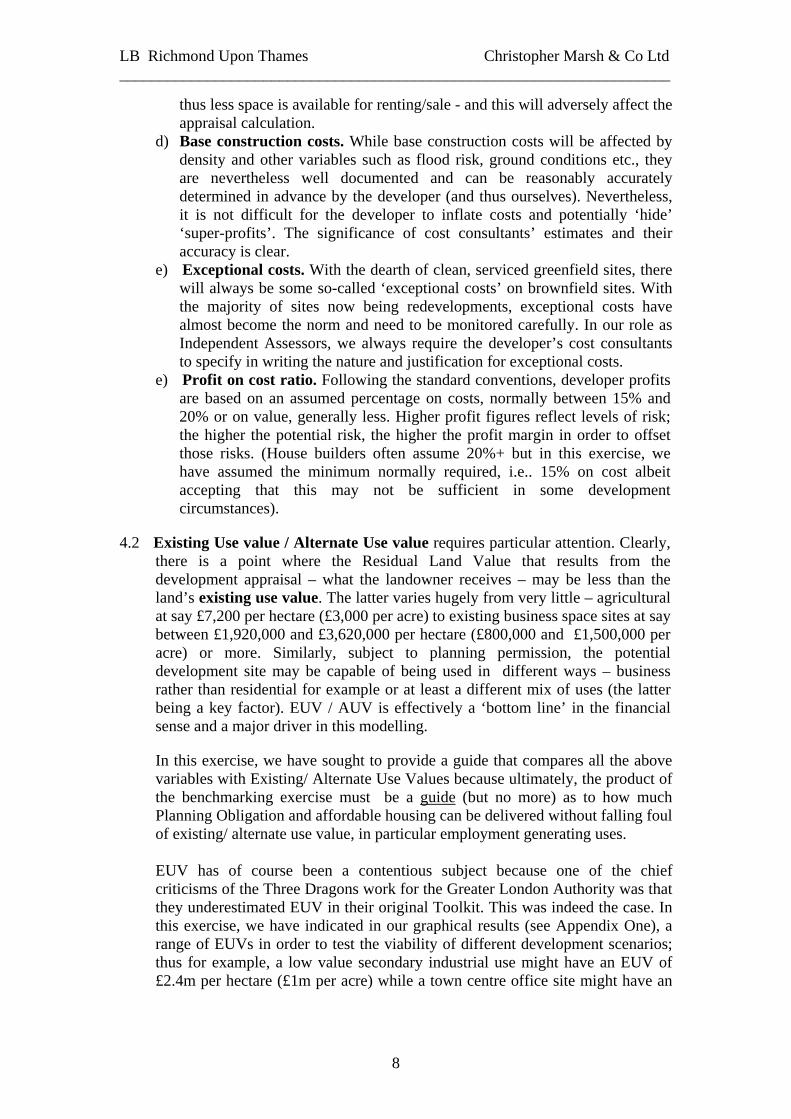
d) Base construction costs. While base construction costs will be affected by density and other variables such as flood risk, ground conditions etc., they are nevertheless well documented and can be reasonably accurately determined in advance by the developer (and thus ourselves). Nevertheless, it is not difficult for the developer to inflate costs and potentially ‘hide’ ‘super-profits’. The significance of cost consultants’ estimates and their accuracy is clear.
e) Exceptional costs. With the dearth of clean, serviced greenfield sites, there will always be some so-called ‘exceptional costs’ on brownfield sites. With the majority of sites now being redevelopments, exceptional costs have almost become the norm and need to be monitored carefully. In our role as Independent Assessors, we always require the developer’s cost consultants to specify in writing the nature and justification for exceptional costs.
e) Profit on cost ratio. Following the standard conventions, developer profits are based on an assumed percentage on costs, normally between 15% and 20% or on value, generally less. Higher profit figures reflect levels of risk; the higher the potential risk, the higher the profit margin in order to offset those risks. (House builders often assume 20%+ but in this exercise, we have assumed the minimum normally required, i.e.. 15% on cost albeit accepting that this may not be sufficient in some development circumstances).
4.2 Existing Use value / Alternate Use value requires particular attention. Clearly, there is a point where the Residual Land Value that results from the development appraisal – what the landowner receives – may be less than the land’s existing use value. The latter varies hugely from very little – agricultural at say £7,200 per hectare (£3,000 per acre) to existing business space sites at say between £1,920,000 and £3,620,000 per hectare (£800,000 and £1,500,000 per acre) or more. Similarly, subject to planning permission, the potential development site may be capable of being used in different ways – business rather than residential for example or at least a different mix of uses (the latter being a key factor). EUV / AUV is effectively a ‘bottom line’ in the financial sense and a major driver in this modelling.
In this exercise, we have sought to provide a guide that compares all the above variables with Existing/ Alternate Use Values because ultimately, the product of the benchmarking exercise must be a guide (but no more) as to how much Planning Obligation and affordable housing can be delivered without falling foul of existing/ alternate use value, in particular employment generating uses. EUV has of course been a contentious subject because one of the chief criticisms of the Three Dragons work for the Greater London Authority was that they underestimated EUV in their original Toolkit. This was indeed the case. In this exercise, we have indicated in our graphical results (see Appendix One), a range of EUVs in order to test the viability of different development scenarios; thus for example, a low value secondary industrial use might have an EUV of £2.4m per hectare (£1m per acre) while a town centre office site might have an

LB Richmond Upon Thames Christopher Marsh & Co Ltd _____________________________________________________________________
9
EUV of £7m per hectare or more (£3m per acre plus). Redevelopment proposals that generate residual land values below EUV will fail to be delivered. While any such thresholds are only a guide in ‘normal’ development circumstances, it does not imply that individual landowners, in particular financial circumstances, will not bring sites forward at a lower return or indeed require a higher return. It is simply indicative. If proven existing use value (via a formal Red Book valuation which is essential) justifies a higher EUV than those assumed, then appropriate adjustments may be necessary. As such, Existing Use Values should be regarded as benchmarks rather than definitive fixtures. At a practical level, it is also necessary to stress that in the Borough area, many residential development sites are redevelopments of existing residential uses, thus emphasising the significance of value uplift.
4.3 Specific Modelling Variables. This section summarises the particular
assumptions used in the benchmarking exercise.
a) Sales Values. Residential values in the Borough have reflected and to a degree preceded national trends in recent years but do of course vary across the Borough as follows:
Area Postcode
Land Registry Overall average Q4, 2006
Barnes SW13 0 £552,738 SW13 8 £686,071 SW13 9 £774,538 East Sheen SW14 7 £448,728 Mortlake SW14 8 £448,503 Richmond TW9 1 £508,119 TW9 2 £478,248 TW9 4 £465,785 TW10 5 £465,785 TW10 6 £690,406 Ham / Petersham TW10 7 £427,506 Twickenham TW1 1 £529,297 TW1 2 £474,905 TW1 3 £301,924 TW1 4 £405,049 Hampton TW12 1 £355,745 TW12 2 £385,589 TW12 3 £315,507 Hampton Wick KT1 4 £356,407 Teddington TW11 0 £333,799 TW11 8 £429,705 Whitton TW2 7 £323,025

LB Richmond Upon Thames Christopher Marsh & Co Ltd _____________________________________________________________________
10
These variations are more obviously illustrated in the following Chart although its should be emphasised that Land Registry data provides averages of all transactions and that new build will command premiums.
Average Residential Sales Values By Postcode
0 200000 400000 600000 800000 1000000
SW13 0
SW13 9
SW14 8
TW9 2
TW10 5
TW10 7
TW12
TW14
TW12 2
KT14
TW11 8
c) The volume of New Build in the Borough is currently at relatively modest
levels with the latest London Residential Research evidence indicating average prices asking / achieved in a sample of new developments. There are also variations here with postcode averages reflecting the particular type of new build under construction. LRR continue to operate in imperial, and while demonstrating a very wide range of values – from £236psf (£2548psm) to £906psf (£9785psm), the majority fall within the range £350-750psf (£3780-8100psm).
Appendix 3 details this data.

LB Richmond Upon Thames Christopher Marsh & Co Ltd _____________________________________________________________________
11
d) Density. Clearly, densities vary across the Borough from town centre to
suburban locations. In this exercise, we have assumed an average residential unit size of 70m2 and a range of densities from 48 units per hectare (3,360m2) – a modest suburban density but much higher than small scale executive developments – to 168 units per hectare (11,760m2) – a high town centre density. While there are clearly examples of small scale schemes at much lower densities, the model nevertheless enables a range of densities to be considered.
e) Gross to Net Floor space. The higher the density, the greater the loss of net
lettable/ saleable space. In this model, we have an adopted a range from 100% gross to net – i.e.. virtually no difference – to 82.5% gross to net in high density situations where common areas amount to 17.5%, and completed development value is reduced in line.
f) Base Construction Costs. The modelling exercise plots a range of base
construction costs reflecting density considerations ranging from £1,291psm to 1,829psm. These costs are relatively high, and could be increased should ‘exceptional costs’ arise, that is the variety of above average costs which include contamination and remediation. While such costs may still be unusual in the Borough , redevelopments are increasingly the norm and thus, such costs will become more common. As a result, costs need to be treated with caution and where exceeded, will inevitably diminish the capacity of schemes to carry obligations and affordable housing. Affordable Housing build costs have been included at £1500m2 in line with Housing Corporation guidelines.
g) Planning Obligations. We have modelled Planning Obligations as provided
by the Borough’s Planning Officers taking account of reductions for one bedroom units and for affordable units and summarised in the following table.

LB Richmond Upon Thames Christopher Marsh & Co Ltd _____________________________________________________________________
12
Planning Obligations Strategy impact. April 2007*
Development type Residential B1 Retail A1 A2 A3 Restaurant A4 Pub/Bar A5 Takeaway
1-2
units 3 or more net 5 or more net
per additional 100 sqm GFA
+ per additional
100 sqm GFA +
per additional 100 sqm GFA
+
per additional 100 sqm GFA
+ of 100 sqm
GFA + of 100 sqm
GFA +
Aff hsg - - - - - - - - -
Educ: pte hsg - £2709 for 2-bed £2709 for 2-bed - - - - - -
Educ: aff hsg - £1561 for 2-bed £1561 for 2-bed - - - - - -
Community Safety - - - - - - - to be negotiated to be negotiated
Health - - £244 a unit - - - - - -
Public Realm etc - - £1128 a unit - - - - - -
Transport - - £5728 a unit £2000/100 sqm £17,000/100 sqm £4000/100 sqm £7000/100 sqm £7000/100 sqm £7000/100 sqm Total pte residential - £2,709 £9,809 - - - - - -
Total aff hsg £1,561 £8,661
Total per sq m - - - £2000/100 sqm £17,000/100 sqm £4000/100 sqm £7000/100 sqm £7000/100 sqm £7000/100 sqm
* At this point, the Strategy had been adopted June 2005, and amendments had been made to contributions for school places (Cab Member decision 2007) Notes
Affordable housing: threshold = 40% on sites 'capable of 10 or more units' gross, but maximum feasible on former employment sites. Where financial contribution for affordable housing is agreed, formula is 'market value less TCI x the appropriate no. & size of units'. Formula needs revision, as TCIs now superseded. School places: threshold = 3 or more units net, excluding specialist housing for older people Figures for private housing are for 2-bed units (although at least 25% will be 1-bed). The take-up rates for private housing are assumed to be 57% at secondary level, & 68% at primary level, although the Education Dept will be applying a primary level take-up of 75% for Twickenham (Middx) side of Borough and 60% for the Richmond (Surrey) side. Figures for affordable housing are also for 2-bed units Community safety: Health: threshold = 5 or more units net £147 per unit x occupancy factor. Figure in table assumes average of 2-bed units, to take account of occupancy factor Public Realm, Open space and Thames: threshold = 5 or more units net £680 per unit x occupancy factor. Figure in table assumes average of 2-bed units, to take account of occupancy factor. Could add £100 if over 400m from open space

LB Richmond Upon Thames Christopher Marsh & Co Ltd _____________________________________________________________________
13
Transport: threshold = 5 or more units net residential, or commercial (B1, A1, A2, A3, A4, A5 uses) with 100 sqm GFA or more £1432 per net additional unit or £500 per additional 100 sqm GFA for commercial x trip generation factor x public transport accessibility factor
Figures in table assume trip generation factors of 2 for residential (average 2-bed flats), 2 for B1, 17 for A1, 4 for A2, 7 for A3, A4, A5 & PTAL average of 2

LB Richmond Upon Thames Christopher Marsh & Co Ltd _____________________________________________________________________
14
h) Affordable Housing Variations. There are of course a wide range of
affordable housing development scenarios in terms of percentage, tenure split, nature of funding and of course increasingly private sector interest in affordable housing per se.
In the Borough area, the overriding need is for social rented affordable units and as such, the normal expectation will be a 70%-30% tenure split, social rented to intermediate units, although there may be site specific circumstances where these proportions are adjusted. We have also modelled at an overall target of 40% provision and at 50% provision with an 80-20% tenure split.
In the light of advice from Registered Social Landlords active in the area which broadly confirms as we would expect, a positive land value contribution both from intermediate tenures and from social rented, and taking account of tenure split expectations as above , we have modelled Residual Land Values on the basis of a value neutral scenario for comparison purposes , that is the affordable housing does not increase or decrease land value but covers its costs. In reality, However, there will be a positive land value contribution especially in higher value parts of the Borough. The assumptions for modelling are as follows. Richmond Appraisals. Assumptions common to basic variations; Social Rent – 70%
Number Type Bedspace/ Person
M2 - Net Internal Area
Habitable Rooms
5 1B / 2P 48 10 10 2B / 3P 58 30 10 2B / 4P 70 30 10 3B / 5P 83 40 35 110
Shared Ownership – 30%
Number Type Bedspace/ Person
M2 - Net Internal Area
Habitable Rooms
5 1B / 2P 48 10 5 2B / 3P 58 15 5 2B / 4P 68 15 15 40

LB Richmond Upon Thames Christopher Marsh & Co Ltd _____________________________________________________________________
15
Build Cost £1500 per m2 Gross Internal Area (GIA = NIA plus 15%) On costs include interest: 9.3% of land and works Grant Social Rent: £92,857 per unit (£25,000 per bedspace) Shared Ownership: £40,000 per unit (£13,300 per bedspace) Other Assumptions 1999 values: 45% of current day (for Target Rent calculation) Rent on SO: 2.5% of unsold equity Staircasing where applicable 50% of SO units over years 5 – 21 Indicative Land Values With Staircasing assumption
Overall Averages OMV
per Ft2
Social Rent
Average / Unit
Average/ Hab.Room
Shared O’ship
Average / Unit
Average/ Hab.Room
Average / Unit
Average/ Hab.Room
300 1100000 31,429 10,000 1000000 66,667 25,000 42,000 14,000 400 1430000 40,857 13,000 1200000 80,000 30,000 52,600 17,533 600 1485000 42,429 13,500 1920000 128,000 48,000 68,100 22,700 800 1540000 44,000 14,000 2600000 173,333 65,000 82,800 27,600
With no Staircasing Overall Averages OMV
per Ft2
Social Rent
Average / Unit
Average/ Hab.Room
Shared O’ship
Average / Unit
Average/ Hab.Room
Average / Unit
Average/ Hab.Room
300 1045000 29,857 9,500 800000 53,333 20,000 36,900 12,300 400 1430000 40,857 13,000 1000000 66,667 25,000 48,600 16,200 600 1485000 42,429 13,500 1440000 96,000 36,000 58,500 19,500 800 1540000 44,000 14,000 1800000 120,000 45,000 66,800 22,267

LB Richmond Upon Thames Christopher Marsh & Co Ltd _____________________________________________________________________
16
Other Influential Factors
a) Variability of landowner attitudes. There is no question that land markets do need time to adapt to changing policy circumstances and landowners may have the choice to hold sites back and hope. Recently, a more common circumstance in areas of sharp price inflation has been developers ‘taking a punt’ – i.e.. buying sites in without consent on the expectation that rising capital values would offset risk and then seeking, in a market that turns, to persuade the authority that the scheme cannot afford its consequential infrastructure and affordable housing.
b) Having said that, there is no question that site specific circumstances will arise where the authority is obliged to weigh up perhaps contradictory policy requirements.
c) On larger schemes perhaps phased over some years, developers will invariably try and agree fixed terms on S106 and affordable housing at the outset. (Their driving factor will be the certainty, required to secure bank funding). In such circumstances, it is often in the authorities’ interest to seek monitoring and review mechanisms in the S106 that will allow a renegotiation at some future date should it become necessary.
4.5 Existing Use Values – Employment Land
4.5.1 A key element in this benchmarking assessment is Existing Use Value and
specifically Employment land currently on the market as existing use values. In determining comparative values, we have considered the Borough’s employment land and its associated values. The key themes are as follows:
Largest use type currently available is offices (B1);
Location is important in pricing values and varies significantly;
Richmond commands higher rents psf due to location and communication links, particularly office sites with access to major roads, such as A316 which leads onto the M3 in the south and towards the Hogarth Roundabout and in towards central London to the north;
Available space in Teddington currently commands the lowest rents psf but as a main office centre, this probably reflects the poor quality of available space and less good communication links;
Most warehousing is available in Hampton on sites further away from central areas;
Small amount of light industrial/industrial sites currently on market in all areas studied;
No sub-sector data captured for currently available employment use sites in the areas of Barnes, Ham/Petersham or Whitton/Heathfield;
Good transport links reflected in the development pipeline. Major town centres (Twickenham, Richmond and Teddington) generate greater number of permissions;
Little employment land use proposals in the pipeline for Ham/Petersham;

LB Richmond Upon Thames Christopher Marsh & Co Ltd _____________________________________________________________________
17
Teddington pipeline data illustrates higher number of residential proposals than employment land;
Twickenham pipeline shows a similarity between residential and employment land use proposals
Nb. Commercial agents still tend to market asking rents in imperial which we reflect below but for comparative modelling purposes, we have included both imperial and metric tables.
4.5.2 Overall, the level of employment land activity is relatively modest with a wide
range of rental values (See Appendix 1). Using this data, we have prepared a series of commercial office and industrial / warehousing valuations to determine residual land value which can then be used for comparative purposes. The following Table summarises outcomes;
Employment Land Values
Use Rent psf / Yield Appraisal No.
1A 1B 1C 1D 1E
B1 Offices £15 - 8% £17 - 8% £20 - 8% £23 - 8% £25 - 8% Land Value - £23.61psf - £10.99 psf £7.95 psf £26.89 psf £39.51 psf Use Rent psf / Yield Appraisal No.
2A 2B 2C 2D 2E
B1 Offices £25 - 7% £30 - 7% £35 - 7% £40 - 6.5% £50 - 6% Land Value £47.72psf £83.88 psf £110.18 psf £168.98 psf £265 psf Use Rent psf / Yield Appraisal No.
3A 3B 3C 3D
B2 / Wh £10 - 8% £12 - 8% £15 - 7.5%
£18 - 7.5%
Land Value £4.18 psf £18.99 psf £33.78 psf £57.51 psf
B1 office rentals illustrate the traditional ‘rule of thumb’, namely that a £20psf minimum rental level is necessary in order to generate a positive land value. In those parts of the Borough, where this is not the case (See the following Table), then redevelopment for B1 office uses is unlikely. Areas of relatively low office rental are most likely to find existing employment sites under pressure for change of use. Land value is also dependent on yield as demonstrated

LB Richmond Upon Thames Christopher Marsh & Co Ltd _____________________________________________________________________
18
Research Criterion Town Class Sub-class East Sheen Hampton Hampton Wick Mortlake Richmond Teddington Twickenham Grand Total
B1 – offices (i) 2 (Avg £17) 11 (Avg £24) 4 (Avg £27) 1 (Avg £19.50) 11 (Avg £24) 4 (Avg 7) 7 (Avg £17) 40
B1© – light industry (iii) 3 (Avg3 £12) 3 (Avg £9) 6 Industrial
uses/workshops/workshops ancillary to garages/filling
stations (vi)
1 (Avg £56) 1 1. sites in mixed use/town centre areas
Warehousing, closed storage (viii) 1 (Avg £18) 1
Total 2 16 4 1 11 7 7 48
B1 – offices (i) 1 (Avg £26) 2 (Avg £23) 11 Avg (£30) 1 4 (Avg £20) 19
B1© – light industry (iii) 2 (Avg£12) 2 Industrial
uses/workshops/workshops ancillary to garages/filling
stations (vi)
1 (Avg £13) 1 2. sites further away from central areas
Warehousing, closed storage (vii) 33 (Avg £12) 33
Total 1 35 14 1 4 56 3. sites with good access/approaches (e.g. Lower Richmond Rd)
B1 – offices (i) 4 Avg (£50) 4
Total 4 4 4. sites with relatively poor access/approaches (e.g. Colne Rd., West Twickenham)
B1 – offices (i) 4 (Avg £26) 4
Total 4 4
B1 – offices (i) 1 (Avg £17) 3 (Avg £20) 2 (Avg £23) 1 8 (Avg £22) 4 (Avg £18) 12 (Avg £18) 31 5. sites of different sizes B1© – light industry (iii) 1 (Avg £13.50) 1
Total 1 3 2 1 8 5 12 32
Grand Total 4 54 6 2 41 12 23 142
Note: Values quoted are asking rents, not those necessarily achieved (or incentivised) for space/sites available in 2006/7.

LB Richmond Upon Thames Christopher Marsh & Co Ltd _____________________________________________________________________
19
above; higher rentals generate better yields and as such improve land value twice over. Density is also a key driver in land value terms and B1 offices can of course vary markedly. For modelling purposes, we have adopted a £7.2m per hectare land value for better quality B1 office sites with say up to five floors and 60% site cover. This might be exceeded in individual cases but it is reasonable for most better locations. Lower densities and less prime locations would be correspondingly lower and in the modelling exercise, we have indicated a £4.8m per hectare (£2m per acre) level for comparative purposes. Similarly, better order industrials at say £15psf and a 7.5% yield with say a 70% plot ratio on a single storey would produce a land value of approximately £2.4m per hectare (£1m per acre). These benchmarks (reflected in the Table above) by location and rent provide the necessary guide to the likelihood of redevelopment pressure, in that clearly any residential led scheme would have to exceed these levels in order to be viable.
Before examining the illustrated outcomes however, it is important to stress again and summarise those variables which may change the outputs – positively and negatively - and which thus must be treated with caution. They are as follows: Positive Impacts on Calculation Negative Impacts Net land value contribution from Affordable Possible Net land value loss Housing from AH Low/deferred Planning Obligations High obligations up-front Historic land costs (minimal) Contamination / remediation
cost
Increase in shared ownership Reduced SHG
Availability of Gap funding
With those caveats in mind, the following Tabular presentation summarises the key outputs.

LB Richmond Upon Thames Christopher Marsh & Co Ltd _____________________________________________________________________
20
RESULTS Table 1. Base Residential Land Values per square foot in LB Richmond (Excluding Affordable Housing)
Table 1 Density – Units/acre
20 Units 14000ft2/acre G/Net 100%
30 Units 21,000ft2/acre
G/N 95%
40 units 26,000ft2/acre
G/N 90%
50 units 31,250 ft2/acre
G/N 87.5%
60 units 36,000ft2/acre
G/N 85%
70 units 40,250ft2/acre
G/N 82.5% Sales
Value psf Residual
Land Value psf
Build - £120psf Build - £130psf Build - £140psf Build - £150psf Build - £160psf Build - £170psf
£275 psf 70.23 50.38 30.54 15.51 0.48 -14.55 £300 psf 87.75 67.03 46.31 30.84 15.37 -0.09 £325 psf 105.28 83.68 62.08 46.17 30.27 14.36 £350 psf 122.80 100.32 77.85 61.51 45.16 28.82 £375 psf 140.32 116.97 93.62 76.84 60.06 43.28 £400 psf 157.85 133.62 109.39 92.17 74.95 57.73 £425 psf 175.37 150.27 125.16 107.5 89.85 72.19 £450 psf 192.89 166.91 140.93 122.84 104.74 86.64 £475 psf 210.42 183.56 156.70 138.17 119.63 101.10 £500 psf 227.94 200.21 172.47 153.50 134.53 115.56 £525 psf 245.46 216.85 188.24 168.83 149.42 130.01 £550 psf 262.99 233.50 204.01 184.17 164.32 144.47 £600 psf 298.03 266.79 235.56 214.83 194.11 173.38 £650 psf 333.08 300.09 267.10 245.50 223.90 202.30 £700 psf 368.12 333.38 298.64 276.16 253.69 231.21 £800 psf 438.22 399.97 361.72 337.49 313.26 289.04 £900 psf 508.31 466.56 424.81 398.82 372.84 346.86
£1000 psf 578.40 533.14 487.89 460.16 432.42 404.69
One Bed Percentage of Total @ 500 ft2 each
20% 30% 40% 50% 60% 70%

LB Richmond Upon Thames Christopher Marsh & Co Ltd _____________________________________________________________________
21
Table 2. Base Residential Land Values per acre in LB Richmond (Excluding Affordable Housing)
Table 2 Density – Units/acre
20 Units 14000ft2/acre G/Net 100%
30 Units 21,000ft2/acre
G/N 95%
40 units 26,000ft2/acre
G/N 90%
50 units 31,250 ft2/acre
G/N 87.5%
60 units 36,000ft2/acre
G/N 85%
70 units 40,250ft2/acre
G/N 82.5% Sales
Value psf Residual
Land Value per acre
Build - £120psf Build - £130psf Build - £140psf Build - £150psf Build - £160psf Build - £170psf
£275 psf 983220 1057980 794040 484687 17280 -585637 £300 psf 1228500 1407630 1204060 963750 553320 -3622 £325 psf 1473920 1757280 1614080 1442812 1089720 577990 £350 psf 1719200 2106720 2024100 1922187 1625760 1160005 £375 psf 1964480 2456370 2434120 2401250 2162160 1742020 £400 psf 2209900 2806020 2844140 2880312 2698200 2323632 £425 psf 2455180 3155670 3254160 3359375 3234600 2905647
£450 psf 2700460 3505110 3664180 3838750 3770640 3487260 £475 psf 2945880 3854760 4074200 4317812 4306680 4069275 £500 psf 3191160 4204410 4484220 4796875 4843080 4651290 £525 psf 3436440 4553850 4894240 5275937 5379120 5232902 £550 psf 3681860 4903500 5304260 5755312 5915520 5814917 £600 psf 4172420 5602590 6124560 6713437 6987960 6978545 £650 psf 4663120 6301890 6944600 7671875 8060400 8142575 £700 psf 5153680 7000980 7764640 8630000 9132840 9306202 £800 psf 6135080 8399370 9404720 10546563 11277360 11633860 £900 psf 7116340 9797760 11045060 12463125 13422240 13961115
£1000 psf 8097600 11195940 12685140 14380000 15567120 16288773
One Bed Percentage of Total @ 500 ft2 each
20% 30% 40% 50% 60% 70%
LB Richmond Upon Thames Christopher Marsh & Co Ltd _____________________________________________________________________
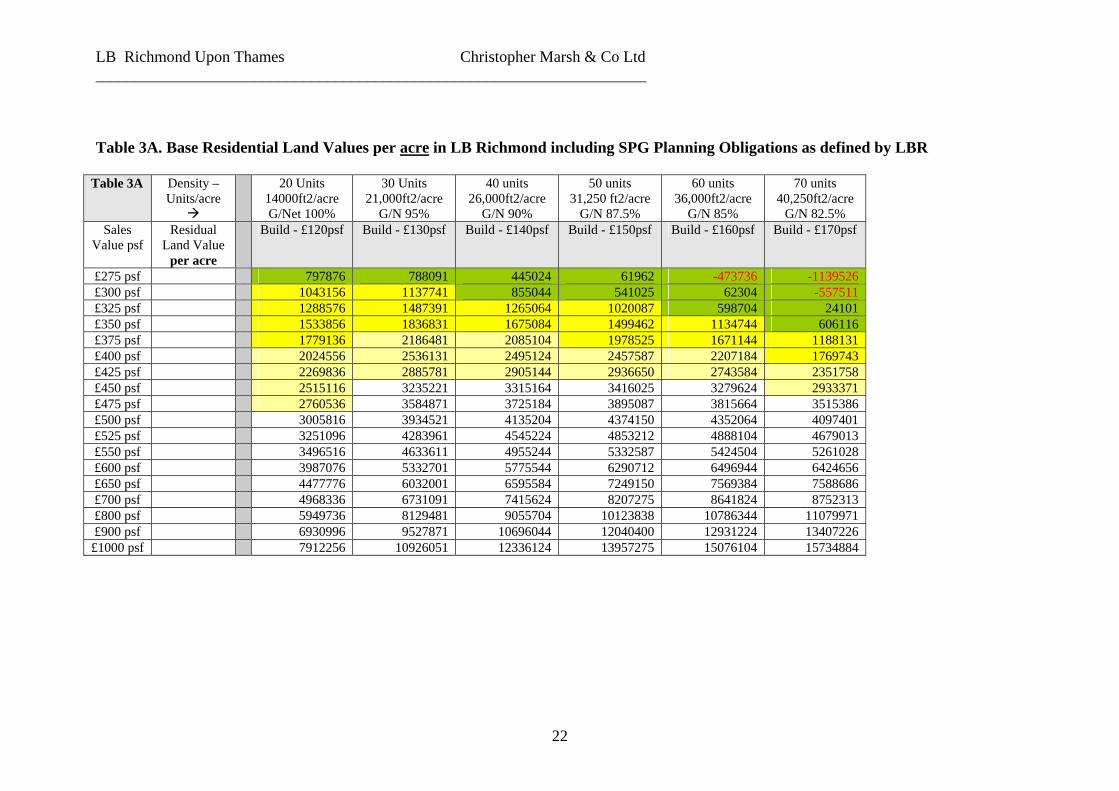
22
Table 3A. Base Residential Land Values per acre in LB Richmond including SPG Planning Obligations as defined by LBR
Table 3A Density – Units/acre
20 Units 14000ft2/acre G/Net 100%
30 Units 21,000ft2/acre
G/N 95%
40 units 26,000ft2/acre
G/N 90%
50 units 31,250 ft2/acre
G/N 87.5%
60 units 36,000ft2/acre
G/N 85%
70 units 40,250ft2/acre
G/N 82.5% Sales
Value psf Residual
Land Value per acre
Build - £120psf Build - £130psf Build - £140psf Build - £150psf Build - £160psf Build - £170psf
£275 psf 797876 788091 445024 61962 -473736 -1139526 £300 psf 1043156 1137741 855044 541025 62304 -557511 £325 psf 1288576 1487391 1265064 1020087 598704 24101 £350 psf 1533856 1836831 1675084 1499462 1134744 606116 £375 psf 1779136 2186481 2085104 1978525 1671144 1188131 £400 psf 2024556 2536131 2495124 2457587 2207184 1769743 £425 psf 2269836 2885781 2905144 2936650 2743584 2351758 £450 psf 2515116 3235221 3315164 3416025 3279624 2933371 £475 psf 2760536 3584871 3725184 3895087 3815664 3515386 £500 psf 3005816 3934521 4135204 4374150 4352064 4097401 £525 psf 3251096 4283961 4545224 4853212 4888104 4679013 £550 psf 3496516 4633611 4955244 5332587 5424504 5261028 £600 psf 3987076 5332701 5775544 6290712 6496944 6424656 £650 psf 4477776 6032001 6595584 7249150 7569384 7588686 £700 psf 4968336 6731091 7415624 8207275 8641824 8752313 £800 psf 5949736 8129481 9055704 10123838 10786344 11079971 £900 psf 6930996 9527871 10696044 12040400 12931224 13407226
£1000 psf 7912256 10926051 12336124 13957275 15076104 15734884

LB Richmond Upon Thames Christopher Marsh & Co Ltd _____________________________________________________________________
23
Table 3B. Base Residential Land Values per acre in LB Richmond including SPG Planning Obligations as defined by LBR Adjusted for 40% Affordable Housing (70-30% split) BUT excluding AH land value adjustment
Table 3B Density – Units/acre
20 Units 14000ft2/acre G/Net 100%
30 Units 21,000ft2/acre
G/N 95%
40 units 26,000ft2/acre
G/N 90%
50 units 31,250 ft2/acre
G/N 87.5%
60 units 36,000ft2/acre
G/N 85%
70 units 40,250ft2/acre
G/N 82.5% Sales
Value psf Residual
Land Value per acre
Build - £120psf Build - £130psf Build - £140psf Build - £150psf Build - £160psf Build - £170psf
£275 psf 804764 799571 456504 62193 -462256 -1130342 £300 psf 1050044 1149221 866524 541256 73784 -548327 £325 psf 1295464 1498871 1276544 1020318 610184 33285 £350 psf 1540744 1848311 1686564 1499693 1146224 615300 £375 psf 1786024 2197961 2096584 1978756 1682624 1197315 £400 psf 2031444 2547611 2506604 2457818 2218664 1778927 £425 psf 2276724 2897261 2916624 2936881 2755064 2360942
£450 psf 2522004 3246701 3326644 3416256 3291104 2942555 £475 psf 2767424 3596351 3736664 3895318 3827144 3524570 £500 psf 3012704 3946001 4146684 4374381 4363544 4106585 £525 psf 3257984 4295441 4556704 4853443 4899584 4688197 £550 psf 3503404 4645091 4966724 5332818 5435984 5270212 £600 psf 3993964 5344181 5787024 6290943 6508424 6433840 £650 psf 4484664 6043481 6607064 7249381 7580864 7597870 £700 psf 4975224 6742571 7427104 8207506 8653304 8761497 £800 psf 5956624 8140961 9067184 10124069 10797824 11089155 £900 psf 6937884 9539351 10707524 12040631 12942704 13416410
£1000 psf 7919144 10937531 12347604 13957506 15087584 15744068

LB Richmond Upon Thames Christopher Marsh & Co Ltd _____________________________________________________________________
24
Table 4A. Base Residential Land Values per acre in LB Richmond including SPG Planning Obligations (adjusted as in Table 3B ) and 40% Affordable housing at nil cost/value
Table 4A Density – Units/acre
20 Units 14000ft2/acre G/Net 100%
30 Units 21,000ft2/acre
G/N 95%
40 units 26,000ft2/acre
G/N 90%
50 units 31,250 ft2/acre
G/N 87.5%
60 units 36,000ft2/acre
G/N 85%
70 units 40,250ft2/acre
G/N 82.5% Sales
Value psf Residual
Land Value per acre
Build - £120psf Build - £130psf Build - £140psf Build - £150psf Build - £160psf Build - £170psf
£275 psf 482858 479743 273902 37316 -647158 -1582479 £300 psf 630026 689533 519914 324754 44270 -767658 £325 psf 777278 899323 765926 612191 366110 19971 £350 psf 924446 1108987 1011938 899816 687734 369180 £375 psf 1071614 1318777 1257950 1187254 1009574 718389 £400 psf 1218866 1528567 1503962 1474691 1331198 1067356 £425 psf 1366034 1738357 1749974 1762129 1653038 1416565
£450 psf 1513202 1948021 1995986 2049754 1974662 1765533 £475 psf 1660454 2157811 2241998 2337191 2296286 2114742 £500 psf 1807622 2367601 2488010 2624629 2618126 2463951 £525 psf 1954790 2577265 2734022 2912066 2939750 2812918 £550 psf 2102042 2787055 2980034 3199691 3261590 3162127 £600 psf 2396378 3206509 3472214 3774566 3905054 3860304 £650 psf 2690798 3626089 3964238 4349629 4548518 4558722 £700 psf 2985134 4045543 4456262 4924504 5191982 5256898 £800 psf 3573974 4884577 5440310 6074441 6478694 6653493 £900 psf 4162730 5723611 6424514 7224379 7765622 8049846
£1000 psf 4751486 6562519 7408562 8374504 9052550 9446441

LB Richmond Upon Thames Christopher Marsh & Co Ltd _____________________________________________________________________
25
Table 4B. Base Residential Land Values per acre in LB Richmond including SPG Planning Obligations (as adjusted in Table 3B) and 40% Affordable housing based on most likely RSL financial scenario with a 70:30% tenure split.
Table 4B Density – Units/acre
20 Units 14000ft2/acre G/Net 100%
30 Units 21,000ft2/acre
G/N 95%
40 units 26,000ft2/acre
G/N 90%
50 units 31,250 ft2/acre
G/N 87.5%
60 units 36,000ft2/acre
G/N 85%
70 units 40,250ft2/acre
G/N 82.5% Sales
Value psf Residual
Land Value per acre
Build - £120psf Build - £130psf Build - £140psf Build - £150psf Build - £160psf Build - £170psf
£275 psf 798858 953743 905902 827316 300842 -476479 £300 psf 966026 1193533 1191914 1164754 1052270 408432 £325 psf 1133278 1433323 1477926 1502191 1434110 1265971 £350 psf 1300446 1484987 1763938 1839816 1815734 1685180 £375 psf 1471614 1918777 2057950 2187254 2209574 2118389 £400 psf 1639666 1949367 2345562 2526691 2593598 2540156 £425 psf 1801234 2391157 2620374 2850129 2958638 2939765
£450 psf 1962802 2622421 2895186 3173754 3323462 3339133 £475 psf 2125254 2855011 3171598 3499191 3690686 3741542 £500 psf 2287622 3087601 3448010 3824629 4058126 4143951 £525 psf 2450790 3321265 3726022 4152066 4427750 4548918 £550 psf 2614042 3555055 4004034 4479691 4797590 4954127 £600 psf 2941178 4023709 4561814 5136566 5539454 5767104 £650 psf 3262798 4484089 5108238 5779629 6264518 6560722 £700 psf 3585134 4945543 5656262 6424504 6991982 7356898 £800 psf 4236374 5878177 6765110 7730441 8465894 8971893 £900 psf 4882730 6803611 7864514 9024379 9925622 10569846
£1000 psf 5539486 7744519 8984562 10344504 11416550 12204441

LB Richmond Upon Thames Christopher Marsh & Co Ltd _____________________________________________________________________
26
Table 5A. Base Residential Land Values per acre in LB Richmond including SPG Planning Obligations (adjusted) and 50% Affordable housing (70:30% split ) at nil cost/value
Table 5A Density – Units/acre
20 Units 14000ft2/acre G/Net 100%
30 Units 21,000ft2/acre
G/N 95%
40 units 26,000ft2/acre
G/N 90%
50 units 31,250 ft2/acre
G/N 87.5%
60 units 36,000ft2/acre
G/N 85%
70 units 40,250ft2/acre
G/N 82.5% Sales
Value psf Residual
Land Value per acre
Build - £120psf Build - £130psf Build - £140psf Build - £150psf Build - £160psf Build - £170psf
£275 psf 402382 399785 228252 31096 -693384 -1695513 £300 psf 525022 574610 433262 270628 36892 -822490 £325 psf 647732 749435 638272 510159 305092 16642 £350 psf 770372 924155 843282 749846 573112 307650 £375 psf 893012 1098980 1048292 989378 841312 598657 £400 psf 1015722 1273805 1253302 1228909 1109332 889463 £425 psf 1138362 1448630 1458312 1468440 1377532 1180471
£450 psf 1261002 1623350 1663322 1708128 1645552 1471277 £475 psf 1383712 1798175 1868332 1947659 1913572 1762285 £500 psf 1506352 1973000 2073342 2187190 2181772 2053292 £525 psf 1628992 2147720 2278352 2426721 2449792 2344098 £550 psf 1751702 2322545 2483362 2666409 2717992 2635106 £600 psf 1996982 2672090 2893512 3145471 3254212 3216920 £650 psf 2242332 3021740 3303532 3624690 3790432 3798935 £700 psf 2487612 3371285 3713552 4103753 4326652 4380748 £800 psf 2978312 4070480 4533592 5062034 5398912 5544577 £900 psf 3468942 4769675 5353762 6020315 6471352 6708205
£1000 psf 3959572 5468765 6173802 6978753 7543792 7872034

LB Richmond Upon Thames Christopher Marsh & Co Ltd _____________________________________________________________________
27
Table 5B. Base Residential Land Values per acre in LB Richmond including SPG Planning Obligations (adjusted) and 50% Affordable housing (70:30% split) at most likely RSL financial scenario.
Table 5B Density – Units/acre
20 Units 14000ft2/acre G/Net 100%
30 Units 21,000ft2/acre
G/N 95%
40 units 26,000ft2/acre
G/N 90%
50 units 31,250 ft2/acre
G/N 87.5%
60 units 36,000ft2/acre
G/N 85%
70 units 40,250ft2/acre
G/N 82.5% Sales
Value psf Residual
Land Value per acre
Build - £120psf Build - £130psf Build - £140psf Build - £150psf Build - £160psf Build - £170psf
£275 psf 797382 992285 1018252 1018596 491616 -313013 £300 psf 945022 1204610 1273262 1320628 1296892 647510 £325 psf 1092732 1416935 1528272 1622659 1640092 1574142 £350 psf 1240372 1629155 1783282 1924846 1983112 1952650 £375 psf 1393012 1848980 2048292 2239378 2341312 2243657 £400 psf 1541722 2062805 2305302 2543909 2687332 2730463 £425 psf 1682362 2264630 2546312 2828440 3009532 3084471
£450 psf 1823002 2466350 2787322 3113128 3331552 3438277 £475 psf 1964712 2669675 3030332 3400159 3656572 3795785 £500 psf 2106352 2873000 3273342 3687190 3981772 4153292 £525 psf 2248892 3077720 3518352 3976721 4309792 4514098 £550 psf 2391702 3282545 3763362 4266409 4637992 4875106 £600 psf 2677982 3693590 4255512 4847971 5297212 5600420 £650 psf 2957332 4094240 4733532 5412190 5935432 6301435 £700 psf 3237612 4496285 5213552 5978753 6576652 7005748 £800 psf 3806312 5312480 6189592 7132034 7882912 8442577 £900 psf 4368942 6119675 7153762 8270315 9171352 9858205
£1000 psf 4944572 6946265 8143802 9441253 10498792 11319534

LB Richmond Upon Thames Christopher Marsh & Co Ltd _____________________________________________________________________
28
Table 5C. Base Residential Land Values per acre in LB Richmond including SPG Planning Obligations (adjusted) and 50% Affordable housing (80:20% split) at most likely RSL financial scenario.
Table 5C Density – Units/acre
20 Units 14000ft2/acre G/Net 100%
30 Units 21,000ft2/acre
G/N 95%
40 units 26,000ft2/acre
G/N 90%
50 units 31,250 ft2/acre
G/N 87.5%
60 units 36,000ft2/acre
G/N 85%
70 units 40,250ft2/acre
G/N 82.5% Sales
Value psf Residual
Land Value per acre
Build - £120psf Build - £130psf Build - £140psf Build - £150psf Build - £160psf Build - £170psf
£275 psf 767382 947285 958252 943596 401616 -418013 £300 psf 910022 1152110 1203262 1233128 1191892 525010 £325 psf 1042732 1144435 1428272 1497659 1490092 1399142 £350 psf 1175372 1531655 1653282 1762346 1788112 1725150 £375 psf 1310012 1724480 1882292 2031878 2056312 2058157 £400 psf 1442722 1914305 2107302 2296409 2390332 2383963 £425 psf 1588362 2123630 2358312 2593440 2727532 2755471
£450 psf 1711002 2328350 2603322 2883128 3055552 3116277 £475 psf 1873712 2533175 2848332 3172659 3383572 3477285 £500 psf 2016352 2738000 3093342 3462190 3711772 3838292 £525 psf 2160992 2945720 3342352 3756721 4045792 4206098 £550 psf 2303702 3150545 3587362 4046409 4373992 4567106 £600 psf 2591982 3564590 4083512 4632971 5039212 5299420 £650 psf 2862332 3951740 4543532 5174690 5650432 5968935 £700 psf 3127612 4331285 4993552 5653753 6246652 6620748 £800 psf 3666312 5102480 5909592 6782034 7462912 7952577 £900 psf 4198942 5864675 6813762 7845315 8661352 9263205
£1000 psf 4734572 6631265 7723802 8916253 9868792 10584534

LB Richmond Upon Thames Christopher Marsh & Co Ltd _____________________________________________________________________
29
Table 6A. Base Residential Land Values per hectare in LB Richmond including SPG Planning Obligations (as adjusted in Table 3B) and 40% Affordable housing based on most likely RSL financial scenario with a 70:30% tenure split.
Table 6A Density – Units/hect
48 Units 3360 m2/hect G/Net 100%
72 Units 5040 m2/hect
G/N 95%
96 units 6760 m2/Hect
G/N 90%
120 units 8400 m2/hect G/N 87.5%
144 units 1080 m2/hect
G/N 85%
168 units 11760 m2/hect
G/N 82.5% Sales Value psm
Residual Land Value per hectare
Build - £1291 psm
Build - £1399 psm
Build - £1506 psm
Build - £1614 psm
Build - £1722 psm
Build - £1829 psm
2970 psm 1973179 2355745 2237577 2043470 743079 -1176903 3240 psm 2386084 2948026 2944027 2876942 2599106 1008827 3510 psm 2799196 3540307 3650477 3710411 3542251 3126948 3780 psm 3212101 3667917 4356926 4544345 4484863 4162394 4050 psm 3634886 4739379 5083136 5402517 5457647 5232420 4320 psm 4049975 4814936 5793538 6240926 6406187 6274185 4573 psm 4449048 5906157 6472323 7039818 7307835 7261219 4842 psm 4848120 6477379 7151109 7839172 8208951 8247658 5111 psm 5249377 7051877 7833847 8643001 9115994 9241608 5380 psm 5650426 7626374 8516584 9446833 10023571 10235559 5649 psm 6053451 8203524 9203274 10255603 10936543 11235827 5918 psm 6456683 8780985 9889964 11064837 11850047 12236694 6456 psm 7264709 9938561 11267681 12687318 13682451 14244747 6994 psm 8059111 11075700 12617348 14275684 15473359 16204983 7532 psm 8855281 12215491 13970967 15868525 17270196 18171538 8640 psm 10463844 14519097 16709822 19094189 20910758 22160576 9720 psm 12060343 16804919 19425350 22290216 24516286 26107520 10800 psm
13682530 19128962 22191868 25550925 28198879 30144969

LB Richmond Upon Thames Christopher Marsh & Co Ltd _____________________________________________________________________
30
Table 6B. Base Residential Land Values per hectare in LB Richmond including SPG Planning Obligations (as adjusted in Table 3B) and 50% Affordable housing based on most likely RSL financial scenario with a 70:30% tenure split.
Table 6B Density – Units/hect
48 Units 3360 m2/hect G/Net 100%
72 Units 5040 m2/hect
G/N 95%
96 units 6760 m2/Hect
G/N 90%
120 units 8400 m2/hect G/N 87.5%
144 units 1080 m2/hect
G/N 85%
168 units 11760 m2/hect
G/N 82.5% Sales Value psm
Residual Land Value per hectare
Build - £1291 psm
Build - £1399 psm
Build - £1506 psm
Build - £1614 psm
Build - £1722 psm
Build - £1829 psm
2970 psm 1969533 2450944 2515082 2515932 1214291 -773142 3240 psm 2334204 2975386 3144957 3261951 3203323 1599349 3510 psm 2699048 3499829 3774831 4007967 4051027 3888130 3780 psm 3063718 4024012 4404706 4754369 4898286 4823045 4050 psm 3440739 4566980 5059281 5531263 5783040 5541832 4320 psm 3808053 5095128 5694095 6283455 6637710 6744243 4573 psm 4155434 5593636 6289390 6986246 7433544 7618643 4842 psm 4502814 6091884 6884685 7689426 8228933 8492544 5111 psm 4852838 6594097 7484920 8398392 9031732 9375589 5380 psm 5202689 7096310 8085154 9107359 9834976 10258631 5649 psm 5554763 7601968 8690329 9822500 10645186 11149822 5918 psm 5907503 8107886 9295504 10538030 11455840 12041512 6456 psm 6614615 9123167 10511115 11974488 13084114 13833037 6994 psm 7304610 10112773 11691824 13368109 14660517 15564544 7532 psm 7996901 11105824 12877473 14767520 16244330 17304198 8640 psm 9401590 13121826 15288292 17616124 19470793 20853165 9720 psm 10791287 15115597 17669792 20427678 22653239 24349766 10800 psm
12213093 17157275 20115191 23319895 25932016 27959249

LB Richmond Upon Thames Christopher Marsh & Co Ltd _____________________________________________________________________
31
Table 6C. Base Residential Land Values per hectare in LB Richmond including SPG Planning Obligations (as adjusted in Table 3B) and 50% Affordable housing based on most likely RSL financial scenario with a 80:20% tenure split.
Table 6C Density – Units/hect
48 Units 3360 m2/hect G/Net 100%
72 Units 5040 m2/hect
G/N 95%
96 units 6760 m2/Hect
G/N 90%
120 units 8400 m2/hect G/N 87.5%
144 units 1080 m2/hect
G/N 85%
168 units 11760 m2/hect
G/N 82.5% Sales Value psm
Residual Land Value per hectare
Build - £1291 psm
Build - £1399 psm
Build - £1506 Psm
Build - £1614 psm
Build - £1722 psm
Build - £1829 psm
2970 psm 1895433 2339794 2366882 2330682 991991 -1032492 3240 psm 2247754 2845711 2972057 3045826 2943973 1296774 3510 psm 2575548 2826754 3527831 3699217 3680527 3455880 3780 psm 2903168 3783187 4083606 4352994 4416636 4261120 4050 psm 3235729 4259465 4649261 5018738 5079090 5083647 4320 psm 3563523 4728333 5205035 5672130 5904120 5888388 4573 psm 3923254 5245366 5825030 6405796 6737004 6806013 4842 psm 4226174 5751024 6430205 7121326 7547213 7697204 5111 psm 4628068 6256942 7035380 7836467 8357422 8588894 5380 psm 4980389 6762860 7640554 8551609 9168076 9480581 5649 psm 5337650 7275928 8255609 9279100 9993106 10389062 5918 psm 5690143 7781846 8860784 9994630 10803760 11280752 6456 psm 6402195 8804537 10086275 11443438 12446854 13089567 6994 psm 7069960 9760797 11222524 12781484 13956567 14743269 7532 psm 7725201 10698274 12334073 13964770 15429230 16353248 8640 psm 9055790 12603126 14596692 16751624 18433393 19642865 9720 psm 10371387 14485747 16829992 19377928 21393539 22880116 10800 psm
11694393 16379225 19077791 22023145 24375916 26143799

LB Richmond Upon Thames Christopher Marsh & Co Ltd
32
5.0 Results 5.1 This section needs to be read in conjunction with the Tabular / Graphical
presentation above, which contains the product of 1296 residual valuations in which land values are calculated on a per square foot basis and then applied via different densities of development to a land value per acre, in order to facilitate comparisons with employment land / floorspace data which still tends to be in imperial. (Series 6 of the Tables then converts the key results into metric). The Tables show Base Residential Land Values resulting from a requirement for a package of Planning Obligations as summarised on page 12 per residential unit, 40% affordable housing (Series 4) and 50% affordable housing (Series 5). Nil cost/value affordable housing is presented as a benchmark (Tables 4A and 5A) and compares with the most realistic RSL scenarios (Tables 4B and 5B) based on a 70-30% tenure split. Table 5C plots the effect of 50% affordable housing with an 80-20% split. Series 6 converts the key outputs into metric.
Six density scenarios with applicable variables are plotted, as follows:
• A = 48 units; 3,360m2/hec; G/Net 100%; Build £1,291 psm; • B = 72 units; 5,040m2/hec; G/Net 95%; Build £1,399 psm • C = 96 units; 6,760 m2/hec; G/N 90%; Build - £1,506 psm • D = 120 units; 8,400m2/hec; G/Net 87.5%; Build £1,614 psm • E = 144 units; 10,080m2/hec; G/Net 85%; Build £1,722 psm • F = 168 units; 11,760m2/hec; G/Net 82.5%; Build £1,829 psm
The Tables demonstrate that the traditional Planning Obligations / Affordable Housing ‘rule of thumb’ largely holds true; namely that once open market sales values exceed £4320psm (£400psf), policy targets are increasingly deliverable in principle, albeit subject to grant availability and none of the negative impacts listed above. As indicated, the typical residential sales value range exceeds £4320psm and therefore, in most circumstances, the affordable housing policy and planning obligation requirement will be deliverable. There are two important caveats; a) That Residual land values exceed Existing Use Value. This is shown in the
Tables by the colour shaded cells reflecting the values explained in para.4.5.2 where green cells identify those scenarios failing to exceed £2.4m per hectare, yellow cells those failing to exceed £4.8m per hectare and light yellow cells those failing to exceed £7.2m per hectare, although there will be site specific circumstances where these thresholds are higher or lower. As indicated, while a higher existing use value requires a commensurate higher residential sales value, in many circumstances, this will still be viable although lower density schemes are more vulnerable to existing use value requirements.
b) That any exceptional costs such as decontamination are not excessive. 5.2 Small Sites. Since local RSLs are often unwilling to take on groups of less than
four units, the modelling exercise above was not relevant. Instead, the issue of commuted sums re-emerges. While commuted sums have been rare in many
LB Richmond Upon Thames Christopher Marsh & Co Ltd
33
Boroughs in recent years, LBRuT does have a formula, namely ‘the value on the open market of units of the same size and in the same location, less any Social Housing Grant granted to the scheme, applied in such a way that a similar ratio of market: affordable units would be achieved as if they were provided on site. Total Cost Indicators have in the past been used as a proxy for social housing grant’. While TCIs have been superceded, they can nevertheless, suitably updated from their last calculation in late 2003 (for the 2004-06 round) by applying the BCIS index, form the basis of a practical approach. The formula’s dependence on open market value clearly means that no single sum can be laid down as a blanket policy. Indeed, such is the variation in residential market values across the Borough, that utilising commuted sums in lower value areas may be worth consideration.
6.0 Conclusions 6.1 The London Borough of Richmond upon Thames has an acute problem of
affordable housing. Affordable housing policy requirements are clearly based on need proven through a reasonably up-to-date Housing Needs Survey. Its requirements for the provision of social and community infrastructure via planning obligations are equally clear although it should be stressed while we initially ran the viability numbers on the basis of the aspirations in the Planning Obligations Strategy 2005, the reality has been rather less and we have re-run all the viability numbers as a result. Ironically, this has a positive effect on affordable housing expectations. This report has examined, in terms of financial viability, the potential to increase affordable housing provision by either reducing thresholds and/or increasing targets, while maintaining a revised but higher level of planning obligation contributions. We also gave particular consideration to the impact of existing use values on redevelopment proposals with specific reference to the retention of employment land. As such, we have considered a range of existing use values and their differential effects on delivering redevelopment proposals with their required levels of obligations and affordable housing. This is a complex set of variables and has now been completed for the second time, with varying affordable housing requirements.
6.2 Our key conclusions are that;
a) Within the residential sales value bands which predominate in the Borough and thus high residual land values, there is scope for 40% affordable housing almost across the Borough (and in many circumstances, 50% with, where necessary some level of cross subsidy provided by the developer) and in addition, the £12-15,000 package of planning obligations required (see page 12/13), without viability being compromised. Where exceptional costs arise, site factors may override this conclusion to some degree and this should not be underestimated.

LB Richmond Upon Thames Christopher Marsh & Co Ltd
34
a) While we accept that smaller sites do incur somewhat higher costs than larger sites pro rata, it is our view that there is sufficient capacity in the base appraisals for development proposals to carry these costs in general. This does of course assume that;
i) Preferred RSLs are prepared to accept small numbers of / individual
affordable housing units which does not appear to be the case; ii) Service charges (in mixed tenure schemes) can be restricted to ensure
affordability; and, iii) The land value market adjusts accordingly.
The reticent stance of local RSLs regarding small schemes does raise the issue of commuted payments which had of course until relatively recently almost disappeared. This is a problem and depends entirely on whether the ‘off-site’ land is available and in particular at what price. Thus LB Greenwich for instance have recently concluded an arrangement in which significant numbers of off site family units are provided on and in addition to the partial redevelopment of an existing council estate, a relatively cost efficient option. In contrast, if the applicant has to buy in the ‘off-site’ at existing use value (plus perhaps hope value), then the ability to deliver affordable housing will be very restricted. We have taken account of this possibility in our diagrammatic conclusions. Commuted sums based on an updated version of the current formula are certainly practical and given the wide range of residential values could be a relatively efficient approach.
b) We are not of the view that an area-based policy differentiating affordable housing provision is a practical proposition for the following reasons;
i) The overall level of new build is relatively low and then includes a
range of values not only reflecting local market variations but also, the type and specification of units proposed. The value range across the Borough is quite wide but nevertheless, we remain of the view that any assumptions about outturn values on a local area base would be very susceptible to challenge and would require constant monitoring and review and thus be disruptive, uncertain and possibly counter-productive.
ii) The potential variables on any such assumption about values and costs – identified throughout this report – have the capacity to undermine any standard approach not only at an area level, but also at a Borough wide level. Such possibilities are specifically recognised for example, in the GLA’s SPG on Affordable Housing (Section 7), where in effect, there is a recognition that financial circumstances may well arise which require a review of affordable housing requirements in individual cases. There is nothing in this analysis that suggests that the Council’s circumstances are markedly different.
d) Density is another key variable as demonstrated in this analysis and in the
interests of accuracy and applicability, it is important that the Council adopt an approach to residential density based either on habitable rooms/ hectare

LB Richmond Upon Thames Christopher Marsh & Co Ltd
35
or floor space / hectare, or a combination of one of these measures with units / hectare.
e) Existing use value / alternate use value is an increasing concern. This exercise
demonstrates that in lower value parts of the Borough, higher demands for affordable housing are likely to conflict with EUV/AUV. Indeed, in a market where the gap between residential values and commercial values has narrowed a little, the possibility of developers changing the proportions of mixed use proposals becomes more of an issue. It is important to stress that where Existing Use Value comparisons arise, a full RICS ‘Red Book’ valuation should be required to substantiate such comparisons. A letter from a local estate agent will not suffice.
f) While this Viability exercise provides benchmarks, they clearly must be
treated with caution and certainly do not imply a fixed position on the part of the Council. Indeed, site specific financial evaluations will continue to be necessary, a point emphasised in Circular 05/05, where the role of the Independent Assessor is recognised specifically.
6.3 Overall, the product of the Council’s review must be a strongly worded
affordable housing and Planning Obligations policy base which effectively redefines the nature of the local land market. Policies must acknowledge that exceptional circumstances may arise but that the authority will require a detailed and robust financial statement to demonstrate conclusively why planning policies cannot be met. Even then, there should be no presumption that such circumstances will be accepted. With regard to employment land, it is clear that if B1 office rents and yields improve, there will be an increasing conflict especially in mixed use schemes to adjust the commercial / residential mix to minimise affordable housing content. In contrast, where low value commercial space is the subject of redevelopment proposals, there is less likelihood of a viability conflict. Having said that, it should again be stressed that such conclusions assume ‘clean’ site circumstances. Genuine ‘exceptional costs’ will change outputs.

LB Richmond Upon Thames Christopher Marsh & Co Ltd
36
APPENDIX 1
EMPLOYMENT LAND REVIEW

LB Richmond Upon Thames Christopher Marsh & Co Ltd
37
APPENDIX ONE
Employment Land Methodology
At a meeting on 26th February 2007, the parameters for research into financial viability of employment sites involving affordable housing were discussed and it was agreed that the criterion for the study would involved 10 areas: Barnes; East Sheen; Mortlake; Richmond; Ham/ Petersham; Twickenham; Whitton/ Heathfield; Teddington; Hampton; and Hampton Wick Within those areas it was agreed to research sites that are in sectors in: 1 sites in mixed use/town centre areas 2 sites further away from central areas 3 sites with good access/approaches (e.g. Lower Richmond Rd) 4 sites with relatively poor access/approaches (e.g. Colne Rd., West Twickenham) 5 sites of different sizes 6 sites with premises of differing age/condition Existing Land Use In existing land use, the sub-sectors include: i B1 - offices ii B1(b) - research, laboratories, studios iii B1(c) – light industry iv Car parking area v Petrol filling station vi Industrial uses/workshops/workshops ancillary to garages/filling stations vii Builder’s yard, open storage (from small yards to timber yards) viii Warehousing, closed storage
This data was captured on-line obtained from local commercial estate agents and other data providers, including:
EGPropertyLink; Snellers; South London Business; Martin Campbell; Michael Rogers; Gateway; Offices Please; Knight Frank; and EGi.
No retail data was to be captured. Proposed Land Uses Proposed land uses, that is sites with planning permission, were analysed from planning data received from the London Borough of Richmond upon Thames (LBRUT). This was used to provide information on sites within the 10 areas as noted above. At the inception meeting the proposed land uses to be identified were: Industrial uses/workshops; Builder’s yard, open storage + enabling uses; Warehousing, closed storage (traditional self-store); Offices – B1; B1(b) – research,

LB Richmond Upon Thames Christopher Marsh & Co Ltd
38
laboratories, studios; B1(c) – light industry; (D1 – especially health-related uses, children’s nurseries; D2 – sports facilities, gym. The original data, received in Excel format, could not be analysed by town as presented as headings and text were shown throughout the dataset producing 3,201 lines of information for data on 699 planning permissions. Excel cannot produce information and analysis on numbers within a dataset where text is included. This dataset also includes towns and areas which are not reflected in the study Therefore the data had to go through a long process of adjustment to make changes and improvements in order to gain information and data on residential and non-residential developments in the immediate pipeline. The non-residential land use data (i.e. employment use sites) was calculated on the major land use, if the scheme fell into a mixed use development. A lot of retail data was presented, but in line with the LBRUT’s instruction, was not shown. Moreover, it was not possible to differentiate the residential types as this was only presented as C3 and not split into private, affordable, shared-ownership or live-work. Whilst it is appreciated that these all fall within the same planning use type, to make analysis of the types of housing, data has to be divided to show results.

LB Richmond Upon Thames Christopher Marsh & Co Ltd
39
Employment Sites Research – Existing Land Use
In researching the number of existing employment land use sites available in the area, a total of 142 sites were identified falling within the use type sub-sector as explained in the methodology. It was noted whilst exploring agents and data provider’s websites that a lot of “A” use type was available (ie. Retail), but has not been shown in line with LBRUT’s criterion. Highest values were found, unsurprisingly in the Richmond area. Richmond benefits from good transport links in most categories, i.e. tube, fast rail links; roads and large, major bus network. The site with the highest rent was in an area deemed to be with good access and approaches. The site in question is on the A316, Lower Mortlake Road, and giving good road links to London to the east and the M3 to the west. There is good bus transport links from Richmond station and close to North Sheen station, but is in an out of town area, although there are some local facilities close by. Lowest values were shown from data received regarding Teddington, as low as £7psf on average on sites identified as central areas. Teddington in transport terms is not as accessible as Richmond. It is on a slow train line, no tube and a lower provision of bus services. The most warehousing and B8 use was found to be located in Hampton on non-central sites. The majority of these sites were located on business parks close to the A308, Upper Sunbury Road, and giving good access to Junction 1 of the M3, and the A316, major road into central London. The Table below is a summary of the number of sites available with Sector and sub-sector use type. All data obtained can be provided if required.

Available Employment Land Research 40
Table : Summary of Existing Land Use Availability Town
Class Sub-class East Sheen Hampton Hampton Wick Mortlake Richmond Teddington Twickenham Grand Total
B1 – offices (i) 2 (Avg £17) 11 (Avg £24) 4 (Avg £27) 1 (Avg £19.50) 11 (Avg £24) 4 (Avg 7) 7 (Avg £17) 40
B1(c) – light industry (iii) 3 (Avg3 £12) 3 (Avg £9) 6 Industrial
uses/workshops/workshops ancillary to garages/filling
stations (vi)
1 (Avg £6) 1 1. sites in mixed use/town centre areas
Warehousing, closed storage (viii) 1 (Avg £18) 1
Total 2 16 4 1 11 7 7 48
B1 – offices (i) 1 (Avg £26) 2 (Avg £23) 11 Avg (£30) 1 4 (Avg £20) 19
B1(c) – light industry (iii) 2 (Avg£12) 2 Industrial
uses/workshops/workshops ancillary to garages/filling
stations (vi)
1 (Avg £13) 1 2. sites further away from central areas
Warehousing, closed storage (vii) 33 (Avg £12) 33
Total 1 35 14 1 4 56 3. sites with good access/approaches (e.g. Lower Richmond Rd)
B1 – offices (i) 4 Avg (£50) 4
Total 4 4 4. sites with relatively poor access/approaches (e.g. Colne Rd., West Twickenham)
B1 – offices (i) 4 (Avg £26) 4
Total 4 4
B1 – offices (i) 1 (Avg £17) 3 (Avg £20) 2 (Avg £23) 1 8 (Avg £22) 4 (Avg £18) 12 (Avg £18) 31 5. sites of different sizes B1(c) – light industry (iii) 1 (Avg £13.50) 1
Total 1 3 2 1 8 5 12 32
Grand Total 4 54 6 2 41 12 23 142
Note: Those highlighted are assumed averages

Appendix 2 41
Employment Sites Research – Proposed Land Use
Summary of Proposed Land Use
Summary of Planning Permissions by Town Supplied by LBRUT
Town
No of Permissions (including any dupes/differing
proposals)
Number of Proposed
Residential
All proposed non-residential (Sq m)1
Barnes 47 98 6,553 East Sheen 45 223 1,137 Mortlake 5 2 64,622 Richmond 118 320 48,091 Ham/Petersham 18 66 420 Twickenham 186 755 53,716 Whitton/Heathfield 24 74 2,488 Teddington 110 906 13,692 Hampton 70 186 19,218 Hampton Wick 31 184 1,040
1 The non-residential use sizing is based on the major with other use type calculated in, where applicable.

Appendix 2 41
APPENDIX TWO
GRAPHICAL RESULTS

Appendix 2 41
Figure 6A: Base Residential Values per hectare in LB Richmond (SPG Planning Obligations as adjusted in Table 3B and 40% affordable housing based on most likely RSL financial scenario with
a 70:30% tenure split)
-£5,000,000
£0
£5,000,000
£10,000,000
£15,000,000
£20,000,000
£25,000,000
£30,000,000
£35,000,000
£2,9
70
£3,2
40
£3,5
10
£3,7
80
£4,0
50
£4,3
20
£4,5
73
£4,8
42
£5,1
11
£5,3
80
£5,6
49
£5,9
18
£6,4
56
£6,9
94
£7,5
32
£8,6
40
£9,7
20
£10,
800
Sales Value psm
Bas
e R
esid
entia
l Val
ues
per h
ecta
re
EUV1 EUV2 EUV3 Unviable and negative value A B C D E F
Typical sales values in LB RichmondTypical sales values in LB Richmond

Appendix 2 41
Figure 6B: Base Residential Values per hectare in LB Richmond (SPG Planning Obligations as adjusted in Table 3B and 50% affordable housing based on most likely RSL financial scenario with
a 70:30% tenure split)
-£5,000,000
£0
£5,000,000
£10,000,000
£15,000,000
£20,000,000
£25,000,000
£30,000,000
£2,9
70
£3,2
40
£3,5
10
£3,7
80
£4,0
50
£4,3
20
£4,5
73
£4,8
42
£5,1
11
£5,3
80
£5,6
49
£5,9
18
£6,4
56
£6,9
94
£7,5
32
£8,6
40
£9,7
20
£10,
800
Sales Value psm
Bas
e R
esid
entia
l Val
ues
per h
ecta
re
EUV1 EUV2 EUV1 Unviable and negative value A B C D E F
Typical sales values in LB Richmond

Appendix 2 41
Figure 6C: Base Residential Values per hectare in LB Richmond (SPG Planning Obligations as adjusted in Table 3B and 50% affordable housing based on most likely RSL financial scenario with
a 80:20% tenure split)
-£5,000,000
£0
£5,000,000
£10,000,000
£15,000,000
£20,000,000
£25,000,000
£30,000,000
£2,9
70
£3,2
40
£3,5
10
£3,7
80
£4,0
50
£4,3
20
£4,5
73
£4,8
42
£5,1
11
£5,3
80
£5,6
49
£5,9
18
£6,4
56
£6,9
94
£7,5
32
£8,6
40
£9,7
20
£10,
800
Sales Value psm
Bas
e R
esid
entia
l Val
ues
per h
ecta
re
Unviable and negative value EUV1 EUV2 EUV3 A B C D E F
Typical sales values in LB Richmond

Appendix 2 41
NB. FURTHER APPENDICES TO BE ADDED