Financial Systems, Industrial Relations and, Industry ... Paper No. 97 Financial Systems, Industrial...
27
Working Paper No. 97 Financial Systems, Industrial Relations and, Industry Specialisation An econometric analysis of institutional complementarities by Ekkehard Ernst University of Bielefeld Department of Economics Center for Empirical Macroeconomics P.O. Box 100 131 33501 Bielefeld, Germany (http://www.wiwi.uni-bielefeld.de/∼cem)
Transcript of Financial Systems, Industrial Relations and, Industry ... Paper No. 97 Financial Systems, Industrial...

Working Paper No. 97
Financial Systems, Industrial Relations and,
Industry Specialisation
An econometric analysis of institutional complementarities
by
Ekkehard Ernst
University of BielefeldDepartment of EconomicsCenter for Empirical MacroeconomicsP.O. Box 100 131
33501 Bielefeld, Germany
(http://www.wiwi.uni-bielefeld.de/∼cem)

F I N A N C I A L S Y S T E M S ,
I N D U S T R I A L R E L A T I O N S , A N D I N D U S T R Y S P E C I A L I S A T I O N
A N E C O N O M E T R I C A N A L Y S I S O F
I N S T I T U T I O N A L C O M P L E M E N T A R I T I E S
E K K E H A R D E R N S T 1
O E C D
W I N T E R 2 0 0 4 - 2 0 0 5
Abstract Asymmetric information problems on the labour and the financial market reduce private incentives to undertake activities necessary to attain the socially optimal rate of growth when the rate of innovation is endogenous. Institutional and contractual arrangements on both markets may help to correctly evaluate the long-term prospects of innovations, to protect the investment in specific assets and consequently lead to increased investment in R&D. When a particular type of innovation in a particular industry suffers from a particular type of informational and coordination problems, various institutional environments will lead to a different industrial specialization. Using various measures of financial and labour market characteristics in 19 OECD countries, interaction terms are constructed to measure the impact of these characteristics - and their combinations - on industrial activity and industrial portfolio selection. A systematic relation between certain institutional combinations and the type of industry that prospers in a particular country can be found.
Keywords: Industrial Specialisation, Institutional Complementarities, Financial Systems, Industrial Relations JEL-Classification: E23, G34, J51, O11
1 OECD, 2, Rue André Pascal, 75775 Paris Cedex 16, France; e-mail: [email protected]. Many thanks to Andrea
Bassanini, Sam Bowles, Robert Boyer and Thierry Debrand and participants of the Workshop on the Transformation of the European Financial System at the Austrian Central Bank, Summer 2003, and of the Workshop for Behavioral and Institutional Economics at Santa Fe Institute, Summer 2001, for helpful comments. The usual caveats apply. In particular, the views expressed in this paper are those of the author and do not necessarily reflect those of the OECD.

1
1. Introduction
Cross-country differences in policies and institutions on labour and financial markets are increasingly recognized as important drivers behind countries’ performance divergence. In this regard, recent empirical studies have revealed the vast differences that exist among apparently similar countries with respect to their financial systems and the way their industrial relations are organized. Despite comparable growth rates and GDP levels, even among the highly developed countries of Western Europe and North America, finance for industry is provided through different channels (Demirgüç-Kunt and Levine, 2001) while labour relations may be subject to numerous legal, institutional and customary constraints (Freeman, 2000).
Economists have therefore started to look into the functioning of particular markets and their interaction with growth rates, following earlier research on endogenous growth. Financial intermediaries may help to overcome agency costs when the quality of a research project is not fully known to the market (King and Levine, 1993). By incurring monitoring cost, the specialized financial operator can detect the true type of the project and thus make it marketable. The better the financial system is developed, the lower will be the monitoring cost to discover the true value and hence the higher will be the growth rate of the economy. Financial intermediaries may also help to reduce inefficient signalling occurring under the pressure of takeovers (Stein, 1988). Overall, studies in this field – while not conclusive as regards the particular source of finance – seem to converge to the fact that the degree of development of financial markets matters for good economic outcomes (Demirgüç-Kunt and Levine, 2001).
Similarly, on the labour market institutional arrangements affect the labour transaction in two important ways. First, they impact on the incentives of firms and workers to undertake specific investment that increases innovative activities and human capital. On-the-job-training, job related capital investments, high effort and cooperation all can be seen as specific investment potentially important to guarantee successful innovation and hence superior firm performance on the market with important aggregate effects on productivity and output growth. Second, labour market institutions may distort the relative price structure on the market for heterogeneous work and different jobs. Reducing inter-industry wage differentials will reduce rent sharing and labour turnover, while reducing inter-plant wage differentials will affect returns to schooling. This will impact on the allocation of talents and educational investment of market participants. Again, to the extent that the composition of the work force affects the innovation process, firms will have differential capacity to generate technical progress and hence output and productivity growth.
However, overall, work on the interaction between industrial relations and economic performance seems to lead to rather weak conclusions only (Fitoussi and Passet, 2000). The most important effects can be detected regarding the effect of labour market institutions on income distribution and wage inequality (Freeman, 2000), while their impact on employment levels seems to depend on the overall system of institutions and policies prevalent in a country. Regarding the importance of labour market institutions for innovation, important systemic influences can nevertheless be detected (Bassanini and Ernst, 2002).
In order to analyse the variety of these labour and financial relations, most of the theoretical and empirical literature to date has concentrated, however, on a separate analysis of policies, institutions and regulation on either the financial or the labour market taken individually, not taking into account possible spillovers and interactions that may exist between the two markets. Part of the reason for the absence of more decisive results may hence lie with the fact that two points have not yet been integrated fully: firstly, possible interaction effects between policies and institutions on both markets may prove to be important determinants of macroeconomic outcomes while not showing up when tested individually. Secondly, aggregate indicators on macroeconomic performance may be too rough, hence sufficiently taking into account possible multiple transmission links within one country by which institutions and regulations may affect particular industries but not aggregate economic outcomes.
In particular, the first point has received increased attention by recent microeconomic research regarding the analysis of the firm (e.g. Milgrom and Robert, 1995). In particular, the value of the relationship between the firm and its employees is likely to be affected simultaneously by institutional

2
arrangements on the financial and the labour market. Closely nit financial relations, for instance, provide incentives for investors to monitor and evaluate in more detail the specific assets, which the firm disposes of. This in turn will increase the marginal effect that cooperative work relations have on worker’s incentives to undertake specific investments – such as work effort – in their current relation.
In addition, industries are characterised by different forms of informational difficulties and coordination failure due, for instance, to differences in the characteristics of the dominant technology in each industry (Breschi, Malerba and Orsenigo, 2000). In this case, a common institutional and policy environment will have different effects on different industries, hence shaping sectoral specialization patterns. For instance, technologies characterized by technological advancement with long gestation periods necessitate the cooperation of the workforce as well as patient financial investors. On the other hand, ready-to-manage technologies with considerable cash flow at an early stage and a broad scope of applications may not prove profitable in the presence of unionised industrial relations and relational finance.
The following paper aims at contributing to this literature by offering an empirical investigation of industrial specialization among OECD economies as a function of their institutional environment and the complementarity that may exists between the prevalent industrial relations and the characteristics of financial systems in these countries. A priori multiple transmission mechanisms may exists between different types of financial systems or industrial relations and industry performance, hence a wide range of indicators is offered to distinguish various types of industries based on their equity and bank finance requirements and their skilled labour demand, and to test for individual as well as for complementary interactions.
The paper is organized as follows. The next section gives an overview of the empirical literature that aims at establishing individual relationships between institutional arrangements on labour and financial markets and certain macroeconomic performance indicators. Section 3 first introduces the concept of institutional complementarity, derives its theoretical implications, presents some illustrative evidence and then develops the empirical hypotheses to be tested and then discusses the methodology applied to test these interactions. Section 4 presents the data bases used to this end while section 5 presents the regression results as well as some sensitivity analysis. A final section concludes.
2. Financial and labour market interactions
a.) Theory and illustrative evidence While the economic literature has discussed extensively the various aspects of microeconomic market failures, an important macroeconomic aspect of market imperfection – market interaction – has started only recently to attract more and more research. Market interaction arises when contractual imperfections on one market affect outcomes on others. Given that economic activity implies the exchange of goods and services on different markets if not at the same time then at least in a specific order, the individual decision making process will create interrelations between the contractual shortcomings on one market and the decision to engage in economic relations on others. Implicitly, this has been recognized since long but never fully exploited for macroeconomic analysis.
This phenomenon has first been exploited in a partial equilibrium setting by recent advancements in microeconomics. In particular, the literature on supermodular production and profit functions (e.g. Milgrom and Roberts, 1995) has started to examine the way by which a firm's factor input and production choices may be interrelated2. However, this work has focused mainly on the firm level, not addressing differences between contractual and institutional (individual versus collective contracting) arrangements. Incentive problems may not be fully solved on the firm level whenever the institutional environment constrains the contractual space from which individual actors may be able to select. Additionally, some incentive problems may not be solved on the microeconomic level due to non-
2 For instance, incentive problems involving informational problems on several markets (e.g. innovative research, and the
input of skilled labour and tight relations with financial investors) may make firms selecting a certain contract package that is joint-optimally (but not necessarily individually) to overcome these problems.

3
cooperative behaviour of individual actors, and only outside institutional (collective) arrangements allow to overcome these shortcomings.
The macroeconomic version of these market interactions therefore has to take into account not only individual contractual arrangements but also institutional constraints that limit or direct individual contractualising. Integrating both – market interactions and institutional constraints – into a common framework has led to what is usually called the theory of “Institutional Complementarities”, recognizing the spillovers that may arise from institutional arrangements on other markets.
Institutional complementarities imply that the extent to which particular institutional arrangements allow to overcome problems of asymmetric information, imperfect contracting or decision coordination may depend on the existence of particular arrangements on other markets. Most institutional arrangements only act locally – i.e. connected to a particular market or to a particular local area – while the agents' decisions are simultaneously influenced by conditions on a variety of markets. More specifically, institutional complementarities arise when two or more institutions reinforce each other in their respective contribution to make an individual agent select a specific action (usually one that is considered to be welfare enhancing). Consequently, a systemic effect prevails as the adoption of one institutional arrangement on one particular market increases or decreases the marginal benefits of adopting another institutional arrangement on another market.
In this paper, we apply this concept by analysing the impact of institutional arrangements on the incentives to build up firm-specific capital as one important way to enhance a firm's productivity and growth. Based on theoretical work by the author (Amable and Ernst, 2003), a genuine link can be constructed between these incentives and the institutional environment via the latter's impact on market characteristics. In particular, both firms and workers may have to invest in firm specific capital such as specific skills, technological effort and innovation outlays that are only valuable inside the firm-worker relation. Financial investors, on the other hand, may make an ex-ante screening and ex-post monitoring effort in order to select and control for good managerial effort. This may be important to generate investment returns as some investment projects may imply close monitoring by outside investors in order to guarantee success. All three types of commitment are specific to the relationship and enter in a complementary way in determining the returns to investment of the particular production relation.
For instance, highly complex technologies with long gestation periods necessitate the cooperation of the work force as well as patient financial investors in order to build up the necessary intangible capital (for instance specific human capital to fully exploit and evaluate the technology being used). Reducing labour turnover as well as providing a security net against easy takeover in case of (temporarily) low market value may make it necessary for stakeholders to get involved in the control and decision process of the management of a firm's tangible and intangible assets. Institutions that favour investment in specific assets are therefore particularly supportive of this type of technologies.
On the other hand, other types of technologies such as ready-to-manage technologies with considerable cash flow at an early stage may not prove profitable in the presence of monopolistic labour and financial markets. Instead, these investment projects need liquid financial and labour markets in order to attract the necessary financial and human capital and be able to reallocate resources rapidly. Investment projects where economic actors hold widely heterogeneous expectations as regards their profitability need this high liquidity in order to attract the necessary capital factors. Again, institutions that favour highly liquid markets with strong opportunities to quickly reallocate resources to different projects are supportive of this type of technologies.
Different institutional environments may therefore support different technologies. In addition, there exists a trade-off between market liquidity and incentives for specific investments such that different local equilibria may not co-exist due to market interaction. Indeed, incentives to invest in specific assets are usually negatively correlated with the outside option of both the investor and the bargaining partner. Consequently, high market liquidity may negatively influence the specific investment provided by firms, workers or financial investors, as the specific match-value decreases. Given the interaction that exists between markets, the reduced incentives for one investment type will spill over to the other market, decreasing overall investment into the firm's assets, ultimately lowering its productivity. It seems therefore, that there may exist a trade-off between efficiency gains that can be

4
achieved in very liquid markets through reallocation and specific investment that would allow for a higher firm productivity. Consequently, while more flexible, liquid markets allow for a quick reallocation of resources through increased matching, more rigid markets may provide the necessary incentives for specific investments that are related to the success of existing firms. Multiple equilibria may therefore be expected (Amable and Ernst, 2003).
This trade-off between market liquidity and incentives for specific investment maps into industrial specialisation via the particular characteristics of different technologies. Indeed, differences regarding technologies and their necessary specific investment are likely to be more important across firms in different industries than across firms within the same industry as documented, for instance, by the relative stability of business R&D in relation to value added across sectors. This may have to do with underlying characteristics of the technology predominantly used within a given industry (see, for instance, Breschi, Malerba and Orsenigo, 2000). Consequently, the institutional environment may not only exert an influence on the macroeconomic performance but may impact differently on industries, depending on whether it favours relation-specific investments or market liquidity. Hence, given the technological differences across industries, variation in the macro-level system of institutions will generate differences in the industrial portfolio a country is developing, in other words: the country's comparative technological advantages depend on its institutional environment. (Kitschelt, 1991; Soskice, 1997; Bassanini and Ernst, 2002).
Different dimensions can be used to assess characteristics of technologies, in addition to innovative outlays as measured by business R&D. For instance, different technologies may require dedicated human capital as a complementary factor in the production process. In addition, technologies may differ in the extent to which they are affected by informational, contractual and coordination problems. Finally, technologies may differ in the extent to which their commercial success may be assessable from the outset; hence, their degree of uncertainty may differ. The following table represents two important dimensions of technological characteristics and their consequences for the optimal market structure and therefore for the mix of supporting institutions:
Table 1: Technological characteristics and market outcomes Asset
specificity
Degree of uncertainty
Low High
Low
Rapid reallocation across firms in liquid markets, external risk sharing
Incentives for specific investments in vertically integrated firms on oligopolistic markets
High
Rapid reallocation across firms, risk-sharing through firm networking and diversification across markets
Incentives for specific investments, low risk-sharing opportunities
Taken together, the paper's main hypothesis is that the institutional environment shapes the comparative advantages a country exhibits not only through the individual effects institutions may have but more importantly through the systemic effect that arises due to market interaction and complementary relations. In order to test these ideas, we concentrate in the following on particular characteristics of OECD countries' financial systems and industrial relations and analyse to what extent direct and complementary effects on the industrial specialization of different countries can be detected. Two dimensions are important: first, a measure or at least a proxy of specific industry characteristics had to be developed, indicating the specific informational and contractual problems one is likely to face in a particular industry. Second, structural variables had to be selected indicating the particular institutional mix on labour and financial markets one can find in specific countries.
Regarding the industry dimension, we used proxy variables to characterize the particular relational needs a certain industry posses. In particular, three indicators have been selected: the skill level of

5
industries, the extent to which they depend on bank finance and the extent to which they depend on equity finance:
– With respect to the level of skilled labour demand, the interpretation can be done in a straightforward manner, reflecting particular needs of these industries for specific investment by stakeholders and therefore for coordinated and institutionalised labour and financial relations, best obtained by highly regulated labour markets (as measured by unionisation, wage bargaining and an indicator for adjusting working time and wages to shocks) and long-term financial relations guaranteed (at least in theory) by the importance of banks and the concentration of ownership.
– As regards the type of external finance, two indicators are available relating to the degree of bank finance on the one hand and to the degree of equity finance on the other. Given the interactions mentioned above, one would expect bank-financed industries to prosper when particular combinations of protective institutional arrangements are present such that implicit capital can be built up. On the contrary, in equity-financed industries, liquidity, low implications by stock- and stakeholders and flexibility in the relations on financial and labour markets may be of particular importance.
Using the industry indicator, industries can be distinguished as to whether they are high-skill, highly bank financed or highly equity financed. A first test whether institutional configurations have any importance for these three different groups of industries therefore simply consists of grouping countries according to their particular financial and labour market characteristics (see Table 7, p. 19). Growth rates can then be averaged over industries and countries in one particular group. When institutional complementarities are at work, one would expect to see that labour and financial market institutions that provide similar types of incentives for industrial activities (following our theoretical discussion) would allow to perform particular types of industries better in the countries where they prevail than in others. And indeed, our figures in Table 7 seem to point towards such a mechanism.
With these theoretical considerations at hand, and given the illustrative evidence that seems to point towards institutional configurations having significant impact on the performance of particular industries, we are able to set up four different hypotheses as to the impact of institutional arrangements on industrial specialization:
– Hypothesis 1: (Interaction between institutional variables and industry specialization) The industrial specialization is systematically related to the interaction between industry characteristics, the capital structure of firms and labour market relations in different countries.
– Hypothesis 2: (Direct effect of financial relations) Industries with high demand of stakeholder implication in the management of firms (as measured by high levels of skilled labour demand and high dependence on bank finance) are relatively more performing in countries with easy access to credit and a large banking sector; the opposite is true for countries with well developed stock markets.
– Hypothesis 3: (Direct effect of industrial relations) Industries with high demand of stakeholder implication in the management of firms are relatively more performing in countries with strong employment protection, weak labour rotation and a relative stability of wage earners' salaries as well as a good representation by trade unions.
– Hypothesis 4: (Complementary effect) Industries with high demand of stakeholder implication in the management of firms are relatively more performing in countries combining long-term financial relations and strong stockholder implication in close firm monitoring with employment protection, weak labour rotation and a relative stability of wage earners' salaries as well as a good representation by trade unions.
b.) Methodology In order to test these issues we proceed in a straightforward way by using multivariate regressions with interactive terms. As we proceed with our analysis on the industry level, this seems to be a very suitable approach for our purpose. The highly incomplete nature of time series data on labour relation

6
issues makes averaging over some time span necessary. It is therefore natural to construct a panel (i.e. cross section) around industry and country characteristics averaged over a period of approximately twenty years. The task here will therefore be to explain the variance of the long-run performance differential among industries and countries using variables institutional differences.
The methodology used here follows the one proposed by Carlin and Mayer (1999) and is similar to that used by Rajan and Zingales (1998). Different to latter we used demeaned variables while different to Carlin and Mayer we are using a combination of country characteristics to test institutional complementarity. To carry out the estimations, let us first define the following matrices:
� Y = k x i matrix of i industrial growth rates and investment shares in k countries
� X = s x k matrix of s individual and/or complementary country structural features in k countries
� Z = c x i matrix of c industry characteristics in i industries.
Let us denote B the s x c matrix containing the coefficients that indicate the relations between country characteristics and industry characteristics on the one hand and industrial activity on the other. The estimation equation then writes as:
ε+= BZXY T
where ε is the error term of the regression.
In this regression, industrial activity is measured by the average growth rate of value added between 1970 and 1995 in 27 industries (i=27) in 19 OECD-countries (k=19). Industries have been mainly selected in manufacturing on the 3- and 4-digit ISIC (Rev. 2) level.
Concerning the industry characteristics, we will retain three indicators reflecting underlying particular needs of investors when choosing an activity in a specific industry: skilled labour input, intermediated finance, and equity finance. The first of these three variables is meant to indicate the degree of coordination necessary in a given industry among stakeholders; the two remaining ones may reflect particular needs for certain types of external finance (with different control and monitoring characteristics) or – as has been suggested by Rajan and Zingales (1998) – reflect an indicator for the need of external finance in general. In order to make sure that the indicators we have chosen reflect an underlying reality of the industry, problems of the supply of these factors had to be taken into account. In this respect, countries with the highest supply-price elasticity are likely to be the ones where the market outcome represents the best the underlying industry needs. Therefore, we have chosen to take Germany as the base for the skill indicator, Japan for the bank finance indicator and the United States for the equity finance indicator, following an earlier suggestion by Rajan and Zingales (1998).
The country characteristics have been taken into account through two different channels. Firstly, we have integrated several factors reflecting conditions on labour and financial markets that have been identified as crucial for economic growth in the literature. Moreover, in order to test our hypothesis on institutional complementarities, we have constructed interacting variables reflecting cross effects of institutional arrangements.
Concerning the financial market, we retain two basic types of variables: Firstly, we are measuring the relative size of the equity market (stock market capitalization, VC market capitalization) and the market for intermediated finance (credit). Second, we provide indicators representing the quality and the involvement of external investors in the firm management, such as accounting standards, equity hold by banks and ownership concentration.
In order to represent the institutional arrangements on the labour market two types of indicators have been chosen: on the one hand, indicators reflecting the individual labour relation and the arrangements framing actors contributing to it, such as the labour turnover, institutional flexibility, employment protection legislation (EPL) and the degree of unionisation. A second type concerns the outcome of the bargaining process, largely dependent on collective coverage, level of bargaining (firm, industry or national level) and coordination among bargaining units.
In order to control for country and industry fixed effects, relative industry performance measures have been chosen. Industrial activity has hence been demeaned compared to industry and country averages.

7
The independent variables have been demeaned the same way: the industrial characteristics with respect to the industrial average, while the country characteristics have been demeaned with respect to the country averages.
Continuing the definition we have yik as the dependent variable in industry i in country k, yi- as its average across countries, y-k as its average across industries and y-- as its average across countries and industries. Furthermore, define xk as the country variables, zi as the industry variables, x- as the averages of the country variables across all countries, z- as the averages of the industry variables across all industries and a and b as parameters.
The general equation of testing individual and complementary country features on industrial specialization would be:
ikikICikikiikkkiik zvbzxbzbxbaay ε++++++=
where xk and vk≡xk´ xk´´ stand for different structural country features represented by matrix X. Here ai represents industry fixed effects, while ak stands for country fixed effects. The structural country characteristics can be tested individually (leaving out bIC), complementarily (leaving out bik) or in combination. Using the demeaned dependent variables – demeaned relative to both country and industry averages – and demeaned industry and country variables – demeaned relative to their industry- and world-wide averages respectively – this equation can be rewritten as:
( )( ) ( )( )
( )( ) ( )( ) ikikkICikik
kiik
ikICikikkiik
zzxxxxbzzxxb
zzvvbzzxxbyyyy
εεεεε
~+−′′′−′′′+−−=+−−+
−−+−−=+−−
−−−−−
−−−−
−−−−−−−−
By demeaning the dependent variable with respect to both industry and country averages we have the convenient effect of controlling effectively for fixed effects helping to focus on the relationship between growth and the interaction of industry and country structure characteristics.
Omitted variables can never be fully accounted for; nevertheless, most of the other factors can be controlled for by this demeaning approach, while others (such as capital intensity and the dynamics of industry's domestic demand), being co-determined in equilibrium are not included in the reduced form, since, in a cross-section, it is impossible to find valid instruments for these variables. Furthermore, we lack good cross-country comparable data on capital intensity both at the aggregate and industry level.
As has been indicated above structural characteristics enter the regression in two ways: firstly, indicators reflecting different aspects of financial and labour market relations are integrated to identify their direct effect on the endogenous variable; secondly, multiplicative terms are constructed to detect complementary effects.
Concerning the financial market, two types of variables are considered. Quantitative indicators measure the size of the stock market exchange and the importance of credit relations in the different economies. In order to measure qualitative aspects, accounting standards, equity holdings by banks and ownership concentration has also been integrated.
With respect to the labour market, two measures of employment flexibility are considered here: the turnover ratio and an institutional flexibility indicator reflecting the possibility to quickly adjust wages and working hours to new economic shocks. On the other hand, the degree to which wage earners are protected by institutional actors is measured by the unionisation rate and the coverage ratio.
Given these different variables, Table 2 synthesizes the sign of the regression coefficients, as we would expect them according to our four different hypotheses:

8
Table 2: Coefficients Table
Industrial characteristics Skill level Equity finance Bank finance
Stock markets b12 > 0 (H2) Banks b21 > 0 (H2) b23 > 0 (H2)
Ownership concentration
b31 > 0 (H2) b33 > 0 (H2)
Flexibility b41 < 0 (H3) b42 > 0 (H3) b43 < 0 (H3) Unionization b51 > 0 (H3) b52 < 0 (H3) b53 > 0 (H3) Accounting *
unions
Banks * unions b71 > 0 (H4a) b72 > 0 (H4b) b73 > 0 (H4a) or b73 < 0 (H4b)
Stru
ctur
al c
hara
cter
istic
s
Ownership * unions
b81 > 0 (H4a) B82 > 0 (H4b) b83 > 0 (H4a) or b83 < 0 (H4b)
3. Regression results
a.) Presentation and discussion
In order to test the different hypotheses ten different regressions3 have been tested, combining the different institutional variables, to assess their impact on the growth rate of value added for the selected 27 industries. Table 3 resumes the variables used and the way they are constructed. A differentiation has been made between regressions assessing direct effects (Table 9) and complementary effects (Table 10). First, only the financial variables have been used (regression 1), then only those variables relating to the labour market (regression 2); in a third regression their explanatory power has been combined (regression 3) while regression 4 reports results where highly insignificant regressors have been dropped; this will constitute the preferred regression for direct effects.
Using second-order equations without assessing the exact functional form4, the second series of regressions tries to establish complementary effects, taking as base each of the three industry characteristics. Regression 4 reports the effects of a combination of ownership concentration and unionisation on skilled dependent industries. Regression 5 tries to establish a relationship between ownership concentration and employment protection on bank-financed industries. Finally, regression 6 relates dispersion of ownership, low unionisation and equity dependent industries. The individual effects have been put together in regression 8 to test their independence, while regression 9 presents the same equation by using a different estimation technique, called least absolute deviation (LAD). Finally, regression 10 presents one possible additional control for industrial growth by considering the effect of R&D intensity. All OLS regressors have been corrected for heteroscedasticity and only regressions corrected for Welsh-outliers have been reported5.
3 Table 9 and Table 10 in the appendix only show the results of regressions controlled for outliers using the Welsh distance
(Welsch, 1982). Similar to the DFITS approach it attempts to summarize the information in the leverage versus residual-squared plot into a single statistic.
4 Only an equation of the form: εβββα ++++= 2132211 xxxxy
has been tested where any squared terms of x1 and x2 – necessary to test for the functional form – have been dropped. 5 Other controls have been used such as capital intensity and openness but have not been reported here. Moreover, we have
tested hypothesis 4 against the alternatives 2 and 3 by putting the complementary terms in the preferred equation to check for robustness of the complementary terms. All regressions - including the ones not corrected for outliers - can be requested from the author.

9
Table 3: Variable construction 1.) Industrial variables: Relative weight of sectors in 1970 Skilled labour input by sector Bank financed industry Equity financed industry 2.) Financial market variables Accounting standards Credit as % of GDP Ownership concentration Equity owned by banks Ownership dispersion 3.) Labour market variables Institutional flexibility Labour turnover Unionisation Collective coverage Employment protection
INITIAL SHARES SKILLS BANK FINANCE EQUITY FINANCE ACCOUNTING CREDIT CONCENTRATION EQUITY DISPERSION FLEXIBILITY TURNOVER UNIONISATION COVERAGE EPL
4.) Dependent variable: The regressors that have been used are constructed by multiplication of an industry variable (1.; except INITIAL SHARES) with one of the variables in 2. or 3.; the complementary regressors have been constructed by multiplication of a variable of all three segments.
All regressions confirm the initial hypothesis of regression towards the mean: in all ten cases, there is a strong convergence with high significance. An increase of the sector size by one percentage point diminishes the growth rate on average by 0.15%. Hence, one observes a growth rate convergence between sectors with low initial parts towards those with high initial parts. The industrial specialization that has taken place between 1970 and 1990 therefore cannot be explained only by reference on the initial size of the sector; other factors have to be taken into account, which leaves room to the institutional variables suggested here.
Analysing the effect of these institutional variables gives indeed some interesting results. As can be seen from the first regression, seven out of nine financial variables can be shown to be significant on the 5- or 10% level. This compares well with similar studies carried out by Carlin and Mayer (1999) and Rajan and Zingales (1998) who also found a strong relationship between (similar) financial variables and industrial growth rates.
Evidence on relations between labour market arrangements and industrial growth rates, however, seems to be much weaker with only five out of nine variables being significant. Moreover, some results seem to be somewhat surprising in that they have the opposite of the (theoretically) expected sign (unionisation comes out to have a positive impact on equity dependent industries). Neither indicators for labour turnover nor variables implying institutional flexibility play any significant role here. Again, this seems to confirm the studies cited earlier that did not found any strong relationship between labour market institutional arrangements and aggregate or disaggregate economic performance.
Integrating both sets of variables into one regression increases the significance level of some variables while reducing the number of significant variables. This may be due to the reduced number of observations (278 compared to 302 and 339 in the first and second equation). Consequently, the F-statistics deteriorates while still leading a 1% significance level for the overall equation. This problem is partly solved by dropping highly insignificant variables as has been done in regression 4.

10
While these first four regressions already showed an important impact of (some) institutional arrangements on the performance of industries with particular needs – and hence confirming our first hypothesis – the complementary effect still has to be assessed. This is the objective of Table 10. Using all three industry dimensions (skill, bank finance, and equity finance), regressions (5)-(7) present evidence on the combination of particular institutional arrangements on the financial and the labour market with industries exposing these particular characteristics.
In all three cases, highly significant combinations have been found to give the (theoretically) predicted sign on industry performance. Combinations of concentrated ownership together with employment protection or unionisation (a private association equivalent to employment protection) is found to be related to industries with particular needs in stakeholder coordination as represented by the input of skilled labour and the demand for bank finance. On the other hand, competitive labour market relations and financial relations characterized by high liquidity and low market power of participants (high degree of ownership dispersion) is systematically linked to industries with high equity demand. Notice, moreover, that the complementary effect offsets some of the earlier direct effects: in all three combinations, the direct effects have a negative sign, indicating that – relative to the complementary effect – an increase of one measure individually does not lead to increased industrial performance; only the combined effect of both types of institutional arrangements will have the anticipated positive effect.
Regression 8, moreover, shows that these linkages can be considered independently reflecting a variety of institutional models. Here, all three previous regressions have been put together, still resulting in significant estimators; hence, no colinearity between complementary or single effect variables seems to emerge. In order to put further pressure on the robustness of these regressions, we also used least absolute deviation (LAD) estimators on the full sample. Here, no outlier control is necessary (hence more observations are available) as existing outliers will less affect the significance of the estimators. In this case, the significance of all estimators drops while still reaching at least the 10% level6.
Moreover, by putting the complementary terms in the preferred regression 4 (not shown in Table 10), hypothesis 4 (the existence of institutional complementarity) could be tested against hypothesis 2 and 3 (only direct effects exist). In this case, the complementary effects remain significant while the direct effects largely disappear if they do not correspond to any of these complementarities (with the notable exception of the direct effect of EPL on equity dependent industries). Hence, going back to our initial hypotheses, the relationship between complementary variables and industrial specialization can clearly be established in light of the results presented in Table 10. Direct and complementary results have been summarized in the following Table 4.
Table 4: Summary of regression results
Industrial characteristics Skill level Equity finance Bank finance
Stock markets + + + + 0 Banking sector 0 0 – – –
Ownership concentration
0 – – – – Worker
representation 0 + 0
Protection of labour relations
+ + + + + +
Dispersion * Flexibility
+ + +
Stru
ctur
al c
hara
cter
istic
s
Concentration * Unions/EPL
+ + + + + +
Source: Own calculations
6 The LAD regression has not been presented here but is available from the author upon request
11
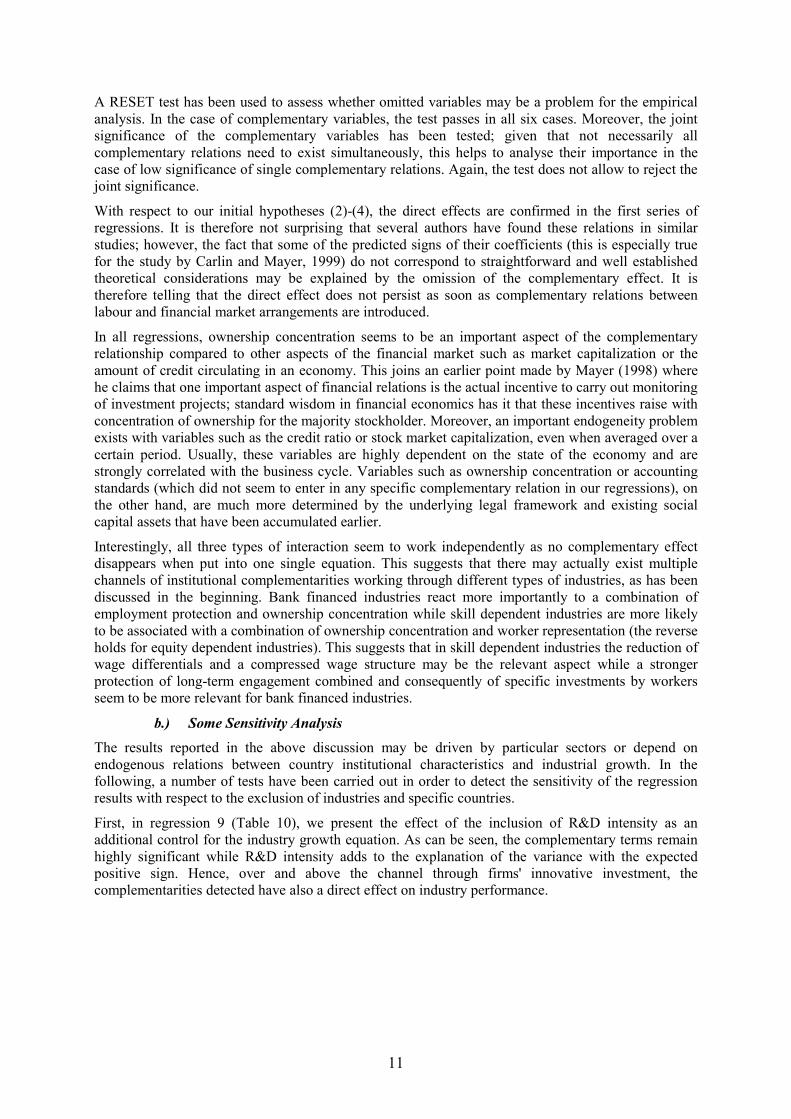
A RESET test has been used to assess whether omitted variables may be a problem for the empirical analysis. In the case of complementary variables, the test passes in all six cases. Moreover, the joint significance of the complementary variables has been tested; given that not necessarily all complementary relations need to exist simultaneously, this helps to analyse their importance in the case of low significance of single complementary relations. Again, the test does not allow to reject the joint significance.
With respect to our initial hypotheses (2)-(4), the direct effects are confirmed in the first series of regressions. It is therefore not surprising that several authors have found these relations in similar studies; however, the fact that some of the predicted signs of their coefficients (this is especially true for the study by Carlin and Mayer, 1999) do not correspond to straightforward and well established theoretical considerations may be explained by the omission of the complementary effect. It is therefore telling that the direct effect does not persist as soon as complementary relations between labour and financial market arrangements are introduced.
In all regressions, ownership concentration seems to be an important aspect of the complementary relationship compared to other aspects of the financial market such as market capitalization or the amount of credit circulating in an economy. This joins an earlier point made by Mayer (1998) where he claims that one important aspect of financial relations is the actual incentive to carry out monitoring of investment projects; standard wisdom in financial economics has it that these incentives raise with concentration of ownership for the majority stockholder. Moreover, an important endogeneity problem exists with variables such as the credit ratio or stock market capitalization, even when averaged over a certain period. Usually, these variables are highly dependent on the state of the economy and are strongly correlated with the business cycle. Variables such as ownership concentration or accounting standards (which did not seem to enter in any specific complementary relation in our regressions), on the other hand, are much more determined by the underlying legal framework and existing social capital assets that have been accumulated earlier.
Interestingly, all three types of interaction seem to work independently as no complementary effect disappears when put into one single equation. This suggests that there may actually exist multiple channels of institutional complementarities working through different types of industries, as has been discussed in the beginning. Bank financed industries react more importantly to a combination of employment protection and ownership concentration while skill dependent industries are more likely to be associated with a combination of ownership concentration and worker representation (the reverse holds for equity dependent industries). This suggests that in skill dependent industries the reduction of wage differentials and a compressed wage structure may be the relevant aspect while a stronger protection of long-term engagement combined and consequently of specific investments by workers seem to be more relevant for bank financed industries.
b.) Some Sensitivity Analysis The results reported in the above discussion may be driven by particular sectors or depend on endogenous relations between country institutional characteristics and industrial growth. In the following, a number of tests have been carried out in order to detect the sensitivity of the regression results with respect to the exclusion of industries and specific countries.
First, in regression 9 (Table 10), we present the effect of the inclusion of R&D intensity as an additional control for the industry growth equation. As can be seen, the complementary terms remain highly significant while R&D intensity adds to the explanation of the variance with the expected positive sign. Hence, over and above the channel through firms' innovative investment, the complementarities detected have also a direct effect on industry performance.

12
Table 5: Industry sensitivity analysis
Complementarity type
Skill complementarity Bank finance complementarity
Equity finance complementarity
on 1% level
311, 312, 313, 321, 322, 323, 324, 331, 332, 341, 342, 354, 355, 356, 361, 362, 369, 371, 372, 381,
383, 3843, 385
All industries
on 5% level 314, 351, 352 All industries Sign
ifica
nce
on 10% level 382
Source: Own calculations
Second, in order to further approximate a standard growth equation, we included a proxy for capital intensity. In the absence of reliable initial values for the stock of capital, we used the average investment intensity over the period 1970-1995 instead. As column (10) shows (Table 10), all complementary terms remain significant at least at the 5% level adding further to the explication of the variance. Investment intensity has the expected positive sign and R&D intensity remains significant with the correct sign.
Finally, in order to determine whether particular sectors are driving the regression, an industry sensitivity test has been carried out for each single industry. In Table 5 the results of the – outlier controlled – regressions have been summarized when a single industry has been dropped.
The table shows that the preferred equation is robust with respect to most sectors; no particular sector seems to drive the equation. The bank finance and equity finance complementarity in the preferred equation even resists to any change of the industrial selection. This is less so with the skill complementarity. While the equation resists to most of the industries, the significance drops to 5% for sectors 314, 351 and 352 and even to 10% for the non-electrical machinery (sector 383). Nevertheless, the complementary relation still holds and no particular sector can be made responsible for driving the results of the preferred equation.
A further issue raised by the above analysis is whether the independent variables can be treated as exogenous. The fact that they are not measured prior to the dates over which industry growth is measured exacerbates this concern. However, even if they were then the question of whether country structures and industry characteristics could be treated as exogenous would arise.
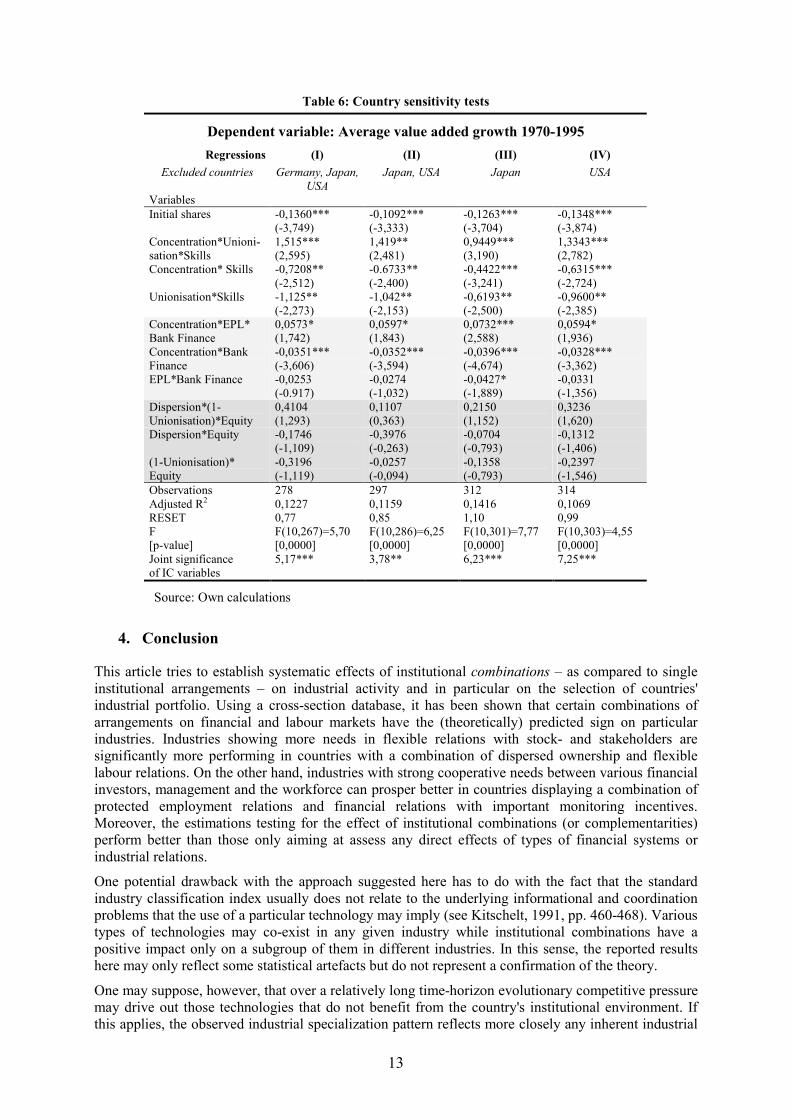
In order to avoid these problems of endogeneity between industry variables and country performance a regression has been run excluding Germany, Japan and USA, the three countries that provided the data on fundamental characteristics of industries7. In order to get a more detailed idea on the relationship between these three countries and the regression results, three more regressions have been provided in addition, excluding only subgroups of countries. The results are presented in Table 6.
It turns out that the first two complementary types resist quite well to the exclusion of all three or subgroups of the above countries. This is less the case with the third complementarity type – between equity dependent industries and a combination of dispersion and low unionisation. Here, a problem seem to exist as the exclusion of either Japan or the United States – and even more importantly the exclusion of both countries – from the regression deteriorates the significance level of the complementarity even though it still keeps the predicted sign. A further analysis seems to be necessary to detect the reason for this econometric behaviour and eventually a substitution of the variables used in the regression.
7 Unfortunately, instrumenting independent variables by country characteristics that may be fundamentally exogenous - as
suggested by the studies cited earlier - proved infeasible given that no appropriate instrument seem to exist for most of the labour market institutional arrangements.
13
Table 6: Country sensitivity tests
Dependent variable: Average value added growth 1970-1995 Regressions (I) (II) (III) (IV)
Excluded countries Germany, Japan, USA
Japan, USA Japan USA
Variables Initial shares -0,1360***
(-3,749) -0,1092*** (-3,333)
-0,1263*** (-3,704)
-0,1348*** (-3,874)
Concentration*Unioni-sation*Skills
1,515*** (2,595)
1,419** (2,481)
0,9449*** (3,190)
1,3343*** (2,782)
Concentration* Skills -0,7208** (-2,512)
-0.6733** (-2,400)
-0,4422*** (-3,241)
-0,6315*** (-2,724)
Unionisation*Skills -1,125** (-2,273)
-1,042** (-2,153)
-0,6193** (-2,500)
-0,9600** (-2,385)
Concentration*EPL* Bank Finance
0,0573* (1,742)
0,0597* (1,843)
0,0732*** (2,588)
0,0594* (1,936)
Concentration*Bank Finance
-0,0351*** (-3,606)
-0,0352*** (-3,594)
-0,0396*** (-4,674)
-0,0328*** (-3,362)
EPL*Bank Finance -0,0253 (-0.917)
-0,0274 (-1,032)
-0,0427* (-1,889)
-0,0331 (-1,356)
Dispersion*(1-Unionisation)*Equity
0,4104 (1,293)
0,1107 (0,363)
0,2150 (1,152)
0,3236 (1,620)
Dispersion*Equity -0,1746 (-1,109)
-0,3976 (-0,263)
-0,0704 (-0,793)
-0,1312 (-1,406)
(1-Unionisation)* Equity
-0,3196 (-1,119)
-0,0257 (-0,094)
-0,1358 (-0,793)
-0,2397 (-1,546)
Observations 278 297 312 314 Adjusted R2 0,1227 0,1159 0,1416 0,1069 RESET 0,77 0,85 1,10 0,99 F [p-value]
F(10,267)=5,70 [0,0000]
F(10,286)=6,25 [0,0000]
F(10,301)=7,77 [0,0000]
F(10,303)=4,55 [0,0000]
Joint significance of IC variables
5,17*** 3,78** 6,23*** 7,25***
Source: Own calculations
4. Conclusion
This article tries to establish systematic effects of institutional combinations – as compared to single institutional arrangements – on industrial activity and in particular on the selection of countries' industrial portfolio. Using a cross-section database, it has been shown that certain combinations of arrangements on financial and labour markets have the (theoretically) predicted sign on particular industries. Industries showing more needs in flexible relations with stock- and stakeholders are significantly more performing in countries with a combination of dispersed ownership and flexible labour relations. On the other hand, industries with strong cooperative needs between various financial investors, management and the workforce can prosper better in countries displaying a combination of protected employment relations and financial relations with important monitoring incentives. Moreover, the estimations testing for the effect of institutional combinations (or complementarities) perform better than those only aiming at assess any direct effects of types of financial systems or industrial relations.
One potential drawback with the approach suggested here has to do with the fact that the standard industry classification index usually does not relate to the underlying informational and coordination problems that the use of a particular technology may imply (see Kitschelt, 1991, pp. 460-468). Various types of technologies may co-exist in any given industry while institutional combinations have a positive impact only on a subgroup of them in different industries. In this sense, the reported results here may only reflect some statistical artefacts but do not represent a confirmation of the theory.
One may suppose, however, that over a relatively long time-horizon evolutionary competitive pressure may drive out those technologies that do not benefit from the country's institutional environment. If this applies, the observed industrial specialization pattern reflects more closely any inherent industrial
14
characteristics. It is therefore important to use long-term averages as we have proposed it in this contribution.
The results arising from several empirical estimations seem to confirm an association between certain types of institutional combinations and countries’ industrial specialization. Depending on the inherent characteristics of the industry as measured by the degree of skill dependence, bank finance dependence, or equity finance dependence, an industry may react differently to combinations of ownership control and outsider control on the financial market and worker representation and employment protection on the labour market. These results have been tested against a variety of alternative hypotheses involving only direct institutional effects and been analysed using a sensitivity analysis. Whether by using an outlier control or a least absolute deviations (LAD) approach, the hypothesis regarding institutional complementarities could be maintained.
Further research along these lines would imply enlarging the possible market interactions as well as the indicators that have been used to analyse these relations. One could imagine integrating indicators concerning the characteristics of the product markets in the countries forming the base of this study. Moreover, using a simulation analysis could help to assess the impact of institutional change during transition periods of modified structural conditions.

15
5. References
[1.] Amable, Bruno and Ekkehard Ernst (2003), “Financial and labour market interactions. Specific investments and market liquidity”, Paper presented at the 18th Annual Congress of the European Economic Association, Stockholm, 2003
[2.] Bassanini, Andrea and Ekkehard Ernst (2002), “Labour market regulation, industrial relations and technological regimes: a tale of comparative advantage”, INDUSTRIAL AND CORPORATE CHANGE, 11, pp. 391-426
[3.] Breschi, Stefano, Franco Malerba and Luigi Orsenigo (2000), “Technological Regimes and Schumpeterian Patterns of Innovation”, ECONOMIC JOURNAL, 110, pp. 388-410
[4.] Carlin, Wendy and Colin Mayer (1999), “Finance, Investment and Growth”, OXFORD FINANCIAL RESEARCH CENTER, 1999-FE-09
[5.] Demirgüç-Kunt, Asli and Ross Levine (2001), FINANCIAL STRUCTURE AND ECONOMIC GROWTH. A CROSS-COUNTRY COMPARISON OF BANKS, MARKETS, AND DEVELOPMENT, MIT-Press, Cambridge, MA.
[6.] Fitoussi, Jean-Paul and Olivier Passet (2000), “Réformes Structurelles et Politiques Macro- économiques: Les Enseignements des ‘Modèles’ de Pays”, RAPPORT DU CONSEIL D’ANALYSE ECONOMIQUE, La Documentation Française, Paris
[7.] Freeman, Richard B. (2000), “Single-Peaked v. Diversified Capitalism: The Relation Between Economic Institutions and Outcomes”, NBER WORKING PAPER, 7556
[8.] Huber, Evelyne, Charles Ragin and John D. Stephens (1997), “Comparative Welfare States Data Set (Luxembourg Income Study)”, Northwestern University et University of North Carolina
[9.] IFC (1992), EMERGING STOCK MARKET FACTBOOK, Washington, D.C.
[10.] IMF (1999), INTERNATIONAL FINANCIAL STATISTICS, Washington, D.C.
[11.] King, Robert G. and Ross Levine (1993), “Finance, Entrepreneurship, and Growth”, JOURNAL OF MONETARY ECONOMICS, 32, pp. 513-542
[12.] Kitschelt, Herbet (1991), “Industrial Governance Structures, Innovation Strategies, and the Case of Japan: Sectoral or Cross-National Comparative Analysis ?”, INTERNATIONAL ORGANIZATION, 45, pp. 453-493
[13.] La Porta, Rafael, Florencio Lopez-De-Silanes , Andrei Shleifer et Robert W. Vishny (1997), “Legal Determinants of External Finance”, JOURNAL OF FINANCE, 52/3, pp. 1131-1150
[14.] La Porta, Rafael, Florencio Lopez-De-Silanes, Andrei Shleifer and Robert W. Vishny (1998), “Law and Finance”, HARVARD UNIVERSITY WORKING PAPER
[15.] Levine, Ross and Sara Zervos (1998), “Stock Markets, Banks, and Economic Growth”, AMERICAN ECONOMIC REVIEW, 88/3, pp. 537-558
[16.] Mayer, Colin (1998), “Financial Systems and Corporate Governance: A Review of the International Evidence”, JOURNAL OF INSTITUTIONAL AND THEORETICAL ECONOMICS, 154, pp. 144-169
[17.] Milgrom, Paul and John Roberts (1995), “Complementarities and Fit, Strategy, Structure, and Organizational Change in Manufacturing”, JOURNAL OF ACCOUNTING AND ECONOMICS, 10, pp. 179-208
[18.] Nicoletti, Giuseppe, Stefano Scarpetta and Olivier Boylaud (1999), “Summary indicators of product market regulation with an extension to employment protection legislation”, OECD ECONOMICS DEPARTMENT, Working Paper no. 226
[19.] OECD (1993), EMPLOYMENT OUTLOOK, Paris
[20.] OECD (1997), EMPLOYMENT OUTLOOK, Paris

16
[21.] Oulton, Nicholas (1996), “Workforce Skills and Export Competitiveness”, in: Alison L. Booth et Dennis J. Snower, ACQUIRING SKILLS. MARKET FAILURES, THEIR SYMPTOMS AND POLICY RESPONSES, CEPR, Cambridge University Press, Cambridge/ UK, pp. 201-230
[22.] Rajan, Raghuram G. and Luigi Zingales (1998), “Financial Dependence and Growth”, AMERICAN ECONOMIC REVIEW, 88/3, pp. 559-586
[23.] Soskice, David (1997), “German Technology Policy, Innovation, and National Institutional Frameworks”, INDUSTRY AND INNOVATION, 4/1, pp. 75-96
[24.] Stein, Jeremy (1988), “Takeover Threats and Managerial Myopia”, JOURNAL OF POLITICAL ECONOMY, 96, pp. 61-80
[25.] Visser, Jelle (1996), “Unionisation Trends. The OECD Countries Union Membership File”, Amsterdam: University of Amsterdam, Centre for Research of European Societies and Labour Relations CESAR
[26.] Welsch, R. E. (1982), “Influence functions and regression diagnostics”, in: R. L. Launer and A. F. Siegel (eds.), MODERN DATA ANALYSIS, Academic Press, pp. 149-169

17
6. Appendix 1 – Data bases
a.) Value added growth In order to evaluate the relative industry performance, data on value added growth at constant prices of 27 manufacturing industries (ISIC Rev. 2, mainly 3-digit) of 19 OECD countries between 1970 and 1995 has been taken. All data tables can be found in appendix 2, p. 19.
Table 8 contains the annual average growth rates of these 19 countries over the selected period. Portugal has shown the highest growth rate with Finland being second; Germany, Norway and the United Kingdom followed the least dynamic growth path in this sample. The table also shows a shift-share analysis. The first is a “share effect”, the contribution of deviations of initial shares in different industries from world averages in 1980, capturing the extent to which deviations from world average growth rates are attributable to high initial shares in industries that experienced high or low growth. The second is a “growth effect”, the contribution of deviations from world average growth rates assuming initial shares are equal to world averages, hence capturing country specific deviations from world average growth rates independent of initial industry allocations. The third is an “interactive effect”, the interaction of deviations of initial shares and industry growth rates from world averages.
The table records that the country variation is nearly entirely attributable to the growth effect. This is confirmed by an analysis of variance: -7.5% of country growth variation is attributable to the share effect, 108.6% to the growth effect and -1.1% to the interactive effect; the last of these implies that there is significant regression to the mean – high share industries have below average growth rates.
b.) Industry characteristics We focus on three characteristics of industries: the extent to which they are reliant on market sources of finance, bank finance and a skilled labour force. Establishing the significance of these inputs to the activities of different industries is complicated by the constraints under which firms in these industries may be operating. There may be legal, regulatory, institutional and cultural considerations, which limit their availability or raise their price. The approach which we have taken mirrors that in Rajan and Zingales (1998) who argue that since the US has one of the most highly developed and liberal financial markets in the world, US firms are likely to face the least constraints in raising external finance. External funding levels of US industries will therefore most closely approximate the requirements of firms operating in those industries.
We similarly constructed our three industry variables by using the countries in which conventional wisdom suggests that they are least likely to be constrained and therefore a close reflection of the underlying characteristics. Stylised descriptions treat the US as the archetypal market based financial system, Japan as a bank based system and Germany as a country in which investments in skills and training is promoted. We therefore measured cross-industry variations in external market based sources of finance in the US, bank finance in Japan and investment in skills in Germany.
Using data from Rajan and Zingales (1998), external financing was measured as the fraction of capital expenditure not financed with cash flow from operations by US firms during the 1980's. Equity financing was measured as the ratio of the net amount of equity issues to capital expenditures. Industry data on bank finance in Japan was obtained from the Japanese Ministry of Finance. Bank financing ratios were constructed as the ratio of bank loans to gross external financing (total investment including investment in financial assets minus retentions) and as the ratio of bank loans to physical investment (net of depreciation) averaged over the period 1981 to 1990. Most of the results reported below refer to the latter definition of bank financing. Oulton (1996) reports skill levels of the German work force in 1987. The proportion of the work force with high, upper intermediate, lower intermediate and no vocational qualifications is reported for 30 manufacturing sectors.
Table 4 shows three of the industry variables: equity financing, bank financing and skill levels. Electrical machinery has a high level of equity financing in the US but a modest level of bank financing in Japan. Clothing has one of the highest levels of bank financing in Japan but raised no equity in the US. Skill levels are high in shipbuilding, an industry that raises little equity in the US and ran down outstanding stocks of bank debt during the 1980’s. Skill levels are low in textiles, an industry that was heavily dependent on bank finance in Japan but raised little external equity finance in the US. In professional goods, levels of equity finance, bank finance and skills are all above their means. The correlation between equity and bank finance is 0.073, between skills and bank financing is -0.455 and between skills and equity financing is 0.172.
c.) Country characteristics
i. The Financial Market
Five structural features that apparently display considerable variation across countries are the degree of concentration of ownership, information disclosure rules, relations between banks and industry, the sizes of stock markets and banking systems. In two papers, La Porta et al. report data on ownership concentration in a large number of countries. La Porta et al. (1997) report data on the median ownership of the three largest shareholders in the 10 largest non-financial privately owned domestic firms. La Porta et al. (1998, table 3b) report the mean percentage of the 20 largest firms that were widely held in the sense of having no shareholder with more than 10% voting control. La Porta et al. (1998, table 4) report a third measure of ownership structure: the mean percentage of the 20 largest firms which were not widely held and had control exercised through a pyramid of at least one publicly traded company. Most of the results relate to the second measure of ownership concentration.

18
Financial disclosure is commonly associated with accounting standards. The Center for International Financial Analysis and Research creates an index of accounting disclosure on a scale from 0 to 90 based on the annual reports of at least three firms in each country. The first comprehensive survey was undertaken in 1990 and the results, which are reported in Rajan and Zingales (1998) and La Porta, Lopez-de-Silanes, Shleifer and Vishny (1997), have been used in this study.
There is no single source of information on bank ownership of corporate equity. Data on the market value of equity held by banks as a proportion of the market value of equity held by the private domestic sector averaged over the period 1980 to 1990 were collected from individual central banks; where this was not available then OECD Financial Statistics were used.
The size of stock markets was measured by the average ratio of market capitalization to GDP over the period 1982 to 1991 as reported by the IFC Emerging Stock Market Factbook. The size of banking systems was measured by the average ratio of bank credit to GDP over the period 1980 to 1990 as reported by IMF International Financial Statistics.
Table 5 records that concentration of ownership is much lower in the UK and US than elsewhere. Australia, Canada and Japan have intermediate levels of concentration and Continental Europe has high levels of concentration. Finland, Germany and Japan have particularly high levels of bank ownership of corporate equity and have also large banking systems. France has a large banking system but little bank ownership of corporate equity. Sweden and New Zealand have no bank ownership of corporate equity and small banking systems. There is little bank ownership in the US but above average amount of bank lending. Accounting disclosure is low in Austria, Greece and Spain. These countries also have small stock markets. The UK has high accounting disclosures and a large stock market but Sweden has high accounting standards but only a modest sized stock market. The correlation between accounting standards and the size of stock markets is 0.472, between bank ownership of corporate equity and the size of banking systems is 0.657, between ownership concentration and bank ownership of equity is 0.126 and between accounting standards and ownership concentration is -0.391.
ii. The Labour Market
Concerning the labour market, indicators for institutional flexibility have been taken from Fitoussi and Passet (2000); theirs reflect the ease with which employment, hours worked and wages can be adapted to modified market conditions. Summing up the three base indicators – ranging from 0 to 2 – gives the overall picture of a country concerning its labor market flexibility. The indicators contain the legislation on employment protection, the ease of use of overtime work, the degree of decentralization and coordination of wage bargaining, the overall wage dispersion and the wage dispersion by skill level (Fitoussi and Passet, 2000, p. 36).
The second indicator for the labour market flexibility is actually one of the components of the first one: the labour turnover as measured by the average rate of turnover of the work force in eleven countries between 1979 and 1991 (OECD, 1993, ch. 4). A high rate indicates rapid layoffs and hirings of firms and hence the possibility of rapidly adjusting the employment level to (short-term) fluctuations.
The rate of unionisation has been taken from the Luxemburg Income Study (Huber, Ragin and Stephens, 1997) and Visser (1996). Collective coverage has been calculated using the available data in OECD (1997) by averaging over the available years. The rate of unionisation represents the degree to which workers are represented within the firm and in the political sphere outside the firm. On the one hand, a high unionisation will affect workers’ power on the bargaining table; on the other hand, it increases the protection of the labour relation through representation (similar to a voice-mechanism). Collective coverage reflects the degree to which bargaining agreements are extended to non-bargaining units; in this, it is a clear indicator of the bargaining power workers have.
As can be seen from Table 13, p. 25, a great diversity of both types of worker representation exists. At one extreme one can find countries like France with a relatively low unionisation rate (about 10% in 1993) but an almost fully encompassing collective coverage (95% in 1993); on the other hand, the USA and Canada have only low degrees of extension of collective agreements, and hence unionisation and collective coverage rates are much closer.
A further indicator for the flexibility of the labour relation is EPL, the employment protection legislation (Nicoletti, Scarpetta and Boylaud, 1999). The indicators regroups a series of administrative barriers to adjustment of the work force, such as firing costs, the restriction of overtime or the restriction of use of temporary workers. As can be seen from the correlation matrix of labour market indicators (Table 13, p. 25 f.) a highly significant negative correlation exists between labour turnover ratios and EPL.
The last three indicators – coordination, centralization and corporatism – reflect the degree of coordination among bargaining partners (OECD, 1997), which may have important consequences for the degree of wage flexibility to aggregate shocks. The centralization indicator simply reflects the level of the bargaining process (firm level, industry level, national level). Coordination instead focuses on the degree of consensus between the collective bargaining partners. Even in the case of decentralized bargaining, it can be coordinated as it will be in the case of pattern bargaining or covert coordination.
Corporatism includes also the interaction of bargaining partners with the surrounding political sphere. Several dimensions affect this indicator: (i) the existence of strong centralized organizations of employers and worker representatives with an exclusive right of representation; (ii) the privileged access of such centralized organizations to government and (iii) social partnership between labour and capital to regulate conflicts over interests. All three indicators range from 1 to 3.

19
7. Appendix 2 – Figures and Tables
Table 7: Institutional complementarities
The figures present average growth rates by country groups in industries characterised by the prevalence of (i) equity finance, (ii) bank finance and (iii) intensive use of high-skilled labour (for sources see Table 11). Country groups have been defined according to labour and financial market characteristics: Cross-country differences in financial market characteristics have been measured by ownership concentration/dispersion as reported by La Porta et al. (1998). Labour market characteristics have been measured by labour market flexibility (Fitoussi and Passet, 2000), employment protection legislation (Nicoletti, Scarpetta and Boylaud, 1999) and by the degree of unionisation (Visser, 1996). Cross-country averages of these indicators have been used as thresholds to define “high” and “low” groups.
Source: Own calculations.
Average growth in Equity-financed Industries
-0,2
-0,1
0
0,1
0,2
Highdispersion
- Highflexibility
Highdispersion
- Lowflexibility
Lowdispersion
- Highflexibility
Lowdispersion
- LowflexibilityD
evia
tion
from
mea
n in
per
cent
Average growth in Bank-financed Industries
-0,75
-0,5
-0,25
0
0,25
0,5
0,75
1
Highconcentration -
High EPL
Highconcentration -
Low EPL
Lowconcentration -
High EPL
Lowconcentration -
Low EPL
Dev
iatio
n fr
om m
ean
in p
erce
nt
Average growth in High-Skill industries
-0,15
-0,1
-0,05
0
0,05
0,1
0,15
Highconcentration -
High unionization
Highconcentration -
Low unionization
Lowconcentration -
High unionization
Lowconcentration -
Low unionization
Dev
iatio
n fr
om m
ean
in p
erce
nt
Country clusters by category:
High-skill industries: Group 1: Austria, Belgium, Germany, Italy, Japan Group 2: Netherlands, New Zealand, Portugal, Spain Group 3: Australia, Denmark, Finland, Norway, Sweden, UK Group 4: Canada, France, USA
Bank-financed industries: Group 1: Austria, Germany, Italy, Portugal, Spain Group 2: Belgium, Denmark, New Zealand Group 3: France, Japan, Netherlands, Norway, Sweden Group 4: Australia, Canada, Finland, UK, USA
Equity-financed industries: Group 1: Canada, UK, USA Group 2: Australia, Finland, France, Netherlands, Norway, Sweden Group 3: Denmark, New Zealand, Portugal Group 4: Austria, Belgium, Germany, Italy, Japan, Spain

20
Table 8: Decomposition of the growth rate
The table presents the average weighted growth rates for manufacturing between 1970 and 1995 for 19 OECD countries in column 2. Column 3 indicates the difference with respect to the country average; columns 4, 5, and 6 decompose the weighted growth rate to evaluate the effect of initial shares, the growth effect and the interaction effect by using the following equation:
Σi{aikgik - ai-gi-} = Σi{aik - ai-}gi- + Σiai-{gik - gi-} + Σi{aik – ai-}{gik - gi-}
where aik is the share of industry i in country k in 1970, gik is the average growth rate of industry i in country k between 1970 and 1995 (the subscript - indicates the country average). Columns 4, 5 and 6 correspond to the first second and third RHS term. Data has been collected from the OECD Structural Analysis Database (STAN) 1998.
Source: Own calculations.
Country Growth rate Distance to the mean Initial Shares Growth effect Interaction effect Australia 0.014 -0.005 0.001 -0.005 -0.001 Austria 0.023 -0.005 0.000 0.005 -0.001 Belgium 0.018 -0.001 0.002 -0.001 -0.002 Canada 0.018 0.000 0.002 0.001 -0.004 Denmark 0.014 -0.005 -0.001 -0.002 -0.001 Finland 0.029 0.010 -0.001 0.014 -0.002 France 0.016 -0.002 0.001 -0.002 -0.001 Germany 0.009 -0.010 0.003 -0.013 0.001 Greece 0.014 -0.005 -0.006 0.000 0.001 Italy 0.028 0.009 -0.004 0.014 -0.001 Japan 0.025 0.007 0.001 0.011 -0.004 Netherlands 0.018 0.000 0.002 -0.004 0.001 New-Zealand 0.007 -0.011 -0.001 -0.008 -0.003 Norway 0.007 -0.012 -0.002 -0.009 -0.001 Portugal 0.033 0.015 -0.004 0.016 0.002 Spain 0.013 -0.006 0.001 -0.006 -0.001 Sweden 0.011 -0.008 -0.001 -0.007 -0.001 UK 0.003 -0.016 0.001 -0.015 -0.001 USA 0.021 0.003 0.002 0.007 -0.006

21
Table 9: Regression results - Direct effects A constant has been added but not reported in the table. Al regression errors have been corrected for heteroscedasticity. Only regression controlled for Welsh outliers have been reported; the full list of regressions is available on request. *=10% significance level; **=5% significance level; ***=1% significance level.
Source: Own calculations.
Variable: Average value added growth 1970-1995 Regressions
Variables (1) (2) (3) (4)
Initial shares -0.1392*** (-3.487)
-0.1368*** (-3.974)
-0.1516*** (-3.556)
-0.1339*** (-3.566)
Accounting*Skills 0.3169** (2.149)
0.5229* (1.964)
0.3126** (2.479)
Accounting*Bank finance
-0.0246** (-2.106)
-0.0075 (-0.473)
Accounting*Equity finance
0.1909** (2.600)
0.0095 (0.079)
0.1997** (1.973)
Equity*Skills 0.1009 (0.381)
-0.1477 (-0.517)
Equity*Bank finance -0.0238* (-1.742)
-0.0455** (-2.390)
-0.0465*** (-3.785)
Equity*Equity finance
0.2896* (1.852)
0.2610 (1.090)
0.2043 (1.500)
Concentration*Skills 0.0068 (0.130)
-0.0320 (-0.340)
Concentration*Bank Finance
-0.0068** (-2.209)
-0.0094 (-1.490)
-0.0158*** (-3.251)
Concentration* Equity finance
0.0491** (2.124)
-0.0807* (-1.787)
-0.0800* (-1.938)
Flexibility*Skills 0.0258 (0.486)
-0.1145 (-1.138)
Flexibility*Bank finance
0.0099 (1.161)
0.0010 (0.113)
Flexibility*Equity finance
0.0455 (1.166)
0.0701 (1.310)
EPL*Skills 0.0107** (2.170)
0.0085* (1.681)
0.0102** (2.094)
EPL*Bank finance 0.0192* (1.704)
0.0154 (1.408)
0.0174*** (3.019)
EPL*Equity finance 0.1389** (2.465)
0.2469*** (3.332)
0.2268*** (4.039)
Unions*Skills 0.1965*** (2.650)
-0.0949 (-0.813)
Unions*Bank finance -0.0028 (-0.526)
-0.0015 (-0.171)
Unions*Equity finance
0.0673* (1.903)
0.1167*** (2.805)
0.0919* (1.699)
Observations 302 339 278 299 Adjusted R2 0.1328 0.1184 0.1635 0.1994 F [p-value] F(10.291)=5.13
[0.0000] F(10.328)=5.82 [0.0000]
F(19.258)=3.61 [0.0000]
F(11.287)=8.38 [0.0000]
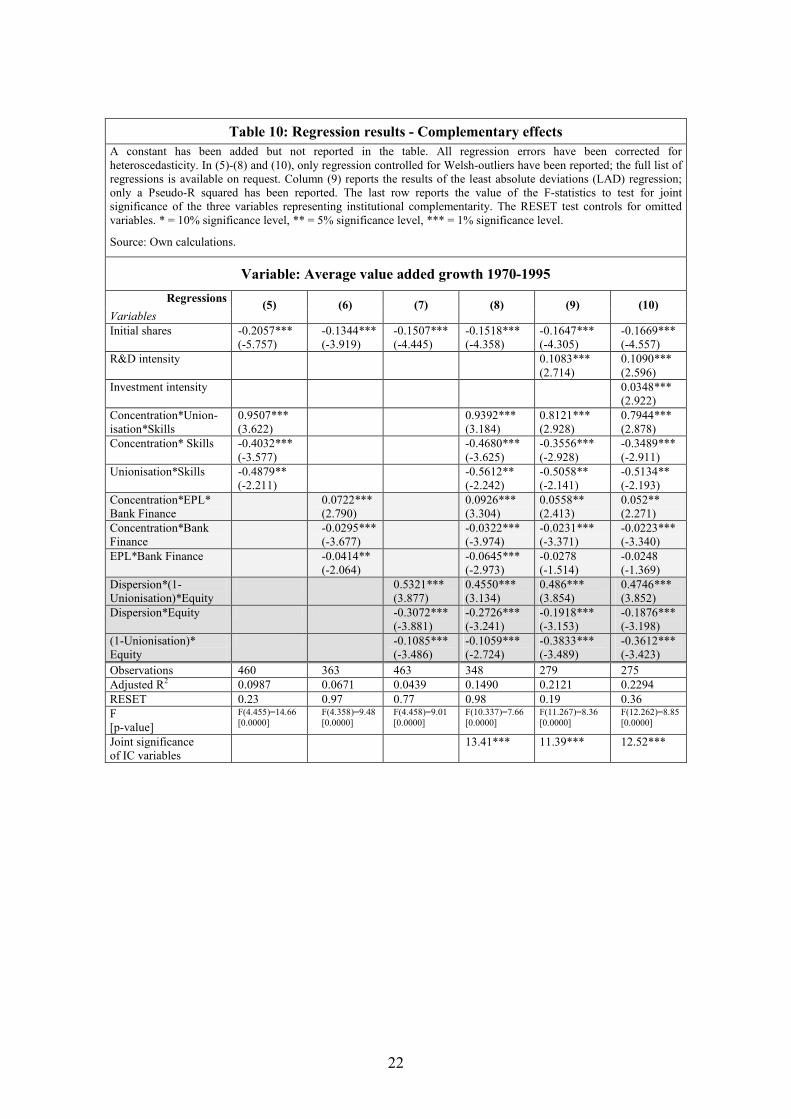
22
Table 10: Regression results - Complementary effects A constant has been added but not reported in the table. All regression errors have been corrected for heteroscedasticity. In (5)-(8) and (10), only regression controlled for Welsh-outliers have been reported; the full list of regressions is available on request. Column (9) reports the results of the least absolute deviations (LAD) regression; only a Pseudo-R squared has been reported. The last row reports the value of the F-statistics to test for joint significance of the three variables representing institutional complementarity. The RESET test controls for omitted variables. * = 10% significance level, ** = 5% significance level, *** = 1% significance level.
Source: Own calculations.
Variable: Average value added growth 1970-1995 Regressions
Variables (5) (6) (7) (8) (9) (10)
Initial shares -0.2057*** (-5.757)
-0.1344*** (-3.919)
-0.1507*** (-4.445)
-0.1518*** (-4.358)
-0.1647*** (-4.305)
-0.1669*** (-4.557)
R&D intensity
0.1083*** (2.714)
0.1090*** (2.596)
Investment intensity
0.0348*** (2.922)
Concentration*Union-isation*Skills
0.9507*** (3.622)
0.9392*** (3.184)
0.8121*** (2.928)
0.7944*** (2.878)
Concentration* Skills -0.4032*** (-3.577)
-0.4680*** (-3.625)
-0.3556*** (-2.928)
-0.3489*** (-2.911)
Unionisation*Skills -0.4879** (-2.211)
-0.5612** (-2.242)
-0.5058** (-2.141)
-0.5134** (-2.193)
Concentration*EPL* Bank Finance
0.0722*** (2.790)
0.0926*** (3.304)
0.0558** (2.413)
0.052** (2.271)
Concentration*Bank Finance
-0.0295*** (-3.677)
-0.0322*** (-3.974)
-0.0231*** (-3.371)
-0.0223*** (-3.340)
EPL*Bank Finance -0.0414** (-2.064)
-0.0645*** (-2.973)
-0.0278 (-1.514)
-0.0248 (-1.369)
Dispersion*(1-Unionisation)*Equity
0.5321*** (3.877)
0.4550*** (3.134)
0.486*** (3.854)
0.4746*** (3.852)
Dispersion*Equity -0.3072*** (-3.881)
-0.2726*** (-3.241)
-0.1918*** (-3.153)
-0.1876*** (-3.198)
(1-Unionisation)* Equity
-0.1085*** (-3.486)
-0.1059*** (-2.724)
-0.3833*** (-3.489)
-0.3612*** (-3.423)
Observations 460 363 463 348 279 275 Adjusted R2 0.0987 0.0671 0.0439 0.1490 0.2121 0.2294 RESET 0.23 0.97 0.77 0.98 0.19 0.36 F [p-value]
F(4.455)=14.66 [0.0000]
F(4.358)=9.48 [0.0000]
F(4.458)=9.01 [0.0000]
F(10.337)=7.66 [0.0000]
F(11.267)=8.36 [0.0000]
F(12.262)=8.85 [0.0000]
Joint significance of IC variables
13.41*** 11.39*** 12.52***

23
Table 11: Industry characteristics The table reports the three industry characteristics that have been used in the above regressions. Column 2 represents the rate of investments financed by net equity of US enterprises during the 1980’s as published by Rajan and Zingales (1998). The third column indicates the average rate of physical investment financed by bank credits in Japanese firms as reported by Carlin and Mayer (1999) (n.a.=not available). The last column represents the rate of skilled to total workers in German industries in 1987 (Oulton, 1996). Moreover, the table reports the correlation between the three industry characteristics (significance levels in parentheses). Note the positive (but non-significant) correlation between the degree of equity finance and the degree of bank finance, as well as the positive (but again non-significant) correlation between skills and equity finance.
Industry Equity finance Bank finance Skills Food 0 0.52 0.658 Beverages 0 0.52 0.745 Tobacco -0.08 0.52 0.619 Textiles 0.01 0.86 0.593 Clothing 0 1.49 0.646 Leather &Products 0 n.a. 0.586 Footwear 0.04 n.a. 0.586 Wood Products 0.04 1.78 0.724 Furnitures & Fixtures 0.01 n.a. 0.724 Paper & Products 0.02 0.68 0.628 Printing & Publishing 0.03 0.80 0.771 Industrial Chemicals 0.07 0.04 0.758 Other Chemicals 0.02 0.04 0.758 Petroleum & Coal Products 0.06 n.a. 0.769 Rubber Products 0.11 n.a. 0.641 Plastic Products, nec 0.26 n.a. 0.641 Pottery, China etc 0.11 0.63 0.623 Glass & Products 0.02 0.63 0.623 Non-Metallic Products, nec 0.01 0.63 0.707 Iron & Steel 0.01 -1.01 0.691 Non-Ferrous Metals 0.02 0.11 0.655 Metal Products 0.02 1.03 0.703 Non-Electrical Machinery 0.11 0.81 0.791 Electrical Machinery 0.36 0.37 0.732 Shipbuilding & Repairing 0.02 -3.41 0.843 Motor Vehicles 0.01 0.39 0.723 Professional Goods 0.62 0.72 0.737
Correlation matrix Equity
finance Bank finance
Skills
Equity finance
1.000
Bank finance
0.0734 (0.7473)
1.000
Skills 0.1717 (0.3949)
-0.4551 (0.0387)
1.000

24
Table 12: Financial market characteristics The table presents the financial market data used for the empirical analysis. Column 2 presents the number of accounting standards on a scale from 0 to 90 reported in Rajan and Zingales (1998) from a survey conducted by the Center for International Financial Analysis and Research normalized to lie in the range 0 to 1 by dividing by 90. Column 3 is the proportion of total equity market capitalization in different countries held by banks. Column 4, shows 1 minus percentage of widely held of the 20 largest publicly traded firms in 1995, reported in La Porta et al. (1998). Column 5 reports market capitalization (reported in the IFC Emerging Stock Market Factbook 1992) to GDP ratios averaged over the period 1982 to 1991. The last column represents bank credit (reported in IMF International Financial Statistics) to GDP ratios averaged over the period 1980 to 1990.
Country Accounting Standards
Equity owned by banks
Ownership concentration
Stock market capitalization
Credit as % of GDP
Australia 0.833 0.042 0.45 0.472 0.357 Austria 0.600 n.a. 0.95 0.078 0.828 Belgium 0.678 0.057 1.00 0.267 0.298 Canada 0.822 0.080 0.50 0.444 0.471 Denmark 0.689 n.a. 0.90 0.231 0.477 Finland 0.856 0.150 0.85 0.152 0.653 France 0.767 0.064 0.70 0.187 0.817 Germany 0.689 0.136 0.65 0.201 0.856 Greece 0.611 n.a. 0.95 0.074 0.314 Italy 0.689 0.057 0.85 0.125 0.520 Japan 0.722 0.232 0.50 0.853 1.018 Netherlands 0.711 0.053 0.70 0.401 0.709 New Zealand 0.778 0.000 0.95 0.386 0.284 Norway 0.822 0.082 0.95 0.142 0.473 Portugal 0.711 n.a. 1.00 0.085 0.562 Spain 0.567 0.095 0.85 0.179 0.684 Sweden 0.922 0.000 1.00 0.395 0.456 UK 0.867 0.017 0.10 0.751 0.422 USA 0.789 0.004 0.20 0.563 0.687
Correlation matrix Accounting
standards Equity owned
by banks Ownership
concentration Market
capitalisation Credit as % of
GDP Accounting standards
1.000
Equity owned by banks
-0.3279 1.000
Ownership concentration
-0.3909 0.1257 1.000
Market capitalisation
0.4720 0.0578 -0.7888 1.000
Credit as % of GDP
-0.1068 0.6566 -0.2272 0.2338 1.000

25
Table 13: Labour market characteristics The table reports the data concerning the labour market characteristics in country sample set. Column 2 reports the labour turnover measured as the percentage of workers employed for less than a year, the indicated ratio is an average between 1979 and 1991 (OECD, 1993). The third column reproduces the indicator for institutional flexibility as calculated by Fitoussi and Passet (2000, p. 36). This indicator contains: the flexibility to adjust employment, the flexibility to adjust overtime, and the flexibility to adjust wages; the indicator varies between 0 and 6. Column 4 reports the average number of unionised workers related to the overall active population between 1975 and 1993. This ratio has been calculated using data published by Huber, Ragin, and Stephens (1997) and Visser (1996). The fifth column gives the rate of collective coverage, averaged over the period between 1980 and 1994 as published in OECD (1997). The next column represents the employment protection legislation, indicating administrative measures, such as firing costs, overtime restrictions and restriction for the use of temporary workers (Nicoletti, Scarpetta and Boylaud, 1999). The last three indicators report the degree of coordination among bargaining units, reflected by the level of bargaining (centralisation), implicit coordination of decentralised units (centralisation) and the interaction with the political sphere (corporatism) as published in OECD (1997).
Country Labour turnover
Inst. flexibility Unionisation Collective
coverage EPL Coordi-nation
Corpo-ratism
Centrali-sation
Australia 23.63 4.5 48.3 84 1.06 1.5 1 1 Austria n.a. 2 50.7 98 2.39 3 3 2 Belgium n.a. 1 52.8 90 2.09 2 2 2 Canada 25.90 6 36.5 36.5 0.64 1 1 1 Denmark n.a. 3.5 74.5 69 1.49 2.2 3 2 Finland 17.38 2.5 70.5 95 2.09 2 2 2 France 14.40 2.5 15.4 90 3.08 2 2 2 Germany 13.17 2 34.5 91.5 2.78 3 3 2 Greece n.a. 2 n.a. n.a. 3.53 3 3 2 Italy n.a. 2 42.2 83.5 4.15 3 3 3 Japan 9.80 3 27.2 24.5 2.65 3 1 1 Netherlands 17.85 2 34.3 78.5 2.36 3 3 2 New Zealand n.a. 5 41.2 49 1.03 1 1 1
Norway n.a. 1.5 52.8 74.5 2.89 3 3 3 Portugal n.a. 3 n.a. n.a. 3.75 2 2 2 Spain 19.55 2 n.a. n.a. 3.21 2 2 2 Sweden n.a. n.a. 80.7 87.5 2.43 2 2 2 UK 19.37 5.5 46.2 58.5 0.51 1 1 1 USA 29.18 6 20.6 22 0.22 1 1 1
Correlation matrix
Labour turnover
Inst. flexibility Unionisation Collective
coverage EPL Coordi-nation
Corpo-ratism
Centrali-sation
Labour turnover
1.000
Inst. Flexibility 0.7491 (0.0126)
1.000
Unionisation 0.0336 (0.9267)
-0.1251 (0.6324)
1.000
Collective coverage
-0.2629 (0.4943)
-0.6342 (0.0111)
0.4683 (0.0673)
1.000
EPL -0.7834 (0.0073)
-0.8103 (0.000)
-0.1488 (0.556)
0.4306 (0.096)
1.000
Coordination -0.8091 (0.005)
-0.8270 (0.000)
0.0605 (0.811)
0.3894 (0.136)
0.7589 (0.000)
1.000
Corporatism -0.4502 (0.192)
-0.7652 (0.000)
0.2582 (0.301)
0.6030 (0.013)
0.6480 (0.003)
0.8043 (0.000)
1.000
Centralisation -0.4555 (0.186)
-0.7966 (0.000)
0.2533 (0.311)
0.5591 (0.024)
0.7539 (0.000)
0.6795 (0.001)
0.8523 (0.000)
1.000