FINANCIAL STATEMENTS - nestle.pk · We have audited the annexed balance sheet of Nestlé Pakistan...
64
FINANCIAL STATEMENTS FOR THE YEAR ENDED 31 DECEMBER 2017 73 Values Rooted in Respect
Transcript of FINANCIAL STATEMENTS - nestle.pk · We have audited the annexed balance sheet of Nestlé Pakistan...
FINANCIAL STATEMENTSFOR THE YEAR ENDED 31 DECEMBER 2017
73Values Rooted in Respect

74 Nestlé Pakistan Limited

Auditors’ Report to the Members
We have audited the annexed balance sheet of Nestlé Pakistan Limited (the Company) as at 31 December 2017 and the
related profit and loss account, statement of comprehensive income, cash flow statement and statement of changes in equity
together with the notes forming part thereof, for the year then ended and we state that we have obtained all the information
and explanations which, to the best of our knowledge and belief, were necessary for the purposes of our audit.
It is the responsibility of the Company’s management to establish and maintain a system of internal control, and prepare
and present the above said statements in conformity with the approved accounting standards and the requirements of the
Companies Ordinance, 1984. Our responsibility is to express an opinion on these statements based on our audit.
We conducted our audit in accordance with the auditing standards as applicable in Pakistan. These standards require that we
plan and perform the audit to obtain reasonable assurance about whether the above said statements are free of any material
misstatement. An audit includes examining, on a test basis, evidence supporting the amounts and disclosures in the above
said statements. An audit also includes assessing the accounting policies and significant estimates made by management,
as well as, evaluating the overall presentation of the above said statements. We believe that our audit provides a reasonable
basis for our opinion and, after due verification, we report that:
a) in our opinion, proper books of account have been kept by the Company as required by the Companies Ordinance, 1984;
(b) in our opinion:
i) the balance sheet and profit and loss account together with the notes thereon have been drawn up in conformity
with the Companies Ordinance, 1984, and are in agreement with the books of account and are further in accordance
with accounting policies consistently applied, except for the change as indicated in note 2.3.1 to the financial
statements with which we concur;
(ii) the expenditure incurred during the year was for the purpose of the Company’s business; and
(iii) the business conducted, investments made and the expenditure incurred during the year were in accordance with
the objects of the Company;
c) in our opinion and to the best of our information and according to the explanations given to us, the balance sheet,
profit and loss account, statement of comprehensive income, cash flow statement and statement of changes in equity
together with the notes forming part thereof conform with approved accounting standards as applicable in Pakistan, and,
give the information required by the Companies Ordinance, 1984, in the manner so required and respectively give a true
and fair view of the state of the Company’s affairs as at 31 December 2017 and of the profit, its comprehensive income,
its cash flows and changes in equity for the year then ended; and
(d) in our opinion, Zakat deductible at source under the Zakat and Ushr Ordinance, 1980 was deducted by the Company and
deposited in the Central Zakat Fund established under section 7 of that Ordinance.
KPMG Taseer Hadi & Co.
Chartered Accountants
(Bilal Ali)
Lahore: February 21, 2018
75Values Rooted in Respect
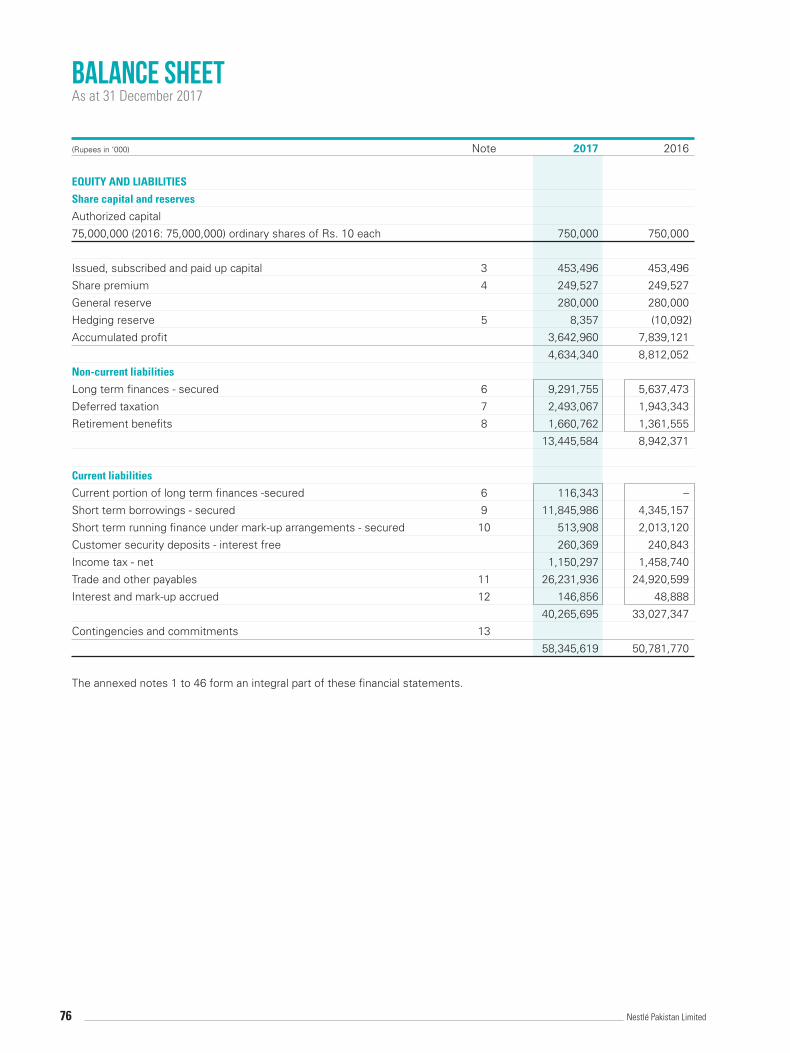
(Rupees in ‘000) Note 2017 2016
EQUITY AND LIABILITIES
Share capital and reserves
Authorized capital
75,000,000 (2016: 75,000,000) ordinary shares of Rs. 10 each 750,000 750,000
Issued, subscribed and paid up capital 3 453,496 453,496
Share premium 4 249,527 249,527
General reserve 280,000 280,000
Hedging reserve 5 8,357 (10,092)
Accumulated profit 3,642,960 7,839,121
4,634,340 8,812,052
Non-current liabilities
Long term finances - secured 6 9,291,755 5,637,473
Deferred taxation 7 2,493,067 1,943,343
Retirement benefits 8 1,660,762 1,361,555
13,445,584 8,942,371
Current liabilities
Current portion of long term finances -secured 6 116,343 –
Short term borrowings - secured 9 11,845,986 4,345,157
Short term running finance under mark-up arrangements - secured 10 513,908 2,013,120
Customer security deposits - interest free 260,369 240,843
Income tax - net 1,150,297 1,458,740
Trade and other payables 11 26,231,936 24,920,599
Interest and mark-up accrued 12 146,856 48,888
40,265,695 33,027,347
Contingencies and commitments 13
58,345,619 50,781,770
The annexed notes 1 to 46 form an integral part of these financial statements.
Balance SheetAs at 31 December 2017
76 Nestlé Pakistan Limited

(Rupees in ‘000) Note 2017 2016
ASSETS
Non-current assets
Property, plant and equipment 14 28,734,507 28,046,124
Capital work-in-progress 15 4,059,585 2,765,730
Intangible assets 16 23,532 31,600
Long term loans and advances 17 367,359 338,449
Long term deposits and prepayments 18 36,147 32,046
33,221,130 31,213,949
Current assets
Stores and spares 19 1,769,987 1,308,329
Stock in trade 20 15,358,288 11,207,230
Trade debts 21 781,116 564,460
Current portion of long term loans and advances 17 135,248 98,565
Sales tax refundable - net 4,477,768 5,374,745
Advances, deposits, prepayments and other receivables 22 1,268,098 661,325
Cash and bank balances 23 1,333,984 353,167
25,124,489 19,567,821
58,345,619 50,781,770
Balance SheetAs at 31 December 2017
JOHN MICHAEL DAVIS BRUNO BORIS OLIERHOEK SYED YAWAR ALI Chief Financial Officer Chief Executive Chairman
77Values Rooted in Respect
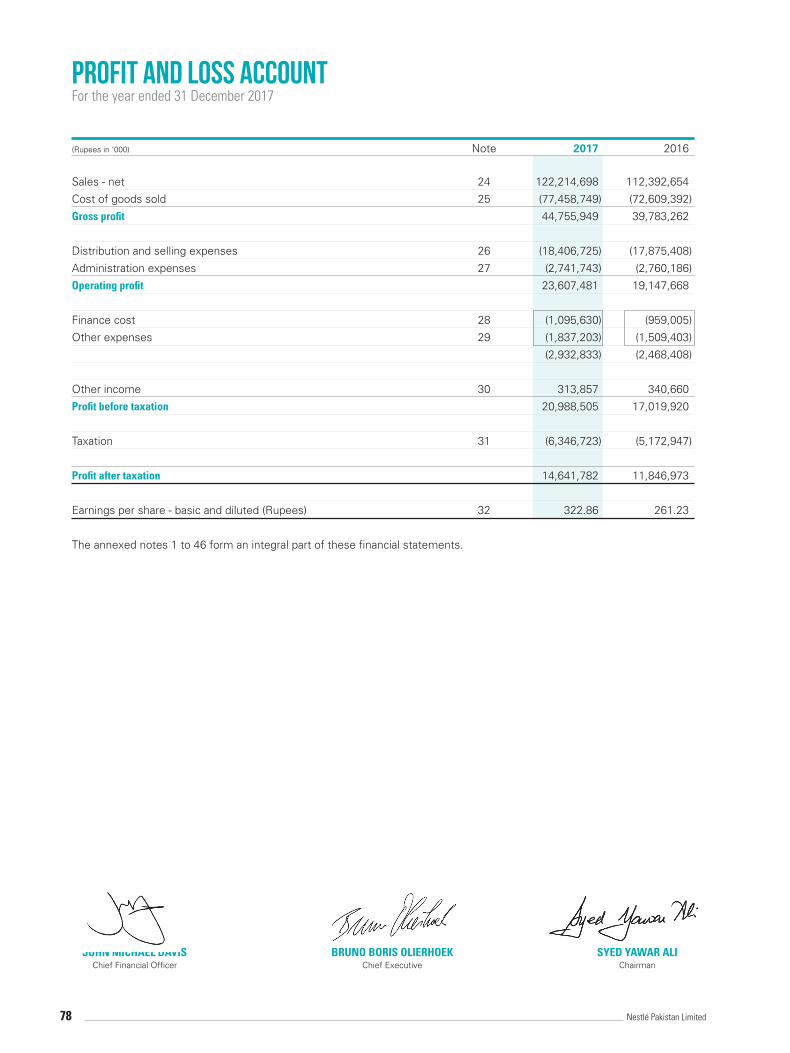
(Rupees in ‘000) Note 2017 2016
Sales - net 24 122,214,698 112,392,654
Cost of goods sold 25 (77,458,749) (72,609,392)
Gross profit 44,755,949 39,783,262
Distribution and selling expenses 26 (18,406,725) (17,875,408)
Administration expenses 27 (2,741,743) (2,760,186)
Operating profit 23,607,481 19,147,668
Finance cost 28 (1,095,630) (959,005)
Other expenses 29 (1,837,203) (1,509,403)
(2,932,833) (2,468,408)
Other income 30 313,857 340,660
Profit before taxation 20,988,505 17,019,920
Taxation 31 (6,346,723) (5,172,947)
Profit after taxation 14,641,782 11,846,973
Earnings per share - basic and diluted (Rupees) 32 322.86 261.23
The annexed notes 1 to 46 form an integral part of these financial statements.
Profit and Loss AccountFor the year ended 31 December 2017
JOHN MICHAEL DAVIS BRUNO BORIS OLIERHOEK SYED YAWAR ALI Chief Financial Officer Chief Executive Chairman
78 Nestlé Pakistan Limited

(Rupees in ‘000) 2017 2016
Profit after taxation 14,641,782 11,846,973
Other Comprehensive Income
Items that are or may be classified subsequently to profit and loss:
Cash flow hedges - effective portion of changes in fair value 31,154 (17,967)
Related tax (12,705) 5,147
18,449 (12,820)
Items that will never be reclassified to profit and loss:
Remeasurement of net retirement benefit liability
recognised directly in the equity (349,793) (20,660)
Related tax 105,179 6,405
(244,614) (14,255)
Total comprehensive income for the year 14,415,617 11,819,898
The annexed notes 1 to 46 form an integral part of these financial statements.
Statement of Comprehensive IncomeFor the year ended 31 December 2017
JOHN MICHAEL DAVIS BRUNO BORIS OLIERHOEK SYED YAWAR ALI Chief Financial Officer Chief Executive Chairman
79Values Rooted in Respect

Cash Flow StatementFor the year ended 31 December 2017
(Rupees in ‘000) Note 2017 2016
Cash flow from operating activities
Cash generated from operations 34 21,925,820 29,534,835
(Increase) / decrease in long term deposits and prepayments (4,101) 11,628
Increase in long term loans and advances (65,593) (62,040)
Increase in customer security deposits - interest free 19,526 19,538
Sales tax refundable - net 896,977 421,867
Retirement benefits paid (423,487) (387,921)
Workers’ profit participation fund paid (11,916) (895,145)
Workers’ welfare fund paid (323,560) (264,986)
Income taxes paid (6,012,968) (5,622,752)
Net cash generated from operating activities 16,000,698 22,755,024
Cash flow from investing activities
Fixed capital expenditure (5,457,179) (4,080,255)
Sale proceeds of property, plant and equipment 250,451 560,991
Net cash used in investing activities (5,206,728) (3,519,264)
Cash flow from financing activities
Finance cost paid (997,662) (993,638)
Long term finances - net 3,770,625 (3,410,127)
Short term borrowings - net 7,500,829 1,345,157
Dividend paid (18,587,733) (15,628,724)
Net cash used in financing activities (8,313,941) (18,687,332)
Net increase in cash and cash equivalents 2,480,029 548,428
Cash and cash equivalents at beginning of the year (1,659,953) (2,208,381)
Cash and cash equivalents at end of the year 35 820,076 (1,659,953)
The annexed notes 1 to 46 form an integral part of these financial statements.
JOHN MICHAEL DAVIS BRUNO BORIS OLIERHOEK SYED YAWAR ALI Chief Financial Officer Chief Executive Chairman
80 Nestlé Pakistan Limited

Capital reserves Revenue reserves
Share Share Hedging General Accumulated
(Rupees in ‘000) capital premium reserve reserve profit Total
Balance as at 1 January 2016 453,496 249,527 2,728 280,000 11,652,011 12,637,762
Total comprehensive income for the year
Profit after taxation – – – – 11,846,973 11,846,973
Cash flow hedges - effective portion of
changes in fair value (net of tax) – – (12,820) – – (12,820)
Remeasurement of net retirement benefits
liability (net of tax) – – – – (14,255) (14,255)
– – (12,820) – 11,832,718 11,819,898
Transaction with owners, directly recognised
in equity
Final dividend for the year ended 31 December
2015 (Rs. 90 per share) – – – – (4,081,463) (4,081,463)
Interim dividend for the six months period ended
30 June 2016 (Rs. 70 per share) – – – – (3,174,472) (3,174,472)
Interim dividend for the nine months period ended
30 September 2016 (Rs. 185 per share) – – – – (8,389,673) (8,389,673)
Balance as at 31 December 2016 453,496 249,527 (10,092) 280,000 7,839,121 8,812,052
Total comprehensive income for the year
Profit after taxation – – – – 14,641,782 14,641,782
Cash flow hedges - effective portion of
changes in fair value (net of tax) – – 18,449 – – 18,449
Remeasurement of net retirement benefits
liability (net of tax) – – – – (244,614) (244,614)
– – 18,449 – 14,397,168 14,415,617
Transaction with owners, directly
recognised in equity
Final dividend for the year ended 31
December 2016 (Rs. 170 per share) – – – – (7,709,429) (7,709,429)
Interim dividend for the six months period
ended 30 June 2017 (Rs. 170 per share) – – – – (7,709,429) (7,709,429)
Interim dividend for the nine months period
ended 30 September 2017 (Rs. 70 per share) – – – – (3,174,471) (3,174,471)
Balance as at 31 December 2017 453,496 249,527 8,357 280,000 3,642,960 4,634,340
The annexed notes 1 to 46 form an integral part of these financial statements.
Statement of Changes in EquityFor the year ended 31 December 2017
JOHN MICHAEL DAVIS BRUNO BORIS OLIERHOEK SYED YAWAR ALI Chief Financial Officer Chief Executive Chairman
81Values Rooted in Respect

1 Legal status and nature of business
Nestlé Pakistan Limited (“the Company”) is a public limited company incorporated in Pakistan and its shares are quoted on Pakistan Stock Exchange. The principal activity of the Company is manufacturing, processing and sale of food products including imported products (dairy, confectionery, culinary, coffee, beverages, infant nutrition and drinking water). Registered office of the Company is situated at Babar Ali Foundation Building, 308-Upper Mall, Lahore.
2 Basis of preparation and summary of significant accounting policies
2.1 Statement of compliance
These financial statements have been prepared in accordance with approved accounting standards as applicable in Pakistan. Approved accounting standards comprise of such International Financial Reporting Standards (IFRS’s) issued by the International Accounting Standards Board and Islamic Financial Accounting Standards (IFAS’s) issued by the Institute of Chartered Accountants of Pakistan as are notified under the repealed Companies Ordinance, 1984, provisions of and directives issued under the repealed Companies Ordinance, 1984. In case requirements differ, the provisions of, or directives issued under the repealed Companies Ordinance, 1984 shall prevail.
On 30 May 2017 the Companies Act, 2017 was enacted which replaced and repealed the Companies Ordinance,
1984 (“the repealed Ordinance”). However the Securities and Exchange Commission of Pakistan, in continuation to its circular 17 dated 20 July 2017 and press release of the same date, vide its circular no. 23 of 2017 dated 04 October 2017 has clarified that the companies whose financial year closes on or before 31 December 2017 shall prepare their financial statements in accordance with the provisions of the repealed Ordinance.
2.2 Accounting convention
These financial statements have been prepared under the historical cost convention, except for recognition of certain employee benefits at present value and recognition of certain financial instruments at fair value.
The preparation of financial statements in conformity with approved accounting standards requires management
to make judgments, estimates and assumptions that affect the application of policies and reported amounts of assets and liabilities, income and expenses. The estimates and associated assumptions and judgments are based on historical experience and various other factors that are believed to be reasonable under the circumstances, the result of which form the basis of making the judgments about carrying values of assets and liabilities that are not readily apparent from other sources. Actual results may differ from these estimates.
The estimates and underlying assumptions are reviewed on an ongoing basis. Revision to accounting estimates
are recognised in the period in which the estimate is revised if the revision affects only that period, or in the period of revision and future periods if the revision affects both current and future periods. The areas where various assumptions and estimates are significant to the Company’s financial statements or where judgments were exercised in application of accounting policies are as follows:
Note • Impairment losses 2.3.7 • Taxation 2.3.8 • Retirement benefits 2.3.9 • Provisions and contingencies 2.3.13 • Useful life of depreciable assets 2.3.14 • Store and spares 2.3.15 • Stock in trade 2.3.15 • Recoverability of trade debts and other receivables 2.3.16
NOTES TO THE FINANCIAL STATEMENTSFOR THE YEAR ENDED 31 DECEMBER 2017
82 Nestlé Pakistan Limited

2.3 Summary of significant accounting policies
The significant accounting policies adopted in preparation of these financial statements are set out below and have been applied consistently to all periods presented in these financial statements, except as mentioned in note 2.3.1 below:
2.3.1 The Company has changed its accounting policy for valuation of inventories i.e. for goods purchased for resale with
effect from 01 January 2017. Previously, in recognising the consumption and valuation of goods purchased for resale, the Company used First In First Out (FIFO) basis, however, the Company has now adopted the weighted average basis for recognizing consumption and valuation as the management considers that this change gives a better presentation of the results and financial position of the Company. This change in accounting policy has been applied prospectively in accordance with International Accounting Standard 8 (IAS-8) “Accounting Policies, Changes in Accounting Estimates and Errors” as resulting impact is considered to be immaterial.
2.3.2 Business combination
Business combinations are accounted for using the acquisition method. Under this method, as of the acquisition date, the Company recognised separately from goodwill the identified assets acquired, the liabilities assumed and any non-controlling interest in the acquiree. The Company measures the identifiable assets acquired and the liabilities assumed at their acquisition date fair values. Goodwill is recognised as the excess of cost of an acquisition over the fair value of net identifiable assets acquired in the business combination. Any goodwill that arises is tested annually for impairment.
2.3.3 Financial instruments
All financial assets and liabilities are recognised at the time when the Company becomes a party to the contractual provisions of the instrument. Financial assets are de-recognised when the Company loses control of the contractual right that comprise the financial assets. Financial liabilities are de-recognised when they are extinguished i.e. when the obligation specified in the contract is discharged, cancelled or expired. Any gain or loss on de-recognition of the financial assets and financial liabilities is taken to profit and loss account currently. The particular measurement methods adopted are disclosed in the individual policy statements associated with each item.
2.3.4 Derivative financial instruments and hedge accounting
Derivatives are recognised initially at fair value, any directly attributable transaction costs are recognised in profit or loss as they are incurred. Subsequent to initial recognition, derivatives are measured at fair value, and changes therein are generally recognised in profit and loss account.
The Company also holds derivative financial instruments to hedge its foreign currency exposures. Embedded
derivatives are separated from the host contract and accounted for separately if certain criteria are met.
Fair value hedge
Derivatives which are designated and qualify as fair value hedge, changes in the fair value of such derivatives are recorded in the profit and loss account, together with any changes in the fair value of the hedged asset or liability that are attributable to the hedged risk.
Cash flow hedges
When a derivative is designated as cash flow hedging instrument, the effective portion of changes in the fair value of the derivative is recognised in other comprehensive income and accumulated in the hedging reserve. Any ineffective portion of changes in the fair value of the derivative is recognised immediately in profit or loss.
NOTES TO THE FINANCIAL STATEMENTSFOR THE YEAR ENDED 31 DECEMBER 2017
83Values Rooted in Respect

The amount accumulated in equity is retained in other comprehensive income and reclassified to profit or loss in the same period or periods during which the hedged item affects profit or loss.
If the hedging instrument no longer meets the criteria for hedge accounting, expires or is sold, terminated or
exercised, or the designation is revoked, then hedge accounting is discontinued prospectively. If the forecast transaction is no longer expected to occur, then the amount accumulated in equity is reclassified to profit or loss.
2.3.5 Financial liabilities
Financial liabilities are classified according to substance of contractual arrangements entered into. Significant financial liabilities include short and long term borrowings, trade and other payables, interest free customer security deposits and interest and markup accrued.
Interest bearing borrowings
Interest bearing borrowings are recognised initially at fair value less attributable transaction cost, if any. Subsequent to initial recognition, these are stated at amortized cost with any difference between cost and redemption value being recognised in the profit and loss over the period of the borrowings on an effective interest basis.
Other financial liabilities
All other financial liabilities are initially recognised at fair value minus directly attributable cost, if any, and subsequently at amortized cost using effective interest rate method.
2.3.6 Offsetting of financial assets and financial liabilities
A financial asset and a financial liability is offset and the net amount is reported in the balance sheet if the Company has a legally enforceable right to set-off the recognised amounts and intends either to settle on a net basis or to realize the asset and settle the liability simultaneously.
2.3.7 Impairment losses
Financial assets
A financial asset is considered to be impaired if objective evidence indicate that one or more events had a negative effect on the estimated future cash flow of that asset.
An impairment loss in respect of a financial asset measured at amortized cost is calculated as a difference between
its carrying amount and the present value of the estimated future cash flows discounted at the original effective interest rate. An impairment loss in respect of an available-for-sale financial asset is calculated by reference to its current fair value.
Individually significant financial assets are tested for impairment on an individual basis. The remaining financial
assets are assessed collectively in groups that share similar credit risk characteristics. Non financial assets
The carrying amounts of the Company’s non-financial assets, other than inventories and deferred tax assets, are reviewed at each reporting date to determine whether there is any indication of impairment. If any such indication exists then the asset’s recoverable amount is estimated. For goodwill and intangible assets that have indefinite lives or that are not yet available for use, recoverable amount is estimated at each reporting date.
An impairment loss is recognised if the carrying amount of an asset or its cash-generating unit exceeds its recoverable
amount. A cash-generating unit is the smallest identifiable asset group that generates cash flows that largely are independent from other assets and groups.
NOTES TO THE FINANCIAL STATEMENTSFOR THE YEAR ENDED 31 DECEMBER 2017
84 Nestlé Pakistan Limited

Impairment losses are recognised in profit and loss. Impairment losses recognised in respect of cash-generating units are allocated first to reduce the carrying amount of any goodwill allocated to the units and then to reduce the carrying amount of the other assets of the unit on a pro-rata basis. Impairment losses on goodwill shall not be reversed.
2.3.8 Taxation
Income tax on the profit or loss for the year comprises current and deferred tax. Current
Provision of current tax is based on the taxable income for the year determined in accordance with the prevailing law for taxation of income. The charge for current tax is calculated using prevailing tax rates or tax rates expected to apply to the profit for the year if enacted after taking into account tax credits, rebates and exemptions, if any. The charge for current tax also includes adjustments, where considered necessary, to provision for tax made in previous years arising from assessments framed during the year for such years.
Deferred
Deferred tax is provided using the balance sheet liability method in respect of all temporary differences arising from differences between the carrying amount of assets and liabilities in the financial statements and the corresponding tax bases used in the computation of the taxable profit. Deferred tax liabilities are generally recognised for all taxable temporary differences and deferred tax assets are recognised to the extent that it is probable that taxable profits will be available against which the deductible temporary differences, unused tax losses and tax credits can be utilized.
The carrying amount of deferred tax asset is reviewed at each balance sheet date and reduced to the extent that it
is no longer probable that sufficient taxable profit will be available to allow all or part of the deferred tax asset to be utilized.
Deferred tax assets and liabilities are calculated at the rates that are expected to apply to the period when the asset is realized or the liability is settled, based on the tax rates (and tax laws) that have been enacted or substantively enacted by the balance sheet date. In this regard, the effects on deferred taxation of the proportion of income that is subject to final tax regime is also considered in accordance with the treatment prescribed by the Institute of Chartered Accountants of Pakistan. Deferred tax is charged or credited in the profit and loss account, except in the case of items credited or charged to equity in which case it is included in equity.
2.3.9 Retirement benefits
Defined benefit plan
The Company’s net obligation in respect of defined benefit plans is calculated separately for each plan by estimating the amount of future benefits that employees have earned in current and prior periods, discounting that amount and deducting the fair value of any plan assets.
The calculation of defined benefit obligation is performed annually by a qualified actuary using the projected unit
credit method. When calculation results in a potential assets for the Company, the recognised asset is limited to the present value of economic benefits available in the form of any future refunds from the plan or reduction in future contributions to the plan.
Remeasurement of net defined benefit liability, which comprise of actuarial gains and losses, the return on plan
assets (excluding interest) and the effect of the asset ceiling (if any, excluding interest) are recognised immediately in other comprehensive income. The Company determines net interest expense/(income) on the defined benefit obligation for the period by applying the discount rate used to measure the defined benefit obligation at the beginning
NOTES TO THE FINANCIAL STATEMENTSFOR THE YEAR ENDED 31 DECEMBER 2017
85Values Rooted in Respect

of the annual period to then-net defined benefit, taking into account any change in the net defined benefit obligation during the period as a result of contributions and benefit payments. Net interest expense and other expenses related to defined benefit plans are recognised in profit and loss.
When the benefits of a plan are changed or when a plan is curtailed, the resulting change in benefit that relates to
past service or the gain or loss on curtailment is recognised immediately in profit or loss. The Company recognises gains and losses on the settlement of a defined benefit plan when the settlement occurs.
Defined contribution plan
The Company operates a recognised provident fund for all its regular employees, excluding expatriates. Equal monthly contributions are made to the fund both by the Company and the employees at the rate of 12% of the basic salary plus cost of living allowance. All regular employees are eligible for provident fund upon their confirmation. Obligation for contributions to defined contribution plan is recognised as an expense in the profit and loss account as and when incurred.
2.3.10 Leases
Operating leases
Leases where a significant portion of the risks and rewards of ownership are retained by the lessor are classified as operating leases. Payments made under operating leases (net of any incentives received from the lessor) are charged to the income statement on a straight-line basis over the period of lease.
2.3.11 Trade and other payables
Trade and other payables are initially recognised at fair value and subsequently at amortized cost using effective interest rate method. Exchange gains and losses arising on translation in respect of liabilities in foreign currency are added to the carrying amount of the respective liabilities.
2.3.12 Dividend
Dividend distribution to the Company’s shareholders is recognised as a liability in the Company’s financial statements in the period in which dividends are approved.
2.3.13 Provisions and contingencies
Provisions are recognised in the balance sheet when the Company has a legal or constructive obligation as a result of past events and it is probable that outflow of economic benefits will be required to settle the obligation and a reliable estimate of the amount can be made. However, provisions are reviewed at each balance sheet date and adjusted to reflect current best estimate. Where the outflow of resources embodying economic benefits is not probable, a contingent liability is disclosed, unless the possibility of outflow is remote.
2.3.14 Fixed capital expenditure and depreciation/amortization
Property, plant and equipment
Property, plant and equipment, except freehold land, are stated at cost less accumulated depreciation and any identified accumulated impairment loss. Freehold land is stated at cost less any identified impairment loss. Cost in relation to self constructed assets includes direct cost of material, labour, applicable manufacturing overheads and borrowing costs on qualifying assets.
Depreciation is charged to profit and loss account, unless it is included in the carrying amount of another asset, on straight
line method whereby cost of an asset is written off over its estimated useful life at the rates given in note 14.
NOTES TO THE FINANCIAL STATEMENTSFOR THE YEAR ENDED 31 DECEMBER 2017
86 Nestlé Pakistan Limited
Residual value and the useful life of an asset are reviewed at least at each financial year-end.
Depreciation on additions is charged from the month in which asset is capitalized / available for use, while no depreciation is charged for the month in which asset is disposed off. Where an impairment loss is recognised, the depreciation charge is adjusted in the future periods to allocate the assets revised carrying amount over its estimated useful life.
Subsequent costs are included in the asset’s carrying amount or recognized as a separate asset, as appropriate, only
when it is probable that future economic benefits associated with the item will flow to the Company and the cost of the item can be measured reliably. All other repair and maintenance costs are charged to income during the period in which they are incurred.
The gain or loss on disposal or retirement of an asset represented by the difference between the sale proceeds and the carrying amount of the asset is recognized as an income or expense.
Capital work-in-progress
Capital work-in-progress is stated at cost less identified impairment loss, if any. It consists of all expenditures and advances connected with specific assets incurred and made during installations and construction period. These are transferred to relevant property, plant and equipment as and when assets are available for use.
Intangible assets
Intangible assets are stated at cost less accumulated amortization and any identified accumulated impairment loss. These are amortized using the straight line method at the rates given in note 16. Amortization on additions is charged from the month in which an intangible asset is acquired, while no amortization is charged for the month in which intangible asset is disposed off.
Subsequent expenditure on intangible assets is capitalized only when it increases the future economic benefits
embodied in the specific asset to which it relates. All other expenditures are charged to income as and when incurred.
2.3.15 Inventories
Inventories are valued as per below mentioned valuation basis: Store and spares
Useable stores and spares except for in-transit, are valued principally at moving average method, while items considered obsolete are carried at nil value. Provision is made against slow moving or obsolete stores and spares on systematic basis.
Raw and packing material
Value in relation to raw and packing materials except for in transit is arrived at on FIFO basis. Provision for unusable raw and pack material is made on an estimated basis, wherever required.
Finished goods and work in process
Value of finished goods and work in process both manufactured and purchased, is determined on weighted average basis, except for in-transit goods. In-transit goods and materials are valued at cost comprising invoice value plus other charges thereon. Cost in relation to work-in-process and finished goods includes an appropriate portion of production overheads. Finished goods are valued at cost or net realizable value, whichever is lower. Net realizable value signifies the estimated selling price in the ordinary course of business less estimated costs of completion and cost necessary to be incurred in order to make a sale.
NOTES TO THE FINANCIAL STATEMENTSFOR THE YEAR ENDED 31 DECEMBER 2017
87Values Rooted in Respect

2.3.16 Trade debts and other receivables
Trade debts and other receivables are carried at original invoice amount less an estimate made for doubtful debts based on a review of all outstanding amounts at the year end. Bad debts are written off when become irrecoverable.
2.3.17 Revenue recognition
Revenue represents the fair value of the consideration received or receivable for goods sold, net of discounts and sales tax. Revenue is recognised when it is probable that the economic benefits associated with the transaction will flow to the Company and the amount of revenue, and the associated cost incurred, or to be incurred, can be measured reliably and there is no continuing management involvement with the goods. Sales of products and services are recorded when the risks and rewards are transferred.
Interest income is accrued on a time proportion basis by reference to the principal outstanding and the applicable rate of return.
2.3.18 Foreign currencies
All monetary assets and liabilities in foreign currencies are translated into rupees at exchange rates prevailing at the balance sheet date. Exchange gains and losses resulting from the settlement of such transactions and from the translations at the year end exchange rates of monetary assets and liabilities denominated in foreign currencies are taken to income currently. Non-monetary assets and liabilities that are measured in terms of historical cost in a foreign currency are translated into rupees at exchange rates prevailing at the date of transaction. Non-monetary assets and liabilities denominated in foreign currency that are stated at fair value are translated into rupees at exchange rates prevailing at the date when fair values are determined.
2.3.19 Borrowing cost
Borrowing costs are interest and other costs that the Company incurs in connection with the borrowing of funds. The Company capitalizes borrowing costs that are directly attributable to the acquisition, construction or production of qualifying assets as part of the cost of these assets. The Company recognizes other borrowing costs as an expense in the period in which it incurs.
2.3.20 Cash and cash equivalents
Cash and cash equivalents are carried in the balance sheet at cost. For the purpose of cash flow statement, cash and cash equivalents comprise cash in hand, demand deposits, other short term highly liquid investments that are readily convertible to known amounts of cash and which are subject to an insignificant risk of change in value and running finances that are repayable on demand.
2.3.21 Segment reporting
An operating segment is a component of the Company that engages in business activities from which it may earn revenues and incur expenses. All operating segments’ operating results are regularly reviewed by the Company’s Chief Executive to make decisions about resources to be allocated to the segment and assess their performance, and for which discrete financial information is available.
2.3.22 New laws / Standards and amendments to published approved International Financial Reporting Standards not yet effective
The Companies Act, 2017 applicable for financial year beginning on 1 January 2018 requires certain additional disclosures and Section 235 of the repealed Companies Ordinance, 1984 relating to treatment of surplus arising out of revaluation of assets has not been carried forward in the Companies Act, 2017. This would require change in accounting policy relating to surplus on revaluation of fixed assets to bring it in line with the requirements of IAS
NOTES TO THE FINANCIAL STATEMENTSFOR THE YEAR ENDED 31 DECEMBER 2017
88 Nestlé Pakistan Limited

16 – Property, plant and equipment. These amendments are not likely to have a significant impact on the Company’s financial statements except for the application of certain additional disclosures.
The following standards, amendments and interpretations of approved accounting standards will be effective for
accounting periods beginning on or after 01 January 2018:
– Classification and Measurement of Share-based Payment Transactions - amendments to IFRS 2 clarify the accounting for certain types of arrangements and are effective for annual periods beginning on or after 01 January 2018. The amendments cover three accounting areas (a) measurement of cash-settled share-based payments; (b) classification of share-based payments settled net of tax withholdings; and (c) accounting for a modification of a share-based payment from cash-settled to equity-settled. The new requirements could affect the classification and/or measurement of these arrangements and potentially the timing and amount of expense recognized for new and outstanding awards. The amendments are not likely to have an impact on Company’s financial statements.
– Transfers of Investment Property (Amendments to IAS 40 ‘Investment Property’ -effective for annual periods
beginning on or after 01 January 2018) clarifies that an entity shall transfer a property to, or from, investment property when, and only when there is a change in use. A change in use occurs when the property meets, or ceases to meet, the definition of investment property and there is evidence of the change in use. In isolation, a change in management’s intentions for the use of a property does not provide evidence of a change in use. The amendments are not likely to have an impact on Company’s financial statements.
– Annual Improvements to IFRSs 2014-2016 Cycle (Amendments to IAS 28 ‘Investments in Associates and Joint
Ventures’) (effective for annual periods beginning on or after 01 January 2018) clarifies that a venture capital organization and other similar entities may elect to measure investments in associates and joint ventures at fair value through profit or loss, for each associate or joint venture separately at the time of initial recognition of investment. Furthermore, similar election is available to non-investment entity that has an interest in an associate or joint venture that is an investment entity, when applying the equity method, to retain the fair value measurement applied by that investment entity associate or joint venture to the investment entity associate’s or joint venture’s interests in subsidiaries. This election is made separately for each investment entity associate or joint venture. The amendments are not likely to have an impact on Company’s financial statements.
– IFRIC 22 ‘Foreign Currency Transactions and Advance Consideration’ (effective for annual periods beginning
on or after 01 January 2018) clarifies which date should be used for translation when a foreign currency transaction involves payment or receipt in advance of the item it relates to. The related item is translated using the exchange rate on the date the advance foreign currency is received or paid and the prepayment or deferred income is recognized. The date of the transaction for the purpose of determining the exchange rate to use on initial recognition of the related asset, expense or income (or part of it) would remain the date on which receipt of payment from advance consideration was recognized. If there are multiple payments or receipts in advance, the entity shall determine a date of the transaction for each payment or receipt of advance consideration. The application of interpretation is not likely to have an impact on Company’s financial statements.
– IFRIC 23 ‘Uncertainty over Income Tax Treatments’ (effective for annual periods beginning on or after 01
January 2019) clarifies the accounting for income tax when there is uncertainty over income tax treatments under IAS 12. The interpretation requires the uncertainty over tax treatment be reflected in the measurement of current and deferred tax. The Company is currently in the process of analyzing the potential impact of changes (if any) on adoption of the standard.
– IFRS 15 ‘Revenue from contracts with customers’ (effective for annual periods beginning on or after 01
July 2018). IFRS 15 establishes a comprehensive framework for determining whether, how much and when
NOTES TO THE FINANCIAL STATEMENTSFOR THE YEAR ENDED 31 DECEMBER 2017
89Values Rooted in Respect
revenue is recognized. It replaces existing revenue recognition guidance, including IAS 18 ‘Revenue’, IAS 11 ‘Construction Contracts’ and IFRIC 13 ‘Customer Loyalty Programmes’. The Company is currently in the process of analyzing the potential impact of changes (if any) on adoption of the standard.
– IFRS 9 ‘Financial Instruments’ and amendment – Prepayment Features with Negative Compensation (effective for annual periods beginning on or after 01 July 2018 and 01 January 2019 respectively). IFRS 9 replaces the existing guidance in IAS 39 Financial Instruments: Recognition and Measurement. IFRS 9 includes revised guidance on the classification and measurement of financial instruments, a new expected credit loss model for calculating impairment on financial assets, and new general hedge accounting requirements. It also carries forward the guidance on recognition and derecognition of financial instruments from IAS 39. The Company is currently in the process of analyzing the potential impact (if any) of changes required in classification and measurement of financial instruments.
– Amendment to IAS 28 ‘Investments in Associates and Joint Ventures’ - Long Term Interests in Associates and
Joint Ventures (effective for annual period beginning on or after 01 January 2019). The amendment will affect companies that finance such entities with preference shares or with loans for which repayment is not expected in the foreseeable future (referred to as long-term interests or ‘LTI’). The amendment and accompanying example state that LTI are in the scope of both IFRS 9 and IAS 28 and explain the annual sequence in which both standards are to be applied. The amendments are not likely to have an impact on Company’s financial statements.
Annual improvements to IFRS standards 2015-2017 cycle. The new cycle of improvements addresses
improvements to following approved accounting standards: – IFRS 3 Business Combinations and IFRS 11 Joint Arrangement - the amendment aims to clarify the accounting
treatment when a company increases its interest in a joint operation that meets the definition of a business. A company remeasures its previously held interest in a joint operation when it obtains control of the business. A company does not remeasure its previously held interest in a joint operation when it obtains joint control of the business.
– IAS 12 Income Taxes - the amendment clarifies that all income tax consequences of dividends (including
payments on financial instruments classified as equity) are recognized consistently with the transaction that generates the distributable profits.
– IAS 23 Borrowing Costs - the amendment clarifies that a company treats as part of general borrowings any
borrowing originally made to develop an asset when the asset is ready for its intended use or sale.
The above amendments are effective from annual period beginning on or after 1 January 2019 and are not likely to have an impact on Company’s financial statements.
NOTES TO THE FINANCIAL STATEMENTSFOR THE YEAR ENDED 31 DECEMBER 2017
90 Nestlé Pakistan Limited

3 Issued, subscribed and paid up capital
2017 2016 2017 2016 (Number of shares) (Rupees in ‘000)
Ordinary shares of Rs. 10 each as
29,787,058 29,787,058 fully paid in cash 297,870 297,870
Ordinary shares of Rs. 10 each as
15,476,867 15,476,867 fully paid bonus shares 154,769 154,769
Ordinary shares of Rs. 10 each issued
85,659 85,659 for consideration other than cash 857 857
45,349,584 45,349,584 453,496 453,496
As at 31 December 2017, Nestlé S.A. Switzerland, the holding company, holds 26,778,229 (2016: 26,778,229) ordinary
shares representing 59.05% (2016: 59.05%) equity interest in the Company. In addition, 9,229,964 (2016: 9,229,786)
ordinary shares are held by the following related parties as at 31 December:
(Number of shares) 2017 2016
Name of related party:
IGI Insurance Limited 4,364,666 4,364,666
Percentage of equity held 9.62% (2016: 9.62%)
Packages Limited 3,649,248 3,649,248
Percentage of equity held 8.05% (2016: 8.05%)
Gurmani Foundation 538,235 538,235
Percentage of equity held 1.19% (2016: 1.19%)
Industrial Technical and Educational Institution 21,666 21,666
Percentage of equity held 0.05% (2016: 0.05%)
Zarai Taraqiati Bank Limited 430,551 430,551
Percentage of equity held 0.95% (2016: 0.95%)
National Management Foundation 224,720 224,720
Percentage of equity held 0.50% (2016: 0.50%)
Nestle’ Pakistan Limited Employees Provident Fund 878 700
Percentage of equity held 0.0019% (2016: 0.0015%)
9,229,964 9,229,786
4 Share premium
This reserve can be utilized by the Company only for the purposes specified in section 81(2) of the Companies Act, 2017.
5 Hedging reserve
The hedging reserve comprises the effective portion of the cash flow hedge which will subsequently be recognised in
the profit or loss as the hedged items affect profit or loss.
NOTES TO THE FINANCIAL STATEMENTSFOR THE YEAR ENDED 31 DECEMBER 2017
91Values Rooted in Respect
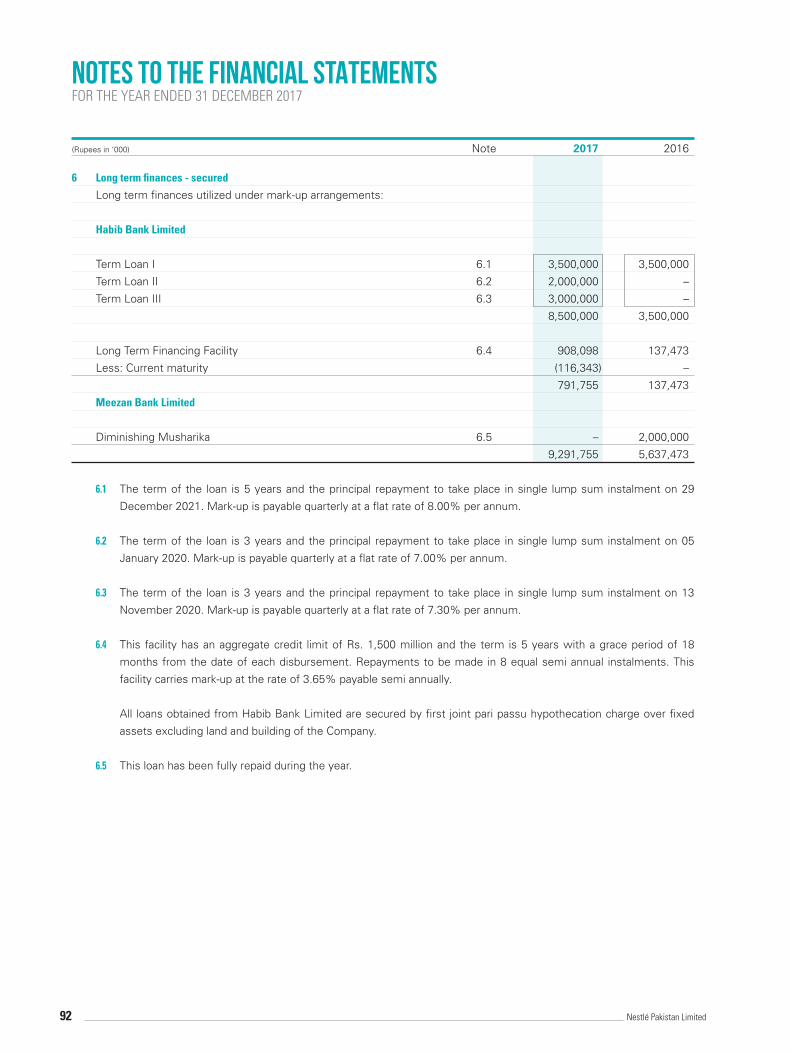
(Rupees in ‘000) Note 2017 2016
6 Long term finances - secured
Long term finances utilized under mark-up arrangements:
Habib Bank Limited
Term Loan I 6.1 3,500,000 3,500,000
Term Loan II 6.2 2,000,000 –
Term Loan III 6.3 3,000,000 –
8,500,000 3,500,000
Long Term Financing Facility 6.4 908,098 137,473
Less: Current maturity (116,343) –
791,755 137,473
Meezan Bank Limited
Diminishing Musharika 6.5 – 2,000,000
9,291,755 5,637,473
6.1 The term of the loan is 5 years and the principal repayment to take place in single lump sum instalment on 29
December 2021. Mark-up is payable quarterly at a flat rate of 8.00% per annum.
6.2 The term of the loan is 3 years and the principal repayment to take place in single lump sum instalment on 05
January 2020. Mark-up is payable quarterly at a flat rate of 7.00% per annum.
6.3 The term of the loan is 3 years and the principal repayment to take place in single lump sum instalment on 13
November 2020. Mark-up is payable quarterly at a flat rate of 7.30% per annum.
6.4 This facility has an aggregate credit limit of Rs. 1,500 million and the term is 5 years with a grace period of 18
months from the date of each disbursement. Repayments to be made in 8 equal semi annual instalments. This
facility carries mark-up at the rate of 3.65% payable semi annually.
All loans obtained from Habib Bank Limited are secured by first joint pari passu hypothecation charge over fixed
assets excluding land and building of the Company.
6.5 This loan has been fully repaid during the year.
NOTES TO THE FINANCIAL STATEMENTSFOR THE YEAR ENDED 31 DECEMBER 2017
92 Nestlé Pakistan Limited

(Rupees in ‘000) Note 2017 2016
7 Deferred taxation
Deferred taxation comprises of temporary differences related to:
Accelerated tax depreciation 3,271,827 3,156,763
Provisions and others (778,760) (1,213,420)
2,493,067 1,943,343
7.1 Movement in deferred tax liability is as follows:
Balance as at 01 January 1,943,343 2,271,523
Charge to OCI related to cash flow hedges 12,705 (5,147)
Charge to profit and loss account 31 537,019 (323,033)
Balance as at 31 December 2,493,067 1,943,343
8 Retirement benefits
Gratuity fund 8.1 984,867 698,864
Pension fund 8.1 675,895 662,691
1,660,762 1,361,555
The Company contributes to following defined benefit plans.
– Gratuity plan entitles an eligible employee to receive a lump sum amount equal to last drawn basic salary
multiplied by number of completed years of service with the Company at the time of cessation of employment.
An eligible employee means the employee who has successfully completed one year of service with the
Company. In case if the employee leaves the employment before successful completion of 10 years of service
than he/ she shall be entitled to 50% of gratuity amount.
– Pension plan comprises of two types i.e. Type A and Type B. Type A members are those members who have
joined the plan and who have not opted to become members of Type B. Type B members are those members
who fulfill the criteria and opted to become member of Type B.
– Type A members are required to make a contribution of 5% of pensionable salary whereas, the Company makes
the contribution based on actuarial recommendations. The annual benefit amount of a Type A member shall
be 2.75% of his/ her pensionable salary at the time of retirement multiplied by number of years of pensionable
service subject to a maximum of 82.5% of pensionable salary.
– Type B member can make a contribution of 3% or 5% of his/ her pensionable salary and the Company will
make a contribution equal to employee contribution +2%. In case of those members who are transferred from
Type A to Type B, such members are required to make a contribution of 5% of pensionable salary and the
Company will make a contribution of 11.4%. Type B member shall be entitled to 30% of employer benefit after
successful completion of three years of pensionable service and thereafter additional 10% for each successful
year till 10th year when he/ she entitles to 100% of the benefit.
Gratuity and pension plans are administered through separate funds that are legally separated from the Company.
The Trust of the funds comprises of six and five employees for pension and gratuity fund respectively, out of which
one employee is the Chair. The Trustees of the funds are required by law to act in the best interests of the plan
participants and are responsible for making all the investments and disbursements out of the funds.
NOTES TO THE FINANCIAL STATEMENTSFOR THE YEAR ENDED 31 DECEMBER 2017
93Values Rooted in Respect
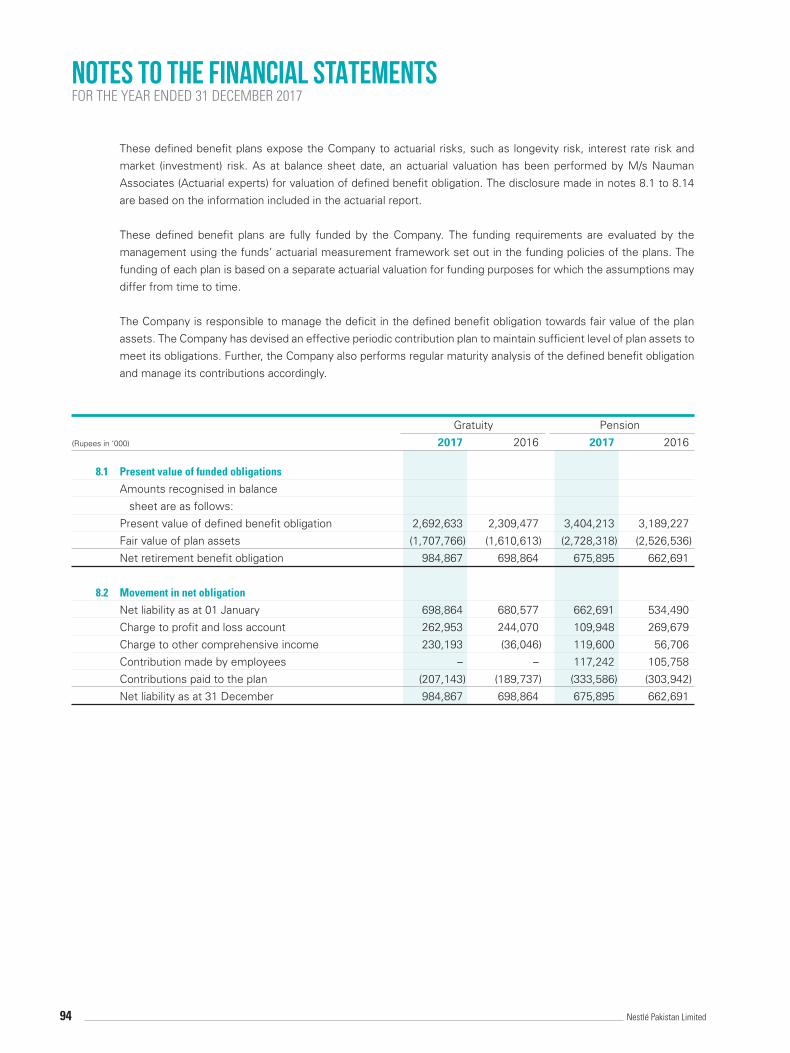
These defined benefit plans expose the Company to actuarial risks, such as longevity risk, interest rate risk and
market (investment) risk. As at balance sheet date, an actuarial valuation has been performed by M/s Nauman
Associates (Actuarial experts) for valuation of defined benefit obligation. The disclosure made in notes 8.1 to 8.14
are based on the information included in the actuarial report.
These defined benefit plans are fully funded by the Company. The funding requirements are evaluated by the
management using the funds’ actuarial measurement framework set out in the funding policies of the plans. The
funding of each plan is based on a separate actuarial valuation for funding purposes for which the assumptions may
differ from time to time.
The Company is responsible to manage the deficit in the defined benefit obligation towards fair value of the plan
assets. The Company has devised an effective periodic contribution plan to maintain sufficient level of plan assets to
meet its obligations. Further, the Company also performs regular maturity analysis of the defined benefit obligation
and manage its contributions accordingly.
Gratuity Pension
(Rupees in ‘000) 2017 2016 2017 2016
8.1 Present value of funded obligations
Amounts recognised in balance
sheet are as follows:
Present value of defined benefit obligation 2,692,633 2,309,477 3,404,213 3,189,227
Fair value of plan assets (1,707,766) (1,610,613) (2,728,318) (2,526,536)
Net retirement benefit obligation 984,867 698,864 675,895 662,691
8.2 Movement in net obligation
Net liability as at 01 January 698,864 680,577 662,691 534,490
Charge to profit and loss account 262,953 244,070 109,948 269,679
Charge to other comprehensive income 230,193 (36,046) 119,600 56,706
Contribution made by employees – – 117,242 105,758
Contributions paid to the plan (207,143) (189,737) (333,586) (303,942)
Net liability as at 31 December 984,867 698,864 675,895 662,691
NOTES TO THE FINANCIAL STATEMENTSFOR THE YEAR ENDED 31 DECEMBER 2017
94 Nestlé Pakistan Limited

Gratuity Pension
(Rupees in ‘000) Note 2017 2016 2017 2016
8.3 Movement in the liability for funded
defined benefit obligations
Liability for defined benefit obligations
as at 01 January 2,309,477 2,024,189 3,189,227 2,556,488
Benefits paid by the plan (117,512) (137,912) (164,680) (124,428)
Current service cost 206,400 185,499 324,458 325,096
Curtailment gain on transfer of
type A members to type B – – (146,068) –
Interest cost 213,819 195,523 295,154 308,784
Remeasurements on obligation:
Actuarial losses / (gains) on present value
Changes in financial assumptions – (1,515) – 67,064
Experience adjustments 80,449 43,693 (93,878) 56,223
80,449 42,178 (93,878) 123,287
Liability for defined benefit obligations
as at 31 December 2,692,633 2,309,477 3,404,213 3,189,227
8.4 Movement in fair value of plan assets
Fair value of plan assets as at 01 January 1,610,613 1,343,612 2,526,536 2,021,998
Contributions paid into the plan 207,143 189,737 333,586 303,942
Benefits paid by the plan (117,512) (137,912) (164,680) (124,428)
Interest income on plan assets 157,266 136,952 248,044 258,443
Remeasurements on fair value of plan assets (149,744) 78,224 (213,478) 66,581
Other administrative expenses by fund – – (1,690) –
Fair value of plan assets as at 31 December 1,707,766 1,610,613 2,728,318 2,526,536
8.5 Plan assets consist of the following:
In terms of amount:
Equity instruments 404,760 369,314 591,112 572,766
Debt instruments 235,448 313,586 380,231 470,441
Cash and other deposits 1,067,558 927,713 1,756,975 1,483,329
8.5.1 1,707,766 1,610,613 2,728,318 2,526,536
NOTES TO THE FINANCIAL STATEMENTSFOR THE YEAR ENDED 31 DECEMBER 2017
95Values Rooted in Respect

Gratuity Pension
(Rupees in ‘000) 2017 2016 2017 2016
8.5.1 Plan assets
Plan assets comprise:
Equity instrument
Fertilizers 19,611 19,673 30,427 35,155
Oil and gas 98,929 73,383 156,495 114,598
Steel 61,444 – 72,460 –
Power 22,486 47,633 43,010 79,825
Financial institutions 68,594 88,450 108,380 138,126
Mutual funds 19,519 22,982 19,519 22,982
Cement 40,093 29,477 58,921 38,149
Automobile 27,571 31,423 43,563 49,678
Chemicals 43,430 43,551 57,074 77,965
Insurance – 9,638 – 11,121
Others 3,083 3,104 1,263 5,167
404,760 369,314 591,112 572,766
Debts instruments
Government bonds 225,198 303,318 359,731 449,789
TFCs 10,250 10,268 20,500 20,652
235,448 313,586 380,231 470,441
Cash at bank
Cash and bank balances 38,885 67,405 53,901 62,822
Term deposit receipts 1,028,673 860,308 1,703,074 1,420,507
1,067,558 927,713 1,756,975 1,483,329
1,707,766 1,610,613 2,728,318 2,526,536
Before making any investment decision, an Asset-Liability matching study is performed by the Board of Trustees
of the funds to evaluate the merits of strategic investments. Risk analysis of each category is done to analyse the
impacts of the interest rate risk, currency risk and longevity risk.
Gratuity Pension
(Rupees in ‘000) 2017 2016 2017 2016
8.6 Profit and loss account includes the following
in respect of retirement benefits:
Interest cost for the year 213,819 195,523 295,154 308,784
Current service cost 206,400 185,499 324,458 325,096
Curtailment gain on transfer of
type A members to type B – – (146,068) –
Interest income on plan assets (157,266) (136,952) (248,044) (258,443)
Contribution made by the employees – – (117,242) (105,758)
Other administrative expense by Fund – – 1,690 –
262,953 244,070 109,948 269,679
NOTES TO THE FINANCIAL STATEMENTSFOR THE YEAR ENDED 31 DECEMBER 2017
96 Nestlé Pakistan Limited

Gratuity Pension
(Rupees in ‘000) 2017 2016 2017 2016
8.7 Charge for the year has been allocated
as follows:
Cost of goods sold 121,377 115,505 60,938 118,681
Distribution and selling expenses 92,800 80,728 73,939 87,978
Administration expenses 48,776 47,837 (24,929) 63,020
262,953 244,070 109,948 269,679
8.8 Actuarial (gains) and losses recognised
directly in other comprehensive income
Cumulative amount at 01 January 624,587 660,633 693,580 636,874
Remeasurements on obligation:
Actuarial losses / (gains) on present value
Changes in financial assumptions – (1,515) – 67,064
Experience adjustments 80,449 43,693 (93,878) 56,223
80,449 42,178 (93,878) 123,287
Remeasurements on fair value of plan assets 149,744 (78,224) 213,478 (66,581)
Losses / (gains) recognised during the year 230,193 (36,046) 119,600 56,706
Cumulative amount at 31 December 854,780 624,587 813,180 693,580
(Rupees in ‘000) 2017 2016 2015 2014 2013
8.9 Historical Information for Gratuity plan
Present value of defined benefit obligation 2,692,633 2,309,477 2,024,189 1,736,589 1,523,346
Fair value of the plan assets (1,707,766) (1,610,613) (1,343,612) (1,184,116) (995,124)
Deficit in the plan 984,867 698,864 680,577 552,473 528,222
Experience adjustments arising on plan liabilities 80,449 43,693 73,878 (33,912) 304,181
Experience adjustments arising on plan assets (149,744) 78,224 (14,330) (10,851) 48,927
(Rupees in ‘000) 2017 2016 2015 2014 2013
8.10 Historical Information for Pension plan
Present value of defined benefit obligation 3,404,213 3,189,227 2,556,488 2,290,437 1,765,958
Fair value of the plan assets (2,728,318) (2,526,536) (2,021,998) (1,731,911) (1,431,777)
Deficit in the plan 675,895 662,691 534,490 558,526 334,181
Experience adjustments arising on plan liabilities (93,878) 56,223 (23,524) 26,939 139,032
Experience adjustments arising on plan assets (213,478) 66,581 (23,627) 8,295 43,519
NOTES TO THE FINANCIAL STATEMENTSFOR THE YEAR ENDED 31 DECEMBER 2017
97Values Rooted in Respect

2017 2016
Gratuity fund Pension fund Gratuity fund Pension fund
per annum per annum per annum per annum
8.11 Significant actuarial assumptions used for
valuation of these plans are as follows:
Discount rate used for profit and loss charge 9.50% 9.50% 10.00% 10.00%
Discount rate used for year-end obligation 9.50% 9.50% 9.50% 9.50%
Expected rates of salary increase 9.50% 9.50% 9.50% 9.50%
Expected rates of return on plan assets 9.50% 9.50% 9.50% 9.50%
Mortality Rate SLIC 2001-2005 SLIC 2001-2005 SLIC 2001-2005 SLIC 2001-2005
Setback Setback Setback Setback
1 year 1 year 1 year 1 year
8.12 Actuarial assumptions sensitivity analysis
If the significant actuarial assumptions used to estimate the defined benefit obligation at the reporting date, had
fluctuated by 50 bps with all other variables held constant, the impact on the present value of the defined benefit
obligation would have been as follows:
Gratuity Pension
Impact on present value of defined benefit
obligation as at 31 December 2017
(Rupees in ‘000) Change Increase Decrease Increase Decrease
Discount rate 50 bps (132,552) 143,599 (178,092) 193,939
Future salary increase 50 bps 144,753 (134,859) 65,689 (62,640)
Gratuity Pension
Impact on present value of defined benefit
obligation as at 31 December 2017
(Rupees in ‘000) Change Scale up by Scale down by Scale up by Scale down by
Expected mortality rates 1 year (629) 674 (18,591) 17,919
The sensitivity analysis of the defined benefit obligation to the significant actuarial assumptions has been performed
using the same calculation techniques as applied for calculation of defined benefit obligation reported in the balance
sheet.
8.13 Weighted average duration of the defined benefit obligation is 10 years and 11 years for gratuity and pension plans,
respectively.
NOTES TO THE FINANCIAL STATEMENTSFOR THE YEAR ENDED 31 DECEMBER 2017
98 Nestlé Pakistan Limited
(Rupees in ‘000) Note 2017 2016
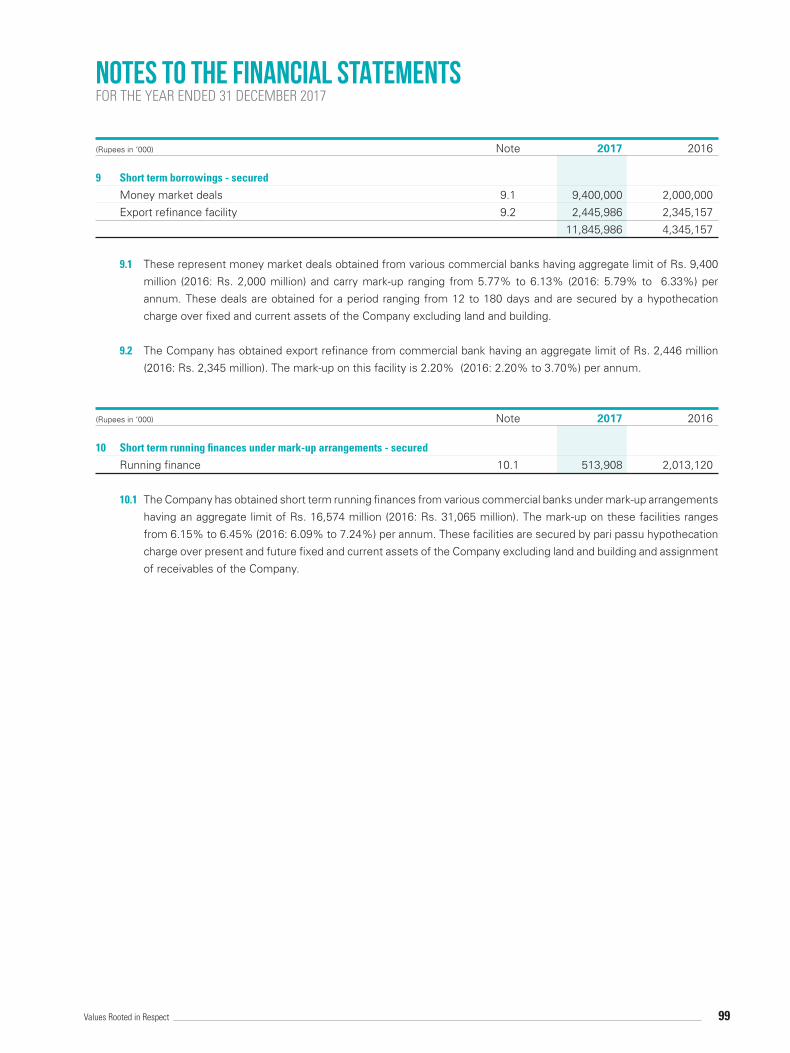
9 Short term borrowings - secured
Money market deals 9.1 9,400,000 2,000,000
Export refinance facility 9.2 2,445,986 2,345,157
11,845,986 4,345,157
9.1 These represent money market deals obtained from various commercial banks having aggregate limit of Rs. 9,400
million (2016: Rs. 2,000 million) and carry mark-up ranging from 5.77% to 6.13% (2016: 5.79% to 6.33%) per
annum. These deals are obtained for a period ranging from 12 to 180 days and are secured by a hypothecation
charge over fixed and current assets of the Company excluding land and building.
9.2 The Company has obtained export refinance from commercial bank having an aggregate limit of Rs. 2,446 million
(2016: Rs. 2,345 million). The mark-up on this facility is 2.20% (2016: 2.20% to 3.70%) per annum.
(Rupees in ‘000) Note 2017 2016
10 Short term running finances under mark-up arrangements - secured
Running finance 10.1 513,908 2,013,120
10.1 The Company has obtained short term running finances from various commercial banks under mark-up arrangements
having an aggregate limit of Rs. 16,574 million (2016: Rs. 31,065 million). The mark-up on these facilities ranges
from 6.15% to 6.45% (2016: 6.09% to 7.24%) per annum. These facilities are secured by pari passu hypothecation
charge over present and future fixed and current assets of the Company excluding land and building and assignment
of receivables of the Company.
NOTES TO THE FINANCIAL STATEMENTSFOR THE YEAR ENDED 31 DECEMBER 2017
99Values Rooted in Respect

(Rupees in ‘000) Note 2017 2016
11 Trade and other payables
Trade creditors
Related parties 4,922,446 4,630,375
Others 11,017,978 10,341,630
15,940,424 14,972,005
Accrued liabilities 7,693,515 8,657,007
Advances from customers 454,112 298,513
Workers’ profit participation fund 11.1 1,127,195 15,998
Workers’ welfare fund 360,502 333,413
Royalty and technical assistance fee payable
to associated company including taxes 281,736 271,701
Unclaimed dividend 26,718 21,122
Withholding income tax payable 51,667 15,930
Withholding sales tax payable 164,096 183,007
Derivative financial liability - cash flow hedge 11.2 86 21,535
Others 131,885 130,368
26,231,936 24,920,599
11.1 Workers’ profit participation fund
Balance as at 01 January 15,998 79,517
Provision for the year 29 1,123,113 912,431
1,139,111 991,948
Net payments / adjustments made during the year (11,916) (975,950)
Balance as at 31 December 11.1.1 1,127,195 15,998
11.1.1 This has been subsequently paid to workers’ profit participation fund.
11.2 The Company has outstanding exchange rate forward contracts with various banks for amounts aggregating to US$
3.924 million (2016: US$ 11.862 million) and EUR€ 1.180 million (2016: EUR€ 4.454 million) to manage exchange
rate exposure on outstanding foreign currency payments under the terms of commitments of letters of credit. Under
the aforementioned contracts, the Company would pay respective rate agreed at the initiation of the contracts on
respective settlement dates. As at 31 December 2017 the fair value of these derivatives is Rs. 588.83 million (2016:
Rs. 2,016.53 million).
NOTES TO THE FINANCIAL STATEMENTSFOR THE YEAR ENDED 31 DECEMBER 2017
100 Nestlé Pakistan Limited

(Rupees in ‘000) 2017 2016
12 Interest and mark-up accrued
Long term finances - secured 11,546 2,500
Short term borrowings - secured 105,354 21,695
Short term running finance under mark-up arrangements - secured 29,956 24,693
146,856 48,888
13 Contingencies and commitments
13.1 There is no material contingency as at balance sheet date.
(Rupees in ‘000) 2017 2016
13.2 Guarantees
Outstanding guarantees 213,023 263,486
Un-utilized portion 586,976 296,514
13.3 Commitments
13.3.1 The amount of future payments under Ijarah and the period in which these payments will become due are as
follows:
(Rupees in ‘000) Note 2017 2016
Not later than one year 9,832 41,925
Later than one year but not later than five years – 13,164
9,832 55,089
13.3.2 Commitments in respect of capital expenditure 1,036,443 275,704
13.4 Letters of credit
Outstanding letters of credit 13.4.1 6,478,488 2,480,350
Un-utilized portion 7,949,052 7,111,680
13.4.1 Out of these outstanding letters of credits, certain liabilities have already been recognized under trade creditors.
NOTES TO THE FINANCIAL STATEMENTSFOR THE YEAR ENDED 31 DECEMBER 2017
101Values Rooted in Respect
(Rupees in ‘000) Note 2017 2016
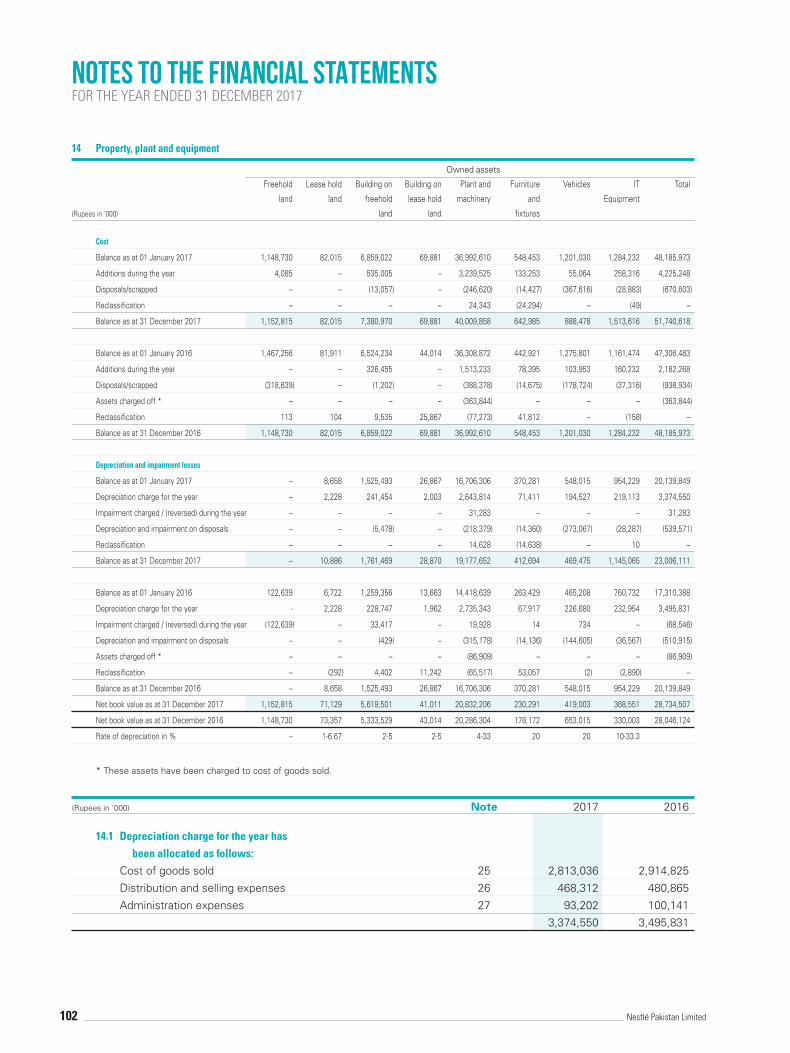
14.1 Depreciation charge for the year has
been allocated as follows:
Cost of goods sold 25 2,813,036 2,914,825
Distribution and selling expenses 26 468,312 480,865
Administration expenses 27 93,202 100,141
3,374,550 3,495,831
14 Property, plant and equipment
Owned assets
Freehold Lease hold Building on Building on Plant and Furniture Vehicles IT Total
land land freehold lease hold machinery and Equipment
(Rupees in ‘000) land land fixtures
Cost
Balance as at 01 January 2017 1,148,730 82,015 6,859,022 69,881 36,992,610 548,453 1,201,030 1,284,232 48,185,973
Additions during the year 4,085 – 535,005 – 3,239,525 133,253 55,064 258,316 4,225,248
Disposals/scrapped – – (13,057) – (246,620) (14,427) (367,616) (28,883) (670,603)
Reclassification – – – – 24,343 (24,294) – (49) –
Balance as at 31 December 2017 1,152,815 82,015 7,380,970 69,881 40,009,858 642,985 888,478 1,513,616 51,740,618
Balance as at 01 January 2016 1,467,256 81,911 6,524,234 44,014 36,308,872 442,921 1,275,801 1,161,474 47,306,483
Additions during the year – – 326,455 – 1,513,233 78,395 103,953 160,232 2,182,268
Disposals/scrapped (318,639) – (1,202) – (388,378) (14,675) (178,724) (37,316) (938,934)
Assets charged off * – – – – (363,844) – – – (363,844)
Reclassification 113 104 9,535 25,867 (77,273) 41,812 – (158) –
Balance as at 31 December 2016 1,148,730 82,015 6,859,022 69,881 36,992,610 548,453 1,201,030 1,284,232 48,185,973
Depreciation and impairment losses
Balance as at 01 January 2017 – 8,658 1,525,493 26,867 16,706,306 370,281 548,015 954,229 20,139,849
Depreciation charge for the year – 2,228 241,454 2,003 2,643,814 71,411 194,527 219,113 3,374,550
Impairment charged / (reversed) during the year – – – – 31,283 – – – 31,283
Depreciation and impairment on disposals – – (5,478) – (218,379) (14,360) (273,067) (28,287) (539,571)
Reclassification – – – – 14,628 (14,638) – 10 –
Balance as at 31 December 2017 – 10,886 1,761,469 28,870 19,177,652 412,694 469,475 1,145,065 23,006,111
Balance as at 01 January 2016 122,639 6,722 1,259,356 13,663 14,418,639 263,429 465,208 760,732 17,310,388
Depreciation charge for the year - 2,228 228,747 1,962 2,735,343 67,917 226,680 232,954 3,495,831
Impairment charged / (reversed) during the year (122,639) – 33,417 – 19,928 14 734 – (68,546)
Depreciation and impairment on disposals – – (429) – (315,178) (14,136) (144,605) (36,567) (510,915)
Assets charged off * – – – – (86,909) – – – (86,909)
Reclassification – (292) 4,402 11,242 (65,517) 53,057 (2) (2,890) –
Balance as at 31 December 2016 – 8,658 1,525,493 26,867 16,706,306 370,281 548,015 954,229 20,139,849
Net book value as at 31 December 2017 1,152,815 71,129 5,619,501 41,011 20,832,206 230,291 419,003 368,551 28,734,507
Net book value as at 31 December 2016 1,148,730 73,357 5,333,529 43,014 20,286,304 178,172 653,015 330,003 28,046,124
Rate of depreciation in % – 1-6.67 2-5 2-5 4-33 20 20 10-33.3
* These assets have been charged to cost of goods sold.
NOTES TO THE FINANCIAL STATEMENTSFOR THE YEAR ENDED 31 DECEMBER 2017
102 Nestlé Pakistan Limited

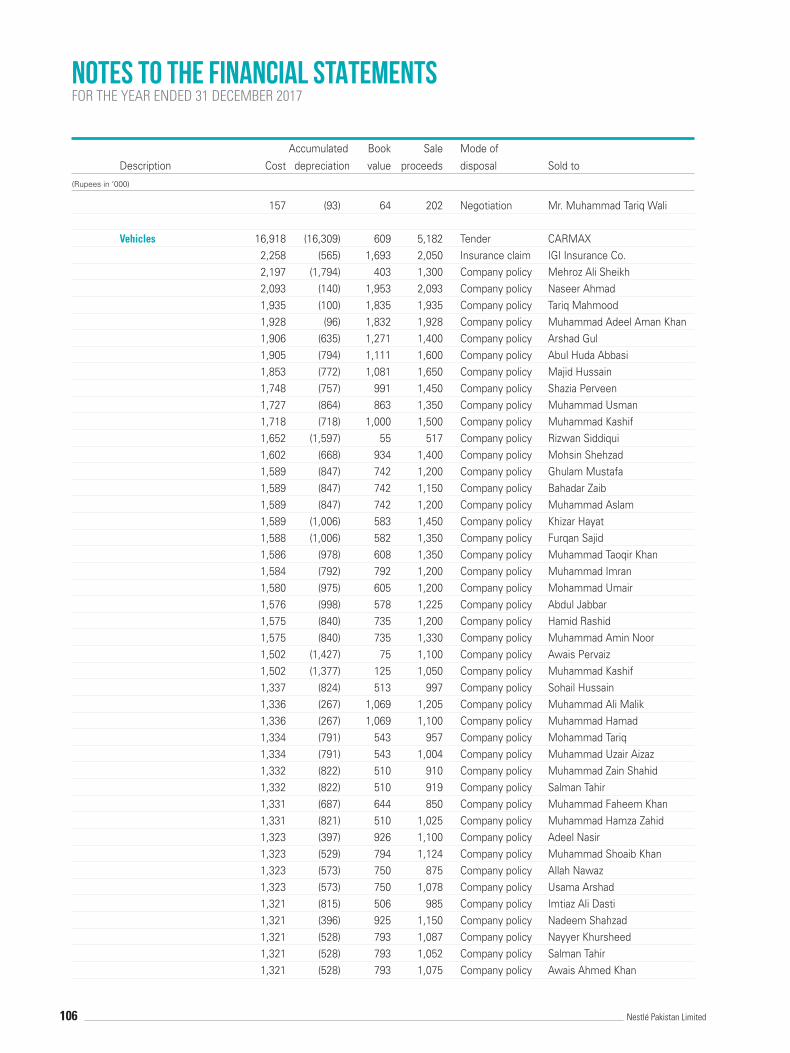
14.2 Detail of significant property, plant and equipment sold during the year is as follows:
Accumulated Book Sale Mode of
Description Cost depreciation value proceeds disposal Sold to
(Rupees in ‘000)
Building on freehold land 2,357 (754) 1,603 68 Tender M/S Maqsood Barlas & Sons 1,520 (512) 1,008 40 Tender M/S Maqsood Barlas & Sons 1,313 (560) 753 38 Tender M/S Maqsood Barlas & Sons 1,313 (560) 753 38 Tender M/S Maqsood Barlas & Sons 1,313 (560) 753 38 Tender M/S Maqsood Barlas & Sons 1,128 (162) 966 33 Tender M/S Maqsood Barlas & Sons 804 (193) 611 21 Tender M/S Maqsood Barlas & Sons 727 (175) 552 19 Tender M/S Maqsood Barlas & Sons 210 (29) 181 6 Tender M/S Zahoor Ahmed 170 (41) 129 4 Tender M/S Maqsood Barlas & Sons 150 (24) 126 4 Tender M/S Maqsood Barlas & Sons 105 (14) 91 3 Tender M/S Zahoor Ahmed 90 (36) 54 2 Tender M/S Maqsood Barlas & Sons Plant and Machinery 11,221 (9,373) 1,848 593 Tender M/S Maqsood Barlas & Sons 4,151 (2,289) 1,862 120 Tender M/S Maqsood Barlas & Sons 2,330 (751) 1,579 104 Tender M/S Maqsood Barlas & Sons 1,903 (1,689) 214 101 Tender M/S Maqsood Barlas & Sons 1,610 (1,035) 575 85 Tender M/S Maqsood Barlas & Sons 1,575 (551) 1,024 815 Negotiation Mr. Muhammad Tariq Wali 1,550 (1,330) 220 44 Negotiation Mr. Zahoor Ahmed 1,228 (481) 747 36 Tender M/S Maqsood Barlas & Sons 1,228 (481) 747 36 Tender M/S Maqsood Barlas & Sons 1,105 (737) 368 58 Tender M/S Maqsood Barlas & Sons 948 (716) 232 28 Tender M/S Maqsood Barlas & Sons 607 (523) 84 32 Tender M/S Maqsood Barlas & Sons 607 (523) 84 32 Tender M/S Maqsood Barlas & Sons 592 (484) 108 17 Tender M/S Maqsood Barlas & Sons 591 (452) 139 31 Tender M/S Maqsood Barlas & Sons 585 (477) 108 17 Tender M/S Maqsood Barlas & Sons 482 (301) 181 168 Negotiation Mr. Muhammad Tariq Wali 482 (301) 181 168 Negotiation Mr. Muhammad Tariq Wali 338 (234) 104 10 Tender M/S Maqsood Barlas & Sons 338 (234) 104 10 Tender M/S Maqsood Barlas & Sons 334 (85) 249 183 Negotiation Mr. Muhammad Tariq Wali 321 (257) 64 110 Negotiation Mr. Muhammad Tariq Wali 321 (260) 61 110 Negotiation Mr. Muhammad Tariq Wali 319 (263) 56 110 Negotiation Mr. Muhammad Tariq Wali 319 (261) 58 110 Negotiation Mr. Muhammad Tariq Wali 319 (259) 60 110 Negotiation Mr. Muhammad Tariq Wali 319 (259) 60 110 Negotiation Mr. Muhammad Tariq Wali 319 (259) 60 110 Negotiation Mr. Muhammad Tariq Wali 319 (259) 60 110 Negotiation Mr. Muhammad Tariq Wali 319 (263) 56 110 Negotiation Mr. Muhammad Tariq Wali
NOTES TO THE FINANCIAL STATEMENTSFOR THE YEAR ENDED 31 DECEMBER 2017
103Values Rooted in Respect

Accumulated Book Sale Mode of
Description Cost depreciation value proceeds disposal Sold to
(Rupees in ‘000)
319 (261) 58 110 Negotiation Mr. Muhammad Tariq Wali 319 (263) 56 110 Negotiation Mr. Muhammad Tariq Wali 315 (186) 129 146 Negotiation Mr. Muhammad Tariq Wali 315 (175) 140 - Theft case 313 (261) 52 110 Negotiation Mr. Muhammad Tariq Wali 313 (262) 51 110 Negotiation Mr. Muhammad Tariq Wali 304 (154) 150 146 Negotiation Mr. Muhammad Tariq Wali 304 (154) 150 146 Negotiation Mr. Muhammad Tariq Wali 305 (154) 151 146 Negotiation Mr. Muhammad Tariq Wali 305 (154) 151 146 Negotiation Mr. Muhammad Tariq Wali 305 (154) 151 146 Negotiation Mr. Muhammad Tariq Wali 295 (150) 145 183 Negotiation Mr. Muhammad Tariq Wali 295 (148) 147 146 Negotiation Mr. Muhammad Tariq Wali 295 (148) 147 110 Negotiation Mr. Muhammad Tariq Wali 295 (148) 147 110 Negotiation Mr. Muhammad Tariq Wali 295 (150) 145 146 Negotiation Mr. Muhammad Tariq Wali 295 (150) 145 146 Negotiation Mr. Muhammad Tariq Wali 257 (142) 115 146 Negotiation Mr. Muhammad Tariq Wali 257 (142) 115 110 Negotiation Mr. Muhammad Tariq Wali 257 (145) 112 110 Negotiation Mr. Muhammad Tariq Wali 257 (145) 112 110 Negotiation Mr. Muhammad Tariq Wali 257 (145) 112 110 Negotiation Mr. Muhammad Tariq Wali 257 (146) 111 110 Negotiation Mr. Muhammad Tariq Wali 257 (146) 111 110 Negotiation Mr. Muhammad Tariq Wali 257 (146) 111 110 Negotiation Mr. Muhammad Tariq Wali 257 (147) 110 110 Negotiation Mr. Muhammad Tariq Wali 257 (146) 111 110 Negotiation Mr. Muhammad Tariq Wali 257 (146) 111 110 Negotiation Mr. Muhammad Tariq Wali 257 (143) 114 110 Negotiation Mr. Muhammad Tariq Wali 257 (147) 110 110 Negotiation Mr. Muhammad Tariq Wali 257 (146) 111 110 Negotiation Mr. Muhammad Tariq Wali 257 (146) 111 110 Negotiation Mr. Muhammad Tariq Wali 257 (146) 111 110 Negotiation Mr. Muhammad Tariq Wali 257 (148) 109 110 Negotiation Mr. Muhammad Tariq Wali 257 (147) 110 110 Negotiation Mr. Muhammad Tariq Wali 257 (147) 110 110 Negotiation Mr. Muhammad Tariq Wali 257 (148) 109 110 Negotiation Mr. Muhammad Tariq Wali 257 (147) 110 110 Negotiation Mr. Muhammad Tariq Wali 257 (147) 110 110 Negotiation Mr. Muhammad Tariq Wali 257 (147) 110 110 Negotiation Mr. Muhammad Tariq Wali 257 (142) 115 146 Negotiation Mr. Muhammad Tariq Wali 257 (141) 116 146 Negotiation Mr. Muhammad Tariq Wali 257 (141) 116 146 Negotiation Mr. Muhammad Tariq Wali 257 (141) 116 146 Negotiation Mr. Muhammad Tariq Wali 257 (141) 116 146 Negotiation Mr. Muhammad Tariq Wali 257 (141) 116 110 Negotiation Mr. Muhammad Tariq Wali 257 (141) 116 110 Negotiation Mr. Muhammad Tariq Wali
NOTES TO THE FINANCIAL STATEMENTSFOR THE YEAR ENDED 31 DECEMBER 2017
104 Nestlé Pakistan Limited

Accumulated Book Sale Mode of
Description Cost depreciation value proceeds disposal Sold to
(Rupees in ‘000)
257 (142) 115 110 Negotiation Mr. Muhammad Tariq Wali 257 (142) 115 110 Negotiation Mr. Muhammad Tariq Wali 257 (143) 114 146 Negotiation Mr. Muhammad Tariq Wali 256 (143) 113 110 Negotiation Mr. Muhammad Tariq Wali 256 (143) 113 146 Negotiation Mr. Muhammad Tariq Wali 256 (143) 113 146 Negotiation Mr. Muhammad Tariq Wali 256 (143) 113 110 Negotiation Mr. Muhammad Tariq Wali 256 (143) 113 110 Negotiation Mr. Muhammad Tariq Wali 256 (145) 111 110 Negotiation Mr. Muhammad Tariq Wali 256 (145) 111 110 Negotiation Mr. Muhammad Tariq Wali 256 (147) 109 146 Negotiation Mr. Muhammad Tariq Wali 255 (147) 108 110 Negotiation Mr. Muhammad Tariq Wali 255 (142) 113 146 Negotiation Mr. Muhammad Tariq Wali 255 (142) 113 146 Negotiation Mr. Muhammad Tariq Wali 255 (142) 113 146 Negotiation Mr. Muhammad Tariq Wali 255 (141) 114 110 Negotiation Mr. Muhammad Tariq Wali 251 (183) 68 110 Negotiation Mr. Muhammad Tariq Wali 251 (106) 145 126 Negotiation Mr. Muhammad Tariq Wali 249 (179) 70 110 Negotiation Mr. Muhammad Tariq Wali 249 (179) 70 110 Negotiation Mr. Muhammad Tariq Wali 249 (179) 70 110 Negotiation Mr. Muhammad Tariq Wali 249 (98) 151 124 Negotiation Mr. Muhammad Tariq Wali 249 (178) 71 110 Negotiation Mr. Muhammad Tariq Wali 249 (181) 68 110 Negotiation Mr. Muhammad Tariq Wali 249 (181) 68 110 Negotiation Mr. Muhammad Tariq Wali 249 (178) 71 110 Negotiation Mr. Muhammad Tariq Wali 249 (181) 68 110 Negotiation Mr. Muhammad Tariq Wali 249 (178) 71 110 Negotiation Mr. Muhammad Tariq Wali 249 (178) 71 110 Negotiation Mr. Muhammad Tariq Wali 249 (178) 71 110 Negotiation Mr. Muhammad Tariq Wali 249 (180) 69 110 Negotiation Mr. Muhammad Tariq Wali 249 (178) 71 110 Negotiation Mr. Muhammad Tariq Wali 248 (179) 69 110 Negotiation Mr. Muhammad Tariq Wali 248 (178) 70 110 Negotiation Mr. Muhammad Tariq Wali 248 (178) 70 110 Negotiation Mr. Muhammad Tariq Wali 248 (178) 70 110 Negotiation Mr. Muhammad Tariq Wali 248 (179) 69 110 Negotiation Mr. Muhammad Tariq Wali 248 (178) 70 110 Negotiation Mr. Muhammad Tariq Wali 248 (179) 69 110 Negotiation Mr. Muhammad Tariq Wali 248 (178) 70 110 Negotiation Mr. Muhammad Tariq Wali 248 (175) 73 183 Negotiation Mr. Muhammad Tariq Wali 248 (178) 70 110 Negotiation Mr. Muhammad Tariq Wali 248 (179) 69 110 Negotiation Mr. Muhammad Tariq Wali 248 (178) 70 110 Negotiation Mr. Muhammad Tariq Wali 248 (178) 70 110 Negotiation Mr. Muhammad Tariq Wali 208 (90) 118 126 Negotiation Mr. Muhammad Tariq Wali 205 (110) 95 146 Negotiation Mr. Muhammad Tariq Wali
NOTES TO THE FINANCIAL STATEMENTSFOR THE YEAR ENDED 31 DECEMBER 2017
105Values Rooted in Respect
Accumulated Book Sale Mode of
Description Cost depreciation value proceeds disposal Sold to
(Rupees in ‘000)
157 (93) 64 202 Negotiation Mr. Muhammad Tariq Wali Vehicles 16,918 (16,309) 609 5,182 Tender CARMAX 2,258 (565) 1,693 2,050 Insurance claim IGI Insurance Co. 2,197 (1,794) 403 1,300 Company policy Mehroz Ali Sheikh 2,093 (140) 1,953 2,093 Company policy Naseer Ahmad 1,935 (100) 1,835 1,935 Company policy Tariq Mahmood 1,928 (96) 1,832 1,928 Company policy Muhammad Adeel Aman Khan 1,906 (635) 1,271 1,400 Company policy Arshad Gul 1,905 (794) 1,111 1,600 Company policy Abul Huda Abbasi 1,853 (772) 1,081 1,650 Company policy Majid Hussain 1,748 (757) 991 1,450 Company policy Shazia Perveen 1,727 (864) 863 1,350 Company policy Muhammad Usman 1,718 (718) 1,000 1,500 Company policy Muhammad Kashif 1,652 (1,597) 55 517 Company policy Rizwan Siddiqui 1,602 (668) 934 1,400 Company policy Mohsin Shehzad 1,589 (847) 742 1,200 Company policy Ghulam Mustafa 1,589 (847) 742 1,150 Company policy Bahadar Zaib 1,589 (847) 742 1,200 Company policy Muhammad Aslam 1,589 (1,006) 583 1,450 Company policy Khizar Hayat 1,588 (1,006) 582 1,350 Company policy Furqan Sajid 1,586 (978) 608 1,350 Company policy Muhammad Taoqir Khan 1,584 (792) 792 1,200 Company policy Muhammad Imran 1,580 (975) 605 1,200 Company policy Mohammad Umair 1,576 (998) 578 1,225 Company policy Abdul Jabbar 1,575 (840) 735 1,200 Company policy Hamid Rashid 1,575 (840) 735 1,330 Company policy Muhammad Amin Noor 1,502 (1,427) 75 1,100 Company policy Awais Pervaiz 1,502 (1,377) 125 1,050 Company policy Muhammad Kashif 1,337 (824) 513 997 Company policy Sohail Hussain 1,336 (267) 1,069 1,205 Company policy Muhammad Ali Malik 1,336 (267) 1,069 1,100 Company policy Muhammad Hamad 1,334 (791) 543 957 Company policy Mohammad Tariq 1,334 (791) 543 1,004 Company policy Muhammad Uzair Aizaz 1,332 (822) 510 910 Company policy Muhammad Zain Shahid 1,332 (822) 510 919 Company policy Salman Tahir 1,331 (687) 644 850 Company policy Muhammad Faheem Khan 1,331 (821) 510 1,025 Company policy Muhammad Hamza Zahid 1,323 (397) 926 1,100 Company policy Adeel Nasir 1,323 (529) 794 1,124 Company policy Muhammad Shoaib Khan 1,323 (573) 750 875 Company policy Allah Nawaz 1,323 (573) 750 1,078 Company policy Usama Arshad 1,321 (815) 506 985 Company policy Imtiaz Ali Dasti 1,321 (396) 925 1,150 Company policy Nadeem Shahzad 1,321 (528) 793 1,087 Company policy Nayyer Khursheed 1,321 (528) 793 1,052 Company policy Salman Tahir 1,321 (528) 793 1,075 Company policy Awais Ahmed Khan
NOTES TO THE FINANCIAL STATEMENTSFOR THE YEAR ENDED 31 DECEMBER 2017
106 Nestlé Pakistan Limited
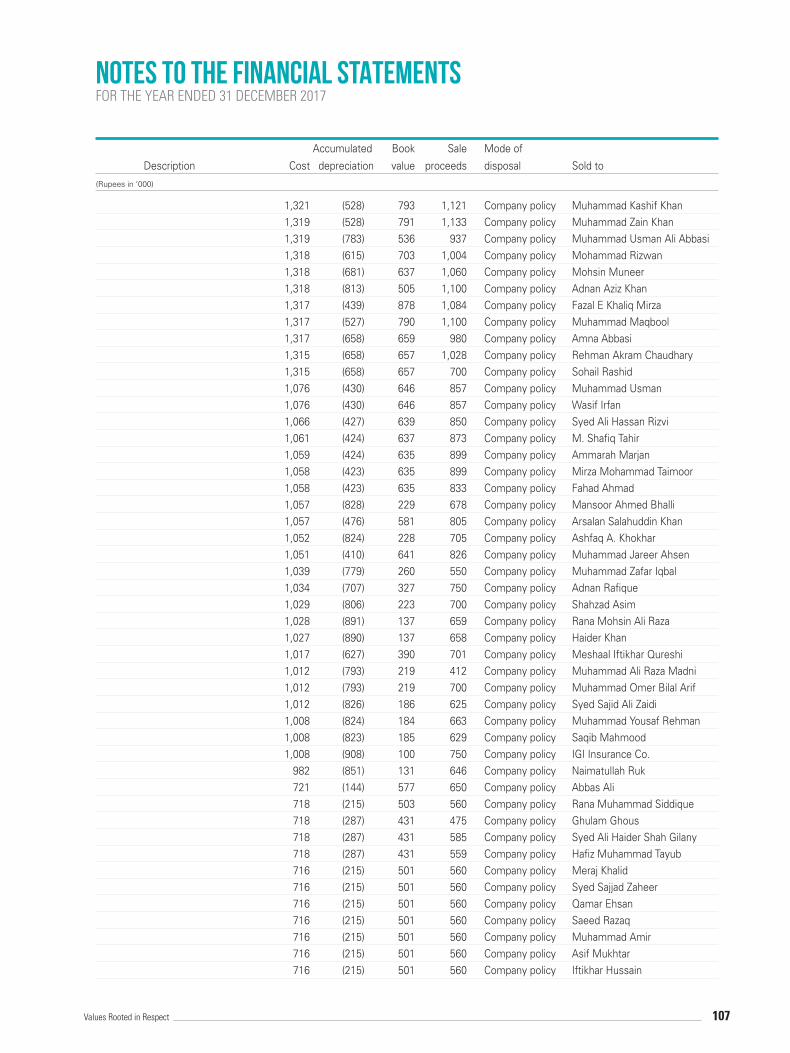
Accumulated Book Sale Mode of
Description Cost depreciation value proceeds disposal Sold to
(Rupees in ‘000)
1,321 (528) 793 1,121 Company policy Muhammad Kashif Khan 1,319 (528) 791 1,133 Company policy Muhammad Zain Khan 1,319 (783) 536 937 Company policy Muhammad Usman Ali Abbasi 1,318 (615) 703 1,004 Company policy Mohammad Rizwan 1,318 (681) 637 1,060 Company policy Mohsin Muneer 1,318 (813) 505 1,100 Company policy Adnan Aziz Khan 1,317 (439) 878 1,084 Company policy Fazal E Khaliq Mirza 1,317 (527) 790 1,100 Company policy Muhammad Maqbool 1,317 (658) 659 980 Company policy Amna Abbasi 1,315 (658) 657 1,028 Company policy Rehman Akram Chaudhary 1,315 (658) 657 700 Company policy Sohail Rashid 1,076 (430) 646 857 Company policy Muhammad Usman 1,076 (430) 646 857 Company policy Wasif Irfan 1,066 (427) 639 850 Company policy Syed Ali Hassan Rizvi 1,061 (424) 637 873 Company policy M. Shafiq Tahir 1,059 (424) 635 899 Company policy Ammarah Marjan 1,058 (423) 635 899 Company policy Mirza Mohammad Taimoor 1,058 (423) 635 833 Company policy Fahad Ahmad 1,057 (828) 229 678 Company policy Mansoor Ahmed Bhalli 1,057 (476) 581 805 Company policy Arsalan Salahuddin Khan 1,052 (824) 228 705 Company policy Ashfaq A. Khokhar 1,051 (410) 641 826 Company policy Muhammad Jareer Ahsen 1,039 (779) 260 550 Company policy Muhammad Zafar Iqbal 1,034 (707) 327 750 Company policy Adnan Rafique 1,029 (806) 223 700 Company policy Shahzad Asim 1,028 (891) 137 659 Company policy Rana Mohsin Ali Raza 1,027 (890) 137 658 Company policy Haider Khan 1,017 (627) 390 701 Company policy Meshaal Iftikhar Qureshi 1,012 (793) 219 412 Company policy Muhammad Ali Raza Madni 1,012 (793) 219 700 Company policy Muhammad Omer Bilal Arif 1,012 (826) 186 625 Company policy Syed Sajid Ali Zaidi 1,008 (824) 184 663 Company policy Muhammad Yousaf Rehman 1,008 (823) 185 629 Company policy Saqib Mahmood 1,008 (908) 100 750 Company policy IGI Insurance Co. 982 (851) 131 646 Company policy Naimatullah Ruk 721 (144) 577 650 Company policy Abbas Ali 718 (215) 503 560 Company policy Rana Muhammad Siddique 718 (287) 431 475 Company policy Ghulam Ghous 718 (287) 431 585 Company policy Syed Ali Haider Shah Gilany 718 (287) 431 559 Company policy Hafiz Muhammad Tayub 716 (215) 501 560 Company policy Meraj Khalid 716 (215) 501 560 Company policy Syed Sajjad Zaheer 716 (215) 501 560 Company policy Qamar Ehsan 716 (215) 501 560 Company policy Saeed Razaq 716 (215) 501 560 Company policy Muhammad Amir 716 (215) 501 560 Company policy Asif Mukhtar 716 (215) 501 560 Company policy Iftikhar Hussain
NOTES TO THE FINANCIAL STATEMENTSFOR THE YEAR ENDED 31 DECEMBER 2017
107Values Rooted in Respect

Accumulated Book Sale Mode of
Description Cost depreciation value proceeds disposal Sold to
(Rupees in ‘000)
716 (215) 501 560 Company policy Khalid Parvaiz 716 (215) 501 560 Company policy Muhammad Yaqub 716 (167) 549 630 Company policy Sajjad Ahmad Nazir 716 (215) 501 560 Company policy Kamran Abid 716 (215) 501 525 Company policy Nabila Gulan 716 (167) 549 638 Company policy Adeel Ahmed 716 (287) 429 615 Company policy Amjad Ali Mirza 716 (215) 501 560 Company policy Ali Akbar 716 (215) 501 560 Company policy M Umair Ahmad Shah 716 (215) 501 560 Company policy Faisal Mahmood 716 (215) 501 560 Company policy Muhammad Sufyan Saleem 716 (215) 501 560 Company policy Mohammad Rehman Khan 716 (287) 429 615 Company policy Qaisar Iqbal 713 (214) 499 560 Company policy Faisal Nadeem 713 (214) 499 560 Company policy Mazhar Abbas 713 (214) 499 560 Company policy Khalid Rashid 713 (214) 499 560 Company policy Muhammad Sami Ullah 713 (214) 499 560 Company policy Muhammad Naveed Akram 713 (214) 499 560 Company policy Rana Sohail Babar 713 (214) 499 560 Company policy Muhammad Naveed Shafiq 713 (214) 499 560 Company policy Muhammad Zahid Joiya 713 (214) 499 560 Company policy Mahboob Hussain 713 (214) 499 560 Company policy Jahangir Khan 711 (285) 426 641 Company policy Usama Farooq 706 (283) 423 579 Company policy Syed Amir Abbas Rizvi 706 (283) 423 614 Company policy Mumtaz Ahmad 706 (283) 423 544 Company policy Waqas Saeed 706 (212) 494 560 Company policy Naeem Ashraf Bhatti 706 (212) 494 560 Company policy Amjad Mujahid 706 (283) 423 594 Company policy Muhammad Shaheen 706 (283) 423 569 Company policy Muhammad Waqas Nasim Qureshi 706 (283) 423 500 Company policy Arshad Ahmed 706 (283) 423 510 Company policy Kiran Anjum 706 (283) 423 500 Company policy Muhammad Asmail 706 (283) 423 557 Company policy Uzma Saleem 706 (282) 424 585 Insurance claim IGI Insurance Co. 706 (282) 424 556 Company policy Mubashir Zia 706 (282) 424 575 Company policy Muhammad Bilal Chishti 702 (246) 456 600 Insurance claim IGI Insurance Co. 702 (281) 421 603 Company policy Aziz Ahmed Khan 702 (281) 421 572 Company policy Syed Ali Hassan 702 (281) 421 617 Company policy Mirza Haseeb Baig 702 (222) 480 600 Insurance claim IGI Insurance Co. 702 (281) 421 566 Company policy Amir Raja 701 (210) 491 560 Company policy M. Saad Khalid 701 (164) 537 617 Company policy Muhammad Ali Ansar Abbas 701 (210) 491 560 Company policy Hafiz Rizwan Rashid
NOTES TO THE FINANCIAL STATEMENTSFOR THE YEAR ENDED 31 DECEMBER 2017
108 Nestlé Pakistan Limited
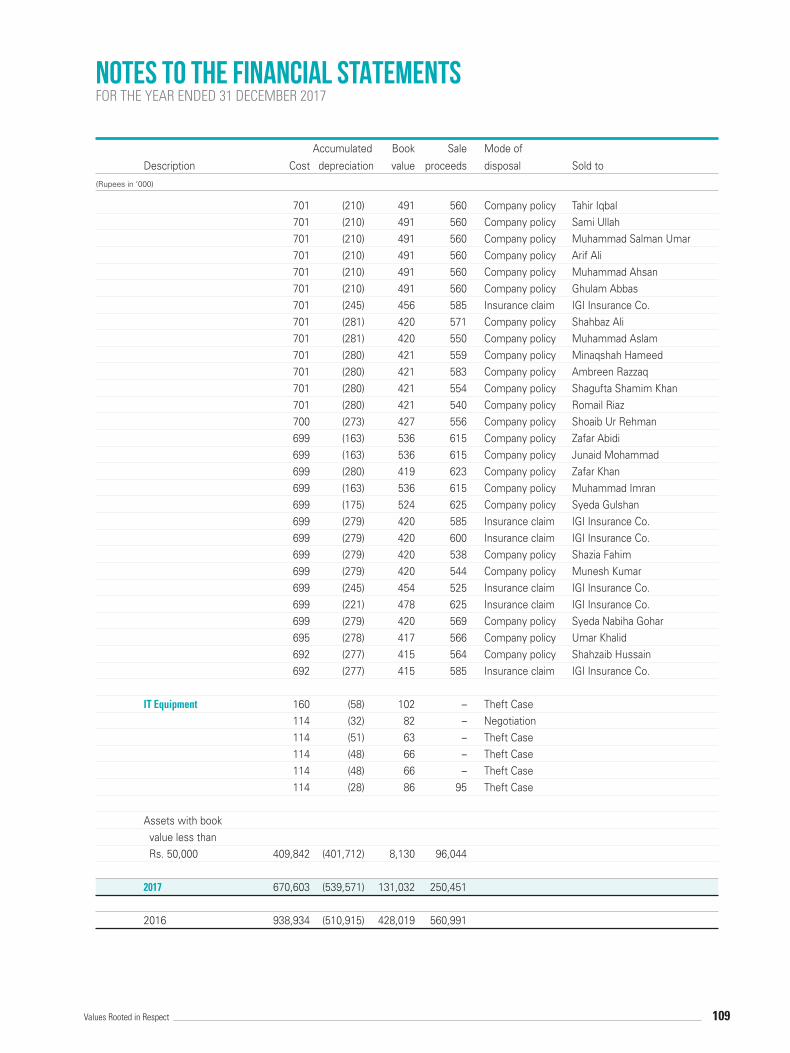
Accumulated Book Sale Mode of
Description Cost depreciation value proceeds disposal Sold to
(Rupees in ‘000)
701 (210) 491 560 Company policy Tahir Iqbal 701 (210) 491 560 Company policy Sami Ullah 701 (210) 491 560 Company policy Muhammad Salman Umar 701 (210) 491 560 Company policy Arif Ali 701 (210) 491 560 Company policy Muhammad Ahsan 701 (210) 491 560 Company policy Ghulam Abbas 701 (245) 456 585 Insurance claim IGI Insurance Co. 701 (281) 420 571 Company policy Shahbaz Ali 701 (281) 420 550 Company policy Muhammad Aslam 701 (280) 421 559 Company policy Minaqshah Hameed 701 (280) 421 583 Company policy Ambreen Razzaq 701 (280) 421 554 Company policy Shagufta Shamim Khan 701 (280) 421 540 Company policy Romail Riaz 700 (273) 427 556 Company policy Shoaib Ur Rehman 699 (163) 536 615 Company policy Zafar Abidi 699 (163) 536 615 Company policy Junaid Mohammad 699 (280) 419 623 Company policy Zafar Khan 699 (163) 536 615 Company policy Muhammad Imran 699 (175) 524 625 Company policy Syeda Gulshan 699 (279) 420 585 Insurance claim IGI Insurance Co. 699 (279) 420 600 Insurance claim IGI Insurance Co. 699 (279) 420 538 Company policy Shazia Fahim 699 (279) 420 544 Company policy Munesh Kumar 699 (245) 454 525 Insurance claim IGI Insurance Co. 699 (221) 478 625 Insurance claim IGI Insurance Co. 699 (279) 420 569 Company policy Syeda Nabiha Gohar 695 (278) 417 566 Company policy Umar Khalid 692 (277) 415 564 Company policy Shahzaib Hussain 692 (277) 415 585 Insurance claim IGI Insurance Co. IT Equipment 160 (58) 102 – Theft Case 114 (32) 82 – Negotiation 114 (51) 63 – Theft Case 114 (48) 66 – Theft Case 114 (48) 66 – Theft Case 114 (28) 86 95 Theft Case Assets with book value less than Rs. 50,000 409,842 (401,712) 8,130 96,044 2017 670,603 (539,571) 131,032 250,451 2016 938,934 (510,915) 428,019 560,991
NOTES TO THE FINANCIAL STATEMENTSFOR THE YEAR ENDED 31 DECEMBER 2017
109Values Rooted in Respect

(Rupees in ‘000) Note 2017 2016
15 Capital work-in-progress
Civil works 682,919 350,587
Plant and machinery 3,387,552 2,923,130
Others 640,081 204,904
4,710,552 3,478,621
Less: Provision for impairment loss (650,967) (712,891)
4,059,585 2,765,730
16 Intangible assets
Cost
Balance as at 01 January 272,655 272,655
Addition during the year – –
Balance as at 31 December 272,655 272,655
Amortization
Balance as at 01 January 241,055 232,987
Charge for the year 26 8,068 8,068
Accumulated amortization as at 31 December 249,123 241,055
Net book value as at 31 December 23,532 31,600
Amortization rate 20% 20%
17 Long term loans and advances
To employees - secured, considered good:
Executives 17.1.1 451,735 379,611
Other employees 50,872 55,758
17.1.2 502,607 435,369
To suppliers - unsecured, considered good – 1,645
502,607 437,014
Less: current portion shown under current assets (135,248) (98,565)
367,359 338,449
17.1 These represent long term interest free loans to employees for the purchase of cars and motor cycles as per
the Company policy and are repayable within a period of 5 years. Loans are secured by the crossed cheque from
employees of the full loan amount in the name of the Company without mentioning any date as part of collateral.
The maximum amount of loans and advances to executives outstanding at the end of any month during the year
was Rs. 464 million (2016: Rs. 420 million).
No loan or advance has been given to Chief Executive and any other Director of the Company.
NOTES TO THE FINANCIAL STATEMENTSFOR THE YEAR ENDED 31 DECEMBER 2017
110 Nestlé Pakistan Limited

(Rupees in ‘000) 2017 2016
17.1.1 Reconciliation of carrying amount of
loans to executives
Balance as at 01 January 379,611 291,971
Disbursements during the year 227,837 187,670
Loans recovered during the year (155,713) (100,030)
Balance as at 31 December 451,735 379,611
17.1.2 The amount of loans and advances to employees and the period in which these will become due are as follows:
(Rupees in ‘000) Note 2017 2016
Less than one year 135,248 98,565
More than one year but not more than 3 years 222,225 127,368
More than 3 years 145,134 209,436
502,607 435,369
18 Long term deposits and prepayments
Long term security deposits 30,163 26,148
Long term prepayments 18.1 5,984 5,898
36,147 32,046
18.1 This represents long term prepayments related to rent of facilities obtained by the Company on cancellable lease
basis. These prepayments are amortized over the term of the lease on straight line basis.
(Rupees in ‘000) Note 2017 2016
19 Stores and spares
Stores 166,635 116,691
Spares, including in transit amounting to Rs. 33.32
million (2016: Rs. 16.23 million) 2,018,720 1,801,506
2,185,355 1,918,197
Less: Provision for obsolete spares 19.1 (415,368) (609,868)
1,769,987 1,308,329
19.1 Provision for obsolete spares
Balance as at 01 January 609,868 499,607
(Reversal) / provision during the year - net (194,500) 171,915
Written off during the year – (61,654)
Balance as at 31 December 415,368 609,868
NOTES TO THE FINANCIAL STATEMENTSFOR THE YEAR ENDED 31 DECEMBER 2017
111Values Rooted in Respect

(Rupees in ‘000) Note 2017 2016
20 Stock in trade
Raw and packing materials including in transit amounting
to Rs. 1,783.50 million (2016: Rs. 1,439.06 million) 11,181,630 7,049,391
Work-in-process 1,000,011 1,277,141
Finished goods 20.1 2,794,801 2,819,891
Goods purchased for resale including in transit amounting
to Rs. 81.81 million (2016: Rs. 23.99 million) 408,689 222,341
15,385,131 11,368,764
Less: Provision for unusable raw and packing material 20.2 (26,843) (161,534)
15,358,288 11,207,230
20.1 The amount charged to profit & loss account of write down of finished goods to net realizable value amounting to
Rs. nil (2016: 9.52) for which the provision was maintained has been written off during the year.
(Rupees in ‘000) Note 2017 2016
20.2 Provision for unusable raw and packing material
Balance as at 01 January 161,534 5,506
(Reversal) / provision during the year - net (120,426) 195,016
Written off during the year (14,265) (38,988)
Balance as at 31 December 26,843 161,534
21 Trade debts
Considered good - unsecured 21.1 781,116 564,460
Considered doubtful - unsecured 21,729 21,729
802,845 586,189
Less: Provision for doubtful debts 21.2 (21,729) (21,729)
781,116 564,460
21.1 These include receivable from related parties amounting to Rs. 5.30 million (2016: Rs. 2.63 million) and are not over
due as at year end.
(Rupees in ‘000) 2017 2016
21.2 Provision for doubtful debts
Balance as at 01 January 21,729 8,593
Net provision during the year – 14,166
Bad debts written off – (1,030)
Balance as at 31 December 21,729 21,729
NOTES TO THE FINANCIAL STATEMENTSFOR THE YEAR ENDED 31 DECEMBER 2017
112 Nestlé Pakistan Limited

(Rupees in ‘000) Note 2017 2016
22 Advances, deposits, prepayments and other receivables
Advances to employees - unsecured,
considered good 708 130
Advances to suppliers - unsecured, considered good 22.1 443,391 403,338
Due from related parties - unsecured,
considered good 22.1 65,689 5,234
Trade deposits and prepayments - considered good 107,988 108,746
Cash margin held against imports 409,339 11,592
Derivative financial asset - cash flow hedge 11.2 17,225 7,520
Other receivables 223,758 124,765
1,268,098 661,325
22.1 These relate to normal business of the Company and are interest free.
(Rupees in ‘000) Note 2017 2016
23 Cash and bank balances
Local currency
- Current accounts 1,037,272 5,427
- Savings accounts 23.1 268,179 340,326
1,305,451 345,753
Foreign currency
- Current accounts 24,310 3,751
Cash in hand 4,223 3,663
1,333,984 353,167
23.1 The balances in savings accounts carry rate of return ranging from 3.74% to 4.00% (2016: 2.40% to 4.08%) per
annum.
(Rupees in ‘000) 2017 2016
24 Sales- net
Own manufactured
Local 129,066,949 117,206,357
Export 5,081,058 4,864,751
134,148,007 122,071,108
Goods purchased for resale 2,044,908 2,534,350
Less :
Sales tax (6,531,304) (5,697,110)
Trade discounts (7,446,913) (6,515,694)
122,214,698 112,392,654
NOTES TO THE FINANCIAL STATEMENTSFOR THE YEAR ENDED 31 DECEMBER 2017
113Values Rooted in Respect

(Rupees in ‘000) Note 2017 2016
25 Cost of goods sold Raw and packing materials consumed 57,401,329 53,300,962 Salaries, wages and amenities 25.1 5,619,997 5,304,612 Fuel and power 2,494,339 1,960,499 Insurance 94,348 95,883 Repairs, maintenance and stores consumption 3,089,048 3,427,576 Rent, rates and taxes 194,470 212,189 Depreciation on property, plant and equipment 14.1 2,813,036 2,914,825 Expenses on information technology 319,802 279,877 Stationery expenses 65,346 57,384 Communication 83,967 84,030 Quality assurance 435,369 365,063 Royalty and technical assistance fee - associated company 2,997,040 3,489,077 Others 549,516 545,714 76,157,607 72,037,691 Decrease / (increase) in work in process 277,130 (234,624) Cost of goods manufactured 76,434,737 71,803,067 Decrease / (increase) in finished goods 34,611 (435,536) Cost of goods sold - own manufactured 76,469,348 71,367,531 Cost of goods sold - purchased for resale 989,401 1,241,861 77,458,749 72,609,392
25.1 Salaries, wages and amenities include Rs. 121.38 million (2016: Rs. 115.51 million) in respect of gratuity, Rs. 60.94
million (2016: Rs. 118.68 million) in respect of pension and Rs. 147.22 million (2016: Rs. 135.89 million) in respect of provident fund.
(Rupees in ‘000) Note 2017 2016
26 Distribution and selling expenses Salaries, wages and amenities 26.1 3,817,061 3,209,435 Training 86,364 98,747 Rent, rates and taxes 80,753 93,515 Insurance 16,539 19,070 Freight outward 2,876,297 2,281,128 Depreciation on property, plant and equipment 14.1 468,312 480,865 Amortization of intangible assets 16 8,068 8,068 Sales promotion and advertisement 9,928,628 10,877,006 Legal and professional charges 17,932 28,340 Vehicle running and maintenance 35,963 30,496 Utilities 44,356 43,025 Repairs and maintenance 190,403 181,283 Subscription, stationery, printing and publication 27,080 29,617 Communications 45,718 38,274 Travelling, conveyance and vehicle running 244,702 251,054 Provision for doubtful advances/debts - net – 16,328 Expenses on information technology 25,513 12,376 Other expenses 493,036 176,781 18,406,725 17,875,408
NOTES TO THE FINANCIAL STATEMENTSFOR THE YEAR ENDED 31 DECEMBER 2017
114 Nestlé Pakistan Limited

26.1 Salaries, wages and amenities include Rs. 92.80 million (2016: Rs. 80.73 million) in respect of gratuity, Rs. 73.94 million (2016: Rs. 87.98 million) in respect of pension and Rs. 109.57 million (2016: Rs. 94.94 million) in respect of provident fund.
(Rupees in ‘000) Note 2017 2016
27 Administration expenses Salaries, wages and amenities 27.1 1,461,041 1,434,513 Training 40,927 55,461 Rent, rates and taxes 152,225 137,227 Insurance 2,676 2,381 Depreciation on property, plant and equipment 14.1 93,202 100,141 Legal and professional charges 27.2 83,719 252,571 Vehicles running and maintenance 20,653 18,050 Utilities 38,900 36,926 Repairs and maintenance 64,080 35,135 Subscription, stationery, printing and publication 51,140 42,271 Communications 88,878 84,564 Travelling and conveyance 155,062 126,316 Expenses on information technology 363,349 343,942 Other expenses 125,891 90,688 2,741,743 2,760,186
27.1 Salaries, wages and amenities include Rs. 48.78 million (2016: Rs. 47.84 million) in respect of gratuity, Rs. (24.93)
million (2016: Rs. 63.02 million) in respect of pension and Rs. 62.02 million (2016: Rs. 59.21 million) in respect of provident fund.
27.2 Legal and professional charges include the following in respect of auditors’ services for:
(Rupees in ‘000) 2017 2016
Statutory audit 1,050 1,050 Half yearly review 158 158 Group audit 315 315 Other certificates 13 137 Other services 63 415 Out of pocket expenses 115 132
1,714 2,207
28 Finance cost Mark-up on long term finances - secured 474,816 624,997 Mark-up on loan from associated company - unsecured – 7,984 Mark-up on short term borrowings - secured 448,607 201,431 Mark-up on short term running finances - secured 134,995 83,570 Bank charges 37,212 41,023 1,095,630 959,005
NOTES TO THE FINANCIAL STATEMENTSFOR THE YEAR ENDED 31 DECEMBER 2017
115Values Rooted in Respect
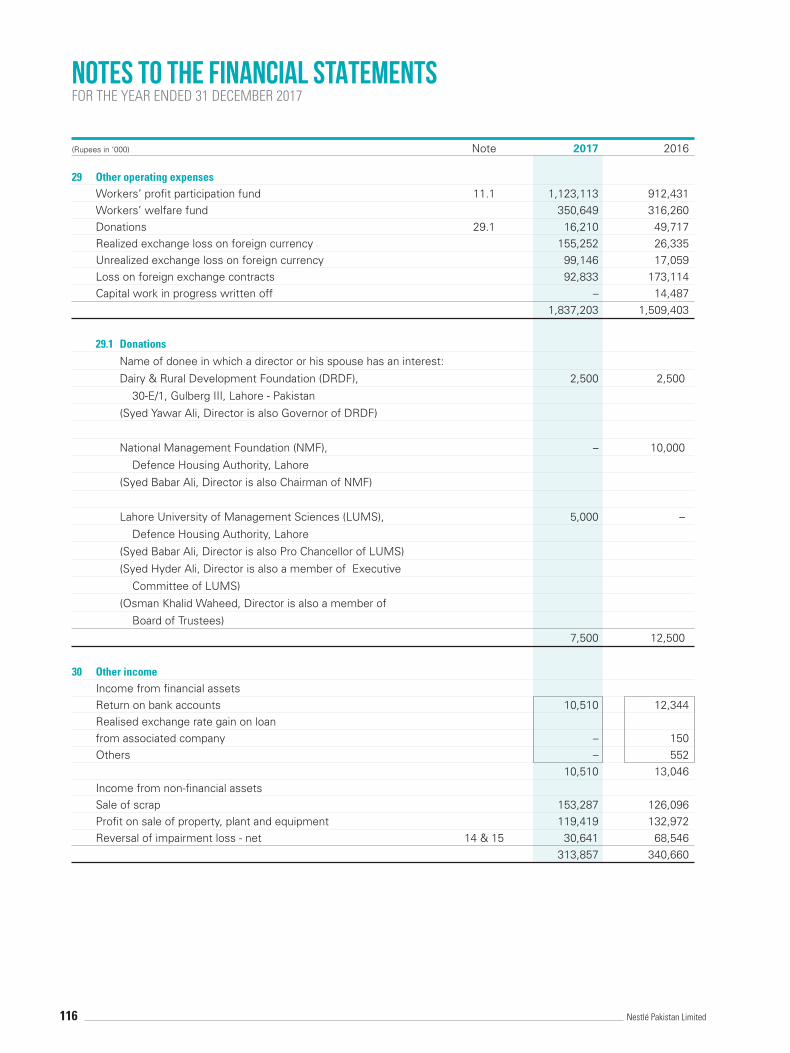
(Rupees in ‘000) Note 2017 2016
29 Other operating expenses Workers’ profit participation fund 11.1 1,123,113 912,431 Workers’ welfare fund 350,649 316,260 Donations 29.1 16,210 49,717 Realized exchange loss on foreign currency 155,252 26,335 Unrealized exchange loss on foreign currency 99,146 17,059 Loss on foreign exchange contracts 92,833 173,114 Capital work in progress written off – 14,487 1,837,203 1,509,403
29.1 Donations
Name of donee in which a director or his spouse has an interest:
Dairy & Rural Development Foundation (DRDF), 2,500 2,500
30-E/1, Gulberg III, Lahore - Pakistan
(Syed Yawar Ali, Director is also Governor of DRDF)
National Management Foundation (NMF), – 10,000
Defence Housing Authority, Lahore
(Syed Babar Ali, Director is also Chairman of NMF)
Lahore University of Management Sciences (LUMS), 5,000 –
Defence Housing Authority, Lahore
(Syed Babar Ali, Director is also Pro Chancellor of LUMS)
(Syed Hyder Ali, Director is also a member of Executive
Committee of LUMS)
(Osman Khalid Waheed, Director is also a member of
Board of Trustees)
7,500 12,500
30 Other income Income from financial assets Return on bank accounts 10,510 12,344 Realised exchange rate gain on loan from associated company – 150 Others – 552 10,510 13,046 Income from non-financial assets Sale of scrap 153,287 126,096 Profit on sale of property, plant and equipment 119,419 132,972 Reversal of impairment loss - net 14 & 15 30,641 68,546 313,857 340,660
NOTES TO THE FINANCIAL STATEMENTSFOR THE YEAR ENDED 31 DECEMBER 2017
116 Nestlé Pakistan Limited
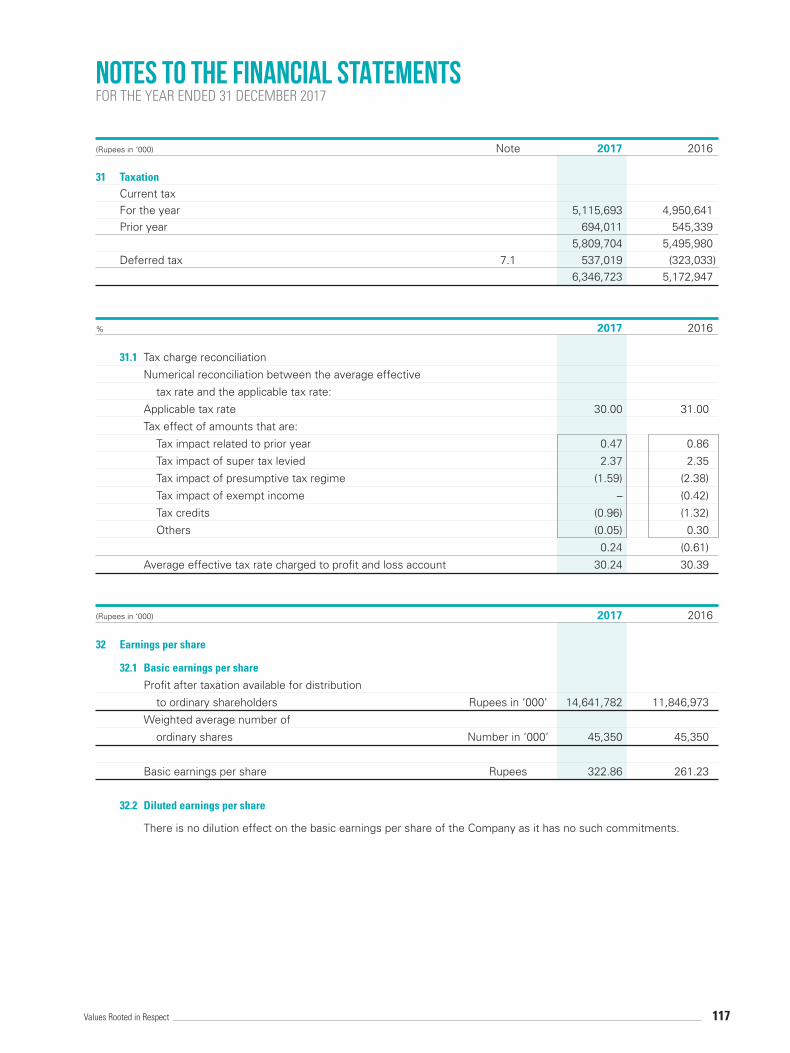
(Rupees in ‘000) Note 2017 2016
31 Taxation Current tax For the year 5,115,693 4,950,641 Prior year 694,011 545,339 5,809,704 5,495,980 Deferred tax 7.1 537,019 (323,033) 6,346,723 5,172,947
% 2017 2016
31.1 Tax charge reconciliation
Numerical reconciliation between the average effective
tax rate and the applicable tax rate:
Applicable tax rate 30.00 31.00
Tax effect of amounts that are:
Tax impact related to prior year 0.47 0.86
Tax impact of super tax levied 2.37 2.35
Tax impact of presumptive tax regime (1.59) (2.38)
Tax impact of exempt income – (0.42)
Tax credits (0.96) (1.32)
Others (0.05) 0.30
0.24 (0.61)
Average effective tax rate charged to profit and loss account 30.24 30.39
(Rupees in ‘000) 2017 2016
32 Earnings per share
32.1 Basic earnings per share
Profit after taxation available for distribution
to ordinary shareholders Rupees in ‘000’ 14,641,782 11,846,973
Weighted average number of
ordinary shares Number in ‘000’ 45,350 45,350
Basic earnings per share Rupees 322.86 261.23
32.2 Diluted earnings per share
There is no dilution effect on the basic earnings per share of the Company as it has no such commitments.
NOTES TO THE FINANCIAL STATEMENTSFOR THE YEAR ENDED 31 DECEMBER 2017
117Values Rooted in Respect

33 Transactions with related parties
The related parties comprise of holding company, associated companies, other related companies, key management
personnel and employees retirement benefit funds. The Company in the normal course of business carries out
transactions with various related parties. Amounts due from and to related parties are shown under receivables and
payables and remuneration to key management personnel is disclosed in note 36. Other significant transactions with
related parties are as follows:
(Rupees in ‘000) 2017 2016
33.1 Transactions during the year
Associated companies
- Royalty and technical assistance fee 3,468,993 3,165,569
- Purchase of assets, goods, services, rental and
reimbursable expenses 16,693,274 14,871,838
- Interest on foreign currency loan – 7,984
- Sale of goods 65,059 102,036
- Repayment of foreign currency loan – 1,047,600
- Donations 7,500 12,500
- Insurance claims 40,804 35,189
Other related parties
- Contribution to staff retirement benefit plans 742,290 679,957 All transactions with related parties have been carried out on mutually agreed terms and conditions except for
donations.
NOTES TO THE FINANCIAL STATEMENTSFOR THE YEAR ENDED 31 DECEMBER 2017
118 Nestlé Pakistan Limited

(Rupees in ‘000) Note 2017 2016
34 Cash generated from operations
Profit before taxation 20,988,505 17,019,920
Adjustment for non-cash charges and other items:
Depreciation on property, plant and equipment 3,374,550 3,495,831
Fixed assets charged off – 291,422
Amortization of intangible assets 8,068 8,068
Reversal of impairment loss - net (30,641) (68,546)
Gain on disposal of property, plant and equipment (119,419) (132,972)
Exchange rate gain on foreign currency loan
from associated company – (150)
Provision for workers’ profit participation fund 1,123,113 912,431
Provision for workers’ welfare fund 350,649 316,260
Provision for doubtful advances/debts - net – 16,328
Reversal / (provision) for obsolete spares - net (194,500) 171,915
Unrealized exchange loss on foreign currency 99,146 17,059
(Reversal) / provision for unusable raw and packing material (120,426) 195,016
Provision for staff retirement benefits 372,901 513,749
Finance cost 1,095,630 959,005
Profit before working capital changes 26,947,576 23,715,336
Effect on cash flow due to working capital changes:
(Increase)/ decrease in current assets:
Stores and spares (267,158) (217,455)
Stock in trade (4,030,632) (1,927,565)
Trade debts (216,656) (265,952)
Advances, deposits, prepayments and other receivables (597,068) 167,335
Increase in current liabilities:
Trade and other payables 89,758 8,063,136
(5,021,756) 5,819,499
21,925,820 29,534,835
35 Cash and cash equivalents
Cash and bank balances 23 1,333,984 353,167
Short term running finance under mark-up
arrangements - secured 10 (513,908) (2,013,120)
820,076 (1,659,953)
NOTES TO THE FINANCIAL STATEMENTSFOR THE YEAR ENDED 31 DECEMBER 2017
119Values Rooted in Respect

36 Remuneration of Chief Executive, Directors and Executives
The aggregate amounts charged in these financial statements during the year for remuneration, including certain
benefits, to the chief executive, executive directors, non-executive directors and executives of the Company are as
follows:
Chairman Chief Executive Executive Director Executive
(Rupees in ‘000) 2017 2016 2017 2016 2017 2016 2017 2016
Fee / managerial remuneration 5,617 5,470 29,894 25,611 41,764 35,303 2,884,200 2,525,438
Bonus – – 9,218 9,030 11,203 11,837 723,546 642,807
Retirement benefits – – – – 3,211 2,671 511,035 516,531
Housing – – 3,762 3,534 3,194 3,049 8,031 10,849
Reimbursable expenses 1,050 699 13,052 10,570 23,949 15,373 691,202 577,861
6,667 6,169 55,926 48,745 83,321 68,233 4,818,014 4,273,486
Number of persons 1 1 1 1 2 2 1,640 1,481
36.1 The chairman, chief executive, executive directors and certain executives of the Company are provided with use of
Company maintained vehicles and residential telephones.
36.2 The aggregate amount charged in these financial statements in respect of contribution to provident fund of key
management personnel is Rs. 211.42 million (2016: Rs. 186.77 million).
36.3 Meeting fees amounting to Rs. 2,475,000 (2016: Rs. 2,700,00) was paid to non executive directors during the year.
Capacity Production
2017 2016 2017 2016
37 Capacity and production
Liquid products - litres in thousand 1,894,155 1,797,329 1,096,222 1,027,518
Non-liquid products - Kgs in thousand 179,508 183,208 108,611 103,028
Under utilization of capacity was mainly due to seasonal impact of fresh milk.
38 Segment reporting
Segment information is presented in respect of the Company’s business. The primary format, business segment, is
based on the Company’s management reporting structure.
Segment results, assets and liabilities include items directly attributable to a segment as well as those that can be
allocated on a reasonable basis. Unallocated assets and liabilities include short term and long term borrowings, employees
retirement benefits and other operating liabilities.
Segment capital expenditure is the total cost incurred during the period to acquire segment assets that are expected to
be used for more than one year.
NOTES TO THE FINANCIAL STATEMENTSFOR THE YEAR ENDED 31 DECEMBER 2017
120 Nestlé Pakistan Limited

The Company’s operations comprise of the following main business segments and product categories:
i) Milk and nutrition products
Milk based products and cereals ii) Beverages
Juices and water
38.1 Segment analysis and reconciliation for the year ended 31 December
Milk and Nutrition Products Beverages Other Operations Total
(Rupees in ‘000) 2017 2016 2017 2016 2017 2016 2017 2016
Sales
External sales 94,718,133 88,578,540 26,709,999 23,091,721 786,566 722,393 122,214,698 112,392,654
Inter-segment sales – – – – – – – –
Total revenue 94,718,133 88,578,540 26,709,999 23,091,721 786,566 722,393 122,214,698 112,392,654
Depreciation and amortization 2,509,829 2,586,163 809,780 850,223 63,009 67,513 3,382,618 3,503,899
Operating profit before tax and before
unallocated expenses 20,152,847 17,164,969 3,826,046 2,443,410 (371,412) (460,711) 23,607,481 19,147,668
Unallocated corporate expenses
Finance cost (1,095,630) (959,005)
Exchange loss on foreign currency (254,398) (43,394)
Other operating expenses (1,582,805) (1,466,009)
Other operating income 283,216 272,114
Taxation (6,346,723) (5,172,947)
Other material non-cash items
Reversal of Impairment loss - net 30,641 68,546 – – – – 30,641 68,546
Profit after taxation 14,641,782 11,846,973
Segment assets 35,876,654 31,513,706 14,296,431 11,927,256 508,219 482,510 50,681,304 43,923,472
Unallocated assets 7,664,315 6,858,298
Total assets 58,345,619 50,781,770
Segment liabilities 20,555,771 19,640,343 6,056,985 5,360,924 170,701 160,175 26,783,457 25,161,442
Unallocated liabilities 26,927,822 16,808,276
Total liabilities 53,711,279 41,969,718
Segment capital expenditure 2,609,139 3,422,617 2,746,815 622,005 101,225 35,633 5,457,179 4,080,255
NOTES TO THE FINANCIAL STATEMENTSFOR THE YEAR ENDED 31 DECEMBER 2017
121Values Rooted in Respect

(Rupees in ‘000) 2017 2016
38.2 Geographical segments
Sales are made by the Company in the following countries:
Pakistan 117,133,640 107,527,903
Afghanistan 4,973,627 4,745,011
Other foreign countries 107,431 119,740
122,214,698 112,392,654
The Company manages and operates manufacturing facilities and sales offices in Pakistan only.
39 Financial risk management
Financial risk factors
The Company’s activities expose it to a variety of financial risks, market risk (including currency risk, other price risk
and interest rate risk), credit risk and liquidity risk. The Company’s overall risk management program focuses on the
unpredictability of financial markets and seeks to minimize potential adverse effects on the financial performance.
The Company finances its operations through equity, borrowings and management of working capital with a view to
maintain an appropriate mix between various sources of finance to minimize risk. The Company follows an effective cash
management and planning policy and maintains flexibility in funding by keeping committed credit lines available. Market
risks are managed by the Company through the adoption of appropriate policies to cover currency risks and interest rate
risks. The Company applies credit limits to its customers and obtains advances from them.
39.1 Market risk
39.1.1 Currency Risk
Currency risk is the risk that the fair value or future cash flows of a financial instrument will fluctuate because of
changes in foreign exchange rates. Currency risk arises mainly from future commercial transactions or receivables
and payables that exist due to transactions in foreign currencies.
The Company is exposed to currency risk arising from various currency exposures, primarily with respect to various
currencies. Currently, the Company’s foreign exchange risk exposure is restricted to the amounts receivable from /
payable to the foreign entities. The Company’s major exposure to currency risk is as follows:
NOTES TO THE FINANCIAL STATEMENTSFOR THE YEAR ENDED 31 DECEMBER 2017
122 Nestlé Pakistan Limited
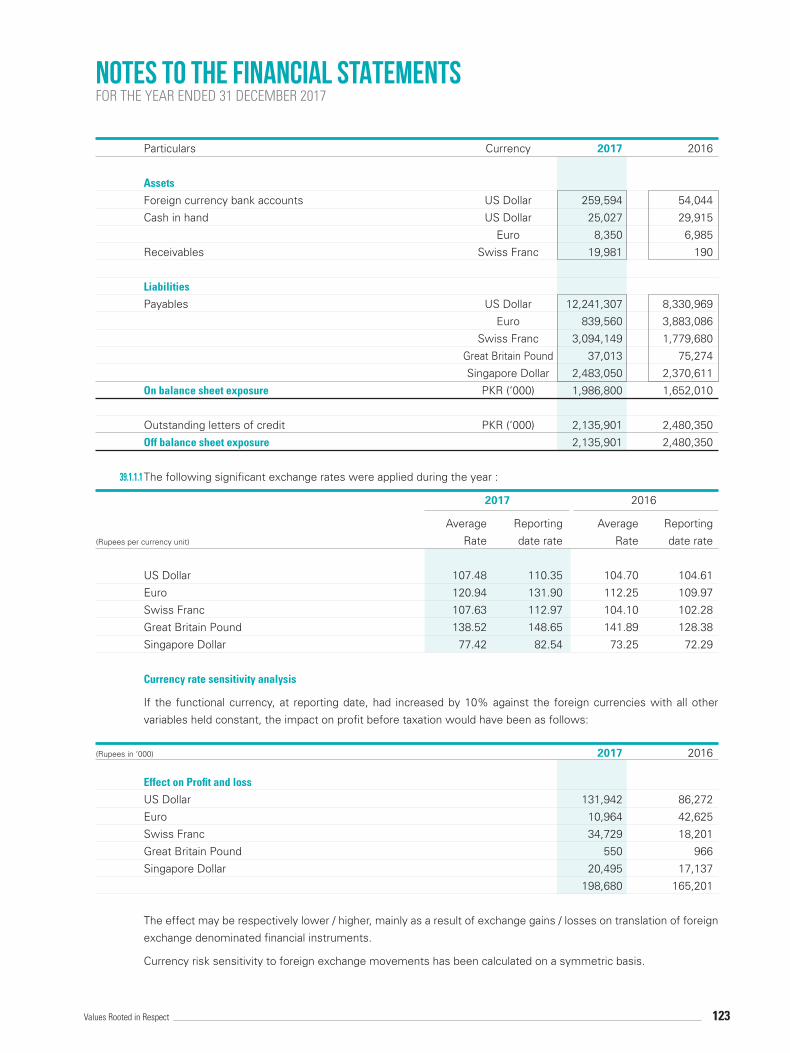
Particulars Currency 2017 2016
Assets
Foreign currency bank accounts US Dollar 259,594 54,044
Cash in hand US Dollar 25,027 29,915
Euro 8,350 6,985
Receivables Swiss Franc 19,981 190
Liabilities
Payables US Dollar 12,241,307 8,330,969
Euro 839,560 3,883,086
Swiss Franc 3,094,149 1,779,680
Great Britain Pound 37,013 75,274
Singapore Dollar 2,483,050 2,370,611
On balance sheet exposure PKR (‘000) 1,986,800 1,652,010
Outstanding letters of credit PKR (‘000) 2,135,901 2,480,350
Off balance sheet exposure 2,135,901 2,480,350
39.1.1.1 The following significant exchange rates were applied during the year :
2017 2016
Average Reporting Average Reporting
(Rupees per currency unit) Rate date rate Rate date rate
US Dollar 107.48 110.35 104.70 104.61
Euro 120.94 131.90 112.25 109.97
Swiss Franc 107.63 112.97 104.10 102.28
Great Britain Pound 138.52 148.65 141.89 128.38
Singapore Dollar 77.42 82.54 73.25 72.29
Currency rate sensitivity analysis
If the functional currency, at reporting date, had increased by 10% against the foreign currencies with all other
variables held constant, the impact on profit before taxation would have been as follows:
(Rupees in ‘000) 2017 2016
Effect on Profit and loss
US Dollar 131,942 86,272
Euro 10,964 42,625
Swiss Franc 34,729 18,201
Great Britain Pound 550 966
Singapore Dollar 20,495 17,137
198,680 165,201
The effect may be respectively lower / higher, mainly as a result of exchange gains / losses on translation of foreign
exchange denominated financial instruments.
Currency risk sensitivity to foreign exchange movements has been calculated on a symmetric basis.
NOTES TO THE FINANCIAL STATEMENTSFOR THE YEAR ENDED 31 DECEMBER 2017
123Values Rooted in Respect
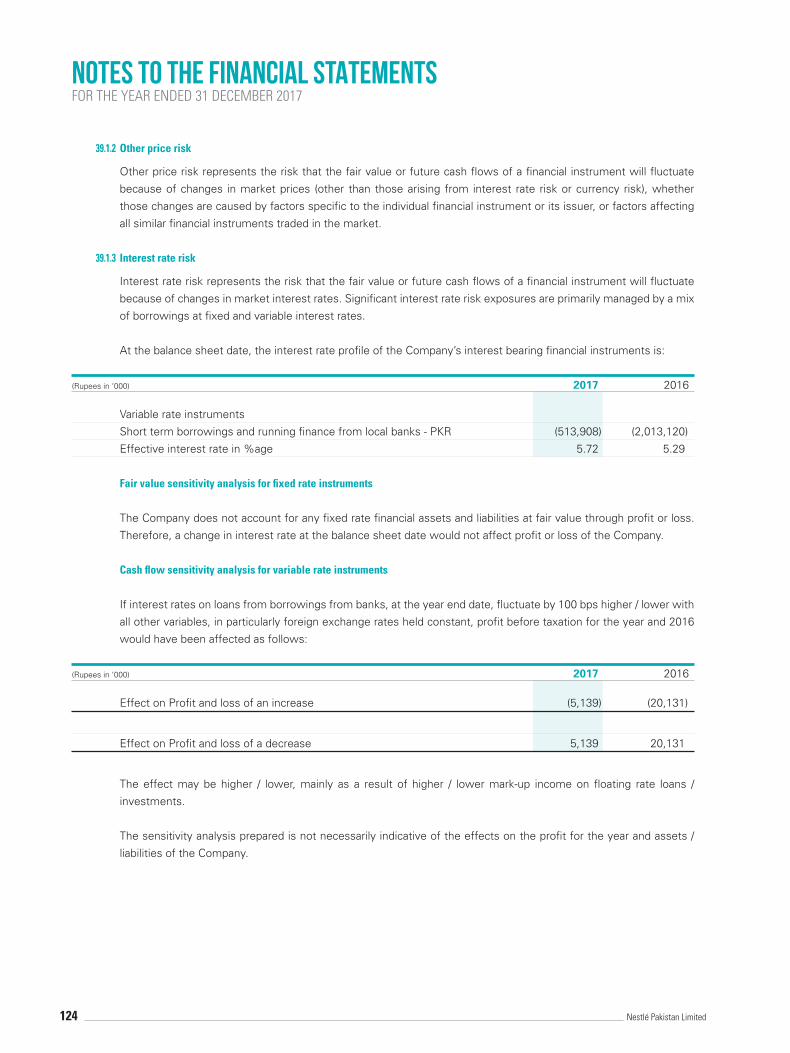
39.1.2 Other price risk
Other price risk represents the risk that the fair value or future cash flows of a financial instrument will fluctuate
because of changes in market prices (other than those arising from interest rate risk or currency risk), whether
those changes are caused by factors specific to the individual financial instrument or its issuer, or factors affecting
all similar financial instruments traded in the market.
39.1.3 Interest rate risk
Interest rate risk represents the risk that the fair value or future cash flows of a financial instrument will fluctuate
because of changes in market interest rates. Significant interest rate risk exposures are primarily managed by a mix
of borrowings at fixed and variable interest rates.
At the balance sheet date, the interest rate profile of the Company’s interest bearing financial instruments is:
(Rupees in ‘000) 2017 2016
Variable rate instruments
Short term borrowings and running finance from local banks - PKR (513,908) (2,013,120)
Effective interest rate in %age 5.72 5.29
Fair value sensitivity analysis for fixed rate instruments
The Company does not account for any fixed rate financial assets and liabilities at fair value through profit or loss.
Therefore, a change in interest rate at the balance sheet date would not affect profit or loss of the Company.
Cash flow sensitivity analysis for variable rate instruments
If interest rates on loans from borrowings from banks, at the year end date, fluctuate by 100 bps higher / lower with
all other variables, in particularly foreign exchange rates held constant, profit before taxation for the year and 2016
would have been affected as follows:
(Rupees in ‘000) 2017 2016
Effect on Profit and loss of an increase (5,139) (20,131)
Effect on Profit and loss of a decrease 5,139 20,131
The effect may be higher / lower, mainly as a result of higher / lower mark-up income on floating rate loans /
investments.
The sensitivity analysis prepared is not necessarily indicative of the effects on the profit for the year and assets /
liabilities of the Company.
NOTES TO THE FINANCIAL STATEMENTSFOR THE YEAR ENDED 31 DECEMBER 2017
124 Nestlé Pakistan Limited

39.1.4 Fair value measurement of financial instruments
Fair value is the price that would be received to sell an asset or paid to transfer a liability in an orderly transaction
between market participants at the measurement date.
Underlying the definition of fair value is the presumption that the company is a going concern and there is no
intention or requirement to curtail materially the scale of its operations or to undertake a transaction on adverse
terms.
A financial instrument is regarded as quoted in an active market if quoted prices are readily and regularly available
from an exchange dealer, broker, industry group, pricing service, or regulatory agency, and those prices represent
actual and regularly occurring market transactions on an arm’s length basis.
IFRS 13 ‘Fair Value Measurement’ requires the company to classify fair value measurements and fair value hierarchy
that reflects the significance of the inputs used in making the measurements of fair value hierarchy has the following
levels:
– Quoted prices (unadjusted) in active markets for identical assets or liabilities (Level 1)
– Inputs other than quoted prices included within level 1 that are observable for the asset either directly (that
is, derived from prices) (Level 2)
– Inputs for the asset or liability that are not based on observable market data (that is, unadjusted) inputs
(Level 3)
Transfer between levels of the fair value hierarchy are recognised at the end of the reporting period during which
the changes have occurred.
The following table shows the carrying amounts and fair values of financial assets and financial liabilities, including
their levels in the fair value hierarchy. It does not include fair value information for financial assets and financial
liabilities not measured at fair value if the carrying amount is a reasonable approximation of fair value.
NOTES TO THE FINANCIAL STATEMENTSFOR THE YEAR ENDED 31 DECEMBER 2017
125Values Rooted in Respect
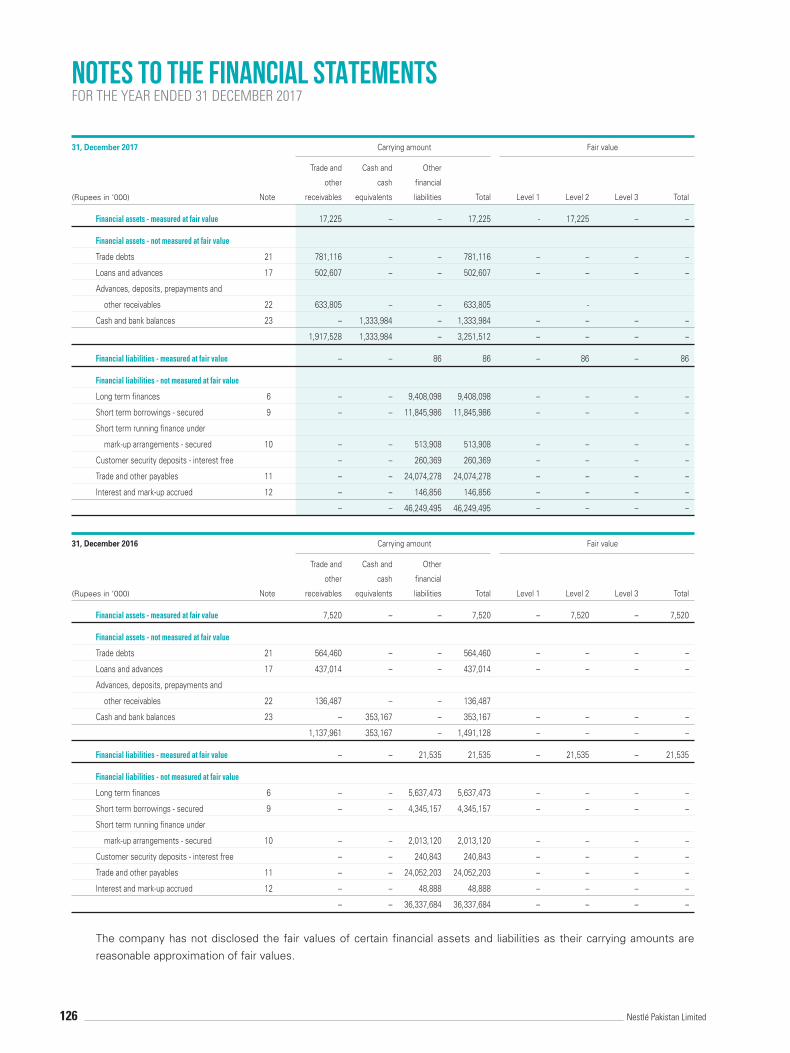
31, December 2017 Carrying amount Fair value
Trade and Cash and Other
other cash financial
(Rupees in ‘000) Note receivables equivalents liabilities Total Level 1 Level 2 Level 3 Total
Financial assets - measured at fair value 17,225 – – 17,225 - 17,225 – –
Financial assets - not measured at fair value
Trade debts 21 781,116 – – 781,116 – – – –
Loans and advances 17 502,607 – – 502,607 – – – –
Advances, deposits, prepayments and
other receivables 22 633,805 – – 633,805 -
Cash and bank balances 23 – 1,333,984 – 1,333,984 – – – –
1,917,528 1,333,984 – 3,251,512 – – – –
Financial liabilities - measured at fair value – – 86 86 – 86 – 86
Financial liabilities - not measured at fair value
Long term finances 6 – – 9,408,098 9,408,098 – – – –
Short term borrowings - secured 9 – – 11,845,986 11,845,986 – – – –
Short term running finance under
mark-up arrangements - secured 10 – – 513,908 513,908 – – – –
Customer security deposits - interest free – – 260,369 260,369 – – – –
Trade and other payables 11 – – 24,074,278 24,074,278 – – – –
Interest and mark-up accrued 12 – – 146,856 146,856 – – – –
– – 46,249,495 46,249,495 – – – –
31, December 2016 Carrying amount Fair value
Trade and Cash and Other
other cash financial
(Rupees in ‘000) Note receivables equivalents liabilities Total Level 1 Level 2 Level 3 Total
Financial assets - measured at fair value 7,520 – – 7,520 – 7,520 – 7,520
Financial assets - not measured at fair value
Trade debts 21 564,460 – – 564,460 – – – –
Loans and advances 17 437,014 – – 437,014 – – – –
Advances, deposits, prepayments and
other receivables 22 136,487 – – 136,487
Cash and bank balances 23 – 353,167 – 353,167 – – – –
1,137,961 353,167 – 1,491,128 – – – –
Financial liabilities - measured at fair value – – 21,535 21,535 – 21,535 – 21,535
Financial liabilities - not measured at fair value
Long term finances 6 – – 5,637,473 5,637,473 – – – –
Short term borrowings - secured 9 – – 4,345,157 4,345,157 – – – –
Short term running finance under
mark-up arrangements - secured 10 – – 2,013,120 2,013,120 – – – –
Customer security deposits - interest free – – 240,843 240,843 – – – –
Trade and other payables 11 – – 24,052,203 24,052,203 – – – –
Interest and mark-up accrued 12 – – 48,888 48,888 – – – –
– – 36,337,684 36,337,684 – – – –
The company has not disclosed the fair values of certain financial assets and liabilities as their carrying amounts are
reasonable approximation of fair values.
NOTES TO THE FINANCIAL STATEMENTSFOR THE YEAR ENDED 31 DECEMBER 2017
126 Nestlé Pakistan Limited

39.2 Credit risk
Credit risk represents the risk that one party to a financial instrument will cause a financial loss for the other party by
failing to discharge an obligation. Company’s credit risk is primarily attributable to its long term deposits, trade debts,
advances, deposits and other receivables and balances at banks. The carrying amount of financial assets represents
the maximum credit exposure. The maximum exposure to credit risk at the reporting date is as follows:
(Rupees in ‘000) 2017 2016
Particulars Trade debts 781,116 564,460 Advances, deposits and other receivables 524,200 104,228 Bank balances 1,329,761 349,504 2,635,077 1,018,192
The aging of trade debts at the reporting date is: Not yet due 750,896 555,857 Past due 0 - 30 days 13,195 5,125 Past due 31 - 60 days 8,825 2,662 Past due 61 - 90 days 5,319 459 Past due 91 - 120 days 1,854 58 Past due 120 days 1,027 299
781,116 564,460
The credit risk on liquid funds is limited because the counter parties are banks with reasonably high credit ratings.
The Company believes that it is not exposed to major concentration of credit risk as its exposure is spread over a
large number of counter parties and subscribers in the case of trade debts.
The credit quality of cash and bank balances that are neither past due nor impaired can be assessed by reference to
external credit ratings or to historical information about counterparty default rate:
Rating 2017 Rating 2016
Short Term Long Term Agency Short Term Long Term Agency
Habib Bank Limited A-1+ AAA JCR-VIS A-1+ AAA JCR-VIS Standard Chartered Bank Limited A1+ AAA PACRA A1+ AAA PACRA United Bank Limited A-1+ AAA JCR-VIS A-1+ AAA JCR-VIS Citi Bank N.A P-1 A1 Moody’s P-1 A1 Moody’s Deutsche Bank AG P-2 Baa2 Moody’s P-2 A3 Moody’s
Meezan Bank Limited A-1+ AA JCR-VIS A-1+ AA JCR-VIS
Due to the Company’s long standing business relationships with these counterparties and after giving due
consideration to their strong financial standing, management does not expect non performance by these counter
parties on their obligations to the Company. Accordingly, the credit risk is minimal.
NOTES TO THE FINANCIAL STATEMENTSFOR THE YEAR ENDED 31 DECEMBER 2017
127Values Rooted in Respect

39.3 Liquidity risk
Liquidity risk is the risk that an entity will encounter difficulty in meeting obligations associated with financial
liabilities.
The Company’s approach to managing liquidity is to ensure, as far as possible, that it will always have sufficient
liquidity to meet its liabilities when due, under both normal and stressed conditions. For this purpose the Company
has sufficient running finance facilities available from various commercial banks to meet its liquidity requirements.
Further, liquidity position of the Company is closely monitored through budgets, cash flow projections and
comparison with actual results by the Board.
The following are the contractual maturity analysis of financial liabilities as at 31 December 2017:
Carrying Contractual Less than 6 to 12 1 year to Total
(Rupees in ‘000) value cash flows 6 months months 5 years
Financial liability
Derivative financial liability
- cash flow hedge 86 86 86 – – 86
Long term finances 9,408,098 11,573,133 392,149 392,149 10,788,835 11,573,133
Short term borrowings 11,845,986 12,052,193 12,052,193 – – 12,052,193
Short term running finance
under mark-up arrangement 513,908 545,770 545,770 – – 545,770
Customer security deposits 260,369 260,369 260,369 – – 260,369
Trade and other payables 24,074,278 24,074,278 24,074,278 – – 24,074,278
Interest and mark-up accrued 146,856 146,856 146,856 – – 146,856
46,249,581 48,652,685 37,471,701 392,149 10,788,835 48,652,685
The following are the contractual maturity analysis of financial liabilities as at 31 December 2016:
Carrying Contractual Less than 6 to 12 1 year to Total
(Rupees in ‘000) value cash flows 6 months months 5 years
Financial liability
Derivative financial liability
- cash flow hedge 21,535 21,535 21,535 – – 21,535
Long term finances 5,637,473 7,749,781 229,509 229,509 7,290,763 7,749,781
Short term borrowings 4,345,157 4,432,213 2,035,463 2,396,750 – 4,432,213
Short term running finance
under mark-up arrangement 2,013,120 2,137,934 62,407 2,075,527 – 2,137,934
Customer security deposits 240,843 260,369 260,369 – – 260,369
Trade and other payables 24,052,203 24,052,203 24,052,203 – – 24,052,203
Interest and mark-up accrued 48,888 48,888 48,888 – – 48,888
36,359,219 38,702,923 26,710,374 4,701,786 7,290,763 38,702,923
Fair values of financial assets and liabilities
The carrying values of all financial assets and liabilities reflected in the financial statements approximate their fair
values. Fair value is determined on the basis of objective evidence at each reporting date. It is the amount for
which an asset could be exchanged, or a liability settled, between knowledgeable, willing parties in an arm’s length
transaction.
NOTES TO THE FINANCIAL STATEMENTSFOR THE YEAR ENDED 31 DECEMBER 2017
128 Nestlé Pakistan Limited
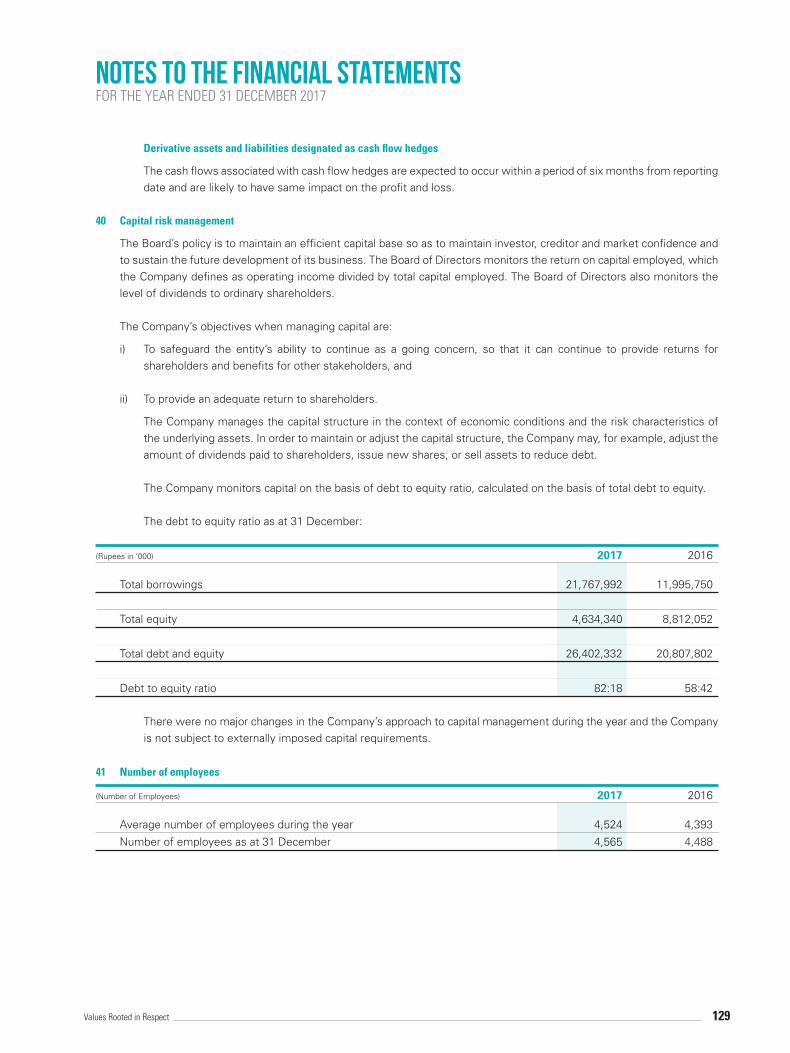
Derivative assets and liabilities designated as cash flow hedges
The cash flows associated with cash flow hedges are expected to occur within a period of six months from reporting date and are likely to have same impact on the profit and loss.
40 Capital risk management
The Board’s policy is to maintain an efficient capital base so as to maintain investor, creditor and market confidence and to sustain the future development of its business. The Board of Directors monitors the return on capital employed, which the Company defines as operating income divided by total capital employed. The Board of Directors also monitors the level of dividends to ordinary shareholders.
The Company’s objectives when managing capital are:
i) To safeguard the entity’s ability to continue as a going concern, so that it can continue to provide returns for shareholders and benefits for other stakeholders, and
ii) To provide an adequate return to shareholders.
The Company manages the capital structure in the context of economic conditions and the risk characteristics of the underlying assets. In order to maintain or adjust the capital structure, the Company may, for example, adjust the amount of dividends paid to shareholders, issue new shares, or sell assets to reduce debt.
The Company monitors capital on the basis of debt to equity ratio, calculated on the basis of total debt to equity.
The debt to equity ratio as at 31 December:
(Rupees in ‘000) 2017 2016
Total borrowings 21,767,992 11,995,750
Total equity 4,634,340 8,812,052
Total debt and equity 26,402,332 20,807,802
Debt to equity ratio 82:18 58:42 There were no major changes in the Company’s approach to capital management during the year and the Company
is not subject to externally imposed capital requirements.
41 Number of employees
(Number of Employees) 2017 2016
Average number of employees during the year 4,524 4,393
Number of employees as at 31 December 4,565 4,488
NOTES TO THE FINANCIAL STATEMENTSFOR THE YEAR ENDED 31 DECEMBER 2017
129Values Rooted in Respect

42 Provident fund disclosure
The following information is based on latest audited financial statements of the Fund as of 31 December 2017:
Audited Audited(Rupees in ‘000) 2017 2016
Size of the fund - total assets 3,541,930 3,266,680
Cost of investments made 3,193,454 2,955,116
Fair value of investments 3,540,788 3,265,609
Percentage of investments made 99.97% 99.97%
2017 2016
Note (Rs in ‘000) % (Rs in ‘000) %
42.1 The break-up of fair value of investments is:
Pakistan investment bonds 350,845 9.91% 581,519 17.81%
Term finance certificates 30,750 0.87% 30,808 0.94%
Term deposit receipts 1,506,911 42.56% 1,231,041 37.70%
Investment in equity instruments 42.2 687,148 19.41% 688,383 21.08%
Mutual funds 139,298 3.93% 63,001 1.93%
Temporary interest based loans to members 635,610 17.95% 494,785 15.15%
Savings accounts with banks 190,226 5.37% 176,072 5.39%
3,540,788 100.00% 3,265,609 100.00%
42.2 Fair value of equity instruments include ordinary shares of the Company whose fair value as at 31 December 2017
is Rs. 10.10 million (2016: Rs. 6.30 million).
42.3 The investments out of provident fund have been made in accordance with the provisions of Section 218 of the
Companies Act, 2017 and the rules formulated for this purpose.
NOTES TO THE FINANCIAL STATEMENTSFOR THE YEAR ENDED 31 DECEMBER 2017
130 Nestlé Pakistan Limited

43
Reco
ncili
atio
n of
mov
emen
t of l
iabi
litie
s to
cas
h flo
ws
aris
ing
from
fina
ncin
g ac
tiviti
es
20
17
Li
abilit
ies
Eq
uity
Lo
ng te
rm
Shor
t ter
m
Shor
t ter
m
Inte
rest
Un
claim
ed
Shar
e Sh
are
Ge
nera
l To
tal
fin
ance
s bo
rrow
ings
ru
nnin
g m
ark-
up
divid
end
capi
tal
prem
ium
Re
serv
e
(Rup
ees
in ‘0
00)
finan
ces
accr
ued
Ba
lanc
e as a
t 01 J
anua
ry 20
17
5,6
37,4
73
4,3
45,1
57
2,0
13,1
20
48,
888
2
1,12
2
453
,496
2
49,5
27
280
,000
1
3,04
8,78
3
Ca
sh flo
ws
Re
ceip
ts fr
om lo
ng te
rm fi
nanc
es
5,7
70,6
25
–
–
–
–
–
–
–
5,7
70,6
25
Sh
ort t
erm
bor
row
ings
repa
id n
et o
f rec
eipt
s –
7
,500
,829
(1
,499
,212
) –
–
–
–
–
6
,001
,617
Re
paym
ent o
f lon
g te
rm fi
nanc
es
(2,0
00,0
00)
–
–
–
–
–
–
–
(2,0
00,0
00)
Fi
nanc
e co
st p
aid
–
–
–
(997
,662
) –
–
–
–
(9
97,6
62)
Di
viden
ds p
aid
–
–
–
–
(18
,587
,733
) –
–
–
(1
8,58
7,73
3)
To
tal c
hang
es fr
om fi
nanc
ing
cash
flow
s 3
,770
,625
7
,500
,829
(1
,499
,212
) (9
97,6
62)
(18,
587,
733)
–
–
–
(9
,813
,153
)
No
n-ca
sh ch
ange
s
Di
viden
d ap
prov
ed
–
–
–
–
18,
593,
329
–
–
–
1
8,59
3,32
9
Fi
nanc
e co
st
–
–
–
1,0
95,6
30
–
–
–
–
1
,095
,630
To
tal n
on-c
ash
chan
ges
–
–
–
1,0
95,6
30
18,
593,
329
–
–
–
1
9,68
8,95
9
Cl
osin
g as a
t 31 D
ecem
ber 2
017
9,4
08,0
98
11,
845,
986
5
13,9
08
146
,856
2
6,71
8
453
,496
2
49,5
27
280
,000
2
2,92
4,58
9
NOTES TO THE FINANCIAL STATEMENTSFOR THE YEAR ENDED 31 DECEMBER 2017
131Values Rooted in Respect

44 Date of authorization for issue
These financial statements were authorized for issue on February 21, 2018 by the Board of Directors of the Company.
45 Dividend
The Board of Directors in their meeting held on February 21, 2018 have proposed a Final Cash dividend for the year
ended 31 December 2017 of Rs. 80 per share (2016: Rs. 170 per share), amounting to Rs. 3,627.97 million (2016: Rs.
7,709.43 million) for approval of the members at the Annual General Meeting to be held on April 16, 2018. These financial
statements do not reflect this dividend.
46 General
46.1 Corresponding figures
Previous year’s figures have been re-arranged, wherever necessary for the purpose of comparison. However no
material re-arrangements have been made.
46.2 Figures have been rounded off to the nearest of thousand of rupee.
NOTES TO THE FINANCIAL STATEMENTSFOR THE YEAR ENDED 31 DECEMBER 2017
JOHN MICHAEL DAVIS BRUNO BORIS OLIERHOEK SYED YAWAR ALI Chief Financial Officer Chief Executive Chairman
132 Nestlé Pakistan Limited

I/We, ________________________________________________, of _______________________________________, being a
member of Nestlé Pakistan Ltd., holder of ________________________________ Ordinary Share(s) as per registered Folio No.
____________________________________ hereby appoint Mr. / Mrs.______________________________________ Folio
No. ___________ of ___________________________or failing him Mr. / Mrs._____________________________ Folio No.
_________________ of ____________________, who is also a member of Nestlé Pakistan Ltd., as my / our proxy in my / our
absence to attend and vote for me / us, and on my / our behalf at the 40th Annual General Meeting of the Company to be
held on April 16, 2018 and at any adjournment thereof.
Signed under my / our hand this ________ day of _____________, 2018.
Signed in the presence of:
Signature of Witness No. 1 Signature of Witness No. 2
Name: Name:
CNIC No.: CNIC No.:
NOTES:
1 This instrument appointing a proxy shall be in writing under the hand of the appointer or his attorney duly authorised in writing, or if the appointer is a corporation either under the common seal or under the hand of an official or attorney so authorised. No person shall be appointed as proxy who is not a member of the Company qualified to vote except that a corporation being a member may appoint a person who is not a member.
2 The instrument appointing a proxy and the power of attorney or other authority (if any), under which it is signed or a notarially certified copy of that power of authority, shall be deposited at the office of the Company not less than 48 (forty eight) hours before the time for holding the meeting at which the person named in the instrument proposes to vote, and in default the instrument of a proxy shall not be treated as valid.
Signature across Rs. 5
Revenue Stamp
Form of ProxyNestlé Pakistan Ltd.308 – Upper Mall, Lahore, Pakistan.
Signature should agree with the specimen signature registered
with the company
133Values Rooted in Respect

AFFIX
CORRECT
POSTAGE
The Company Secretary
Nestlé Pakistan Ltd.308 – Upper Mall, Lahore, PakistanPhone No. +92 42 111 637 853Fax No. +92 42 3578 9303www.nestle.pk

162018

AFFIX
CORRECT
POSTAGE
The Company Secretary
Nestlé Pakistan Ltd.308 – Upper Mall, Lahore, PakistanPhone No. +92 42 111 637 853Fax No. +92 42 3578 9303www.nestle.pk