Financial Statements - University of Surrey of Surrey Financial Statements...University of Surrey...
60
1 University of Surrey 2016/17 Financial Statements
Transcript of Financial Statements - University of Surrey of Surrey Financial Statements...University of Surrey...

1
University of Surrey
2016/17
Financial Statements

Cover image: Innovation for Health building. Credit: Scott Tallon Walker Architects

University of Surrey
Financial statements for the year ended 31 July 2017
Contents
Page
Vice-Chancellor's introduction 1
Strategic report 2 - 11
Public benefit statement 12 - 14
Corporate governance statement 15 - 16
Responsibilities of the Council of the University of Surrey 17
Independent auditor's report to the Council of the University of Surrey 18 - 19
Statement of comprehensive income and expenditure 20
Statement of changes in reserves 21
Balance sheets 22
Consolidated cash flow statement 23
Notes to the financial statements 24 - 52
Council members 53


1
University of SurreyUniversity of Surrey
Vice-Chancellor’s introduction
I am pleased to introduce the 2016/17 financial statements. These reflect another successful year for the University, with growth in student numbers driving a 5% increase in total income to £272m. 2016/17 marked the 50th anniversary of the granting of our Royal Charter and a programme of events through the year has provided opportunities to highlight our achievements and strengthen links at both a local and international level. The Festival of Wonder, held in May 2017, saw us welcoming over 6,000 people (including many local residents) to campus for an open day event including hands-on workshops, student arts performances and talks. The same month we held our first ever overseas graduation ceremonies, in China. The 2017 league table rankings reflect our continuing firm standing in the top 20 of UK higher education institutions, while a strong year for teaching and learning culminated in receipt of a prestigious gold award in the first Teaching Excellence Framework (TEF) exercise. Applications for 2016/17 undergraduate entry were exceptionally high following our ‘University of the Year’ and ‘University of the Year for Student Experience’ awards for 2016 by The Times / The Sunday Times. Enrolments (excluding clearing students) rose from 3,008 for 2015/16 entry to 3,466 for 2016/17 entry. Total student headcount (undergraduate and postgraduate students) increased to 15,719, a 3% rise on the previous year’s figure of 15,280, which was itself a record for the University. The value of research awards (the order book for future research activity) increased significantly in 2016/17 with the award of a £10m grant from the Department for Digital, Culture, Media and Sport (DCMS) marking another major success for our 5G Innovation Centre. Recognising the pivotal role that postgraduate research students and early career researchers have to play in enabling us to realise our research ambitions, during 2016/17 we established a new doctoral college to support these groups.
Work continues to develop the campus infrastructure in line with the growth in student numbers. The pace of capital investment increased significantly in 2016/17 as we began construction of the next phase of student accommodation on our Manor Park campus. This £80m investment will provide an additional 480 student rooms from September 2018 and a further 670 rooms from September 2019. 2016/17 also saw completion of our new Innovation for Health building. This provides facilities to enable us to help change the delivery of healthcare in the UK by training the next generation of graduates who can work proficiently across the traditional boundaries of health and engineering sciences. During 2016/17, my first full year of academic tenure, I have worked with colleagues to develop a new corporate strategy. The corporate strategy 2017-2022 builds on the University’s proud heritage of working with the community and industry, and positions the University to take advantage of the changing environment and new possibilities offered. It sets out a clear direction for the future, highlighting the University’s priorities and the ways in which it will ensure resilient, agile, and sustainable growth in order to become a prominent global university.
The strategic report on the following pages presents in more detail the progress made in 2016/17 towards our strategic goals. I would like to express my thanks to all members of the University Council, staff, students and supporters for making this such a successful year. Professor G Q Max Lu President and Vice-Chancellor
1

University of Surrey
2
University of Surrey
Strategic report
Introduction During 2016/17 the University celebrated both the 125th anniversary of its foundation and the 50th anniversary of the granting of its Royal Charter. This strategic report seeks to set the 2016/17 financial results of the University and its subsidiary companies in the context of the University’s strategy and operations, and describes the further progress which the University has made towards its ambition of being a leading national and international university.
University overview The University was established on 9 September 1966 with the grant of its Royal Charter, though its roots go back to 1891 with the founding of the Battersea Polytechnic Institute. It became a college of advanced technology in 1956 and moved from London to its present location in Guildford in the late 1960s. Although founded as a science and engineering focussed institution, the University’s educational, research and other activities now cover a broad range of disciplines. The University is organised into three academic faculties, each led by an Executive Dean: Faculty of Engineering & Physical Sciences (FEPS) Faculty of Health & Medical Sciences (FHMS) Faculty of Arts & Social Sciences (FASS)
In addition to its core academic activities (which include the activities of Surrey Sports Park Limited), the University owns and manages Surrey Research Park. Since its establishment in the mid-1980s, Surrey Research Park has developed as a major centre of excellence in technology, science, health and engineering. Although not a requirement, some tenants are spinouts from the University and others benefit from close links with the University’s academic activities.
Strategy 2016/17 marked the final year of the University’s 2007–2017 strategy focussed on:
enhancing research output quality growing funded research activity continuing to deliver high quality teaching and
learning delivering high employability for graduates increasing student numbers and quality continuing the focus on excellent student
satisfaction achieving financial sustainability.
This strategy has guided the University well over the past ten years and further progress in the above areas is highlighted in the relevant sections of this report.
The University routinely monitors its performance through a balanced scorecard. This comprises eight core academic KPIs (four each for teaching and research), supported by four thematic quadrants:
staff engagement financial performance and sustainability customer opinions (as reflected in league tables
and student surveys) strategic developments.
Wherever possible, the balanced scorecard uses established sector definitions in order to facilitate external benchmarking. Relevant metrics are included in this report. The final year of the 2007-2017 strategy was also the first full year of tenure for Professor Max Lu, the University’s President and Vice-Chancellor. Under Professor Lu’s leadership, the University worked during 2016/17 to define a new corporate strategy 2017-2022.
The corporate strategy 2017-2022 builds on the University’s proud heritage of working with the community and industry, and positions the University to take advantage of the changing environment and new possibilities offered. It sets out a clear direction for the future, highlighting the University’s priorities and the ways in which it will ensure resilient, agile, and sustainable growth in order to become a prominent global university.
Operating environment
The University continues to operate in a challenging environment, with increasing competition for students, and uncertainties around Brexit, immigration numbers, research funding and fees high on the political agenda.
Universities UK continues to lobby government on a number of fronts regarding immigration policy, campaigning for students to be taken out of the net migration target and seeking to ensure that changes to immigration rules do not limit the ability of universities to attract and recruit world-leading academics. The conclusion of the August 2017 report from The Office for National Statistics that ’there is no evidence of a major issue of non-EU students overstaying their entitlement to stay’ is a potentially positive sign, as is the subsequent announcement by the Migration Advisory Committee of a review of the economic impact of international students.
In the domestic market, the Labour Party’s manifesto promise to abolish undergraduate tuition fees has reignited a national debate regarding fees, loans and, more broadly, whether students receive value for money. In response, the current government has reversed a decision to raise fees in line with inflation and has announced a review of the whole higher education funding model.
2

3
University of SurreyUniversity of Surrey
Strategic report (continued)
Review of operations
Senior appointments
2016/17 saw a number of new appointments to the Executive Board.
In November 2016 Professor Graham Miller was appointed on a permanent basis to the post of Executive Dean for the Faculty of Arts and Social Sciences. Professor Miller had previously held the position on an interim basis, prior to which he was Head of the University’s School of Hospitality and Tourism Management. Professor Helen Griffiths joined from Aston University as Dean for the Faculty of Health and Medical Sciences in December 2016 and in January 2017 Professor Jane Powell, from Goldsmiths, University of London, took up the new post of Vice-Provost Education and Students. In August 2017 it was announced that Professor David Sampson, from the University of Western Australia, would be joining the University in January 2018 as Vice-Provost Research and Innovation.
Learning and teaching
The University is committed to providing its students with outstanding educational programmes, quality training in professional skills, and opportunities to grow in confidence and develop leadership attributes.
Teaching quality
A strong year for teaching and learning culminated in the University receiving a prestigious gold award in the first Teaching Excellence Framework (TEF) exercise. This marked the University out as one of the UK’s top performing higher education institutions (HEIs), with 43 (32%) of the 134 submitting HEIs awarded gold status.
Publication of the TEF results in June 2017 saw the University scoring highly on its metrics. The TEF panel also highlighted Surrey’s university-wide commitment to developing pedagogical expertise, skills and knowledge, exemplified by nationally-funded projects. It also commended Surrey’s practice of systematically embedding professional skills and employability throughout the curriculum, and the many ways in which Surrey’s students are not only stretched but also supported to succeed.
Student satisfaction
The results of the 2017 National Student Survey (NSS) showed 87% of Surrey students expressing satisfaction with the quality of their course, placing the University 33rd out of 131 reported higher education institutions.
Direct comparison with previous years is difficult due to a change in methodology, which has included new questions focussing more on student engagement than student
satisfaction. Nevertheless, this is a disappointing result and the University continues to maintain a strong focus on improving all areas of the student experience.
Chart 1: National Student Survey (NSS)
Learning and teaching developments
The School of Veterinary Medicine admitted its third cohort, comprising 127 students, in September 2016. Student progression for the past two academic years is 98% and the School continues to have the highest module evaluation questionnaire (MEQ) scores in the University.
The University continues to explore opportunities to expand its academic offering in response to the changing needs of society and student demand.
During 2016/17 the University continued to develop its business case for a new medical school. This followed the government’s October 2016 announcement that it planned to make an additional 1,500 medical school places available and the University’s subsequent submission of an expression of interest in establishing a new medical school. Following HEFCE’s allocation of the first 500 places to existing medical schools, in October 2017 HEFCE and Health Education England formally announced the call for bids from existing or potential new providers for the remaining 1,000 places. The University is finalising its bid for submission by the deadline of 23 November 2017. Should it be successful, the first intake to the new undergraduate programme would be expected in 2019/20.
In the meantime, completion of the new £12.5m Innovation for Health building, described later in this report (page 9), has enabled the University to develop five new undergraduate courses, across the traditional boundaries of health and engineering, for delivery from 2017/18.
Good degrees
The percentage of students achieving good degrees (defined as first or upper 2nd class) has risen steadily in recent years, from 76.9% in 2012/13 to 85.6% in 2016/17.
Chart 2: Percentage of students achieving good degrees
2012/13 2013/14 2014/15 2015/16 2016/17
Overall satisfaction 92% 91% 92% 90% 87%
Position =9/136 =8/135 =5/139 =17/140 =33/131
3

University of Surrey
4
University of Surrey
Strategic report (continued)
Employability The University continues to maintain its reputation as an institution focussed on supporting its students into graduate-level jobs and/or further study, as evidenced by the comments from the TEF panel above. The Professional Training Year (PTY), which is available to almost all undergraduate students, remains a significant selling point for the University with students recognising its value in enhancing their prospects of obtaining graduate-level employment. 1,200 students undertook a placement year in 2016/17 compared with 1,075 in 2015/16. A restructuring of the Directorate of Employability has enabled it to increase its student-facing presence, focussing on specialist support for postgraduate research students (PGRs) and early career researchers (ECRs) in collaboration with the new doctoral college, and partnering with the Widening Participation and Outreach team to develop tailored support for widening participation and black and minority ethnic students. The results of HESA’s 2016 ‘Destination of Leavers from Higher Education’ (DLHE) survey, released in 2017, showed the percentage of leavers in work and/or further study six months after graduation at 93.0% (2016: 95.6%), with the number in graduate-level jobs at 76.9% (2016: 82.4%). Student numbers
The University’s much improved league table position over recent years has led to a significant increase in student demand for places. Applications for undergraduate entry have recovered strongly since a dip in 2012/13 when the impact of the University’s decision to increase its entry tariff coincided with an overall reduction in student demand caused by the introduction of the £9,000 fee. Applications for 2016/17 undergraduate entry were exceptionally high following Surrey’s receipt of the ‘University of the Year’ award for 2016 by The Times and The Sunday Times. Undergraduate enrolments increased from 3,008 for 2015/16 entry to 3,466 for 2016/17 entry. The entry tariff relaxed back from 432 for 2015/16 entry to 418 for 2016/17 entry reflecting a year of consolidation as the University continues to grow its intake with more challenging market conditions.
Chart 3: UCAS undergraduate applications and enrolments (excluding clearing students)
Postgraduate taught student numbers fell from 2,859 in 2015/16 to 2,600 in 2016/17. This still represented an increase on the 2014/15 figure of 2,521.
The total student headcount continues to rise. The 2016/17 total headcount of 15,719 represented an increase of almost 3% on the previous year’s figure of 15,280, which was itself the highest ever achieved by the University.
Chart 4: Student numbers (headcount at 1 December)
Research
The University’s research ambition is to be a top 20 university in the UK and a top 150 university in the world for international research. Research strategy As part of its strategy to realise ambitious objectives for research excellence and impact, the University has identified six cross-cutting research themes based on its research strengths and analysis of funder programmes:
sustainability urban living digital innovation technology impacting life lifelong health and wellbeing space and aerospace.
The first two themes are now active and the remaining themes will be established in the near future. At the core of the sustainability theme is research that enables society to undertake activities and developments which meet the needs of the present, without compromising the ability of future generations to meet their own needs. The urban living theme focusses on research and innovation to address the challenges faced by urban areas and to help them realise visions for future urban living, transforming them into safer, smarter, more
* The entry tariff for 2013/14 onwards follows the methodology used in the main league tables i.e. it includes students with any tariffable score. The entry tariff for 2012/13 excludes students with a combination of qualifications that includes a single A-level.

5
University of Surrey University of Surrey
Strategic report (continued)
sustainable and healthier environments that better serve the population and society. Research income, awards and bids The financial statements show total research income for 2016/17 of £40.3m (2015/16: £38.9m). Chart 5: Research income
2016/17 2015/16
£m £m
Operational research income 33.9 31.1
5GIC programme contributions in kind 6.4 7.6
Research & development expenditure tax credits 0.0 0.2
Total 40.3 38.9
In addition to growth in the core operational research income, the 5G Innovation Centre (5GIC) programme continues to attract significant in-kind contributions from industrial partners for the development of research services and capacity. These contributions (valued at £6.4m in 2016/17) have no impact on the financial surplus for the year as income and expenditure are reported at the same values. The value of new research awards (i.e. the order book for future research activity) announced during 2016/17 was £45.0m. This was £7.1m higher than the three-year average and £6.8m (18%) higher than the previous financial year. The key growth area for research awards was UK government funding with a £10m grant from the Department for Digital, Culture, Media and Sport (DCMS) for 5G research included in the 2016/17 total of £45.0m. This award marked another major success for the University’s 5G Innovation Centre (5GIC), with Surrey taking the lead in the £16m DCMS funded programme to deliver the year one recommendations from the government’s January 2017 Future Communication Challenge Group (FCCG) report. This HUB 1 project will include delivery of an end to end 5G trial across the three collaborating university sites (Surrey, Bristol and Kings College, London) by Q1 2018 and delivery of the foundation for the longer term (£185m) expansion to further hubs and spokes to provide a national asset to implement a globally leading 5G strategy for the UK. 2016/17 also saw the University being awarded three Distributed Ledger Technology (DLT) grants (total value £1.1m) by the Engineering and Physical Sciences Research Council (EPSRC). The three uniquely interdisciplinary projects, covering eVoting, digital archives and the use of healthcare technology, position Surrey as a UK leader in blockchain technology, contributing to the EPSRC’s delivery plan outcomes to support a more prosperous UK by working towards a more connected and healthy nation.
The total value of research bids in 2016/17 was £166.8m. This was £21.5m higher than the three-year average and £36.7m higher than the previous financial year. Improving success rates is a major component of the research strategy and the University was particularly encouraged by 2016/17’s 29% success rate for EU bids. This compared with a 17% success rate for 2015/16, a figure in line with EU averages. Following a 4% improvement in the success rate for UK Research Council bids in 2015/16 to 27%, the success rate fell back slightly to 25% in 2016/17. Chart 6: Research bids, awards & extensions
2012/13 2013/14 2014/15 2015/16 2016/17
£m £m £m £m £m Research awards and extensions
31.3 32.5 43.0 38.2 45.0
Research bids 162.4 140.8 164.9 130.1 166.8
Doctoral college
The research strategy recognises that postgraduate research students (PGRs) and early career researchers (ECRs) have a pivotal role to play in enabling the University to realise its research ambitions. To support these groups, 2016/17 saw establishment of a new doctoral college. Having both physical and virtual form, the college brings strategic oversight and structural coherence to the support of both PGRs and ECRs by focussing on:
building a strong research culture and community
of scholars developing highly skilled and employable PGRs
and ECRs providing first class training and supervision ensuring the University is an excellent recruiter of
excellent PGRs and ECRs ensuring the University is an attractive
proposition to funders of PGR and ECR activity.
Strategic partnerships
Collaboration is one of the University of Surrey’s major strengths and values. The University has become a key driver of economic growth with strong collaborative links with entities such as other academic institutions, public sector establishments and major industry partners. National Physical Laboratory (NPL) The University of Surrey has a strong and long-standing relationship with the National Physical Laboratory (NPL). In March 2015 a formal partnering agreement was signed between Surrey, NPL, The Department for Business Energy and Industrial Strategy (BEIS), and the University of
5
University of Surrey
6
University of Surrey
Strategic report (continued)
Strathclyde. Achievements in the first two years of the partnership have included:
development of a network of regional hubs, including
NPL South of England based at Surrey establishment of the Post-Graduate Institute of
Measurement Science opening of two joint NPL/Surrey science facilities establishment of several joint appointments.
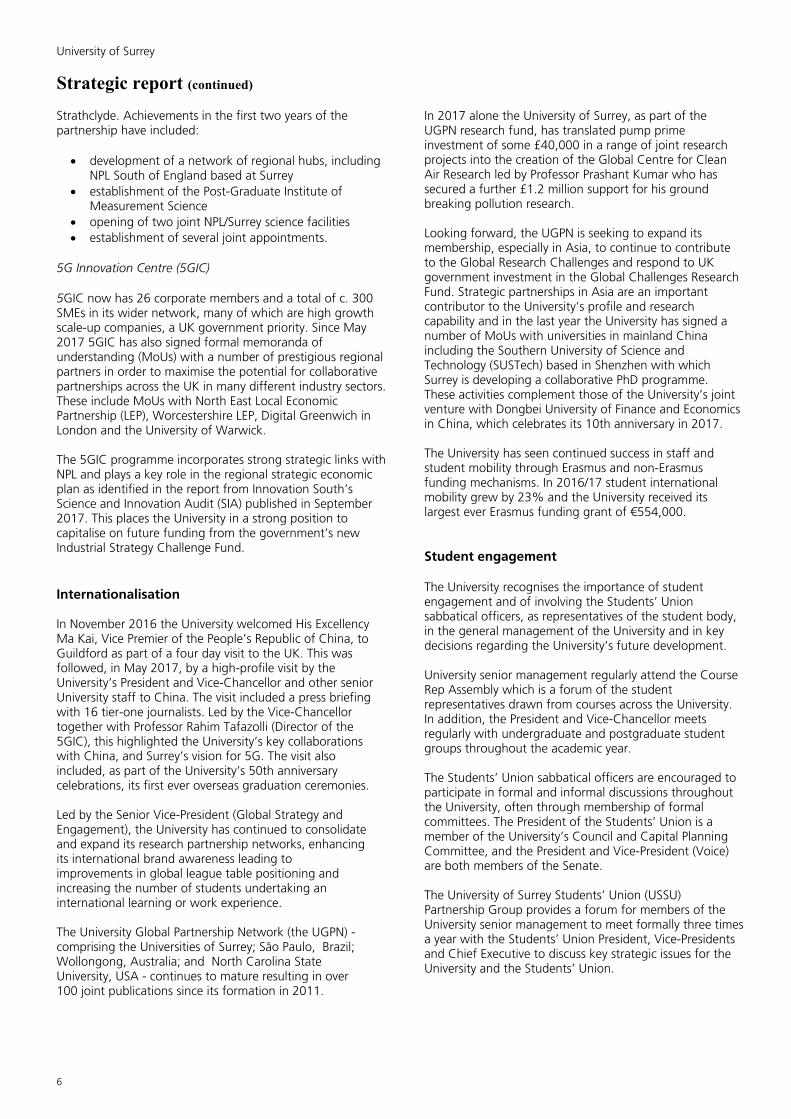
5G Innovation Centre (5GIC) 5GIC now has 26 corporate members and a total of c. 300 SMEs in its wider network, many of which are high growth scale-up companies, a UK government priority. Since May 2017 5GIC has also signed formal memoranda of understanding (MoUs) with a number of prestigious regional partners in order to maximise the potential for collaborative partnerships across the UK in many different industry sectors. These include MoUs with North East Local Economic Partnership (LEP), Worcestershire LEP, Digital Greenwich in London and the University of Warwick. The 5GIC programme incorporates strong strategic links with NPL and plays a key role in the regional strategic economic plan as identified in the report from Innovation South’s Science and Innovation Audit (SIA) published in September 2017. This places the University in a strong position to capitalise on future funding from the government’s new Industrial Strategy Challenge Fund. Internationalisation
In November 2016 the University welcomed His Excellency Ma Kai, Vice Premier of the People’s Republic of China, to Guildford as part of a four day visit to the UK. This was followed, in May 2017, by a high-profile visit by the University’s President and Vice-Chancellor and other senior University staff to China. The visit included a press briefing with 16 tier-one journalists. Led by the Vice-Chancellor together with Professor Rahim Tafazolli (Director of the 5GIC), this highlighted the University’s key collaborations with China, and Surrey’s vision for 5G. The visit also included, as part of the University’s 50th anniversary celebrations, its first ever overseas graduation ceremonies.
Led by the Senior Vice-President (Global Strategy and Engagement), the University has continued to consolidate and expand its research partnership networks, enhancing its international brand awareness leading to improvements in global league table positioning and increasing the number of students undertaking an international learning or work experience.
The University Global Partnership Network (the UGPN) -comprising the Universities of Surrey; São Paulo, Brazil; Wollongong, Australia; and North Carolina State University, USA - continues to mature resulting in over 100 joint publications since its formation in 2011.
In 2017 alone the University of Surrey, as part of the UGPN research fund, has translated pump prime investment of some £40,000 in a range of joint research projects into the creation of the Global Centre for Clean Air Research led by Professor Prashant Kumar who has secured a further £1.2 million support for his ground breaking pollution research. Looking forward, the UGPN is seeking to expand its membership, especially in Asia, to continue to contribute to the Global Research Challenges and respond to UK government investment in the Global Challenges Research Fund. Strategic partnerships in Asia are an important contributor to the University’s profile and research capability and in the last year the University has signed a number of MoUs with universities in mainland China including the Southern University of Science and Technology (SUSTech) based in Shenzhen with which Surrey is developing a collaborative PhD programme. These activities complement those of the University’s joint venture with Dongbei University of Finance and Economics in China, which celebrates its 10th anniversary in 2017. The University has seen continued success in staff and student mobility through Erasmus and non-Erasmus funding mechanisms. In 2016/17 student international mobility grew by 23% and the University received its largest ever Erasmus funding grant of €554,000.
Student engagement
The University recognises the importance of student engagement and of involving the Students’ Union sabbatical officers, as representatives of the student body, in the general management of the University and in key decisions regarding the University’s future development. University senior management regularly attend the Course Rep Assembly which is a forum of the student representatives drawn from courses across the University. In addition, the President and Vice-Chancellor meets regularly with undergraduate and postgraduate student groups throughout the academic year. The Students’ Union sabbatical officers are encouraged to participate in formal and informal discussions throughout the University, often through membership of formal committees. The President of the Students’ Union is a member of the University’s Council and Capital Planning Committee, and the President and Vice-President (Voice) are both members of the Senate. The University of Surrey Students’ Union (USSU) Partnership Group provides a forum for members of the University senior management to meet formally three times a year with the Students’ Union President, Vice-Presidents and Chief Executive to discuss key strategic issues for the University and the Students’ Union.

7
University of Surrey University of Surrey
Strategic report (continued)
Staff engagement
The University continues to carry out an annual staff survey in order to gain a comprehensive view of issues which impact on engagement levels, staff satisfaction and business performance. Key indictors from the survey are included on the University’s balanced scorecard. The 2017 survey saw an increase in the staff engagement score to 74% (2016: 70%), the best in the seven years that the University has been working with the current survey provider (OCRI). The response rate was maintained at the 2016 level of 75%. When comparing feedback, in comparable questions, with the 30 other universities which work with OCRI, 21 of the University’s questions scored 5 or more percentage points above the benchmark, 10 scored within 5 percentage points of the benchmark and no questions scored 5 percentage points or more below the benchmark. As in previous years institutional level and local action plans have been drawn up in response to the staff survey scores and free-text comments.
Financial review
Introduction
2016/17 was the University’s second year of reporting under the new UK accounting standard ‘FRS 102’ and the Statement of Recommended Practice: Accounting for Further and Higher Education (SORP 2015). In order to reduce the volatility created by FRS 102, the University took the decision, on transition, to adopt:
the accrual model for accounting for government
capital and revenue grants hedge accounting for qualifying interest rate swaps.
The University remains exposed to volatility in respect of the following, which were not previously accounted for through the income and expenditure account and over which the University has little, if any, control: movements on the provision for payments under
the USS deficit recovery plan movements in the fair value of interest rate swaps
which do not qualify for hedge accounting changes in the market value of Surrey Research
Park. The University cannot budget for these items, which may be subject to significant volatility as a result of changes in market conditions. It therefore considers it appropriate to monitor performance against an underlying operating surplus which excludes these items.
Income and expenditure
The statement of comprehensive income and expenditure on page 20 of the financial statements shows a consolidated surplus for 2016/17 of £4.2m. This compares with the 2015/16 surplus of £0.9m. The 2016/17 underlying operating surplus was £4.7m. Although lower than the previous year’s figure of £11.1m, this was better than plan. Chart 7: Reconciliation to underlying operating surplus
Consolidated income rose in 2016/17 by £12.3m (5%) to £271.8m, with tuition fee income rising by £7.5m (6%) to £137.3m. As described earlier in this report, research income increased by £1.4m to £40.3m.
2016/17 expenditure of £266.6m was £9.9m higher than the previous financial year. The main change was in operational staff costs which increased by £11.4m (9%) to £141.0m. This rise included the full year impact of the additional academic staff appointed in response to 2015/16’s very successful student recruitment round, together with the full year effect of the April 2016 national insurance and USS pension changes. Interest and other finance costs fell from £12.8m in 2015/16 to £8.1m in 2016/17, reflecting a decrease in the fair value of interest rate swaps.
The underlying operating surplus can be further analysed between the University’s core activities and Surrey Research Park as shown below:
Chart 8: Analysis of underlying operating surplus
2016/17 2015/16
£m £m Consolidated surplus for the year
4.2 0.9
Movement on USS provision 0.8 4.7 (Decrease) / increase in interest rate swaps liability (1.2) 3.8
Loss on Surrey Research Park revaluation 1.1 1.3
Other investment (gains) / losses (0.2) 0.4 Underlying consolidated operating surplus
4.7 11.1
2016/17 2015/16
£m £m
Core activities:
University (0.3) 6.0
Surrey Sports Park Limited 0.0 (0.3)
Surrey Research Park 5.0 5.4 Underlying consolidated operating surplus
4.7 11.1

University of Surrey
8
University of Surrey
Strategic report (continued)
Surrey Research Park
As shown above, Surrey Research Park generated a surplus for 2016/17 of £5.0m (2015/16: £5.4m). 2016/17 income of £10.1m was slightly lower than the previous year’s figure of £10.5m. This reflected lower income from both dilapidation settlements (following successful negotiation of a new lease with an existing tenant) and tenants fit-out works. The lower income from tenants fit-out works was matched by a corresponding reduction in costs. Net assets
Consolidated net assets increased by £21.9m in 2016/17 to £476.3m. The main contributory factors, apart from the underlying operating surplus of £4.7m, were:
local government pension scheme actuarial gains
(primarily experience gains) a decrease in the interest rate swaps liability
(reflecting a part-reversal of the previous year’s fall in long term interest rates)
Chart 9: Movement in consolidated net assets 2016/17
The recent trend in pension provisions (USS and LGPS) is shown below.
Chart 10: Pension provisions at 31 July
2013 2014 2015 2016 2017
£m £m £m £m £m
Obligation to fund USS pension deficit N/A 13.7 30.1 34.3 33.8
LGPS pension liability – funded 27.4 35.4 38.0 45.6 35.3
LGPS pension liability - unfunded 1.4 1.5 1.4 1.4 1.4
Total N/A 50.6 69.5 81.3 70.5
Surrey Research Park is included on the balance sheet as an investment property asset. The recent trend in the Park’s value, taking into account development expenditure on new and existing buildings, is shown below. Completed investment properties and development land are shown at valuation, properties under development are shown at cost.
Chart 11: Surrey Research Park valuation at 31 July *
2013 2014 2015 2016 2017*
£m £m £m £m £mCompleted investment properties
79.2 91.2 105.9 110.0 111.7
Properties under development
0.8 1.0 4.1 1.3 0.1
Development land
1.1 6.2 9.9 8.1 7.5
Total 81.1 98.4 119.9 119.4 119.3
* Excludes 30 Priestley Road which is held as a fixed asset
Cash flow
The consolidated cash flow statement on page 23 shows a decrease in cash and cash equivalents in the year of £19.1m. Taking into account the drawdown of £120m of private placement funds in the year, there was an increase in available cash (defined as cash and cash equivalents plus short term deposits) of £92.9m, to £161.9m, as shown below.
Chart 12: Movement in consolidated available cash
2016/17 2015/16
£m £m
Opening consolidated available cash 69.0 59.7
Net cash inflow from operating activities 27.4 39.6
Net income from Surrey Research Park 5.1 5.4
Capital expenditure – University (49.9) (34.3) Capital expenditure – Surrey Research Park
(1.2) (1.1)
Capital grants received 4.4 9.0
Loan drawdowns 120.0 0.5 Financing (net interest and capital repayments) (13.5) (13.7)
Other movements 0.6 3.9
Closing consolidated available cash 161.9 69.0
Increase +92.9 +9.3
Of the £120m private placement funds received in the year, only £12.5m were spent by 31 July 2017. The balance of £107.5m is earmarked for transformational and strategic projects, giving an underlying available cash balance at 31 July 2017 of £54.4m.
Net cash inflow from operating activities fell from £39.6m in 2015/16 to £27.4m in 2016/17. This was partly due to a fall in the underlying operating surplus (from £11.1m to £4.7m), with an increase in debtors also a contributory factor. With significant debt servicing commitments as well as the need to fund core capital requirements from operating cash, the University is focussed on increasing this figure in future years. Offset against the 31 July 2017 available cash balance of £161.9m were borrowings of £293.8m, giving net debt at
£m
Consolidated net assets at 31 July 2016 454.4
Underlying operating surplus 4.7 Local Government Pension Scheme (LGPS) actuarial gains
10.8
Movement on USS provision (0.8)
Decrease in interest rate swaps liability 8.1
Surrey Research Park revaluation (1.1)
Other investment gains 0.2
Consolidated net assets at 31 July 2017 476.3

9
University of SurreyUniversity of Surrey
Strategic report (continued)
31 July 2017 of £131.9m. This reflected a £19.8m increase in net debt in the year.
Capital investment
The University has invested heavily in its estate in recent years in order to increase capacity for academic work and improve the student experience.
The consolidated cash flow statement on page 23 shows total capital investment for 2016/17 of £49.9m (2016: £34.3m).
The pace of capital investment increased significantly in 2016/17 as the University began construction of the next phase of student accommodation on its Manor Park campus. 480 student rooms will be available from September 2018 with a further 670 rooms due to come on stream in September 2019. This will increase the total number of student rooms on the Manor Park campus to circa 3,000 and the total across the two campuses (Manor Park and Stag Hill) to circa 6,000.
The major capital project completed in the year was the £12.5m Innovation for Health building. This was officially opened in February 2017 by Sir Mark Walport, Chief Scientific Advisor to the UK government. Providing laboratory and other facilities, the Innovation for Health building will enable the University to help change the delivery of healthcare in the UK, by combining teaching and research into an academic programme aimed at training the next generation of graduates who can work proficiently across the traditional boundaries of health and engineering sciences.
The University has traditionally met its requirements for additional academic and other space through construction of new buildings on its own land. However, in October 2016, the University took advantage of an opportunity to purchase, for £7.4m, a 51,000 square feet office building on Surrey Research Park which the University had sold on a long lease in 1984. It was agreed that this building (30 Priestley Road) should become the new home for the School of Health Sciences.
The decision to make 30 Priestley Road the new home for the School of Health Sciences marks a major step forward in achieving a ‘One Health’ campus at Manor Park by bringing the School of Health Sciences near to the School of Veterinary Medicine, Royal Surrey County Hospital and the proposed medical school. Following refurbishment, it is anticipated that the School of Health Sciences will relocate to 30 Priestley Road in Spring 2019. This will release significant space on the Stag Hill campus to allow for further moves, thereby driving a more efficient overall allocation to support the University’s strategic growth plans.
Other capital projects were undertaken in the year to address some of the infrastructure challenges faced by the University as it grows its student population.
Treasury management
The University’s investment, borrowing and hedging strategies are determined by its Finance Committee in accordance with a Treasury Management Policy approved by the University Council.
As mentioned above, during 2016/17 the University drew down the £120m of private placement funds it had secured in 2015/16. This gave outstanding borrowings and finance lease obligations on the 31 July 2017 balance sheet of £293.8m, compared with £181.1m at 31 July 2016. Both figures exclude undrawn bank loan facilities of £10.0m.
The University recognises that it has a relatively high gearing ratio. However, the University has borrowed to fund assets which produce a strong income stream and contribute to the strategic ambitions of the University. The University benefits from competitive margins and relatively light financial covenants. It manages the risk of interest rate rises on its bank borrowings through standalone hedging instruments and a fixed rate of interest on £30m of loan finance. The University’s policy is to fix the interest rate on at least 70% of its total bank term debt, allowing cash balances to act as a natural hedge against a portion of the debt.
The weighted average cost of capital on all drawn funds (bank debt plus private placement funds) at 31 July 2017 was 3.59%. This compared with the weighted average at 31 July 2016 (bank debt only) of 3.76%.
Approximately two thirds of the £120m private placement funds are being applied to the Manor Park student residences project (1,150 student rooms). The balance of the private placement monies is to be spent on transformational and strategic projects. These would include a medical school should the University be successful in its bid for publicly funded medical school places.
Chart 13: Debt profile at 31 July (including undrawn funds)
The main objective in making investments is to achieve a reasonable rate of return whilst minimising risk. The University places short term monies in accordance with criteria approved by its Finance Committee, based on minimum counterparty credit ratings and limits on the amount placed with any one provider.
9

University of Surrey
10
University of Surrey
Strategic report (continued)
The weighted average return on short term deposits fell from 0.74% in 2015/16 to 0.58% in 2016/17 reflecting further downward pressure on short term interest rates.
Risks and uncertainties The University’s approach to risk management is described in the corporate governance statement on pages 15 to 16. The following are considered the most significant areas of risk:
generating sufficient cash to support the
University’s strategic goals ability of the infrastructure to support growth student experience and outcomes student numbers and quality of students (post
Brexit) research income and quality (including the impact
of Brexit on research income)
Cash generation As is the case across the sector, the University’s cost base is under increasing pressure from wage inflation, lower research overhead recovery and higher cost inflation across non-pay and capital-spend categories.
Prioritisation and phasing optimisation, notably around the capital programme, is underway. In addition, the University has established a structured efficiency, simplification and growth programme, drawing on both internal and external resources.
Campus infrastructure Work continues to develop the campus infrastructure in line with the growth in student numbers. This includes the construction of new student residences and provision of additional study spaces. The University provides proportionally more student accommodation on its campuses than other institutions. Nevertheless, there remains a large unsatisfied demand from Surrey students for good quality University residential accommodation, due to high prices and a significant shortage of purpose-built private sector student accommodation in Guildford.
Construction of the additional 1,150 student rooms on Manor Park will meet short-term needs. However, the University is exploring options with third party providers to support further growth, whereby the third party would construct additional student residential accommodation either on or off campus.
During 2016/17 the University engaged an international design practice, Hassell, to review the estate and create a single unified masterplan. This will enable capital
investment decisions to be made in the context of an agreed development framework and a set of agreed principles, ensuring that the inherent value of the University’s estate is maintained and enhanced through informed decision making for years to come.
Student experience and outcomes
The University continues to prioritise the student experience as a core part of its strategy, ensuring it responds to students’ growing expectations of enhanced academic quality, support services, facilities, accommodation and pathways to employment. In addition to measures already being taken to improve the physical infrastructure as described above, the University continues to develop the technology needed to support innovative approaches to teaching, learning and support. At the same time it continues to invest in expanding and enhancing resources in areas such as student well-being and communications. Student numbers and quality of students
The University has moderated its trajectory of student number growth in response to assessments of the impact of Brexit on the EU student market and to the need for investment in campus infrastructure. 2017/18 undergraduate recruitment has exceeded the revised target by c. 170 students with the entry tariff largely maintained. Overall fee income (undergraduate and postgraduate) for 2017/18 is forecast to be broadly in line with plan. Research income and quality
The University needs to grow its research quality and performance to enhance its global reputation which is critical to its long-term sustainability. This is challenging at a time when many research funders, particularly those funding the basic/fundamental research that correlates most highly with research standing, do not cover the full costs of research. The research environment is also increasingly competitive with many universities seeking to increase their research portfolios at a time when many funders are resource constrained. The University continues to address these risks through its six research strategy work-streams. These are to:
develop and deliver thematic research priorities recruit and retain world-class academics and
postgraduate researchers develop world-leading outputs deliver more systematic proposal submission create impact improve research culture and infrastructure.
At the same time the University continues to monitor the sector impacts of Brexit in terms of funding, collaboration,

11
University of Surrey University of Surrey
Strategic report (continued)
and access to talent and resources. It has implemented a number of strategies to support its existing EU employees and will undertake further mitigating measures as appropriate.
Future outlook
Whilst the challenges facing the University and the wider UK higher education sector cannot be underestimated, the University looks ahead confidently, as it builds on its strengths to grow into a leading global institution renowned for producing sought-after graduates and outstanding research, both of which will help shape the world for a better future.

University of Surrey
12
University of Surrey
Public benefit statement
The University is an exempt charity within the meaning of Schedule 3 of the Charities Act 2011. It is therefore exempt from registration with the Charity Commission and its compliance with charity law is monitored by The Higher Education Funding Council of England (HEFCE) as principal regulator. The University’s charitable purposes are defined in its Royal Charter as the advancement of education, learning and teaching. The University brings a wide range of benefits to individual students and to society as a whole through the quality of the education it offers and the quality of the graduates and postgraduates it produces, as well as through the dissemination and practical application of its research. This narrative describes how the University has delivered the two aspects of public benefit, namely:
benefit aspect – a purpose must be beneficial public aspect – the purpose must benefit the public
in general, or a sufficient section of the public In determining the University’s strategic, operational and financial objectives, the members of Council, as trustees, have had due regard to the Charity Commission’s guidance on public benefit.
League table performance
The delivery of public benefit is evidenced by the University’s strong performance across all the main UK university league tables. The 2017 league table rankings reflect the University’s continuing strong standing in the top 20 of UK higher education institutions. Chart 1: League table rankings
Research The University is committed to open access and to making its research publications freely available online so that they can be enjoyed by a global audience.
The University combines expertise from across the University, and works in partnership with external stakeholders, to undertake research focussed on key global health, economic, environmental and social challenges.
In addition to the University’s cutting-edge work on 5G technology, 2016/17 highlights included world-leading collaboration on air pollution, led by Professor Prashant Kumar, Professor and Chair in Air Quality and Health at the University of Surrey. These included the results of studies showing how:
car drivers in London are causing the most pollution per commuter, but are themselves the least exposed to that pollution when compared with those taking the underground or the bus. This study was carried out as part of a project jointly funded by ESRC (UK), FAPESP (Brazil) and NWO (Netherlands).
low hedges reduce air pollution in cities more effectively than taller trees. This study, which was a collaborative effort by partners in the UK, Europe and the USA, was carried out as part of the iSCAPE (Improving Smart Control of Air Pollution in Europe) project, funded by the European Community’s Horizon 2020 Programme.
During 2016/17 the University confirmed its place as one off the country’s top universities for cyber security research when it was re-awarded its status as an ‘Academic Centre of Excellence in Cyber Security Research’ for a further five years. The status, which is held by just 14 UK universities, is given by The National Cyber Security Centre (NCSC) in partnership with Research Councils UK (RCUK) and the Department for Business, Energy and Industrial Strategy (BEIS).
Public engagement With leading experts in a broad range of fields, Surrey academics frequently feature in high-profile media and contribute to global news headlines. During 2016/17 the University generated significant global coverage across online, print and broadcast. The majority of media coverage is gained through proactive release of research findings. Stories with strong human interest in areas such as health, travel and cyber security ensure a spread of coverage in national news, lifestyle and broadcast titles, as well as providing trade titles with key scientific and academic context. The work of Professor Prashant Kumar has already been mentioned above. The results of the study led by Professor Kumar into how low hedges can reduce air pollution was featured on BBC World Service, BBC 4 and BBC News, as well as in daily newspapers including The Times and The Telegraph. Professor Kumar was also
Publication date 2013 2014 2015 2016 2017
The Guardian 8 6 4 4 10
The Times / The Sunday Times
12 11 8 14 19
The Complete University Guide
13 12 8 11 13
THE Table of Tables 11 9 7 10 14

13
University of Surrey University of Surrey
Public benefit statement (continued)
interviewed by 10 BBC regional radio stations on this subject.
Professor Alan Woodward, a cyber security expert and visiting professor at the University of Surrey, was interviewed by the BBC and national press on a number of topics during 2016/17, including the cyber attacks on the NHS and the British Airways power blackout, with his comments on the NHS cyber attacks appearing in more than 1,000 news articles. The University’s academics were also at the heart of informed commentary on the 2017 UK General Election, with Dr Simon Usherwood and Dr Alia Middleton interviewed on both local and national radio as well as in overseas publications including Europe Online Magazine.
Community engagement
The University provides local residents with a range of opportunities to participate in its sporting, educational, cultural and social activities. The major highlight of 2016/17 was the Festival of Wonder, which marked the close of the University’s 50th anniversary celebrations. Held in May 2017, this attracted over 6,000 people to campus for an open day event featuring music, comedy and dance performances, talks, sports activities, hands-on workshops, and science and technology exhibits. Highlights across the different zones included actor Brian Blessed in conversation with Professor Jim Al-Khalili (the University’s Professor of Public Engagement); a rare recital and interview with Grammy award-winning classical guitarist John Williams; and a talk by the Channel 4 ‘Supervet’ Noel Fitzpatrick (an honorary professor at the University). Surrey Sports Park continues to be a major asset to the local community as well as to the University, providing opportunities for the public both to participate in sport and to watch competitions of the highest level. In July 2017 Surrey Sports hosted the Lacrosse World Cup. This saw 18,000 spectators watching 25 teams from around the world competing in what has been described as the best world lacrosse event in sports history. Media coverage generated was significant, with 339,000 twitter impressions being achieved across the 12 days of competition, and every match after the quarter finals being broadcast live internationally. England went on to win the bronze medal. As well as encouraging local residents to visit the University campus, staff also take the University out into the local community. The University had a significant presence at Guildford Borough Council’s ‘Innovate Guildford’ – a science and arts festival attended by 7,000 local people in March 2017 – with demonstrations and displays on various subjects including space debris and the science of superheroes. It also took part again in the global ‘Pint of Science’ festival with 400 local people attending talks by the University’s academics in three local pubs in May 2017.
The University actively encourages feedback from the local community and the results of the University’s annual residents survey will inform the University’s outreach and engagement activity over the coming year. Widening participation and student support The University continues to make a significant investment in the widening participation (WP) and outreach agenda to ensure that able students from any background are able to access the institution and do not face any barriers to progression. The University monitors its performance against the main Higher Education Statistics Agency (HESA) widening participation benchmarks. The most recently published data (2015/16) shows the University exceeding the relevant benchmarks for measures of participation of lower-represented groups, with participation of state schools remaining significantly higher than its benchmark
Chart 2: Widening participation
Participation of under-represented groups (young full time 1st degree)
2015/16
2014/15
Surrey Location
benchmark*
Surrey
Location
benchmark*
% % % % Lower socio-economic groups (NE_SEC classes 4-7)
30.1 N/A 28.6 28.0
State schools 92.1 85.4 91.9 84.8
Low participation neighbourhoods 8.0 7.5 7.3 7.3
* The location benchmark takes account of the student’s home region
The University has a strong record in providing targeted undergraduate bursaries for students from lower income households. The number of students benefiting from support increased from 1,923 in 2015/16 to 2,306 in 2016/17. Total spend fell from £4.1m in 2015/16 to £3.7m in 2016/17. The University continues to take steps to gain further insight into the impact of its financial support to ensure its bursaries are appropriately targeted. The fall in spend on undergraduate bursaries was in line with guidance from the Office for Fair Access (OFFA) which recommends that universities focus expenditure on outreach and retention instead. The University is committed to increasing its expenditure on access activities from £0.4m in 2014/15 to £2.5m in 2021/22 and on measures to improve student success and

University of Surrey
14
University of Surrey
Public benefit statement (continued)
progression from £0.4m in 2014/15 to £3.0m in 2021/22. As part of its increased investment in access activities, in February 2017 the University placed a WP outreach coordinator, four days a week, in Kings College, Guildford (a non-selective academy school). This is part of a two-year commitment to raising attainment and aspiration of the pupils towards further study through consistent and targeted WP support. It marks a significant increase in the support the University was already providing through its existing access activities and through having senior University staff representation on the school’s governing body. In addition to its access activities, the University provides a range of resources to support students whilst they are at University. The dedicated student money team provides specific advice and support to those students who experience financial difficulties. This includes the provision of hardship loans and grants. The University also offers a wide range of support to students with disabilities or specific learning difficulties to enable them to participate fully in University life. Other examples of public benefit The strategic report on pages 2 to 11 gives further examples of how the University is benefiting society and the economy through the advancement of its educational activities, high graduate employability rates, and engagement with business. Further examples of how the University’s research activities are delivering public benefit can be found in the 2017 Annual Review at www.surrey.ac.uk/annual-review and on the University’s dedicated research webpages at www.surrey.ac.uk/research.

15
University of SurreyUniversity of Surrey
Corporate governance statement The University is a body incorporated by Royal Charter originally granted in 1966 and an exempt charity within the meaning of Schedule 3 of the Charities Act 2011. The University is committed to exhibiting best practice in all aspects of corporate governance. It endeavours to conduct its business in accordance with the seven principles identified by the Committee on Standards in Public Life (selflessness, integrity, objectivity, accountability, openness, honesty and leadership) and with the Higher Education Code of Governance published by the Committee of University Chairs (CUC) in December 2014. Summary of the University's structure of corporate governance
The University’s objects, powers and framework of governance are set out in the Charter and its supporting Statutes and Ordinances (the ‘governing documents’). In accordance with the requirements of its governing documents, the Council comprises a majority of external members, together with ex officio and elected University representatives. The role of the Chair of Council is separated from the role of the Vice-Chancellor as Chief Executive. The powers of the Council are set out in the Statutes and Ordinances of the University. Under the Memorandum of Assurance and Accountability with the Higher Education Funding Council for England (HEFCE), the Council is collectively responsible for overseeing the University’s activities, determining its future direction and fostering an environment in which its mission is achieved and the potential of all students is realised. The Council has adopted the following Statement of Primary Responsibilities:- The primary responsibilities of the Council are:
to approve the mission and strategic vision of the University and long term academic and business plans; to agree key performance indicators and annual budgets and to ensure that these meet the interests of stakeholders
to ensure the establishment and monitoring of systems of control and accountability, including financial and operational controls and risk assessment; and procedures for handling internal grievances and for managing conflicts of interest
to ensure processes are in place to monitor and evaluate the performance and effectiveness of the University against its plans, previous performance and agreed key performance indicators which should be, where possible and appropriate, benchmarked against other comparable universities
to appoint the Vice-Chancellor and to put in place suitable arrangements for monitoring his/her performance.
In addition, the Council cannot delegate responsibility for:
varying the governing documents approving the annual audited accounts appointing the external auditor of the University.
The Council continually assesses its mix of skills, experience and diversity to ensure its appropriateness. New members receive an induction programme tailored to their specific needs. The effectiveness of the Council is reviewed regularly, with the most recent full effectiveness review having taken place in October 2017. This took the form of a half day, interactive session, facilitated by external consultants. The Council is increasing the number of formal meetings from four to five a year from 2017/18. In addition, it holds a strategic away-day jointly with the Executive Board once a year. It has a number of committees, all of which are formally constituted with appropriate external membership and terms of reference. These include a Finance Committee, an Audit and Assurance Committee, a Nominations Committee and a Remuneration Committee. The Finance Committee, which comprises a majority of external members, meets at least five times a year. It advises the Council on financial policy and strategy, reviews and recommends to the Council the University’s financial forecasts, and keeps the University’s financial position under review. The Audit and Assurance Committee meets three times a year with the external and internal auditors in attendance. It oversees the risk management process and considers detailed reports from the auditors, which include recommendations for the improvement of the University's systems of internal control together with management's responses and implementation plans. It also receives and considers reports from HEFCE and other organisations and ensures that processes are in place to ensure compliance with statutory regulations. It considers the draft annual financial statements from the point of view of factual presentation, compliance with general and University accounting policies, controls assurance and any identified control deficiencies. Whilst senior executives attend meetings of the Audit and Assurance Committee as necessary, they are not members of the Committee, and the Committee may meet with the external and internal auditors on their own for independent discussions. The Chair of the Committee has direct access to the Chair of Council. The Nominations Committee, under the chairmanship of the Chair of Council, meets as required to consider and make recommendations to the Council on the appointment of external members to the Council and on the appointment of external co-opted members to Council sub-committees. It also makes recommendations to the Council regarding the appointment of the Vice-Chancellor and the appointment of Pro-Chancellors.
15

University of Surrey
16
University of Surrey
Corporate governance statement (continued)
The Remuneration Committee, under the chairmanship of the Vice-Chair of Council, meets twice annually with additional meetings at the discretion of the Chair. It monitors the performance of the Vice-Chancellor, and determines the salary and conditions of service of the Vice-Chancellor and members of the Executive Board. It ensures an effective succession plan is in place for Executive Board level posts and approves any severance payments made to staff earning over £100,000 per annum. The Vice-Chancellor is not a member of the Committee, but is in attendance at meetings except when the Committee is discussing his own salary and conditions of service.
The University has a Senate which meets four times a year and has responsibility, under the control and approval of the Council, for oversight and assurance of the academic endeavour of the University. The University has an Executive Board which is the senior management committee of the University and meets monthly under the chairmanship of the Vice-Chancellor as Chief Executive. The Executive Board has a number of supporting executive and advisory committees, all of which are formally constituted with appropriate terms of reference and which include external members where relevant.
In March 2017 the Council approved changes to the membership and terms of reference of certain of its sub-committees to streamline membership and attendance at meetings; and to ensure the terms of reference reflect the latest remit of the Committees. Changes in management roles, in anticipation of the new corporate strategy 2017-2022, also prompted a review of the roles of the Senate and its primary sub-committees and the primary sub-committees of the Executive Board. This review provided the opportunity to provide greater accountability and transparency. The relevant changes were approved by the Council in March 2017.
Statement of internal control The Council, as governing body, is responsible for ensuring that the University has a sound system of internal control and for reviewing its effectiveness. Such a system is designed to understand and manage rather than eliminate the risk of failure to achieve business objectives and can only provide reasonable and not absolute assurance against material misstatement or loss. The key elements of the University's system of internal control include the following:
a comprehensive Scheme of Delegation, approved by the Council, which records the reserved powers of the Council and the delegation of the Council’s powers to its sub-committees; to the Vice-Chancellor; and to the Senate and its sub-committees
clear definitions of the responsibilities of, and the authority delegated to, heads of academic faculties and administrative departments
a comprehensive medium and short-term planning process, supplemented by detailed annual income, expenditure, capital and cash flow budgets
regular reviews of academic performance and monthly reviews of financial results involving variance reporting and updates of forecast outturns
clearly defined and formalised requirements for approval and control of expenditure, with investment decisions involving capital or revenue expenditure being subject to formal detailed appraisal and review according to approval levels set by the Council
Financial Regulations, approved by the Finance Committee, together with supporting financial policies and procedures
a professional Internal Audit team whose annual programme is approved by the Audit and Assurance Committee.
In March 2017 the Council approved a new Risk Management Strategy and a revised Risk Management Policy. The Risk Management Strategy describes the University’s strategy on, and approach to, risk management. It provides clarity as to why risk management should be undertaken and describes the nature and extent of risks the organisation is willing to take in achieving its strategic objectives. It aims to provide uniformity across risk management procedures, describing when and how to record and escalate risks and the format and timing of reports. The Risk Management Strategy sets out the roles and responsibilities of the University Council, key committees and individuals. In accordance with the Risk Management Strategy:- the Audit & Assurance Committee is charged by
Council with keeping the integrity and effectiveness of the organisation’s risk management under review
the Vice-Chancellor has responsibility for implementing the policies and strategies on risk management and internal control
the Executive Board supports the Vice-Chancellor in discharging the responsibility for the implementation of the Policy and Strategy as well as ensuring that risk management is embedded within the strategic decision-making process. It also ensures ownership of risk management throughout the organisation (including the identification and management of risks) and regularly reviews the strategic risk register.
The strategic risk register forms the basis of the internal audit programme. The Council is of the view that there is an ongoing process for identifying, evaluating and managing the principal risks to achievement of the University's objectives; that it has been in place for the year ended 31 July 2017 and up to the date of approval of the financial statements; and that it accords with HEFCE guidance.
16

17
University of SurreyUniversity of Surrey
Responsibilities of the Council of the University of Surrey In accordance with the University’s Charter and Statutes, the Council is responsible for the management and the administration of the affairs of the University and is required to present audited financial statements for each financial year.
The Council is responsible for ensuring the maintenance of proper accounting records which disclose with reasonable accuracy at any time the financial position of the University and its subsidiaries and which enable it to ensure that the financial statements are prepared in accordance with the University's Charter and Statutes, the Statement of Recommended Practice: Accounting for Further and Higher Education, and other relevant accounting standards. In addition, within the terms and conditions of a Memorandum of Assurance and Accountability agreed between HEFCE and the Council of the University, the Council, through its designated office holder (the Vice-Chancellor), is required to prepare financial statements for each financial year which give a true and fair view of the state of affairs of the University and of the surplus or deficit and cash flows for that year.
In causing the financial statements to be prepared, the Council has to ensure that:
suitable accounting policies are selected and
consistently applied judgements and estimates are made that are
reasonable and prudent applicable accounting standards have been followed,
subject to any material departures disclosed and explained in the financial statements
financial statements are prepared on the going concern basis unless it is inappropriate to presume that the University will continue in operation. The Council is satisfied that the University has adequate resources to continue in operation for the foreseeable future: for this reason the going concern basis continues to be adopted in the preparation of the financial statements.
The Council has taken reasonable steps: to ensure that funds from HEFCE are used only for
the purposes for which they have been given and in accordance with the Memorandum of Assurance and Accountability and any other conditions which HEFCE may from time to time prescribe
to ensure that there are appropriate financial and management controls in place to safeguard public funds and funds from other sources
to safeguard the assets of the University and to prevent and detect fraud and other irregularities
to secure the economical, efficient and effective management of the University's resources and expenditure.
The Council recognises its responsibility for the maintenance and integrity of the corporate and financial information included on the University’s website and notes that legislation in the UK governing the preparation and dissemination of financial statements may differ from legislation in other jurisdictions.
17

18
Independent auditor’s report to the Council of the University of Surrey
Report on the audit of the financial statements Opinion We have audited the financial statements of the University of Surrey (“the University”) for the year ended 31 July 2017 which comprise the Group and University statement of comprehensive income and expenditure, the Group and University statement of changes in reserves, the Group and University balance sheet and the Group cash flow statement and related notes, including the accounting policies in note 1. In our opinion the financial statements:
give a true and fair view of the state of the Group’s
and the University’s affairs as at 31 July 2017, and of the Group’s and the University’s income and expenditure, gains and losses and changes in reserves, and of the Group’s cash flows, for the year then ended;
have been properly prepared in accordance with UK accounting standards, including FRS 102 The Financial Reporting Standard applicable in the UK and Republic of Ireland, and with the 2015 Statement of Recommended Practice – Accounting for Further and Higher Education; and
meet the requirements of HEFCE’s Accounts Direction to higher education institutions for 2016/17 financial statements.
Basis for opinion
We conducted our audit in accordance with International Standards on Auditing (UK) (“ISAs (UK)”) and applicable law. Our responsibilities are described below. We have fulfilled our ethical responsibilities under, and are independent of the group in accordance with, UK ethical requirements including the FRC Ethical Standard. We believe that the audit evidence we have obtained is a sufficient and appropriate basis for our opinion. Going concern
We are required to report to you if we have concluded that the use of the going concern basis of accounting is inappropriate or there is an undisclosed material uncertainty that may cast significant doubt over the use of that basis for a period of at least twelve months from the date of approval of the financial statements. We have nothing to report in these respects.
Other information
The Council is responsible for the other information, which comprises the strategic report, the public benefit
statement and the corporate governance statement. Our opinion on the financial statements does not cover the other information and, accordingly, we do not express an audit opinion or any form of assurance conclusion thereon. Our responsibility is to read the other information and, in doing so, consider whether, based on our financial statements audit work, the information therein is materially misstated or inconsistent with the financial statements or our audit knowledge. Based solely on that work, we have not identified material misstatements in the other information. Council responsibilities
As explained more fully in their statement set out on page 17, the Council is responsible for: the preparation of the financial statements and for being satisfied that they give a true and fair view; such internal control as it determines is necessary to enable the preparation of financial statements that are free from material misstatement, whether due to fraud or error; assessing the group and parent University’s ability to continue as a going concern, disclosing, as applicable, matters related to going concern; and using the going concern basis of accounting unless it either intends to liquidate the group or the parent University or to cease operations, or has no realistic alternative but to do so. Auditor’s responsibilities
Our objectives are to obtain reasonable assurance about whether the financial statements as a whole are free from material misstatement, whether due to fraud or error, and to issue our opinion in an auditor’s report. Reasonable assurance is a high level of assurance, but does not guarantee that an audit conducted in accordance with ISAs (UK) will always detect a material misstatement when it exists. Misstatements can arise from fraud or error and are considered material if, individually or in aggregate, they could reasonably be expected to influence the economic decisions of users taken on the basis of the financial statements.
A fuller description of our responsibilities is provided on the FRC’s website at: www.frc.org.uk/auditorsresponsibilities.
Report on other legal and regulatory requirements
We are required to report on the following matters under the HEFCE Audit Code of Practice (effective
18

19
Independent auditor’s report to the Council of the University of Surrey (continued)
1 August 2016) issued under the Further and Higher Education Act 1992.
In our opinion, in all material respects:
funds from whatever source administered by theGroup or the University for specific purposes havebeen properly applied to those purposes andmanaged in accordance with relevant legislation;and
funds provided by HEFCE have been applied inaccordance with the Memorandum of Assuranceand Accountability and any other terms andconditions attached to them.
The purpose of our audit work and to whom we owe our responsibilities
This report is made solely to the Council, in accordance with the University’s Charter, Statutes and Ordinances of the institution. Our audit work has been undertaken so that we might state to the Council those matters we are required to state to them in an auditor’s report and for no other purpose. To the fullest extent permitted by law, we do not accept or assume responsibility to anyone other than the University and the Council for our audit work, for this report, or for the opinions we have formed.
Joanne Lees
for and on behalf of KPMG LLP, Statutory Auditor Chartered Accountants 15 Canada Square London E14 5GL
19

University of Surrey
20
University of Surrey
Statement of comprehensive income and expenditurefor the year ended 31 July 2017
2016/17 2015/16 2016/17 2015/16Note £000 £000 £000 £000
IncomeFunding council grants 2 30,674 29,386 30,674 29,386 Tuition fees and education grants 3 137,292 129,749 137,292 129,749 Research grants and contracts 4 40,313 38,946 40,313 38,946 Other income 5 52,261 49,641 47,582 44,973 Investment income 6 10,695 11,066 10,890 11,279 Donations and endowments 7 553 702 553 702 Total income 271,788 259,490 267,304 255,035
ExpenditureStaff costs - operational 8 141,023 129,608 138,108 126,737 Staff costs - movement on USS provision 8 761 4,670 761 4,670 Staff costs - restructuring 8 128 468 116 468 Other operating expenses 10 91,247 85,176 88,557 82,929 Depreciation 25,320 23,985 25,306 23,980 Interest and other finance costs 11 8,091 12,786 8,064 12,786 Total expenditure 266,570 256,693 260,912 251,570
Surplus before other gains and losses 5,218 2,797 6,392 3,465
Loss on disposal of fixed assets (97) (36) (97) (36)Loss on investments 12 (882) (1,660) (1,053) (1,904)
Surplus before taxation 4,239 1,101 5,242 1,525
Taxation 13a (13) (161) (57) (98)
Surplus for the year 4,226 940 5,185 1,427
Actuarial gain/(loss) in respect of pension schemes 10,790 (7,152) 10,415 (6,898)Change in fair value of hedging financial instruments 6,861 (7,337) 6,861 (7,337)Total comprehensive income for the year 21,877 (13,549) 22,461 (12,808)
Represented by:Endowment comprehensive income for the year (114) 111 (114) 111 Restricted comprehensive income for the year - 20 - 20 Unrestricted comprehensive income for the year 21,991 (13,680) 22,575 (12,939)
21,877 (13,549) 22,461 (12,808)
All income and expenditure relates to continuing operations.
Consolidated University
20

21
University of SurreyUniversity of Surrey
Statement of changes in reservesfor the year ended 31 July 2017
ConsolidatedCash flow
Endowment Restricted Unrestricted hedge reserve Total£000 £000 £000 £000 £000
Balance at 1 August 2015 2,561 175 481,452 (16,254) 467,934
Surplus from the income and expenditure statement 355 181 404 - 940 Other comprehensive income - - (7,152) (7,337) (14,489)Release of restricted funds spent in year (244) (161) 405 - -
111 20 (6,343) (7,337) (13,549)
Balance at 1 August 2016 2,672 195 475,109 (23,591) 454,385
Surplus from the income and expenditure statement 273 223 3,730 - 4,226 Other comprehensive income - - 10,790 6,861 17,651 Release of restricted funds spent in year (387) (223) 610 - - Total comprehensive income for the year (114) - 15,130 6,861 21,877
Balance at 31 July 2017 2,558 195 490,239 (16,730) 476,262
UniversityCash flow
Endowment Restricted Unrestricted hedge reserve Total£000 £000 £000 £000 £000
Balance at 1 August 2015 2,561 175 488,386 (16,254) 474,868
Surplus from the income and expenditure statement 355 181 891 - 1,427 Other comprehensive income - - (6,898) (7,337) (14,235)Release of restricted funds spent in year (244) (161) 405 - -
111 20 (5,602) (7,337) (12,808)
Balance at 1 August 2016 2,672 195 482,784 (23,591) 462,060
Surplus from the income and expenditure statement 273 223 4,689 - 5,185 Other comprehensive income - - 10,415 6,861 17,276 Release of restricted funds spent in year (387) (223) 610 - - Total comprehensive income for the year (114) - 15,714 6,861 22,461
Balance at 31 July 2017 2,558 195 498,498 (16,730) 484,521
Income and expenditure account
Income and expenditure account
21
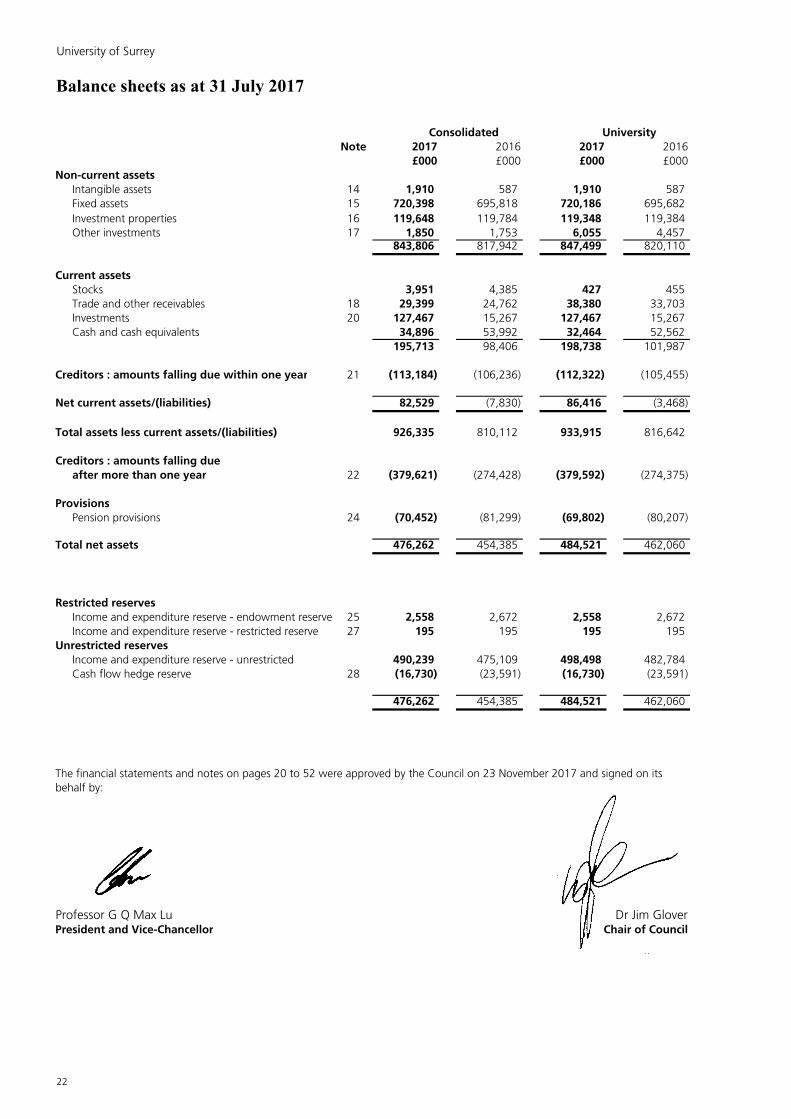
University of Surrey
22
University of Surrey
Balance sheets as at 31 July 2017
Note 2017 2016 2017 2016£000 £000 £000 £000
Non-current assetsIntangible assets 14 1,910 587 1,910 587 Fixed assets 15 720,398 695,818 720,186 695,682 Investment properties 16 119,648 119,784 119,348 119,384 Other investments 17 1,850 1,753 6,055 4,457
843,806 817,942 847,499 820,110
Current assetsStocks 3,951 4,385 427 455 Trade and other receivables 18 29,399 24,762 38,380 33,703 Investments 20 127,467 15,267 127,467 15,267 Cash and cash equivalents 34,896 53,992 32,464 52,562
195,713 98,406 198,738 101,987
Creditors : amounts falling due within one year 21 (113,184) (106,236) (112,322) (105,455)
Net current assets/(liabilities) 82,529 (7,830) 86,416 (3,468)
Total assets less current assets/(liabilities) 926,335 810,112 933,915 816,642
Creditors : amounts falling dueafter more than one year 22 (379,621) (274,428) (379,592) (274,375)
ProvisionsPension provisions 24 (70,452) (81,299) (69,802) (80,207)
Total net assets 476,262 454,385 484,521 462,060
Restricted reserves25 2,558 2,672 2,558 2,672
Income and expenditure reserve - restricted reserve 27 195 195 195 195 Unrestricted reserves
Income and expenditure reserve - unrestricted 490,239 475,109 498,498 482,784 Cash flow hedge reserve 28 (16,730) (23,591) (16,730) (23,591)
476,262 454,385 484,521 462,060
Professor G Q Max Lu Dr Jim GloverPresident and Vice-Chancellor Chair of Council
Consolidated University
The financial statements and notes on pages 20 to 52 were approved by the Council on 23 November 2017 and signed on its behalf by:
Income and expenditure reserve - endowment reserve
22

23
University of SurreyUniversity of Surrey
Consolidated cash flow statementfor the year ended 31 July 2017
Note 2016/17 2015/16£000 £000
Cash inflow from operating activitiesSurplus for the year 4,226 940 Add: taxation 13 161 Adjustments for non-cash iemsDepreciation 15 24,400 23,417 Amortisation of intangibles 14 920 568 Loss on investments 12 882 1,660 Impairment of fixed assets 97 136 Decrease/(increase) in stocks 434 (338)Increase in receivables (4,914) (236)Increase in creditors 5,164 7,866 (Decrease)/increase in pension provision (1,696) 2,632 Receipt of donated equipment (501) - Adjustment for investing or financing activitiesNet income from Surrey Research Park (5,113) (5,403)Other investment income (623) (606)Interest payable 11 8,091 12,786 Endowment income 25 (109) (355)Loss on sale of fixed assets - 293 Capital grant income (3,711) (3,603)Adjustment for taxationTax paid (126) (403)Net cash inflow from operating activities 27,434 39,515
Cashflows from investing activitiesProceeds from sale of fixed assets - 7 Capital grant receipts 4,392 9,052 Disposal of non-current asset investments - 3,044 (Investment in)/withdrawal of deposits (111,959) 472 Surrey Research Park net income 5,309 5,403 Investment income 264 666 Payments made to acquire fixed assets (47,692) (34,080)Payments made to acquire intangible assets (2,255) (259)New non-current asset investments (1,172) (1,076)
(153,113) (16,771)
Net cash inflow from financing activities Interest paid (5,572) (6,153)Interest element of finance lease payments (672) (672)Endowment cash received 109 355 New unsecured loans 120,000 453 Repayments of amounts borrowed (6,618) (6,239)Capital element of finance lease payments 29 (664) (654)
106,583 (12,910)
(Decrease)/increase in cash and cash equivalents in the year 29 (19,096) 9,834
Cash and cash equivalents at beginning of the year 53,992 44,158
Cash and cash equivalents at end of the year 34,896 53,992
23
University of Surrey
24
University of Surrey
Notes to the financial statements
1 Accounting policies
Basis of preparation
Basis of consolidation
Recognition of income
Grant funding
Donations and endowments
Non-exchange transactions without performance related conditions are donations and endowments. Donations andendowments with donor imposed restrictions are recognised in income either when the charitable donation has been received,or before receipt, if there is sufficient evidence to provide the necessary certainty that the donation will be received and thevalue of the incoming resources can be measured with sufficient reliability. Income is retained within the restricted reserve untilsuch time that it is utilised in line with such restrictions at which point the income is released to general reserves through areserve transfer.
Donations with no restrictions are recognised in income when the University is entitled to the funds.
Investment income and appreciation of endowments is recorded in income in the year in which it arises as either restricted or unrestricted income according to the terms applied to the individual endowment fund.
Fee income is stated gross and credited to the statement of consolidated income and expenditure over the period in which students are studying. Where the amount of the tuition fee is reduced by a discount for prompt payment, income receivable is shown net of the discount. Internally-funded bursary and scholarship payments are accounted for gross as expenditure and not deducted from income.
Government revenue grants including funding council block grants and research grants are recognised in income over the periods in which the University recognises the related costs for which the grant is intended to compensate. Where part of a government grant is deferred it is recognised as deferred income within creditors and allocated between creditors due within one year and due after more than one year as appropriate.
Grants (including research grants) from non-government sources are recognised in income when the University is entitled to the income and performance related conditions have been met. Income received in advance of performance related conditions being met is recognised as deferred income within creditors on the balance sheet and released to income as the conditions are met.
The financial statements have been prepared in accordance with the Statement of Recommended Practice (SORP): Accounting for Further and Higher Education 2015 (2015 SORP) and in accordance with Financial Reporting Standard FRS 102. The University is a public benefit entity and therefore has applied the relevant public benefit requirement of FRS 102. The financial statements are prepared in accordance with the historical cost convention (modified by the revaluation of fixed assets and derivative financial instruments).
The consolidated financial statements include the University and all its subsidiaries for the financial year to 31 July 2017. Intra group transactions are eliminated on consolidation.
The consolidated financial statements do not include the income and expenditure of the Students' Union as the University does not exert control or dominant influence over its policy decisions.
The University has significant cash equivalents and short term investment balances sufficient to meet its day to day working capital requirements. Despite the level of external borrowings the University's forecast projections show that it will continue to have sufficient funds to meet its obligations for the forseeable future. Accordingly the going concern basis has been adopted in the preparation of the consolidated financial statements.
Income from the sale of goods or services is credited to the statement of comprehensive income and expenditure when the goods or services are supplied to the external customers or the terms of the contract have been satisfied.
24

25
University of SurreyUniversity of Surrey
Notes to the financial statements (continued)
1 Accounting policies (continued)
Donations and endowments (continued)
Capital grants
Pension schemes
The two principal pension schemes are the Universities Superannuation Scheme (USS) and the Surrey County Council Local Government Pension Scheme (Surrey Pension Fund). The University also participates in the London Pensions Fund Authority Local Government Pension Scheme (LPFA Pension Fund). All are defined benefit schemes and were, until April 2016, contracted out of the State Second Pension (S2P), with assets held in separate trustee administered funds.
Because of the mutual nature of the USS, the scheme's assets are not hypothecated to individual institutions and a scheme-wide contribution rate is set. The University is therefore exposed to actuarial risks associated with other institutions' employees and is unable to identify its share of the underlying assets and liabilities of the USS on a consistent and reasonable basis and therefore, as required by Section 28 of FRS 102, accounts for the scheme as if it were a defined contribution scheme. As a result, the amount charged to the statement of comprehensive income and expenditure represents the contributions payable to the scheme in respect of the accounting period.
A liability is recorded within provisions for any contractual commitment to fund past deficits within the USS.
A defined contribution plan is a post employment benefit plan under which the company pays fixed contributions into a separate entity and will have no legal or constructive obligation to pay further amounts. Obligations for contributions to defined contribution pension plans are recognised as an expense in the statement of comprehensive income and expenditure in the periods during which services are rendered by employees.
a. Defined contribution plan
The group is able to identify its share of the underlying assets and liabilities of the Surrey Pension Fund and the LPFA Pension Fund and fully adopts Section 28 of FRS 102 in respect of these two schemes.
The University operates the National Health Service Pension Scheme which is available to staff who immediately prior to appointment at the University were members of that scheme. This is a statutory, unfunded, multi-employer, defined benefit scheme in which the University is unable to identify its share of the underlying liabilities and assets and it is therefore accounted for on a contribution basis.
The group operates defined contribution pension schemes for temporary staff and certain employees of a subsidiary undertaking. Contributions are charged to the statement of comprehensive income and expenditure as they become payable in accordance with the scheme rules.
There are three main types of donations and endowments identified within reserves:
1. Restricted donations - the donor has specified that the donation must be used for a particular objective.
2. Restricted expendable endowments - the donor has specified a particular objective other than the purchase or construction of tangible fixed assets, and the University has the power to use the capital.
3. Restricted permanent endowments - the donor has specified that the fund is to be permanently invested to generate an income stream to be applied to a particular objective.
Government capital grants are initially recorded in creditors and released to the statement of comprehensive income and expenditure over the expected useful lives of the related assets. Other capital grants are recognised in income when the University is entitled to the funds subject to any performance related conditions being met.
25

University of Surrey
26
University of Surrey
Notes to the financial statements (continued)
1 Accounting policies (continued)
Pension schemes (continued)
Employment benefits
Agency arrangements
Tangible fixed assets
a. Land and buildings
b. Equipment
Motor vehicles - 5 yearsOther computing equipment - 3 yearsEquipment acquired for specific research projects - project lifeOther equipment - 5 to 20 yearsFurniture - 10 years
Depreciation methods, useful lives and residual values are reviewed at the date of preparation of each balance sheet.
b. Defined benefit plan
Defined benefit plans are post-employment benefit plans other than defined contribution plans. Under defined benefit plans, the University’s obligation is to provide the agreed benefits to current and former employees, and actuarial risk (that benefits will cost more or less than expected) and investment risk (that returns on assets set aside to fund the benefits will differ from expectations) are borne, in substance, by the group. The group recognises a liability for its obligations under defined benefit plans, net of plan assets. This net defined benefit liability is measured as the estimated amount of benefit that employees have earned in return for their service in the current and prior periods, discounted to determine its present value, less the fair value (at bid price) of plan assets. The calculation is performed by a qualified actuary using the projected unit credit method. Where the calculation results in a net asset, recognition of the asset is limited to the extent to which the University is able to recover the surplus either through reduced contributions in the future or through refunds from the plan.
Equipment costing less than £10,000 per individual item, or group of related items, is written off in the year of acquisition. All other equipment is capitalised. Capitalised equipment is stated at cost and depreciated over its useful life, as follows:
Where parts of a fixed asset have different useful lives, they are accounted for as separate items of fixed assets.
Short term employment benefits such as salaries and compensated absences are recognised as an expense in the year in which the employees render service to the University. Any unused benefits are accrued and measured as the additional amount the University expects to pay as a result of the unused entitlement.
No depreciation is charged on assets in the course of the construction.
Funds received and disbursed as paying agent on behalf of a funding body are excluded from the comprehensive statement of income and expenditure where the University is exposed to minimal risk or enjoys minimal economic benefit related to the transaction.
Fixed assets are stated at cost / deemed cost less accumulated depreciation and accumulated impairment losses. Certain assets, that had been revalued to fair value on the date of transition to the 2015 SORP, are measured on the basis of deemed cost, being the revalued amount at the date of that revaluation.
Under the transition rules of FRS 102, land and buildings were revalued on 1 August 2014 to fair value which is then used as its deemed cost at that date. Depreciation and impairment losses are subsequently charged on the revalued amount. Additions subsequent to this date are accounted for at cost, based on the value of architects' certificates and other direct costs incurred to 31 July. They are not depreciated until they are brought into use.
Costs incurred in relation to land and buildings after initial purchase or construction, and prior to valuation, are capitalised to the extent that they increase the expected future benefits to the University.
Freehold land is not depreciated as it is considered to have an indefinite useful life. Freehold buildings are depreciated on a straight line basis over their expected useful lives of up to 80 years.
26

27
University of SurreyUniversity of Surrey
Notes to the financial statements (continued)
1 Accounting policies (continued)
Finance costs
Intangible assets
Fixed asset impairments
Leased assets
a. Operating lease
b. Finance lease
Maintenance of premises
Investment properties
Investments
Non-current asset investments are held on the balance sheet at fair value where this is readily available. Otherwise they are recorded at amortised cost less impairment.
Current asset investments are held at fair value with movements recognised in the statement of comprehensive income and expenditure.
Costs in respect of operating leases are charged to the statement of comprehensive income and expenditure on a straight line basis over the lease term. Any lease premiums or incentives are spread over the minimum lease term.
Investment properties are measured initially at cost and subsequently at fair value with movements recognised in the comprehensive statement of income and expenditure. Properties are not depreciated but are revalued annually according to market conditions as at 31 July each year.
The University has a five year rolling long term maintenance plan which forms the basis of the ongoing maintenance of the estate. Expenditure on long term maintenance which does not meet the FRS 102 criteria for capitalisation, and expenditure on all routine corrective maintenance, is charged to the statement of comprehensive income and expenditure as incurred.
Leases in which the University assumes substantially all the risks and rewards of ownership of the leased asset are classified as finance leases. Leased assets acquired by way of finance lease and the corresponding lease liabilities are intially recognised at an amount equal to the lower of their fair value and the present value of the minimum lease payments at inception of the lease.
Investment property is land and buildings held for rental income or capital appreciation rather than for use in delivering services.
Borrowing costs and interest receivable which are directly attributable to the acquisition, construction or production of a qualifying asset are capitalised.
Intangible assets are amortised over a period of up to 7 years representing the estimated economic life of the assets and are subject to periodic impairment reviews as appropriate.
A review for impairment of a fixed asset is carried out if events or changes in circumstances indicate that the carrying amount of the fixed asset may not be recoverable.
Minimum lease payments are apportioned between the finance charge and the reduction of the outstanding liability. The finance charge is allocated to the statement of comprehensive income and expenditure each period during the lease term so as to produce a constant periodic rate of interest on the remaining balance of the liability.
27

University of Surrey
28
University of Surrey
Notes to the financial statements (continued)
1 Accounting policies (continued)
Stocks
Cash and cash equivalents
Taxation status
Deferred taxation
Financial instruments
a. Short term debtors and creditors
b. Derivatives
The University and its subsidiaries receive no similar exemption in respect of Value Added Tax. Irrecoverable VAT on inputs is included in the costs of such inputs. Any irrecoverable VAT allocated to tangible fixed assets is included in their cost.
Deferred tax is provided in full on subsidiary undertaking losses that are expected to be recovered in the future and on timing differences which result in an obligation at the balance sheet date to pay more tax, or a right to pay less tax, at a future date, at rates expected to apply when they crystallise based on current rates and law. Timing differences arise from the inclusion of items of income and expenditure in taxation computations in periods different from those in which they are included in financial statements. Deferred tax assets are recognised to the extent they are regarded as more likely than not to be recovered. Deferred tax assets and liabilities are not discounted.
The University's subsidiary undertakings are subject to corporation tax in the same way as any commercial organisation, although they may be able to take advantage of Section 471 CTA 2010 to mitigate the corporation tax liability through gift aid.
Derivatives are held on the balance sheet at fair value. The University has adopted and complied with the requirements of hedge accounting in respect of certain interest rate swaps. Movements in fair value are recorded in the surplus/deficit or within other comprehensive income, as appropriate.
The University has chosen to apply the provisions of sections 11 and 12 of FRS102 in full. Financial assets and financial liabilities are recognised in the balance sheet when the University becomes a party to the contractual provisions of the instrument. A financial asset and financial liability are offset only when there is a legally enforceable right to set off the recognised amounts and an intention either to settle on a net basis, or to realise the asset and settle the liability simultaneously.
With the exception of derivatives, financial assets and liabilities all meet the criteria for basic financial instruments prescribed within FRS 102 section 11.8 and are initially recognised at the transaction price plus any additional directly attributable transaction costs.
Debtors and creditors with no stated interest rate and receivable or payable within one year are recorded at transaction price. Any losses arising from impairment are recognised in the statement of comprehensive income and expenditure in other operating expenses.
Stocks are stated at the lower of cost and net realisable value. Where necessary, provision is made for obsolete, slow-moving and defective stocks.
Cash includes cash in hand, deposits repayable on demand and overdrafts. Deposits are repayable on demand if in practice they are available within 24 hours without penalty.
Cash equivalents are short term, highly liquid investments, with a maturity date of 3 months or less from the date of acquisition, that are readily convertible to known amounts of cash with insignificant risk of change in value.
The University is an exempt charity within the meaning of Schedule 3 of the Charities Act 2011 (formerly Schedule 2 of the Charities Act 1993) and is considered to pass the tests set out in Paragraph 1, Schedule 6 of the Finance Act 2010 and therefore meets the definition of a charitable company for UK corporation tax purposes. Accordingly, the University is potentially exempt from taxation in respect of income or capital gains received within categories covered by section 287 CTA 2009 and sections 471 and 478-489 CTA 2010 (formerly s505 of ICTA 1988) or section 256 of the Taxation of Chargeable Gains Act 1992, to the extent that such income or gains are applied to exclusively charitable purposes.
28

29
University of SurreyUniversity of Surrey
Notes to the financial statements (continued)
1 Accounting policies (continued)
Research and development
Foreign currency translation
Provisions, contingent liabilities and contingent assets
Contingent assets are disclosed by way of a note, where there is a possible rather than a present asset arising from a past event.
Reserves
Judgements and estimates
a. Pensions
b. Fixed assets
Contingent liabilities are disclosed by way of a note when the definition of a provision is not met and includes three scenarios: a possible rather than a present obligation; a possible rather than a probable outflow of economic benefits and; an inability to measure the economic outflow.
Provisions are recognised in the financial statements when the University has a present obligation (legal or constructive) as a result of a past event, it is probable that a transfer of economic benefits will be required to settle the obligation and a reliable estimate can be made of the amount of the obligation. The amount recognised as a provision is discounted to present value where the time value of money is material. The discount rate used reflects current market assessments of the time value of money and reflects any risks specific to the liability.
Expenditure on general research and development is written off against surpluses in the year in which it is incurred.
Design and content costs relating to the development of websites to support specific teaching or training courses, or for specific research projects, are capitalised. These are amortised over the useful economic life of projects. Where there is uncertainty over the life of the course or its viability such costs are written off as incurred, as are design and content costs for websites that are for the general use of the institution and its staff.
Transactions denominated in foreign currencies are recorded at the rates of exchange ruling at the dates of the transactions. Monetary assets and liabilities denominated in foreign currencies are re-translated into sterling either at year end rates or, where there are related forward foreign exchange contracts, at contract rates. The resulting exchange differences are dealt with in the determination of income and expenditure for the financial year.
Reserves are classified as restricted or unrestricted. Restricted endowment reserves include balances which, through endowments made to the University, are held as a permanently restricted fund which the University must hold in perpetuity.
Other restricted reserves include balances where the donor has designated a specific purpose and therefore the University is restricted in the use of these funds.
The various assumptions and parameters used in the valuation of the pension liabilities are disclosed in note 34. Furthermore, the valuation of the liability in the balance sheet recording the University's share of the USS pension deficit required assumptions relating to growth in future staff pay rate and headcount.
The University's operational academic buildings have been valued using a depreciated replacement cost (DRC) approach. Assumptions have been made under this basis on the cost of a modern equivalent asset. Non-specialised operational properties, such as student accommodation and other residential properties, have been valued at fair value. This value has been derived with reference to trading income and expenditure.
The preparation of financial statements under FRS102 requires judgements, estimates and assumptions to be made that affect the application of policies and reported amounts of assets and liabilities, income and expenses. The estimates and associated assumptions are based on historical experience and various other factors that are believed to be reasonable under the circumstances, the results of which form the basis of making the judgements about carrying values of assets and liabilities that are not readily apparent from other sources. Actual results may differ from these estimates. The judgements, estimates and assumptions which have a significant risk of causing a material adjustment to the carrying amount of assets and liabilities in the next financial year are discussed below.
29

University of Surrey
30
University of Surrey
Notes to the financial statements (continued)
1 Accounting policies (continued)
Judgements and estimates (continued)
b. Fixed assets (continued)
c. Investment property
d. Annual leave accrual
e. Financial instruments
Buildings have been apportioned between three components: structure, fit-out costs and plant & machinery. The apportionment of the costs between these components was based on the elemental cost breakdowns of recent university building projects to establish the appropriate proportion of notional replacement cost that should be attributed to the identified components.
Assumptions have also been made on the remaining useful economic lives of the buildlings. Consideration has been given to both the physical and functional obsolescence of the buildings and its components, as well as other environmental factors.
Land has similarly been valued under the DRC basis, having regards to the likely costs of acquiring a site for an equivalent development in a relevant location at the valuation date.
Management assesses the useful economic life of equipment by considering the expected usage, etimated technical obsolescence, residual value and physical wear and tear of the asset. Differences between such estimates and actual results may have a material impact on the amount of the carrying values of the equipment and may result in adjustments to future depreciation.
Investment property has been valued on the basis of fair value. This is defined as the price that would be received to sell an asset in an orderly transaction between market participants at the measurement date.
The University has provided for the cost of unused annual leave of its employees at the end of the financial year. This accrual was based on the actual leave carried forward at 31 July of a number of employees sampled across University departments. The results from this sample were extrapolated over the University employee population as a whole to determine the total accrual.
The University has entered into a number of interest rate swaps. These swaps have been valued at the year end using mark-to-market values as provided by Bloomberg.
30

31
University of SurreyUniversity of Surrey
Notes to the financial statements (continued)
2 Funding council grantsConsolidated & University
2016/17 2015/16£000 £000
Recurrent grantHigher Education Funding CouncilTeaching 8,969 8,077 Research 14,940 14,587
23,909 22,664
Specific grantsHigher Education Innovation Fund 3,069 2,958 Other 824 602
Deferred capital grants released in yearBuilding 1,912 1,856 Equipment 960 1,306
30,674 29,386
3 Tuition fees and education grantsConsolidated & University
2016/17 2015/16£000 £000
UK & EU undergraduates 63,570 54,035 UK & EU postgraduates 6,046 5,888 Non-EU undergraduates 25,584 24,498 Non-EU postgraduates 20,893 23,241 Non-credit bearing courses 3,156 3,230 Nurse training contract 13,417 14,674 Research training support grants 4,626 4,183
137,292 129,749
4 Research grants and contractsConsolidated & University
2016/17 2015/16£000 £000
Research councils 14,870 12,491 UK based charities 2,405 2,173 UK central government tax credits for R & D expenditure - 222 Other UK government, health and hospital authorities 3,332 3,877 UK industry and commerce 7,380 7,910 EU government bodies 7,107 7,538 EU industry and commerce 4,460 3,779 Other grants and contracts 759 956
40,313 38,946
31

University of Surrey
32
University of Surrey
Notes to the financial statements (continued)
5 Other income Consolidated University
2016/17 2015/16 2016/17 2015/16£000 £000 £000 £000
Residences, catering and conferences 31,026 30,772 29,768 29,442 Other services rendered 4,308 4,084 4,625 4,326 Income from use of University facilities 5,603 5,299 904 448 Other income 11,324 9,486 12,285 10,757
52,261 49,641 47,582 44,973
6 Investment income Consolidated University
2016/17 2015/16 2016/17 2015/16£000 £000 £000 £000
Investment income on endowments (note 25) 32 43 32 43 Research Park income 10,071 10,469 10,071 10,469 Income from non-current investments 81 18 81 18 Income from cash deposits 511 536 509 530 Other interest receivable - - 197 219
10,695 11,066 10,890 11,279
7 Donations and endowmentsConsolidated & University
2016/17 2015/16£000 £000
New endowments (note 25) 109 355 Donations with restrictions 223 196 Unrestricted donations 221 151
553 702
8 Staff Consolidated University
2016/17 2015/16 2016/17 2015/16£000 £000 £000 £000
Staff costs - operational:Wages and salaries 112,680 105,019 110,118 102,451 Social security costs 11,064 8,903 10,858 8,716 Pension costs: 17,279 15,686 17,132 15,570
141,023 129,608 138,108 126,737 Movement on USS provision 761 4,670 761 4,670 Staff costs - restructuring 128 468 116 468
141,912 134,746 138,985 131,875
Consolidated University2016/17 2015/16 2016/17 2015/16Number Number Number Number
Full time equivalent staff numbers:Research and teaching 1,095 1,030 1,095 1,030 Professional 1,073 1,006 1,045 976 Technical and experimental 140 121 140 121 Operational 372 357 308 301 Other 8 9 8 9
2,688 2,523 2,596 2,437
32

33
University of SurreyUniversity of Surrey
Notes to the financial statements (continued)
9 Emoluments of higher paid staff2016/17 2015/16
£000 £000
Emoluments of President and Vice-Chancellor: Salary - 52 (1 August 2015 to 30 September 2015) Allowance in lieu of pension contributions - 8
- 60 Pension contributions - -
- 60
Emoluments of Acting Vice-Chancellor: Salary - 123 (1 October 2015 to 24 April 2016) Benefits in kind - 2
Allowance in lieu of pension contributions - 2 - 127
Pension contributions - 12 - 139
Emoluments of President and Vice-Chancellor: Salary 310 83 (from 25 April 2016) Bonus / performance related pay 5 -
Benefits in kind 2 2 Relocation allowance - 7 Allowance in lieu of pension contributions 49 4
366 96 Pension contributions - 10
366 106
Consolidated2016/17 2015/16
Number of employeesRemuneration band
£100,001- £110,000 18 18 £110,001- £120,000 14 8 £120,001- £130,000 12 8 £130,001- £140,000 6 7 £140,001- £150,000 5 4 £150,001- £160,000 3 2 £160,001- £170,000 1 1 £170,001- £180,000 - 1 £180,001- £190,000 - - £190,001- £200,000 - - £200,001- £210,000 3 - £210,001- £220,000 - - £220,001- £230,000 - 1
62 50
On 4 May 2015 Professor Michael Kearney was appointed Acting Vice-Chancellor due to an unplanned leave of absence for Professor Sir Christopher Snowden (President and Vice-Chancellor). Professor Kearney received an allowance for this position of £12,000 for the period 1 August 2015 to 30 September 2015, not included in the comparative figures above.
In accordance with HEFCE's Accounts Direction for 2016/17 financial statements, these bands exclude staff who joined or left part way through the year who would have received emoluments in these bands in a full year.
Compensation for loss of office of £nil was paid in respect of higher paid staff (2015/16: £nil).
Remuneration of other higher paid staff, excluding employer's pension contributions and early retirement costs but including allowances in lieu of pension contributions:
33

University of Surrey
34
University of Surrey
Notes to the financial statements (continued)
9 Emoluments of higher paid staff (continued)
Key management personnel
2016/17 2015/16£000 £000
Salary, pension contributions and other emoluments 2,771 2,451
10 Other operating expenses Consolidated University
2016/17 2015/16 2016/17 2015/16£000 £000 £000 £000
Other operating expenses (inclusive of irrecoverable VAT) include:
External auditors remuneration in respect of the audit of these financial statements 63 83 63 83
External auditors remuneration in respect of other services:Audit of the University's subsidiaries 13 13 - - Audit related services 41 39 41 39 Consultancy 50 - 50 -
Operating lease rentals: land and buildings 1,592 1,642 1,592 1,554 other 1,650 1,590 1,551 1,492
Foreign exchange (gains)/losses (66) 157 (66) 157
Trustees
11 Interest and other finance costs Consolidated University
2016/17 2015/16 2016/17 2015/16£000 £000 £000 £000
On bank loans and other loans:Loans wholly repayable within five years 8 - 8 -Loans not wholly repayable within five years 6,931 6,405 6,931 6,405
6,939 6,405 6,939 6,405 On finance leases 598 631 598 631 (Decrease)/increase in fair value of derivatives (1,178) 3,834 (1,178) 3,834 Net charge on pension scheme 1,727 1,907 1,700 1,907 Other interest payable 5 9 5 9
8,091 12,786 8,064 12,786
12 Loss on investments Consolidated University
2016/17 2015/16 2016/17 2015/16£000 £000 £000 £000
Loss on revaluation of Research Park 1,077 1,334 1,077 1,334 Other investment property losses 154 - 144 - (Gain)/loss on revaluation of other investments (349) 326 (168) 570
882 1,660 1,053 1,904
Key management personnel are those persons having authority and responsibility for planning, directing and controlling the activities of the University. The University of Surrey defines its "key management personnel" to be the Executive Board members.
Key management personnel compensation is included in staff costs. The full time equivalent key management personnel were 16 (2015/16: 13).
The total consolidated statutory audit fee paid directly to KPMG, net of VAT, was £65,000 (2015/16: £82,000).
No trustee received payment for serving as a trustee during the year (2015/16: £nil).One trustee received £5,000 for services provided to the University (2015/16: £nil).The total expenses paid to or on behalf of one trustee were £486 (2015/16: £1,318 to three trustees).
34

35
University of SurreyUniversity of Surrey
Notes to the financial statements (continued)
13a Taxation Consolidated
2016/17 2015/16£000 £000
Recognised in the statement of comprehensive income and expenditure
Corporation tax on RDEC claim - 60 Tax on profits of subsidiary undertakings (44) 63 Foreign tax 57 38 Current tax charge 13 161
13b Factors affecting current tax charge
2016/17 2015/16£000 £000
Surplus before taxation 4,239 1,101
Surplus multiplied by standard rateof corporation tax in the UK of 19.67% (2015/16: 20%) 848 220
Factors affecting charge:
University surplus exempt from tax (1,031) (305)Balances eliminated on consolidation exempt from tax 4 4 Tax charged on RDEC claim - 60 Tax charged on profits earned overseas 57 38 Write off deferred tax debtor in subsidiary - 53 Corporation tax payment by subsidiary - 9 Deferred tax net credit in subsidiaries (45) - Losses carried forward in subsidiaries 79 21 Losses carried back against prior year profit in subsidiary 22 - Expenses disallowable for tax in subsidiaries 32 36 Other 47 25 Total current tax charge (note 13a) 13 161
14 Intangible assets
Software
£'000CostAt 1 August 2016 7,486 Additions at cost 2,255 Disposals (31)At 31 July 2017 9,710
AmortisationAt 1 August 2016 6,899 Charge for the year 920 Disposals (19)At 31 July 2017 7,800
Net book valueAt 31 July 2017 1,910
At 31 July 2016 587
Consolidated
Consolidated & University
35
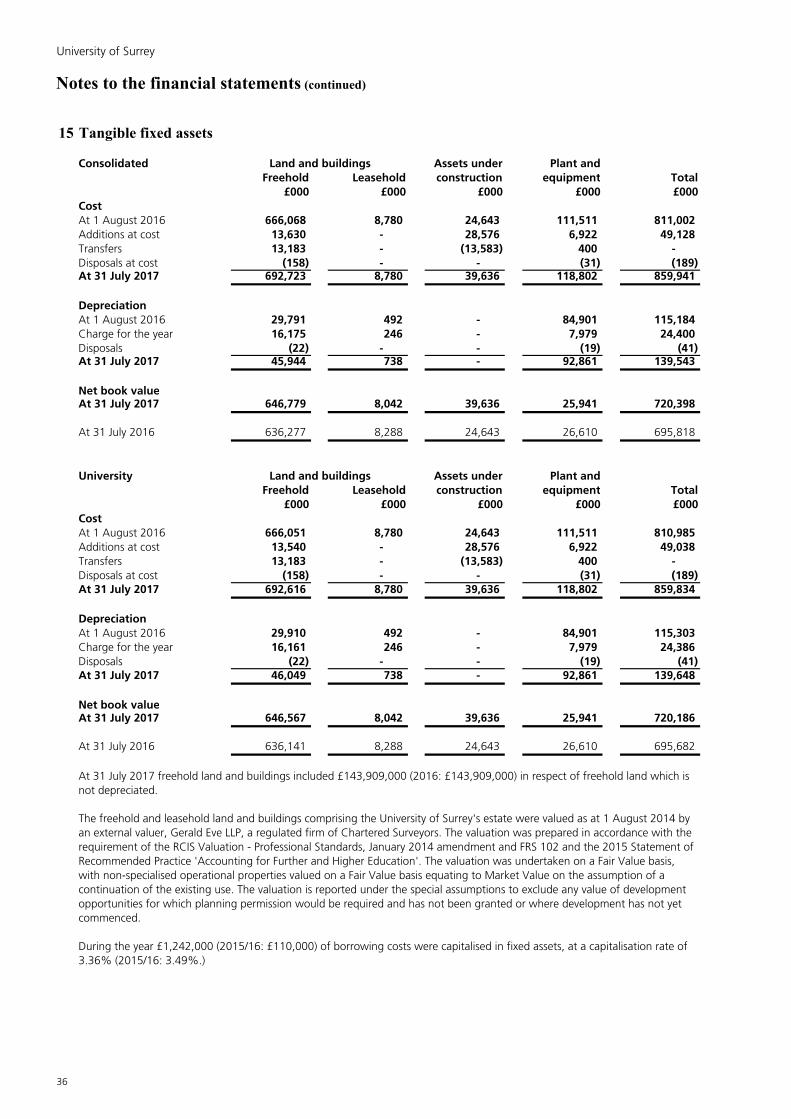
University of Surrey
36
University of Surrey
Notes to the financial statements (continued)
15 Tangible fixed assets
Consolidated Assets under Plant andFreehold Leasehold construction equipment Total
£000 £000 £000 £000 £000CostAt 1 August 2016 666,068 8,780 24,643 111,511 811,002 Additions at cost 13,630 - 28,576 6,922 49,128 Transfers 13,183 - (13,583) 400 - Disposals at cost (158) - - (31) (189)At 31 July 2017 692,723 8,780 39,636 118,802 859,941
DepreciationAt 1 August 2016 29,791 492 - 84,901 115,184 Charge for the year 16,175 246 - 7,979 24,400 Disposals (22) - - (19) (41)At 31 July 2017 45,944 738 - 92,861 139,543
Net book valueAt 31 July 2017 646,779 8,042 39,636 25,941 720,398
At 31 July 2016 636,277 8,288 24,643 26,610 695,818
University Assets under Plant andFreehold Leasehold construction equipment Total
£000 £000 £000 £000 £000CostAt 1 August 2016 666,051 8,780 24,643 111,511 810,985 Additions at cost 13,540 - 28,576 6,922 49,038 Transfers 13,183 - (13,583) 400 - Disposals at cost (158) - - (31) (189)At 31 July 2017 692,616 8,780 39,636 118,802 859,834
DepreciationAt 1 August 2016 29,910 492 - 84,901 115,303 Charge for the year 16,161 246 - 7,979 24,386 Disposals (22) - - (19) (41)At 31 July 2017 46,049 738 - 92,861 139,648
Net book valueAt 31 July 2017 646,567 8,042 39,636 25,941 720,186
At 31 July 2016 636,141 8,288 24,643 26,610 695,682
During the year £1,242,000 (2015/16: £110,000) of borrowing costs were capitalised in fixed assets, at a capitalisation rate of 3.36% (2015/16: 3.49%.)
Land and buildings
Land and buildings
The freehold and leasehold land and buildings comprising the University of Surrey's estate were valued as at 1 August 2014 by an external valuer, Gerald Eve LLP, a regulated firm of Chartered Surveyors. The valuation was prepared in accordance with the requirement of the RCIS Valuation - Professional Standards, January 2014 amendment and FRS 102 and the 2015 Statement of Recommended Practice 'Accounting for Further and Higher Education'. The valuation was undertaken on a Fair Value basis, with non-specialised operational properties valued on a Fair Value basis equating to Market Value on the assumption of a continuation of the existing use. The valuation is reported under the special assumptions to exclude any value of development opportunities for which planning permission would be required and has not been granted or where development has not yet commenced.
At 31 July 2017 freehold land and buildings included £143,909,000 (2016: £143,909,000) in respect of freehold land which is not depreciated.
36

37
University of SurreyUniversity of Surrey
Notes to the financial statements (continued)
15 Tangible fixed assets (continued)
2017 2016£000 £000
Net book valueLand & buildings 8,041 10,527 Equipment 194 304
8,235 10,831
Depreciation charge for yearLand & buildings 246 297 Equipment 110 61
356 358
16 Investment properties
Consolidated OtherBuildings
Undeveloped Under CompletedLand Development Buildings Buildings Total£000 £000 £000 £000 £000
At 1 August 2016 8,050 1,286 110,048 400 119,784 Additions - 1,172 - - 1,172 Transfers 455 (2,393) 1,938 - - Disposals - - (131) - (131)Change in market value (955) - (122) (100) (1,177) At 31 July 2017 7,550 65 111,733 300 119,648
University OtherBuildings
Undeveloped Under CompletedLand Development Buildings Buildings Total£000 £000 £000 £000 £000
At 1 August 2016 8,050 1,286 110,048 - 119,384 Additions - 1,172 - - 1,172 Transfers 455 (2,393) 1,938 - - Disposals - - (131) - (131)Change in market value (955) - (122) - (1,077) At 31 July 2017 7,550 65 111,733 - 119,348
The valuation was prepared on the basis of fair value, defined as the price that would be received to sell an asset, or paid to transfer a liability, in an orderly transaction between market participants at the measurement date.
Tangible fixed assets include the following with respect to assets held under finance leases:
Consolidated & University
The Research Park completed buildings, which have a historical cost of £55,472,000 (2016: £53,942,000), were valued as at 31 July 2017 by an external valuer, Deloitte LLP. The valuation of the property was in accordance with Valuation Practice Standard 3 of the RICS Valuation – Global Standards 2017 (revised July 2017) ('The Red Book').
Research Park
Research Park
37

University of Surrey
38
University of Surrey
Notes to the financial statements (continued)
17 Other non-current investments
ConsolidatedOther non
Subsidiary currentcompanies investments Total
£000 £000 £000
At 1 August 2016 - 1,753 1,753 Additions - - - Disposals - (1) (1)Change in market value - 98 98 At 31 July 2017 - 1,850 1,850
UniversityOther non
Subsidiary currentcompanies investments Total
£000 £000 £000
At 1 August 2016 3,198 1,259 4,457 Additions 1,680 - 1,680 Disposals - - - Change in market value (206) 124 (82) At 31 July 2017 4,672 1,383 6,055
Significant shareholdings in subsidiaries
Name Nature of business Class of share % held
Surrey Sports Park Limited Sports park management Ordinary 100UniSGrist Limited Grants to entrepreneurs Ordinary 100University of Surrey Seed Fund Limited Technology investment Ordinary 100Blackwell Developments (Guildford) Limited Property development Ordinary 100
18 Trade and other receivables
2017 2016 2017 2016£000 £000 £000 £000
Trade receivables 10,258 6,782 10,328 7,057 Amounts owed by subsidiary undertakings - - 9,169 9,023 Other receivables including taxation 140 174 104 139 Deferred tax (note 19) 196 241 - - Prepayments and accrued income 18,805 17,565 18,779 17,484
29,399 24,762 38,380 33,703
All subsidiaries are registered in England and Wales.
Consolidated University
Other receivables in the Consolidated and University balance sheets include £nil which is due after more than one year (2016: £nil).
The deferred tax receivable relates to a deferred tax credit arising in one of the subsidiaries, Surrey Sports Park Limited, the recoverability of which is dependent on future trading profits.
38

39
University of SurreyUniversity of Surrey
Notes to the financial statements (continued)
19 Deferred tax asset
2017 2016 2017 2016£000 £000 £000 £000
The deferred tax asset comprises:Accelerated capital allowances 23 19 - - Short term timing differences 63 3 - - Pension 110 219 - -
196 241 - -
Deferred tax asset excluding pension:Balance at 1 August 22 79 - -
64 (57) - - Balance at 31 July 86 22 - -
Deferred tax pension asset:Balance at 1 August 219 154 - -
(19) 2 - - (90) 63 - -
Balance at 31 July 110 219 - -
20 Current asset investments
2017 2016£000 £000
Short term deposits (maturing within 1 year) 127,000 15,028 Other investments 467 239
127,467 15,267
21 Creditors : amounts falling due within one year Consolidated University
2017 2016 2017 2016£000 £000 £000 £000
Unsecured loans (note 23a) 6,784 6,380 6,784 6,380 Obligations under finance leases (note 23b) 697 662 697 662 Other loans (note 23c) 232 238 232 238 Payments received on account 8,769 8,758 8,769 8,758 Trade creditors 4,086 3,087 3,980 3,162 Amounts owed to group undertakings - - 120 47 Other creditors including taxation and social security 14,690 14,858 14,590 14,958 Government deferred capital grants 3,517 4,044 3,517 4,044 Accruals and deferred income 74,409 68,209 73,633 67,206
113,184 106,236 112,322 105,455
Deferred income
Consolidated & University2017 2016£000 £000
Research grants received on account 6,882 5,183 Other grant income 782 679
7,664 5,862
Short term deposits are held with banks and building societies operating in the London market and licensed by the Financial Conduct Authority with more than 3 months and less than 12 months maturity at inception.
Included within accruals and deferred income are the following items of income which have been deferred until specific performance related conditions have been met.
University Consolidated
(Charge)/credit to other comprehensive income
Credit/(charge) to the statement of comprehensive income and expenditure
Consolidated & University
(Charge)/credit to the statement of comprehensive income and expenditure
39

University of Surrey
40
University of Surrey
Notes to the financial statements (continued)
22 Creditors : amounts falling due after more than one year
Consolidated University2017 2016 2017 2016£000 £000 £000 £000
Unsecured loans (note 23a) 276,637 163,421 276,637 163,421 Obligations under finance leases (note 23b) 8,574 9,273 8,574 9,273 Government deferred capital grants 66,802 65,831 66,802 65,831 Derivatives 26,719 34,758 26,719 34,758 Other loans (note 23c) 860 1,092 860 1,092 Other creditors 29 53 - -
379,621 274,428 379,592 274,375
23 Borrowings
a. Unsecured loans Consolidated & University2017 2016£000 £000
Unsecured loans are repayable as follows:Within one year or on demand 6,784 6,380 Between one and two years 11,041 6,784 Between two and five years 35,667 32,928 Over five years 229,929 123,709
283,421 169,801 Due within one year or on demand (6,784) (6,380)
Due after more than one year 276,637 163,421
Unsecured loans repayable by 2052 283,421 169,801
Unsecured loans at 31 July 2017 were as follows:
£000 Interest rate % Maturity BorrowerBanks:Scottish Widows 18,163 variable 2031 UniversityScottish Widows 25,560 variable 2022-2026 UniversityLloyds 50,000 fixed / variable 2033 UniversityNational Westminster 14,951 variable 2030 UniversityNational Westminster 1,665 variable 2022 UniversityNational Westminster 11,062 variable 2032 UniversitySantander 42,020 variable 2035 University
Private Placement:Legal & General 40,000 fixed 2046 UniversityPricoa 55,000 fixed 2046 UniversityBAE Systems Pension Fund 25,000 fixed 2052 University
283,421
The derivatives relate to interest rate swaps that the University has entered into in order to fix the interest rate paid on certain of its borrowings.
During 2016/17 a hedging gain of £1,178,000 (2015/16: loss of £3,834,000) was recognised in the statement of comprehensive income and expenditure for changes in fair value of interest rate swaps and £6,861,000 was reclassified from the statement of comprehensive income and expenditure to the cash flow hedge reserve (2015/16: £7,337,000 from the cash flow hedge reserve to the statement of comprehensive income and expenditure).
All loans are unsecured but include a negative pledge clause whereby the University undertakes not to grant security over its assets to third parties.
Interest on £30,000,000 of the Lloyds loan is payable at a fixed rate. Interest on the balance of this loan and all other variable rate loans is payable at a margin above base rate / LIBOR.
The weighted average interest rate at 31 July 2017, inclusive of lender margins and swap costs, was 3.59% (2016: 3.76%).
40

41
University of SurreyUniversity of Surrey
Notes to the financial statements (continued)
23 Borrowings (continued)
b. Finance leases
Net finance lease obligations are repayable as follows:
Consolidated & UniversityLand & Plant & Land & Plant &
buildings equipment Total buildings equipment Total£000 £000 £000 £000 £000 £000
Within one year 597 100 697 562 100 662 Between two and five years 2,768 98 2,866 3,540 198 3,738 Over five years 5,708 - 5,708 5,535 - 5,535
9,073 198 9,271 9,637 298 9,935
c. Other loansConsolidated & University
2017 2016£000 £000
Other loans are repayable as follows:Within one year 232 238 Between two and five years 283 514 Over five years 577 578 Total other loans 1,092 1,330
24 Provisions
Consolidated Obligation to Defined Pensionfund deficit on benefit enhancements
USS pension obligations on termination Total£000 £000 £000 £000
At 1 August 2016 34,298 45,604 1,397 81,299 Utilised in year (1,266) (729) (108) (2,103)Additions 761 (9,591) 86 (8,744)At 31 July 2017 33,793 35,284 1,375 70,452
University Obligation to Defined Pensionfund deficit on benefit enhancements
USS pension obligations on termination Total£000 £000 £000 £000
At 1 August 2016 34,298 44,512 1,397 80,207 Utilised in year (1,266) (742) (108) (2,116)Additions 761 (9,136) 86 (8,289)At 31 July 2017 33,793 34,634 1,375 69,802
The obligation to fund the past deficit on the Universities Superannuation Scheme (USS) arises from the contractual obligation with the pension scheme for total payments relating to benefits arising from past performance. Management have assessed future employees within the USS and salary payments over the period of the contracted obligation in assessing the value of this provision. The University is funding the deficit through monthly payments into the scheme at a rate of 2.1% of pensionable pay. The provision is based on the deficit recovery plan agreed following the March 2014 valuation. This recovery plan provides for the deficit to be paid off by 2031. The deficit recovery plan is subject to revision following each triennial valuation.
For the assumptions on the discount rate and inflation used for calculating the provision for pension enhancements on termination see note 34b.
2017 2016
The defined benefit obligations comprise the deficits on the local government pension schemes (Surrey Pension Fund and LPFA Pension Fund). The University is currently making monthly payments to the Surrey Pension Fund of £144,000 to pay off the deficit by 2033 and an annual payment to the LPFA Pension Fund of £80,000, rising annually with CPI, to pay off the deficit by 2028. The obligations and payments are subject to revision following each triennial valuation.
41

University of Surrey
42
University of Surrey
Notes to the financial statements (continued)
25 Endowment reserve
Consolidated & UniversityRestricted Restricted 2017 2016
permanent expendable Total Total£000 £000 £000 £000
Balances at 1 August 2016Capital 253 1,979 2,232 2,432 Accumulated income 186 254 440 129
439 2,233 2,672 2,561
New endowments - 109 109 355 Investment income 10 22 32 43 Expenditure (7) (381) (388) (230)Increase/(decrease) in market value of investments 51 82 133 (57)
54 (168) (114) 111
At 31 July 2017 493 2,065 2,558 2,672
Represented by:
Capital 325 1,882 2,207 2,232 Accumulated income 168 183 351 440
493 2,065 2,558 2,672
Analysis by type of purpose:
Scholarships and bursaries 263 1,144 1,407 1,459 Prize funds 201 115 316 305 Hardship funds 29 22 51 154 General - 781 781 748 Research support - 3 3 6
493 2,065 2,558 2,672
Analysis by asset:
Listed investments 1,207 1,042 Cash held as part of investment portfolio 63 104 Cash held at bank for endowment funds 1,288 1,526
2,558 2,672
26 Connected charitable institutions
Connected institutions with income under £100,000At 1 August Change in At 31 July
2016 Income Expenditure market value 2017£000 £000 £000 £000 £000
Restricted expendable endowment funds:Scholarship (1 fund) 569 12 (27) 64 618 Studentship (2 funds) 344 2 (69) - 277
913 14 (96) 64 895
There were no connected institutions with income over £100,000.
A number of charitable institutions are administered by or on behalf of the University and have been established for its general or specific purposes. As a result, under paragraph 28 of schedule 3 to the Charities Act 2011, these connected institutions are exempt from registration with the Charity Commission. All of these connected institutions are included in these consolidated financial statements. The movements in the year on the total funds of all connected institutions, as reported in their own accounts, were as follows:
42
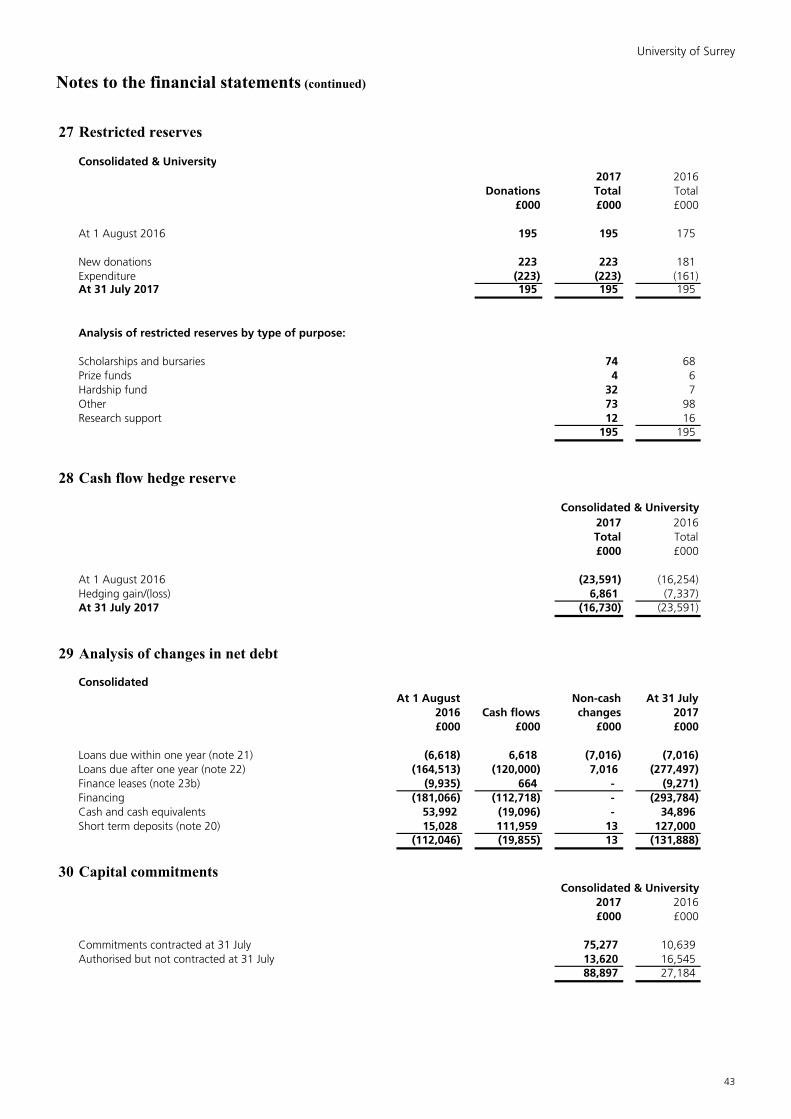
43
University of SurreyUniversity of Surrey
Notes to the financial statements (continued)
27 Restricted reserves
Consolidated & University2017 2016
Donations Total Total£000 £000 £000
At 1 August 2016 195 195 175
New donations 223 223 181 Expenditure (223) (223) (161)At 31 July 2017 195 195 195
Analysis of restricted reserves by type of purpose:
Scholarships and bursaries 74 68 Prize funds 4 6 Hardship fund 32 7 Other 73 98 Research support 12 16
195 195
28 Cash flow hedge reserve
Consolidated & University2017 2016Total Total£000 £000
At 1 August 2016 (23,591) (16,254)Hedging gain/(loss) 6,861 (7,337)At 31 July 2017 (16,730) (23,591)
29 Analysis of changes in net debt
ConsolidatedAt 1 August Non-cash At 31 July
2016 Cash flows changes 2017£000 £000 £000 £000
Loans due within one year (note 21) (6,618) 6,618 (7,016) (7,016)Loans due after one year (note 22) (164,513) (120,000) 7,016 (277,497)Finance leases (note 23b) (9,935) 664 - (9,271)Financing (181,066) (112,718) - (293,784)Cash and cash equivalents 53,992 (19,096) - 34,896 Short term deposits (note 20) 15,028 111,959 13 127,000
(112,046) (19,855) 13 (131,888)
30 Capital commitmentsConsolidated & University
2017 2016£000 £000
Commitments contracted at 31 July 75,277 10,639 Authorised but not contracted at 31 July 13,620 16,545
88,897 27,184
43

University of Surrey
44
University of Surrey
Notes to the financial statements (continued)
31 Lease obligations
Total rentals payable under non-cancellable operating leases are as follows:
Consolidated & University2017 2016
Land & Plant & Land & Plant &buildings equipment buildings equipment
Expiry date: £000 £000 £000 £000
Within one year 433 21 478 14 Between two and five years - 1,180 - 1,554 Over five years - - - -
433 1,201 478 1,568
Total rentals receivable under non-cancellable operating leases are as follows:
Consolidated2017 2016
Land & Plant & Land & Plant &buildings equipment buildings equipment
Expiry date: £000 £000 £000 £000
Within one year 5,241 - 4,827 - Between two and five years 14,654 - 15,134 - Over five years 10,653 - 9,165 -
30,548 - 29,126 -
University2017 2016
Land & Plant & Land & Plant &buildings equipment buildings equipment
Expiry date: £000 £000 £000 £000
Within one year 5,241 - 4,827 - Between two and five years 14,654 - 15,134 - Over five years 9,209 - 9,165 -
29,104 - 29,126 -
32 Contingent assets and liabilities
33 Financial commitments
Undrawn loan facilities
There are no other known contingent assets or liabilities.
A contingent liability exists in relation to the USS pension valuation recovery plan, since the University is an employer of members within the scheme. The contingent liability relates to the amount generated by past service of current members and the associated proportion of the deficit. Given that the scheme is a multi-employer scheme and the University is unable to identify its share of the underlying assets and liabilities, the contingent liability is not recognised as a provision on the balance sheet. The associated receivable from the scheme in respect of the reimbursement of the University's expenditure is similarly not recognised.
The loan is repayable in 60 equal quarterly instalments from 31 July 2018.
On 4 June 2013 the University entered into an agreement with Lloyds TSB Bank plc to borrow £60,000,000. £35,000,000 of this balance was drawn down on 31 October 2013, £15,000,000 was drawn down on 31 October 2014 and the balance of £10,000,000 is due to be drawn down no later than 31 December 2018.
Interest on the loan was payable at a variable rate up until 31 July 2014. From 1 August 2014, interest on £30,000,000 (amortising) is payable at a fixed rate and interest on the balance is payable at a variable rate.
44

45
University of SurreyUniversity of Surrey
Notes to the financial statements (continued)
34 Pension schemes
The total pension cost for the University and its subsidiaries was:
Consolidated2016/17 2015/16
Total Total£000 £000
USS 13,492 11,901 Local government pension scheme 3,443 3,443 Other pension schemes 344 342 Total pension cost 17,279 15,686
The following amounts were paid in respect of early retirements and are included in restructuring costs:
Consolidated2016/17 2015/16
£000 £000
USS - 28 Local Government Pension Scheme curtailments - 49
- 77
a. Universities Superannuation Scheme (USS)
2017 2016£000 £000
Scheme assets 60,000,000 49,800,000 Total scheme liabilities (77,500,000) (58,300,000)FRS 102 total scheme deficit (17,500,000) (8,500,000)FRS 102 total funding level 77% 85%
2017 2016
Discount rate 2.6% 3.6%Pensionable salary growth n/a n/a
Pension increases (CPI) 2.4% 2.2%
The USS is the main scheme covering most academic and academic related staff, which provides benefits based on final pensionable salary. The assets of the scheme are held in a separate fund administered by the trustee, Universities Superanuation Scheme Limited.
Defined benefit liability numbers for the scheme have been produced using the following assumptions:
USS is valued every three years by a professionally qualified independent actuary using the projected unit method. The actuary carries out a review of the funding level each year between triennial valuations and details of his estimate of the funding level at 31 March 2017 are included in this note.
The latest triennial actuarial valuation of the scheme was as at 31 March 2014 ("the valuation date"). This was the third valuation for USS under the scheme-specific funding regime introduced by the Pensions Act 2004, which requires schemes to adopt a statutory funding objective, which is to have sufficient and appropriate assets to cover their technical provisions. At the valuation date the value of the assets of the scheme was £41.6 billion and the value of the scheme's technical provisions was £46.9 billion indicating a shortfall of £5.3 billion. The assets therefore were sufficient to cover 89% of the benefits which had accrued to members after allowing for expected future increases in earnings. FRS 102 valuations of these assets and liabilities at 31 July 2016 and 31 July 2017 were:
Since the institution cannot identify its share of scheme assets and liabilities, the following disclosures reflect those relevant for the scheme as a whole.
45
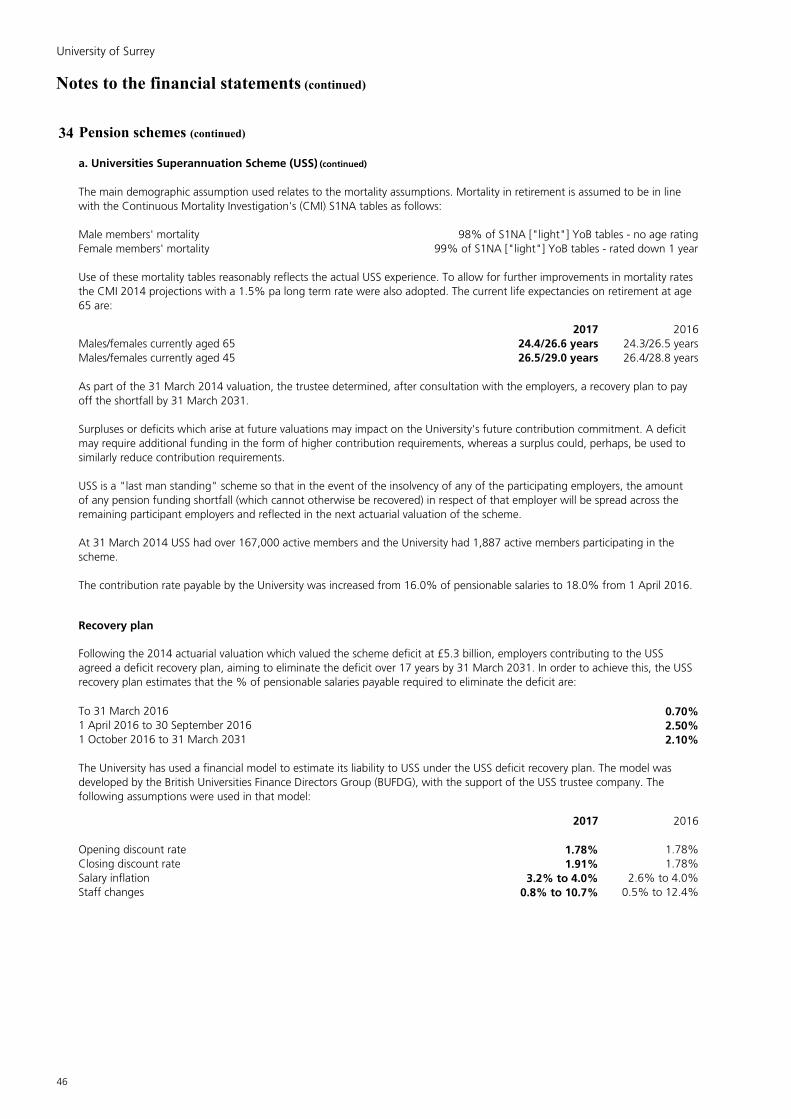
University of Surrey
46
University of Surrey
Notes to the financial statements (continued)
34 Pension schemes (continued)
a. Universities Superannuation Scheme (USS) (continued)
Male members' mortality 98% of S1NA ["light"] YoB tables - no age ratingFemale members' mortality 99% of S1NA ["light"] YoB tables - rated down 1 year
2017 2016Males/females currently aged 65 24.4/26.6 years 24.3/26.5 yearsMales/females currently aged 45 26.5/29.0 years 26.4/28.8 years
Recovery plan
To 31 March 2016 0.70%1 April 2016 to 30 September 2016 2.50%1 October 2016 to 31 March 2031 2.10%
2017 2016
Opening discount rate 1.78% 1.78%Closing discount rate 1.91% 1.78%Salary inflation 3.2% to 4.0% 2.6% to 4.0%Staff changes 0.8% to 10.7% 0.5% to 12.4%
At 31 March 2014 USS had over 167,000 active members and the University had 1,887 active members participating in the scheme.
Following the 2014 actuarial valuation which valued the scheme deficit at £5.3 billion, employers contributing to the USS agreed a deficit recovery plan, aiming to eliminate the deficit over 17 years by 31 March 2031. In order to achieve this, the USS recovery plan estimates that the % of pensionable salaries payable required to eliminate the deficit are:
The University has used a financial model to estimate its liability to USS under the USS deficit recovery plan. The model was developed by the British Universities Finance Directors Group (BUFDG), with the support of the USS trustee company. The following assumptions were used in that model:
The contribution rate payable by the University was increased from 16.0% of pensionable salaries to 18.0% from 1 April 2016.
The main demographic assumption used relates to the mortality assumptions. Mortality in retirement is assumed to be in line with the Continuous Mortality Investigation's (CMI) S1NA tables as follows:
Use of these mortality tables reasonably reflects the actual USS experience. To allow for further improvements in mortality rates the CMI 2014 projections with a 1.5% pa long term rate were also adopted. The current life expectancies on retirement at age 65 are:
As part of the 31 March 2014 valuation, the trustee determined, after consultation with the employers, a recovery plan to pay off the shortfall by 31 March 2031.
Surpluses or deficits which arise at future valuations may impact on the University's future contribution commitment. A deficit may require additional funding in the form of higher contribution requirements, whereas a surplus could, perhaps, be used to similarly reduce contribution requirements.
USS is a "last man standing" scheme so that in the event of the insolvency of any of the participating employers, the amount of any pension funding shortfall (which cannot otherwise be recovered) in respect of that employer will be spread across the remaining participant employers and reflected in the next actuarial valuation of the scheme.
46

47
University of SurreyUniversity of Surrey
Notes to the financial statements (continued)
34 Pension schemes (continued)
b. Surrey County Council local government pension scheme (Surrey Pension Fund)
Consolidated2017 2016
Pension increase rate (CPI) 2.4% 1.9%Salary increase rate 2.7% 3.4%Discount rate 2.6% 2.4%
Males Females Males FemalesCurrent pensioners 22.5 years 24.6 years 22.5 years 24.6 years
24.1 years 26.4 years 24.5 years 26.9 years
The Group's estimated share of the assets in the scheme was:
2017 2016£000 £000
Equities 70,203 68,483 Bonds 13,464 14,417 Property 7,693 5,407 Cash 4,808 1,802
96,168 90,109
The following amounts were measured in accordance with the requirements of FRS 102:
Analysis of amounts shown in the balance sheet
2017 2016£000 £000
Fair value of employer assets 96,168 90,109 Present value of funded liabilities (131,287) (134,920)Net underfunding in funded plans (35,119) (44,811)Present value of unfunded liabilities (1,277) (1,286)Net liability (36,396) (46,097)
The Surrey Pension Fund is valued every three years by professionally qualified independent actuaries using the projected unit method. In the intervening years the actuary reviews the progress of the scheme.
The contribution payable by the employer, as a percentage of payroll, is 19.9%. This percentage reflects the future service contribution. The past service deficit will be met by the payment of monetary amounts. The amount payable in respect of the past service deficit in 2016/17 was £1,732,000 per annum (2015/16: £1,732,000).
Consolidated
Consolidated
Life expectancy is based on Vita Curves with improvements in line with the CMI 2013 model assuming the current rate of improvements has peaked and will converge to a long term rate of 1.25%. Based on these assumptions, the average future life expectancies at age 65 for males and females are summarised below:
An allowance is included for future retirements to elect to take 25% of the maximum additional tax-free cash up to HMRC limits for pre-April 2008 service and 63% of the maximum tax-free cash for post-April 2008 service.
2017 2016
Future pensioners (assumed age at 31 March 2016 is 45 years)
Under the definitions set out in section 28 of FRS 102, "Employee benefits", the Surrey Pension Fund is a multi-employer defined benefit pension scheme. The actuary has identified the University's share of its assets and liabilities as at 31 July 2017.
A full actuarial valuation was carried out as at 31 March 2016 and updated to 31 July 2017 on an FRS102 basis by a qualified independent actuary. The material assumptions used by the actuary were:
47

University of Surrey
48
University of Surrey
Notes to the financial statements (continued)
34 Pension schemes (continued)
b. Surrey County Council local government pension scheme (Surrey Pension Fund) (continued)
Analysis of amounts recognised in the consolidated statement of comprehensive income and expenditure
2016/17 2015/16£000 £000
Current service cost 3,443 3,443 Net interest 1,101 1,374 Past service cost (including curtailments) - 49
4,544 4,866
Actual return on plan assets (5,929) (7,272)
Analysis of amounts recognised in other comprehensive income
2016/17 2015/16£000 £000
Changes in financial assumptions (2,571) (13,115)Other experience gains 9,625 1,743 Return on assets excluding amounts shown in net interest 3,351 4,320 Total measurements recognised in other comprehensive income 10,405 (7,052)
Changes in the present value of the defined benefit obligation
2016/17 2015/16£000 £000
Opening defined benefit obligation 136,207 119,673 Current service cost 3,443 3,443 Interest cost on defined benefit obligation 3,271 4,326 Contributions by members 671 789 Changes in financial assumptions 2,571 13,115 Other experience gains (9,625) (1,743)Past service cost (including curtailments) - 49 Estimated benefits paid (3,887) (3,358)Unfunded benefits paid (87) (87)Closing defined benefit obligation 132,564 136,207
Changes in the fair value of employer assets
2016/17 2015/16£000 £000
Opening fair value of employer assets 90,109 81,048 Interest on assets 2,170 2,951 Contributions by members 671 789 Contributions by the employer 3,754 4,359 Contributions in respect of unfunded benefits 87 87 Return on assets less interest 3,351 4,320 Estimated benefits paid (3,887) (3,358)Unfunded benefits paid (87) (87)Closing fair value of employer assets 96,168 90,109
Consolidated
Consolidated
Consolidated
Consolidated
48

49
University of SurreyUniversity of Surrey
Notes to the financial statements (continued)
34 Pension schemes (continued)
c. London Pensions Fund Authority local government pension scheme (LPFA Pension Fund)
2017 2016
Pension increase rate (CPI) 2.0% 1.5%Discount rate 1.5% 1.6%
The average future life expectancies at age 65 are summarised below:
Males Females Males FemalesRetiring today 21.1 years 24.0 years 21.9 years 24.0 years
2017 2016£000 £000
Cashflow matching - 157 Equities 1,279 927 Cash 145 75 Target return portfolio 433 438 Other assets 230 204
2,087 1,801
The following amounts were measured in accordance with the requirements of FRS 102:
Analysis of amounts shown in the balance sheet
2017 2016£000 £000
Fair value of employer assets 2,087 1,801 Present value of funded liabilities (2,252) (2,594)Net underfunding in funded plans (165) (793)Present value of unfunded liabilities (98) (111)Net liability (263) (904)
The University's estimated share of the assets in the scheme was:
20162017
The LPFA Pension Fund is valued every three years by professionally qualified independent actuaries using the projected unit method. In the intervening years, the actuary reviews the progress of the scheme.
Under the definitions set out in Section 28 of FRS 102, "Employee benefits", the LPFA Pension Fund is a multi-employer defined benefit pension scheme. The actuary has identified the University's share of its assets and liabilities as at 31 July 2017.
A full actuarial valuation was carried out as at 31 March 2016 and updated to 31 July 2017 on an FRS 102 basis by a qualified independent actuary. The relevant material assumptions used by the actuary at 31 July 2017 were:
49

University of Surrey
50
University of Surrey
Notes to the financial statements (continued)
34 Pension schemes (continued)
c. London Pensions Fund Authority local government pension scheme (LPFA Pension Fund) (continued)
Analysis of amounts recognised in the consolidated statement of comprehensive income and expenditure
2016/17 2015/16£000 £000
Net interest 14 22 Administration expenses 2 3
16 25
Actual return on plan assets (270) (95)
Analysis of amounts recognised in other comprehensive income
2016/17 2015/16£000 £000
Changes in financial assumptions 39 (202)Other experience gains/(losses) 135 (4)Return on assets excluding amounts shown in net interest 242 43 Other actuarial gains on assets 59 - Total measurements recognised in other comprehensive income 475 (163)
Changes in the present value of the defined benefit obligation
2017 2016£000 £000
Opening defined benefit obligation 2,705 2,659 Interest cost 42 74 Change in financial assumptions 99 202 Change in demographic assumptions (138) - Other experience (gains)/losses (135) 4 Estimated benefits paid (210) (221)Unfunded benefits paid (13) (13)Closing defined benefit obligation 2,350 2,705
Changes in the fair value of employer assets
2017 2016£000 £000
Opening fair value of employer assets 1,801 1,854 Interest on assets 28 52 Return on assets less interest 242 43 Other actuarial gains 59 - Contributions by the employer 169 76 Contributions in respect of unfunded benefits 13 13 Estimated benefits paid (210) (221)Unfunded benefits paid (13) (13)Administration expenses (2) (3)Closing fair value of employer assets 2,087 1,801
50

51
University of SurreyUniversity of Surrey
Notes to the financial statements (continued)
35 Related party transactions
2016/17
£000 £000 £000
Charterhouse School 2 - - Electrical Research Association Foundation 68 - - Guildford Education Partnership 1 - - Kent, Surrey & Sussex Air Ambulance Trust 2 - - Royal Surrey County Hospital Foundation NHS Trust 629 - (102)Surrey County Council 165 30 (22)
176 1,169 2
2015/16
£000 £000 £000
Andrews and Partners Ltd 122 - 21 Electrical Research Association Foundation 75 - - Philips Electronics UK Ltd 30 20 28 Recycling Technologies Ltd 22 - 2 Surrey County Council 110 21 10 Universities UK 36 2 -
59 1,114 - University of Surrey Students' Union
Balance due to/(from)
the University
Recognised income
Recognised expenditure
University of Surrey Students' Union
All transactions involving entities in which a member of the Council or the Executive Board may have an interest, including those identified below, are conducted in accordance with the University's financial regulations and normal procurement procedures. The University has taken advantage of the exemption under FRS 102 not to disclose transactions with subsidiaries that are wholly owned. The table below shows transactions with related parties not covered by the exemption.
Recognised expenditure
Recognised income
Balance due to/(from)
the University
Related parties include Council and Executive Board members and entities in which the Council and Executive Board members have significant influence.
51

University of Surrey
52
University of Surrey
Notes to the financial statements (continued)
36 Financial instruments
Carrying amount of financial instruments
The carrying amounts of the financial assets include:2017 2016£000 £000
Assets measured at fair value through the statement of comprehensive income and expenditure 1,674 1,281 Liabilities measured at fair value through the statement of comprehensive income and expenditure (26,719) (34,758)
Assets
Liabilities
Lender Interest rate % Maturity Fair value2016 2016£000 £000
Barclays 5.09 2032 Quarterly 2,084 4,774 Barclays 5.38 2032 Quarterly 3,881 2,546 Lloyds 5.49 2022 Quarterly 1,176 1,605 Lloyds 4.00 2038 Quarterly 1,213 6,339 RBS 4.74 2024 Quarterly 1,286 1,649 RBS 4.52 2024 Quarterly 12,134 1,564 Barclays 4.33 2035 Quarterly 4,945 16,281
26,719 34,758
During the year changes in the fair value of the interest rate swaps of £1,243,000 were credited to interest payable (2015/16: £3,834,000 charge to interest payable) and £6,947,000 credited to other comprehensive income (2015/16: £7,337,000 charge to other comprehensive income).
The fair value of the financial assets measured at fair value through the statement of comprehensive income and expenditure is determined by reference to their quoted bid price at the balance sheet date.
The fair value of interest rate swaps, recorded in liabilities, is based on broker quotes using forecast projections of LIBOR. Those quotes are tested for reasonableness by discounting estimated future cash flows based on the terms and maturity of each contract and using market interest rates for similar instruments at the measurement date.
The University uses interest rate swaps as cash flow hedges in order to hedge against the risk of fluctuations in cash flows arising from interest rate changes on certain of the University's borrowings. These swaps, included in liabilities above, are as follows:
During the year income arising from assets measured at fair value of £25,000 (2015/16: £48,000) and net gains on changes in fair value of £388,000 (2015/16: £467,000 loss) were recognised in the statement of comprehensive income and expenditure.
Interest payment frequency
52

53
University of SurreyUniversity of Surrey
Council members (trustees)
ChairDr J Glover
Vice-ChairMs A Watts
TreasurerMr A Stuart
Ex officio members
President & Vice-ChancellorProfessor G Q M Lu
Provost & Executive Vice-PresidentProfessor M Kearney
Chief Operating OfficerMr D Sharkey (from December 2016)
Senior Vice-President (Advancement and Partnerships) Mr G Melly (from December 2016)
Senior Vice-President (Global Strategy and Engagement) Professor V Emery (from December 2016)
President, Students’ UnionMs A Mackenzie Smith (to July 2017)Ms S Cochrane (from July 2017)
Elected by the Senate Professor R BrooksDr R Woods (to August 2017)Professor S Price (from September 2017)Professor P Smith (from September 2017)
Lay membersMr V Baxi (from January 2017)Dr H Bowcock (to July 2017)Dr A BraggDr M GoodfellowMr A Herman (to December 2016)Dr S HowesMs C Ighodaro Mr P MaskellMr D McNulty (from January 2017)Mr M Queen Ms J SawkinsDato Dr Kim Tan (to March 2017)Mr K Taylor (to December 2016)
The Council members who held office during the year and until the date on which the financial statements were formally approved were as follows:
53

University of Surrey
54

55
University of Surrey

University of SurreyGuildford, Surrey GU2 7XH, UK
T: +44 (0)1483 300800
twitter.com/uniofsurrey facebook.com/universityofsurrey youtube.com/universityofsurrey
surrey.ac.uk
7104-1217