Financial statements of - Family Service Toronto · Family Service Toronto Notes to the financial...
23
Financial statements of Family Service Toronto March 31, 2017
Transcript of Financial statements of - Family Service Toronto · Family Service Toronto Notes to the financial...

Financial statements of
Family Service Toronto March 31, 2017

Family Service Toronto March 31, 2017 Table of contents Independent Auditor’s Report ............................................................................................................................ 1-2
Statement of financial position .............................................................................................................................. 3
Statement of operations ........................................................................................................................................ 4
Statement of changes in fund balances ................................................................................................................ 5
Statement of cash flows ........................................................................................................................................ 6
Notes to the financial statements ..................................................................................................................... 7-21
Deloitte LLP 400 Applewood Crescent Suite 500 Vaughan ON L4K 0C3 Canada Tel: 416-601-6150 Fax: 416-601-6151 www.deloitte.ca
Independent Auditor’s Report
To the Members of Family Service Toronto
We have audited the accompanying financial statements of Family Service Toronto (“FST”), which comprise the statement of financial position as at March 31, 2017, the statements of operations, changes in fund balances, and cash flows for the year then ended and a summary of significant accounting policies and other explanatory information.
Management’s Responsibility for the Financial Statements Management is responsible for the preparation and fair presentation of these financial statements in accordance with Canadian accounting standards for not-for-profit organizations, and for such internal control as management determines is necessary to enable the preparation of financial statements that are free from material misstatement, whether due to fraud or error.
Auditor’s Responsibility Our responsibility is to express an opinion on these financial statements based on our audit. We conducted our audit in accordance with Canadian generally accepted auditing standards. Those standards require that we comply with ethical requirements and plan and perform the audit to obtain reasonable assurance about whether the financial statements are free from material misstatement.
An audit involves performing procedures to obtain audit evidence about the amounts and disclosures in the financial statements. The procedures selected depend on the auditor’s judgment, including the assessment of the risks of material misstatement of the financial statements, whether due to fraud or error. In making those risk assessments, the auditor considers internal control relevant to the entity’s preparation and fair presentation of the financial statements in order to design audit procedures that are appropriate in the circumstances, but not for the purpose of expressing an opinion on the effectiveness of the entity’s internal control. An audit also includes evaluating the appropriateness of accounting policies used and the reasonableness of accounting estimates made by management, as well as evaluating the overall presentation of the financial statements.
We believe that the audit evidence we have obtained is sufficient and appropriate to provide a basis for our audit opinion.

Page 2
Opinion In our opinion, the financial statements present fairly, in all material respects, the financial position of FST as at March 31, 2017 and the results of its operations and its cash flows for the year then ended in accordance with Canadian accounting standards for not-for-profit organizations.
Chartered Professional Accountants Licensed Public Accountants June 15, 2017

Family Service TorontoStatement of financial positionas at March 31, 2017
2017 2016Capital and Capital and
General Learning Endowment General Learning EndowmentFund Fund Funds Total Fund Fund Funds Total
$ $ $ $ $ $ $ $
AssetsCurrent assets
Cash 1,192,996 - - 1,192,996 3,095,112 506,228 - 3,601,340 Grants and accounts receivable (Note 5) 950,378 15,000 - 965,378 640,961 - - 640,961 Prepaid expenses 542,353 - - 542,353 447,823 - - 447,823
2,685,727 15,000 - 2,700,727 4,183,896 506,228 - 4,690,124
Investments (Note 3) - - 1,028,861 1,028,861 - - 976,013 976,013 Net investment in joint venture (Note 4) - 2,315,715 - 2,315,715 - 2,520,953 - 2,520,953 Capital assets (Note 6) - 1,362,086 - 1,362,086 - 1,636,730 - 1,636,730 Deferred property development costs (Note 7) - 295,532 - 295,532 - 295,532 - 295,532 Mortgage receivable (Note 8) - 12,430,301 12,430,301 - 12,430,301 - 12,430,301
2,685,727 16,418,634 1,028,861 20,133,222 4,183,896 17,389,744 976,013 22,549,653
LiabilitiesCurrent liabilities
Accounts payable and accrued charges (Note 9) 3,397,766 - - 3,397,766 5,322,078 - - 5,322,078 Deferred lease inducements (Note 16) - 55,552 - 55,552 - 55,552 - 55,552 Inter-fund balances (463,597) 423,097 40,500 - (848,017) 836,876 11,141 - Deferred contributions (Note 11) 253,078 - 267,963 521,041 279,318 - 265,459 544,777
3,187,247 478,649 308,463 3,974,359 4,753,379 892,428 276,600 5,922,407
Long-termDeferred lease inducements (Note 16) 201,325 421,273 - 622,598 143,881 476,825 - 620,706 Deferred capital contributions (Note 11) - 381,995 381,995 - 590,087 - 590,087
3,388,572 1,281,917 308,463 4,978,952 4,897,260 1,959,340 276,600 7,133,200
Commitments and contingencies (Notes 22 and 23)
Fund balancesInvested in capital assets (Note 13) - 503,266 - 503,266 - 514,266 - 514,266 Invested in property development project (Notes 7 and 8) - 12,725,833 - 12,725,833 - 12,725,833 - 12,725,833 Externally restricted (Note 12) - - 720,398 720,398 - - 699,413 699,413 Internally restricted (Note 13) - 1,907,618 - 1,907,618 - 2,190,305 - 2,190,305 Unrestricted (702,845) - - (702,845) (713,364) - - (713,364)
(702,845) 15,136,717 720,398 15,154,270 (713,364) 15,430,404 699,413 15,416,453 2,685,727 16,418,634 1,028,861 20,133,222 4,183,896 17,389,744 976,013 22,549,653
The accompanying notes to the financial statements are an integral part of this financial statement.Page 3

Family Service TorontoStatement of operationsyear ended March 31, 2017
2017 2016General Fund Capital and General Fund Capital and
Community Client purchase Learning Community Client purchase Learningprograms IWS (1) of service (2) Fund Total programs FSEAP/IWS (1) of service (2) Fund Total
$ $ $ $ $ $ $ $ $ $
RevenueGovernment (Note 14) 6,224,851 - 30,462,379 - 36,687,230 6,301,625 - 27,656,847 - 33,958,472 United Way
Base allocation 3,707,974 - - 61,321 3,769,295 3,720,104 - - 49,191 3,769,295 Other 89,047 - - - 89,047 81,167 - - - 81,167
Foundations and other agencies 200,529 - 299,602 - 500,131 199,791 - 455,160 - 654,951 Fees
Integrated Workplace Solutions - 550,617 - 11,000 561,617 - - - - - Employee assistance program - - - - - - 1,506,922 - - 1,506,922 Client 172,935 - - - 172,935 141,270 - - - 141,270
Membership, donations and bequests 48,712 - - - 48,712 103,097 - - - 103,097 Investment income (Note 3) 45,739 - - - 45,739 11,082 - - 12,105 23,187 Gain on sale of capital assets (Note 6) - - - - - - - - 12,269,584 12,269,584 Amortization of deferred capital
contributions (Note 11b) - - - 301,001 301,001 - - - 321,185 321,185 Amortization of deferred lease
inducements (Note 16) - - - 55,552 55,552 - - - 50,923 50,923 Other 38,602 - - 85,902 124,504 74,286 9,472 - 9,246 93,004
10,528,389 550,617 30,761,981 514,776 42,355,763 10,632,422 1,516,394 28,112,007 12,712,234 52,973,057
ExpensesSalaries 6,653,554 230,494 - 5,304 6,889,352 7,078,775 968,658 - - 8,047,433 Employee benefits 1,168,923 38,890 - 8,437 1,216,250 1,232,881 168,726 - - 1,401,607 Client purchase of service - - 30,761,981 - 30,761,981 - - 28,112,007 - 28,112,007 Contracted services 975,405 249,490 - 17,661 1,242,556 807,290 73,420 - 768,520 1,649,230 Building occupancy 788,179 21,910 - 253,258 1,063,347 611,103 181,532 - 307,330 1,099,965 Office and supplies 614,138 5,777 - 419 620,334 511,404 51,797 - 140,963 704,164 Transportation 74,514 2,800 - 210 77,524 96,877 4,536 - - 101,413 Promotion 19,876 21 - - 19,897 19,952 35,099 - - 55,051 Education and conferences 42,660 - - - 42,660 42,060 1,065 - - 43,125 Amortization - - - 417,874 417,874 - - - 421,299 421,299 Share of loss of joint venture (Note 4) - - - 137,736 137,736 - - - 152,747 152,747 Other 192,302 554 - (43,436) 149,420 232,361 22,572 - 267,176 522,109
10,529,551 549,936 30,761,981 797,463 42,638,931 10,632,703 1,507,405 28,112,007 2,058,035 42,310,150 (Deficiency) excess of revenue over
expenses (1,162) 681 - (282,687) (283,168) (281) 8,989 - 10,654,199 10,662,907
(1) FSEAP is defined as Family Services Employee Assistance Program. IWS is defined as Integrated Workplace Solutions(2) FST administers these funds for clients on behalf of the Government of Ontario and Partner Agencies.
The accompanying notes to the financial statements are an integral part of this financial statement.Page 4

Family Service TorontoStatement of changes in fund balancesyear ended March 31, 2017
2017 2016
General Endowment General EndowmentFund Capital and Learning Fund Funds Fund Capital and Learning Fund Funds
Invested in Invested inproperty property
development Invested in Internally development Invested inproject capital restricted Externally project capital Internally Externally
Unrestricted (Notes 7 and 8) assets (Note 13) restricted Total Unrestricted (Notes 7 and 8) assets restricted restricted Total$ $ $ $ $ $ $ $ $ $ $ $
Fund balances, beginning of year (713,364) 12,725,833 514,266 2,190,305 699,413 15,416,453 (1,042,768) 212,383 1,470,162 3,414,356 752,473 4,806,606
(Deficiency) excess of revenue over expenses (481) - - (282,687) - (283,168) 8,708 12,430,301 (1,160,717) (615,385) - 10,662,907
Additions duringthe year 11,000 - (11,000) - - - (204,821) 83,149 204,821 (83,149) - -
FSEAP Interfund loan (Note 10) - - - - - - 525,517 - - (525,517) - - Change in unrealized gain (loss)
in the endowment funds - - - - 20,985 20,985 - - - - (53,060) (53,060) Fund balances, end of year (702,845) 12,725,833 503,266 1,907,618 720,398 15,154,270 (713,364) 12,725,833 514,266 2,190,305 699,413 15,416,453
The accompanying notes to the financial statements are an integral part of this financial statement.Page 5

Family Service TorontoStatement of cash flowsyear ended March 31, 2017
2017 2016$ $
Operating activities(Deficiency) excess of revenue over expenses (283,168) 10,662,907 Items not affecting cash
Gain on sale of capital assets - (12,269,584) Amortization of deferred lease inducements (55,552) (50,923) Amortization of capital assets 417,874 421,299 Amortization of deferred capital contributions (301,001) (321,185) Share of loss of joint venture 137,736 152,747 Write-off of residual balances re: FSEAP (Note 10) - (67,042)
(84,111) (1,471,781)
Changes in operating working capital itemsGrants and accounts receivable (324,417) 1,090,708 Prepaid expenses (94,530) (140,637) Accounts payable and accrued charges
General fund (1,924,312) 907,806 Capital and learning fund - (54,081)
Deferred lease inducementsGeneral fund 57,444 143,881 Capital and learning fund - 583,300
Decrease in deferred contributionsGeneral fund (26,240) (125,371) Endowment fund 2,504 44,154
(2,393,662) 977,979
Financing activityDeferred capital contributions 92,909 223,500
Investing activitiesPurchase of capital assets (143,230) (993,770) Investment in joint venture 67,502 (2,673,700) Deposit on purchase of interest in property - 300,000 Deferred property development costs (Note 7) - (83,149) Proceeds from sale of capital assets - 13,430,301 Mortgage receivable - (12,430,301) Net purchase of investments (31,863) (43,542)
(107,591) (2,494,161)
Decrease in cash (2,408,344) (1,292,682) Cash, beginning of year 3,601,340 4,894,022 Cash, end of year 1,192,996 3,601,340
The accompanying notes to the financial statements are an integral part of this financial statement.Page 6

Family Service Toronto Notes to the financial statements March 31, 2017
Page 7
1. Purpose of the Organization
Family Service Toronto (“FST”) strengthens individuals, families and communities through counselling, education, social action, advocacy and community development and works with partners to build a vibrant community social services sector. FST helps people face a wide variety of life challenges. For over 100 years, FST has been assisting families and individuals through counselling, community development, advocacy and public education programs. Services are available to everyone who lives or works in Toronto. FST is incorporated under the Ontario Corporations Act as a not-for-profit organization and is a registered charity under the Income Tax Act.
2. Significant accounting policies
These financial statements have been prepared in accordance with Canadian accounting standards for not-for-profit organizations using the deferral method of reporting contributions.
Financial instruments
Financial assets and financial liabilities are initially recognized at fair value when FST becomes a party to the contractual provisions of the financial instrument. Subsequently, all financial instruments are measured at amortized cost, except for investments traded in an active market which are measured at fair value. Any subsequent changes in fair value are recorded in the Statement of operations.
Fair value is determined directly from published price quotations in an active market. Transaction costs are expensed when incurred.
Financial assets measured at amortized cost are assessed at each reporting date for indication of impairment. If such impairment exists, the asset is written down and the resulting impairment loss is recognized in the Statement of operations.
Fund accounting
Revenues and expenses related to program delivery and administrative activities are reported in the General Fund.
Assets, liabilities, revenues and expenses relating to FST’s current and future capital and special purpose requirements, as approved by the Board, are reflected in the Capital and Learning Fund.
Endowment contributions are reported in the Endowment Fund. All investment income earned on resources of the Endowment Fund have restrictions imposed by the contributors of the funds, and are reported as deferred contributions in the Endowment Fund.
The Capital and Learning Fund is to support initiatives with breakthrough thinking in responding creatively and effectively to emerging community needs and to provide sufficient funds for required capital additions and significant repairs to property. The Board of Directors may approve other uses on an exceptional basis.
Revenue recognition
FST follows the deferral method of accounting for contributions.
Restricted contributions and donations are recognized as revenue of the appropriate fund in the year in which the related expenses are incurred. Unrestricted contributions are recognized as revenue of the appropriate fund when received or receivable if the amount to be received can be reasonably estimated and collection is reasonably assured.
Endowment contributions are recognized as direct increases in the Endowment Fund Balance. Investment income earned on endowed funds is restricted.
Family Service Toronto Notes to the financial statements March 31, 2017
Page 8
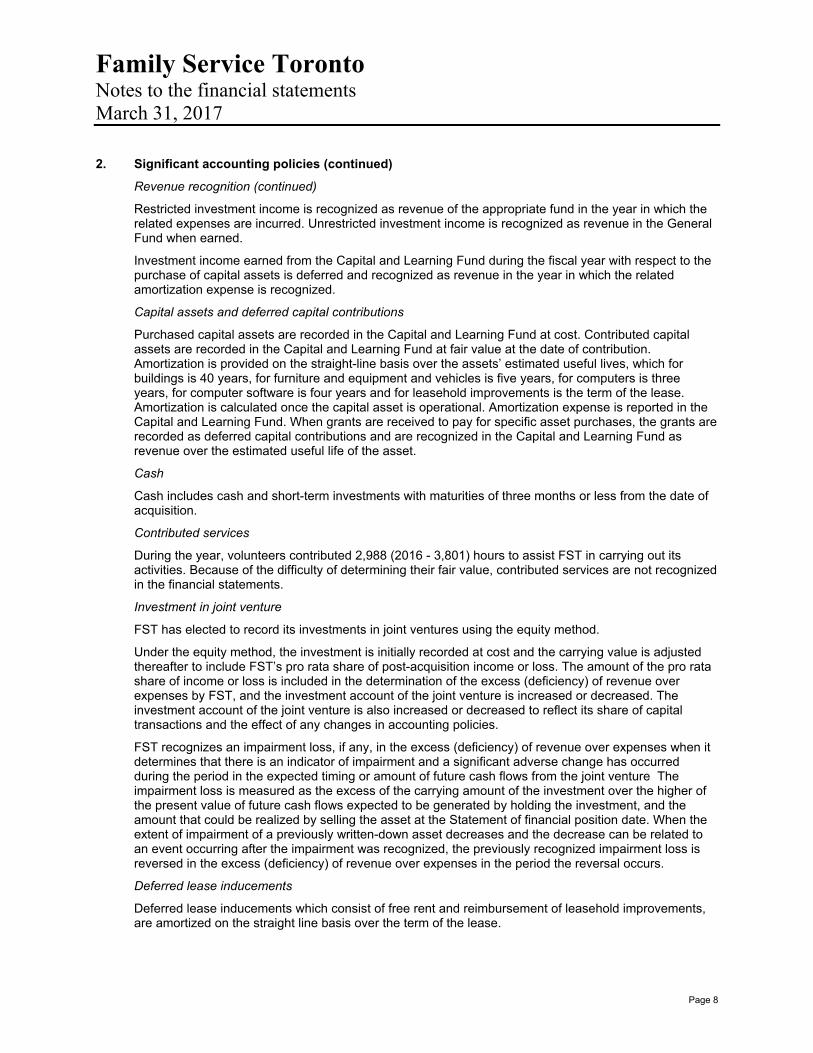
2. Significant accounting policies (continued)
Revenue recognition (continued)
Restricted investment income is recognized as revenue of the appropriate fund in the year in which the related expenses are incurred. Unrestricted investment income is recognized as revenue in the General Fund when earned.
Investment income earned from the Capital and Learning Fund during the fiscal year with respect to the purchase of capital assets is deferred and recognized as revenue in the year in which the related amortization expense is recognized.
Capital assets and deferred capital contributions
Purchased capital assets are recorded in the Capital and Learning Fund at cost. Contributed capital assets are recorded in the Capital and Learning Fund at fair value at the date of contribution. Amortization is provided on the straight-line basis over the assets’ estimated useful lives, which for buildings is 40 years, for furniture and equipment and vehicles is five years, for computers is three years, for computer software is four years and for leasehold improvements is the term of the lease. Amortization is calculated once the capital asset is operational. Amortization expense is reported in the Capital and Learning Fund. When grants are received to pay for specific asset purchases, the grants are recorded as deferred capital contributions and are recognized in the Capital and Learning Fund as revenue over the estimated useful life of the asset.
Cash
Cash includes cash and short-term investments with maturities of three months or less from the date of acquisition.
Contributed services
During the year, volunteers contributed 2,988 (2016 - 3,801) hours to assist FST in carrying out its activities. Because of the difficulty of determining their fair value, contributed services are not recognized in the financial statements.
Investment in joint venture
FST has elected to record its investments in joint ventures using the equity method.
Under the equity method, the investment is initially recorded at cost and the carrying value is adjusted thereafter to include FST’s pro rata share of post-acquisition income or loss. The amount of the pro rata share of income or loss is included in the determination of the excess (deficiency) of revenue over expenses by FST, and the investment account of the joint venture is increased or decreased. The investment account of the joint venture is also increased or decreased to reflect its share of capital transactions and the effect of any changes in accounting policies.
FST recognizes an impairment loss, if any, in the excess (deficiency) of revenue over expenses when it determines that there is an indicator of impairment and a significant adverse change has occurred during the period in the expected timing or amount of future cash flows from the joint venture The impairment loss is measured as the excess of the carrying amount of the investment over the higher of the present value of future cash flows expected to be generated by holding the investment, and the amount that could be realized by selling the asset at the Statement of financial position date. When the extent of impairment of a previously written-down asset decreases and the decrease can be related to an event occurring after the impairment was recognized, the previously recognized impairment loss is reversed in the excess (deficiency) of revenue over expenses in the period the reversal occurs.
Deferred lease inducements
Deferred lease inducements which consist of free rent and reimbursement of leasehold improvements, are amortized on the straight line basis over the term of the lease.

Family Service Toronto Notes to the financial statements March 31, 2017
Page 9
2. Significant accounting policies (continued)
Use of estimates
The preparation of financial statements in conformity with Canadian accounting standards for not-for-profit organizations requires management to make estimates and assumptions that affect the reported amounts of assets and liabilities and the disclosure of contingent assets and liabilities at the statement of financial position date and the reported amounts of revenues and expenses for the year then ended. Future actual results may differ from such estimates. Balances which require some degree of estimation and assumptions are investments, accrued liabilities, deferred contributions, deferred capital contributions and amortization of capital assets.
3. Investments and financial risk management
FST’s performance is subject to a number of risks which are managed using a number of tools and techniques. Details of these risks are provided below:
Interest rate risk
Interest rate risk refers to the consequences of interest rate changes on the value of FST’s investments. Interest changes directly impact the fair value of fixed income securities held by FST. Interest rate changes will also have an indirect impact on the remaining assets of FST. Due to the nature of the operations of FST and related cash flows, asset mix decisions include consideration of differences in the interest rate sensitivity to FST’s assets and liabilities.
Credit risk
Credit risk is the risk that one party to a financial instrument will fail to discharge an obligation and cause the other party to incur a financial loss. FST’s Statement of Investment Policy, which is reviewed annually, defines permitted investments and provides guidelines and restrictions on acceptable investments, which minimize credit risk.
The maximum credit exposure of FST is represented by the fair value of the investments as presented on the Statement of financial position.
Market risk
Market risk is the risk that the value of an investment will fluctuate as a result of changes in market conditions, whether those changes are specific to an individual investment or factors affecting all securities traded in the market.
To mitigate the impact of market risk, FST invests in a diversified portfolio of investments, based on Board approved policies.
The table below summarizes the market value and the cost of the investments:
2017 2016Cost Fair value Cost Fair value
$ $ $ $
Mutual fundsCash 6,040 6,040 34 34 Bond fund 754,203 747,597 727,924 738,575 Canadian equity fund 207,225 275,224 207,646 237,404
967,468 1,028,861 935,604 976,013
Total interest earned on endowment funds for the year was $30,099 (2016 - $43,741) which was recognized as a deferred contribution in the Endowment Fund (Note 11).
Total interest earned on the Capital and Learning Fund for the year was $Nil (2016 - $12,105).

Family Service Toronto Notes to the financial statements March 31, 2017
Page 10
4. Net investment in joint venture
During 2016, FST entered into a joint venture for a 15% interest in a property located at 128 Sterling Road, Toronto, Ontario.
The net investment in the joint venture consists of:
2017 2016$ $
Opening balance 2,520,953 - Purchase price - 2,587,500 Less:
Distributions from Joint Venture (67,502) - Share of loss of the co-ownership for the period (137,736) (152,747)
2,315,715 2,434,753 Add:
Land transfer tax - 86,200 2,315,715 2,520,953
The difference between the $2,315,715 above and Co-owners’ equity amount of $2,109,515 below represents lease inducements provided by the Vendor.
FST accounts for its interest in the Joint Venture using the equity method. Summarized financial information of the Joint Venture is set out below:
Financial position
2017 2016$ $
Total assets 3,772,818 4,042,330
Total liabilities 1,663,303 1,727,577 Co-owners’ equity 2,109,515 2,314,753
3,772,818 4,042,330
Results of operations
2017 2016$ $
Total revenue 234,943 143,697 Total expenses 372,679 296,444 Net loss for the year (137,736) (152,747)
Cash flows
2017 2016$ $
Cash provided by operating activities 89,842 89,933 Cash provided by financing activities (35,323) 1,650,000 Cash used in investing activities (87,884) (1,661,380) (Decrease) increase in cash (33,365) 78,553
Family Service Toronto Notes to the financial statements March 31, 2017
Page 11
4. Net investment in joint venture (continued)
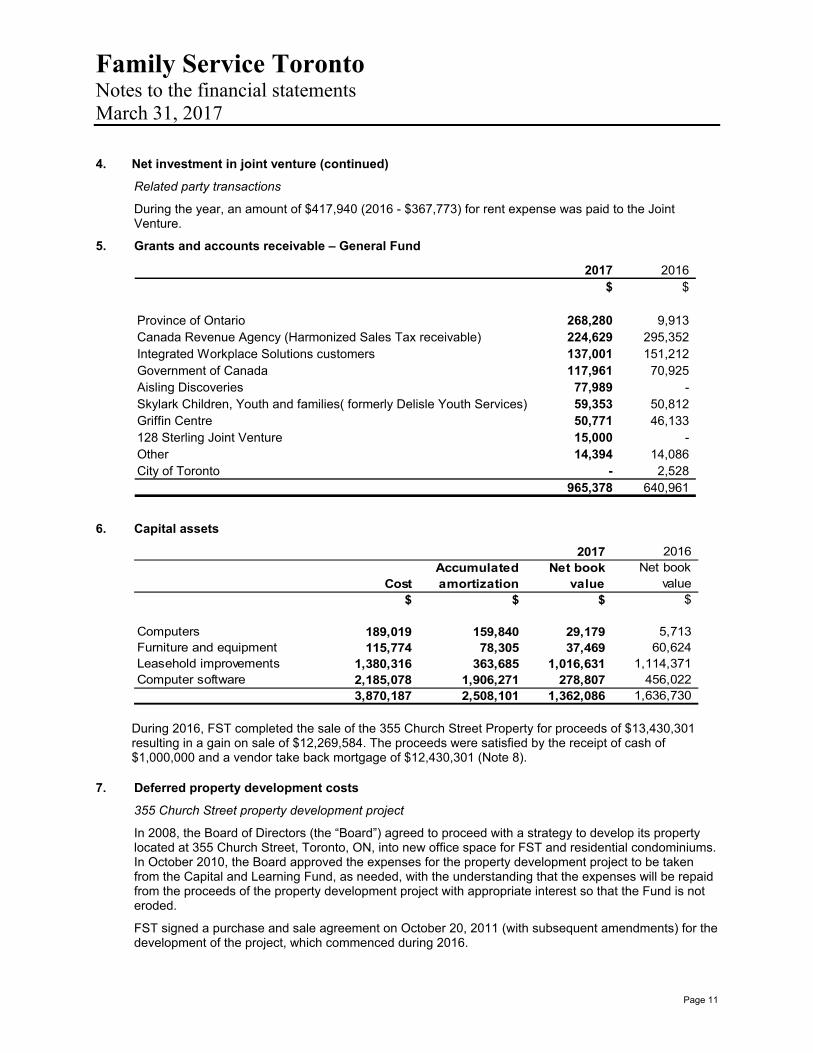
Related party transactions
During the year, an amount of $417,940 (2016 - $367,773) for rent expense was paid to the Joint Venture.
5. Grants and accounts receivable – General Fund
2017 2016$ $
Province of Ontario 268,280 9,913 Canada Revenue Agency (Harmonized Sales Tax receivable) 224,629 295,352 Integrated Workplace Solutions customers 137,001 151,212 Government of Canada 117,961 70,925 Aisling Discoveries 77,989 - Skylark Children, Youth and families( formerly Delisle Youth Services) 59,353 50,812 Griffin Centre 50,771 46,133 128 Sterling Joint Venture 15,000 - Other 14,394 14,086 City of Toronto - 2,528
965,378 640,961
6. Capital assets
2017 2016Accumulated Net book Net book
Cost amortization value value$ $ $ $
Computers 189,019 159,840 29,179 5,713 Furniture and equipment 115,774 78,305 37,469 60,624 Leasehold improvements 1,380,316 363,685 1,016,631 1,114,371 Computer software 2,185,078 1,906,271 278,807 456,022
3,870,187 2,508,101 1,362,086 1,636,730
During 2016, FST completed the sale of the 355 Church Street Property for proceeds of $13,430,301 resulting in a gain on sale of $12,269,584. The proceeds were satisfied by the receipt of cash of $1,000,000 and a vendor take back mortgage of $12,430,301 (Note 8).
7. Deferred property development costs
355 Church Street property development project
In 2008, the Board of Directors (the “Board”) agreed to proceed with a strategy to develop its property located at 355 Church Street, Toronto, ON, into new office space for FST and residential condominiums. In October 2010, the Board approved the expenses for the property development project to be taken from the Capital and Learning Fund, as needed, with the understanding that the expenses will be repaid from the proceeds of the property development project with appropriate interest so that the Fund is not eroded.
FST signed a purchase and sale agreement on October 20, 2011 (with subsequent amendments) for the development of the project, which commenced during 2016.

Family Service Toronto Notes to the financial statements March 31, 2017
Page 12
7. Deferred property development costs (continued)
Amounts capitalized to the project are as follows:
$
Up to 2011 144,067 2012 92,125 2013 26,385 2014 8,766 2015 41,040 2016 (16,851)
295,532
In addition to the above $295,532, $30,044 was expensed in 2011, and interest of $40,158 was charged, resulting in project cost to date of $365,734.
8. Mortgage receivable
During 2016, FST entered into a vendor take back mortgage in the amount of $12,430,301 which will be used in the purchase of the new condominium unit at 355 Church Street, Toronto, Ontario. The mortgage is carried at face value in the Statement of financial position and is interest free without a maturity date. It does not require monthly principal or interest payments and is unsecured.
9. Government remittances
The amounts outstanding with respect to government remittances as at March 31, 2017, were $23,310 (2016 - $197,074). These amounts are included in accounts payable and accrued charges.
10. FSEAP interfund loan
2017 2016$ $
Product development loanBeginning balance - 107,028 Inter-fund loan written off (107,028)
Ending balance - -
Deficit loansBeginning balance - 418,489 Inter-fund loan 2015Inter-fund loan written off (418,489)
Ending balance - - - -
The Board approved management’s recommendation to wind down FSEAP at its meeting on September 16, 2015, due to its continuing financial instability. Subsequently, FSEAP gave notice to its customers and transferred some of its business to other FSEAP partners. FSEAP officially closed its operations on December 31, 2015. The outstanding FSEAP loan of $525,517 and FSEAP 2015-16 operating loss of $1,174,145 have been written off through the Capital and Learning Fund. During the current fiscal year, the FSEAP loss of $38,951 has been written off through the Capital and Learning Fund.

Family Service Toronto Notes to the financial statements March 31, 2017
Page 13
11. Deferred contributions and deferred capital contributions
(a) Deferred contributions
General Fund
Deferred contributions reported in the General Fund relate to restricted operating funding received in the current and prior years that are to be used in a subsequent year. For example, grants received for work to be completed in the next fiscal year and unspent contributions which have externally imposed restrictions are included in this category.
The breakdown by source of revenue is as follows:
2017 2016$ $
Deferred interest and special purpose contributions 101,999 102,132 Special purpose contributions 56,767 56,767 Province of Ontario 48,905 40,050 Other agencies 45,407 48,751 Foundations - 27,734 Other - 3,884
253,078 279,318
Endowment Funds
Deferred contributions reported in the Endowment Fund represent unspent restricted investment income net of investment management fees earned on the various endowment funds.
2017 2016$ $
Beginning balance 265,459 221,305 Interest earned for the year (Note 3) 30,099 43,741 Realized gain on sale of investment 2,405 413 Interest recognized from prior years (30,000) - Ending balance 267,963 265,459
(b) Deferred capital contributions
Capital and Learning Fund
Deferred capital contributions reported in the Capital and Learning Fund consist of the restricted contributions with which some of FST’s leasehold improvements, computers, computer software and furniture and equipment were originally purchased.

Family Service Toronto Notes to the financial statements March 31, 2017
Page 14
11. Deferred contributions and deferred capital contributions (continued)
(b) Deferred capital contributions (continued)
The changes for the year in the deferred capital contributions balance reported in the Capital and Learning Fund are as follows:
2017 2016$ $
Beginning balance 590,087 754,814 Additions
Grants received 92,909 223,500 Write-off of residual balances re: FSEAP - (67,042) Amounts amortized to revenue (301,001) (321,185) Ending balance 381,995 590,087
12. Externally restricted fund balances
Major categories of externally imposed restrictions on fund balances are as follows:
2017 2016$ $
Hindmarsh endowment fund 500,100 500,100 Other endowment funds 158,904 158,904 Unrealized investment gain 61,394 40,409
720,398 699,413
The Hindmarsh Endowment Fund was provided in 1984 by the Atkinson Charitable Foundation to provide income for utilities, repairs and maintenance costs of the Family Life Centre located in Bolton, Ontario, a program which FST no longer operates. By agreement with the Foundation, there has been no impairment to the capital portion of the Endowment Fund, and the purpose of the interest of the Endowment Fund has been varied. The Endowment Fund interest, together with an operating grant from the Foundation, will be used towards Social Reform activities.
All of the endowment funds have restrictions on the use of the interest earned by the capital in the fund. The interest earned but not yet spent to March 31, 2017 is reported as deferred contributions in the Endowment Fund (Note 11).

Family Service Toronto Notes to the financial statements March 31, 2017
Page 15
13. Internally restricted and invested in capital assets fund balances
The Board of Directors has internally restricted $1,907,618 (2016 - $2,190,305) to be used for capital and learning requirements.
The Invested in capital assets fund consist of the following:
2017 2016$ $
Net book value of capital assets (Note 6) 1,362,086 1,636,730 Less:
Deferred capital contributions (Note 11) (381,995) (590,087) Deferred lease inducement (Note 16) (476,825) (532,377)
503,266 514,266
The balance of $503,266 represents unfunded leasehold improvements at the 128 Sterling Road property that will be recovered from future program funding.
14. Revenue - government
General Fund
2017 2016$ $
FederalPublic Health Agency of Canada - Growing Up
Healthy Downtown 110,546 110,546 Employment and Social Development Canada - 30,776 Immigration, Refugees and Citizenship Canada 270,311 264,347
ProvincialMinistry of Community and Social Services 34,801,655 32,054,503 Toronto Central Local Health Integration Network 662,771 647,174 Ministry of Health and Long-Term Care - AIDS Bureau 134,620 134,620 Ministry of Attorney General 493,794 512,896 Ministry of Citizenship, Immigration and International Trade 89,385 112,960
MunicipalCity of Toronto - Community Service Partnerships 104,225 101,995 City of Toronto - Investing in Neighbourhoods 19,923 (11,345)
36,687,230 33,958,472
15. Pension plan
The employer pension expense for the defined contributions plan amounted to $59,679 (2016 - $72,068).

Family Service Toronto Notes to the financial statements March 31, 2017
Page 16
16. Deferred lease inducements
General Fund
Total rent payable is calculated over the term of the lease and straight-lined, resulting in a long-term liability. The total long-term liability of $201,325 (2016 - $143,881) includes free rent.
Capital and Learning Fund
During the prior year, FST was reimbursed by the landlord for leasehold improvements made to the leased space. The changes in deferred lease inducements are as follows:
2017 2016$ $
Balance, beginning of the year 532,377 - Additions - 583,300 Amortization (55,552) (50,923) Balance, end of year 476,825 532,377
Current portion 55,552 55,552 Long-term portion 421,273 476,825
476,825 532,377

Family Service Toronto Notes to the financial statements March 31, 2017
Page 17
17. Contracts with Ministry of Community and Social Services that are in surplus or deficit positions
FST has a Service Contract/CFST Approval with the Ministry of Community and Social Services. A reconciliation report summarizes by service (detail code), all revenues and expenses and identifies any resulting surplus or deficit that relates to the Service Contract/CFSA Approval.
A review of these reports shows the following services to be in a surplus/(deficit) position as at March 31, 2017. A summary of the contract is as follows:
DS Coord Adult IQAL-CPS Group SpecialCost centre Proc Children PSW POS POS S.I.L. Respite Living Service
MCSS detail code 9133 9252 8888 9131 9131 9112 9130 8847 9132
MCSS TPBE # 928799 928799 928799 928799 10000840 928799 928799 928799 928799 Sub-total
$ $ $ $ $ $ $ $ $ $
MCSS contract 534,890 286,307 181,488 1,486,575 174,167 358,677 53,793 427,828 973,212 4,476,937
Miscellaneous revenue - - - - - - - - 4,124 4,124
Revenue 534,890 286,307 181,488 1,486,575 174,167 358,677 53,793 427,828 977,336 4,481,061
Expenses
Salaries 289,803 210,702 132,744 - 6,289 76,452 - - 566,915 1,282,905
Employee benefits 51,597 40,047 23,402 - 1,673 14,573 - - 103,149 234,441
Travel and
communication 4,781 3,730 2,376 - - - - - 49,957 60,844
Services 94,128 3,119 75 - - 2,431 - - 106,216 205,969
Supplies and
equipment 101,045 78 110 - - - - - 10,134 111,367
Client purchase of
service - - - 1,328,542 145,026 252,903 43,364 425,516 24,596 2,219,947
Capital purchase - - - - - - - - - -
MCSS admin allocation 51,756 28,631 17,490 - 17,417 12,318 - - 93,626 221,238
593,110 286,307 176,197 1,328,542 170,405 358,677 43,364 425,516 954,593 4,336,711
(Deficit) surplus (58,220) - 5,291 158,033 3,762 - 10,429 2,312 22,743 144,350

Family Service Toronto Notes to the financial statements March 31, 2017
Page 18
17. Contracts with Ministry of Community and Social Services that are in surplus or deficit positions (continued)
2017 2016Passport Person VAW VAW VAW DS
Coord Passport Directed Counselling Service Sys Client ComCost centre Process POS Planning Service Coord Survey Part-PDPMCSS detail code 9134 9134 9131 8773 8787 8786 9131MCSS TPBE # 39330 10000840 39330 112876 112876 112876 112876 Sub-total Total Total
$ $ $ $ $ $ $ $ $ $
MCSS contract 1,688,849 28,110,925 141,000 701,065 8,691 2,100 56,016 30,708,646 35,185,583 33,843,720 Miscellaneous revenue 3,209 - - 33,554 - - - 36,763 40,887 82,137 Revenue 1,692,058 28,110,925 141,000 734,619 8,691 2,100 56,016 30,745,409 35,226,470 33,925,857
ExpensesSalaries 759,984 - 12,564 500,569 - - 45,199 1,318,316 2,601,221 2,744,833 Employee benefits 150,515 - 2,196 87,505 - - 5,653 245,869 480,310 494,248 Travel and
communication 37,515 - - 10,859 - - 1,870 50,244 111,088 133,707 Services 415,675 - 82,149 53,026 8,691 2,100 165 561,806 767,775 739,248 Supplies and
equipment 40,040 - - 3,283 - - 219 43,542 154,909 71,473 Client purchase of
service - 28,109,657 - - - - - 28,109,657 30,329,604 27,535,496 Capital purchase 18,485 - - 10,300 - - - 28,785 28,785 159,618 MCSS admin allocation 162,970 - 11,600 69,077 - - - 243,647 464,885 490,056
1,585,184 28,109,657 108,509 734,619 8,691 2,100 53,106 30,601,866 34,938,577 32,368,679 Surplus 106,874 1,268 32,491 - - - 2,910 143,543 287,893 1,557,178
Family Service Toronto Notes to the financial statements March 31, 2017
Page 19
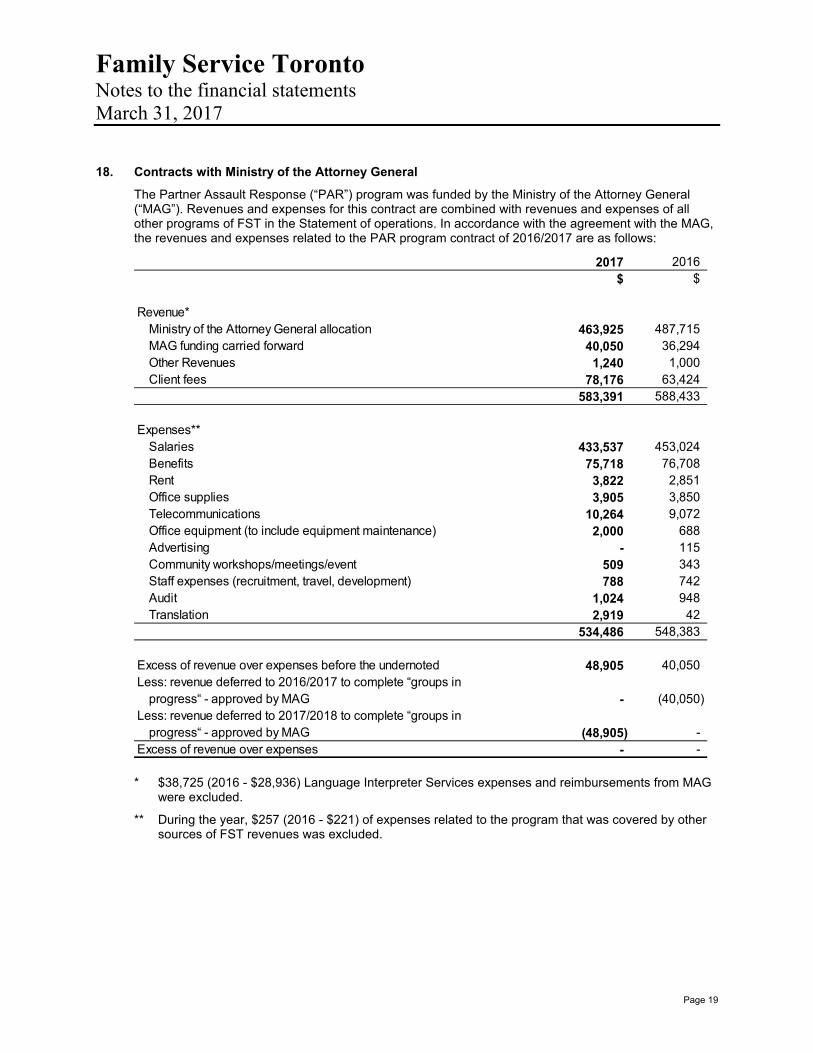
18. Contracts with Ministry of the Attorney General
The Partner Assault Response (“PAR”) program was funded by the Ministry of the Attorney General (“MAG”). Revenues and expenses for this contract are combined with revenues and expenses of all other programs of FST in the Statement of operations. In accordance with the agreement with the MAG, the revenues and expenses related to the PAR program contract of 2016/2017 are as follows:
2017 2016$ $
Revenue*Ministry of the Attorney General allocation 463,925 487,715 MAG funding carried forward 40,050 36,294 Other Revenues 1,240 1,000 Client fees 78,176 63,424
583,391 588,433
Expenses**Salaries 433,537 453,024 Benefits 75,718 76,708 Rent 3,822 2,851 Office supplies 3,905 3,850 Telecommunications 10,264 9,072 Office equipment (to include equipment maintenance) 2,000 688 Advertising - 115 Community workshops/meetings/event 509 343 Staff expenses (recruitment, travel, development) 788 742 Audit 1,024 948 Translation 2,919 42
534,486 548,383
Excess of revenue over expenses before the undernoted 48,905 40,050 Less: revenue deferred to 2016/2017 to complete “groups in
progress“ - approved by MAG - (40,050) Less: revenue deferred to 2017/2018 to complete “groups in
progress“ - approved by MAG (48,905) - Excess of revenue over expenses - -
* $38,725 (2016 - $28,936) Language Interpreter Services expenses and reimbursements from MAG
were excluded.
** During the year, $257 (2016 - $221) of expenses related to the program that was covered by other sources of FST revenues was excluded.

Family Service Toronto Notes to the financial statements March 31, 2017
Page 20
19. Contract with Public Health Agency of Canada
The Growing Up Healthy Downtown (“GUHD”) project is funded by Public Health Agency of Canada (“PHAC”). Revenues and expenses for this contract are combined with revenues and expenses of all other programs of FST in the Statement of operations. In accordance with the agreement with the PHAC, the revenues and expenses related to the GUHD contract of 2016/2017 are as follows:
2017 2016$ $
Revenue 520,200 520,200
ExpensesThe 519 Church Street Community Centre 58,522 58,522 Davenport-Perth Neighborhood Community Health Centre 58,522 58,522 Dixon Hall 58,522 58,522 Family Service Toronto 110,546 110,546 Waterfront Community Centre 58,522 58,522 West Neighbourhood House 58,522 58,522 University Settlement 58,522 58,522 Woodgreen Community Services 58,522 58,522
520,200 520,200 Excess of revenue over expenses - -
20. Contract with Ministry of Health and Long-Term Care - AIDS Bureau
The HIV/AIDS Community Counseling program of David Kelley Services was funded by the Ministry of Health and Long-Term Care-AIDS Bureau. Revenues and expenses for this contract are combined with revenues and expenses of all other programs of FST in the Statement of operations. In accordance with the agreement with the Ministry, the revenues and expenses related to the program contract of 2016/2017 are as follows:
2017 2016$ $
RevenueMOHLTC - AIDS Bureau Funding Program 134,620 134,620 Other income 455 966
135,075 135,586
ExpensesSalaries 111,797 111,807 Benefits 19,538 19,278 Supplies and other expenses 1,146 1,999 Protected allocations 2,594 2,502
135,075 135,586 Excess of revenue over expenses - -
21. Additional disclosures
FST is covered under the Broader Public Sector Accountability Act and Public Sector Salary Disclosure Act. Salaries of affected personnel are reported to the Ontario Government.

Family Service Toronto Notes to the financial statements March 31, 2017
Page 21
22. Commitments
Leases
FST has operating lease commitments for premises and equipment up to 2026. The minimum annual payments are as follows:
$
2018 923,060 2019 672,768 2020 547,095 2021 429,269 2022 437,933 Thereafter 1,623,528
4,633,653
23. Contingencies and guarantees
In the normal course of business, FST enters into agreements that meet the definition of a guarantee. FST’s primary guarantees are as follows:
(a) Indemnity has been provided to all directors and officers of FST for various items including, but not limited to, all costs to settle suits or actions due to their involvement with FST, subject to certain restriction. FST has purchased directors’ and officers’ liability insurance to mitigate the cost of any potential future suits or actions. The term of the indemnification is not explicitly defined, but is limited to the period over which the indemnified party served as a director or officer of FST. The maximum amount of any potential future payment cannot be reasonably estimated.
(b) In the normal course of business, FST has entered into agreements that include indemnities in favour of third parties, such as purchase and sale agreements, confidentiality agreements, engagement letters with advisors and consultants, outsourcing agreements, leasing contracts, information technology agreements and service agreements. These indemnification agreements may require FST to compensate counterparties for losses incurred by the counterparties as a result of breaches in representation and regulations or as a result of litigation claims or statutory sanctions that may be suffered by the counterparty as a consequence of the transaction
The terms of these indemnities are not explicitly defined and the maximum amount of any potential reimbursement cannot be reasonably estimated.
The nature of these indemnification agreements prevents FST from making a reasonable estimate of the maximum exposure due to the difficulties in assessing the amount of liability which stems from the unpredictability of future events and the unlimited coverage offered to counterparties. Historically, FST has not made any significant payments under such or similar indemnification agreements and therefore no amount has been accrued in the balance sheet with respect to these agreements.
FST has a grievance that is in abeyance as of March 31, 2017. Since the amount and the outcome of this grievance is not determinable at this time, no provision has been made in the financial statements. Any settlement will be recognized in the period when the amount is known.
24. Line of credit
FST has an available line of credit of $200,000 with a Canadian chartered financial institution of which $Nil has been drawn as at March 31, 2017 and 2016. Interest is payable at the bank’s prime rate plus 1.5% (2016 - the bank’s prime rate plus 1.5%).


![Toronto Hydro Corporation · Toronto Hydro Corporation NOTES TO INTERIM CONSOLIDATED FINANCIAL STATEMENTS [all tabular amounts in thousands of dollars, unaudited] September 30, …](https://static.fdocuments.net/doc/165x107/5ae50e617f8b9a5b348f97dd/toronto-hydro-corporation-hydro-corporation-notes-to-interim-consolidated-financial.jpg)