Financial Statements - alliancebank.com.my Directors are also responsible to ensure their consistent...
108
Financial Statements 80 Statement of Board of Directors’ Responsibilities 81 Directors’ Report 87 Statement by Directors 87 Statutory Declaration 88 Independent Auditors’ Report 90 Statements of Financial Position 91 Statements of Comprehensive Income 92 Consolidated Statements of Changes in Equity 93 Statements of Changes in Equity 94 Consolidated Statements of Cash Flow 96 Statements of Cash Flow 97 Notes to the Financial Statements
Transcript of Financial Statements - alliancebank.com.my Directors are also responsible to ensure their consistent...

Financial Statements80 Statement of Board of Directors’ Responsibilities 81 Directors’ Report87 Statement by Directors87 Statutory Declaration88 Independent Auditors’ Report90 Statements of Financial Position91 Statements of Comprehensive Income92 Consolidated Statements of Changes in Equity93 Statements of Changes in Equity94 Consolidated Statements of Cash Flow96 Statements of Cash Flow97 Notes to the Financial Statements

80 ALLIANCE FINANCIAL GROUP BERHAD (6627-X)
The Companies Act, 1965 requires Directors to prepare financial statements for each financial year, which give a true and fair view of the state of affairs of the Group and the Company for the financial year.
In preparing the financial statements, the Directors are responsible for the adoption of suitable accounting policies that comply with the provisions of the Companies Act, 1965, the MASB Approved Accounting Standards in Malaysia for Entities Other than Private Entities and the Bank Negara Malaysia Guidelines. The Directors are also responsible to ensure their consistent use in the financial statements, supported where necessary by reasonable and prudent judgements.
The Directors hereby confirm that suitable accounting policies have been consistently applied in the preparation of the financial statements. The Directors also confirm that the Company maintains adequate accounting records and an effective system of internal control to safeguard the assets of the Group and the Company and prevent and detect fraud or any other irregularities.
Statement of Board of Directors’ Responsibilities for preparing the Annual Audited Financial Statements

812012 ANNUAL REPORT
Directors’ Report
The Directors present their report together with the audited financial statements of the Group and of the Company for the financial year ended 31 March 2012.
PRINCIPAL ACTIVITIESThe principal activities of the Company are investment holding and provision of management services to the subsidiaries.
The principal activities of the subsidiaries are commercial banking and financing, Islamic banking, investment banking including provision of stockbroking services, unit trusts and fund management, and the provision of related financial services.
There have been no significant changes in the nature of the principal activities during the financial year.
RESULTS Group Company RM’000 RM’000
Profit before taxation and zakat 643,603 260,884 Taxation and zakat (163,764) (61,095)
Net profit after taxation and zakat 479,839 199,789
Attributable to: Owners of the parent 479,355 199,789 Non-controlling interests 484 –
Net profit after taxation and zakat 479,839 199,789
RESERVES AND PROVISIONSThere were no material transfers to or from reserves or provisions during the financial year other than as disclosed in the financial statements.
DIVIDENDSThe amount of dividends declared and paid by the Company since 31 March 2011 were as follows: RM’000
(i) First interim dividend of 5.6 sen per share, tax exempt under the single tier tax system, on 1,548,105,929 ordinary shares of RM1.00 each, in respect of financial year ended 31 March 2012, was paid on
26 August 2011 85,705
(ii) Second interim dividend of 7.7 sen per share, tax exempt under the single tier tax system, on 1,548,105,929 ordinary shares of RM1.00 each, in respect of financial year ended 31 March 2012, was paid on
28 February 2012 117,495
203,200
Dividends paid on the shares held in Trust pursuant to the Company’s ESS which are classified as shares held for ESS are not accounted for in the total equity. An amount of RM988,000 and RM1,709,000 being dividends paid for those shares were added back to the appropriation of retained profits in respect of the first and second interim dividends respectively.
With the above-mentioned two (2) interim dividends paid, the Directors do not recommend the payment of any final dividend in respect of the current financial year.

82 ALLIANCE FINANCIAL GROUP BERHAD (6627-X)
Directors’ Report
EMPLOYEES’ SHARE SCHEMEThe Alliance Financial Group Berhad Employees’ Share Scheme (“ESS”) is governed by the Bye-Laws approved by the shareholders at an Extraordinary General Meeting held on 28 August 2007. The ESS which comprises the Share Option Plan, the Share Grant Plan and the Share Save Plan took effect on 3 December 2007 and is in force for a period of 10 years.
On 22 July 2011, the Company offered/awarded the following share options and share grants to Directors and employees of the Company and its subsidiaries who have met the criteria of eligibility for the participation in the ESS:
(i) 9,764,000 share options under the Share Option Plan at an option price of RM3.58 per share which will be vested subject to the achievement of performance conditions.
(ii) 2,127,600 share grants under the Share Grant Plan. The first 50% of the share grants are to be vested at the end of the second year and the remaining 50% of the share grants are to be vested at the end of the third year from the date on which an award is made.
There were no share options offered under the Share Save Plan during the financial year.
The salient features of the ESS are disclosed in Note 30 to the financial statements.
Save for the Group Chief Executive Officer of Alliance Bank Malaysia Berhad, none of the other Directors of the Company were offered/awarded any share options/share grants during the financial year.
Details of share options/share grants offered/awarded to Directors are disclosed in the section on Directors’ Interest in this report.
SHARES HELD FOR EMPLOYEES’ SHARE SCHEMEDuring the financial year ended 31 March 2012, the Trustee of the ESS had purchased 8,266,200 ordinary shares of RM1.00 each from the open market at an average price of RM3.46 per share. The total consideration for the purchase including transaction costs was RM28,637,996. The shares purchased are being held in trust by the Trustee of the ESS in accordance with the Trust Deed dated 3 December 2007.
During the financial year ended 31 March 2012, 1,428,150 shares have been vested and transferred from the Trustee to the eligible employees of the Company and its subsidiaries in accordance with the terms under the Share Grant Plan of the ESS. As at 31 March 2012, the Trustee of the ESS held 24,466,800 ordinary shares representing 1.58% of the issued and paid-up capital of the Company. Such shares are held at a carrying amount of RM68,194,175 and further relevant details are disclosed in Note 29 to the financial statements.
BUSINESS REVIEW FOR FINANCIAL YEAR ENDED (“FYE”) 31 MARCH 2012For the twelve months ended 31 March 2012, the Group’s profit before tax grew 16.4%, from RM553.1 million in the previous financial year to RM643.6 million. After setting aside taxation, the Group’s net profit rose by 17.3% to RM479.8 million.
Arising from this improvement in profits, the Group’s return on equity rose to 13.6% (FY2011: 13.0%) and earnings per share to 31.5 sen (FY2011: 26.7 sen). The Group paid a higher total net dividend of 13.3 sen in FY2012, compared with 7.0 sen in the previous year.
Net interest income, including income from Islamic banking operations, however, grew by 3.0% to RM930.2 million, despite the 11.3% growth in loans and financing. This was due to the further contraction in the net interest margin to 2.51% (FY2011: 2.69%) arising from the full year impact of the rise in the Overnight Policy Rate (“OPR”) in 2010 and May 2011, as well as several increases in Statutory Reserve Requirement (“SRR”) during the year.
The non-interest income ratio improved further to 26.8% (FY2011: 20.8%) driven by trading in investment securities, treasury sales, transaction banking and wealth management. The cost to income ratio dropped to 47.3% (FY2011: 48.3%) due to more effective cost management, as the Group continued to focus on streamlining of business operations to improve productivity and efficiency.
As deposits had expanded at a relatively faster rate of 13.4% to RM32.1 billion, compared to the loans growth at 11.3%, the Group’s loans to deposits ratio remained healthy at 77.8% (FY2011: 78.8%).
Reflecting the disciplined approach in credit risk management and collection processes, the Group’s gross impaired loans ratio improved further to 2.4% (FY2011: 3.3%), and the overall asset quality remains better than the industry average. The gross impaired loan loss coverage ratio, has risen to 108.5% (FY2011: 90.1%), as the Group has set aside collective provisions under Bank Negara Malaysia’s transitional provision for FRS 139 adoption. The Group also remains well capitalized with a risk-weighted capital ratio (“RWCR”) standing at 15.2%, well above the minimum requirement of 8%.
During the year, the Group had continued with its investments to upgrade technology and infrastructure, as well as its human capital, to support the on-going business expansion, and further enhance the Group’s competitiveness in the financial services industry.

832012 ANNUAL REPORT
Directors’ Report
ECONOMIC OUTLOOK AND PROSPECTS FOR FYE 31 MARCH 2013Bank Negara Malaysia (“BNM”) has projected a 4% to 5% growth in the real gross domestic product (“GDP”) in 2012 amidst a more challenging external environment. This is based on expectations of the timely and full implementation of the Economic Transformation Program and other measures announced in the 2012 Budget. Further, BNM is also expected to maintain an accommodative monetary policy to facilitate economic growth, while responding to global developments and managing the risks of inflation.
BUSINESS OUTLOOK FOR FYE 31 MARCH 2013Against this background of moderate GDP growth, the Group expects demand for financing and non-interest income business activities to be sustained. The Group will continue to focus on existing business opportunities in Consumer Banking and Business Banking, while enhancing Treasury and Transaction Banking and developing the Wealth Management and Investment Banking business. The Group’s priority will be on growing revenue, managing asset quality, enhancing its human capital, improving productivity, and building the balance sheet for sustainable growth.
The Group expects to deliver a satisfactory performance for the next financial year ending March 2013.
RATING BY EXTERNAL RATING AGENCYThe banking subsidiary, Alliance Bank Malaysia Berhad (“ABMB”) is rated by Rating Agency Malaysia Berhad (“RAM”). Based on RAM’s rating in November 2011, ABMB’s short-term and long-term ratings are reaffirmed at P1 and A1 respectively. RAM has classified these rating categories as follows:
P1 - Financial institutions in this category have superior capacities for timely payments of obligations.
A1 - Financial institutions rated in this category are adjudged to offer adequate safety for timely payments of financial obligations. This level of rating indicates financial institutions with adequate credit profiles, but which possess one or more problem areas, giving rise to the possibility of future riskiness. Financial institutions rated in this category have generally performed at industry average and are considered to be more vulnerable to changes in economic conditions than those rated in the higher categories.
DIRECTORSThe names of the Directors of the Company in office since the date of the last report and at the date of this report are:
Datuk Oh Chong Peng Dato’ Thomas Mun Lung Lee Tan Yuen Fah Stephen Geh Sim Whye Megat Dziauddin Bin Megat Mahmud Kung Beng Hong Ou Shian Waei Sng Seow Wah Lee Ah Boon (appointed on 18 April 2012) Phoon Siew Heng (resigned on 18 April 2012)
DIRECTORS’ BENEFITSNeither at the end of the financial year, nor at any time during that year, did there subsist any arrangement to which the Company was a party, whereby the Directors might acquire benefits by means of the acquisition of shares in, or debentures of, the Company or any other body corporate, other than those arising from the share options and share grants under the ESS.
Since the end of the previous financial year, no Director has received or become entitled to receive a benefit (other than benefits included in the aggregate amount of emoluments received or due and receivable by the Directors or the fixed salary of a full-time employee of the Company or related corporations as shown in Note 35(b) and Note 48(c) to the financial statements of the Company or financial statements of related corporations) by reason of a contract made by the Company or a related corporation with any Director or with a firm of which the Director is a member, or with a company in which the Director has a substantial financial interest.

84 ALLIANCE FINANCIAL GROUP BERHAD (6627-X)
DIRECTORS’ INTERESTSAccording to the Register of Directors’ Shareholdings, the interests of Directors in office at the end of the financial year in shares, share options and share grants in the Company were as follows:
Number of Ordinary Shares of RM1.00 Each 1.4.2011 Acquired Sold 31.3.2012
The Company
Megat Dziauddin Bin Megat Mahmud - Direct 3,000 – – 3,000
Sng Seow Wah - Direct – 105,800 – 105,800
Dato’ Thomas Mun Lung Lee - Indirect (held through spouse, Datin Teh Yew Kheng) 35,000 – – 35,000
Number of Options Over Ordinary Shares of RM1.00 Each Exercise price 1.4.2011 Offered Vested Exercised Lapsed 31.3.2012 RM
Sng Seow Wah 3.15 835,300 – – – – 835,300 #
Sng Seow Wah 3.58 – 1,279,900 # – – – 1,279,900
# Subject to the achievement of performance conditions.
Number of Grants Over Ordinary Shares of RM1.00 Each Date of grant 1.4.2011 Awarded Vested 31.3.2012
Sng Seow Wah 23 September 2010 133,700 – – 133,700 *
Sng Seow Wah 28 July 2011 – 174,400 * – 174,400
* The first 50% of the share grants are to be vested at the end of the second year and the remaining 50% of the share grants are to be vested at the end of the third year from the date on which an award is made. Further details are as disclosed in Note 30 to the financial statements.
By virtue of their shareholdings in the Company, the above Directors are deemed to have beneficial interests in the shares of the subsidiary companies of the Company. None of the other Directors in office at the end of the financial year had any interest in shares, share options and share grants in the Company or its related corporations during the financial year.
SHARE CAPITALThere was no change in the issued and paid-up capital of the Company during the financial year.
BAD AND DOUBTFUL DEBTSBefore the financial statements of the Group and of the Company were made out, the Directors took reasonable steps to ascertain that proper action had been taken in relation to the writing off of bad debts and the making of allowance for doubtful debts and satisfied themselves that all known bad debts had been written off and that adequate allowance had been made for doubtful debts.
At the date of this report, the Directors are not aware of any circumstances which would render the amount written off for bad debts or the amount of the allowance for doubtful debts in the financial statements of the Group and of the Company inadequate to any substantial extent.
Directors’ Report

852012 ANNUAL REPORT
Directors’ Report
CURRENT ASSETSBefore the financial statements of the Group and of the Company were made out, the Directors took reasonable steps to ensure that any current assets which were unlikely to realise their value as shown in the accounting records in the ordinary course of business had been written down to an amount which they might be expected so to realise.
At the date of this report, the Directors are not aware of any circumstances which would render the values attributed to the current assets in the financial statements of the Group and of the Company misleading.
VALUATION METHODAt the date of this report, the Directors are not aware of any circumstances which have arisen which would render adherence to the existing method of valuation of assets or liabilities of the Group and of the Company misleading or inappropriate.
CONTINGENT AND OTHER LIABILITIESAt the date of this report, there does not exist:
(i) any charge on the assets of the Group and of the Company which has arisen since the end of the financial year which secures the liabilities of any other person; or
(ii) any contingent liability in respect of the Group and of the Company which has arisen since the end of the financial year other than in the ordinary course of business.
No contingent or other liability of the Group and of the Company has become enforceable or is likely to become enforceable within the period of twelve months after the end of the financial year which, in the opinion of the Directors, will or may affect the ability of the Group or of the Company to meet their obligations as and when they fall due.
CHANGE OF CIRCUMSTANCESAt the date of this report, the Directors are not aware of any circumstances, not otherwise dealt with in this report or financial statements of the Group and of the Company, which would render any amount stated in the financial statements misleading.
ITEMS OF AN UNUSUAL NATUREIn the opinion of the Directors:
(i) the results of the operations of the Group and of the Company during the financial year were not substantially affected by any item, transaction or event of a material and unusual nature; and
(ii) there has not arisen in the interval between the end of the financial year and the date of this report any item, transaction or event of a material and unusual nature which is likely to affect substantially the results of the operations of the Group and of the Company for the financial year in which this report is made.
SIGNIFICANT EVENTS DURING THE FINANCIAL YEARThe significant events during the financial year are disclosed in Note 51 to the financial statements.

86 ALLIANCE FINANCIAL GROUP BERHAD (6627-X)
SUBSEQUENT EVENTSThere were no material events subsequent to the end of the financial reporting period that require disclosure or adjustment to the financial statements.
COMPLIANCE WITH BANK NEGARA MALAYSIA’S EXPECTATIONS ON FINANCIAL REPORTINGIn the preparation of the financial statements, the Directors have taken reasonable steps to ensure that Bank Negara Malaysia’s expectations on financial reporting have been complied with, including those as set out in Guidelines on Financial Reporting for Financial Institutions and the Guidelines on Classification and Impairment Provisions for Loans/Financing.
AUDITORSThe auditors, PricewaterhouseCoopers, have expressed their willingness to continue in office.
Signed on behalf of the Board in accordance with a resolution of the Directors dated 30 May 2012.
Datuk Oh Chong Peng Dato’ Thomas Mun Lung Lee
Kuala Lumpur, Malaysia
Directors’ Report

872012 ANNUAL REPORT
Statement by DirectorsPursuant to Section 169(15) of the Companies Act, 1965
Statutory DeclarationPursuant to Section 169(16) of the Companies Act, 1965
We, Datuk Oh Chong Peng and Dato’ Thomas Mun Lung Lee, being two of the Directors of Alliance Financial Group Berhad, do hereby state that, in the opinion of the Directors, the accompanying financial statements set out on pages 90 to 186 are drawn up in accordance with the provisions of the Companies Act, 1965 and the MASB Approved Accounting Standards in Malaysia for Entities Other than Private Entities and Bank Negara Malaysia Guidelines, so as to give a true and fair view of the state of affairs of the Group and of the Company as at 31 March 2012 and of the results and the cash flows of the Group and of the Company for the financial year then ended.
The information set out in Note 54 to the financial statements have been complied in accordance with the Guidance of Special Matter No. 1, Determination of Realised and Unrealised Profits or Losses in the Context of Disclosures Pursuant to Bursa Malaysia Securities Berhad Listing Requirements, issued by the Malaysian Institute of Accountants.
Signed on behalf of the Board in accordance with a resolution of the Directors dated 30 May 2012.
Datuk Oh Chong Peng Dato’ Thomas Mun Lung Lee
Kuala Lumpur, Malaysia
I, Lee Eng Leong, being the officer primarily responsible for the financial management of Alliance Financial Group Berhad, do solemnly and sincerely declare that the accompanying financial statements set out on pages 90 to 186 are in my opinion correct, and I make this solemn declaration conscientiously believing the same to be true and by virtue of the provisions of the Statutory Declarations Act, 1960.
Subscribed and solemnly declared by the abovenamed Lee Eng Leong at Kuala Lumpur in the Federal Territory on 30 May 2012. Lee Eng Leong
Before me,
Sivanason a/l Marimuthu Commissioner for Oaths
Kuala Lumpur, Malaysia 30 May 2012

88 ALLIANCE FINANCIAL GROUP BERHAD (6627-X)
Independent Auditors’ Reportto the Members of Alliance Financial Group Berhad(Incorporated in Malaysia)
REPORT ON THE FINANCIAL STATEMENTSWe have audited the financial statements of Alliance Financial Group Berhad on pages 90 to 185 which comprise the statements of financial position as at 31 March 2012 of the Group and of the Company, and the statements of comprehensive income, changes in equity and cash flows of the Group and of the Company for the year then ended, and a summary of significant accounting policies and other explanatory notes, as set out on Note 1 to Note 53.
Directors’ responsibility for the financial statements
The Directors of the Company are responsible for the preparation of financial statements that give a true and fair view in accordance with the MASB Approved Accounting Standards in Malaysia for Entities Other than Private Entities, the Companies Act, 1965 and Bank Negara Malaysia Guidelines, and for such internal control as the Directors determine are necessary to enable the preparation of financial statements that are free from material misstatement, whether due to fraud or error.
Auditors’ responsibility
Our responsibility is to express an opinion on these financial statements based on our audit. We conducted our audit in accordance with approved standards on auditing in Malaysia. Those standards require that we comply with ethical requirements and plan and perform the audit to obtain reasonable assurance whether the financial statements are free from material misstatement.
An audit involves performing procedures to obtain audit evidence about the amounts and disclosures in the financial statements. The procedures selected depend on our judgment, including the assessment of risks of material misstatement of the financial statements, whether due to fraud or error. In making those risk assessments, we consider internal control relevant to the entity’s preparation of financial statements that give a true and fair view in order to design audit procedures that are appropriate in the circumstances, but not for the purpose of expressing an opinion on the effectiveness of the entity’s internal control. An audit also includes evaluating the appropriateness of accounting policies used and the reasonableness of accounting estimates made by the Directors, as well as evaluating the overall presentation of the financial statements.
We believe that the audit evidence we have obtained is sufficient and appropriate to provide a basis for our audit opinion.
Opinion
In our opinion, the financial statements have been properly drawn up in accordance with the MASB Approved Accounting Standards in Malaysia for Entities Other than Private Entities, the Companies Act, 1965 and Bank Negara Malaysia Guidelines so as to give a true and fair view of the financial position of the Group and of the Company as at 31 March 2012 and of their financial performance and cash flows for the year then ended.
REPORT ON OTHER LEGAL AND REGULATORY REQUIREMENTSIn accordance with the requirements of the Companies Act, 1965 in Malaysia, we also report the following:
(a) In our opinion, the accounting and other records and the registers required by the Act to be kept by the Company and its subsidiaries have been properly kept in accordance with the provisions of the Act.
(b) We are satisfied that the financial statements of the subsidiaries that have been consolidated with the Company’s financial statements are in form and content appropriate and proper for the purposes of the preparation of the financial statements of the Group and we have received satisfactory information and explanations required by us for those purposes.
(c) The audit reports on the financial statements of the subsidiaries did not contain any qualification and any adverse comment made under Section 174(3) of the Act.
892012 ANNUAL REPORT
Independent Auditors’ Reportto the Members of Alliance Financial Group Berhad(Incorporated in Malaysia)
OTHER REPORTING RESPONSIBILITIESThe supplementary information set out in Note 54 on page 186 is disclosed to meet the requirement of Bursa Malaysia Securities Berhad and is not part of the financial statements. The Directors are responsible for the preparation of the supplementary information in accordance with Guidance on Special Matter No. 1, Determination of Realised and Unrealised Profits or Losses in the Context of Disclosure Pursuant to Bursa Malaysia Securities Berhad Listing Requirements, as issued by the Malaysian Institute of Accountants (“MIA Guidance”) and the directive of Bursa Malaysia Securities Berhad. In our opinion, the supplementary information is prepared, in all material respects, in accordance with the MIA Guidance and the directive of Bursa Malaysia Securities Berhad.
OTHER MATTERSThis report is made solely to the members of the Company, as a body, in accordance with Section 174 of the Companies Act, 1965 in Malaysia and for no other purpose. We do not assume responsibility to any other person for the content of this report.
PricewaterhouseCoopers Mohammad Faiz Bin Mohammad Azmi (No. AF: 1146) (No.2025/03/14 (J)) Chartered Accountants Chartered Accountant
Kuala Lumpur, Malaysia 30 May 2012

90 ALLIANCE FINANCIAL GROUP BERHAD (6627-X)
Group Company 2012 2011 2012 2011 Note RM’000 RM’000 RM’000 RM’000
ASSETSCash and short-term funds 3 1,874,333 914,038 6,501 46,858Deposits and placements with banks and other
financial institutions 4 97,713 100,228 19,315 605,700Balances due from clients and brokers 5 61,698 80,519 – –Financial assets held-for-trading 6 1,491,995 1,938,250 – –Financial investments available-for-sale 7 9,123,201 9,259,940 – –Financial investments held-to-maturity 8 795,256 940,726 – –Derivative financial assets 9 23,712 32,047 – –Loans, advances and financing 10 24,360,203 21,796,319 – –Other assets 11 78,157 87,621 269 219Tax recoverable 15,484 3,244 462 799Statutory deposits 12 1,163,083 291,108 – –Investments in subsidiaries 13 – – 1,777,505 1,777,489Investment in associate 14 26,552 28,530 – –Investment property 15 27,748 27,748 – –Property, plant and equipment 16 90,293 104,837 516 285Intangible assets 17 354,902 357,682 – –Deferred tax assets 18 15,341 109,099 300 284
39,599,671 36,071,936 1,804,868 2,431,634 Non-current assets held for sale 53 3,814 – – –
TOTAL ASSETS 39,603,485 36,071,936 1,804,868 2,431,634
LIABILITIES AND EQUITYDeposits from customers 19 32,130,962 28,345,647 – –Deposits and placements of banks and other
financial institutions 20 2,161,005 1,952,200 – –Balances due to clients and brokers 21 74,915 86,743 – –Bills and acceptances payable 22 178 111,159 – –Derivative financial liabilities 9 26,241 33,347 – –Amount due to Cagamas Berhad 23 22,044 125,776 – –Other liabilities 24 870,807 811,890 4,354 1,529Subordinated obligations 25 611,615 600,000 – –Long term borrowings 26 – 601,272 – 601,272Provision for taxation 7,372 40,507 – –Deferred tax liabilities 18 23,012 6,792 – –
TOTAL LIABILITIES 35,928,151 32,715,333 4,354 602,801
Share capital 27 1,548,106 1,548,106 1,548,106 1,548,106Reserves 28 2,190,517 1,847,175 320,602 323,894Shares held for Employees’ Share Scheme 29 (68,194) (43,167) (68,194) (43,167)
CAPITAL AND RESERVES ATTRIBUTABLE TO OWNERS OF THE PARENT 3,670,429 3,352,114 1,800,514 1,828,833
Non-controlling interests 4,905 4,489 – –
TOTAL EQUITY 3,675,334 3,356,603 1,800,514 1,828,833
TOTAL LIABILITIES AND EQUITY 39,603,485 36,071,936 1,804,868 2,431,634
COMMITMENTS AND CONTINGENCIES 45 18,741,373 15,909,028 – –
Statements of Financial Positionas at 31 March 2012
The accompanying notes form an integral part of the financial statements.

912012 ANNUAL REPORT
Statements of Comprehensive Incomefor the year ended 31 March 2012
Group Company 2012 2011 2012 2011 Note RM’000 RM’000 RM’000 RM’000
Interest income 31 1,328,122 1,203,438 12,947 18,214Interest expense 32 (654,259) (533,176) (14,178) (21,382)
Net interest income/(expense) 673,863 670,262 (1,231) (3,168)Net income from Islamic banking business 33 256,329 232,732 – –
930,192 902,994 (1,231) (3,168)Other operating income 34 320,182 225,722 267,198 147,844
Net income 1,250,374 1,128,716 265,967 144,676Other operating expenses 35 (591,796) (544,900) (4,113) (4,002)
Operating profit before allowance 658,578 583,816 261,854 140,674Allowance for losses on loans, advances
and financing and other losses 36 (34,640) (33,309) – –Write-back of/(allowance for) impairment 37 21,643 4,076 (970) (642)
Operating profit after allowance 645,581 554,583 260,884 140,032Share of results of associate 14 (1,978) (1,470) – –
Profit before taxation and zakat 643,603 553,113 260,884 140,032Taxation and zakat 38 (163,764) (143,962) (61,095) (31,190)
Net profit after taxation and zakat 479,839 409,151 199,789 108,842
Other comprehensive income: Revaluation reserve on financial investments
available-for-sale - Net gain/(loss) from change in fair value 85,531 (7,925) – – - Transfer (to)/from deferred tax (21,382) 1,981 – –
Other comprehensive income/(expense), net of tax 64,149 (5,944) – –
Total comprehensive income for the year 543,988 403,207 199,789 108,842
Profit attributable to:Owners of the parent 479,355 409,202 199,789 108,842Non-controlling interests 484 (51) – –
Net profit after taxation and zakat 479,839 409,151 199,789 108,842
Total comprehensive income attributable to:Owners of the parent 543,504 403,258 199,789 108,842Non-controlling interests 484 (51) – –
Total comprehensive income for the year 543,988 403,207 199,789 108,842
Earnings per share attributable to owners of the parent: Basic (sen) 39(a) 31.5 26.7 Diluted (sen) 39(b) 31.4 26.7
The accompanying notes form an integral part of the financial statements.

92 ALLIANCE FINANCIAL GROUP BERHAD (6627-X)
Cons
olid
ated
Sta
tem
ents
of C
hang
es in
Equ
ityfo
r the
yea
r end
ed 3
1 M
arch
201
2
Attri
buta
ble to
Own
ers o
f the
Pare
nt
Em
ploye
es’
Shar
e Pr
ofit
Sche
me
Equa
lisat
ion
Shar
es
Non-
Sh
are
Shar
e St
atut
ory
Capit
al
Reva
luatio
n (“
ESS”
) R
eser
ve
held
Ret
ained
Cont
rollin
g To
tal
Ca
pital
Pre
mium
R
eser
ve
Rese
rve
Rese
rve
Rese
rve
(“PE
R”)
for E
SS
Pro
fits
Tota
l In
tere
sts
Equit
yGr
oup
Note
RM
’000
RM’
000
RM’
000
RM’00
0 R
M’00
0 RM
’000
RM’00
0 RM
’000
RM’00
0 R
M’00
0 RM
’000
RM’00
0
At 1
April
2010
1,54
8,10
6
304,
289
493,
477
7,01
3 74
,564
12
,341
26
,388
(4
6,69
7)
631,
114
3,05
0,59
5 4,
540
3,05
5,13
5
Net p
rofit
/ (los
s) aft
er ta
xatio
n and
zaka
t
– –
– –
– –
– –
409,
202
409,
202
(51)
40
9,15
1Ot
her c
ompr
ehen
sive e
xpen
se
–
– –
– (5
,944
) –
– –
– (5
,944
) –
(5,9
44)
Total
com
preh
ensiv
e (ex
pens
e)/inc
ome
–
– –
– (5
,944
) –
– –
409,
202
403,
258
(51)
40
3,20
7Tra
nsfer
to st
atutor
y res
erve
– –
50,8
91
– –
– –
– (5
0,89
1)
– –
–Tra
nsfer
to P
ER
–
– –
– –
– (2
5,35
5)
– 25
,355
–
– –
Shar
e-ba
sed p
aym
ent u
nder
ESS
–
– –
– –
5,34
7 –
– –
5,34
7 –
5,34
7Di
viden
ds pa
id to
shar
ehold
ers
40
– –
– –
– –
– –
(107
,086
) (1
07,0
86)
– (1
07,0
86)
ESS
shar
es ve
sted t
o: - e
mplo
yees
of su
bsidi
aries
– –
– –
– (3
,485
) –
3,48
5 –
– –
– - o
wn em
ploye
es
–
– –
– –
(45)
–
45
– –
– –
Trans
fer of
ESS
shar
es pu
rcha
se pr
ice
differ
ence
on sh
ares
veste
d
– –
– –
– (3
90)
– –
390
– –
–
At 3
1 Ma
rch 2
011
1,
548,
106
30
4,28
9 54
4,36
8 7,
013
68,6
20
13,7
68
1,03
3 (4
3,16
7)
908,
084
3,35
2,11
4 4,
489
3,35
6,60
3
At 1
April
2011
1,548
,106
304,2
89
544,3
68
7,013
68
,620
13,76
8 1,0
33
(43,1
67)
908,0
84
3,352
,114
4,489
3,3
56,60
3Ne
t pro
fit af
ter ta
xatio
n and
zaka
t
– –
– –
– –
– –
479,3
55
479,3
55
484
479,8
39Ot
her c
ompr
ehen
sive i
ncom
e
– –
– –
64,14
9 –
– –
– 64
,149
– 64
,149
Total
com
preh
ensiv
e inc
ome
–
– –
– 64
,149
– –
– 47
9,355
54
3,504
48
4 54
3,988
Trans
fer to
statu
tory r
eser
ve
–
– 55
,761
– –
– –
– (5
5,761
) –
– –
Purc
hase
of sh
ares
pursu
ant t
o ESS
29
–
– –
– –
– –
(28,6
38)
– (2
8,638
) –
(28,6
38)
Shar
e-ba
sed p
aym
ent u
nder
ESS
–
– –
– –
6,649
–
– –
6,649
–
6,649
Trans
fer to
retai
ned p
rofit
s on s
hare
s lap
sed:
- em
ploye
es of
subs
idiar
ies
–
– –
– –
(2,91
9)
– –
2,919
–
– –
- o
wn em
ploye
es
–
– –
– –
(61)
–
– 61
–
– –
Divid
ends
paid
to sh
areh
older
s 40
–
– –
– –
– –
– (2
03,20
0)
(203
,200)
(6
8)
(203
,268)
ESS
shar
es ve
sted t
o: - e
mplo
yees
of su
bsidi
aries
– –
– –
– (3
,558)
–
3,558
–
– –
– - o
wn em
ploye
es
–
– –
– –
(53)
–
53
– –
– –
Trans
fer of
ESS
shar
es pu
rcha
se pr
ice
differ
ence
on sh
ares
veste
d
– –
– –
– 17
5 –
– (1
75)
– –
–
At 31
Mar
ch 20
12
1,5
48,10
6 30
4,289
60
0,129
7,0
13
132,7
69
14,00
1 1,0
33
(68,1
94)
1,131
,283
3,670
,429
4,905
3,6
75,33
4
The
acco
mpa
nyin
g no
tes
form
an
inte
gral
par
t of t
hese
fina
ncia
l sta
tem
ents
.

932012 ANNUAL REPORT
Statements of Changes in Equityfor the year ended 31 March 2012
Non-Distributable <Distributable> Employees’ Share Shares Scheme held Share Share (“ESS”) for Retained Total Capital Premium Reserve ESS Profits EquityCompany Note RM’000 RM’000 RM’000 RM’000 RM’000 RM’000
At 1 April 2010 1,548,106 304,289 12,341 (46,697) 3,691 1,821,730Net profit after taxation – – – – 108,842 108,842Share-based payment under ESS – – 5,347 – – 5,347Dividends paid to shareholders 40 – – – – (107,086) (107,086)ESS recharge amount received
from subsidiaries – – – 3,485 – 3,485ESS shares vested to:
- employees of subsidiaries – – (3,485) – – (3,485) - owned employees – – (45) 45 – –
Transfer of ESS shares purchase price difference on shares vested – – (390) – 390 –
At 31 March 2011 1,548,106 304,289 13,768 (43,167) 5,837 1,828,833
At 1 April 2011 1,548,106 304,289 13,768 (43,167) 5,837 1,828,833Net profit after taxation – – – – 199,789 199,789Purchase of shares pursuant to ESS – – – (28,638) – (28,638)Share-based payment under ESS – – 6,649 – – 6,649Transfer to retained profits on
shares lapsed: - employees of subsidiaries – – (2,919) – – (2,919)
- own employees – – (61) – 61 –Dividends paid to shareholders 40 – – – – (203,200) (203,200)ESS recharge amount received
from subsidiaries – – – 3,558 – 3,558ESS shares vested to:
- employees of subsidiaries – – (3,558) – – (3,558) - owned employees – – (53) 53 – –Transfer of ESS shares
purchase price difference on shares vested – – 175 – (175) –
At 31 March 2012 1,548,106 304,289 14,001 (68,194) 2,312 1,800,514
The accompanying notes form an integral part of these financial statements.

94 ALLIANCE FINANCIAL GROUP BERHAD (6627-X)
2012 2011 RM’000 RM’000
CASH FLOWS FROM OPERATING ACTIVITIES
Profit before taxation and zakat 643,603 553,113
Adjustments for: Accretion of discount less amortisation of premium of financial investments (94,369) (82,179) Depreciation of property, plant and equipment 29,374 39,592 Dividends from financial investments available-for-sale (10,229) (3,705) (Gain)/loss on disposal of property, plant and equipment (200) 329 Loss on disposal of foreclosed properties 20 38 Net gain from redemption of financial investments held-to-maturity (16,831) (3) Net gain from sale of financial assets held-for-trading (3,699) (417) Net gain from sale of financial investments available-for-sale (47,408) (3,509) Unrealised loss/(gain) on revaluation of financial assets held-for-trading 185 (256) Unrealised gain on revaluation of derivative instruments (1,572) (4,149) Interest expense on subordinated obligations 34,513 36,540 Interest expense on long term borrowings 14,178 21,382 Interest income from financial investments held-to-maturity (22,751) (30,682) Interest income from financial investments available-for-sale (253,237) (206,340) Interest income from financial investments held-for-trading (3,862) (1,044) Allowance for loan, advances and financing (net of recoveries) 89,744 103,804 Allowance for other assets 6,280 4,801 (Write-back of)/allowances for commitments and contingencies (4,210) 59 Net write-back of financial investments available-for-sale (22,759) (585) Net write-back of financial investments held-to-maturity (344) (3,491) Impairment for property, plant and equipment 1,460 – Amortisation of computer software 18,239 14,420 Share options/grants under ESS 6,649 5,347 Property, plant and equipment written off 2,046 3,399 Computer software written off 841 1 Share of results of associate 1,978 1,470 Loss on liquidation of subsidiaries – 7
Operating profit before working capital changes 367,639 447,942Changes in working capital:
Deposits from customers 3,785,315 4,636,994 Deposits and placements of banks and other financial institutions 208,805 (346,208) Bills and acceptances payable (110,981) (427,191) Balances due from clients and brokers 22,085 6,150 Other liabilities 75,641 9,719 Deposits and placements with banks and other financial institutions 2,515 71,346 Financial assets held-for-trading 460,685 (1,909,800) Loans, advances and financing (2,653,628) (1,146,201) Other assets 1,672 (22,322) Statutory deposits with Bank Negara Malaysia (871,975) (32,602) Amount due to Cagamas Berhad (103,732) 97,699
Cash generated from operations 1,184,041 1,385,526Taxes and zakat paid (120,533) (118,616)
Net cash generated from operating activities 1,063,508 1,266,910
Consolidated Statements of Cash Flowfor the year ended 31 March 2012

952012 ANNUAL REPORT
Consolidated Statements of Cash Flowfor the year ended 31 March 2012
2012 2011 RM’000 RM’000
CASH FLOWS FROM INVESTING ACTIVITIES
Dividends received from financial instruments available-for-sale 10,219 3,657Interest received from financial investments held-to-maturity 22,751 30,682Interest received from financial investments available-for-sale 253,237 206,340Interest received from financial investments held-for-trading 3,862 1,044Purchase of property, plant and equipment (22,720) (14,882)Purchase of computer software (16,300) (10,400)Purchase of shares held for ESS (28,638) –Proceeds from disposal of property, plant and equipment 770 1,818Proceeds from disposal of computer software – 155Proceeds from disposal of foreclosed properties 4,285 62Proceeds from redemption and maturity of financial investments
held-to-maturity (net of purchase) 218,950 6,640Proceeds from disposal of financial investments available-for-sale (net of purchase) 319,507 (3,940,354)Acquisition of investment in an associate – (30,000)
Net cash generated from/(used in) investing activities 765,923 (3,745,238)
CASH FLOWS FROM FINANCING ACTIVITIES
Redemptions of subordinated bonds (600,000) –Proceeds from issuance of subordinated notes 597,366 –Interest paid on subordinated obligations (32,778) (36,540)Repayment of long term borrowings (600,000) –Interest paid on long term borrowings (15,450) (21,808)Dividends paid to non-controlling interests (68) –Dividends paid to shareholders of the Company (203,200) (107,086)
Net cash used in financing activities (854,130) (165,434)
NET CHANGE IN CASH AND CASH EQUIVALENTS 975,301 (2,643,762)CASH AND CASH EQUIVALENTS AT BEGINNING OF YEAR 826,534 3,470,296
CASH AND CASH EQUIVALENTS AT END OF YEAR 1,801,835 826,534
Cash and cash equivalents comprise the following:Cash and short-term funds 1,874,333 914,038Less: Monies held in trust (Note 3) (72,498) (87,504)
1,801,835 826,534
The accompanying notes form an integral part of the financial statements.

96 ALLIANCE FINANCIAL GROUP BERHAD (6627-X)
Statements of Cash Flowfor the year ended 31 March 2012
2012 2011 RM’000 RM’000
CASH FLOWS FROM OPERATING ACTIVITIES
Profit before taxation 260,884 140,032
Adjustments for: Depreciation of property, plant and equipment 103 76
Interest income from deposits and placements with banks and other financial institutions (12,947) (18,214) Interest expense on long term borrowings 14,178 21,382 Write-back of impairment in subsidiary – (5,962)
Allowance for impairment losses on amount due from subsidiaries 970 642 Loss on disposal of property, plant and equipment 109 – Share options/grants under ESS 6,649 5,347 Gross dividend income from subsidiary (265,765) (146,462)
Operating profit/(loss) before working capital changes 4,181 (3,159)Changes in working capital: Receivables (42) 26 Payables 2,472 (394) Deposits 586,385 10,906 Subsidiaries (7,118) (120)
Cash generated from operations 585,878 7,259 Taxes refunded 667 675
Net cash generated from operating activities 586,545 7,934
CASH FLOWS FROM INVESTING ACTIVITIES
Interest received from deposits and placements with banks and other financial institutions 12,947 18,214Purchase of shares held for ESS (28,638) –Purchase of property, plant and equipment (536) –Proceeds from disposal of property, plant and equipment 93 –Dividend received 204,324 114,846ESS recharge amount received from subsidiaries 3,558 3,485
Net cash generated from investing activities 191,748 136,545
CASH FLOWS FROM FINANCING ACTIVITIES
Dividends paid (203,200) (107,086)Repayment of long term borrowings (601,272) –Interest paid on long term borrowings (14,178) (21,382)
Net cash used in financing activities (818,650) (128,468)
NET CHANGE IN CASH AND CASH EQUIVALENTS (40,357) 16,011CASH AND CASH EQUIVALENTS AT BEGINNING OF YEAR 46,858 30,847
CASH AND CASH EQUIVALENTS AT END OF YEAR 6,501 46,858
Cash and cash equivalents comprise the following:Cash and short-term funds 6,501 46,858
The accompanying notes form an integral part of the financial statements.

972012 ANNUAL REPORT
Notes to the Financial Statements31 March 2012
1. CORPORATE INFORMATION The Company is a public limited liability company, incorporated and domiciled in Malaysia, and is listed on the Main Market of Bursa
Malaysia Securities Berhad. The registered office of the Company is located at 3rd Floor, Menara Multi-Purpose, Capital Square, No. 8, Jalan Munshi Abdullah, 50100 Kuala Lumpur, Malaysia.
The principal activities of the Company are investment holding and provision of management services to the subsidiaries.
The principal activities of the subsidiaries are commercial banking and financing, Islamic banking, investment banking including provision of stockbroking services, unit trusts and fund management, and the provision of related financial services.
There have been no significant changes in the nature of the principal activities during the financial year.
The financial statements were authorised for issue by the Board of Directors in accordance with a resolution of the Directors on 30 May 2012.
2. SIGNIFICANT ACCOUNTING POLICIES The principal accounting policies adopted by the Group are consistent with those adopted in the annual audited financial statements for
the previous financial year, unless otherwise stated.
Standards, amendments to published standards and interpretations that are effective
The new accounting standards, amendments and improvements to published standards and interpretations that are effective for the Group’s financial year beginning on or after 1 April 2011 are as follows:
• RevisedFRS1“First-timeAdoptionofFinancialReportingStandards”
• RevisedFRS3“BusinessCombinations”
• RevisedFRS127“ConsolidatedandSeparateFinancialStatements”
• AmendmenttoFRS2“Share-basedPayment:GroupCash-settledShare-basedPaymentTransactions”
• AmendmenttoFRS7“FinancialInstruments:Disclosures-ImprovingDisclosuresaboutFinancialInstruments”
• AmendmenttoFRS1“First-timeAdoptionofFinancialReportingStandards”
• AmendmenttoFRS132“FinancialInstruments:Presentation-ClassificationofRightsIssue”
• AmendmenttoICInterpretation9‘’ReassessmentofEmbeddedDerivatives’’
• ICInterpretation4“DeterminingwhetheranArrangementcontainsaLease”
• ICInterpretation12“ServiceConcessionArrangements”
• ICInterpretation16“HedgesofANetInvestmentInAForeignOperation”
• ICInterpretation17“DistributionsofNon-cashAssetstoOwners”
• ICInterpretation18“TransferofAssetsFromCustomers”
• ImprovementstoFRSs(2010)
OtherthantheadoptionofAmendmenttoFRS7‘’FinancialInstruments:Disclosures-ImprovingDisclosuresaboutFinancialInstruments’’which will impact the disclosure requirement of fair value measurement by level of a fair value measurement hierarchy, the adoption of the other revised accounting standards, amendments and improvements to published standards and interpretations are not expected to have a material impact on the financial statements of the Group and the Company.

98 ALLIANCE FINANCIAL GROUP BERHAD (6627-X)
Notes to the Financial Statements31 March 2012
2. SIGNIFICANT ACCOUNTING POLICIES (cont’d)
Standards, amendments to published standards and interpretations to existing standards that are applicable to the Group but not yet effective
The Group will apply the new standards, amendments to standards and interpretations in the following period:
Financial year beginning on/after 1 April 2012
In the next financial year, the Group will be adopting the new IFRS-compliant framework, Malaysian Financial Reporting Standards (“MFRS”). MFRS 1 “First-time adoption of MFRS” provides for certain optional exemptions and certain mandatory exceptions for first-time MFRS adopters.
(i) MFRS 139 “Financial instruments: Recognition and Measurement” - Bank Negara Malaysia has removed the transitional provision for banking institutions on loan impairment assessment and provisioning to comply with the FRS 139 requirements. The application of this standard will have impact on the basis used in assessing loan impairment on collective basis and impact on the financial statements are currently still being assessed by the Group.
(ii) The revised MFRS 124 “Related Party Disclosures” (effective from 1 January 2012) removes the exemption to disclose transactions between government-related entities and the government, and all other government-related entities. The following new disclosures are now required for government related entities:
- The name of the government and the nature of their relationship;
- The nature and amount of each individually significant transactions; and
- The extent of any collectively significant transactions, qualitatively or quantitatively.
The application of this standard is not expected to have a material impact on the financial statements of the Group.
(iii) Amendment to MFRS 112 “Income taxes” (effective from 1 January 2012) introduces an exception to the existing principle for the measurement of deferred tax assets or liabilities arising on investment property measured at fair value. MFRS 112 currently requires an entity to measure the deferred tax relating to an asset depending on whether the entity expects to recover the carrying amount of the asset through use or sale. It can be difficult and subjective to assess whether recovery will be through use or through sale when the asset is measured using the fair value model in FRS 140 “Investment property”. As a result of the amendments, IC Interpretation 121 “Income taxes - recovery of revalued non-depreciable assets” will no longer apply to investment properties carried at fair value. The amendment also incorporate into MFRS 112 the remaining guidance previously contained in IC Interpretation 121 which is withdrawn. The application of this standard is not expected to have a material impact on the financial statements of the Group.
(iv) IC Interpretation 19 “Extinguishing financial liabilities with equity instruments” (effective from 1 July 2011) provides clarification when an entity renegotiates the terms of a financial liability with its creditor and the creditor agrees to accept the entity’s shares or other equity instruments to settle the financial liability fully or partially. A gain or loss, being the difference between the carrying value of the financial liability and the fair value of the equity instruments issued, shall be recognised in profit or loss. Entities are no longer permitted to reclassify the carrying value of the existing financial liability into equity with no gain or loss recognised in profit or loss. The application of this standard is not expected to have a material impact on the financial statements of the Group.
(v) Amendment to MFRS 1 “First time adoption on fixed dates and hyperinflation” (effective from 1 July 2011) includes two changes toMFRS1.Thefirstreplacesreferencestoafixeddateof1January2004with‘thedateoftransitiontoMFRSs’,thuseliminating the need for entities adopting MFRSs for the first time to restate de-recognition transactions that occurred before the date of transition to MFRSs. The second amendment provides guidance on how an entity should resume presenting financial statements in accordance with MFRSs after a period when the entity was unable to comply with MFRSs because its functional currency was subject to severe hyperinflation.
(vi) Amendment to MFRS 7 “Financial instruments: Disclosures on transfers of financial assets” (effective from 1 July 2011) promotes transparency in the reporting of transfer transactions and improve users’ understanding of the risk exposures relating to transfers of financial assets and the effect of those risks on an entity’s financial position, particularly those involving securitisation of financial assets.

992012 ANNUAL REPORT
Notes to the Financial Statements31 March 2012
2. SIGNIFICANT ACCOUNTING POLICIES (cont’d)
Standards, amendments to published standards and interpretations to existing standards that are applicable to the Group but not yet effective (cont’d)
The Group will apply the new standards, amendments to standards and interpretations in the following period: (cont’d)
Financial year beginning on/after 1 April 2013
A brief discussion of the significant new FRSs that have been issued is set out below. Due to the complexity of these new FRSs and their proposed changes, the financial effects of their adoption are currently still being assessed by the Group.
(i) MFRS 9 “Financial instruments - classification and measurement of financial assets and financial liabilities” (effective from 1 January 2015) replaces the multiple classification and measurement models in MFRS 139 with a single model that has only two classification categories: amortised cost and fair value. The basis of classification depends on the entity’s business model for managing the financial assets and the contractual cash flow characteristics of the financial asset.
The accounting and presentation for financial liabilities and for de-recognising financial instruments has been relocated from MFRS 139, without change, except for financial liabilities that are designated at fair value through profit or loss (“FVTPL”). Entities with financial liabilities designated at FVTPL recognise changes in the fair value due to changes in the liability’s credit risk directly inothercomprehensiveincome(‘’OCI’’).ThereisnosubsequentrecyclingoftheamountsinOCItoprofitorloss,butaccumulatedgains or losses may be transferred within equity.
The guidance in MFRS 139 on impairment of financial assets and hedge accounting continues to apply.
MFRS 7 requires disclosures on transition from MFRS 139 to MFRS 9.
(ii) MFRS 10 “Consolidated financial statements” (effective from 1 January 2013) changes the definition of control. An investor controls an investee when it is exposed, or has rights, to variable returns from its involvement with the investee and has the ability to affect those returns through its power over the investee. It establishes control as the basis for determining which entities are consolidated in the consolidated financial statements and sets out the accounting requirements for the preparation of consolidated financial statements. It replaces all the guidance on control and consolidation in MFRS 127 “Consolidated and separate financial statements” and IC Interpretation 112 “Consolidation – special purpose entities”.
(iii) MFRS 11 “Joint arrangements” (effective from 1 January 2013) requires a party to a joint arrangement to determine the type of joint arrangement in which it is involved by assessing its rights and obligations arising from the arrangement, rather than its legal form. There are two types of joint arrangement: joint operations and joint ventures. Joint operations arise where a joint operator has rights to the assets and obligations relating to the arrangement and hence accounts for its interest in assets, liabilities, revenue and expenses. Joint ventures arise where the joint operator has rights to the net assets of the arrangement and hence equity accounts for its interest. Proportional consolidation of joint ventures is no longer allowed.
(iv) MFRS 12 “Disclosures of interests in other entities” (effective from 1 January 2013) sets out the required disclosures for entities reporting under the two new standards, MFRS 10 and MFRS 11, and replaces the disclosure requirements currently found in MFRS 128 “Investments in associates”. It requires entities to disclose information that helps financial statement readers to evaluate the nature, risks and financial effects associated with the entity’s interests in subsidiaries, associates, joint arrangements and unconsolidated structured entities.
(v) MFRS 13 “Fair value measurement” (effective from 1 January 2013) aims to improve consistency and reduce complexity by providing a precise definition of fair value and a single source of fair value measurement and disclosure requirements for use across MFRSs. The requirements do not extend the use of fair value accounting but provide guidance on how it should be applied where its use is already required or permitted by other standards. The enhanced disclosure requirements are similar to those in MFRS 7 “Financial instruments: Disclosures”, but apply to all assets and liabilities measured at fair value, not just financial ones.
(vi) The revised MFRS 127 “Separate financial statements” (effective from 1 January 2013) includes the provisions on separate financial statements that are left after the control provisions of MFRS 127 have been included in the new MFRS 10.
(vii) The revised MFRS 128 “Investments in associates and joint ventures”(effective from 1 January 2013) includes the requirements for joint ventures, as well as associates, to be equity accounted following the issue of MFRS 11.
(viii) Amendment to MFRS 101 “Presentation of items of other comprehensive income” (effective from 1 July 2012) requires entities to separateitemspresentedin‘othercomprehensiveincome’(“OCI’’)inthestatementofcomprehensiveincomeintotwogroups,basedon whether or not they may be recycled to profit or loss in the future. The amendment does not address which items are presented in OCI.
100 ALLIANCE FINANCIAL GROUP BERHAD (6627-X)
Notes to the Financial Statements31 March 2012
2. SIGNIFICANT ACCOUNTING POLICIES (cont’d)
Standards, amendments to published standards and interpretations to existing standards that are applicable to the Group but not yet effective (cont’d)
The Group will apply the new standards, amendments to standards and interpretations in the following period: (cont’d)
Financial year beginning on/after 1 April 2013 (cont’d)
(ix) Amendment to MFRS 119 “Employee benefits” (effective from 1 January 2013) makes significant changes to the recognition and measurement of defined benefit pension expense and termination benefits, and to the disclosures for all employee benefits. Actuarial gains and losses will no longer be deferred using the corridor approach. MFRS 119 shall be withdrawn on application of this amendment.
(x) Amendment to MFRS 132 “Financial instruments: Presentation” (effective from 1 January 2014) does not change the current offsetting model in MFRS 132. It clarifies the meaning of ‘currently has a legally enforceable right of set-off’ that the right of set-off must be available today (not contingent on a future event) and legally enforceable for all counterparties in the normal course of business. It clarifies that some gross settlement mechanisms with features that are effectively equivalent to net settlement will satisfy the MFRS 132 offsetting criteria.
(xi) Amendment to MFRS 7 “Financial instruments: Disclosures” (effective from 1 January 2013) requires more extensive disclosures focusing on quantitative information about recognised financial instruments that are offset in the statement of financial position and those that are subject to master netting or similar arrangements irrespective of whether they are offset.
(a) Basis of Preparation
The financial statements of the Group and Company have been prepared in accordance with the provisions of the Companies Act, 1965, Financial Reporting Standards, the MASB Approved Accounting Standards in Malaysia for Entities Other than Private Entities and Bank Negara Malaysia (“BNM”) Guidelines.
The financial statements of the Group and the Company have also been prepared under the historical cost convention, except as disclosed in this summary of significant accounting policies.
The financial statements incorporate all activities relating to the Islamic banking business which have been undertaken by the Group. Islamic banking business refers generally to the acceptance of deposits and granting of financing under the Shariah principles.
The financial statements are presented in Ringgit Malaysia (“RM”) and all numbers are rounded to the nearest thousand (RM’000), unless otherwise stated.
The preparation of the financial statements in conformity with Financial Reporting Standards and BNM Guidelines requires the use of certain critical accounting estimates and assumptions that affect the reported amount of assets and liabilities and disclosure of contingent assets and liabilities at the date of the financial statements and the reported amounts of revenues and expenses during the reported period. It also requires Directors to exercise their judgement in the process of applying the Group and Company’s accounting policies. Although these estimates and judgement are based on the Directors’ best knowledge of current events and actions, actual results may differ. The areas involving a higher degree of judgement or complexity, or areas where assumptions and estimates are significant to the financial statements are described in the following notes:
(i) Annual testing for impairment of goodwill (Note 17) - the measurement of the recoverable amount of cash-generating units are determined based on the value-in-use method, which requires the use of estimates for cash flow projections approved by management covering a 5-year period, estimated growth rates for cash flows beyond the fifth year are extrapolated in perpetuity and discount rates are applied to the cash flow projections.
(ii) Allowance for losses on loans, advances and financing and other losses (Note 36) - the Group make allowance for losses on loans, advances and financing based on assessment of recoverability. Whilst management is guided by the relevant BNM guidelines and accounting standards, management makes judgement on the future and other key factors in respect of the estimation of the amount and timing of the cash flows in assessing allowance for impairment of loans, advances and financing. Among the factors considered are the Group’s aggregate exposure to the borrowers, the net realisable value of the underlying collateral value, the viability of the customer’s business model, the capacity to generate sufficient cash flows to service debt obligations and the aggregate amount and ranking of all other creditor claims.

1012012 ANNUAL REPORT
Notes to the Financial Statements31 March 2012
2. SIGNIFICANT ACCOUNTING POLICIES (cont’d)
(b) Economic Entities in the Group
(i) Subsidiaries
Subsidiaries are all those entities (including special purpose entities) over which the Group has power to govern the financial and operating policies, generally accompanying a shareholding of more than one half of the voting rights. The existence and effect of potential voting rights that are currently exercisable or convertible are considered when assessing whether the Group controls another entity.
The consolidated financial statements comprise the financial statements of the Company and its subsidiaries as at the end of the reporting period. The financial statements of the subsidiaries are prepared for the same reporting date as the Company.
Subsidiaries are consolidated using the acquisition method of accounting. Under the acquisition method of accounting, subsidiaries are fully consolidated from the date on which control is transferred to the Group and are de-consolidated from the date that control ceases. The cost of acquisition is measured as fair value of the assets given, equity instruments issued and liabilities incurred or assumed at the date of exchange. Upon the adoption of the revised FRS 3 and FRS 127, acquisition-related costs are expensed as incurred. Prior to adoption of the revised FRS 3 and FRS 127, acquisition-related costs were included as part of the cost of business combination.
Identifiable assets acquired and liabilities and contingent liabilities assumed in a business combination are measured initially at their fair values at the acquisition date, irrespective of the extent of any non-controlling interest. The excess of the cost of acquisition over the fair value of the Group’s share of the identifiable net assets acquired at the date of acquisition is reflected as goodwill. If the cost of acquisition is less than the fair value of the identifiable net assets of the subsidiary acquired, the gain is recognised directly in the statement of comprehensive income.
Non-controlling interests represents the portion of profit or loss and net assets of a subsidiary attributable to equity interests that are not owned, directly or indirectly through subsidiaries, by the parent. It is measured at the minorities’ share of the fair value of the subsidiaries’ identifiable assets and liabilities at the acquisition date and the minorities’ share of changes in the subsidiaries’ equity since that date. At the end of the reporting period, non-controlling interests consists of amount calculated on the date of business combination to the Group and its share of changes in the subsidiaries’ equity since the date of business combination.
Upon adoption of the revised FRS 3 and FRS 127, all earnings and losses of the subsidiaries are attributed to the parent and the non-controlling interest, even if the attribution of losses to the non-controlling interests results in a debit balance in the shareholders’ equity. Profit or loss attribution to non-controlling interest for prior years is not restated. As a consequence, no adjustments were necessary to any of the amounts previously recognised in the financial statements.
Intercompany transactions, balances and unrealised gains on transactions between Group companies are eliminated. Unrealised losses are also eliminated. This may indicate an impairment of the asset transferred. Accounting policy of subsidiaries have been changed where necessary to ensure consistency with the policies adopted by the Group.
The gain or loss on disposal of a subsidiary is the difference between net disposal proceeds and the Group’s share of its net assets as of the date of disposal including the cumulative amount of any exchange differences that relate to the subsidiary is recognised in the statement of comprehensive income attributable to the parent.
(ii) Associates
Associates are those corporations, partnerships or other entities in which the Group exercises significant influence, but which it does not control, generally accompanying a shareholding of between 20% and 50% of voting rights. Significant influence is the power to participate in financial and operating policy decisions of associates but not power to exercise control over those policies.
Investments in associates are accounted for using the equity method of accounting and are initially recognised at cost. The Group’s investment in associates includes goodwill identified on acquisition, net of any accumulated impairment.

102 ALLIANCE FINANCIAL GROUP BERHAD (6627-X)
2. SIGNIFICANT ACCOUNTING POLICIES (cont’d)
(b) Economic Entities in the Group (cont’d)
(ii) Associates (cont’d)
The Group’s share of its associates’ post-acquisition profits or losses is recognised in the statement of comprehensive income, and its share of post-acquisition movements in reserves is recognised in other comprehensive income. The cumulative post-acquisition movements are adjusted against the carrying amount of the investment. If the Group’s share of losses of an associate equals or exceeds its interest in the associate, the Group discontinues recognising its share of future losses. The interest in an associate is the carrying of the investment in the associate under the equity method together with any long term interests that, in substance, form part of the Group’s net investment in the associate. After the Group’s interest is reduced to zero, additional losses are provided for, and a liability is recognised, only to the extent that the investor has incurred legal or constructive obligations or made payments on behalf of the associate. If the associate subsequently reports profits, the Group resumes recognising its share of those profits only after its share of the profits equals the share of losses not recognised.
Unrealised gains on transactions between the Group and its associates are eliminated to the extent of the Group’s interest in the associates, unrealised losses are also eliminated unless the transaction provides evidence on impairment of the asset transferred. Where necessary, in applying the equity method, adjustments are made to the financial statements of associates to ensure consistency of accounting policies with those of the Group.
The most recent available audited financial statements of the associates are used by the Group in applying the equity method. Where the dates of the audited financial statements used are not coterminous with those of the Group, the share of results is arrived at from the last audited financial statements available and management financial statements to the end of the accounting period. Uniform accounting policies are adopted for like transactions and events in similar circumstances.
(iii) Changes in ownership interests
Upon adoption of the revised FRS 127, when the Group ceases to have control, joint control or significant influence, any retained interest in the entity is re-measured to its fair value with the change in carrying amount recognised in profit or loss. This fair value is its fair value on initial recognition as a financial asset in accordance with FRS 139. Any amounts previously recognised in other comprehensive income in respect of that entity are accounted for as if the Group had directly disposed of the related assets or liabilities.
(c) Investments in Subsidiaries and Associate
In the Company’s separate financial statements, investments in subsidiaries and associate are carried at cost less accumulated impairment. The policy for the recognition and measurement of impairment is in accordance with Note 2(j)(v). On disposal of investments in subsidiaries and associate, the difference between disposal proceeds and the carrying amounts of the investments are recognised in the statement of comprehensive income.
(d) Intangible Assets
(i) Goodwill
Goodwill represents the excess of the cost of acquisition of subsidiaries over the fair value of the Group’s share of the identifiable net assets at the date of acquisition.
Goodwill is measured at cost less accumulated impairment, if any. Goodwill is no longer amortised. Instead it is allocated to cash-generating units which are expected to benefit from the synergies of the business combination. Each cash-generating unit represents the lowest level at which the goodwill is monitored and is not larger than a reportable business segment. The carrying amount of goodwill is tested annually for impairment, or more frequently if events or changes in circumstances indicate that it might be impaired. Gains and losses on the disposal of an entity include the carrying amount of goodwill relating to the entity sold. The policy for the recognition and measurement of impairment is in accordance with Note 2(j)(iv).
(ii) Computer Software
Acquired computer software licenses are capitalised on the basis of the costs incurred to acquire and bring the specific software to use. The costs are amortised over their useful lives of five years and are stated at cost less accumulated amortisation and accumulated impairment, if any. Computer software is assessed for impairment whenever there is an indication that it may be impaired. The amortisation period and amortisation method are reviewed at least at the end of each reporting period.
The policy for the recognition and measurement of impairment is in accordance with Note 2(j)(v).
Notes to the Financial Statements31 March 2012

1032012 ANNUAL REPORT
Notes to the Financial Statements31 March 2012
2. SIGNIFICANT ACCOUNTING POLICIES (cont’d)
(d) Intangible Assets (cont’d)
(ii) Computer Software (cont’d)
Costs associated with maintaining computer software programmes are recognised as expenses as incurred. Costs that are directly associated with the production of identifiable and unique software products controlled by the Group, and that will probably generate economic benefits exceeding costs beyond one year, are recognised as intangible assets. These costs include software development employee costs and appropriate portion of relevant overheads.
(iii) Other non-financial assets
Intangible assets acquired separately are measured at cost on initial recognition. The cost of intangible assets acquired in a business combination is their fair values as at the date of acquisition. Following initial recognition, intangible assets are carried at cost less any accumulated amortisation and any accumulated impairment. The useful lives of intangible assets are assessed to be either finite or indefinite. Intangible assets with finite lives are amortised on a straight-line basis over the estimated economic useful lives and assessed for impairment whenever there is an indication that the intangible asset may be impaired. The amortisation period and the amortisation method for an intangible asset with a finite useful life are reviewed at least at the end of each reporting period.
Intangible assets with indefinite useful lives are not amortised but tested for impairment annually or more frequently if the events or changes in circumstances indicate that the carrying value may be impaired either individually or at the cash-generating unit level. The useful life of an intangible asset with an indefinite life is also reviewed annually to determine whether the useful assessment continues to be supportable.
(e) Financial Assets
The Group allocates financial assets to the following categories: loans, advances and financing; financial assets held-for-trading; financial investments available-for-sale; and financial investments held-to-maturity. Management determines the classification of its financial instruments at initial recognition. The policy of the recognition and measurement of impairment is in accordance with Note 2(j).
(i) Loans, advances and financing
Loans, advances and financing are non-derivative financial assets with fixed or determinable payments that are not quoted in the active market.
Loans, advances and financing are initially recognised at fair value which is the cash consideration to originate or purchase the loan including any transaction costs and measured subsequently at amortised cost using the effective interest rate method, less impairment allowance.
An uncollectible loan, advance and financing or portion of a loan, advance and financing classified as bad is written off after taking into consideration the realisable value of collateral, if any, when in the judgement of the management, there is no prospect of recovery.
(ii) Financial assets at fair value through profit or loss
Financial assets classified in this category consist of financial assets held-for-trading. Financial asset is classified as held-for-trading if it is acquired principally for the purpose of selling or repurchasing in the near term or it is part of a portion of identified financial instruments that are managed together and for which there is evidence of a recent actual pattern of short-term profit-taking.
Financial assets held-for-trading are stated at fair value and any gain or loss arising from a change in their fair values and the derecognition of financial assets held-for-trading are recognised in the statement of comprehensive income.

104 ALLIANCE FINANCIAL GROUP BERHAD (6627-X)
Notes to the Financial Statements31 March 2012
2. SIGNIFICANT ACCOUNTING POLICIES (cont’d)
(e) Financial Assets (cont’d)
(iii) Financial investments held-to-maturity
Financial investments held-to-maturity are financial assets with fixed or determinable payments and fixed maturity that the Group have the positive intent and ability to hold to maturity.
Financial investments held-to-maturity are measured at amortised cost based on the effective yield method. Amortisation of premium, accretion of discount and impairment as well as gain or loss arising from derecognition of financial investments held-to-maturity are recognised in the statement of comprehensive income.
Any sale or reclassification of more than an insignificant amount of financial investments held-to-maturity not close to their maturity would result in the reclassification of all financial investments held-to-maturity to financial investments available-for-sale, and prevents the Group from classifying the similar class of financial instruments as financial investments held-to-maturity for the current and following two (2) financial years.
(iv) Financial investments available-for-sale
Financial investments available-for-sale are financial assets that are not classified as held-for-trading or held-to-maturity. Financial investments available-for-sale are measured at fair value. The return and cost of the financial investments available-for-sale are credited and charged to the statement of comprehensive income using accreted/amortised cost based on effective yield method. Any gain or loss arising from a change in fair value after applying the accreted/amortised cost method are recognised directly in equity through the statement of changes in equity, until the financial asset is sold, collected, disposed of or impaired, at which time the cumulative gain or loss previously recognised in equity will be transferred to the statement of comprehensive income.
(v) Reclassification of financial assets
The Group may choose to reclassify non-derivative assets out from the held-for-trading category, in rare circumstances, where the financial assets are no longer held for the purpose of selling or repurchasing in the short term. In addition, the Group may also choose to reclassify financial assets that would meet the definition of loans and receivables out of the held-for-trading or available-for-sale categories if the Group have the intention and ability to hold the financial asset for the foreseeable future or until maturity.
Reclassifications are made at fair value as at the reclassification date, whereby the fair value becomes the new cost or amortised cost, as applicable. Any fair value gains or losses previously recognised in the statement of comprehensive income is not reversed.
As at reporting date, the Group have not made any such reclassifications of financial assets.
(f) Financial Liabilities
Financial liabilities are initially recognised at the fair value of consideration received less directly attributable transaction costs. Subsequent to initial recognition, financial liabilities are measured at amortised cost. The Group does not have any non-derivative financial liabilities designated at fair value through profit or loss. Financial liabilities measured at amortised cost include deposits from customers, deposits from banks and debt securities issued and other borrowed funds.
Interest payables are now classified into the respective class of financial liabilities.
(g) Repurchase Agreements
Financial instruments purchased under resale agreements are instruments which the Group have purchased with a commitment to resell at future dates. The commitment to resell the instruments are reflected as an asset in the statement of financial position.
Conversely, obligations on financial instruments sold under repurchase agreements are instruments which the Group have sold from their portfolio, with a commitment to repurchase at future dates. Such financing transactions and the obligations to repurchase the instruments are reflected as a liability in the statement of financial position.

1052012 ANNUAL REPORT
Notes to the Financial Statements31 March 2012
2. SIGNIFICANT ACCOUNTING POLICIES (cont’d)
(h) Investment Properties
Investment properties are properties which are held either to earn rental income or for capital appreciation or both.
Such property is initially measured at cost, including transaction costs. Subsequent to initial recognition, investment property is carried at cost less any accumulated depreciation and any accumulated impairment. The policy for the recognition and measurement of impairment is in accordance with Note 2(j)(v).
Freehold land has unlimited useful life and therefore, is not depreciated.
Such property is derecognised when either it has been disposed and no future economic benefit is expected from its disposal. Any gain or loss on the retirement or disposal is recognised in the statement of comprehensive income in the year in which they arise.
(i) Property, Plant and Equipment and Depreciation
Property, plant and equipment are initially recorded at cost. The cost of an item of property, plant and equipment initially recognised includes its purchase price and any cost that is directly attributable to bringing the asset to the location and condition necessary for it to be capable of operating in the manner intended by management.
Subsequent costs are included in the asset’s carrying amount or recognised as a separate asset, as appropriate, only when it is probable that future economic benefits associated with the item will flow to the Group and the cost of the item can be measured reliably. The carrying amount of the replaced part is derecognised. All other repairs and maintenance are recognised as expenses in the statement of comprehensive income during the financial period in which they are incurred.
When significant parts of an item of property, plant and equipment have different useful lives, they are accounted for as separate items (major components) of property, plant and equipment.
Subsequent to initial recognition, property, plant and equipment except for freehold land are stated at cost less accumulated depreciation and accumulated impairment, if any. The policy for the recognition and measurement of impairment is in accordance with Note 2(j)(v).
Freehold land has an unlimited useful life and therefore is not depreciated. Other property, plant and equipment are depreciated on the straight-line basis to write off the cost of each asset to its residual value over the estimated useful life, summarised as follows:
Buildings 2% Office furniture and fixtures 10% Motor vehicles 10% - 16.6% Office equipment 20% Renovations 20% Computer equipment 33.3%
The residual values, useful life and depreciation method are reviewed at each financial year-end to ensure that the amount, method and period of depreciation are consistent with previous estimates and the expected pattern of consumption of the future economic benefits embodied in the items of property, plant and equipment.
An item of property, plant and equipment is derecognised upon disposal or when no future economic benefits are expected from its use or disposal. The difference between the net disposal proceeds, if any, and the net carrying amount is recognised in the statement of comprehensive income.

106 ALLIANCE FINANCIAL GROUP BERHAD (6627-X)
Notes to the Financial Statements31 March 2012
2. SIGNIFICANT ACCOUNTING POLICIES (cont’d)
(j) Impairment of Assets
The carrying amounts of the Group’s assets except for deferred tax assets, are reviewed at the end of each reporting period to determine whether there are any indications of impairment. If any such indications exist, the asset’s recoverable amount is estimated to determine the amount of impairment to be recognised. The policies on impairment of assets are summarised as follows:
(i) Loans, advances and financing
Loans, advances and financing of the Group are classified as impaired when they fulfill either of the following criteria:
(a) principal or interest or both are past due for three (3) months or more;
(b) where a loan is in arrears for less than three (3) months, the loan exhibits indications of credit weaknesses; or
(c) where an impaired loan has been rescheduled or restructured, the loan will continue to be classified as impaired until repayments based on the revised and/or restructured terms have been observed continuously for a period of six (6) months.
For the determination of impairment, the Group assesses at each reporting date whether there is objective evidence that a financial asset or a group of financial assets is impaired and impairment losses are incurred only if there is objective evidenceofimpairmentasaresultofoneormoreeventsthatoccurredaftertheinitialrecognitionoftheasset(a‘lossevent’)and that loss event (or events) has an impact on the estimated future cash flows of the financial asset or group of financial assets that can be reliably estimated.
The criteria that the Group uses to determine that there is objective evidence of an impairment include:
(a) significant financial difficulty of the issuer or obligor;
(b) a breach of contract, such as a default or delinquency in interest or principal payments;
(c) it becomes probable that the borrower will enter bankruptcy or winding up petition is served on the borrower, significant shareholder or significant guarantor;
(d) adverse Center Credit Reference Information System (“CCRIS”) findings or unfavorable industry developments for that borrower; and
(e) observable data indicating that there is a measurable decrease in the estimated future cash flows including adverse changes in the repayment behavior of the borrower or downgrade of the borrower’s credit ratings.
The Group first assesses individually whether objective evidence of impairment exists for all loans deemed to be individually significant, and individually or collectively for loans, advances and financing that are not individually significant. If it is determined that no objective evidence of impairment exists for an individually assessed loan whether significant or not, the loan is then collectively assessed for impairment. If there is objective evidence that an impairment has been incurred, the amount of the loss is measured as the difference between the asset’s carrying amount and the present value of estimated future cash flows (excluding future credit losses that have not been incurred) discounted at the financial asset’s original effective interest rate. If a loan has a variable interest rate, the discount rate for measuring any impairment is the current effective interest rate determined under the contract.
The calculation of the present value of the estimated future cash flows of a collateralised financial asset reflects the cash flows that may result from foreclosure less costs for obtaining and selling the collateral, whether or not foreclosure is probable. The carrying amount of the asset is reduced through the use of an allowance account and the amount of the loss is recognised in the statement of comprehensive income. Interest income continues to be accrued on the reduced carrying amount and is accrued using the rate of interest used to discount the future cash flows for the purposes of measuring the impairment. The interest is recognised as interest income.
For loans which are collectively assessed, the Group’s collective assessment impairment allowance is maintained at a minimum of 1.5% of total outstanding loans, net of individual assessment impairment allowance.
For margin balances of the stockbroking business, the accounts are classified as impaired when the closing market value of the counter(s) so financed has fallen below 130% of the outstanding balance, and 100% impairment allowance is made on the impaired accounts, net of collateral held, if any.
1072012 ANNUAL REPORT
Notes to the Financial Statements31 March 2012
2. SIGNIFICANT ACCOUNTING POLICIES (cont’d)
(j) Impairment of Assets (cont’d)
(ii) Financial investments held-to-maturity
For financial investments held-to-maturity in which there are objective evidence of impairment, impairment is measured as the difference between the financial instrument’s carrying amount and the present value of the estimated future cash flows discounted at the original effective interest rate. The amount of the impairment is recognised in the statement of comprehensive income.
Subsequent reversals in the impairment is recognised when the decrease can be objectively related to an event occurring after the impairment was recognised, to the extent that the financial instrument’s carrying amount does not exceed its amortised cost if no impairment had been recognised. The reversal is recognised in the statement of comprehensive income.
(iii) Financial investments available-for-sale
For financial investments available-for-sale in which there are objective evidence of impairment, the cumulative unrealised losses that had been recognised directly in equity shall be transferred from equity to the statement of comprehensive income, even though the securities have not been derecognised. The cumulative impairment is measured as the difference between the acquisition cost (net of any principal repayment and amortisation) and the current fair value, less any impairment previously recognised in the statement of comprehensive income.
In the case of quoted equity investments, a significant or prolonged decline in the fair value of the security below its cost is also considered in determining whether objective evidence of impairment exists. Where such evidence exists, the cumulative loss (measured as the difference between the acquisition cost and the current fair value, less any impairment loss previously recognised) is removed from equity and recognised in the statement of comprehensive income.
Impairment recognised on equity instruments classified as available-for-sale is not reversed subsequent to its recognition. Reversals of impairment on debt instruments classified as available-for-sale are recognised in the statement of comprehensive income if the increase in fair value can be objectively related to an event occurring after the recognition of the impairment in the statement of comprehensive income.
(iv) Goodwill/Intangible assets
Goodwill and intangible assets that have an indefinite useful life are tested annually for impairment, or more frequently if events or changes in circumstances indicate that the carrying value may be impaired. For the purpose of impairment testing, goodwill from business combinations or intangible assets are allocated to cash-generating units (“CGU”) which are expected to benefit from the synergies of the business combination or the intangible asset.
The recoverable amount is determined for each CGU based on its value in use. In assessing value in use, the estimated future cash flows are discounted to their present value using a pre-tax discount rate that reflects current market assessments of the time value of money and the risks specific to the asset. An impairment is recognised in statement of comprehensive income when the carrying amount of the CGU, including the goodwill or intangible asset, exceeds the recoverable amount of the CGU. The total impairment is allocated, first, to reduce the carrying amount of goodwill or intangible assets allocated to the CGU and then to the other assets of the CGU on a pro-rata basis.
An impairment on goodwill is not reversed in subsequent periods. An impairment for other intangible assets is reversed if, and only if, there has been a change in the estimates used to determine the intangible asset’s recoverable amount since the last impairment was recognised and such reversal is through the statement of comprehensive income to the extent that the intangible asset’s carrying amount does not exceed the carrying amount that would have been determined, net of amortisation, if no impairment had been recognised.
(v) Other assets
Other assets such as property, plant and equipment, investment properties, computer software, foreclosed properties and investments in subsidiaries and associates are reviewed for objective indications of impairment at the end of each reporting period or whenever there is any indication that these assets may be impaired. Where such indications exist, impairment is determined as the excess of the asset’s carrying value over its recoverable amount (greater of value in use or fair value less costs to sell) and is recognised in the statement of comprehensive income. An impairment for an asset is reversed if, and only if, there has been a change in the estimates used to determine the asset’s recoverable amount since the last impairment was recognised.
The carrying amount is increased to its revised recoverable amount, provided that the amount does not exceed the carrying amount that would have been determined (net of amortisation or depreciation) had no impairment been recognised for the asset in prior years. A reversal of impairment for an asset is recognised in the statement of comprehensive income.

108 ALLIANCE FINANCIAL GROUP BERHAD (6627-X)
Notes to the Financial Statements31 March 2012
2. SIGNIFICANT ACCOUNTING POLICIES (cont’d)
(k) Leases
A lease is recognised as a finance lease if it transfers substantially to the Group all the risks and rewards incidental to ownership. All leases that do not transfer substantially all the risks and rewards are classified as operating leases.
(i) Finance Leases
Assets acquired by way of hire purchase or finance leases are stated at an amount equal to the lower of their fair values and the present value of the minimum lease payments at the inception of the leases, less accumulated depreciation and impairment. The corresponding liability is included in the statement of financial position as borrowings. In calculating the present value of the minimum lease payments, the discount factor used is the interest rate implicit in the lease, when it is practicable to determine; otherwise, the Company’s incremental borrowing rate is used. Any initial direct costs are also added to the carrying amount of such assets.
Lease payments are apportioned between the finance costs and the reduction of the outstanding liability. Finance costs, which represent the difference between the total leasing commitments and the fair value of the assets acquired, are recognised in the statement of comprehensive income over the term of the relevant lease so as to produce a constant periodic rate of charge on the remaining balance of the obligations for each accounting period.
The depreciation policy for leased assets is in accordance with that for depreciable property, plant and equipment as described in Note 2(i). The policy for the recognition and measurement of impairment is in accordance with Note 2(j)(v).
(ii) Operating Leases
Operating lease payments are recognised in the statement of comprehensive income on a straight-line basis over the term of the relevant lease. The aggregate benefit of incentives provided by the lessor is recognised as a reduction of rental expenses over the lease term on a straight-line basis.
The land and buildings elements of a lease of land and buildings are considered separately for the purposes of lease classification. Leasehold land that normally has an indefinite economic life and where title is not expected to pass to the lessee by the end of the lease term is treated as an operating lease. The payment made on entering into or acquiring a leasehold land is accounted for as prepaid lease payments at the end of the reporting period. In the case of a lease of land and buildings, the prepaid lease payments or the upfront payments made are allocated, whenever necessary, between the land and buildings elements in proportion to the relative fair values for leasehold interest in the land element and buildings element of the lease at the inception of the lease. The prepaid lease payments are amortised over the lease term in accordance with the pattern of benefits provided.
(l) Bills and Acceptances Payable
Bills and acceptances payable represent the Group’s own bills and acceptances rediscounted and outstanding in the market.
(m) Equity Instruments
Ordinary shares and irredeemable convertible preference shares (“ICPS”) are classified as equity. Dividends on ordinary shares and ICPS are recognised in equity in the period in which they are declared.
The transaction costs of an equity transaction are accounted for as a deduction from equity, net of tax. Equity transaction costs comprise only those incremental external costs directly attributable to the equity transaction which would otherwise have been avoided.
(n) Subordinated Bonds
The interest-bearing instruments are recognised as liability and are recorded at face value. Interest expense are accrued based on the effective interest rate method.
(o) Interest-bearing Borrowings
Interest-bearing bank borrowings are recorded at the amount of proceeds received. All the borrowing costs are recognised as expenses in the statement of comprehensive income in the period in which they are incurred.
(p) Other Assets
Other receivables are carried at anticipated realisable values. Bad debts are written-off when identified. An estimate is made for doubtful debts based on a review of all outstanding amounts as at the end of the reporting period.

1092012 ANNUAL REPORT
Notes to the Financial Statements31 March 2012
2. SIGNIFICANT ACCOUNTING POLICIES (cont’d)
(q) Provisions
Provisions are recognised when:
- the Group has a present legal or constructive obligation as a result of past events;
- it is probable that an outflow of resources will be required to settle the obligation; and
- a reliable estimate of the amount can be made.
Where the Group expects a provision to be reimbursed (for example, under an insurance contract), the reimbursement is recognised as a separate asset but only when the reimbursement is virtually certain. Provision are not recognised for future operating losses.
Where there are a number of similar obligations, the likelihood that an outflow will be required in settlement is determined by considering the class of obligations as a whole. A provision is recognised even if the likelihood of an outflow with respect to any one item included in the same class of obligations may be small.
Provisions are measured at the present value of the expenditures expected to be required to settle the obligation using a pre-tax rate that reflects current market assessments of the time value of money and the risks specific to the obligation. The increase in the provision due to passage of time is recognised as finance cost expense.
(r) Balances Due From Clients and Brokers
In line with FRS 139, Bursa Malaysia Securities Berhad (the “Bursa”) has amended the Rules of Bursa Securities issued on 4 November 2010. In accordance with the Rules of Bursa Securities, clients’ accounts are classified as impaired accounts (previously referred to as non-performing) under the following circumstances:
Criteria for classification as impaired
Types Doubtful Bad
Contra losses When account remains outstanding for 16 to 30 calendar days from the date of contra transaction.
When the account remains outstanding for more than 30 calendar days from the date of contra transaction.
Overdue purchase contracts When the account remains outstanding from T+5 market days to 30 calendar days.
When the account remains outstanding for more than 30 calendar days.
Bad debts are written off when identified. Impairment allowances are made for balances due from clients and brokers which are considered doubtful or which have been classified as impaired, after taking into consideration collateral held by the Group and deposits of and amounts due to dealer representative in accordance with the Rules of Bursa Securities. Collective assessment allowance is made based on a certain percentage of balances due from clients and brokers (excluding outstanding purchase contracts which are not due for payment) net of individual assessment allowances already made.
(s) Revenue Recognition
Revenue is recognised to the extent that it is probable that the economic benefits associated with the transaction will flow to the Group and the amount of the revenue can be measured reliably.
(i) Recognition of Dividend Income
Dividend income from financial investments held-to-maturity, financial investments available-for-sale and investment in subsidiaries and associates are recognised when the right to receive payment is established.
(ii) Recognition of Interest and Financing Income
Interest income is recognised using effective interest rates, which is the rate that exactly discounts estimated future cash payments or receipts through the expected life of the loans or, where appropriate, a shorter period to the net carrying amount of the loan. When calculating the effective interest rate, the Group estimates cash flows considering all contractual terms of the loans but does not consider future credit losses. The calculation includes significant fees paid or received between parties to the contract that are an integral part of the effective interest rate, transaction costs and all other premiums or discounts.
Interest income is recognised in the statement of comprehensive income for all interest-bearing assets on an accrual basis. Interest income includes the amortisation of premium or accretion of discount. Income from the Islamic banking business is recognised on an accrual basis in accordance with the Shariah principles.

110 ALLIANCE FINANCIAL GROUP BERHAD (6627-X)
Notes to the Financial Statements31 March 2012
2. SIGNIFICANT ACCOUNTING POLICIES (cont’d)
(s) Revenue Recognition (cont’d)
(iii) Recognition of Fees and Other Income
Loan arrangement fees and commissions, management and participation fees and underwriting commissions are recognised as income when all conditions precedent are fulfilled.
Commitment, guarantee and portfolio management fees which are material are recognised as income based on time apportionment basis.
Corporate advisory fees are recognised as income on the completion of each stage of the assignment.
Brokerage charged to clients is recognised on the day when the contracts are executed.
(t) Recognition of Interest and Financing Expenses
Interest expense and attributable profit (on activities relating to Islamic banking business) on deposits and borrowings of the Group are recognised on an accrual basis.
(u) Derivative Financial Instruments and Hedging Activities
Derivatives are initially recognised at fair value on the date a derivative contract is entered into and are subsequently re-measured at their fair value.
The method of recognising the resulting gain or loss depends on whether the derivative is designated as a hedging instrument, and the nature of the item being hedged. The Group designate derivatives that qualify for hedge accounting as either:
(i) Hedges of the fair value of recognised assets or liabilities or a firm commitment (fair value hedge);
(ii) Hedges of a particular risk associated with a recognised asset or liability or a highly probable forecast transaction (cash flow hedge); or
(iii) Hedges of a net investment in a foreign operation (net investment hedge).
The Group documents at the inception of the transaction the relationship between hedging instruments and hedged items, as well as its risk management objectives and strategy for undertaking various hedging transactions. The Group also documents its assessment, both at hedge inception and on an ongoing basis, of whether the derivatives that are used in hedging transactions are highly effective in offsetting changes in fair values or cash flows of hedged items.
(i) Fair value hedge
Changes in the fair value of derivatives that are designated and qualify as fair value hedges are recorded in statement of comprehensive income, together with any changes in the fair value of the hedged asset or liability that are attributable to the hedged risk.
If the hedge no longer meets the criteria for hedge accounting, the adjustment to the carrying amount of a hedged item for which the effective interest method is used is amortised to profit or loss over the period to maturity.
(ii) Cash flow hedge
The effective portion of changes in the fair value of derivatives that are designated and qualified as cash flow hedges is recognised in other comprehensive income. The gain or loss relating to the ineffective portion is recognised immediately in statement of comprehensive income.
When a hedging instrument expires or is sold, or when a hedge no longer meets the criteria for hedge accounting, any cumulative gain or loss existing in equity at that time remains in statement of changes in equity and is recognised when the forecast transaction is ultimately recognised in statement of comprehensive income. When a forecast transaction is no longer expected to occur, the cumulative gain or loss that was reported in statement of changes in equity is immediately transferred to statement of comprehensive income.

1112012 ANNUAL REPORT
Notes to the Financial Statements31 March 2012
2. SIGNIFICANT ACCOUNTING POLICIES (cont’d)
(u) Derivative Financial Instruments and Hedging Activities (cont’d)
(iii) Net investment hedge
Hedges of net investments in foreign operations are accounted for similarly to cash flow hedges. Any gain or loss on the hedging instrument relating to the effective portion of the hedge is recognised in other comprehensive income. The gain or loss relating to the ineffective portion is recognised immediately in statement of comprehensive income.
Gains and losses accumulated in other comprehensive income are included in statement of comprehensive income when the foreign operation is partially disposed of or sold.
(iv) Derivatives that do not qualify for hedge accounting
Certain derivatives instruments do not qualify for hedge accounting. Changes in the fair value of any derivative instrument that does not qualify for hedge accounting are recognised immediately in the statement of comprehensive income.
(v) Foreign Currency Translations
Transactions in foreign currencies are initially recorded in Ringgit Malaysia at rates of exchange ruling at the date of the transaction. At the end of each reporting period, foreign currency monetary items are translated into Ringgit Malaysia at exchange rates ruling at that date.
All exchange rate differences are taken to the statement of comprehensive income.
The financial statements are presented in Ringgit Malaysia, which is also the Group’s and the Company’s primary functional currency.
(w) Income Tax
Income tax on the profit or loss for the year comprises current and deferred tax. Current tax is the expected amount of income taxes payable in respect of the taxable profit for the year and is measured using the tax rates that have been enacted at the end of reporting date.
Deferred tax is provided for, using the liability method, on temporary differences at the end of the reporting date between the tax bases of assets and liabilities and their carrying amounts in the financial statements. In principle, deferred tax liabilities are recognised for all taxable temporary differences and deferred tax assets are recognised for all deductible temporary differences, unused tax losses and unused tax credits to the extent that it is probable that taxable profit will be available against which the deductible temporary differences, unused tax losses and unused tax credits can be utilised. Deferred tax is not recognised if the temporary difference arises from goodwill or negative goodwill or from the initial recognition of an asset or liability in a transaction which is not a business combination and at the time of the transaction, affects neither accounting profit nor taxable profit.
Deferred tax is measured at the tax rates that are expected to apply in the period when the asset is realised or the liability is settled, based on tax rates that have been enacted or substantively enacted at the end of the reporting period. Deferred tax is recognised as income or an expense in the statement of comprehensive income for the period, except when it arises from a transaction which is recognised directly in other comprehensive income or directly in equity, in which case the deferred tax is also charged or credited to other comprehensive income or to equity, or when it arises from a business combination that is an acquisition, in which case the deferred tax is included in the resulting goodwill.
(x) Foreclosed Properties
Foreclosed properties are stated at the lower of carrying amount and fair value less costs to sell.
(y) Cash and Cash Equivalents
Cash and cash equivalents as stated in the statements of cash flow comprise cash and bank balances and short-term deposits maturity within one month that are readily convertible into cash with insignificant risk of changes in value.
(z) Zakat
This represents Islamic business zakat. It is an obligatory amount payable by an Islamic banking subsidiary to comply with the Shariah principles.

112 ALLIANCE FINANCIAL GROUP BERHAD (6627-X)
Notes to the Financial Statements31 March 2012
2. SIGNIFICANT ACCOUNTING POLICIES (cont’d)
(aa) Employee Benefits
(i) Short-Term Benefits
Wages, salaries, bonuses and social security contributions are recognised as an expense in the year in which the associated services are rendered by employees of the Group. Short-term accumulating compensated absences such as paid annual leave are recognised when services are rendered by employees that increase their entitlement to future compensated absences, and short-term non-accumulating compensated absences such as sick leave are recognised when the absences occur.
(ii) Defined Contribution Plans
Defined contribution plans are post-employment benefit plans under which the Group pays fixed contributions into separate entities or funds and will have no legal or constructive obligations to pay further contributions if any of the funds do not hold sufficient assets to pay all employee benefits relating to employee services in the current and preceding financial years. Such contributions are recognised as an expense in the statement of comprehensive income as incurred. As required by law, companies in Malaysia make contributions to the Employees Provident Fund (“EPF”).
(iii) Equity Compensation Benefits
The ESS comprise the Share Option Plan, the Share Grant Plan and the Share Save Plan. The ESS are an equity-settled, share-based compensation plans, in which the Group’s Directors and employees are granted or are allowed to acquire ordinary shares of the Company.
The total fair value of the share options/share grants offered/awarded to the eligible Directors and employees are recognised as an employee cost with a corresponding increase in the share scheme reserve within equity over the vesting period and taking into account the probability that the scheme will vest. The fair value of the shares options/share grants are measured at grant date, taking into account, if any, the market vesting conditions upon which the share options/share grants were offered/awarded but excluding the impact of any non-market vesting conditions. Non-market vesting conditions are included in assumptions about the number of share options/share grants that are expected to become exercisable/to vest.
At the end of each reporting period, the Group revises its estimates of the number of share options/share grants that are expected to become exercisable/to vest. It recognises the impact of the revision of original estimates, if any, in the statement of comprehensive income, and a corresponding adjustment to equity over the remaining vesting period. The equity amount is recognised in the share scheme reserve until the share options/share grants are exercised/vested.
The proceeds received net of any directly attributable transaction costs are credited to equity when the options are exercised.
(ab) Contingent Liabilities and Contingent Assets
The Group does not recognise a contingent liability but discloses its existence in the financial statements. A contingent liability is a possible obligation that arises from past events whose existence will be confirmed by the occurrence or non-occurrence of one or more uncertain future events beyond the control of the Group or a present obligation that is not recognised because it is not probable that an outflow of resources will be required to settle the obligation. A contingent liability also arises in the extremely rare case where there is a liability that cannot be recognised because it cannot be measured reliably.
A contingent asset is a possible asset that arises from past events whose existence will be confirmed by the occurrence or non-occurrence of one or more uncertain future events beyond the control of the Group. The Group does not recognise contingent assets but discloses its existence where inflows of economic benefits are probable, but not virtually certain.
(ac) Financial Guarantee Contracts
Financial guarantee contracts that require the issuer to make specified payments to reimburse the holder for a loss it incurs because a specified debtor fails to make payments when due, in accordance with the terms of a debt instrument. Such financial guarantees are given to banks, financial instituitions and other bodies on behalf of customers to secure loans, overdraft and other banking facilities.

1132012 ANNUAL REPORT
Notes to the Financial Statements31 March 2012
2. SIGNIFICANT ACCOUNTING POLICIES (cont’d)
(ac) Financial Guarantee Contracts (cont’d)
Financial guarantees are initially recognised in the financial statements at fair value on the date the guarantee was given. The fair value of a financial guarantee at the time of signature is zero because all guarantees are agreed on arm’s length terms and the value of the premium agreed corresponds to the value of the guarantee obligation. No receivable for the future premiums is recognised. Subsequent to initial recognition, the Group’s liabilities under such guarantees are measured at the higher of the initial amount, less amortisationoffeesrecognisedinaccordancewithFRS137‘’Provision,ContingentLiabilitiesandContingentAssets’’,andthebestestimate of the amount required to settle the guarantee. These estimates are determined based on experience of similar transactions and history of past losses, supplemented by the judgement of management. The fee income earned is recognised on a straight-line basis over the life of the guarantee. Any increase in the liability relating to guarantees is reported in the profit or loss.
(ad) Segment Reporting
Operating segments are reported in a manner consistent with the internal reporting provided to the chief operating decision-maker. The chief operating decision-maker, who is responsible for allocating resources and assessing performance of the operating segments.
(ae) Non-current Assets Held for Sale
Non-current assets are classified as assets held for sale and stated at the lower of carrying amount and fair value less costs to sell if their carrying amount is recovered principally through a sale transaction rather than through continuing use.
3. CASH AND SHORT-TERM FUNDS Group Company 2012 2011 2012 2011 RM’000 RM’000 RM’000 RM’000
Cash and balances with banks and other financial institutions 488,971 501,618 9 32
Money at call and deposit placements maturing within one month 1,385,362 412,420 6,492 46,826
1,874,333 914,038 6,501 46,858
Note:
(i) Included in the cash and short-term funds of the Group are monies held in trust by a subsidiary amounting to RM72,498,000 (2011: RM87,504,000).
(ii) There is an amount of RM325,000 (2011: RM44,465,000) being the deposits placement by the Company with its subsidiaries.
4. DEPOSITS AND PLACEMENTS WITH BANKS AND OTHER FINANCIAL INSTITUTIONS Group Company 2012 2011 2012 2011 RM’000 RM’000 RM’000 RM’000
Licensed banks 93,438 50,193 – 605,700Licensed investment banks 4,275 50,035 19,315 –
97,713 100,228 19,315 605,700
Note:
(i) The deposits of the Company with maturity more than one month amounting to RM NIL (2011: RM600,000,000) are placed with its subsidiaries.
(ii) An amount of RM4,264,000 (2011: RM2,298,000) being a bank account maintained by the Company for PB Trustee Services Berhad pursuant to the Company’s ESS.

114 ALLIANCE FINANCIAL GROUP BERHAD (6627-X)
Notes to the Financial Statements31 March 2012
5. BALANCES DUE FROM CLIENTS AND BROKERS Group 2012 2011 RM’000 RM’000
Due from clients 58,060 96,318Due from brokers 4,900 –
62,960 96,318Less: Allowance for other losses (1,262) (15,799)
61,698 80,519
These represent amounts receivable by Alliance Investment Bank Berhad (“AIBB”) from non-margin clients and outstanding contracts entered into on behalf of clients where settlement via the Bursa Malaysia Securities Clearing Sdn. Bhd. has yet to be made.
AIBB’s normal trade credit terms for non-margin clients is three (3) market days in accordance with the Bursa Malaysia Securities Berhad’s (“Bursa”) Fixed Delivery and Settlement System (“FDSS”) trading rules.
Included in the balances due from clients and brokers are impaired accounts, as follows:
Group 2012 2011 RM’000 RM’000
Classified as doubtful 165 976Classified as bad 1,420 15,856
1,585 16,832
The movements in allowance for other losses are as follows:
Group 2012 2011 RM’000 RM’000
At beginning of year 15,799 16,482Allowance made during the year 1,536 2,214Reversal of allowance (1,623) (2,897)Amount written off (14,450) –
1,262 15,799
6. FINANCIAL ASSETS HELD-FOR-TRADING Group 2012 2011 RM’000 RM’000
At fair value
Money market instruments:Bank Negara Malaysia bills 1,371,696 1,848,299Malaysian Government securities 20,053 –Malaysian Government investment certificates 100,246 59,951Malaysian Government treasury bills – 30,000
1,491,995 1,938,250

1152012 ANNUAL REPORT
Notes to the Financial Statements31 March 2012
7. FINANCIAL INVESTMENTS AVAILABLE-FOR-SALE Group 2012 2011 RM’000 RM’000
At fair value
Money market instruments:Malaysian Government securities 2,316,772 3,244,713Malaysian Government investment certificates 1,833,967 764,371Cagamas bonds 35,254 35,396Negotiable instruments of deposits 884,535 1,741,201Bankers’ acceptances 1,944,074 1,388,637
Quoted securities in Malaysia:Shares 4,212 3,875Debt securities 4,768 7,818
Unquoted securities:Shares 135,888 117,587Debt securities and medium term notes 1,963,731 1,956,342
9,123,201 9,259,940
8. FINANCIAL INVESTMENTS HELD-TO-MATURITY Group 2012 2011 RM’000 RM’000
At amortised cost
Money market instruments:Malaysian Government securities 328,639 804,820Malaysian Government investment certificates 439,463 105,624
At cost
Quoted securities in Malaysia:Debt securities – 4,902
Unquoted securities:Debt securities 74,283 116,711
842,385 1,032,057Accumulated impairment (47,129) (91,331)
795,256 940,726
The table below shows the movements in accumulated impairment during the financial year for the Group:
Group 2012 2011 RM’000 RM’000
At beginning of year 91,331 94,822Reclassified to financial investments available-for-sale due
to conversion of bond into equity instrument (4,902) –Write-back during the year (39,300) (3,491)
At end of year 47,129 91,331

116 ALLIANCE FINANCIAL GROUP BERHAD (6627-X)
Notes to the Financial Statements31 March 2012
9. DERIVATIVE FINANCIAL ASSETS/(LIABILITIES) Derivative financial instruments are financial instruments whose values change in response to changes in prices or rates (such as foreign
exchange rates, interest rates and security prices) of the underlying instruments. These instruments allow the Group and the banking customers to transfer, modify or reduce their foreign exchange and interest rate risk hedge relationships. The Group also transacts in these instruments for proprietary trading purposes. The risks associated with the use of derivative financial instruments, as well as management’s policy for controlling these risks are set out in Note 43.
The table below shows the Group’s derivative financial instruments as at the end of the reporting period. The contractual or underlying notional amounts of these derivative financial instruments and their corresponding gross positive (derivative financial asset) and gross negative (derivative financial liability) fair values as at the end of the reporting period are analysed below.
2012 2011 Contract/ Fair Value Contract/ Fair Value Notional Notional Amount Assets Liabilities Amount Assets LiabilitiesGroup RM’000 RM’000 RM’000 RM’000 RM’000 RM’000
Foreign exchange contracts and commodity contracts:
- Currency forwards 859,253 4,792 (6,243) 442,706 1,217 (7,713) - Currency swaps 1,690,284 9,774 (8,784) 1,819,102 18,692 (18,042) - Currency spots 258,209 185 (150) 76,047 70 (37) - Currency options 122,204 467 (324) 24,473 90 (57) - Gold options 217,538 2,512 (1,102) 482,299 2,499 (2,499)
Interest rate related contracts: - Interest rate swaps 2,106,781 5,982 (9,215) 2,112,000 9,479 (4,999)
Hedging Derivatives Interest rate related contracts: - Interest rate swaps 14,115 – (423) – – –
Total derivative assets/(liabilities) 5,268,384 23,712 (26,241) 4,956,627 32,047 (33,347)
The Group use fair value hedges to protect against the changes in fair value of financial assets and financial liabilities due to movements in market interest rates.
During the financial year, the Group use interest rate swaps to hedge against interest rate risk of structured deposits. There was no ineffectiveness to be recorded from their fair value hedge.

1172012 ANNUAL REPORT
Notes to the Financial Statements31 March 2012
10. LOANS, ADVANCES AND FINANCING Group 2012 2011 RM’000 RM’000
Overdrafts 1,853,950 1,753,908Term loans/financing- Housing loans/financing 9,259,885 8,325,550- Syndicated term loans/financing 472,949 287,171- Hire purchase receivables 654,336 784,046- Other term loans/financing 7,715,570 6,310,426Bills receivables 308,763 179,607Trust receipts 207,515 176,527Claims on customers under acceptance credits 2,337,986 2,202,863Staff loans [include RM92,000 loans to Directors of banking subsidiary (2011: RM121,000)] 54,567 60,938Credit/charge card receivables 623,563 663,059Revolving credits 1,043,680 1,347,748Other loans 451,282 347,518
Gross loans, advances and financing 24,984,046 22,439,361Add: Sales commissions and handling fees 28,523 24,969Less: Allowance for impaired loans, advances and financing - Individual assessment allowance (266,349) (328,375) - Collective assessment allowance (386,017) (339,636)
Total net loans, advances and financing 24,360,203 21,796,319
(i) By maturity structure:
Within one year 7,023,573 6,868,094 One year to three years 822,931 771,372 Three years to five years 1,253,470 1,389,244 Over five years 15,884,072 13,410,651
Gross loans, advances and financing 24,984,046 22,439,361
(ii) By type of customer:
Domestic non-bank financial institutions- Stockbroking companies – 20,002- Others 207,162 187,410Domestic business enterprises- Small and medium enterprises 5,472,374 4,784,192- Others 4,961,344 4,531,660Government and statutory bodies 12,618 18,224Individuals 13,457,860 12,349,218Other domestic entities 247,679 14,671Foreign entities 625,009 533,984
Gross loans, advances and financing 24,984,046 22,439,361
(iii) By interest/profit rate sensitivity:
Fixed rate- Housing loans/financing 90,812 107,669- Hire purchase receivables 654,337 784,046- Other fixed rate loans/financing 1,997,225 2,207,047Variable rate- Base lending rate plus 16,737,766 14,989,061- Cost plus 5,200,601 4,120,772- Other variable rates 303,305 230,766
Gross loans, advances and financing 24,984,046 22,439,361

118 ALLIANCE FINANCIAL GROUP BERHAD (6627-X)
Notes to the Financial Statements31 March 2012
10. LOANS, ADVANCES AND FINANCING (cont’d) Group 2012 2011 RM’000 RM’000
(iv) By economic purposes:
Purchase of securities 456,010 354,975 Purchase of transport vehicles 561,763 703,969 Purchase of landed property 13,100,915 11,514,820
of which: - Residential 9,750,258 8,671,706 - Non-residential 3,350,657 2,843,114
Purchase of fixed assets excluding land and buildings 117,110 99,836 Personal use 2,146,045 2,093,967 Credit card 623,563 663,059 Construction 249,709 253,621 Merger and acquisition 207,265 – Working capital 6,327,613 6,116,583 Others 1,194,053 638,531
Gross loans, advances and financing 24,984,046 22,439,361
(v) By geographical distribution:
Northern region 1,911,286 1,882,761 Central region 18,825,748 16,442,221 Southern region 2,100,061 2,014,167 East Malaysia region 2,146,951 2,100,212
Gross loans, advances and financing 24,984,046 22,439,361
(vi) Movements in impaired loans, advances and financing (“impaired loans”) are as follows:
At beginning of year 741,324 843,866 Impaired during the year 441,439 564,613 Reclassified as non-impaired during the year (361,159) (328,118) Recoveries (106,986) (190,022) Amount written off (113,483) (149,015)
At end of year 601,135 741,324
Gross impaired loans as % of gross loans, advances and financing 2.4% 3.3%
(vii) Movements in the allowance for impaired loans are as follows:
Individual assessment allowance At beginning of year 328,375 389,578 Allowance made during the year (net) 43,363 87,812 Amount written off (105,389) (149,015)
At end of year 266,349 328,375
Collective assessment allowance At beginning of year 339,636 323,644
Allowance made during the year (net) 46,381 15,992
At end of year 386,017 339,636
As % of gross loans, advances and financing less individual assessment allowance 1.6% 1.5%

1192012 ANNUAL REPORT
Notes to the Financial Statements31 March 2012
10. LOANS, ADVANCES AND FINANCING (cont’d) Group 2012 2011 RM’000 RM’000
(viii) Impaired loans analysed by economic purposes are as follows:
Purchase of securities 5,432 10,268 Purchase of transport vehicles 5,652 8,959 Purchase of landed property 251,134 283,410
of which: - Residential 180,614 209,057 - Non-residential 70,520 74,353
Purchase of fixed assets excluding land and buildings 190 182 Personal use 29,955 37,151 Credit card 9,908 12,694 Construction 11,869 12,777 Working capital 245,777 315,987 Others 41,218 59,896
601,135 741,324
(ix) Impaired loans by geographical distribution:
Northern region 135,319 104,487 Central region 358,099 500,546 Southern region 50,698 68,965 East Malaysia region 57,019 67,326
601,135 741,324
11. OTHER ASSETS Group Company 2012 2011 2012 2011 RM’000 RM’000 RM’000 RM’000
Other receivables, deposits and prepayments [Note (a)] 100,059 103,113 250 208Trade receivables 2,514 2,190 – –Foreclosed properties – 4,200 – –Amounts due from subsidiaries [Note (b)] – – 2,327 1,349
102,573 109,503 2,577 1,557Less: Allowance for other losses [Note (c)] (24,416) (21,882) (2,308) (1,338)
78,157 87,621 269 219
Note:
(a) Other receivables, deposits and prepayments
Included in other receivables, deposits and prepayments of the Group is an amount of RM22,044,000 (2011: RM25,134,000) being the principal balance of housing loans and hire purchase loans acquired by the banking subsidiary from a state owned entity and which have been sold to Cagamas Berhad, with recourse obligations.
(b) Amounts due from subsidiaries
Company 2012 2011 RM’000 RM’000
Non-interest bearing 2,327 1,349 Less: Allowance for impairment losses (2,308) (1,338)
19 11
The amounts due from subsidiaries of RM2,327,000 (2011: RM1,349,000) are unsecured, interest-free and repayable upon demand.

120 ALLIANCE FINANCIAL GROUP BERHAD (6627-X)
Notes to the Financial Statements31 March 2012
11. OTHER ASSETS (cont’d)
(c) Movements in allowance for other losses of the Group and the Company:
Group Company 2012 2011 2012 2011 RM’000 RM’000 RM’000 RM’000
At beginning of year 21,882 21,853 1,338 696 Allowance net of write-back 2,534 29 970 642
At end of year 24,416 21,882 2,308 1,338
12. STATUTORY DEPOSITS Statutory deposits comprise the following:
(a) Non-interest bearing statutory deposits of RM1,162,983,000 (2011: RM291,008,000) relating to the banking subsidiaries, maintained with Bank Negara Malaysia in compliance with Section 26(2)(c) of the Central Bank of Malaysia Act, 2009, the amounts of which are determined as a set percentage of total eligible liabilities.
(b) Interest bearing statutory deposits of RM100,000 (2011: RM100,000) relating to a subsidiary, Alliance Trustee Berhad which is maintained with the Accountant-General in compliance with Section 3(f) of the Trust Companies Act, 1949.
13. INVESTMENTS IN SUBSIDIARIES Company 2012 2011 RM’000 RM’000
Unquoted shares, at cost At beginning of year 1,810,438 1,817,638 Liquidation of a subsidiary – (7,200)
1,810,438 1,810,438 Employees’ Share Scheme [Note (a)] 14,360 14,344
1,824,798 1,824,782 Less: Accumulated impairment (47,293) (47,293)
At end of year 1,777,505 1,777,489
Note:
(a) This amount is in respect of the services rendered by the employees of the Company’s subsidiaries, pursuant to the Employees’ Share Scheme.

1212012 ANNUAL REPORT
Notes to the Financial Statements31 March 2012
13. INVESTMENTS IN SUBSIDIARIES (cont’d)
Details of the subsidiaries, which are incorporated in Malaysia, are as follows:
Name Principal activities
Effective equity interest
2012 2011 % %
Subsidiaries of the Company
Alliance Bank Malaysia Berhad Banking and finance business and the provision of related financial services
100 100
Hijauan Setiu Sdn. Bhd. Investment holding 100 100Setiu Integrated Resort Sdn. Bhd. Investment holding 100 100Pridunia Sdn. Bhd. Dormant 100 100Alliance Trustee Berhad Trustee services 100 100 Kota Indrapura Development Corporation Berhad Property holding 100 100
Subsidiaries of Alliance Bank Malaysia Berhad
Alliance Investment Bank Berhad Investment banking business including Islamic banking, provision of stockbroking services and related financial services
100 100
Alliance Islamic Bank Berhad Islamic banking and the provision of related financial services
100 100
Alliance Direct Marketing Sdn. Bhd. Dealing in sales and distribution of consumer and commercial banking products
100 100
AllianceGroup Nominees (Asing) Sdn. Bhd. Nominee services 100 100 AllianceGroup Nominees (Tempatan) Sdn. Bhd. Nominee services 100 100Alliance Investment Management Berhad Management of unit trusts funds, provision of
fund management and investment advisory services70 70
AllianceGroup Properties Sdn. Bhd. Liquidated – 100
Subsidiaries of Alliance Investment Bank Berhad
Alliance Research Sdn. Bhd. Investment advisory 100 100AIBB Nominees (Tempatan) Sdn. Bhd. Nominee services 100 100AIBB Nominees (Asing) Sdn. Bhd. Nominee services 100 100KLCS Sdn. Bhd. Dormant 100 100Alliance Investment Futures Sdn. Bhd. Dormant 100 100Rothputra Nominees (Tempatan) Sdn. Bhd.
(under members' voluntary winding up)Dormant 100 100
KLCity Ventures Sdn. Bhd. Liquidated – 100
KLCS Asset Management Sdn. Bhd. Liquidated – 100
KLCity Unit Trust Bhd. Liquidated – 94.94
Unincorporated trust for ESS* Special purpose vehicle for ESS – –
* Deemed subsidiary pursuant to IC 112 – Consolidation: Special Purpose Entities

122 ALLIANCE FINANCIAL GROUP BERHAD (6627-X)
Notes to the Financial Statements31 March 2012
14. INVESTMENT IN ASSOCIATE Group 2012 2011 RM’000 RM’000
Unquoted shares
At cost 30,000 30,000Share of post acquisition losses (3,448) (1,470)
26,552 28,530
Represented by:Share of net tangible assets 26,552 28,530
Details of the associate, which is incorporated in Malaysia, is as follows:
Name Principal activities Effective equity interest2012 2011
% %
AIA AFG Takaful Berhad Offering and providing of Takaful products and services
30 30
The summarised financial information of the associate is as follows:
2012 2011 RM’000 RM’000
Assets and Liabilities Current assets 11,968 207 Non-current assets 78,780 99,647
90,748 99,854
Current liabilities 2,242 4,665
2,242 4,665
ResultsRevenue 9,812 1,206Loss for the year (6,594) (4,810)
15. INVESTMENT PROPERTY Group 2012 2011 RM’000 RM’000
Freehold land, at cost 23,114 23,114Development costs 8,943 8,943
32,057 32,057
Accumulated impairment: At beginning/end of year (4,309) (4,309)
27,748 27,748
The fair value of the freehold land of RM34,758,000 (2011: RM34,758,000) is derived based on an independent professional valuation using the open market value on a direct comparison basis.
The investment property incurred direct expenses amounting to RM286,412 (2011: RM334,947) for the current financial year.

1232012 ANNUAL REPORT
Note
s to
the
Fina
ncia
l Sta
tem
ents
31 M
arch
201
2
16.
PROP
ERTY
, PLA
NT A
ND E
QUIP
MEN
T
Leas
ehol
d la
nd
Le
ss
Offic
e
Free
hold
50
yea
rs
than
eq
uipm
ent
Com
pute
r M
otor
land
or
mor
e 50
yea
rs
Build
ings
R
enov
atio
ns
and
furn
iture
eq
uipm
ent
vehi
cles
To
tal
Grou
p
RM’0
00
RM
’000
RM
’000
R
M’0
00
RM’0
00
RM
’000
R
M’0
00
RM
’000
RM
’000
2012
Cost
At b
egin
ning
of y
ear
2,96
2 12
,567
1,
850
50,3
43
113,
212
65,7
24
137,
887
2,80
9 38
7,35
4Ad
ditio
ns
– –
– –
8,85
6 6,
886
6,02
0 95
8 22
,720
Disp
osal
s –
– –
– (5
1)
(409
) (9
7)
(981
) (1
,538
)W
ritte
n of
f –
– –
– (6
,004
) (3
,042
) (1
5,18
6)
(5)
(24,
237)
Tran
sfer
–
(530
) 53
0 –
– –
– –
–Re
class
ified
to n
on-c
urre
nt a
sset
s he
ld fo
r sal
e [N
ote
53]
(1,0
09)
– (5
30)
(7,1
43)
– –
– –
(8,6
82)
At e
nd o
f yea
r 1,
953
12,0
37
1,85
0 43
,200
11
6,01
3 69
,159
12
8,62
4 2,
781
375,
617
Accu
mul
ated
Dep
reci
atio
nAt
beg
inni
ng o
f yea
r –
2,62
1 81
4 15
,792
80
,054
49
,371
12
8,98
2 92
7 27
8,56
1Ch
arge
for t
he y
ear
– 11
0 27
84
6 15
,144
6,
782
6,21
1 25
4 29
,374
Disp
osal
s –
– –
– (3
8)
(376
) (9
6)
(458
) (9
68)
Writ
ten
off
– –
– –
(4,0
89)
(2,9
22)
(15,
175)
(5
) (2
2,19
1)Tr
ansf
er
– (1
71)
171
– –
– –
– –
Recla
ssifi
ed to
non
-cur
rent
ass
ets
held
for s
ale
[Not
e 53
] –
– (1
78)
(4,5
42)
– –
– –
(4,7
20)
At e
nd o
f yea
r –
2,56
0 83
4 12
,096
91
,071
52
,855
11
9,92
2 71
8 28
0,05
6
Accu
mul
ated
Impa
irmen
tAt
beg
inni
ng o
f yea
r –
– –
3,95
6 –
– –
– 3,
956
Char
ge fo
r the
yea
r –
– –
1,46
0 –
– –
– 1,
460
Recla
ssifi
ed to
non
-cur
rent
ass
ets
held
for s
ale
[Not
e 53
] –
– –
(148
) –
– –
– (1
48)
At e
nd o
f yea
r –
– –
5,26
8 –
– –
– 5,
268
Net C
arry
ing
Amou
nt
1,95
3 9,
477
1,01
6 25
,836
24
,942
16
,304
8,
702
2,06
3 90
,293

124 ALLIANCE FINANCIAL GROUP BERHAD (6627-X)
Note
s to
the
Fina
ncia
l Sta
tem
ents
31 M
arch
201
2
16.
PROP
ERTY
, PLA
NT A
ND E
QUIP
MEN
T (c
ont’d
)
Leas
ehol
d la
nd
Le
ss
Offic
e
Free
hold
50
yea
rs
than
eq
uipm
ent
Com
pute
r M
otor
land
or
mor
e 50
yea
rs
Build
ings
R
enov
atio
ns
and
furn
iture
eq
uipm
ent
vehi
cles
To
tal
Grou
p
RM’0
00
RM
’000
RM
’000
R
M’0
00
RM’0
00
RM
’000
R
M’0
00
RM
’000
RM
’000
2011
Cost
At b
egin
ning
of y
ear
2,96
2 11
,767
2,
650
50,3
43
115,
910
72,6
53
131,
195
3,11
5 39
0,59
5Ad
ditio
ns
– –
– –
4,28
7 2,
676
7,26
5 65
4 14
,882
Disp
osal
s –
– –
– (1
,477
) (3
,983
) (1
93)
(955
) (6
,608
)W
ritte
n of
f –
– –
– (5
,508
) (5
,622
) (3
80)
(5)
(11,
515)
Tran
sfer
–
800
(800
) –
– –
– –
–
At e
nd o
f yea
r 2,
962
12,5
67
1,85
0 50
,343
11
3,21
2 65
,724
13
7,88
7 2,
809
387,
354
Accu
mul
ated
Dep
reci
atio
nAt
beg
inni
ng o
f yea
r –
2,78
1 51
7 14
,805
67
,311
45
,013
11
9,95
5 1,
164
251,
546
Char
ge fo
r the
yea
r –
117
20
987
16,8
87
11,7
26
9,54
0 31
5 39
,592
Disp
osal
s –
– –
– (1
16)
(3,6
65)
(133
) (5
47)
(4,4
61)
Writ
ten
off
– –
– –
(4,0
28)
(3,7
03)
(380
) (5
) (8
,116
)Tr
ansf
er
– (2
77)
277
– –
– –
– –
At e
nd o
f yea
r –
2,62
1
814
15,7
92
80,0
54
49,3
71
128,
982
927
278,
561
Accu
mul
ated
Impa
irmen
tAt
beg
inni
ng/e
nd o
f yea
r –
– –
3,95
6 –
– –
– 3,
956
Net C
arry
ing
Amou
nt
2,96
2 9,
946
1,03
6 30
,595
33
,158
16
,353
8,
905
1,88
2 10
4,83
7

1252012 ANNUAL REPORT
Notes to the Financial Statements31 March 2012
16. PROPERTY, PLANT AND EQUIPMENT (cont’d)
Office equipment Computer and Motor equipment furniture vehicles Renovations Total RM’000 RM’000 RM’000 RM’000 RM’000Company
2012
CostAt beginning of year 276 554 396 599 1,825Additions – – 500 36 536Disposal – – (396) – (396)
At end of year 276 554 500 635 1,965
Accumulated DepreciationAt beginning of year 276 515 165 584 1,540Charge for the year – 9 46 48 103Disposal – – (194) – (194)
At end of year 276 524 17 632 1,449
Net Carrying Amount – 30 483 3 516
2011
CostAt beginning/end of year 276 554 396 599 1,825
Accumulated DepreciationAt beginning of year 269 496 133 566 1,464Charge for the year 7 19 32 18 76
At end of year 276 515 165 584 1,540
Net Carrying Amount – 39 231 15 285
17. INTANGIBLE ASSETS Group 2012 2011 RM’000 RM’000
Goodwill
CostAt beginning/end of year 304,149 304,149
Accumulated Impairment:At beginning/end of year (2,084) (2,084)
Net Carrying Amount 302,065 302,065
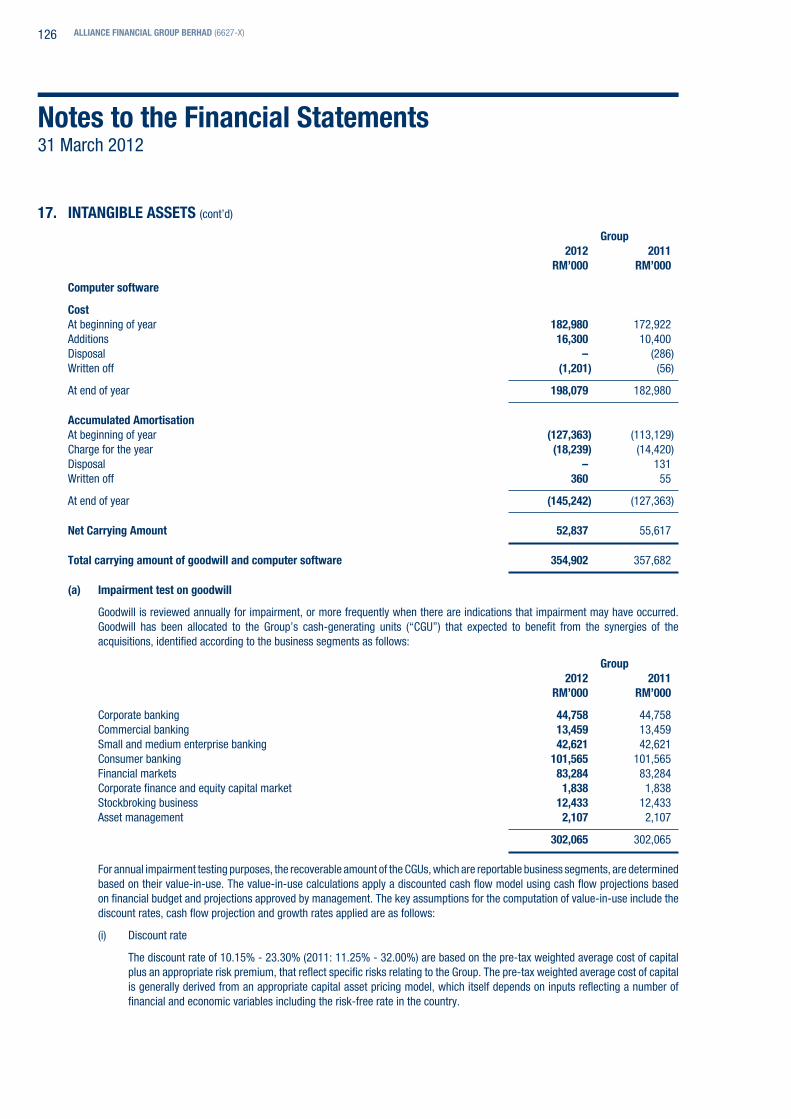
126 ALLIANCE FINANCIAL GROUP BERHAD (6627-X)
Notes to the Financial Statements31 March 2012
17. INTANGIBLE ASSETS (cont’d)
Group 2012 2011 RM’000 RM’000
Computer software
CostAt beginning of year 182,980 172,922Additions 16,300 10,400Disposal – (286)Written off (1,201) (56)
At end of year 198,079 182,980
Accumulated Amortisation At beginning of year (127,363) (113,129)Charge for the year (18,239) (14,420)Disposal – 131Written off 360 55
At end of year (145,242) (127,363)
Net Carrying Amount 52,837 55,617
Total carrying amount of goodwill and computer software 354,902 357,682
(a) Impairment test on goodwill
Goodwill is reviewed annually for impairment, or more frequently when there are indications that impairment may have occurred. Goodwill has been allocated to the Group’s cash-generating units (“CGU”) that expected to benefit from the synergies of the acquisitions, identified according to the business segments as follows:
Group 2012 2011 RM’000 RM’000
Corporate banking 44,758 44,758 Commercial banking 13,459 13,459 Small and medium enterprise banking 42,621 42,621
Consumer banking 101,565 101,565 Financial markets 83,284 83,284 Corporate finance and equity capital market 1,838 1,838 Stockbroking business 12,433 12,433 Asset management 2,107 2,107
302,065 302,065
For annual impairment testing purposes, the recoverable amount of the CGUs, which are reportable business segments, are determined based on their value-in-use. The value-in-use calculations apply a discounted cash flow model using cash flow projections based on financial budget and projections approved by management. The key assumptions for the computation of value-in-use include the discount rates, cash flow projection and growth rates applied are as follows:
(i) Discount rate
The discount rate of 10.15% - 23.30% (2011: 11.25% - 32.00%) are based on the pre-tax weighted average cost of capital plus an appropriate risk premium, that reflect specific risks relating to the Group. The pre-tax weighted average cost of capital is generally derived from an appropriate capital asset pricing model, which itself depends on inputs reflecting a number of financial and economic variables including the risk-free rate in the country.

1272012 ANNUAL REPORT
Notes to the Financial Statements31 March 2012
17. INTANGIBLE ASSETS (cont’d)
(a) Impairment test on goodwill (cont’d)
(ii) Cash flow projections and growth rate
Cash flow projections are based on five-year financial budget and projections approved by management. Cash flows beyond the fifth year are extrapolated in perpetuity using a nominal growth rate of 4.7% (2011: 6.5%) based on respective industry’s average growth rate forecasted. Cash flows are extrapolated in perpetuity due to the long term perspective of these businesses within the Group.
Impairment is recognised in the statement of comprehensive income when the carrying amount of a CGU exceeds its recoverable amount. This annual impairment test review reveals that there was no evidence of impairment for the financial year.
(b) Sensitivity to changes in assumptions
Any reasonable possible change in the key assumptions would not cause the carrying amount of the goodwill to exceed the recoverable amount of the CGU, which would warrant any impairment to be recognised.
18. DEFERRED TAX
Deferred tax assets and liabilities are offset when there is a legally enforceable right to set-off current tax assets against current tax liabilities and when the deferred taxes relate to the same tax authority. The net deferred tax assets and liabilities shown on the statement of financial position after appropriate offsetting are as follows:
Group Company 2012 2011 2012 2011 RM’000 RM’000 RM’000 RM’000
Deferred tax assets, net 15,341 109,099 300 284Deferred tax liabilities, net (23,012) (6,792) – –
(7,671) 102,307 300 284
At beginning of year 102,307 68,240 284 4Recognised in statement of comprehensive income (88,596) 32,086 16 280Recognised in equity (21,382) 1,981 – –
At end of year (7,671) 102,307 300 284
Deferred tax assets- to be recovered more than 12 months 14,464 68,233 51 32- to be recovered within 12 months 877 40,866 249 252
15,341 109,099 300 284
Deferred tax liabilities- to be recovered more than 12 months 2,182 212 – –- to be recovered within 12 months (25,194) (7,004) – –
(23,012) (6,792) – –
Deferred tax assets and liabilities prior to offsetting are summarised as follows:
Deferred tax assets 51,076 141,702 302 293Deferred tax liabilities (58,747) (39,395) (2) (9)
(7,671) 102,307 300 284

128 ALLIANCE FINANCIAL GROUP BERHAD (6627-X)
Notes to the Financial Statements31 March 2012
18. DEFERRED TAX (cont’d)
The components and movements of deferred tax assets and liabilities during the financial year prior to offsetting are as follows:
Allowance for Unabsorbed losses on loans, tax losses Other advances and and capital temporary financing allowances differences Total
Group RM’000 RM’000 RM’000 RM’000
Deferred tax assets:At 1 April 2010 74,016 4,498 34,583 113,097Recognised in statement of comprehensive income 11,622 (260) 17,243 28,605
At 31 March 2011 85,638 4,238 51,826 141,702Recognised in statement of comprehensive income (73,312) (1,050) (16,264) (90,626)
At 31 March 2012 12,326 3,188 35,562 51,076
Financial Property, investments plant and available-for-sale equipment Total
Group RM’000 RM’000 RM’000
Deferred tax liabilities:At 1 April 2010 24,855 20,002 44,857Recognised in statement of comprehensive income – (3,481) (3,481)Recognised in equity (1,981) – (1,981)
At 31 March 2011 22,874 16,521 39,395Recognised in statement of comprehensive income – (2,030) (2,030)Recognised in equity 21,382 – 21,382
At 31 March 2012 44,256 14,491 58,747
Other temporary differences Total
Company RM’000 RM’000
Deferred tax assets:At 1 April 2010 – –Recognised in statement of comprehensive income 293 293
At 31 March 2011 293 293Recognised in statement of comprehensive income 9 9
At 31 March 2012 302 302
Property, Other plant and temporary equipment differences Total
Company RM’000 RM’000 RM’000
Deferred tax liabilities:At 1 April 2010 (53) 49 (4)Recognised in statement of comprehensive income 62 (49) 13
At 31 March 2011 9 – 9Recognised in statement of comprehensive income (7) – (7)
At 31 March 2012 2 – 2

1292012 ANNUAL REPORT
Notes to the Financial Statements31 March 2012
18. DEFERRED TAX (cont’d)
Group 2012 2011 RM’000 RM’000
Deferred tax assets of the Group have not been recognised in respect of: Unabsorbed tax losses – 5,775
19. DEPOSITS FROM CUSTOMERS Group 2012 2011 RM’000 RM’000
Demand deposits 9,141,209 8,010,395Savings deposits 1,700,686 1,633,845Fixed/investment deposits 15,595,344 14,580,270Money market deposits 4,091,427 3,042,274Negotiable instruments of deposits 1,407,325 993,052Structured deposits [Note] 194,971 85,811
32,130,962 28,345,647
(i) The maturity structure of fixed/investment deposits, money market deposits and negotiable instruments of deposits are as follows:
Due within six months 16,483,378 14,449,496 Six months to one year 4,516,406 4,098,314 One year to three years 72,776 54,539 Three years to five years 21,536 13,247
21,094,096 18,615,596
(ii) The deposits are sourced from the following types of customers:
Domestic financial institutions 2,151,287 998,676 Government and statutory bodies 1,396,323 1,069,088 Business enterprises 11,845,743 10,111,082 Individuals 15,707,697 15,227,162 Others 1,029,912 939,639
32,130,962 28,345,647
Note:
(a) Structured deposits represent foreign currency time deposits with embedded foreign exchange, gold commodity linked options and interest rate index linked placements.
(b) The Group has undertaken a fair value hedge on the interest rate risk of the structured deposits amounting to RM14,115,000 (2011: RM Nil) using interest rate swaps.
Group 2012 2011 RM’000 RM’000
Structured deposits 14,115 – Fair value changes arising from fair value hedges (423) –
13,692 –
The fair value gain of the interest rate swap in this hedge transaction as at financial year ended 31 March 2012 is RM423,000 (2011: RM Nil).
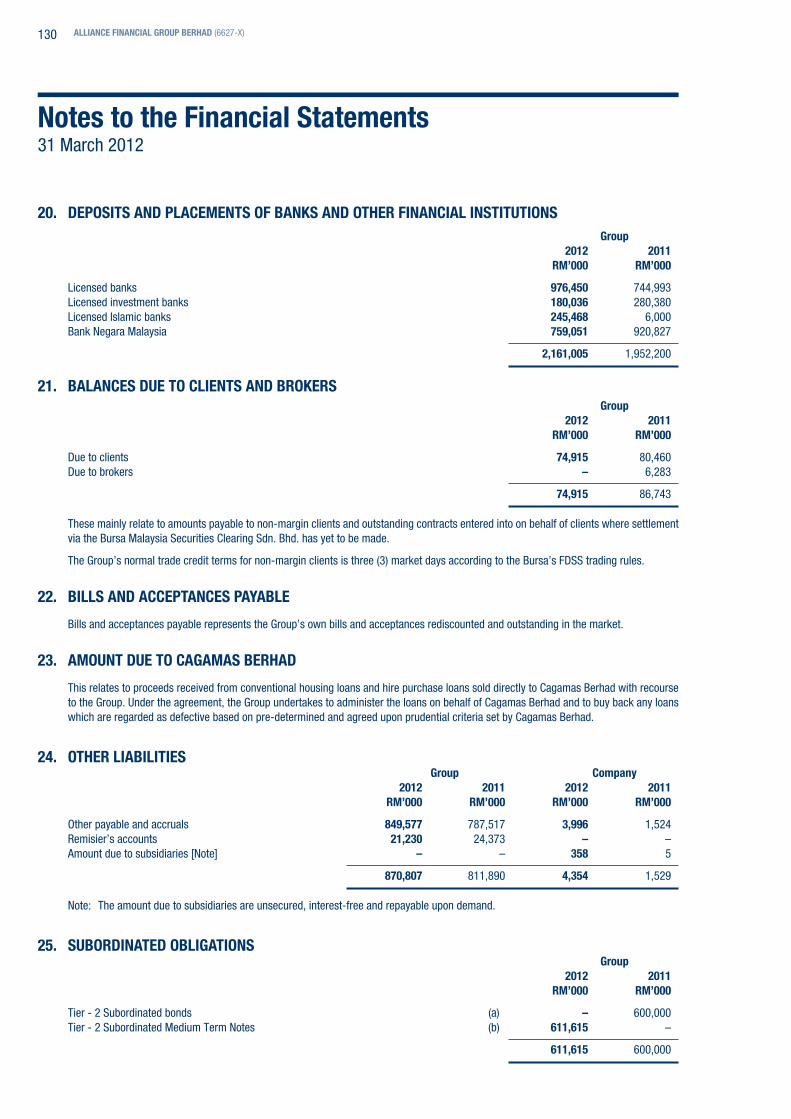
130 ALLIANCE FINANCIAL GROUP BERHAD (6627-X)
Notes to the Financial Statements31 March 2012
20. DEPOSITS AND PLACEMENTS OF BANKS AND OTHER FINANCIAL INSTITUTIONS Group 2012 2011 RM’000 RM’000
Licensed banks 976,450 744,993Licensed investment banks 180,036 280,380Licensed Islamic banks 245,468 6,000Bank Negara Malaysia 759,051 920,827
2,161,005 1,952,200
21. BALANCES DUE TO CLIENTS AND BROKERS Group 2012 2011 RM’000 RM’000
Due to clients 74,915 80,460Due to brokers – 6,283
74,915 86,743
These mainly relate to amounts payable to non-margin clients and outstanding contracts entered into on behalf of clients where settlement via the Bursa Malaysia Securities Clearing Sdn. Bhd. has yet to be made.
The Group’s normal trade credit terms for non-margin clients is three (3) market days according to the Bursa’s FDSS trading rules.
22. BILLS AND ACCEPTANCES PAYABLE
Bills and acceptances payable represents the Group’s own bills and acceptances rediscounted and outstanding in the market.
23. AMOUNT DUE TO CAGAMAS BERHAD
This relates to proceeds received from conventional housing loans and hire purchase loans sold directly to Cagamas Berhad with recourse to the Group. Under the agreement, the Group undertakes to administer the loans on behalf of Cagamas Berhad and to buy back any loans which are regarded as defective based on pre-determined and agreed upon prudential criteria set by Cagamas Berhad.
24. OTHER LIABILITIES Group Company 2012 2011 2012 2011 RM’000 RM’000 RM’000 RM’000
Other payable and accruals 849,577 787,517 3,996 1,524 Remisier’s accounts 21,230 24,373 – – Amount due to subsidiaries [Note] – – 358 5
870,807 811,890 4,354 1,529
Note: The amount due to subsidiaries are unsecured, interest-free and repayable upon demand.
25. SUBORDINATED OBLIGATIONS Group 2012 2011 RM’000 RM’000
Tier - 2 Subordinated bonds (a) – 600,000 Tier - 2 Subordinated Medium Term Notes (b) 611,615 –
611,615 600,000

1312012 ANNUAL REPORT
Notes to the Financial Statements31 March 2012
25. SUBORDINATED OBLIGATIONS (cont’d)
(a) Tier - 2 Subordinated bonds
The main features of the subordinated bonds are as follows:
(i) Issue date : 26 May 2006
(ii) Tenure of the facility/issue : 10-year from the Issue Date on a non-callable 5 year basis
(iii) Anniversary date : 26 May
(iv) Maturity date : 26 May 2016
(v) Interest coupon : 6.09% per annum, subject to revision of rate in year six
(vi) Revision of interest : The bonds, unless redeemed at the end of five (5) years from the settlement date, shall bear interest of 7.59% per annum from the sixth year onwards until the final redemption
(vii) Redemption option : The issuer may, at its option, redeem the subordinated bonds in part or in whole, at any anniversary date on or after five (5) years from the issue date
(viii) Final redemption : At par on maturity date
AllianceBankMalaysiaBerhad (‘’ABMB’’), awholly-owned subsidiary of theCompanyhas fully redeemed the subordinatedbondson 26 May 2011 upon obtaining approval from Bank Negara Malaysia.
(b) Tier - 2 Subordinated Medium Term Notes Group 2012 RM’000
At cost 600,000 Accumulated unamortised discount (2,171) Interest accrued 13,786
611,615
On 8 April 2011, ABMB completed the issuance of RM600 million Subordinated Medium Term Notes (‘’Subordinated Notes’’) undertheRM1.5billionSubordinatedMediumTermNotesProgramme(‘’SubordinatedMTNProgramme’’).
The Subordinated MTN Programme was earlier approved by Bank Negara Malaysia and the Securities Commission on 30 December 2010 and 25 February 2011 respectively. The Subordinated Notes are eligible for inclusion as Tier-2 capital of ABMB under BNM’s capital adequacy regulations.
The Subordinated Notes have been assigned a long term rating of A2 by RAM Rating Services Berhad with tenure of 10 years, callable five (5) years after issue date and on every coupon payment date thereafter, subject to BNM’s approval.
The coupon rate for the Subordinated Notes is fixed at 4.82% per annum, payable semi-annually throughout the entire tenure and was issued at a discount. The proceeds have been used to redeem the RM600 million Subordinated Bonds of ABMB on 26 May 2011.
The main features of the Subordinated Notes are as follows:
(i) Issue date : 8 April 2011
(ii) Tenure of the facility/issue : 10 years from the issue date and callable five (5) years after the issue date
(iii) Maturity date : 8 April 2021
(iv) Interest rate/coupon : 4.82% per annum, payable semi-annually in arrears
(v) Redemption option : The issuer may, at its option, redeem the Subordinated Notes at any coupon date on or after five (5) years from the issue date
(vi) The Subordinated Notes will constitute direct and unsecured obligations of the issuer, subordinated in right and priority of payment, to the extent and in the manner provided in the Subordinated Notes, ranking pari passu among themselves.
(vii) In the event of winding up or liquidation of the issuer, be subordinated in right of payment to all deposit liabilities and other liabilities of the issuer, except in each case to those liabilities which by their terms rank equally in right of payment or which are subordinated to the Subordinated Notes.

132 ALLIANCE FINANCIAL GROUP BERHAD (6627-X)
Notes to the Financial Statements31 March 2012
26. LONG TERM BORROWINGS Group/Company 2012 2011 RM’000 RM’000
Unsecured Fixed rate term loan [Note (a)] – 401,189 Floating rate term loan [Note (b)] – 200,083
– 601,272
Note:
(a) In 2011, the term loan bears a fixed interest rate at 3.5% per annum repayable by way of a bullet payment at the end of the third year with extension option of one (1) year.
(b) In 2011, the term loan bears interest at Cost of Fund plus 0.5% per annum repayable by way of a bullet payment at the end of the fourth year.
The fixed rate term loan and floating rate term loan have been fully repaid on 27 July 2011 and 27 January 2012 respectively.
27. SHARE CAPITAL Group/Company Number of Ordinary Shares of RM1 each Amount 2012 2011 2012 2011 ’000 ’000 RM’000 RM’000
Authorised At beginning/end of year 2,000,000 2,000,000 2,000,000 2,000,000
Issued and fully paid At beginning/end of year 1,548,106 1,548,106 1,548,106 1,548,106
28. RESERVES
Group Company 2012 2011 2012 2011 Note RM’000 RM’000 RM’000 RM’000
Non-distributable: Statutory reserve (a) 600,129 544,368 – – Capital reserve (b) 7,013 7,013 – – Revaluation reserve (c) 132,769 68,620 – – Employees’ share scheme reserve (d) 14,001 13,768 14,001 13,768 Share premium 304,289 304,289 304,289 304,289 Profit equalisation reserve (e) 1,033 1,033 – _
1,059,234 939,091 318,290 318,057 Distributable: Retained profits (f) 1,131,283 908,084 2,312 5,837
2,190,517 1,847,175 320,602 323,894

1332012 ANNUAL REPORT
Notes to the Financial Statements31 March 2012
28. RESERVES (cont’d)
Note:
(a) The statutory reserve is maintained by the Group, in compliance with Section 36 of the Banking and Financial Institutions Act, 1989 and Section 15 of the Islamic Banking Act, 1983 and is not distributable as dividends.
(b) The capital reserve is in respect of retained profit capitalised for a bonus issue by a subsidiary company.
(c) The revaluation reserve is in respect of unrealised fair value gains and losses on financial investments available-for-sale.
(d) The employees’ share scheme reserve relates to the equity-settled share options/grants to Directors and employees. This reserve is made up of the estimated fair value of the share options/share grants based on the cumulative services received from Directors and employees over the vesting period.
(e) Profit equalisation reserve which is derived in accordance with the “Framework of Rate of Return” (BNM/GP2-i).
(f) Prior to 1 January 2008, Malaysian companies adopted the full imputation system. In accordance with the Finance Act, 2007 which was gazetted on 28 December 2007, companies shall not be entitled to deduct tax on dividend paid, credited or distributed to its shareholders, and such dividends will be exempted from tax in the hands of the shareholders (“single tier system”). However, there is a transitional period of six years, expiring on 31 December 2013, to allow companies to pay franked dividends to their shareholders using their Section 108 balance under limited circumstances. Companies also have an irrevocable option to disregard their accumulated tax credit under Section 108 of the Income Tax Act, 1967 and opt to pay dividends under the single tier system. The change in the tax legislation also provides for the Section 108 balance to be locked-in as at 31 December 2007 in accordance with Section 39 of the Finance Act, 2007.
The Company has elected to distribute dividends out of its entire retained earnings under the single tier tax system.
29. SHARES HELD FOR EMPLOYEES’ SHARE SCHEME (“ESS”) A trust has been established for the ESS and is administrated by an appointed trustee. The Trustee will be entitled from time to time to
accept financial assistance from the Company upon such terms and conditions as stipulated in the Trust Deed dated 3 December 2007 and the Trustee may purchase the Company’s shares from the open market for the purpose of the ESS. The Trustee shall refrain from exercising any voting rights attached to these shares. In accordance with FRS 132 Financial Instruments - Presentation and Disclosure, the share purchased for the benefit of the ESS are recorded as “Share Held for ESS” in the equity on the statement of financial position.
During the financial year, the Trustee of the ESS had purchased 8,266,200 ordinary shares of RM1.00 each from the open market at an average price of RM3.46 per share. The total consideration for the purchase including transaction costs was RM28,637,996. The shares purchased are being held in trust by the Trustee of the ESS in accordance with the Trust Deed dated 3 December 2007.
During the financial year ended 31 March 2012, 1,428,150 shares have been vested and transferred from the Trustee to the eligible employees of the Company and its subsidiaries in accordance with the terms under the Share Grant Plan of the ESS. As at 31 March 2012, the Trustee of the ESS held 24,466,800 ordinary shares representing 1.58% of the issued and paid-up capital of the Company.

134 ALLIANCE FINANCIAL GROUP BERHAD (6627-X)
Notes to the Financial Statements31 March 2012
30. EMPLOYEES’ SHARE SCHEME (“ESS”) The Alliance Financial Group Berhad Employees’ Share Scheme (“ESS”) is governed by the Bye-Laws approved by the shareholders at an
Extraordinary General Meeting held on 28 August 2007. The ESS which comprises of the Share Option Plan, the Share Grant Plan and the Share Save Plan took effect on 3 December 2007 and is in force for a period of 10 years.
There were no share options offered under the Share Save Plan during the financial year.
The salient features of the ESS are as follows:
(i) The ESS is implemented and administered by the Employees’ Share Participating Scheme Committee (“ESPS Committee”) in accordance with the Bye-Laws.
(ii) The total number of shares which may be available under the ESS shall not exceed in aggregate 10% of the total issued and paid-up share capital of the Company at any one time during the existence of the ESS and out of which not more than 50% of the shares available under the ESS shall be allocated, in aggregate, to Directors and senior management. In addition, not more than 10% of the shares available under the ESS shall be allocated to any individual Director or employee who, either singly or collectively through his/her associates, holds 20% or more in the issued and paid-up capital of the Company.
(iii) The subscription price for each share under the Share Option Plan, Share Grant Plan and Share Save Plan may be at a discount (as determined by the ESPS Committee or such other pricing mechanism as may from time to time be permitted by Bursa Malaysia Securities Berhad or such other relevant regulatory authorities), provided that the discount shall not be more than 10% from the 5-day weighted average market price of the shares of the Company transacted on Bursa Malaysia Securities Berhad immediately preceding the date on which an offer is made or at par value of the shares, whichever is higher.
(iv) The ESPS Committee may at its discretion offer to any Director or employee of a corporation in the Group to participate in the ESS if the Director or employee:
(a) has attained the age of 18 years;
(b) in the case of a Director, is on the board of directors of a corporation in the Group;
(c) in the case of an employee, is employed by a corporation in the Group; and
(d) is not a participant of any other employee share option scheme implemented by any other corporation within the Group which is in force for the time being.
provided that the non-executive directors of the Group who are not employed by a corporation in the Group shall not be eligible to participate in the Share Save Plan.
(v) Under the Share Option Plan and Share Grant Plan, the ESPS Committee may stipulate the performance targets, performance period, value and/or other conditions deemed appropriate.
(vi) Under the Share Save Plan, the ESPS Committee may at its discretion offer Share Save Option(s) to any employees of the Group to subscribe for the shares of the Company and the employee shall authorise deductions to be made from his/her salary.
(vii) The Company may decide to satisfy the exercise of options/awards of shares under the ESS through the issue of new shares, transfer of existing shares or a combination of both new and existing shares of the Company.
(viii) The Company may appoint or authorise the Trustee of the ESS to acquire the Company’s shares from the open market to give effect to the ESS.
Save for the Group Chief Executive Officer of Alliance Bank Malaysia Berhad, none of the other Directors of the Company were offered/awarded any share options/share grants during the financial year.

1352012 ANNUAL REPORT
Note
s to
the
Fina
ncia
l Sta
tem
ents
31 M
arch
201
2
30.
EMPL
OYEE
S’ S
HARE
SCH
EME
(“ES
S”) (
cont
’d)
The
follo
win
g ta
ble
illus
trate
s th
e nu
mbe
r and
wei
ghte
d av
erag
e ex
erci
se p
rices
(“W
AEP”
) of,
and
mov
emen
ts in
, sha
re o
ptio
ns/g
rant
s du
ring
the
finan
cial
yea
r:
Grou
p Sh
are
Optio
ns
Sha
re G
rant
s20
12
Num
ber o
f Sha
re O
ptio
ns
Num
ber o
f Sha
re G
rant
s
At
At
At
At
begi
nnin
g
Offe
red/
end
be
ginn
ing
Of
fere
d/
Vest
ed/
en
d
of
yea
r a
war
ded
Lap
sed
of
yea
r of
yea
r aw
arde
d
exer
cise
d L
apse
d o
f yea
r
‘0
00
‘000
‘0
00
‘000
‘0
00
‘000
‘0
00
‘000
‘0
00
2008
Sha
re S
chem
e 4,
224
– (4
,224
) –
– –
– –
–20
09 S
hare
Sch
eme
5,22
9 –
(1,2
18)
4,01
1
711
–
(643
) (6
8)
–20
10 S
hare
Sch
eme
6,03
4
– (1
,554
) 4,
480
1,
752
–
(785
) (2
87)
680
2011
Sha
re S
chem
e 6,
625
–
(1,4
59)
5,16
6
1,77
5
– –
(385
) 1,
390
2012
Sha
re S
chem
e –
9,76
4
(774
) 8,
990
– 2,
127
–
(194
) 1,
933
22,1
12
9,76
4
(9,2
29)
22,6
47
4,23
8
2,12
7
(1,4
28)
(934
) 4,
003
WAE
P (R
M)
2.82
3.
58
2.96
3.
09
Shar
e Op
tions
Sh
are
Gran
ts20
11
Num
ber o
f Sha
re O
ptio
ns
Num
ber o
f Sha
re G
rant
s
At
At
At
At
begi
nnin
g
Offe
red/
end
be
ginn
ing
Of
fere
d/
Vest
ed/
en
d
of
yea
r a
war
ded
Lap
sed
of
yea
r of
yea
r aw
arde
d
exer
cise
d L
apse
d o
f yea
r
‘0
00
‘000
‘0
00
‘000
‘0
00
‘000
‘0
00
‘000
‘0
00
2008
Sha
re S
chem
e 5,
801
– (1
,577
) 4,
224
71
3 –
(604
) (1
09)
–20
09 S
hare
Sch
eme
7,28
2
– (2
,053
) 5
,229
1,
846
–
(838
) (2
97)
711
2010
Sha
re S
chem
e 8,
103
–
(2,0
69)
6,03
4
2,27
8 –
– (5
26)
1,75
220
11 S
hare
Sch
eme
– 7,
959
(1,3
34)
6,62
5 –
2,
169
–
(394
) 1
,775
21,1
86
7,95
9 (7
,033
) 22
,112
4,
837
2,1
69
(1,4
42)
(1,3
26)
4,23
8
WAE
P (R
M)
2.68
3.
15
2.77
2.
82

136 ALLIANCE FINANCIAL GROUP BERHAD (6627-X)
Note
s to
the
Fina
ncia
l Sta
tem
ents
31 M
arch
201
2
30.
EMPL
OYEE
S’ S
HARE
SCH
EME
(“ES
S”) (
cont
’d)
Com
pany
Sh
are
Optio
ns
Sha
re G
rant
s20
12
Num
ber o
f Sha
re O
ptio
ns
Num
ber o
f Sha
re G
rant
s
At
At
At
At
begi
nnin
g
Offe
red/
end
be
ginn
ing
Of
fere
d/
Vest
ed/
en
d
of
yea
r a
war
ded
Lap
sed
of
yea
r of
yea
r aw
arde
d
exer
cise
d L
apse
d o
f yea
r
‘0
00
‘000
‘0
00
‘000
‘0
00
‘000
‘0
00
‘000
‘0
00
2008
Sha
re S
chem
e 94
–
(94)
–
– –
– –
–20
09 S
hare
Sch
eme
92
– –
92
10
– (1
0)
– –
2010
Sha
re S
chem
e 11
1 –
– 11
1
24
–
(12)
–
1220
11 S
hare
Sch
eme
92
– (7
) 85
22
–
– (2
) 20
2012
Sha
re S
chem
e –
219
(8
) 21
1 –
38
– (3
) 35
389
21
9
(109
) 49
9
56
38
(22)
(5
) 67
WAE
P (R
M)
2.80
3.
58
3.11
3.
08
Shar
e Op
tions
Sh
are
Gran
ts20
11
Num
ber o
f Sha
re O
ptio
ns
Num
ber o
f Sha
re G
rant
s
At
At
At
At
begi
nnin
g
Offe
red/
end
be
ginn
ing
Of
fere
d/
Vest
ed/
en
d
of
yea
r a
war
ded
Lap
sed
of
yea
r of
yea
r aw
arde
d
exer
cise
d L
apse
d o
f yea
r
‘0
00
‘000
‘0
00
‘000
‘0
00
‘000
‘0
00
‘000
‘0
00
2008
Sha
re S
chem
e 94
–
– 94
9
– (9
) –
–20
09 S
hare
Sch
eme
92
– –
92
19
–
(9)
–
1020
10 S
hare
Sch
eme
111
–
– 11
1 24
–
– –
24
2011
Sha
re S
chem
e –
92
– 92
–
22
–
– 2
2
297
92
–
389
52
22
(18)
–
56
WAE
P (R
M)
2.70
3.
15
– 2.
80

1372012 ANNUAL REPORT
Notes to the Financial Statements31 March 2012
30. EMPLOYEES’ SHARE SCHEME (“ESS”) (cont’d)
(a) Details of share options/grants at the end of financial year:
WAEP RM Exercise Period
2008 Share Options 3.07 12.12.2010 – 11.12.20142009 Share Options 2.70 02.09.2011 – 01.09.20152010 Share Options 2.38 25.08.2012 – 24.08.20162011 Share Options 3.15 23.09.2013 – 22.09.20172012 Share Options 3.58 22.07.2014 – 21.07.2017
Vesting Dates
2008 Share Grants – First 50% of the share grants– Second 50% of the share grants
12.12.200912.12.2010
2009 Share Grants – First 50% of the share grants– Second 50% of the share grants
02.09.201002.09.2011
2010 Share Grants – First 50% of the share grants– Second 50% of the share grants
25.08.201125.08.2012
2011 Share Grants – First 50% of the share grants– Second 50% of the share grants
23.09.201223.09.2013
2012 Share Grants – First 50% of the share grants– Second 50% of the share grants
22.07.2013 22.07.2014
Note:
(i) 2008 Share Options had since lapsed and all shares were forfeited due to performance measures were not meet during the extended grace period.
(ii) 2008 and 2009 Share Grants were fully vested in accordance with the stipulated terms.
(b) Allocation of shares options/grants to Executive Directors and senior management of the Group:
(i) The aggregate maximum allocation of shares options/grants to Executive Directors and senior management of the Group during the financial year and since commencement of the ESS is 50% of shares available under the ESS.
(ii) The actual percentage granted to Executive Directors and senior management of the total number of shares options/grants offered are as follows:
Percentage
Since commencement of the ESS
2008 Share Scheme 46.2% 2009 Share Scheme 48.7% 2010 Share Scheme 48.5% 2011 Share Scheme 43.5%
During the financial year
2012 Share Scheme 48.8%

138 ALLIANCE FINANCIAL GROUP BERHAD (6627-X)
Notes to the Financial Statements31 March 2012
30. EMPLOYEES’ SHARE SCHEME (“ESS”) (cont’d)
(c) Fair value of share options/share grants offered/awarded:
The fair value of share options/share grants under the Share Option Plan and the Share Grant Plan during the financial year was estimated by an external valuer using a binomial model, taking into account the terms and conditions upon which the share options/share grants were offered/awarded. The fair value of share options and share grants measured at offer/award date and the assumptions are as follows:
Share Options
2008 2009 2010 2011 2012
Fair value of the shares as at grant date, - 12 December 2007 (RM) 0.8072 – – – –
- 2 September 2008 (RM) – 0.7040 – – – - 25 August 2009 (RM) – – 0.7489 – – - 23 September 2010 (RM) – – – 0.8980 – - 22 July 2011 (RM) – – – – 0.8790
Weighted average share price (RM) 3.1000 2.6600 2.4000 3.1300 3.7200 Weighted average exercise price (RM) 3.0696 2.6989 2.3784 3.1480 3.5800 Expected volatility (%) 0.2617 0.2709 0.3403 0.3115 0.2977
Expected life (years) 7 7 7 7 6 Risk free rate (%) 3.57 to 4.57 3.79 to 5.22 2.04 to 4.61 2.92 to 4.04 2.93 to 4.18
Expected dividend yield (%) 1.78 1.78 1.78 1.78 3.08
Share Grants
2008 2009 2010 2011 2012
Fair value of the shares as at grant date, - 12 December 2007 (RM) 2.9639 – – – –
- 2 September 2008 (RM) – 2.5432 – – – - 25 August 2009 (RM) – – 2.2941 – – - 23 September 2010 (RM) – – – 2.9930 – - 22 July 2011 (RM) – – – – 3.4405
Weighted average share price (RM) 3.1000 2.6600 2.4000 3.1300 3.7200 Expected volatility (%) 0.2617 0.2709 0.3403 0.3115 0.2977
Risk free rate (%) 3.57 to 4.57 3.79 to 5.22 2.04 to 4.61 2.92 to 4.04 2.93 to 4.18 Expected dividend yield (%) 1.78 1.78 1.78 1.78 3.08
The expected life of the share options is based on the exercisable period of the share options and is not necessarily indicative of exercise patterns that may occur. The expected volatility reflects the assumption that the historical volatility is indicative of future trends, which may also not necessarily be the actual outcome. No other features of the share options/share grants were incorporated into the measurement of fair value.
The risk-free rate is employed using a range of risk-free rates for Malaysian Government Securities (“MGS”) tenure from 1-year to 20-year MGS.

1392012 ANNUAL REPORT
Notes to the Financial Statements31 March 2012
31. INTEREST INCOME Group Company 2012 2011 2012 2011 RM’000 RM’000 RM’000 RM’000
Loans, advances and financing 908,692 841,945 – –Money at call and deposit placements with financial institutions 41,836 36,855 12,947 18,214Financial assets held-for-trading 3,862 1,044 – –Financial investments available-for-sale 253,237 206,340 – –Financial investments held-to-maturity 22,751 30,682 – –Others 3,375 4,393 – –
1,233,753 1,121,259 12,947 18,214 Accretion of discount less amortisation of premium 94,369 82,179 – –
1,328,122 1,203,438 12,947 18,214
32. INTEREST EXPENSE Group Company 2012 2011 2012 2011 RM’000 RM’000 RM’000 RM’000
Deposits and placements of banks and other financial institutions 33,640 55,345 – –
Deposits from customers 565,206 411,329 – –Loans sold to Cagamas 2,908 642 – –Subordinated obligations 34,513 36,540 – –Long term borrowings 14,178 21,382 14,178 21,382Others 3,814 7,938 – –
654,259 533,176 14,178 21,382
33. NET INCOME FROM ISLAMIC BANKING BUSINESS Group 2012 2011 RM’000 RM’000
Income derived from investment of depositors’ funds and others 335,853 292,564 Income derived from investment of Islamic Banking funds 32,097 27,988 Income attributable to depositors and financial institutions (139,025) (112,805)
228,925 207,747 Add: Income due to head office eliminated at Group level 27,404 24,985
256,329 232,732
Note:
Net income from Islamic banking business comprises income generated from both Alliance Islamic Bank Berhad (“AIS”) and Islamic banking business currently residing in Alliance Investment Bank Berhad (“AIBB”). Both AIS and AIBB are wholly-owned subsidiaries of Alliance Bank Malaysia Berhad, which in turn is a wholly owned subsidiary of the Company.

140 ALLIANCE FINANCIAL GROUP BERHAD (6627-X)
Notes to the Financial Statements31 March 2012
34. OTHER OPERATING INCOME Group Company 2012 2011 2012 2011 RM’000 RM’000 RM’000 RM’000
(a) Fee income: Commissions 55,160 35,031 – – Service charges and fees 30,546 34,529 – – Portfolio management fees 6,994 6,628 – – Corporate advisory fees 6,073 3,064 – – Underwriting commissions 990 949 – – Brokerage fees 14,499 17,837 – – Guarantee fees 8,764 8,603 – – Processing fees 10,817 11,779 – – Commitment fees 14,376 14,042 – – Other fee income 28,533 14,645 – –
176,752 147,107 – –
(b) Investment income: Gain arising from sale/redemption of: - Financial assets held-for-trading 3,699 417 – – - Financial investments available-for-sale 47,408 3,509 – – - Financial investments held-to-maturity 16,831 3 – – Unrealised (loss)/gain from revaluation of: - Financial assets held-for-trading (185) 256 – – - Derivative financial instruments 1,572 4,149 – – Realised gain on derivative financial instruments 37,444 43,925 – – Gross dividend income from: - Financial investments available-for-sale 10,229 3,705 – – - Subsidiary – – 265,765 146,462
116,998 55,964 265,765 146,462
(c) Other income/(expense): Foreign exchange gain 7,977 7,415 – – Gain/(loss) on disposal of property, plant and equipment 200 (329) (109) – (Loss)/gain on liquidation of subsidiaries – (7) – 203 Loss on disposal of foreclosed properties (20) (38) – – Others 18,275 15,610 1,542 1,179
26,432 22,651 1,433 1,382
Total other operating income 320,182 225,722 267,198 147,844

1412012 ANNUAL REPORT
Notes to the Financial Statements31 March 2012
35. OTHER OPERATING EXPENSES Group Company 2012 2011 2012 2011 RM’000 RM’000 RM’000 RM’000
Personnel costs - Salaries, allowances and bonuses 290,164 254,506 1,470 1,329 - Contribution to EPF 47,849 42,523 307 276 - Share options/grants under ESS 6,649 5,347 156 119 - Others 31,495 30,962 138 98
376,157 333,338 2,071 1,822
Establishment costs - Depreciation of property, plant and equipment 29,374 39,592 103 76 - Amortisation of computer software 18,239 14,420 – – - Rental of premises 27,414 26,290 62 133 - Water and electricity 6,137 5,470 10 11 - Repairs and maintenance 9,965 10,470 78 12 - Information technology expenses 33,255 29,339 3 1 - Others 20,007 13,406 – –
144,391 138,987 256 233
Marketing expenses - Promotion and advertisement 11,178 8,912 – – - Branding and publicity 4,756 4,861 – – - Others 4,688 4,805 – –
20,622 18,578 – –
Administration and general expenses - Communication expenses 13,126 11,681 2 4 - Printing and stationery 3,756 4,619 2 3 - Insurance 5,926 10,501 1 1 - Professional fees 13,750 13,668 157 174 - Others 14,068 13,528 1,624 1,765
50,626 53,997 1,786 1,947
Total other operating expenses 591,796 544,900 4,113 4,002
Included in the other operating expenses are the following:
Auditors’ remuneration [Note (a)] 1,516 3,172 98 88 Hire of equipment 3,964 3,626 10 10 Property, plant and equipment written off 2,046 3,399 – – Computer software written off 841 1 – –

142 ALLIANCE FINANCIAL GROUP BERHAD (6627-X)
35. OTHER OPERATING EXPENSES (cont’d)
Group Company 2012 2011 2012 2011 RM’000 RM’000 RM’000 RM’000
(a) Auditors’ remuneration
Statutory audit fee 896 778 51 44 Audit related services 485 753 33 29 Tax compliance work 117 591 9 10 Tax related services 13 355 – – Other services 5 695 5 5
Total 1,516 3,172 98 88
(b) Directors’ remuneration
Directors of the Company: Non-Executive Directors - Allowances 912 1,022 340 359 - Fees 1,497 1,430 540 525 - Benefits-in-kind 55 38 31 38
2,464 2,490 911 922
CEOs and Directors of Subsidiaries: Chief Executive Officers - Salaries and allowances 3,047 1,765 – – - Bonuses 1,414 831 – – - Contribution to EPF 641 378 – – - Share options/grants under ESS 930 417 – – - Benefits-in-kind 56 55 – –
6,088 3,446 – –
Non-Executive Directors - Allowances 240 578 – – - Fees 504 447 – –
744 1,025 – –
9,296 6,961 911 922
Past Directors - Salaries and allowances including meeting allowance 182 151 – – - Fees 179 30 – – - Contribution to EPF 10 20 – – - Benefits-in-kind – 2 – –
371 203 – –
Total 9,667 7,164 911 922
Total Directors’ remuneration excluding benefits-in-kind 9,556 7,069 880 884
Notes to the Financial Statements31 March 2012

1432012 ANNUAL REPORT
Notes to the Financial Statements31 March 2012
35. OTHER OPERATING EXPENSES (cont’d)
2012 2011 Executive Non-Executive Executive Non-Executive Directors/CEOs Directors Directors/CEOs Directors
Directors of the Company:
Below RM50,000 – – – – RM50,001 - RM100,000 – 2 – 2 RM100,001 - RM150,000 – 5 – 5 RM150,001 - RM200,000 – 1 – – RM200,001 - RM250,000 – – – 1 RM250,001 - RM300,000 – – – – RM300,001 - RM350,000 – – – – RM350,001 - RM400,000 – – – – RM400,001 - RM450,000 – – – – Above RM450,000 – – – –
Directors of the Group:
Below RM50,000 – – – 2 RM50,001 - RM100,000 – – – – RM100,001 - RM150,000 – 5 – 4 RM150,001 - RM200,000 – 1 – – RM200,001 - RM250,000 – 2 – 2 RM250,001 - RM300,000 – 1 – – RM300,001 - RM350,000 1 1 – 2 RM350,001 - RM400,000 – – – – RM400,001 - RM450,000 – 1 – 1 Above RM450,000 3 2 3 3
36. ALLOWANCE FOR LOSSES ON LOANS, ADVANCES AND FINANCING AND OTHER LOSSES Group 2012 2011 RM’000 RM’000
Allowance for/(write-back of) losses on loans and financing:(a) Individual assessment allowance
- Made during the year (net) 43,363 87,812(b) Collective assessment allowance
- Made during the year (net) 46,381 15,992(c) Bad debts on loans and financing
- Recovered (65,590) (80,844) - Written off 8,416 3,988
32,570 26,948 (Write-back of)/allowance for commitments and contingencies (4,210) 59 Allowance for other assets 6,280 6,302
34,640 33,309

144 ALLIANCE FINANCIAL GROUP BERHAD (6627-X)
Notes to the Financial Statements31 March 2012
37. (WRITE-BACK OF)/ALLOWANCE FOR IMPAIRMENT Group Company 2012 2011 2012 2011 RM’000 RM’000 RM’000 RM’000
Write-back of impairment on securities: - Financial investments available-for-sale (22,759) (585) – – - Financial investments held-to-maturity (344) (3,491) – –Allowance for impairment on
property, plant and equipment (Note 16) 1,460 – – –Allowance for impairment on debts due from subsidiaries – – 970 642
(21,643) (4,076) 970 642
38. TAXATION AND ZAKAT Group Company 2012 2011 2012 2011 RM’000 RM’000 RM’000 RM’000
Income tax provision for current year 173,433 153,758 61,128 31,476Deferred tax (9,524) (10,136) (55) (240)
163,909 143,622 61,073 31,236(Over)/under provision in prior years (258) (22) 22 (46)
Taxation 163,651 143,600 61,095 31,190Zakat 113 362 – –
163,764 143,962 61,095 31,190
Income tax is calculated at the Malaysian statutory tax rate of 25% (2011: 25%) of the estimated assessable profit for the year.
A reconciliation of income tax expense applicable to profit before taxation at the statutory income tax rate to income tax expense at the effective income tax rate of the Group and of the Company is as follows:
Group Company 2012 2011 2012 2011 RM’000 RM’000 RM’000 RM’000
Profit before taxation and zakat 643,603 553,113 260,884 140,032
Taxation at Malaysian statutory tax rate of 25% (2011: 25%) 160,901 138,283 65,221 35,008Effect of expenses not deductible for tax purposes 6,869 9,393 852 1,278Effect of income not subject to tax (2,752) (2,418) (5,000) (5,050)(Over)/under provision in prior years (258) (22) 22 (46)Unabsorbed tax losses which deferred tax recognised
during the year (1,109) (1,636) – –
Tax expense for the year 163,651 143,600 61,095 31,190
Tax savings during the year arising from:
- utilisation of tax losses brought forward from previous year 2,173 1,145 – –

1452012 ANNUAL REPORT
Notes to the Financial Statements31 March 2012
39. EARNINGS PER SHARE(a) Basic
The calculation of the basic earnings per share is based on net profit attributable to owners of the parent for the financial year divided by the weighted average number of ordinary shares of RM1.00 each in issue during the financial year excluding the weighted average shares held for ESS.
Group 2012 2011
Net profit attributable to owners of the parent (RM’000) 479,355 409,202
Weightedaveragenumberofordinarysharesinissue(‘000) 1,548,106 1,548,106 EffectofsharesboughtbackforESS(‘000) (24,467) (17,629)
1,523,639 1,530,477
Basic earnings per share (sen) 31.5 26.7
(b) Diluted
The calculation of the diluted earnings per share is based on the net profit attributable to owners of the parent for the financial year divided by the weighted average number of ordinary shares of RM1.00 each in issue during the financial year, excluding the weighted average shares held for ESS and taken into account the assumed Share Grants to employees under ESS were vested to the employees as at 31 March 2012.
Group 2012 2011
Net profit attributable to owners of the parent (RM’000) 479,355 409,202
Weightedaveragenumberofordinarysharesinissue(‘000) 1,548,106 1,548,106 EffectofsharesboughtbackforESS(‘000) (24,467) (17,629) EffectofShareGrantsunderESS(‘000) 4,003 4,238
1,527,642 1,534,715
Diluted earnings per share (sen) 31.4 26.7

146 ALLIANCE FINANCIAL GROUP BERHAD (6627-X)
Notes to the Financial Statements31 March 2012
40. DIVIDENDS Dividend in respect Net Dividends of financial year per Ordinary Share 2012 2011 2012 2011 RM’000 RM’000 Sen Sen
Recognised during the financial year:
First interim dividend
5.6 sen per share, tax exempt under the single tier tax system, on 1,548,105,929 ordinary shares of RM1.00 each, declared in the financial year ended 31 March 2012, was paid on 26 August 2011 85,705 – 5.54 –
3.3 sen per share, tax exempt under the single tier tax system, on 1,548,105,929 ordinary shares of RM1.00 each, declared in the financial year ended 31 March 2011, was paid on 27 August 2010 – 50,458 – 3.26
Second interim dividend
7.7 sen per share, tax exempt under the single tier tax system, on 1,548,105,929 ordinary shares of RM1.00 each, declared in the financial year ended 31 March 2012, was paid on 28 February 2012 117,495 – 7.59 –
3.7 sen per share, tax exempt under the single tier tax system, on 1,548,105,929 ordinary shares of RM1.00 each, declared in the financial year ended 31 March 2011, was paid on 28 February 2011 – 56,628 – 3.66
203,200 107,086 13.13 6.92
Dividends paid on the shares held in Trust pursuant to the Company’s ESS which are classified as shares held for ESS are not accounted for in the equity. An amount of RM2,697,000 (2011: RM1,281,000) being dividends paid for those shares were added back to the appropriation of retained profits in respect of the dividends.
41. CAPITAL COMMITMENTS Group 2012 2011 RM’000 RM’000
Capital expenditure: Authorised and contracted for 58,075 23,338 Authorised but not contracted for 56 6,020
58,131 29,358

1472012 ANNUAL REPORT
Notes to the Financial Statements31 March 2012
42. MATERIAL LITIGATIONS(a) A corporate borrower had issued a Writ of Summons in 2005 against an agent bank for a syndicate of lenders comprising three banks
of which ABMB is one of them, claiming for general, special and exemplary damages alleging a breach of duty and contract. The credit facilities consist of a bridging loan of RM58.5 million and a revolving credit facility of RM4.0 million which were granted by the syndicate lenders of which the ABMB’s participation was RM18.5 million. In 2002, the credit facilities were restructured to a loan of RM30.0 million, of which the ABMB’s participation was RM8.31 million, payable over seven years. The syndicated lenders had also filed a suit against the corporate borrower for the recovery of the above-mentioned loan.
The two suits were then consolidated and heard together. On 6 May 2009, judgment was delivered against the agent bank for special damages amounting to RM115.5 million together with interest at the rate of 6% per annum from date of disbursement to date of realisation with general damages to be assessed by the Court. The agent bank’s solicitors had filed an appeal against the said decision. The High Court had on 24 June 2009 granted a stay of execution of the judgment pending disposal of its appeal at the Court of Appeal. The High Court of Appeal has fixed the hearing of the appeal on 19 June 2012.
The advice from the agent bank’s solicitors is that they have a better than even chance of succeeding in the said appeal.
(b) ABMB had in 1999 filed a suit against a corporate borrower and the guarantor (collectively referred to as “the Defendants”) for the outstanding amount due to a default in banking facility amounting to RM2.36 million. The Defendants filed a counter-claimed against ABMB for special damages amounting to RM15.5 million and general damages to be assessed by the Court for negligence and/or wrongful termination of the banking facilities, statutory interest on judgment sum, costs and such other and/or further relief deemed fit by the Court.
On 4 May 2009, the High Court in Kota Kinabalu dismissed ABMB’s claim and allowed Defendants claim for general damages to be assessed by the Deputy Registrar. ABMB filed an appeal to the Court of Appeal against the High Court judgment and applied to the High Court for a stay of execution against the said judgment. On 3 August 2009, the High Court dismissed ABMB’s application for stay of execution of the judgment. ABMB then filed an appeal to the Court of Appeal against the said decision. On 16 November 2009, the Court of Appeal dismissed ABMB’s appeal for stay of execution with no order as to costs and directed that an early hearing date would be scheduled for ABMB’s appeal proper.
On 18 January 2011, the Court of Appeal allowed ABMB’s appeal by dismissing the counter-claim against ABMB and allowing ABMB’s claim against the Defendants. The Defendants filed an application for leave to appeal at the Federal Court against the said decision. On 23 November 2011, the Federal Court dismissed the Defendants application for leave to appeal at the Federal Court with costs of RM10,000.
Pursuant to the decision by the Federal Court, the High Court had on 10 February 2012 struck out the matter with costs to follow as per Court of Appeal order. This essentially concludes the matter thus bringing the counter-claim against ABMB to an end.
(c) ABMB commenced a civil suit against an individual borrower in March 2007 for recovery of an overdraft facility secured by shares from the individual borrower and shares from a third party. The individual borrower counter-claimed against ABMB for various declarations amongst others that ABMB had acted wrongfully or in bad faith in demanding the repayment for the facility and that there was in existence a collateral contract between the individual borrower, ABMB and the third party. In addition, the individual borrower is also claiming for general damages to be assessed by the courts.
Arising from the above-mentioned suit, the third party in September 2008 filed a separate suit against ABMB for force selling the shares pledged by the third party. The third party’s claim is for damages for loss of the benefit of the shares pledged to ABMB, damages for conversion, damages for misrepresentation and for breach of contract.
The two cases were consolidated into one suit. The consolidated suits were heard from 20 till 24 February 2012. On 20 March 2012, the High Court allowed ABMB’s claim against the individual borrower and dismissed the individual borrower’s counter claim against ABMB with costs of RM150,000. The individual borrower has since filed an appeal to the Court of Appeal against the said decision. ABMB is contesting the appeal.
On 20 March 2012, the High Court dismissed the third party suit against ABMB with costs of RM150,000. The third party has since appealed against the said decision to the Court of Appeal. ABMB is contesting the appeal.

148 ALLIANCE FINANCIAL GROUP BERHAD (6627-X)
Notes to the Financial Statements31 March 2012
43. FINANCIAL RISK MANAGEMENT POLICIES
The Group manages risk within clearly defined guidelines that are approved by the Directors. In addition, the Board of Directors of the Group provides independent oversight to ensure that risk management policies are complied with, through a framework of established controls and reporting process.
The guidelines and policies adopted by the Group to manage the main risks that arise in the conduct of its business activities are as follows:
(a) Credit Risk
Credit risk is the potential loss of revenue and/or principal arising from defaults by borrowers or counterparties through business activities in lending, trading, investing and hedging. Exposure to credit risk may be categorised as primary or secondary.
Primary exposure to credit risk arises from loans, advances and financing. The amount of credit exposure is represented by the carrying amount of loans, advances and financing in the statement of financial position. The lending activities in the Group are guided by the Group’s Credit Policies and Guidelines, in line with Best Practices in the Management of Credit Risk, issued by Bank Negara Malaysia. These credit policies and guidelines also include an Internal Grading model adopted by the Group to grade its loans, advances and financing accounts according to their respective risk profiles.
On the other hand, secondary credit exposure arise from financial transactions with counterparties (including interbank market activities, derivative instruments used for hedging and debt instruments), of which the amount of credit exposure in respect of these instruments is equal to the carrying amount of these assets in the statements of financial position. This exposure is monitored on an on-going basis against predetermined counterparty limits.
The credit exposure arising from off-balance sheet activities, i.e. commitments and contingencies is set out in Note 45 to the financial statements.
Credit risk arising from Treasury activities are managed by appropriate policies, counterparty limits and supported by the Group’s Risk Management Framework.

1492012 ANNUAL REPORT
Notes to the Financial Statements31 March 2012
43. FINANCIAL RISK MANAGEMENT POLICIES (cont’d)
(a) Credit Risk (cont’d)
(i) Maximum exposure to credit risk
The following table presents the Group’s maximum exposure to credit risk of on-balance sheet and off-balance sheet financial instruments, before taking into account of any collateral held or other credit enhancements and after allowance for impairment where appropriate.
For on-balance sheet financial assets, the maximum exposure to credit risk equals their carrying amount. For financial guarantees and similar contracts granted, the maximum exposure to credit risk is the maximum amount that would have to pay if the guarantees were to be called upon. For credit related commitments and contingencies that are irrevocable over the life of the respective facilities, the maximum exposure to credit risk is the full amount of the undrawn credit facilities granted to customers.
Group Company 2012 2011 2012 2011 RM’000 RM’000 RM’000 RM’000
Credit risk exposure of on-balance sheet: Cash and short-term funds (exclude cash in hand) 1,683,092 704,169 6,500 46,857 Deposits and placements with banks and other financial institutions 97,713 100,228 19,315 605,700 Balances due from clients and brokers 61,698 80,519 – – Financial assets held-for-trading 1,491,995 1,938,250 – – Financial investments available-for-sale (exclude equity securities) 8,983,101 9,138,478 – – Financial investments held-to-maturity 795,256 940,726 – – Derivative financial assets 23,712 32,047 – – Loans, advances and financing 24,717,697 22,110,986 – –
Total on-balance sheet 37,854,264 35,045,403 25,815 652,557
Credit risk exposure of off-balance sheet: Financial guarantees 463,962 453,370 – – Credit related commitments and contingencies 13,009,027 10,499,031 – –
Total off-balance sheet 13,472,989 10,952,401 – –
Total maximum exposure 51,327,253 45,997,804 25,815 652,557

150 ALLIANCE FINANCIAL GROUP BERHAD (6627-X)
Note
s to
the
Fina
ncia
l Sta
tem
ents
31 M
arch
201
2
43.
FINA
NCIA
L RI
SK M
ANAG
EMEN
T PO
LICI
ES (c
ont’d
)
(a)
Cred
it Ri
sk (c
ont’d
)
(ii)
Cred
it ris
k co
ncen
trat
ions
A co
ncen
tratio
n of
cre
dit r
isk
exis
ts w
hen
a nu
mbe
r of c
ount
erpa
rties
are
eng
aged
in s
imila
r act
iviti
es a
nd h
ave
sim
ilar e
cono
mic
cha
ract
eris
tics
that
cau
se th
eir a
bilit
y to
mee
t co
ntra
ctua
l obl
igat
ions
to b
e si
mila
rly a
ffect
ed b
y ch
ange
s in
eco
nom
ic a
nd o
ther
con
ditio
ns. T
he a
naly
ses
of c
redi
t ris
k co
ncen
tratio
n pr
esen
ted
belo
w re
late
s on
ly to
fina
ncia
l as
sets
sub
ject
to c
redi
t ris
k an
d ar
e ba
sed
on th
e in
dust
ry in
whi
ch th
e co
unte
rpar
ty is
eng
aged
.
Finan
cial,
Trans
port,
Go
vern
men
t In
sura
nce
Stor
age
Agric
ultur
e,
and
and
and
Manu
fact
uring
,
Mo
tor
Othe
r
Cent
ral
Bus
iness
Co
mm
unica
tion
Who
lesale
&
Re
siden
tial
Vehic
le Co
nsum
erGr
oup
Bank
Se
rvice
s Se
rvice
s R
etail
Trad
e C
onstr
uctio
n Mo
rtgag
e Fin
ancin
g Lo
ans
Tota
l20
12
RM’00
0 RM
’000
RM’00
0 RM
’000
RM’00
0 RM
’000
RM’00
0 RM
’000
RM’00
0
Cash
and
sho
rt-te
rm fu
nds
1,06
7,24
1 61
5,85
1 –
– –
– –
– 1,
683,
092
Depo
sits
and
plac
emen
ts w
ith
bank
s an
d ot
her f
inan
cial
inst
itutio
ns
– 97
,713
–
– –
– –
– 97
,713
Bala
nces
due
from
clie
nts
and
brok
ers
– –
– –
– –
– 61
,698
61
,698
Fina
ncia
l ass
ets
held
-for-
tradi
ng
1,49
1,99
5 –
– –
– –
– –
1,49
1,99
5Fi
nanc
ial i
nves
tmen
ts
avai
labl
e-fo
r-sa
le
4,20
2,30
9 4,
237,
686
137,
155
374,
422
31,5
29
– –
– 8,
983,
101
Fina
ncia
l inv
estm
ents
he
ld-to
-mat
urity
76
8,10
1 21
,949
5,
206
– –
– –
– 79
5,25
6De
rivat
ive fi
nanc
ial a
sset
s –
23,7
12
– –
– –
– –
23,7
12Lo
ans,
adv
ance
s an
d fin
ancin
g –
2,59
5,62
4 13
0,01
5 7,
240,
115
290,
869
9,59
7,76
6 43
9,62
0 4,
423,
688
24,7
17,6
97
Tota
l on-
bala
nce
shee
t 7,
529,
646
7,59
2,53
5 27
2,37
6 7,
614,
537
322,
398
9,59
7,76
6 43
9,62
0 4,
485,
386
37,8
54,2
64
Fina
ncia
l gua
rant
ees
– 37
,712
19
,908
33
8,36
1 30
,596
30
0 –
37,0
85
463,
962
Cred
it re
late
d co
mm
itmen
ts
and
cont
inge
ncie
s –
1,33
9,21
5 66
,964
3,
126,
409
1,22
5,98
1 3,
404,
765
230
3,84
5,46
3 13
,009
,027
Tota
l off-
bala
nce
shee
t –
1,37
6,92
7 86
,872
3,
464,
770
1,25
6,57
7 3,
405,
065
230
3,88
2,54
8 13
,472
,989
Tota
l cre
dit r
isk
7,52
9,64
6 8,
969,
462
359,
248
11,0
79,3
07
1,57
8,97
5 13
,002
,831
43
9,85
0 8,
367,
934
51,3
27,2
53

1512012 ANNUAL REPORT
Note
s to
the
Fina
ncia
l Sta
tem
ents
31 M
arch
201
2
43.
FINA
NCIA
L RI
SK M
ANAG
EMEN
T PO
LICI
ES (c
ont’d
)
(a)
Cred
it Ri
sk (c
ont’d
)
(ii)
Cred
it ris
k co
ncen
trat
ions
(con
t’d)
Finan
cial,
Trans
port,
Gove
rnm
ent
Insu
ranc
e St
orag
e Ag
ricult
ure,
an
d an
d an
d Ma
nufa
ctur
ing,
Moto
r Ot
her
Ce
ntra
l B
usine
ss
Com
mun
icatio
n W
holes
ale &
Resid
entia
l Ve
hicle
Cons
umer
Grou
p Ba
nk
Serv
ices
Serv
ices
Ret
ail Tr
ade
Con
struc
tion
Mortg
age
Finan
cing
Loan
s To
tal
2011
RM
’000
RM’00
0 RM
’000
RM’00
0 RM
’000
RM’00
0 RM
’000
RM’00
0 RM
’000
Cash
and
sho
rt-te
rm fu
nds
524,
670
179,
499
– –
– –
– –
704,
169
Depo
sits
and
pla
cem
ents
with
ba
nks
and
othe
r fin
anci
al
inst
itutio
ns
– 10
0,22
8 –
– –
– –
– 10
0,22
8Ba
lanc
es d
ue fr
om c
lient
s an
d br
oker
s –
– –
– –
– –
80,5
19
80,5
19Fi
nanc
ial a
sset
s he
ld-f
or-t
radi
ng
1,93
8,25
0 –
– –
– –
– –
1,93
8,25
0Fi
nanc
ial i
nves
tmen
ts
avai
labl
e-fo
r-sa
le
4,05
9,90
8 4,
584,
626
162,
118
300,
215
31,6
11
– –
– 9,
138,
478
Fina
ncia
l inv
estm
ents
he
ld-t
o-m
atur
ity
910,
444
24,9
51
5,23
6 –
95
– –
– 94
0,72
6De
rivat
ive
finan
cial
ass
ets
– 30
,657
–
– –
– –
1,39
0 32
,047
Loan
s, a
dvan
ces
and
finan
cing
–
2,02
9,10
8 15
6,46
0 6,
559,
284
421,
713
8,49
8,85
9 55
7,26
2 3,
888,
300
22,1
10,9
86
Tota
l on-
bala
nce
shee
t 7,
433,
272
6,94
9,06
9 32
3,81
4 6,
859,
499
453,
419
8,49
8,85
9 55
7,26
2 3,
970,
209
35,0
45,4
03
Fina
ncia
l gua
rant
ees
– 28
,423
22
,630
34
1,32
8 23
,932
–
– 37
,057
45
3,37
0Cr
edit
rela
ted
com
mitm
ents
an
d co
ntin
genc
ies
– 80
4,32
2 75
,937
2,
442,
788
1,30
4,86
6 1,
276,
176
1,10
1 4,
593,
841
10,4
99,0
31
Tota
l off-
bala
nce
shee
t –
832,
745
98,5
67
2,78
4,11
6 1,
328,
798
1,27
6,17
6 1,
101
4,63
0,89
8 10
,952
,401
Tota
l cre
dit r
isk
7,43
3,27
2 7,
781,
814
422,
381
9,64
3,61
5 1,
782,
217
9,77
5,03
5 55
8,36
3 8,
601,
107
45,9
97,8
04

152 ALLIANCE FINANCIAL GROUP BERHAD (6627-X)
Notes to the Financial Statements31 March 2012
43. FINANCIAL RISK MANAGEMENT POLICIES (cont’d)
(a) Credit Risk (cont’d)
(ii) Credit risk concentrations (cont’d)
Financial, Insurance and BusinessCompany Services Total2012 RM’000 RM’000
Cash and short-term funds 6,500 6,500 Deposits and placements with banks and other financial institutions 19,315 19,315
Total credit risk 25,815 25,815
2011
Cash and short-term funds 46,857 46,857 Deposits and placements with banks and other financial institutions 605,700 605,700
Total credit risk 652,557 652,557
(iii) Collaterals
The main types of collateral obtained by the Group are as follows: - For personal housing loans, mortgages over residential properties; - For commercial property loans, charges over the properties being financed; - For hire purchase, charges over the vehicles or plant and machineries financed; and - For other loans/financing, charges over business assets such as premises, inventories, trade receivables or deposits.
(iv) Credit quality - Loans, advances and financing
All loans, advances and financing are categorised as either: - neither past due nor impaired; - past due but not impaired; or - impaired.
Past due loans, advances and financing refer to loans that are overdue by one day or more. Impaired loans are loans with month-in-arrears more than 90 days or with impaired allowances.
Distribution of loans, advances and financing by credit quality
Group 2012 2011 RM’000 RM’000
Neither past due nor impaired 23,255,955 20,710,623 Past due but not impaired 1,126,956 987,414 Impaired 601,135 741,324
Gross loans, advances and financing 24,984,046 22,439,361 Sales commissions and handling fees 28,523 24,969 Less: Allowance for impairment - Individual assessment (266,349) (328,375) - Collective assessment (386,017) (339,636)
Net loans, advances and financing 24,360,203 21,796,319
Financial effect of collateral held for loans, advances and financing 70.9% 60.9%

1532012 ANNUAL REPORT
Notes to the Financial Statements31 March 2012
43. FINANCIAL RISK MANAGEMENT POLICIES (cont’d)
(a) Credit Risk (cont’d)
(iv) Credit quality - Loans, advances and financing (cont’d)
Credit quality of loans, advances and financing neither past due nor impaired
Analysis of loans, advances and financing that are neither past due nor impaired analysed based on the Group’s internal credit grading system is as follows:
Group 2012 2011 RM’000 RM’000
Grading classification - Good 22,379,010 19,168,648 - Fair 876,945 1,541,975
23,255,955 20,710,623
The definition of the grading classification can be summarised as follows:
Good: refers to loans, advances and financing which have never been past due in the last 6 months and have never undergone any restructuring or rescheduling exercise previously.
Fair: refers to loans, advances and financing which have been past due at some point within the last 6 months, or have undergone restructuring or rescheduling exercise previously.
Loans, advances and financing that are past due but not impaired
An aging analysis of loans, advances and financing that are past due but not impaired is set out below.
For the purpose of this analysis an asset is considered past due and included below when any payment due under strict contractual terms is received late or missed. The amount included is the entire financial assets, not just the payment of principal or interest or both overdue.
Group 2012 2011 RM’000 RM’000
Past due up to 1 month 909,157 773,027 Past due > 1 - 2 months 187,351 186,858 Past due > 2 - 3 months 30,448 27,529
1,126,956 987,414
Loans, advances and financing assessed as impaired
An analysis of loans assessed as impaired is as follows:
Group 2012 2011 RM’000 RM’000
Gross impaired loans/financing 601,135 741,324 Less: Allowance for impairment - Individual assessment (266,349) (328,375)
Net impaired loans/financing 334,786 412,949

154 ALLIANCE FINANCIAL GROUP BERHAD (6627-X)
Notes to the Financial Statements31 March 2012
43. FINANCIAL RISK MANAGEMENT POLICIES (cont’d)
(a) Credit Risk (cont’d)
(v) Repossessed collateral
The Group obtained assets by taking possession of collateral held as security as follows: Group 2012 2011 RM’000 RM’000
Nature of assets Industrial factory – 5,300
Residential property – 105
– 5,405
Repossessed or foreclosed properties are sold as soon as practicable, with the proceeds used to reduce the outstanding indebtedness. Repossessed property is classified in the consolidated statements of financial position within other assets.
(vi) Credit quality - Financial instruments
The table below presents an analysis of the credit quality of cash and short term funds, deposits and placements with other financial instituitions, debt securities and derivative financial assets. Cash and short term funds herein excluding the cash in hand. Debt securities included financial assets held-for-trading, financial investments available-for-sale and financial investments held-to-maturity. Financial assets held-for-trading and financial investments available-for-sale are measured on a fair value basis. The fair value will reflect the credit risk of the issuer.

1552012 ANNUAL REPORT
Notes to the Financial Statements31 March 2012
43. FINANCIAL RISK MANAGEMENT POLICIES (cont’d)
(a) Credit Risk (cont’d)
(vi) Credit quality - Financial instruments (cont’d)
Most listed and some unlisted securities are rated by external rating agencies. The Group uses external credit ratings provided by RAM, MARC, FITCH, Moody and S&P. The table below presents an analysis of debt securities by rating agency:
Deposits and placements Financial Financial Financial Cash and with assets investments investments Derivative short-term financial held-for- available- held-to- financial funds instituitions trading for-sale maturity assets Total RM’000 RM’000 RM’000 RM’000 RM’000 RM’000 RM’000
Group 2012
By rating agencies RAM AAA 169,439 – – 680,975 – 11,321 861,735 AA1 230,178 – – 128,976 – 2,020 361,174 AA2 175 4,275 – 35,578 – 2,620 42,648 AA3 1 – – 16,342 – 25 16,368 AA- – – – – – 855 855 A1 259,661 – – – – 30 259,691
MARC AAA – – – 324,242 – – 324,242 AA- – – – 31,529 – – 31,529
FITCH AA+ – – – – – 111 111 A1 5,303 – – – – – 5,303
MOODY AA1 5,146 – – – – – 5,146 AA3 12,726 – – – – – 12,726 AA- – – – – – 9 9 A1 551 – – – – – 551 A2 2,032 31,914 – – – – 33,946 A3 230 – – – – – 230 BAA1 314 – – – – – 314 C 1,463 – – – – – 1,463
S&P AA 53 – – – – – 53 AA- 2,469 – – – – – 2,469 A+ 61,336 – – – – – 61,336 A 2,026 61,355 – – – – 63,381 A- 31,863 – – – – – 31,863
Government back 854,144 – 1,491,995 4,932,081 768,102 1,467 8,047,789 Unrated [Note] 43,982 169 – 2,833,378 27,154 5,254 2,909,937
1,683,092 97,713 1,491,995 8,983,101 795,256 23,712 13,074,869

156 ALLIANCE FINANCIAL GROUP BERHAD (6627-X)
Notes to the Financial Statements31 March 2012
43. FINANCIAL RISK MANAGEMENT POLICIES (cont’d)
(a) Credit Risk (cont’d)
(vi) Credit quality - Financial instruments (cont’d)
Deposits and placements Financial Financial Financial Cash and with assets investments investments Derivative short-term financial held-for- available- held-to- financial funds instituitions trading for-sale maturity assets Total RM’000 RM’000 RM’000 RM’000 RM’000 RM’000 RM’000
Group 2011
By rating agencies RAM AAA 86,461 – – 831,253 – 23,265 940,979
AA1 10 – – 337,646 – 60 337,716 AA2 211 – – 51,098 – 3,556 54,865 AA3 – – – 32,193 – 6 32,199 A1 33,499 50,029 – – – 1,032 84,560 C3 – – – 7,003 – – 7,003
MARC AAA – – – 240,381 – – 240,381 AA- – – – 31,610 – 2,338 33,948
FITCH AA- 597 – – – – – 597 A1 6,294 – – – – – 6,294 A+ – – – – – 5 5
MOODY AA1 3,357 – – – – – 3,357 AA3 5,747 – – – – – 5,747 A1 563 – – – – – 563 A2 2,068 – – – – – 2,068 A3 402 – – – – – 402 BAA1 795 – – – – – 795 C 699 – – – – – 699
S&P AA 170 – – – – – 170
AA- 978 – – – – – 978 A 1,516 – – – – – 1,516
Government back 524,797 – 1,938,250 4,464,571 910,444 – 7,838,062 Unrated [Note] 36,005 50,199 – 3,142,723 30,282 1,785 3,260,994
704,169 100,228 1,938,250 9,138,478 940,726 32,047 12,853,898
Note:
Unrated financial instruments comprises placements with financial institutions where credit rating is not available and also investment in banker’ acceptances, negotiable instruments of deposits and certain debt securities that are not rated.

1572012 ANNUAL REPORT
Notes to the Financial Statements31 March 2012
43. FINANCIAL RISK MANAGEMENT POLICIES (cont’d)
(b) Market Risk
Market risk refers to the risk that fair value of future cash flows of a financial instrument will fluctuate because of the movement in the market rates or prices; the main components being interest rate risk and foreign exchange risk.
The Group has established a framework of approved risk policies, measurement methodologies and risk limits as approved by the Group Risk Management Committee for overall management of market risk. Market risk arising from the trading activities is controlled via position limits, sensitivity limits and regular revaluation of positions versus current market quotations.
The Group is also susceptible to exposure to market risk arising from changes in prices of the shares quoted on Bursa Malaysia, which will impact on the Group’s balances due from clients and brokers. The risk is controlled by application of credit approvals, limits and monitoring procedures.
(i) Interest/profit rate risk
As a subset of market risk, interest rate/profit rate risk refers to the volatility in net interest/profit income as a result of changes in interest rate levels/rate of return and shifts in the composition of the assets and liabilities. Interest rate/rate of return risk is managed through interest rate sensitivity analysis. The potential reduction in net interest/profit income from an unfavourable interest/profit rate movement is monitored and reported to Management. In addition to pre-scheduled meetings, Group Assets and Liabilities Committee (“ALCO”) members will also deliberate on revising the Bank’s lending/financing and deposit rates in response to changes in the benchmark rates set by the central bank.
The effects of changes in the levels of interest rates on the market value of securities are monitored closely and mark-to-market valuations are regularly reported to Management.
The Group are exposed to various risks associated with the effects of fluctuations in the prevailing levels of market interest rates on its financial position and cash flows. The effects of changes in the levels of interest rates on the market value of securities are monitored regularly and the outcome of mark-to-market valuations are escalated to Management regularly. The table below summarises the effective interest rates at the end of reporting period and the periods in which the financial instruments will re-price or mature, whichever is the earlier.

158 ALLIANCE FINANCIAL GROUP BERHAD (6627-X)
Note
s to
the
Fina
ncia
l Sta
tem
ents
31 M
arch
201
2
43.
FINA
NCIA
L RI
SK M
ANAG
EMEN
T PO
LICI
ES (c
ont’d
)
(b)
Mar
ket R
isk
(con
t’d)
(i)
Inte
rest
/pro
fit ra
te ri
sk (c
ont’d
)
No
n-tra
ding
boo
k
Non-
Ef
fect
ive
in
tere
st/
inte
rest
/
Up to
>1
– 3
>3
– 6
>6
– 1
2
>1 –
5
Over
5
pro
fit
Trad
ing
prof
itGr
oup
1
mon
th
mon
ths
mon
ths
m
onth
s y
ears
y
ears
se
nsiti
ve
boo
k T
otal
ra
te20
12
RM’0
00
RM’0
00
RM
’000
RM
’000
RM
’000
RM
’000
R
M’0
00
RM’0
00
RM
’000
%
Asse
tsCa
sh a
nd s
hort-
term
fund
s 1,
384,
073
– –
– –
– 49
0,26
0 –
1,87
4,33
3 3.
04De
posit
s an
d pl
acem
ents
with
ban
ks
and
othe
r fin
ancia
l ins
titut
ions
–
93,1
38
4,42
9 –
– –
146
– 97
,713
2.
32Ba
lanc
es d
ue fr
om c
lient
s an
d br
oker
s 1,
631
– –
– –
– 60
,067
–
61,6
98
12.0
0Fi
nanc
ial a
sset
s he
ld-fo
r-tra
ding
–
– –
– –
– –
1,49
1,99
5 1,
491,
995
3.00
Fina
ncia
l inv
estm
ents
ava
ilabl
e-fo
r-sa
le
953,
177
1,91
0,03
1 15
0,48
5 88
,717
2,
493,
255
3,31
4,23
5 21
3,30
1 –
9,12
3,20
1 3.
79Fi
nanc
ial i
nves
tmen
ts h
eld-
to-m
atur
ity
– 50
,081
13
4,35
9 11
,992
35
7,15
4 23
3,11
4 8,
556
– 79
5,25
6 3.
55De
rivat
ive fi
nanc
ial a
sset
s - T
radi
ng d
eriva
tives
–
– –
– –
– –
23,7
12
23,7
12
–Lo
ans,
adv
ance
s an
d fin
ancin
g 18
,988
,098
1,
013,
570
338,
603
608,
585
1,48
5,71
8 1,
976,
860
(51,
231)
* –
24,3
60,2
03
5.46
Othe
r non
-inte
rest
/pro
fit
sens
itive
bal
ance
s –
– –
– –
– 1,
775,
374
– 1,
775,
374
–
Tota
l ass
ets
21,3
26,9
79
3,06
6,82
0 62
7,87
6 70
9,29
4 4,
336,
127
5,52
4,20
9 2,
496,
473
1,51
5,70
7 39
,603
,485
Liab
ilitie
sDe
posit
s fro
m c
usto
mer
s 15
,942
,492
3,
716,
695
2,35
3,81
3 5,
203,
955
87,6
47
40,2
78
4,78
6,08
2 –
32,1
30,9
62
2.31
Depo
sits
and
plac
emen
ts o
f ban
ks
and
othe
r fin
ancia
l ins
titut
ions
77
1,75
3 46
2,66
2 22
6,14
0 61
,329
62
8,46
2 –
10,6
59
– 2,
161,
005
2.02
Bala
nces
due
to c
lient
s an
d br
oker
s 38
,858
–
– –
– –
36,0
57
– 74
,915
2.
90Bi
lls a
nd a
ccep
tanc
es p
ayab
le
14
40
124
– –
– –
– 17
8 3.
36De
rivat
ive fi
nanc
ial l
iabi
litie
s- T
radi
ng d
eriva
tives
–
– –
– –
– –
25,8
18
25,8
18
–- H
edgi
ng d
eriva
tives
–
– –
– –
423
– –
423
–Am
ount
due
to C
agam
as B
erha
d –
– 1,
634
9,56
6 10
,844
–
– –
22,0
44
4.54
Subo
rdin
ated
obl
igat
ions
–
– –
– 59
7,82
9 –
13,7
86
– 61
1,61
5 4.
92
Tota
l lia
bilit
ies
carr
ied
forw
ard
16,7
53,1
17
4,17
9,39
7 2,
581,
711
5,27
4,85
0 1,
324,
782
40,7
01
4,84
6,58
4 25
,818
35
,026
,960

1592012 ANNUAL REPORT
Note
s to
the
Fina
ncia
l Sta
tem
ents
31 M
arch
201
2
43.
FINA
NCIA
L RI
SK M
ANAG
EMEN
T PO
LICI
ES (c
ont’d
)
(b)
Mar
ket R
isk
(con
t’d)
(i)
Inte
rest
/pro
fit ra
te ri
sk (c
ont’d
)
No
n-tra
ding
boo
k
Non-
Ef
fect
ive
in
tere
st/
inte
rest
/
Up to
>1
– 3
>3
– 6
>6
– 1
2
>1 –
5
Over
5
pro
fit
Trad
ing
prof
itGr
oup
1
mon
th
mon
ths
mon
ths
m
onth
s y
ears
y
ears
se
nsiti
ve
boo
k T
otal
ra
te20
12
RM’0
00
RM’0
00
RM
’000
RM
’000
RM
’000
RM
’000
R
M’0
00
RM’0
00
RM
’000
%
Tota
l lia
bilit
ies
brou
ght f
orw
ard
16,7
53,1
17
4,17
9,39
7 2,
581,
711
5,27
4,85
0 1,
324,
782
40,7
01
4,84
6,58
4 25
,818
35
,026
,960
Othe
r non
-inte
rest
/pro
fit
sens
itive
bal
ance
s –
– –
– –
– 90
1,19
1 –
901,
191
–
Tota
l lia
bilit
ies
16,7
53,1
17
4,17
9,39
7 2,
581,
711
5,27
4,85
0 1,
324,
782
40,7
01
5,74
7,77
5 25
,818
35
,928
,151
Equi
ty
– –
– –
– –
3,67
0,42
9 –
3,67
0,42
9 –
Non-
cont
rollin
g in
tere
sts
– –
– –
– –
4,90
5 –
4,90
5 –
Tota
l lia
bilit
ies
and
equi
ty
16,7
53,1
17
4,17
9,39
7 2,
581,
711
5,27
4,85
0 1,
324,
782
40,7
01
9,42
3,10
9 25
,818
39
,603
,485
On-b
alan
ce s
heet
inte
rest
se
nsiti
vity
gap
4,57
3,86
2 (1
,112
,577
) (1
,953
,835
) (4
,565
,556
) 3,
011,
345
5,48
3,50
8 (6
,926
,636
) 1,
489,
889
–
* Im
paire
d lo
ans,
indi
vidua
l ass
essm
ent a
llow
ance
and
col
lect
ive a
sses
smen
t allo
wan
ce o
f the
Gro
up a
re c
lass
ified
und
er th
e no
n-in
tere
st/p
rofit
sen
sitive
col
umn.

160 ALLIANCE FINANCIAL GROUP BERHAD (6627-X)
Note
s to
the
Fina
ncia
l Sta
tem
ents
31 M
arch
201
2
43.
FINA
NCIA
L RI
SK M
ANAG
EMEN
T PO
LICI
ES (c
ont’d
)
(b)
Mar
ket R
isk
(con
t’d)
(i)
Inte
rest
/pro
fit ra
te ri
sk (c
ont’d
)
No
n-tra
ding
boo
k
Non-
Ef
fect
ive
in
tere
st/
inte
rest
/
Up to
>1
– 3
>3
– 6
>6
– 1
2
>1 –
5
Over
5
pro
fit
Trad
ing
prof
itGr
oup
1
mon
th
mon
ths
mon
ths
m
onth
s y
ears
y
ears
se
nsiti
ve
boo
k T
otal
ra
te20
11
RM’0
00
RM’0
00
RM
’000
RM
’000
RM
’000
RM
’000
R
M’0
00
RM’0
00
RM
’000
%
Asse
tsCa
sh a
nd s
hort-
term
fund
s 41
1,99
8 –
– –
– –
502,
040
– 91
4,03
8 2.
90De
posit
s an
d pl
acem
ents
with
ban
ks
and
othe
r fin
ancia
l ins
titut
ions
–
100,
000
160
– –
– 68
–
100,
228
3.05
Bala
nces
due
from
clie
nts
and
brok
ers
1,07
0 –
– –
– –
79,4
49
– 80
,519
12
.00
Fina
ncia
l ass
ets
held
-for-
tradi
ng
– –
– –
– –
– 1,
938,
250
1,93
8,25
0 2.
82Fi
nanc
ial i
nves
tmen
ts a
vaila
ble-
for-
sale
1,
246,
175
2,14
7,16
2 59
3,50
3 14
0,83
7 2,
761,
012
2,18
7,04
8 18
4,20
3 –
9,25
9,94
0 3.
50Fi
nanc
ial i
nves
tmen
ts h
eld-
to-m
atur
ity
10,0
09
– 63
3,48
0 –
292,
381
– 4,
856
– 94
0,72
6 2.
75De
rivat
ive fi
nanc
ial a
sset
s- T
radi
ng d
eriva
tives
–
– –
– –
– –
32,0
47
32,0
47
–Lo
ans,
adv
ance
s an
d fin
ancin
g 16
,882
,804
1,
413,
040
336,
274
222,
518
1,45
8,63
6 1,
409,
734
73,3
13*
– 21
,796
,319
5.
67Ot
her n
on-in
tere
st/p
rofit
se
nsiti
ve b
alan
ces
– –
– –
– –
1,00
9,86
9 –
1,00
9,86
9 –
Tota
l ass
ets
18,5
52,0
56
3,66
0,20
2 1,
563,
417
363,
355
4,51
2,02
9 3,
596,
782
1,85
3,79
8 1,
970,
297
36,0
71,9
36
Liab
ilitie
sDe
posit
s fro
m c
usto
mer
s 13
,893
,485
3,
176,
893
2,48
4,73
5 4,
129,
928
91,3
35
– 4,
569,
271
– 28
,345
,647
2.
19De
posit
s an
d pl
acem
ents
of b
anks
an
d ot
her f
inan
cial i
nstit
utio
ns
968,
458
61,1
96
8,95
2 23
,447
88
2,91
1 –
7,23
6 –
1,95
2,20
0 2.
13Ba
lanc
es d
ue to
clie
nts
and
brok
ers
34,5
16
– –
– –
– 52
,227
–
86,7
43
2.55
Bills
and
acc
epta
nces
pay
able
86
,161
24
,948
50
–
– –
– –
111,
159
3.04
Deriv
ative
fina
ncia
l lia
bilit
ies
- Tra
ding
der
ivativ
es
– –
– –
– –
– 33
,347
33
,347
–
Amou
nt d
ue to
Cag
amas
Ber
had
– –
– 10
0,00
0 25
,134
–
642
– 12
5,77
6 3.
77Su
bord
inat
ed o
blig
atio
ns
– 60
0,00
0 –
– –
– –
– 60
0,00
0 6.
09
Tota
l lia
bilit
ies
carr
ied
forw
ard
14,9
82,6
20
3,86
3,03
7 2,
493,
737
4,25
3,37
5 99
9,38
0 –
4,62
9,37
6 33
,347
31
,254
,872
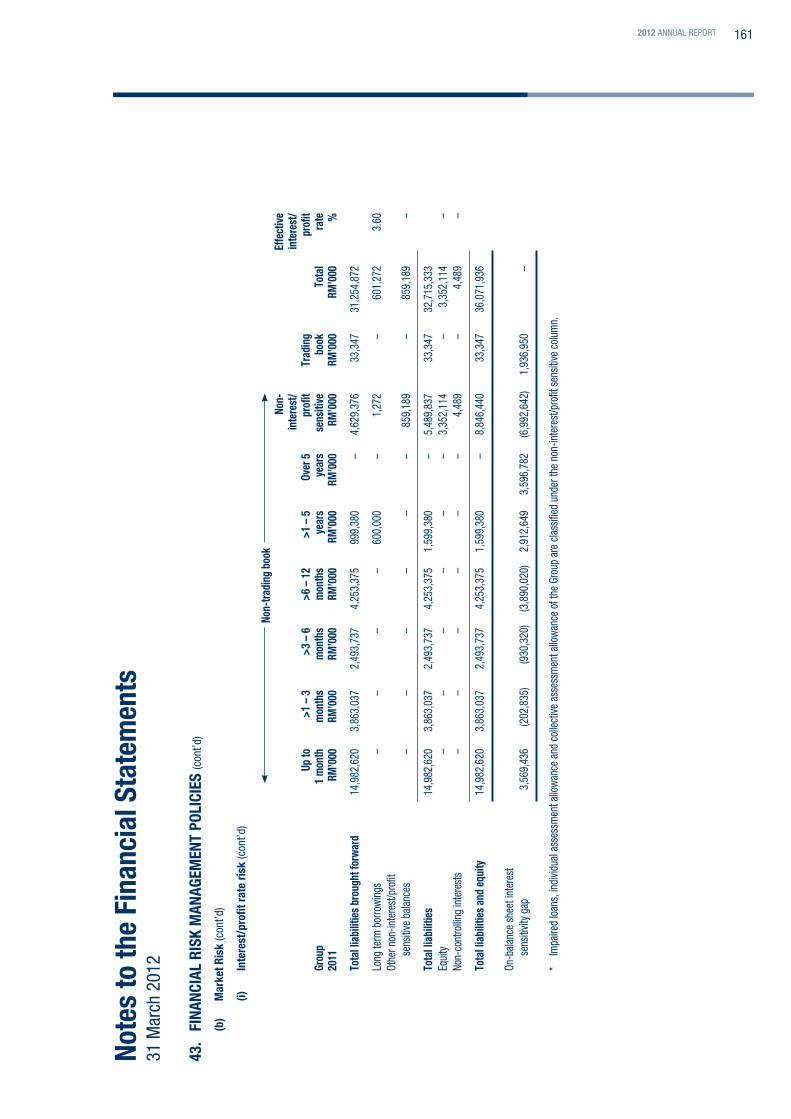
1612012 ANNUAL REPORT
Note
s to
the
Fina
ncia
l Sta
tem
ents
31 M
arch
201
2
43.
FINA
NCIA
L RI
SK M
ANAG
EMEN
T PO
LICI
ES (c
ont’d
)
(b)
Mar
ket R
isk
(con
t’d)
(i)
Inte
rest
/pro
fit ra
te ri
sk (c
ont’d
)
No
n-tra
ding
boo
k
Non-
Ef
fect
ive
in
tere
st/
inte
rest
/
Up to
>1
– 3
>3
– 6
>6
– 1
2
>1 –
5
Over
5
pro
fit
Trad
ing
prof
itGr
oup
1
mon
th
mon
ths
mon
ths
m
onth
s y
ears
y
ears
se
nsiti
ve
boo
k T
otal
ra
te20
11
RM’0
00
RM’0
00
RM
’000
RM
’000
RM
’000
RM
’000
R
M’0
00
RM’0
00
RM
’000
%
Tota
l lia
bilit
ies
brou
ght f
orw
ard
14,9
82,6
20
3,86
3,03
7 2,
493,
737
4,25
3,37
5 99
9,38
0 –
4,62
9,37
6 33
,347
31
,254
,872
Long
term
bor
row
ings
–
– –
– 60
0,00
0 –
1,27
2 –
601,
272
3.60
Othe
r non
-inte
rest
/pro
fit
sens
itive
bal
ance
s –
– –
– –
– 85
9,18
9 –
859,
189
–
Tota
l lia
bilit
ies
14,9
82,6
20
3,86
3,03
7 2,
493,
737
4,25
3,37
5 1,
599,
380
– 5,
489,
837
33,3
47
32,7
15,3
33Eq
uity
–
– –
– –
– 3,
352,
114
– 3,
352,
114
–No
n-co
ntro
lling
inte
rest
s –
– –
– –
– 4,
489
– 4,
489
–
Tota
l lia
bilit
ies
and
equi
ty
14,9
82,6
20
3,86
3,03
7 2,
493,
737
4,25
3,37
5 1,
599,
380
– 8,
846,
440
33,3
47
36,0
71,9
36
On-b
alan
ce s
heet
inte
rest
se
nsiti
vity
gap
3,56
9,43
6 (2
02,8
35)
(930
,320
) (3
,890
,020
) 2,
912,
649
3,59
6,78
2 (6
,992
,642
) 1,
936,
950
–
* Im
paire
d lo
ans,
indi
vidua
l ass
essm
ent a
llow
ance
and
col
lect
ive a
sses
smen
t allo
wan
ce o
f the
Gro
up a
re c
lass
ified
und
er th
e no
n-in
tere
st/p
rofit
sen
sitive
col
umn.

162 ALLIANCE FINANCIAL GROUP BERHAD (6627-X)
Note
s to
the
Fina
ncia
l Sta
tem
ents
31 M
arch
201
2
43.
FINA
NCIA
L RI
SK M
ANAG
EMEN
T PO
LICI
ES (c
ont’d
)
(b)
Mar
ket R
isk
(con
t’d)
(i)
Inte
rest
/pro
fit ra
te ri
sk (c
ont’d
)
No
n-tra
ding
boo
k
Non-
Effe
ctiv
e
Up to
>1
– 3
>3
– 6
>6
– 1
2
>1 –
5
Over
5
inte
rest
inte
rest
Com
pany
1
mon
th
mon
ths
m
onth
s
mon
ths
yea
rs
yea
rs
sens
itive
T
otal
ra
te20
12
RM’0
00
RM’0
00
RM’0
00
RM’0
00
RM’0
00
RM’0
00
RM
’000
RM
’000
%
Asse
tsCa
sh a
nd s
hort-
term
fund
s 6,
477
– –
– –
– 24
6,
501
2.96
Depo
sits
and
plac
emen
ts w
ith b
anks
an
d ot
her f
inan
cial i
nstit
utio
ns
– –
19,2
64
– –
– 51
19
,315
3.
17Ot
her n
on-in
tere
st
sens
itive
bal
ance
s –
– –
– –
– 1,
779,
052
1,77
9,05
2 –
Tota
l ass
ets
6,47
7 –
19,2
64
– –
– 1,
779,
127
1,80
4,86
8
Liab
ilitie
sOt
her n
on-in
tere
st
sens
itive
bal
ance
s –
– –
– –
– 4,
354
4,35
4 –
Tota
l lia
bilit
ies
– –
– –
– –
4,35
4 4,
354
Equi
ty
– –
– –
– –
1,80
0,51
4 1,
800,
514
–
Tota
l lia
bilit
ies
and
equi
ty
– –
– –
– –
1,80
4,86
8 1,
804,
868

1632012 ANNUAL REPORT
Note
s to
the
Fina
ncia
l Sta
tem
ents
31 M
arch
201
2
43.
FINA
NCIA
L RI
SK M
ANAG
EMEN
T PO
LICI
ES (c
ont’d
)
(b)
Mar
ket R
isk
(con
t’d)
(i)
Inte
rest
/pro
fit ra
te ri
sk (c
ont’d
)
No
n-tra
ding
boo
k
Non-
Effe
ctiv
e
Up to
>1
– 3
>3
– 6
>6
– 1
2
>1 –
5
Over
5
inte
rest
inte
rest
Com
pany
1
mon
th
mon
ths
m
onth
s
mon
ths
yea
rs
yea
rs
sens
itive
T
otal
ra
te20
11
RM’0
00
RM’0
00
RM’0
00
RM’0
00
RM’0
00
RM’0
00
RM
’000
RM
’000
%
Asse
tsCa
sh a
nd s
hort-
term
fund
s 46
,763
–
– –
– –
95
46,8
58
2.74
Depo
sits
and
plac
emen
ts w
ith b
anks
an
d ot
her f
inan
cial i
nstit
utio
ns
– –
– 40
0,00
0 20
0,00
0 –
5,70
0 60
5,70
0 2.
76Ot
her n
on-in
tere
st
sens
itive
bal
ance
s –
– –
– –
– 1,
779,
076
1,77
9,07
6 –
Tota
l ass
ets
46,7
63
– –
400,
000
200,
000
– 1,
784,
871
2,43
1,63
4
Liab
ilitie
sLo
ng te
rm b
orro
win
gs
– –
– –
600,
000
– 1,
272
601,
272
3.60
Othe
r non
-inte
rest
se
nsiti
ve b
alan
ces
– –
– –
– –
1,52
9 1,
529
–
Tota
l lia
bilit
ies
– –
– –
600,
000
– 2,
801
602,
801
Equi
ty
– –
– –
– –
1,82
8,83
3
1,82
8,83
3 –
Tota
l lia
bilit
ies
and
equi
ty
– –
– –
600,
000
– 1,
831,
634
2,43
1,63
4

164 ALLIANCE FINANCIAL GROUP BERHAD (6627-X)
Notes to the Financial Statements31 March 2012
43. FINANCIAL RISK MANAGEMENT POLICIES (cont’d)
(b) Market Risk (cont’d)
(ii) Foreign currency exchange risk
Foreign currency exchange risk refers to the risk that fair value of future cash flows of a financial instrument will fluctuate because of the movements in the exchange rates for foreign currency exchange positions taken by the Group from time to time. For the Group, foreign exchange risk is concentrated in its commercial banking. Foreign currency exchange risk is managed via approved risk limits and open positions are regularly revalued against current exchange rates and reported to Management.
The following table summarises the assets, liabilities and net open position by currency as at the end of financial reporting period, which are mainly in US, Singapore, Euro and Australian Dollars. Other foreign exchange exposures include exposure to Japanese Yen, Pound Sterling and New Zealand Dollars.
Singapore Euro Australian Group US Dollars Dollars Dollars Dollars Others Total 2012 RM’000 RM’000 RM’000 RM’000 RM’000 RM’000
AssetsCash and short-term funds 18,243 531 2,101 1,733 9,751 32,359Deposits and placements with banks
and other financial institutions 123,304 – – 128,288 – 251,592Loans, advances and financing 277,991 – 817 1,047 3,025 282,880Other financial assets 1,998 – – 2 9 2,009
Total financial assets 421,536 531 2,918 131,070 12,785 568,840
LiabilitiesDeposits from customers 140,435 13,944 11,489 76,066 41,668 283,602Deposits and placements of banks
and other financial institutions 456,778 3,351 816 31,854 17 492,816Other financial liabilities 429 1 – – 11 441
Total financial liabilities 597,642 17,296 12,305 107,920 41,696 776,859
On-balance sheet open position (176,106) (16,765) (9,387) 23,150 (28,911) (208,019)Off-balance sheet open position 175,430 24,034 12,081 (24,927) 39,632 226,250
Net open position (676) 7,269 2,694 (1,777) 10,721 18,231
Group 2011
AssetsCash and short-term funds 12,389 2,339 – – 58,245 72,973Loans, advances and financing 163,961 – 1,583 – 3,425 168,969Other financial assets 7,384 – – 38 4 7,426
Total financial assets 183,734 2,339 1,583 38 61,674 249,368
LiabilitiesDeposits from customers 163,167 1,680 11,069 34,882 20,718 231,516Deposits and placements of banks
and other financial institutions 30,258 – – – 159 30,417Other financial liabilities 578 12 11 106 8 715
Total financial liabilities 194,003 1,692 11,080 34,988 20,885 262,648
On-balance sheet open position (10,269) 647 (9,497) (34,950) 40,789 (13,280)Off-balance sheet open position 8,285 5,882 6,575 (2,603) 6,005 24,144
Net open position (1,984) 6,529 (2,922) (37,553) 46,794 10,864

1652012 ANNUAL REPORT
Notes to the Financial Statements31 March 2012
43. FINANCIAL RISK MANAGEMENT POLICIES (cont’d)
(b) Market Risk (cont’d)
(iii) Value at risk (‘VaR’)
Value-at-risk (VaR) reflects the maximum potential loss of value of a portfolio resulting from market movements within a specified probability of occurrence (level of confidence); for a specific period of time (holding period). For the Group, VaR is computed based on the historical simulation approach with parameters in accordance with BNM and Basel requirements. Backtesting is performed daily to validate and reassess the accuracy of the VaR model. This involves the comparison of the daily VaR values against the actual profit and loss over the corresponding period.
The table below sets out a summary of the Group’s VaR profile by financial instrument types for the Trading Portfolio:
AverageGroup Balance for the year Minimum Maximum2012 RM’000 RM’000 RM’000 RM’000
Instruments:FX swap (549) (885) (18) (44,087)Government securities (12,291) (14,765) (6,452) (41,399)Private debt securities (1,707) (4,477) (1,045) (7,999)
2011
Instruments:FX swap (770) (525) (272) (989)Government securities (11,487) (7,650) (4,256) (12,201)Private debt securities (5,144) (3,641) (1,870) (6,456)
(iv) Interest rate risk/rate of return risk in the banking book
The following tables present the Group’s projected sensitivity to a 100 basis point parallel shock to interest rates across all maturities applied on the Group’s interest sensitivity gap as at reporting date.
2012 2011 Group Group - 100 bps + 100 bps - 100 bps + 100 bps Increase/(Decrease) Increase/(Decrease) RM’000 RM’000 RM’000 RM’000
Impact on net interest income Ringgit Malaysia (53,366) 53,366 (44,616) 44,616
As percentage of net interest income (5.7%) 5.7% (4.9%) 4.9%
Note:
The foreign currency impact on net interest income is considered insignificant as the exposure is less than 5% of Banking Book assets/liabilities.

166 ALLIANCE FINANCIAL GROUP BERHAD (6627-X)
Notes to the Financial Statements31 March 2012
43. FINANCIAL RISK MANAGEMENT POLICIES (cont’d)
(b) Market Risk (cont’d)
Other risk measures
(v) Stress test
Stress testing is normally used by banks to gauge their potential vulnerability to exceptional but plausible events. The Group performs stress testing regularly to measure and alert management on the effects of potential political, economic or other disruptive events on our exposures. The Group’s stress testing process is governed by the Stress Testing Framework as approved by the Board. Stress testing are conducted on a bank-wide basis as well as on specific portfolios. The Group’s bank-wide stress testing exercise uses a variety of broad macroeconomic indicators that are then translated into stress impacts on the various business units. The results are then consolidated to provide an overall impact on the Group’s financial results and capital requirements. Stress testing results are reported to management to provide them with an assessment of the financial impact of such events would have on the Group’s profitability and capital levels.
(vi) Sensitivity analysis
Sensitivity analysis is used to measure the impact of changes in individual stress factors such as interest/profit rates or foreign exchange rates. It is normally designed to isolate and quantify exposure to the underlying risk. The Group performs sensitivity analysis such as parallel shifts of interest/profit rates (in increment of 25 basis points) on its exposures, primarily on the banking and trading book positions.
(vii) Displaced Commercial Risk
Displaced commercial risk arises from the Group’s Islamic financial services offered under Alliance Islamic Bank Berhad. It refers to the risk of losses which the Islamic Bank absorbs to make sure that Investment Account Holders are paid in rate of return equivalent to a competitive market rate of return.This risk arises when the actual rate of return is lower than returns expected by Investment Account Holders.
(c) Liquidity Risk
Liquidity risk relates to the Group’s ability to maintain adequate liquid assets so as to punctually meet its financial obligations and commitments when due. Market liquidity risk refers to the potential risk that the Group is unable to liquidate its assets/securities at or near the previous market price due to inadequate market depth or disruptions to the marketplace.
The Group’s liquidity risk profile is managed using Bank Negara Malaysia’s New Liquidity Framework, other internal policies and ALCO benchmarks. A contingency funding plan is also established by the Group as a forward-looking measure to ensure that liquidity risk can be addressed according to the degrees of key risk indicators, and which incorporates alternative funding strategies which are ready to be implemented on a timely basis to mitigate the impact of unforeseen adverse changes in liquidity in the marketplace.

1672012 ANNUAL REPORT
Notes to the Financial Statements31 March 2012
43. FINANCIAL RISK MANAGEMENT POLICIES (cont’d)
(c) Liquidity Risk (cont’d)
(i) Liquidity risk for assets and liabilities based on remaining contractual maturities
The maturities of on-balance sheet assets and liabilities as well as other off-balance sheet assets and liabilities, commitments and counter-guarantees are important factors in assessing the liquidity of the Group. The table below provides analysis of assets and liabilities into relevant maturity terms based on remaining contractual maturities:
Up to >1 – 3 >3 – 6 >6 – 12 Group 1 month months months months >1 year Total2012 RM’000 RM’000 RM’000 RM’000 RM’000 RM’000
AssetsCash and short-term funds 1,874,333 – – – – 1,874,333Deposits and placements with
banks and other financial institutions – 93,270 4,443 – – 97,713
Balances due from clients and brokers 42,207 – – – 19,491 61,698
Financial investments 1,031,877 2,922,378 697,092 97,906 6,661,199 11,410,452Loans, advances and
financing 4,969,403 1,549,577 987,148 598,935 16,255,140 24,360,203Other asset balances 36,224 14,328 7,186 7,989 1,733,359 1,799,086
Total assets 7,954,044 4,579,553 1,695,869 704,830 24,669,189 39,603,485
LiabilitiesDeposits from customers 20,654,834 3,736,550 2,376,978 5,228,010 134,590 32,130,962Deposits and placements
of banks and other financial institutions 770,600 471,339 226,276 64,329 628,461 2,161,005
Balances due to clients and brokers 73,802 – – – 1,113 74,915
Bills and acceptances payable 14 40 124 – – 178Amount due to Cagamas Berhad – – 1,634 9,566 10,844 22,044Subordinated obligations 13,786 – – – 597,829 611,615Other financial liabilities 577,720 37,538 23,573 44,941 243,660 927,432
Total financial liabilities 22,090,756 4,245,467 2,628,585 5,346,846 1,616,497 35,928,151Equity – – – – 3,670,429 3,670,429Non-controlling interests – – – – 4,905 4,905
Total liabilities and equity 22,090,756 4,245,467 2,628,585 5,346,846 5,291,831 39,603,485
Net maturity mismatch (14,136,712) 334,086 (932,716) (4,642,016) 19,377,358 –

168 ALLIANCE FINANCIAL GROUP BERHAD (6627-X)
Notes to the Financial Statements31 March 2012
43. FINANCIAL RISK MANAGEMENT POLICIES (cont’d)
(c) Liquidity Risk (cont’d)
(i) Liquidity risk for assets and liabilities based on remaining contractual maturities (cont’d)
Up to >1 – 3 >3 – 6 >6 – 12 Group 1 month months months months >1 year Total2011 RM’000 RM’000 RM’000 RM’000 RM’000 RM’000
AssetsCash and short-term funds 914,038 – – – – 914,038Deposits and placements with
banks and other financial institutions – 100,065 163 – – 100,228
Balances due from clients and brokers 61,441 – – – 19,078 80,519
Financial investments 2,122,429 3,187,345 809,576 932,379 5,087,187 12,138,916Loans, advances and financing 4,790,087 1,471,389 945,286 557,078 14,032,479 21,796,319Other asset balances 26,137 7,797 9,203 2,878 995,901 1,041,916
Total assets 7,914,132 4,766,596 1,764,228 1,492,335 20,134,645 36,071,936
LiabilitiesDeposits from customers 18,396,643 3,205,854 2,505,723 4,146,075 91,352 28,345,647Deposits and placements of
banks and other financial institutions 971,566 61,203 13,074 23,447 882,910 1,952,200
Balances due to clients and brokers 85,200 – – – 1,543 86,743
Bills and acceptances payable 86,161 24,948 50 – – 111,159Amount due to Cagamas Berhad 514 294 766 101,562 22,640 125,776Subordinated obligations – 600,000 – – – 600,000Long term borrowings 1,272 – – – 600,000 601,272Other financial liabilities 539,469 39,671 24,365 48,729 240,302 892,536
Total financial liabilities 20,080,825 3,931,970 2,543,978 4,319,813 1,838,747 32,715,333Equity – – – – 3,352,114 3,352,114Non-controlling interests – – – – 4,489 4,489
Total liabilities and equity 20,080,825 3,931,970 2,543,978 4,319,813 5,195,350 36,071,936
Net maturity mismatch (12,166,693) 834,626 (779,750) (2,827,478) 14,939,295 –
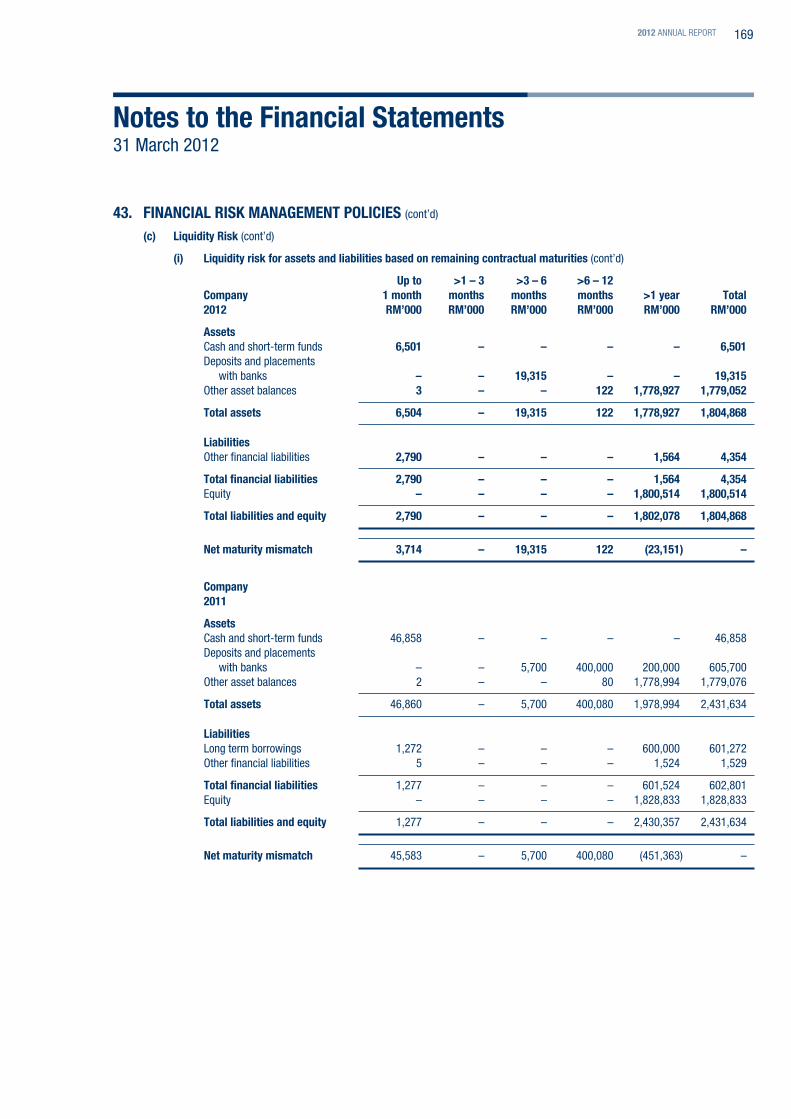
1692012 ANNUAL REPORT
Notes to the Financial Statements31 March 2012
43. FINANCIAL RISK MANAGEMENT POLICIES (cont’d)
(c) Liquidity Risk (cont’d)
(i) Liquidity risk for assets and liabilities based on remaining contractual maturities (cont’d)
Up to >1 – 3 >3 – 6 >6 – 12 Company 1 month months months months >1 year Total2012 RM’000 RM’000 RM’000 RM’000 RM’000 RM’000
AssetsCash and short-term funds 6,501 – – – – 6,501Deposits and placements
with banks – – 19,315 – – 19,315Other asset balances 3 – – 122 1,778,927 1,779,052
Total assets 6,504 – 19,315 122 1,778,927 1,804,868
LiabilitiesOther financial liabilities 2,790 – – – 1,564 4,354
Total financial liabilities 2,790 – – – 1,564 4,354Equity – – – – 1,800,514 1,800,514
Total liabilities and equity 2,790 – – – 1,802,078 1,804,868
Net maturity mismatch 3,714 – 19,315 122 (23,151) –
Company 2011
AssetsCash and short-term funds 46,858 – – – – 46,858Deposits and placements
with banks – – 5,700 400,000 200,000 605,700Other asset balances 2 – – 80 1,778,994 1,779,076
Total assets 46,860 – 5,700 400,080 1,978,994 2,431,634
LiabilitiesLong term borrowings 1,272 – – – 600,000 601,272Other financial liabilities 5 – – – 1,524 1,529
Total financial liabilities 1,277 – – – 601,524 602,801Equity – – – – 1,828,833 1,828,833
Total liabilities and equity 1,277 – – – 2,430,357 2,431,634
Net maturity mismatch 45,583 – 5,700 400,080 (451,363) –

170 ALLIANCE FINANCIAL GROUP BERHAD (6627-X)
43.
FINA
NCIA
L RI
SK M
ANAG
EMEN
T PO
LICI
ES (c
ont’d
)
(c)
Liqu
idity
Ris
k (c
ont’d
)
(ii)
Cont
ract
ual m
atur
ity o
f fin
anci
al li
abili
ties
on a
n un
disc
ount
ed b
asis
The
tabl
e be
low
pre
sent
s th
e ca
sh fl
ows
paya
ble
by th
e Gr
oup
unde
r fin
anci
al li
abili
ties
by r
emai
ning
con
tract
ual m
atur
ities
at t
he e
nd o
f the
rep
ortin
g pe
riod.
The
am
ount
di
sclo
sed
in th
e ta
ble
are
the
cont
ract
ual u
ndis
coun
ted
cash
flow
s of
all
finan
cial
liab
ilitie
s (i.
e. n
omin
al v
alue
s), w
hich
the
Grou
p m
anag
es th
e in
here
nt li
quid
ity ri
sk b
ased
on
disc
ount
ed e
xpec
ted
cash
inflo
ws.
Grou
p Up
to 1
mon
th
>1-
3 m
onth
s
>3-6
mon
ths
>6-
12 m
onth
s >
1-5
year
s O
ver 5
yea
rs
Tota
l20
12
RM’0
00
RM’0
00
RM
’000
R
M’0
00
RM
’000
R
M’0
00
RM’0
00
Non
deriv
ativ
e fin
anci
al li
abili
ties
Depo
sits
from
cus
tom
ers
20,9
86,0
96
3,79
3,93
2 2,
415,
161
5,32
6,81
7 10
5,59
5 45
,994
32
,673
,595
Depo
sits
and
plac
emen
ts o
f ban
ks a
nd o
ther
fina
ncia
l ins
titut
ions
77
1,03
6 47
5,05
1 22
6,94
2 69
,525
64
4,64
6 –
2,18
7,20
0Ba
lanc
es d
ue to
clie
nts
and
brok
ers
73,8
02
– –
– 1,
113
– 74
,915
Bills
and
acc
epta
nces
pay
able
14
40
12
4 –
– –
178
Amou
nt d
ue to
Cag
amas
Ber
had
666
379
2,51
1 9,
697
10,4
66
– 23
,719
Subo
rdin
ated
obl
igat
ions
14
,460
–
– 14
,460
70
1,22
0 –
730,
140
Othe
r fin
ancia
l lia
bilit
ies
575,
661
26,1
49
21,7
51
43,5
02
234,
128
– 90
1,19
1
22
,421
,735
4,
295,
551
2,66
6,48
9 5,
464,
001
1,69
7,16
8 45
,994
36
,590
,938
Item
s no
t rec
ogni
sed
in th
e st
atem
ent o
f fin
ancia
l pos
ition
Fina
ncia
l gua
rant
ees
76,1
73
96,4
67
91,9
71
113,
733
85,5
51
67
463,
962
Cred
it re
late
d co
mm
itmen
ts a
nd c
ontin
genc
ies
8,07
1,14
4 12
4,02
1 56
,918
96
,849
33
7,41
0 4,
322,
685
13,0
09,0
27
8,
147,
317
220,
488
148,
889
210,
582
422,
961
4,32
2,75
2 13
,472
,989
Deriv
ativ
es fi
nanc
ial l
iabi
lites
De
rivat
ives
settl
ed o
n a
net b
asis
Inte
rest
rate
der
ivativ
es
(57)
(7
52)
(624
) (1
,214
) (2
,801
) (4
24)
(5,8
72)
Hedg
ing
deriv
ative
s –
34
35
69
548
102
788
(5
7)
(718
) (5
89)
(1,1
45)
(2,2
53)
(322
) (5
,084
)
Deriv
ative
s se
ttled
on
a gr
oss
basis
Outfl
ow
(544
,827
) (5
97,4
00)
(251
,471
) (5
8,26
4)
– –
(1,4
51,9
62)
Inflo
w
542,
768
586,
117
249,
632
56,8
06
– –
1,43
5,32
3
(2
,059
) (1
1,28
3)
(1,8
39)
(1,4
58)
– –
(16,
639)
Note
s to
the
Fina
ncia
l Sta
tem
ents
31 M
arch
201
2

1712012 ANNUAL REPORT
43.
FINA
NCIA
L RI
SK M
ANAG
EMEN
T PO
LICI
ES (c
ont’d
)
(c)
Liqu
idity
Ris
k (c
ont’d
)
(ii)
Cont
ract
ual m
atur
ity o
f fin
anci
al li
abili
ties
on a
n un
disc
ount
ed b
asis
(con
t’d)
Grou
p Up
to 1
mon
th
>1-
3 m
onth
s
>3-6
mon
ths
>6-
12 m
onth
s >
1-5
year
s O
ver 5
yea
rs
Tota
l20
11
RM’0
00
RM’0
00
RM
’000
R
M’0
00
RM
’000
R
M’0
00
RM’0
00
Non
deriv
ativ
e fin
anci
al li
abili
ties
Depo
sits
from
cus
tom
ers
18,4
96,9
81
3,29
7,27
1 2,
551,
908
4,22
0,32
4 94
,517
–
28,6
61,0
01De
posit
s an
d pl
acem
ents
of b
anks
and
oth
er fi
nanc
ial i
nstit
utio
ns
972,
010
61,5
76
9,26
7 29
,934
91
1,89
0 –
1,98
4,67
7Ba
lanc
es d
ue to
clie
nts
and
brok
ers
85,2
00
– –
– 1,
543
– 86
,743
Bills
and
acc
epta
nces
pay
able
98
,025
32
,884
43
–
– –
130,
952
Amou
nt d
ue to
Cag
amas
Ber
had
665
379
1,04
5 10
5,64
3 23
,716
–
131,
448
Subo
rdin
ated
obl
igat
ions
–
618,
270
– –
– –
618,
270
Long
term
bor
row
ings
1,
775
3,61
0 5,
444
10,8
30
619,
079
– 64
0,73
8Ot
her f
inan
cial l
iabi
litie
s 53
9,46
9 39
,671
24
,365
48
,729
24
0,30
2 –
892,
536
20
,194
,125
4,
053,
661
2,59
2,07
2 4,
415,
460
1,89
1,04
7 –
33,1
46,3
65
Item
s no
t rec
ogni
sed
in th
e st
atem
ent o
f fin
ancia
l pos
ition
Fina
ncia
l gua
rant
ees
83,5
60
79,8
96
92,5
00
124,
509
72,9
05
– 45
3,37
0Cr
edit
rela
ted
com
mitm
ents
and
con
tinge
ncie
s 8,
283,
090
55,9
10
42,8
68
89,1
13
249,
215
1,77
8,83
5 10
,499
,031
8,
366,
650
135,
806
135,
368
213,
622
322,
120
1,77
8,83
5 10
,952
,401
Deriv
ativ
es fi
nanc
ial l
iabi
lites
De
rivat
ives
settl
ed o
n a
net b
asis
Inte
rest
rate
der
ivativ
es
– (2
92)
(91)
82
1,
802
1,38
1 2,
882
Deriv
ative
s se
ttled
on
a gr
oss
basis
Outfl
ow
(87,
071)
(3
80,0
16)
(308
,146
) (4
41,8
39)
– –
(1,2
17,0
72)
Inflo
w
86,4
28
367,
712
299,
925
434,
659
– –
1,18
8,72
4
(6
43)
(12,
304)
(8
,221
) (7
,180
) –
– (2
8,34
8)
Note
s to
the
Fina
ncia
l Sta
tem
ents
31 M
arch
201
2

172 ALLIANCE FINANCIAL GROUP BERHAD (6627-X)
43.
FINA
NCIA
L RI
SK M
ANAG
EMEN
T PO
LICI
ES (c
ont’d
)
(c)
Liqu
idity
Ris
k (c
ont’d
)
(ii)
Cont
ract
ual m
atur
ity o
f fin
anci
al li
abili
ties
on a
n un
disc
ount
ed b
asis
(con
t’d)
Com
pany
Up
to 1
mon
th
>1-
3 m
onth
s
>3-6
mon
ths
>6-
12 m
onth
s >
1-5
year
s O
ver 5
yea
rs
Tota
l20
12
RM’0
00
RM’0
00
RM
’000
R
M’0
00
RM
’000
R
M’0
00
RM’0
00
Othe
r fin
ancia
l lia
bilit
ies
2,79
0 –
– –
1,56
4 –
4,35
4
Tota
l fin
anci
al li
abili
ties
2,79
0 –
– –
1,56
4 –
4,35
4
2011
Long
term
bor
row
ings
1,
775
3,61
0 5,
444
10,8
30
619,
079
– 64
0,73
8 Ot
her f
inan
cial l
iabi
litie
s 5
– –
– 1,
524
– 1,
529
Tota
l fin
anci
al li
abili
ties
1,78
0 3,
610
5,44
4 10
,830
62
0,60
3 –
642,
267
Note
s to
the
Fina
ncia
l Sta
tem
ents
31 M
arch
201
2

1732012 ANNUAL REPORT
Notes to the Financial Statements31 March 2012
43. FINANCIAL RISK MANAGEMENT POLICIES (cont’d)
(d) Operational and Shariah Compliance Risk
Operational risk is the risk of direct or indirect loss resulting from inadequate or failed internal processes, people and systems or from external events. The Shariah Compliance Risk arises from the Bank’s failure to comply with the Shariah rules and principles determined by the relevant Shariah regulatory councils.
Operational and Shariah Compliance risk management is a continual cyclic process which includes risk identification, assessment, control, mitigation and monitoring. This includes analysing the risk profile of the Group, determines any causes of failure, assesses potential loss and enhances controls to reduce/avoid risks.
Every line of business and support departments are responsible for the management of their day-to-day operational and Shariah Compliance risks while support, monitoring and reporting is facilitated by Operational Risk Management Department. Group Internal Audit and Shariah Review Team play the role of providing independent compliance assurance to Management and the Board.
The main activities undertaken by the Group in managing operational and Shariah Compliance risks includes the pre-identification of risks control and self assessments; key risk indicators, reviews of documentation of the Bank’s processes and procedures; conducting operational and Shariah Compliance risk awareness internal training and managing potential crisis events via the mitigation resource of business continuity management.
The Group has implemented regulatory and Basel II requirements for capital charge for operational risk under the Basic Indicator Approach. Ongoing monitoring and periodic policy/process changes are carried out to reduce the Group’s exposure to unexpected losses, improve control and management of operational risk, to cultivate an organizational culture that places a high priority on effective operational risk management and adherence to sound operating controls and best practices.
44. CAPITAL ADEQUACY
The capital adequacy ratios of the banking group are computed in accordance with BNM’s revised Risk-Weighted Capital Adequacy Framework (RWCAF-Basel II). The banking group have adopted the Standardised Approach for credit risk and market risk, and the Basic Indicator Approach for operational risk. The minimum regulatory capital adequacy requirement is 8.0% (2011: 8.0%) for the risk-weighted capital ratio.
(a) The capital adequacy ratios of the banking group are as follows:
2012 2011
Before deducting proposed dividends Core capital ratio 12.00% 12.40% Risk-weighted capital ratio 15.71% 16.54%
After deducting proposed dividends Core capital ratio 11.52% 11.95%
Risk-weighted capital ratio 15.22% 16.09%
Components of Tier-I and Tier-II capital are as follows: 2012 2011
RM’000 RM’000 Tier-I capital (Core Capital)
Paid-up share capital 596,517 596,517 Irredeemable convertible preference shares 4,000 4,000 Share premium 597,517 597,517
Retained profits 1,420,731 1,194,222 Statutory reserves 842,167 786,406 Other reserves 10,018 10,018 Non-controlling interests 4,905 4,488
3,475,855 3,193,168 Less: Purchased goodwill/goodwill on consolidation (302,065) (302,065) Deferred tax assets (15,038) (108,808)
Total Tier-I capital 3,158,752 2,782,295

174 ALLIANCE FINANCIAL GROUP BERHAD (6627-X)
Notes to the Financial Statements31 March 2012
44. CAPITAL ADEQUACY (cont’d)
(a) The capital adequacy ratios of the banking group are as follows (cont’d):
Components of Tier-I and Tier-II capital are as follows (cont’d):
2012 2011 RM’000 RM’000
Tier-II capital Subordinated obligations 597,829 600,000
Collective assessment allowance 381,019 333,466
Total Tier-II capital 978,848 933,466
Total Capital 4,137,600 3,715,761 Less: Investment in subsidiaries (3,620) (3,620)
Total Capital Base 4,133,980 3,712,141
(b) The breakdown of risk-weighted asset (“RWA’’) by exposures in each major risk category are as follows:
Group 2012 2011 RM’000 RM’000
Credit risk 23,601,495 20,149,305 Market risk 265,432 71,884 Operational risk 2,445,524 2,222,953
Total RWA and capital requirement 26,312,451 22,444,142
Detailed information on the risk exposure above are prescribed under BNM’s Risk-Weighted Capital Adequacy Framework (Basel II) - Disclosure Requirement (Pillar 3) is presented in the Alliance Bank Malaysia Berhad’s Pillar 3 Report.
(c) The capital adequacy ratios of the banking subsidiaries are as follows:
Alliance Alliance Alliance Bank Islamic Investment Malaysia Bank Bank Berhad Berhad Berhad
31 March 2012 Before deducting proposed dividends Core capital ratio 13.93% 12.35% 57.91% Risk-weighted capital ratio 14.37% 14.19% 58.39%
After deducting proposed dividends Core capital ratio 13.32% 11.52% 56.65% Risk-weighted capital ratio 13.76% 13.36% 57.13%
31 March 2011 Before deducting proposed dividends Core capital ratio 14.63% 11.65% 57.17% Risk-weighted capital ratio 14.98% 13.37% 57.33%
After deducting proposed dividends Core capital ratio 14.09% 11.65% 55.51%
Risk-weighted capital ratio 14.44% 13.37% 55.67%

1752012 ANNUAL REPORT
Notes to the Financial Statements31 March 2012
44. CAPITAL ADEQUACY (cont’d)
(c) The capital adequacy ratios of the banking subsidiaries are as follows (cont’d):
Note:
(i) The capital adequacy ratios of Alliance Islamic Bank Berhad are computed in accordance with BNM’s Capital Adequacy Framework for Islamic Banks (CAFIB). The Bank has adopted the Standardised Approach for credit risk and market risk, and Basic Indicator Approach for operational risk. The minimum regulatory capital adequacy requirement is 8.0% (2011: 8.0%) for the risk-weighted capital ratio.
(ii) The capital adequacy ratios of Alliance Investment Bank Berhad are computed in accordance with BNM’s revised Risk-weighted Capital Adequacy Framework (RWCAF-Basel II). The Bank and the Group have adopted the Standardised Approach for credit risk and market risk, and the Basic Indicator Approach for operational risk. The minimum regulatory capital adequacy requirement is 8.0% (2011: 8.0%) for the risk-weighted capital ratio.
45. COMMITMENTS AND CONTINGENCIES In the normal course of business, the Group make various commitments and incur certain contingent liabilities with legal recourse to their
customers. No material losses are anticipated as a results of these transactions.
The off-balance sheet exposures and their related counterparty credit risk of the Group are as follows:
Positive Fair Value Credit Risk- Principal of Derivative Equivalent Weighted Amount Contracts Amount Assets RM’000 RM’000 RM’000 RM’000
Group 2012
Credit-related exposures Direct credit substitutes 397,029 – 397,029 397,029 Transaction-related contingent items 549,766 – 274,883 274,883 Short-term self-liquidating trade-related contingencies 153,561 – 30,712 30,712 Obligation under on-going underwritting agreement 70,122 – 35,061 35,061 Irrevocable commitments to extent credit:
- maturity exceeding one year 4,320,657 – 2,160,328 1,786,192 - maturity not exceeding one year 5,793,193 – 1,158,639 1,004,648 Unutilised credit card lines 2,188,661 – 437,732 340,525
13,472,989 – 4,494,384 3,869,050
Derivative financial instruments Foreign exchange related contracts:
- less than one year 3,147,488 17,730 64,522 38,478 Interest rate related contracts: - one year or less 587,000 130 912 182 - over one year to three years 1,110,000 2,592 14,192 2,838 - over three years 423,896 3,260 20,055 6,467
5,268,384 23,712 99,681 47,965
18,741,373 23,712 4,594,065 3,917,015

176 ALLIANCE FINANCIAL GROUP BERHAD (6627-X)
Notes to the Financial Statements31 March 2012
45. COMMITMENTS AND CONTINGENCIES (cont’d)
The off-balance sheet exposures and their related counterparty credit risk of the Group are as follows (cont’d):
Positive Fair Value Credit Risk- Principal of Derivative Equivalent Weighted Amount Contracts Amount Assets RM’000 RM’000 RM’000 RM’000
Group 2011
Credit-related exposures Direct credit substitutes 423,539 – 423,539 423,539 Transaction-related contingent items 515,311 – 257,655 257,655 Short-term self-liquidating trade-related contingencies 143,281 – 28,656 28,656 Irrevocable commitments to extent credit:
- maturity exceeding one year 1,715,131 – 857,565 727,272 - maturity not exceeding one year 4,729,308 – 945,862 852,441 Unutilised credit card lines 3,425,831 – 685,166 528,386
10,952,401 – 3,198,443 2,817,949
Derivative financial instruments Foreign exchange related contracts: - less than one year 2,844,627 22,568 77,079 40,842 Interest rate related contracts: - one year or less 380,000 257 637 127
- over one year to three years 1,447,000 6,465 29,535 5,907 - over three years 285,000 2,757 15,957 3,192
4,956,627 32,047 123,208 50,068
15,909,028 32,047 3,321,651 2,868,017
46. CAPITAL The Group’s capital management objectives are:
- to maintain sufficient capital resources to meet the regulatory capital requirements as set forth by Bank Negara Malaysia,
- to maintain sufficient capital resources to support the Group’s risk appetite and to enable future business growth, and
- to meet the expectations of key stakeholders, including shareholders, investors, regulators and rating agencies.
In line with this, the Group aims to maintain capital adequacy ratios that are comfortably above the regulatory requirement, while balancing shareholders’ desire for sustainable returns and high standards of prudence.
The Group carries out stress testing to estimate the potential impact of extreme, but plausible, events on the Group’s earnings, balance sheet and capital. The results of the stress test are to facilitate the formation of action plan(s) in advance if the stress test reveals that the Group’s capital will be adversely affected. The results of the stress test are tabled to the Group Risk Management Committee for deliberations.
The Group’s regulatory capital are determined under Bank Negara Malaysia’s revised Risk-weighted Capital Adequacy Framework and their capital ratios complies with the prescribe capital adequacy ratios.

1772012 ANNUAL REPORT
Notes to the Financial Statements31 March 2012
47. LEASE COMMITMENTS
The Group and the Company have lease commitments in respect of equipment on hire and premises, all of which are classified as operating leases. A summary of the non-cancellable long term commitments is as follows:
Group Company 2012 2011 2012 2011 RM’000 RM’000 RM’000 RM’000
Within one year 26,744 21,295 14 316 Between one and five years 33,788 14,183 770 810
60,532 35,478 784 1,126
The operating leases for the Group and the Company’s other premises typically cover for an initial period of three years with options for renewal. These leases are cancellable but are usually renewed upon expiry or replaced by leases on other properties. Future minimum lease commitments are anticipated to be not less than the rental expense for 2012.
48. SIGNIFICANT RELATED PARTY TRANSACTIONS
In addition to related party disclosures mentioned elsewhere in the financial statements, set out below are the Group’s and the Company’s other significant related party transactions and balances:
Group Company 2012 2011 2012 2011 RM’000 RM’000 RM’000 RM’000
(a) Transactions
Interest income - subsidiaries – – (12,869) (18,176) - key management personnel (98) (6) – –
Dividend income - subsidiary – – (265,765) (146,462)
Overhead expenses recharged - subsidiaries – – (1,998) (1,635)
Interest expenses - key management personnel 1,079 1,034 – –
Management fees - related companies 903 363 – –
(b) Balances
Amount due to deposits from customers - key management personnel (14,498) (40,825) – –
Overdraft - key management personnel 3,168 89 – –
Money at call and deposit placements with financial institutions - subsidiaries – – 21,540 650,249
Loans, advances and financing - key management personnel 4,434 322 – –
Other assets - subsidiaries – – 19 11
Other liabilities - subsidiaries – – (358) (5)

178 ALLIANCE FINANCIAL GROUP BERHAD (6627-X)
Notes to the Financial Statements31 March 2012
48. SIGNIFICANT RELATED PARTY TRANSACTIONS (cont’d)
(i) Related companies refer to member companies of Alliance Financial Group Berhad.
(ii) Key management personnel refer to those persons having authority and responsibility for planning, directing and controlling the activities of the Group and the Company, directly or indirectly, including Executive Directors and Non-Executive Directors of the Group and the Company (including close members of their families). Other members of key management personnel of the Group are the Group Chief Executive Officer, Group Chief Operating Officer, Group Chief Financial Officer, Group Chief Risk Officer, Group Chief Credit Officer and Group Company Secretary.
(c) Compensation of key management personnel
Remuneration of Directors and other members of key management for the year is as follows:
Group Company 2012 2011 2012 2011 RM’000 RM’000 RM’000 RM’000
Short-term employee benefits Fees 2,072 1,876 540 525 Salary and other remuneration, including meeting allowances 9,252 6,818 680 659 Contribution to EPF 1,171 758 50 44 Share options/grants under ESS 1,336 781 106 76 Benefits-in-kind 122 93 31 38
13,953 10,326 1,407 1,342
Included in the total key management personnel are: Directors’ remuneration (Note 35(b)) 9,296 6,961 911 922
Executive Directors of the Group and other members of key management have been offered/awarded the following number of share options/share grants under the ESS:
Share Options Share Grants 2012 2011 2012 2011 ’000 ’000 ’000 ’000
Group
At beginning of year 3,050 2,289 379 309 Directors/key management personnel appointed during the year 68 183 7 24 Offered/awarded 2,569 1,484 350 238 Vested – – (73) (67) Lapsed (1,462) (906) (120) (125)
At end of year 4,225 3,050 543 379
Company
At beginning of year 276 221 28 29 Offered/awarded 171 55 23 9 Vested (68) – (12) (10)
At end of year 379 276 39 28
The above share options/share grants were offered/awarded on the same terms and conditions as those offered to other employees of the Group (Note 30).

1792012 ANNUAL REPORT
Notes to the Financial Statements31 March 2012
49. FAIR VALUE OF FINANCIAL ASSETS AND LIABILITIES(a) Comparison of carrying amount and fair value
The following table summarizes the carrying amounts of financial assets and liabilities on the Group and Company’s statement of financial position, and their fair value differentiating between financial assets and liabilities subsequently measured at fair value and these subsequently measured at amortised cost.
2012 2011 Carrying Carrying amount Fair value amount Fair value RM’000 RM’000 RM’000 RM’000
Group
Financial assets Cash and short-term funds 1,874,333 1,874,333 914,038 914,038 Deposits and placements with banks and other financial institutions 97,713 97,713 100,228 100,228 Balances due from clients and brokers 61,698 61,698 80,519 80,519 Financial assets held-for-trading 1,491,995 1,491,995 1,938,250 1,938,250 Financial investments available-for-sale 9,123,201 9,123,201 9,259,940 9,259,940 Financial investments held-to-maturity 795,256 809,381 940,726 955,844 Derivative financial assets 23,712 23,712 32,047 32,047 Loans, advances and financing 24,360,203 24,755,886 21,796,319 22,137,588
Financial liabilities Deposits from customers 32,130,962 32,129,447 28,345,647 28,345,646 Deposits and placements of banks and other financial institutions 2,161,005 2,128,981 1,952,200 1,912,490 Balances due to clients and brokers 74,915 74,915 86,743 86,743 Bills and acceptances payable 178 178 111,159 111,159 Derivative financial liabilities 26,241 26,241 33,347 33,347 Amount due to Cagamas Berhad 22,044 20,471 125,776 125,882 Subordinated obligations 611,615 611,820 600,000 615,025 Long term borrowings – – 601,272 598,000
Company
Financial assets Cash and short-term funds 6,501 6,501 46,858 46,858 Deposits and placements with banks and other financial institutions 19,315 19,315 605,700 605,700
Financial liability Long term borrowings – – 601,272 598,000
Note:
The fair value of the other assets and other liabilities, which are considered short-term in nature, are estimated to be approximately their carrying values.

180 ALLIANCE FINANCIAL GROUP BERHAD (6627-X)
Notes to the Financial Statements31 March 2012
49. FAIR VALUE OF FINANCIAL ASSETS AND LIABILITIES (cont’d)
The methods and assumptions used in estimating the fair values of financial instruments are as follows:
(i) Cash and short-term funds
The carrying amounts approximate fair values due to the relatively short maturity of the financial instruments.
(ii) Deposits and placements with banks and other financial institutions
The fair values of these financial instruments with remaining maturity of less than one year approximate their carrying amounts due to the relatively short maturity of the financial instruments. For those financial instruments with maturity of more than one year, the fair values are estimated based on discounted cash flows using applicable prevailing market rates for placements of similar credit risk and similar remaining maturity as at the end of the reporting period .
(iii) Financial assets held-for-trading, financial investments available-for-sale and financial investments held-to-maturity
The fair values are estimated based on quoted or observable market prices at the end of the reporting period. Where such quoted or observable market prices are not available, the fair values are estimated using pricing models or discounted cash flow techniques. Where discounted cash flow technique is used, the expected future cash flows are discounted using prevailing market rates for a similar instrument at the end of the reporting date.
(iv) Derivative financial instruments
The fair values of derivative financial instruments are obtained from quoted market rates in active market, including recent market transactions and valuation techniques, such as discounted cash flow models, as appropriate.
(v) Loans, advances and financing
The fair values of fixed rate loans with remaining maturity of less than one year and variable rate loans are estimated to approximate their carrying values. For fixed rate loans and Islamic financing with remaining maturity of more than one year, the fair values are estimated based on expected future cash flows of contractual instalment payments and discounted at applicable prevailing rates at the end of the reporting period offered to new borrowers with similar credit profiles. In respect of impaired loans, the fair values are deemed to approximate the carrying values, net of individual allowance or specific allowance for losses on loans, advances and financing.
(vi) Deposits from customers
The fair values of deposit liabilities payable on demand (demand and savings deposits), or deposits with maturity of less than one year are estimated to approximate their carrying amounts. The fair values of fixed deposits with remaining maturities of more than one year are estimated based on expected future cash flows discounted at applicable prevailing rates offered for deposits of similar remaining maturities. For negotiable instruments of deposits, the fair values are estimated based on quoted or observable market prices as at the end of the reporting period. Where such quoted or observable market prices are not available, the fair values of negotiable instruments of deposits are estimated using the discounted cash flow technique.
(vii) Deposits and placements of banks and other financial institutions and bills and acceptances payable
The carrying values of these financial instruments with remaining maturity of less than one year approximate their carrying amounts due to the relatively short maturity of the financial instruments.
(viii) Amount due to Cagamas Berhad
The fair values of amount due to Cagamas Berhad are determined based on the discounted cash flows of future instalment payments at applicable prevailing Cagamas rates as at the end of the reporting period.
(ix) Long term borrowings
The fair values of variable rate borrowings are estimated to approximate carrying values. For fixed rate borrowings, the fair values are estimated based on discounted cash flow techniques using a current yield curve approximate for the remaining term to maturity.
(x) Subordinated obligations
The fair value of the subordinated bonds is estimated based on discounted cash flow techniques using a current yield curve appropriate for the remaining term to maturity.
(xi) Balances due from/(to) clients and brokers
The carrying amounts are reasonable estimates of the fair values because of their short tenor.
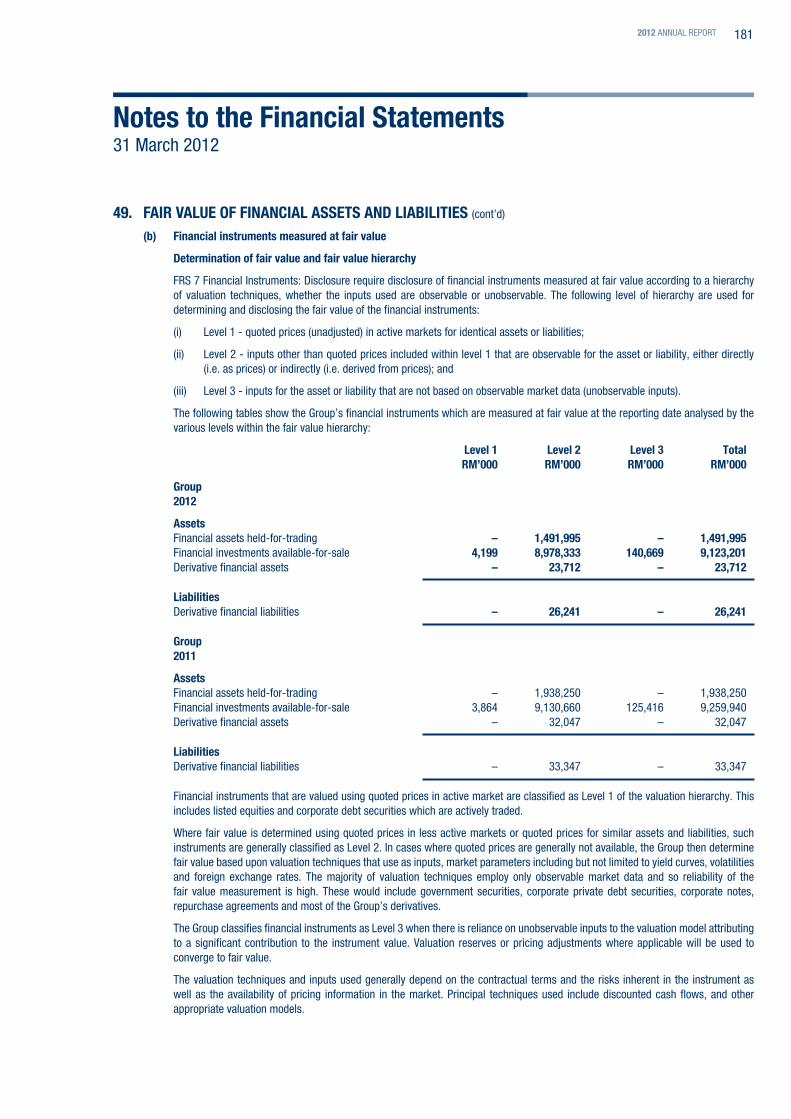
1812012 ANNUAL REPORT
49. FAIR VALUE OF FINANCIAL ASSETS AND LIABILITIES (cont’d)
(b) Financial instruments measured at fair value
Determination of fair value and fair value hierarchy
FRS 7 Financial Instruments: Disclosure require disclosure of financial instruments measured at fair value according to a hierarchy of valuation techniques, whether the inputs used are observable or unobservable. The following level of hierarchy are used for determining and disclosing the fair value of the financial instruments:
(i) Level 1 - quoted prices (unadjusted) in active markets for identical assets or liabilities;
(ii) Level 2 - inputs other than quoted prices included within level 1 that are observable for the asset or liability, either directly (i.e. as prices) or indirectly (i.e. derived from prices); and
(iii) Level 3 - inputs for the asset or liability that are not based on observable market data (unobservable inputs).
The following tables show the Group’s financial instruments which are measured at fair value at the reporting date analysed by the various levels within the fair value hierarchy:
Level 1 Level 2 Level 3 Total RM’000 RM’000 RM’000 RM’000
Group 2012
Assets Financial assets held-for-trading – 1,491,995 – 1,491,995 Financial investments available-for-sale 4,199 8,978,333 140,669 9,123,201 Derivative financial assets – 23,712 – 23,712
Liabilities Derivative financial liabilities – 26,241 – 26,241
Group 2011
Assets Financial assets held-for-trading – 1,938,250 – 1,938,250 Financial investments available-for-sale 3,864 9,130,660 125,416 9,259,940 Derivative financial assets – 32,047 – 32,047
Liabilities Derivative financial liabilities – 33,347 – 33,347
Financial instruments that are valued using quoted prices in active market are classified as Level 1 of the valuation hierarchy. This includes listed equities and corporate debt securities which are actively traded.
Where fair value is determined using quoted prices in less active markets or quoted prices for similar assets and liabilities, such instruments are generally classified as Level 2. In cases where quoted prices are generally not available, the Group then determine fair value based upon valuation techniques that use as inputs, market parameters including but not limited to yield curves, volatilities and foreign exchange rates. The majority of valuation techniques employ only observable market data and so reliability of the fair value measurement is high. These would include government securities, corporate private debt securities, corporate notes, repurchase agreements and most of the Group’s derivatives.
The Group classifies financial instruments as Level 3 when there is reliance on unobservable inputs to the valuation model attributing to a significant contribution to the instrument value. Valuation reserves or pricing adjustments where applicable will be used to converge to fair value.
The valuation techniques and inputs used generally depend on the contractual terms and the risks inherent in the instrument as well as the availability of pricing information in the market. Principal techniques used include discounted cash flows, and other appropriate valuation models.
Notes to the Financial Statements31 March 2012
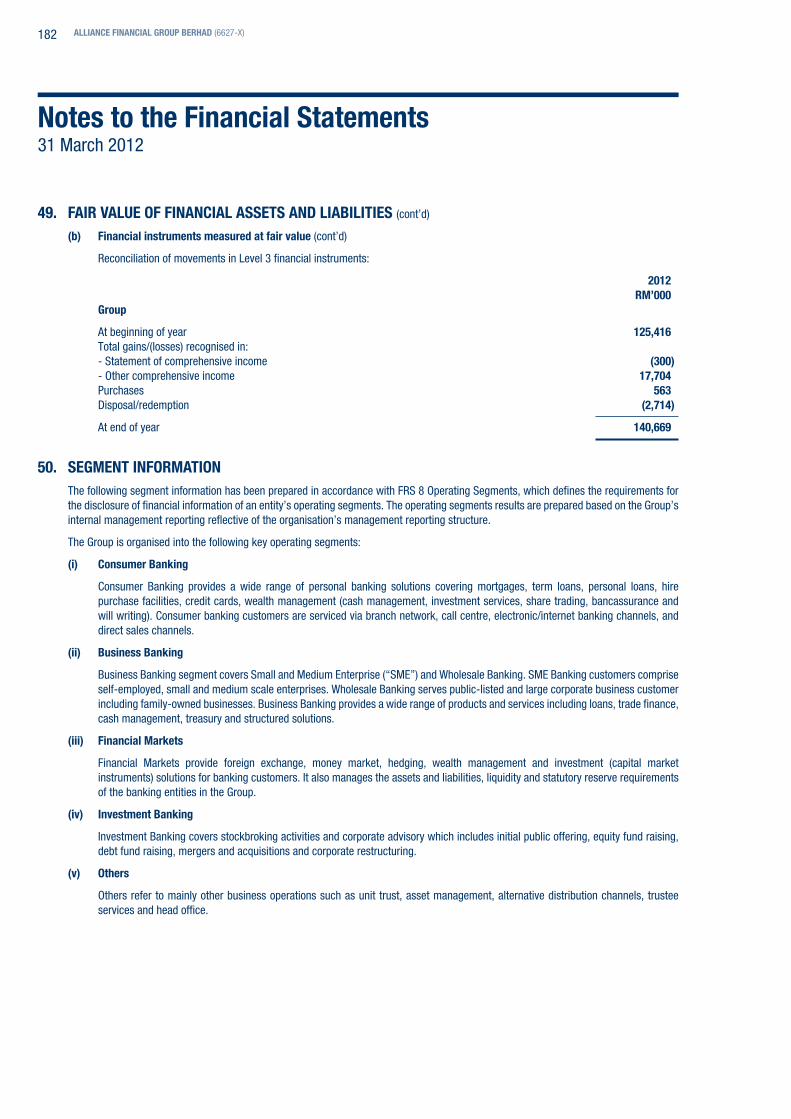
182 ALLIANCE FINANCIAL GROUP BERHAD (6627-X)
Notes to the Financial Statements31 March 2012
49. FAIR VALUE OF FINANCIAL ASSETS AND LIABILITIES (cont’d)
(b) Financial instruments measured at fair value (cont’d)
Reconciliation of movements in Level 3 financial instruments:
2012 RM’000
Group
At beginning of year 125,416 Total gains/(losses) recognised in: - Statement of comprehensive income (300) - Other comprehensive income 17,704 Purchases 563 Disposal/redemption (2,714)
At end of year 140,669
50. SEGMENT INFORMATION The following segment information has been prepared in accordance with FRS 8 Operating Segments, which defines the requirements for
the disclosure of financial information of an entity’s operating segments. The operating segments results are prepared based on the Group’s internal management reporting reflective of the organisation’s management reporting structure.
The Group is organised into the following key operating segments:
(i) Consumer Banking
Consumer Banking provides a wide range of personal banking solutions covering mortgages, term loans, personal loans, hire purchase facilities, credit cards, wealth management (cash management, investment services, share trading, bancassurance and will writing). Consumer banking customers are serviced via branch network, call centre, electronic/internet banking channels, and direct sales channels.
(ii) Business Banking
Business Banking segment covers Small and Medium Enterprise (“SME”) and Wholesale Banking. SME Banking customers comprise self-employed, small and medium scale enterprises. Wholesale Banking serves public-listed and large corporate business customer including family-owned businesses. Business Banking provides a wide range of products and services including loans, trade finance, cash management, treasury and structured solutions.
(iii) Financial Markets
Financial Markets provide foreign exchange, money market, hedging, wealth management and investment (capital market instruments) solutions for banking customers. It also manages the assets and liabilities, liquidity and statutory reserve requirements of the banking entities in the Group.
(iv) Investment Banking
Investment Banking covers stockbroking activities and corporate advisory which includes initial public offering, equity fund raising, debt fund raising, mergers and acquisitions and corporate restructuring.
(v) Others
Others refer to mainly other business operations such as unit trust, asset management, alternative distribution channels, trustee services and head office.

1832012 ANNUAL REPORT
Note
s to
the
Fina
ncia
l Sta
tem
ents
31 M
arch
201
2
50.
SEGM
ENT
INFO
RMAT
ION
(con
t’d)
Co
nsum
er
Bus
ines
s F
inan
cial
In
vest
men
t
Tota
l In
ter-
segm
ent
GROU
P B
anki
ng
Ban
king
M
arke
ts
Ban
king
Ot
hers
O
pera
tions
El
imin
atio
n To
tal
2012
R
M’0
00
RM’0
00
RM
’000
R
M’0
00
RM
’000
RM
’000
RM
’000
RM
’000
Net i
nter
est i
ncom
e/(e
xpen
se)
- ext
erna
l inc
ome/
(exp
ense
) 14
1,18
0 30
7,02
5 22
3,19
2 5,
193
(15,
488)
66
1,10
2 12
,761
67
3,86
3 - i
nter
-seg
men
t 95
,661
(1
0,39
0)
(81,
474)
(3
,797
) –
– –
–
23
6,84
1 29
6,63
5 14
1,71
8 1,
396
(15,
488)
66
1,10
2 12
,761
67
3,86
3 Ne
t inc
ome
from
Isla
mic
bank
ing
busin
ess
121,
624
66,8
46
40,4
54
– –
228,
924
27,4
05
256,
329
Othe
r ope
ratin
g in
com
e 94
,087
13
7,82
9 90
,422
24
,606
31
4,68
7 66
1,63
1 (3
41,4
49)
320,
182
Net i
ncom
e 45
2,55
2 50
1,31
0 27
2,59
4 26
,002
29
9,19
9 1,
551,
657
(301
,283
) 1,
250,
374
Othe
r ope
ratin
g ex
pens
es
(251
,931
) (2
00,6
99)
(39,
164)
(3
1,37
3)
(26,
670)
(5
49,8
37)
5,65
4 (5
44,1
83)
Depr
ecia
tion
and
amor
tisat
ion
(23,
025)
(1
6,25
6)
(6,0
86)
(2,0
78)
(168
) (4
7,61
3)
– (4
7,61
3)
Oper
atin
g pr
ofit
177,
596
284,
355
227,
344
(7,4
49)
272,
361
954,
207
(295
,629
) 65
8,57
8 Al
low
ance
for i
mpa
irmen
t on
loan
s,
adva
nces
and
fina
ncin
g an
d ot
her l
osse
s (2
4,26
7)
(8,5
28)
(1,0
53)
(195
) (5
97)
(34,
640)
–
(34,
640)
W
rite-
back
of i
mpa
irmen
t –
– 21
,643
–
– 21
,643
–
21,6
43
Segm
ent r
esul
t 15
3,32
9 27
5,82
7 24
7,93
4 (7
,644
) 27
1,76
4 94
1,21
0 (2
95,6
29)
645,
581
Shar
e of
resu
lts in
an
asso
ciate
(1,9
78)
Taxa
tion
and
zaka
t
(163
,764
)
Net p
rofit
afte
r tax
atio
n an
d za
kat
47
9,83
9
Segm
ent a
sset
s 13
,155
,522
11
,284
,537
16
,260
,377
23
6,57
9 1,
885,
675
42,8
22,6
90
(3,7
21,7
77)
39,1
00,9
13
Reco
ncilia
tion
of s
egm
ent a
sset
s to
con
solid
ated
ass
ets:
In
vest
men
t in
an a
ssoc
iate
26,5
52
Prop
erty
, pla
nt a
nd e
quip
men
t
90,2
93
Unal
loca
ted
asse
ts
30
,825
In
tang
ible
ass
ets
35
4,90
2
Tota
l ass
ets
39
,603
,485
Segm
ent l
iabi
litie
s 15
,980
,443
11
,087
,887
9,
802,
809
105,
221
64,5
08
37,0
40,8
68
(1,1
43,1
01)
35,8
97,7
67Un
allo
cate
d lia
bilit
ies
30
,384
Tota
l lia
bilit
ies
35
,928
,151

184 ALLIANCE FINANCIAL GROUP BERHAD (6627-X)
Note
s to
the
Fina
ncia
l Sta
tem
ents
31 M
arch
201
2
50.
SEGM
ENT
INFO
RMAT
ION
(con
t’d)
Co
nsum
er
Bus
ines
s F
inan
cial
In
vest
men
t
Tota
l In
ter-
segm
ent
GROU
P B
anki
ng
Ban
king
M
arke
ts
Ban
king
Ot
hers
O
pera
tions
El
imin
atio
n To
tal
2011
R
M’0
00
RM’0
00
RM
’000
R
M’0
00
RM
’000
RM
’000
RM
’000
RM
’000
Net i
nter
est i
ncom
e/(e
xpen
se)
- ext
erna
l inc
ome/
(exp
ense
) 22
2,47
5 24
5,16
0 19
8,38
1 4,
574
(2,6
60)
667,
930
2,33
2 67
0,26
2 - i
nter
-seg
men
t 41
,922
47
,967
(8
7,17
3)
(2,7
16)
– –
– –
26
4,39
7 29
3,12
7 11
1,20
8 1,
858
(2,6
60)
667,
930
2,33
2 67
0,26
2 Ne
t inc
ome
from
Isla
mic
bank
ing
busin
ess
116,
889
55,8
32
35,0
27
– –
207,
748
24,9
84
232,
732
Othe
r ope
ratin
g in
com
e 73
,499
10
2,13
0 39
,638
29
,615
17
0,80
6 41
5,68
8 (1
89,9
66)
225,
722
Net i
ncom
e 45
4,78
5 45
1,08
9 18
5,87
3 31
,473
16
8,14
6 1,
291,
366
(162
,650
) 1,
128,
716
Othe
r ope
ratin
g ex
pens
es
(236
,522
) (1
68,1
28)
(35,
240)
(3
0,10
2)
(24,
495)
(4
94,4
87)
3,59
8 (4
90,8
89)
Depr
ecia
tion
and
amor
tisat
ion
(27,
180)
(1
5,16
4)
(7,4
45)
(3,9
60)
(262
) (5
4,01
1)
– (5
4,01
1)
Oper
atin
g pr
ofit
191,
083
267,
797
143,
188
(2,5
89)
143,
389
742,
868
(159
,052
) 58
3,81
6 (A
llow
ance
for)/
writ
e-ba
ck o
f im
pairm
ent o
n lo
ans,
adva
nces
and
fina
ncin
g an
d ot
her l
osse
s (3
7,03
5)
2,97
2 41
2 64
4 (3
02)
(33,
309)
–
(33,
309)
W
rite-
back
of i
mpa
irmen
t –
1,13
9 2,
937
– –
4,07
6 –
4,07
6
Segm
ent r
esul
t 15
4,04
8 27
1,90
8 14
6,53
7 (1
,945
) 14
3,08
7 71
3,63
5 (1
59,0
52)
554,
583
Shar
e of
resu
lts in
an
asso
ciate
(1,4
70)
Taxa
tion
and
zaka
t
(143
,962
)
Net p
rofit
afte
r tax
atio
n an
d za
kat
40
9,15
1
Segm
ent a
sset
s 12
,730
,209
9,
134,
341
15,4
49,4
64
248,
641
2,50
2,00
7 40
,064
,662
(4
,596
,118
) 35
,468
,544
Reco
ncilia
tion
of s
egm
ent a
sset
s to
con
solid
ated
ass
ets:
In
vest
men
t in
an a
ssoc
iate
28,5
30
Prop
erty
, pla
nt a
nd e
quip
men
t
104,
837
Unal
loca
ted
asse
ts
11
2,34
3 In
tang
ible
ass
ets
35
7,68
2
Tota
l ass
ets
36
,071
,936
Segm
ent l
iabi
litie
s 15
,677
,949
9,
272,
735
8,95
3,81
2 11
6,28
6 65
8,49
7 34
,679
,279
(2
,011
,245
) 32
,668
,034
Unal
loca
ted
liabi
litie
s
47,2
99
Tota
l lia
bilit
ies
32
,715
,333

1852012 ANNUAL REPORT
Notes to the Financial Statements31 March 2012
51. SIGNIFICANT EVENTS DURING THE FINANCIAL YEAR Liquidation of subsidiary
The following subsidiaries have been liquidated pursuant to Section 272(5) of the Companies Act, 1965:
(a) Subsidiary of Alliance Bank Malaysia Berhad
(i) AllianceGroup Properties Sdn. Bhd. - liquidated with effect from 11 November 2011.
(b) Subsidiaries of Alliance Investments Bank Berhad
(ii) KLCS Asset Management Sdn. Bhd. - liquidated with effect from 28 April 2011.
(iii) KLCity Ventures Sdn. Bhd. - liquidated with effect from 11 November 2011.
(iv) KLCity Unit Trust Berhad - liquidated with effect from 28 December 2011.
52. SUBSEQUENT EVENTS
There were no material events subsequent to the end of the financial reporting period that require disclosure or adjustment to the financial statements.
53. NON-CURRENT ASSETS HELD FOR SALE Group 2012 2011 RM’000 RM’000
Building 2,453 – Freehold land 1,009 – Leasehold land 352 –
3,814 –
Property, plant and equipment where deposits have been received from buyers of the properties and where a definitive buyer have been identified will classified as non-current assets held for sale. The disposals are expected to be completed in next financial year.

186 ALLIANCE FINANCIAL GROUP BERHAD (6627-X)
Notes to the Financial Statements31 March 2012
54. REALISED AND UNREALISED PROFITS On 25 March 2010, Bursa Malaysia Securities Berhad (“Bursa Malaysia”) issued a directive to all listed issuers pursuant to Paragraphs 2.06
and 2.23 of Bursa Malaysia Main Market Listing Requirements. The directive requires all listed issuers to disclose the breakdown of the unappropriated profits or accumulated losses as at the end of the reporting period, into realised and unrealised profits or losses.
On 20 December 2010, Bursa Malaysia further issued guidance on the disclosure and the format required.
The breakdown of retained profits of the Group and the Company as at the reporting date, into realised and unrealised profits, pursuant to the directive, is as follows:
Group Company 2012 2011 2012 2011 RM’000 RM’000 RM’000 RM’000
Total retained profits - Realised 1,360,783 1,045,846 2,012 5,553 - Unrealised 51,858 144,761 300 284
1,412,641 1,190,607 2,312 5,837 Less: Consolidation adjustments (281,358) (282,523) – –
Total retained profits as per accounts 1,131,283 908,084 2,312 5,837
The determination of realised and unrealised profits is based on the Guidance of Special Matter No. 1, Determination of Realised and Unrealised Profits or Losses in the Context of Disclosures Pursuant to Bursa Malaysia Securities Berhad Listing Requirements, issued by the Malaysian Institute of Accountants on 20 December 2010.
Accordingly, the unrealised retained profits of the Group and the Company as disclosed above excludes translation gains and losses on monetary items denominated in a currency other than the functional currency and foreign exchange contracts, as these gains and losses are incurred in the ordinary course of business of the Group and the Company, and are hence deemed as realised.
The disclosure of realised and unrealised profits above is solely for complying with the disclosure requirements stipulated in the directive of Bursa Malaysia and should not be applied for any other purposes.