
"What's 'Publishing'?" - A brief explanation about the game publishing service.

University of Mississippi University of Mississippi
eGrove eGrove
Individual and Corporate Publications Accounting Archive
1922
Financial statements: an explanation in brief of a system for their Financial statements: an explanation in brief of a system for their
analysis from the standpoint of the credit grantor and the analysis from the standpoint of the credit grantor and the
business executive business executive
Robert Morris Associates
Follow this and additional works at: https://egrove.olemiss.edu/acct_corp
Part of the Accounting Commons, and the Taxation Commons
Recommended Citation Recommended Citation Robert Morris Associates, "Financial statements: an explanation in brief of a system for their analysis from the standpoint of the credit grantor and the business executive" (1922). Individual and Corporate Publications. 137. https://egrove.olemiss.edu/acct_corp/137
This Article is brought to you for free and open access by the Accounting Archive at eGrove. It has been accepted for inclusion in Individual and Corporate Publications by an authorized administrator of eGrove. For more information, please contact [email protected].
F in a n c ia l S t a t e m e n t s
A n explanation in brief o f a system for their analysis from the standpoint o f the credit grantor and the business executive
ISSUED BYTHE ROBERT MORRIS ASSOCIATES
(A National Organization of Bank Credit Men)SECRETARY’S OFFICE
AT LANSDOWNE, PENNSYLVANIA
F I N A N C I A L STATEMENTS
An explanation in brief of a system for their analysis from the standpoint of the credit grantor and the business executive
ISSUED BY
T H E ROBERT MORRIS ASSOCIATES (A National Organization of Bank Credit Men)
SECRETARY'S OFFICE
AT LANSDOWNE, PENNSYLVANIA

Copyright 1922 toy
The Robert Morris Associates

INDEX
Elements of the Risk: Financial Strength Moral Risk Economic Risk Their Relative Values
Comparative Analysis: Current Liabilities "Two For One" Inequalities of Businesses
Collateral Ratios: Merchandise to Receivables Worth to Fixed .., Sales to Receivables Sales to Merchandise Sales to Worth Worth to Debt Sales to Fixed
Application of Principles: Statements, Companies A and B Analysis Company A Analysis Company B
Interpretative Index 18, 19, Weights Index, Companies A and B Index Formula
Paragraphs
2 3 4 5
8 9
10
13 A 13 B 13 C 13 D 13 E 13 F 13 G
14 15 16
20, 21 22 27
29-30
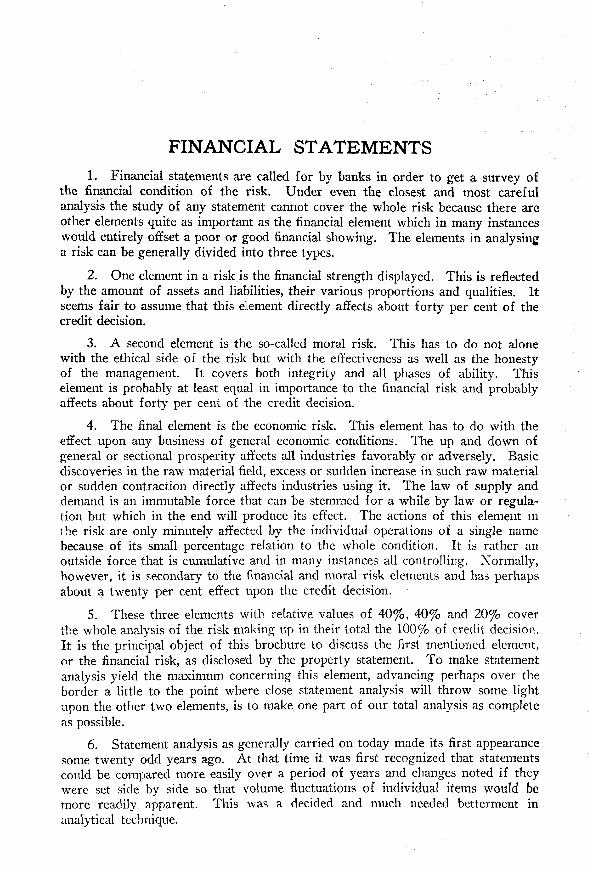
FINANCIAL STATEMENTS 1. Financial statements are called for by banks in order to get a survey of
the financial condition of the risk. Under even the closest and most careful analysis the study of any statement cannot cover the whole risk because there are other elements quite as important as the financial element which in many instances would entirely offset a poor or good financial showing. The elements in analysing a risk can be generally divided into three types.
2. One element in a risk is the financial strength displayed. This is reflected by the amount of assets and liabilities, their various proportions and qualities. It seems fair to assume that this element directly affects about forty per cent of the credit decision.
3. A second element is the so-called moral risk. This has to do not alone with the ethical side of the risk but with the effectiveness as well as the honesty of the management. It covers both integrity and all phases of ability. This element is probably at least equal in importance to the financial risk and probably affects about forty per cent of the credit decision.
4. The final element is the economic risk. This element has to do with the effect upon any business of general economic conditions. The up and down of general or sectional prosperity affects all industries favorably or adversely. Basic discoveries in the raw material field, excess or sudden increase in such raw material or sudden contraction directly affects industries using it. The law of supply and demand is an immutable force that can be stemmed for a while by law or regulation but which in the end will produce its effect. The actions of this element in the risk are only minutely affected by the individual operations of a single name because of its small percentage relation to the whole condition. It is rather an outside force that is cumulative and in many instances all controlling. Normally, however, it is secondary to the financial and moral risk elements and has perhaps about a twenty per cent effect upon the credit decision.
5. These three elements with relative values of 40%, 40% and 20% cover the whole analysis of the risk making up in their total the 100% of credit decision. It is the principal object of this brochure to discuss the first mentioned element, or the financial risk, as disclosed by the property statement. To make statement analysis yield the maximum concerning this element, advancing perhaps over the border a little to the point where close statement analysis will throw some light upon the other two elements, is to make one part of our total analysis as complete as possible.
6. Statement analysis as generally carried on today made its first appearance some twenty odd years ago. At that time it was first recognized that statements could be compared more easily over a period of years and changes noted if they were set side by side so that volume fluctuations of individual items would be more readily apparent. This was a decided and much needed betterment in analytical technique.
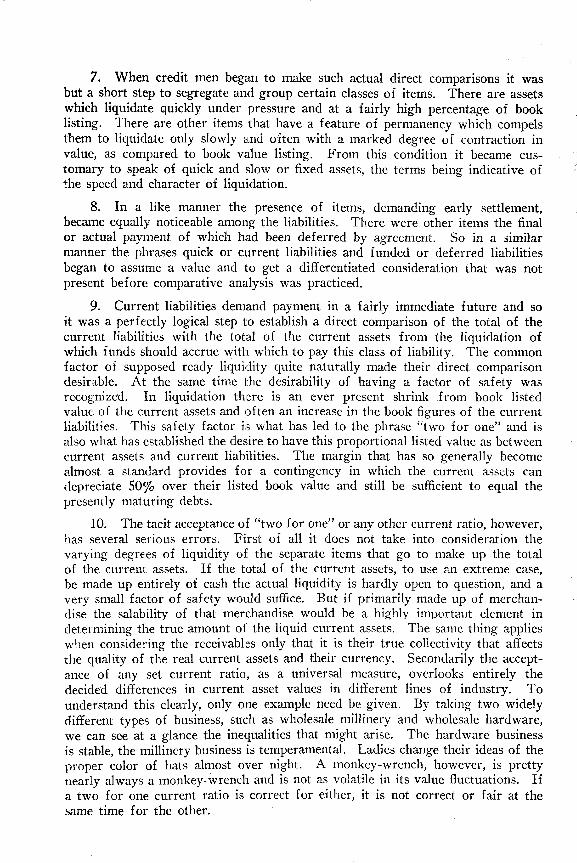
7. When credit men began to make such actual direct comparisons it was but a short step to segregate and group certain classes of items. There are assets which liquidate quickly under pressure and at a fairly high percentage of book listing. There are other items that have a feature of permanency which compels them to liquidate only slowly and often with a marked degree of contraction in value, as compared to book value listing. From this condition it became customary to speak of quick and slow or fixed assets, the terms being indicative of the speed and character of liquidation.
8. In a like manner the presence of items, demanding early settlement, became equally noticeable among the liabilities. There were other items the final or actual payment of which had been deferred by agreement. So in a similar manner the phrases quick or current liabilities and funded or deferred liabilities began to assume a value and to get a differentiated consideration that was not present before comparative analysis was practiced.
9. Current liabilities demand payment in a fairly immediate future and so it was a perfectly logical step to establish a direct comparison of the total of the current liabilities with the total of the current assets from the liquidation of which funds should accrue with which to pay this class of liability. The common factor of supposed ready liquidity quite naturally made their direct comparison desirable. At the same time the desirability of having a factor of safety was recognized. In liquidation there is an ever present shrink from book listed value of the current assets and often an increase in the book figures of the current liabilities. This safety factor is what has led to the phrase "two for one" and is also what has established the desire to have this proportional listed value as between current assets and current liabilities. The margin that has so generally become almost a standard provides for a contingency in which the current assets can depreciate 50% over their listed book value and still be sufficient to equal the presently maturing debts.
10. The tacit acceptance of "two for one" or any other current ratio, however, has several serious errors. First of all it does not take into consideration the varying degrees of liquidity of the separate items that go to make up the total of the current assets. If the total of the current assets, to use an extreme case, be made up entirely of cash the actual liquidity is hardly open to question, and a very small factor of safety would suffice. But if primarily made up of merchandise the salability of that merchandise would be a highly important element in determining the true amount of the liquid current assets. The same thing applies when considering the receivables only that it is their true collectivity that affects the quality of the real current assets and their currency. Secondarily the acceptance of any set current ratio, as a universal measure, overlooks entirely the decided differences in current asset values in different lines of industry. To understand this clearly, only one example need be given. By taking two widely different types of business, such as wholesale millinery and wholesale hardware, we can see at a glance the inequalities that might arise. The hardware business is stable, the millinery business is temperamental. Ladies change their ideas of the proper color of hats almost over night. A monkey-wrench, however, is pretty nearly always a monkey-wrench and is not as volatile in its value fluctuations. If a two for one current ratio is correct for either, it is not correct or fair at the same time for the other.
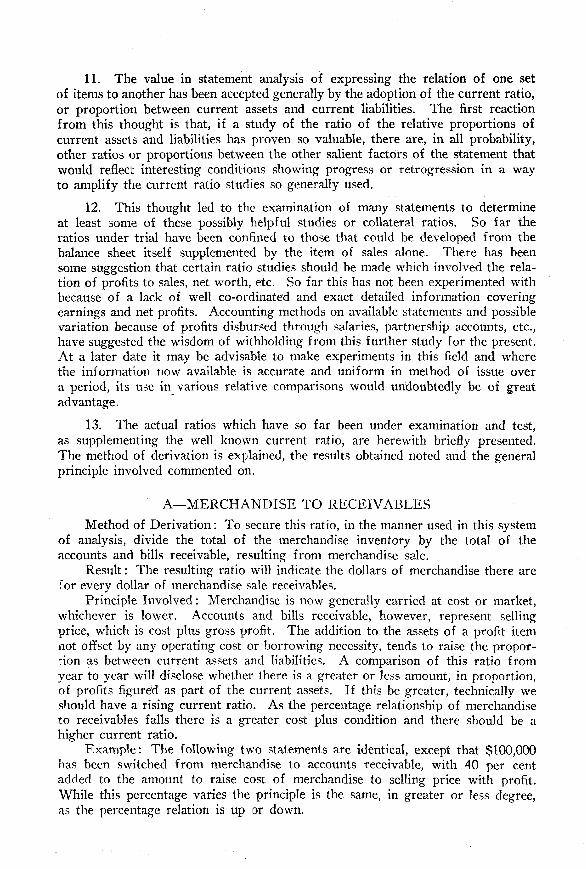
11. The value in statement analysis of expressing the relation of one set of items to another has been accepted generally by the adoption of the current ratio, or proportion between current assets and current liabilities. The first reaction from this thought is that, if a study of the ratio of the relative proportions of current assets and liabilities has proven so valuable, there are, in all probability, other ratios or proportions between the other salient factors of the statement that would reflect interesting conditions showing progress or retrogression in a way to amplify the current ratio studies so generally used.
12. This thought led to the examination of many statements to determine at least some of these possibly helpful studies or collateral ratios. So far the ratios under trial have been confined to those that could be developed from the balance sheet itself supplemented by the item of sales alone. There has been some suggestion that certain ratio studies should be made which involved the relation of profits to sales, net worth, etc. So far this has not been experimented with because of a lack of well co-ordinated and exact detailed information covering earnings and net profits. Accounting methods on available statements and possible variation because of profits disbursed through salaries, partnership accounts, etc., have suggested the wisdom of withholding from this further study for the present. At a later date it may be advisable to make experiments in this field and where the information now available is accurate and uniform in method of issue over a period, its use in various relative comparisons would undoubtedly be of great advantage.
13. The actual ratios which have so far been under examination and test, as supplementing the well known current ratio, are herewith briefly presented. The method of derivation is explained, the results obtained noted and the general principle involved commented on.
A—MERCHANDISE TO RECEIVABLES
Method of Derivation: To secure this ratio, in the manner used in this system of analysis, divide the total of the merchandise inventory by the total of the accounts and bills receivable, resulting from merchandise sale.
Result: The resulting ratio will indicate the dollars of merchandise there are for every dollar of merchandise sale receivables.
Principle Involved: Merchandise is now generally carried at cost or market, whichever is lower. Accounts and bills receivable, however, represent selling price, which is cost plus gross profit. The addition to the assets of a profit item not offset by any operating cost or borrowing necessity, tends to raise the proportion as between current assets and liabilities. A comparison of this ratio from year to year will disclose whether there is a greater or less amount, in proportion, of profits figured as part of the current assets. If this be greater, technically we should have a rising current ratio. As the percentage relationship of merchandise to receivables falls there is a greater cost plus condition and there should be a higher current ratio.
Example: The following two statements are identical, except that $100,000 has been switched from merchandise to accounts receivable, with 40 per cent added to the amount to raise cost of merchandise to selling price with profit. While this percentage varies the principle is the same, in greater or less degree, as the percentage relation is up or down.

EXAMPLE REC.-MDSE. RATIO THEORY
Assets As Mdse. After Conversion Cash $60,000 $60,000 Rec 50,000 190,000 Mdse 200,000 100,000
Current Assets $310,000 $350,000 Plant 500,000 500,000 Prepaid expenses, etc 20,000 20,000
Total $830,000 $870,000
Liabilities Notes payable $125,000 $125,000 Accounts payable 45,000 45,000 Tax reserve 15,000 15,000
Current Liabilities $185,000 $185,000 Mortgages 100,000 100,000
Total Debt $285,000 $285,000 Capital 300,000 300,000 Surplus 245,000 285,000
Total $830,000 $870,000
In the first instance the current ratio is expressed by the following fraction and its equivalent percentage :
350.000
185.000)
310.000
185.000 = 167.56 per cent with the Merchandise to Receivables ratio at 400%
In the second instance, after the transfer of merchandise to accounts, it is
= 189.18 per cent with the Merchandise to Receivables ratio at 52%.
B—WORTH TO FIXED OR NON-CURRENT ASSETS
Method of Derivation: To secure this ratio, divide the net worth by the net non-current assets.
Result: The resulting ratio will indicate the dollars of net worth, or stockholders investment, for every dollar not currently invested. The margin above 100 per cent indicates the proportion over and above fixed capital investment that the stockholders have provided as active working capital possible of investment in liquid assets.
Principle Involved: Plant and other non-current assets are a capital investment. The stockholders should in general, by their capital contributions, provide for the plant equity and the cost of all other non-current assets. There should be a substantial stockholders' investment over and above this amount, to provide working capital, as the phrase goes, for the "going part" of the business.
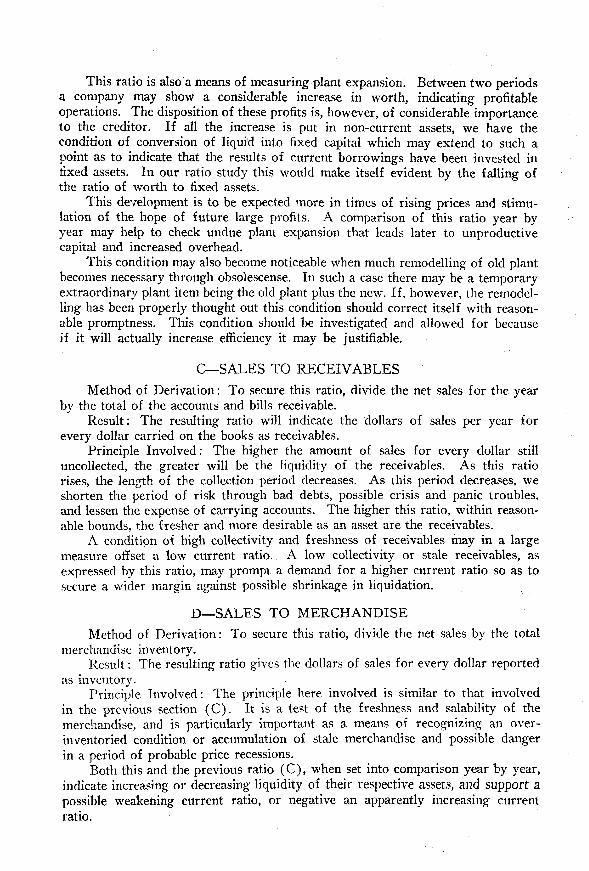
This ratio is also a means of measuring plant expansion. Between two periods a company may show a considerable increase in worth, indicating profitable operations. The disposition of these profits is, however, of considerable importance to the creditor. If all the increase is put in non-current assets, we have the condition of conversion of liquid into fixed capital which may extend to such a point as to indicate that the results of current borrowings have been invested in fixed assets. In our ratio study this would make itself evident by the falling of the ratio of worth to fixed assets.
This development is to be expected more in times of rising prices and stimulation of the. hope of future large profits. A comparison of this ratio year by year may help to check undue plant expansion that leads later to unproductive capital and increased overhead.
This condition may also become noticeable when much remodelling of old plant becomes necessary through obsolescense. In such a case there may be a temporary extraordinary plant item being the old plant plus the new. If, however, the remodelling has been properly thought out this condition should correct itself with reasonable promptness. This condition should be investigated and allowed for because if it will actually increase efficiency it may be justifiable.
C—SALES TO RECEIVABLES
Method of Derivation: To secure this ratio, divide the net sales for the year by the total of the accounts and bills receivable.
Result: The resulting ratio will indicate the dollars of sales per year for every dollar carried on the books as receivables.
Principle Involved: The higher the amount of sales for every dollar still uncollected, the greater will be the liquidity of the receivables. As this ratio rises, the length of the collection period decreases. As this period decreases, we shorten the period of risk through bad debts, possible crisis and panic troubles, and lessen the expense of carrying accounts. The higher this ratio, within reasonable bounds, the fresher and more desirable as an asset are the receivables.
A condition of high collectivity and freshness of receivables may in a large measure offset a low current ratio. A low collectivity or stale receivables, as expressed by this ratio, may prompt a demand for a higher current ratio so as to secure a wider margin against possible shrinkage in liquidation.
D—SALES TO MERCHANDISE
Method of Derivation: To secure this ratio, divide the net sales by the total merchandise inventory.
Result: The resulting ratio gives the dollars of sales for every dollar reported as inventory.
Principle Involved: The principle here involved is similar to that involved in the previous section (C) . It is a test of the freshness and salability of the merchandise, and is particularly important as a means of recognizing an over-inventoried condition or accumulation of stale merchandise and possible danger in a period of probable price recessions.
Both this and the previous ratio (C), when set into comparison year by year, indicate increasing or decreasing liquidity of their respective assets, and support a possible weakening current ratio, or negative an apparently increasing current ratio.

E—SALES TO WORTH
Method of Derivation: To secure this ratio, divide the net sales by the net worth.
Result: The resulting ratio will record the dollars of sales for every dollar of stockholders' invested capital.
Principle Involved: To be productively and sanely employed business principles demand a certain normal activity of invested funds. If the money invested, and left in the business by the stockholders is turned over too slowly, it is less productive. If it be too sluggish in its movement, it may indicate what is commonly called "dry rot." On the other hand, if this ratio is too high, it may indicate that the company is over-extending its operations and getting into a position of doing too much business for its capital investment. Either of these conditions approaches the danger point of credit when approaching an extreme.
F—WORTH TO DEBT
Method of Derivation: To secure this ratio, divide the net worth by the total debt, both current and funded.
Result: This ratio gives as a result the proportion that exists between the investment by the stockholders and the capital loaned to the company.
Principle Involved: In the productive activity of any business, there are two kinds of capital funds used, under two controls. The first is the capital, surplus and undivided profits or net worth of the business. The second is the debt of the concern, which is measured and controlled by its credit standing, and by the will of its creditors.
The proportion that exists between the worth and the debts shows quite clearly the balance between the source and the ownership of the funds being used in the affairs of the business As the proportions of debt increases over the funds invested by the stockholders the company becomes more dependent for working capital upon the decisions of its creditors, and the more susceptible to the strains and pressure of crisis.
The lower the worth to debt ratio, the more extended becomes the reliance of the owners upon their moral risk strength. Therefore, any event that will shake the belief in the moral risk, the greater will be the jeopardy of such a company. Too great reliance upon the good will of creditors will be shown by too low a worth to debt ratio. An abnormally low ratio should prompt the conservative credit grantor to investigate his risk more closely, and should influence the business executive to consider the advisability of revamping his affairs so as to establish a better balance between the capital invested and capital secured through loans. The having of too heavy a debt, especially if current in its nature, is like having a temperamental partner who may at any time wish to be paid out.
G—SALES TO FIXED OR NON-CURRENT ASSETS
Method of Derivation: To produce this ratio, divide the net sales by the net total non-current assets.
Result: The resulting ratio will indicate the dollars of net sales for every dollar invested in plant or other non-liquid assets.
Principle Involved: The comparative earning capacity of plant investment depends, in a large measure, on the volume of goods it can produce and sell.

This ratio can be used to good advantage in connection with the ratio of worth to non-current assets (B) . If the worth to non-current assets be a falling ratio, or below normal, and the sales to fixed assets be also a falling ratio, or below normal, then we are faced with a condition in which plant is enlarging more rapidly than worth, in proportion, and its sales productivity is not keeping pace with its increase in size. It then becomes the duty of the credit grantor and the executive to urge increased production efficiency, and not expansion of plant. As stated in section B, this ratio can be used to check up on the conversion of liquid capital into fixed capital, because plant extension is vindicated economically only if efficiency and resulting productivity demand it. This falling ratio may appear for a time where a new management takes over an old plant that needs revamping. If the investigation because of such a fall in this ratio discloses this fact and if policy is sound no alarm need necessarily be felt.
It is, of course, understood in sales ratios that allowance must be made to correct for price level changes if they are present in marked degree or variation.
APPLICATION
14. To emphasize the principles in this analysis method the following two statements are submitted running over a course of five years. In addition to the actual balance sheet figures, the various ratios just discussed have been developed so that the statements may be studied by their use. Two studies have been selected because by comparison of two sets of figures a better understanding may be had.
COMPANY A
Date
Cash Receivables Mdse
Current Assets Fixed Assets
Total
Notes and Accts. Payable.. Tax Reserve
Current Debt Funded Debts
Total Debt
Capital Surplus Net Worth
Total
Sales
1918
4,000 35,034 40,210
79,244 65,500
144,744
39,425
39,425 25,800
65,225
50,000 29,519 79,519
144,744
185,000
1919
5,000 41,098 50,280
96,378 65,500
161,878
45,477 2,000
47,477 20,000
67,477
50,000 44,401 94,401
161,878
230,000
1920
5,500 42,061 46,310
93,871 76,200
170,071
41,326 4,000
45,326 15,000
60,326
60,000 49,745 109,745
170,071
255,000
1921
6,000 50,383 46,206
102,589 78,000
180,589
44,320 5,000
49,320 10,000
59,320
70,000 51,269 121,269
180,589
260,000
1922
5,700 41,363 39,210
86,273 78,000
164,273
40,340 2,000
42,340 5,000
47,340
70,000 46,933 116,933
164,273
240,000
Mdse.-Rec Worth-Fixed Sales-Rec Sales-Mdse Sales-Worth Worth-Debt Sales-Fixed
% 200 114 121 528 460 232 121 282
% 202 122 145 559 457 243 139 351
% 205 110 143 606 550 233 181 334
% 208 91
155 516 563 214 205 333
% 203
94 149 580 612 205 247 307
Average 203 106 143 558 528 225 179 321
COMPANY A, ANALYSIS
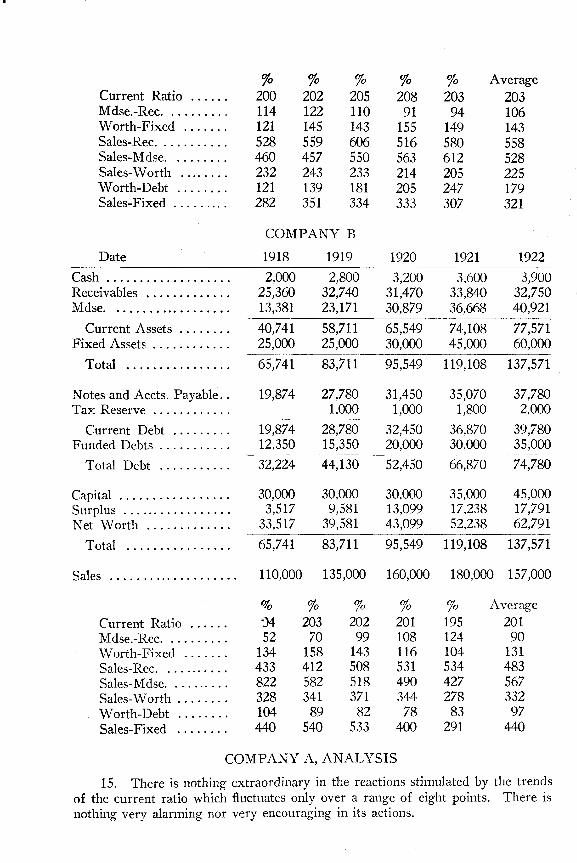
15. There is nothing extraordinary in the reactions stimulated by the trends of the current ratio which fluctuates only over a range of eight points. There is nothing very alarming nor very encouraging in its actions.
COMPANY B
Sales 110,000 135,000 160,000 180,000 157,000
Date 1918 1919 1920 1921 1922
Cash 2,000 2,800 3,200 3,600 3,900 Receivables 25,360 32,740 31,470 33,840 32,750 Mdse 13,381 23,171 30,879 36,668 40,921
Current Assets 40,741 58,711 65,549 74,108 77,571 Fixed Assets 25,000 25,000 30,000 45,000 60,000
Total 65,741 83,711 95,549 119,108 137,571
Notes and Accts. Payable.. 19,874 27,780 31,450 35,070 37,780 Tax Reserve 1,000 1,000 1,800 2,000
Current Debt 19,874 28,780 32,450 36,870 39,780 Funded Debts 12,350 15,350 20,000 30,000 35,000
Total Debt 32,224 44,l30 52,450 66,870 74780
Capital 30.000 30,000 30,000 35,000 45,000 Surplus 3,517 9,581 13,099 17,238 17,791 Net Worth 33,517 39,581 43,099 52,238 62,791
Total 65,741 83,711 95,549 119,108 137/571
Current Ratio Mdse.-Rec Worth-Fixed Sales-Rec Sales-Mdse Sales-Worth Worth-Debt Sales-Fixed
% 04 52 134 433 822 328 104 440
% 203 70 158 412 582 341 89 540
% 202 99 143 508 518 371 82 533
% 201 108 116 531 490 344 78 400
% 195 124 104 534 427 278 83 291
Average
201 90 131 483 567 332 97 440
The Merchandise to Receivables ratio (discussed in paragraph 13 section A) shows a trend toward an increasing proportion of Receivables as related to Merchandise. The fact that this trend has occurred preliminary to the break in prices would seem in this case to be a desirable feature rather than undesirable, eliminating as it does the danger of loss in value through price recession.
The Worth to Fixed Assets ratio (discussed in paragraph 13 section B) shows a marked betterment. This company has increased its Net Worth in a greater degree than it has tied up its capital in plant or non-current assets. This is decidedly a good sign.
The ratio of Sales to Receivables (discussed in paragraph 13 section C) shows an improvement. The collectivity of the receivables reached its high point in 1920 and perhaps due to the crisis of that year recedes somewhat in 1921. However, by 1922 the company got hold of its collection policy and the liquidity of the receivables rises again.
In the ratio of Sales to Merchandise (discussed in paragraph 13, section D) the company makes an excellent showing. There has been a steady and considerable speeding up in the selling. Apparently the company did not accumulate dead inventory. This is an additional satisfactory indication.
The item of Sales to Net Worth (discussed in paragraph 13 section E) indicates a decline in activity of invested funds. This, however, has not been unreasonable in view of the price recessions, etc., and while perhaps indicating a shrinkage in profits, an actual decrease in surplus showing in 1922, the extent of the reductions is still within bounds. It is however a negative showing.
Perhaps the strongest point in the whole analysis is shown in the ratio of Net Worth to Debt (discussed in paragraph 13 section F ) . At the beginning of the period for every $100 of debt, the stockholders had provided $121 in order to support the volume of operation. By 1922 this condition had been improved so that the company is providing $247 of owned capital for every $100 of debt or borrowed capital. This has cut the danger of credit pressure from creditors to less than 50% of what it was in 1918. It seems to indicate a far-sighted conservation of earnings and is a highly improving indication.
The last of the ratios, Sales to Fixed Assets (discussed in paragraph 13, section G) shows some improvement over the statement of 1918, although it has been falling since 1919. It registers about 95% of its average position for the period and so, while an adverse indication it is not yet a seriously critical one.
SUMMARY—COMPANY A
In summary the total position seems to have made a decided improvement, far better in fact than the current ratio alone would indicate. If we were to average each ratio for the period and compare the 1922 ratio to this average we would get the following table:
Current Ratio Worth to Fixed
*Sales to Rec *Sales to Mdse
Sales to Worth Sales to Fixed
*Worth to Debt
Average 203% 143% 558% 528% 225% 321% 179%
1922 Ratios 203% 149% 580% 612% 205% 307% 247%
1922 Relation to A 100% 0 104% + 103% + 116% + 9 1 % — 95% —
137% +

The current ratio is no indicator as it equals the average. Three major ratios, marked (*) shows substantial betterments and three minor ratios shows a falling off. The logical answer seems to be that the company has shown a marked improvement.
COMPANY B ANALYSIS
16. The Current Ratio of this company does not make much of any indication of trend during this period. It is true that it declined from 204% to 195% but this is a decline of a very moderate degree and does not create any impression of retrogression.
The ratio of Merchandise to Receivables (discussed in paragraph 13, section A) is a sharply rising ratio that would, by the mathematics of the study, explain away to a very great extent the moderate fall in the current ratio. This study, when combined with the current ratio, would lead us to believe that perhaps some betterment had taken place in the credit position of the company.
The Worth to Fixed Asset ratio (theory discussed in paragraph 13, section B) indicates a variety of fluctuations. At first the ratio shows a betterment as between 1918 and 1919. After that, however, there is a steady decline until in 1922 the ratio amounts to only 104%. It is true that a very considerable part of the plant or fixed assets may have been financed by funded debt arrangement, but not completely for the funded debt has increased from $12,350 to $35,000—or $22,650 —while the fixed assets have increased from $25,000 to $60,000—or $35,000. The difference has had to come out of net worth and the indications are that the company is increasing fixed assets more rapidly than it is creating wealth or even than it can interest long time lenders. Taking the funded debt and the net worth together in 1918 and establishing the relation of this total to the fixed assets it produces a ratio of 183% which has fallen when similarly computed in 1922 to 163%, thereby checking the opinion of the conversion of liquid into fixed capital at a too rapid rate.
The ratio of Sales to Receivables (theory discussed in paragraph 13, Section C) indicates a speeding up between 1918 and 1921, but then an inability to advance further. It is, however, at a probably satisfactory level and is a good factor.
The actions of the ratio of Sales to Merchandise (theory discussed in paragraph 13, section D) are not at all satisfactory and are a marked factor of retrogression. From a relative turnover of over eight times this ratio has fallen to a little more than four times or to about 50% of its 1918 liquidity. There is an interesting correlation that can be made between this ratio and the ratio of Merchandise to Receivables. In 1918, when prices were advancing, this company carried a larger bulk of receivables than merchandise. At this time and until sometime in 1920 prices tended to advance and a stock that was perhaps a little below normal in turnover was not a danger. It may also be that the company showed a higher relation of Sales to Merchandise at this time because of a war profiteering wider margin of profit charged. As the price break period came, however, this company switches from this position and in 1921 and 1922 the merchandise is the bulkier of the two items indicating the danger of falling prices under which the company operated. Both the ratio of Sales to Merchandise and Merchandise to Receivables, ratios and their use in combination suggest a question as to the economic soundness of thought and ability to meet conditions by the management. Decidedly a bad factor, although not primarily reflected by the current ratio.
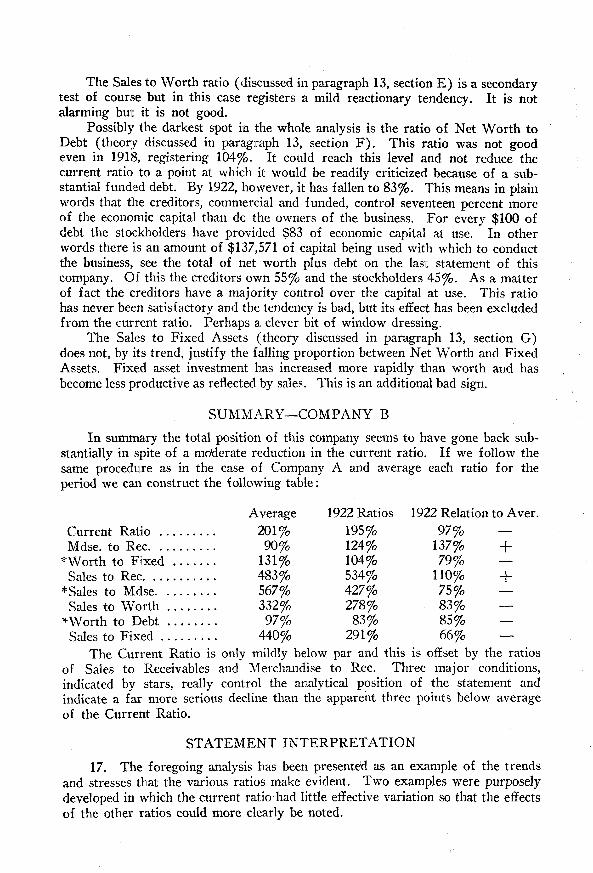
The Sales to Worth ratio (discussed in paragraph 13, section E ) is a secondary test of course but in this case registers a mild reactionary tendency. It is not alarming but it is not good.
Possibly the darkest spot in the whole analysis is the ratio of Net Worth to Debt (theory discussed in paragraph 13, section F ) . This ratio was not good even in 1918, registering 104%. It could reach this level and not reduce the current ratio to a point at which it would be readily criticized because of a substantial funded debt. By 1922, however, it has fallen to 83%. This means in plain words that the creditors, commercial and funded, control seventeen percent more of the economic capital than do the owners of the business. For every $100 of debt the stockholders have provided $83 of economic capital at use. In other words there is an amount of $137,571 of capital being used with which to conduct the business, see the total of net worth plus debt on the last statement of this company. Of this the creditors own 55% and the stockholders 45%. As a matter of fact the creditors have a majority control over the capital at use. This ratio has never been satisfactory and the tendency is bad, but its effect has been excluded from the current ratio. Perhaps a clever bit of window dressing.
The Sales to Fixed Assets (theory discussed in paragraph 13, section G) does not, by its trend, justify the falling proportion between Net Worth and Fixed Assets. Fixed asset investment has increased more rapidly than worth and has become less productive as reflected by sales. This is an additional bad sign.
SUMMARY—COMPANY B
In summary the total position of this company seems to have gone back substantially in spite of a moderate reduction in the current ratio. If we follow the same procedure as in the case of Company A and average each ratio for the period we can construct the following table:
Current Ratio Mdse. to Rec
* Worth to Fixed Sales to Rec
*Sales to Mdse Sales to Worth
* Worth to Debt Sales to Fixed
The Current Ratio is only mildly below par and this is offset by the ratios of Sales to Receivables and Merchandise to Rec. Three major conditions, indicated by stars, really control the analytical position of the statement and indicate a far more serious decline than the apparent three points below average of the Current Ratio.
STATEMENT INTERPRETATION
17. The foregoing analysis has been presented as an example of the trends and stresses that the various ratios make evident. Two examples were purposely developed in which the current ratio had little effective variation so that the effects of the other ratios could more clearly be noted.
Average 201%
90% 131% 483% 567% 332%
97% 440%
1922 Ratios 195% 124% 104% 534% 427% 278%
83% 291%
1922 Relation to Aver. 97%
137% 79%
110% 75% 83% 85% 66%
—
+ —
+ — — — —
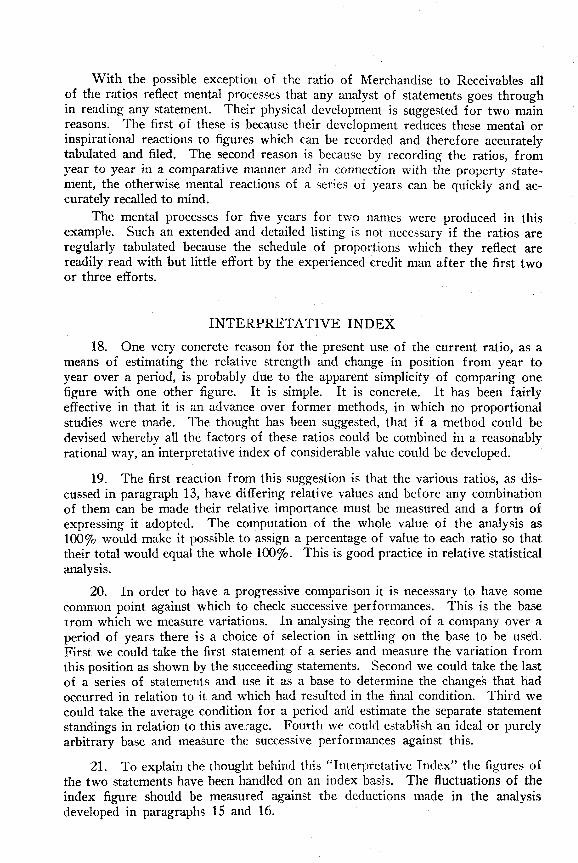
With the possible exception of the ratio of Merchandise to Receivables all of the ratios reflect mental processes that any analyst of statements goes through in reading any statement. Their physical development is suggested for two main reasons. The first of these is because their development reduces these mental or inspirational reactions to figures which can be recorded and therefore accurately tabulated and filed. The second reason is because by recording the ratios, from year to year in a comparative manner and in connection with the property statement, the otherwise mental reactions of a series of years can be quickly and accurately recalled to mind.
The mental processes for five years for two names were produced in this example. Such an extended and detailed listing is not necessary if the ratios are regularly tabulated because the schedule of proportions which they reflect are readily read with but little effort by the experienced credit man after the first two or three efforts.
INTERPRETATIVE INDEX
18. One very concrete reason for the present use of the current ratio, as a means of estimating the relative strength and change in position from year to year over a period, is probably due to the apparent simplicity of comparing one figure with one other figure. It is simple. It is concrete. It has been fairly effective in that it is an advance over former methods, in which no proportional studies were made. The thought has been suggested, that if a method could be devised whereby all the factors of these ratios could be combined in a reasonably rational way, an interpretative index of considerable value could be developed.
19. The first reaction from this suggestion is that the various ratios, as discussed in paragraph 13, have differing relative values and before any combination of them can be made their relative importance must be measured and a form of expressing it adopted. The computation of the whole value of the analysis as 100% would make it possible to assign a percentage of value to each ratio so that their total would equal the whole 100%. This is good practice in relative statistical analysis.
20. In order to have a progressive comparison it is necessary to have some common point against which to check successive performances. This is the base from which we measure variations. In analysing the record of a company over a period of years there is a choice of selection in settling on the base to be used. First we could take the first statement of a series and measure the variation from this position as shown by the succeeding statements. Second we could take the last of a series of statements and use it as a base to determine the changes that had occurred in relation to it and which had resulted in the final condition. Third we could take the average condition for a period and estimate the separate statement standings in relation to this average. Fourth we could establish an ideal or purely arbitrary base and measure the successive performances against this.
21. To explain the thought behind this "Interpretative Index" the figures of the two statements have been handled on an index basis. The fluctuations of the index figure should be measured against the deductions made in the analysis developed in paragraphs 15 and 16.

25% 5%
10% 15% 15% 5%
20% 5%
100%
CHOICE OF WEIGHTS
22. As was said in paragraph 19 the various ratios have relatively differing values. In the application of this theory to the analysis of the two specimen statements the following scale has been selected as differentiating between the relative importance of the various ratios. These weights, however, are susceptible of change for various types of business. For example, in the jobbing business the ratios dealing with fixed assets would be of less importance than in a manufacturing business for very obvious reasons.
Current Ratio Mdse. to Rec Worth to Fixed Sales to Rec Sales to Mdse Sales to Worth Worth to Debt Sales to Fixed
Total
This particular table means, for example, that the relation that exists between Net Worth and Debt is considered as being four-fifths as important as the Current Ratio and twice as important as the relation of Net Worth to Fixed Assets.
23. There is an inversion in two of the ratios as they were used in the first development of ratio analysis. These two inverted ratios are now listed as "Merchandise to Receivables" and "Worth to Debt." This has been done so that their effects upon the index would register in the same direction as the other ratios. For example an increasing current ratio is a betterment. An increase in the Net Worth as compared to the Total Debt is also a betterment. With the ratios as above listed any increase tends to a betterment and any decrease to a falling off, except for logical and carefully explained exceptions.
24. If we divide any one ratio by whatever base we may have developed or selected for that ratio we can at once determine what percentage of the base the ratio is. For example, if 200 be selected as a base for the current ratio then if an individual statement has a current ratio of 200 it is 100% of the base, as far as that one ratio is concerned. If the individual current ratio is 150 then its relation to a 200 base is 75%.
25. In formula this would look as follows:
== Relative Current Ratio Strength
Applied in figures to the 1918 statement of Company A, discussed in paragraph 14, in which the current ratio for 1918 is 200 and the average for the period, 203, being used as a base, this formula would be
= 98%
meaning that the current ratio of Company A in 1918 is 98% of the average for the period, which has been used as a base.
Single Year Current Ratio
Base Current Ratio
200 203

26. Following this procedure for each of the eight ratios for each year for both companies we would establish the following tables in percentages:
COMPANY A
Current Ratio Mdse. to Rec Worth to Fixed Sales to Rec Sales to Mdse Sales to Worth Worth to Debt Sales to Fixed . . . . . . . .
Current Ratio Mdse. to Rec Worth to Fixed Sales to Rec Sales to Mdse Sales to Worth Worth to Debt Sales to Fixed
COMPANY B
These two scales or tables mean that each ratio, in the year at the column head bears the indicated percentage relationship recorded in that column, to the base which was the average of the ratio for the period.
For example: The average of the five ratios of Sales to Merchandise of Company B, for the five years of the study, is 567% (see last column table of ratios below Company B, paragraph 14, last column fifth line). In 1921 the ratio of Sales to Merchandise was 490% (see same table fourth column, fifth line). Dividing 490, the yearly ratio, by 567, the average base ratio, produces 86%, meaning that this ratio in 1921 is 86% as strong as the average.
27. In paragraph 22 a series of weights or relative values of the ratios was listed. If these weights or values be multiplied by the percentage of average for both companies that appear in paragraph 25, the following table will be developed.
RATIO INDEX VALUES—COMPANY A
Current Ratio Mdse. to Rec Worth to Fixed Sales to Rec Sales to Mdse Sales to Worth Worth to Debt Sales to Fixed
Total or Index . . . .
1918 98 107 84 94 87 103 67 87
1919
99 115 101 100 86 107 77 109
1920
101 103 100 108 104 103 101 104
1921
102 85 108 92 106 95 114 103
1922
100 89 104 103 116 91 137 95
1918 101 57 102 89 144 98 107 100
1919
101 78 120 85 102 102 91 122
1920
100 109 109 105 91 111 84 121
1921
100 120 88 109 86 103 80 90
1922
97 137 79 110 75 83 85 66
1918 24.50 5.35 8.40 14.10 13.05 5.15 13.40 4.35
88.30
1919 24.75 5.75 10.10 15.00 12.90 5.35 15.40 5.45
94.70
1920 25.25 5.15 10.00 16.20 15.60 5.15
20.20 5.20
102.75
1921
25.50 4.25 10.80 13.80 15.90 4.75 22.80 5.15
102.95
1922
25.00 4.45 10.40 15.45 17.40 4.55 27.40 4.75
109.40
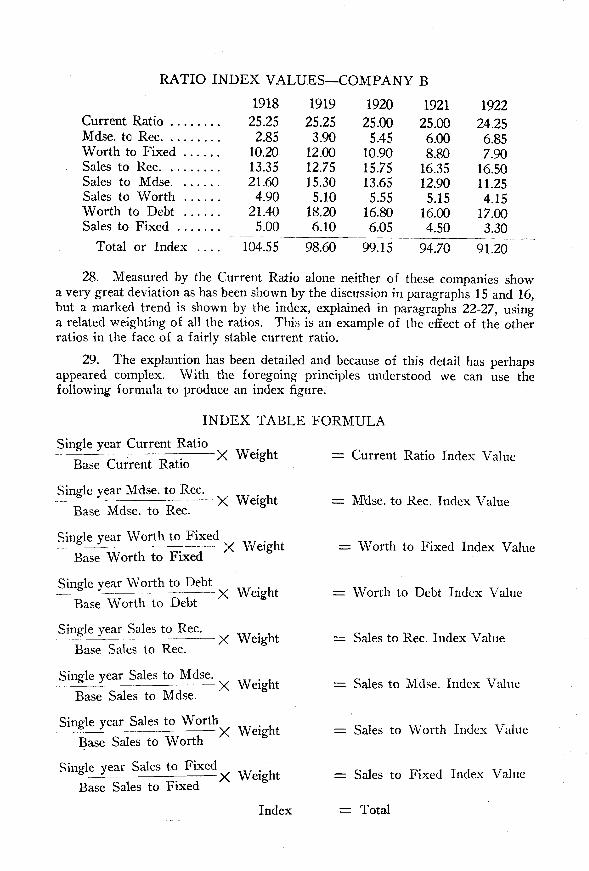
RATIO INDEX VALUES—COMPANY B
Current Ratio Mdse. to Rec Worth to Fixed Sales to Rec Sales to Mdse Sales to Worth Worth to Debt Sales to Fixed
Total or Index . . . .
28. Measured by the Current Ratio alone neither of these companies show a very great deviation as has been shown by the discussion in paragraphs 15 and 16, but a marked trend is shown by the index, explained in paragraphs 22-27, using a related weighting of all the ratios. This is an example of the effect of the other ratios in the face of a fairly stable current ratio.
29. The explantion has been detailed and because of this detail has perhaps appeared complex. With the foregoing principles understood we can use the following formula to produce an index figure.
INDEX TABLE FORMULA
Weight = Current Ratio Index Value
Weight = Mdse. to Rec. Index Value
Weight = Worth to Fixed Index Value
Weight = Worth to Debt Index Value
Weight = Sales to Rec. Index Value
Weight = Sales to Mdse. Index Value
Weight = Sales to Worth Index Value
Weight = Sales to Fixed Index Value
Index = Total
Single year Current Ratio
Base Current Ratio
Single year Mdse. to Rec.
Base Mdse. to Rec.
Single year Worth to Fixed
Base Worth to Fixed
Single year Worth to Debt
Base Worth to Debt
Single year Sales to Rec.
Base Sales to Rec.
Single year Sales to Mdse.
Base Sales to Mdse.
Single year Sales to Worth
Base Sales to Worth
Single year Sales to Fixed
Base Sales to Fixed
1918
25.25 2.85 10.20 13.35 21.60 4.90 21.40 5.00
104.55
1919
25.25 3.90 12.00 12.75 15.30 5.10 18.20 6.10
98.60
1920
25.00 5.45 10.90 15.75 13.65 5.55 16.80 6.05
99.15
1921
25.00 6.00 8.80 16.35 12.90 5.15 16.00 4.50
94.70
1922
24.25 6.85 7.90 16.50 11.25 4.15 17.00 3.30
91.20

30. Applied to the last statement of Company B, 1922, using the average of each ratio as a base this formula, filled out, would look as follows;
Total = 91.20 or Index
31. To compute this index, once the ratios have been prepared, takes less than six minutes per statement by use of a computing machine such as in the office of many banks. Sufficient accuracy can be secured by use of a slide rule in about the same time.
To compute the eight ratios from a regular comparison sheet takes less than four minutes, sometimes less than three minutes, per statement after the figures are spread upon a regular comparison sheet.
32. The concrete advantage of the ratio method of analysis is that it produces definite proportional reactions that can be tabulated and read in comparison with previous definite proportions similarly developed. They have a statistical value in that, because of their definite method of development, they may be combined into an index, if that be desired.
33. Industries are very largely affected by similar economic changes. We hear of the steel industry booming or the lumber industry stagnant. The automobile industry, as a whole concrete thing, is held up to criticism or condemnation. Tanners, as a class, are affected by changes in hide market values. Department stores report good or bad holiday trade. Everywhere we find people speaking of industries by groups. Type by groups is acknowledged in everyday conversation, both personal and highly statistical. The question arises—Why not statement analysis by groups?
34. Already a sufficient experimentation has been made to make moderately certain as a fact the once estimate:
25 = 24.25 Current Ratio Value
5 = 6.85 Mdse to Rec. Value
10 = 7.90 Worth to Fixed Value
20 = 17.00 Worth to Debt Value
15 = 16.50 Sales to Rec. Value
15 = 11.25 Sales to Mdse. Value
5 = 4.15 Sales to Worth Value
5 = 3.30 Sales to Fixed Value
195 201
124
90 104 131
83 97
534
483
427
567
278
332
291
440
That groups of statements in similar lines will have certain similar characteristics because they are largely controlled by the action of the law of supply and demand upon the same basic raw materials and also upon the finished product.
35. If an industry be improving and operating under profitable economic conditions the effect of this will be noticeable in the proportions of a combined statement made up of the many separate statements of the trade or a well selected list. Within an industry there will be good and poor managements. The proportions of the statements of these will be better or worse than the average. By comparing the ratios from a statement of an individual company with the ratios from a consolidated statement of many companies in the same line it may be able to place it in the good or poor class. This would depend on whether or not its proportions were better or worse than those of the group.
36. If such a combined study were made over a series of years and the trends noted the trend of an individual company could be checked to determine whether it was following the general direction of the industry or diverging from it. That such a thing can positively be done is, of course, open to argument, but the indications are so strong that a proper amount of investigation should be given this field.
37. As differing types of business would produce different normals in the ratios, so will difference in location also produce different normals within a type of business. Transportation, the labor supply, the condition of the people in their own prosperity, and many other such forces, affect business differently in various parts of the country. It would be almost as unfair to compare the New England, Texas or Oregon hardware merchant to a general average, as to compare the millinery and hardware man in general.
To overcome the sectional inequalities mentioned above, the country, as a whole, should be divided into several sections.
Type ratios for different kinds of business should be established, first on a national basis, and then for each section, using statements originating in each section as material for compilation.
The differentiation of types of business, and also as between their locations, is a fairly evident economic necessity. The manner of making this differentiation is not difficult to determine. There is, however, another variable to be taken into our calculation, and that is the date of issue of the statement.
The time of the year in which the statement is made may make a considerable difference in its proportions. It may not be fair to compare a January statement with a condition as shown by June figures.
Again, there may be a whole year which may be affected by adverse weather conditions so as to dislocate proportions. It would be unfair to compare the proportion of a bad crop year, for example, with a good crop year, except to study the effects of the bad conditons and perhaps measure their extent.
While this necessity of differentiation is recognized, little can be done to establish ratios prepared upon a basis to allow for this time element until we have cumulative figures extending over a sufficient number of years to establish a reasonably stable ratio set that will not be too much affected by one temporary decline or abnormal advance. Eventually we can develop figures that will apply the law of averages to kind of business, location of plant, and time of issue.
It may be that such a study will throw some light, if developed, upon the business cycle.


![INGLES- Cannan, Wealth Brief Explanation of Causes of Economic Wealth [1914].pdf](https://static.fdocuments.net/doc/165x107/577cda6d1a28ab9e78a5a699/ingles-cannan-wealth-brief-explanation-of-causes-of-economic-wealth-1914pdf.jpg)


