Financial Services & Insurance: The Long March Insurance Information Institute December 2001 If...
87
Financial Services & Insurance: The Long March Insurance Information Institute December 2001 If you’d like a copy of this presentation, I will be happy to e-mail it to you Robert P. Hartwig, Ph.D. Vice President & Chief Economist Insurance Information Institute 110 William Street New York, NY 10038 Tel: (212) 346-5520 Fax: (212) 732-1916 [email protected] www.iii.org
-
Upload
neil-thomas -
Category
Documents
-
view
213 -
download
0
Transcript of Financial Services & Insurance: The Long March Insurance Information Institute December 2001 If...

Financial Services & Insurance: The Long March
Insurance Information InstituteDecember 2001
If you’d like a copy of this presentation, I will be happy to e-mail it to you
Robert P. Hartwig, Ph.D. Vice President & Chief EconomistInsurance Information Institute 110 William Street New York, NY 10038Tel: (212) 346-5520 Fax: (212) 732-1916 [email protected] www.iii.org

Presentation Outline• Financial Services—What’s Happening Today?
• Who’s the Competition?
• Why Bother Getting into Financial Services?
• What’s Hot?
• Lessons from Banks’ Experience with Insurance
• Does the Internet Make a Difference?
• Your Bread & Butter: Investing, Estate & Retirement Planning
• The Economy
• Q&A

CONVERGENCE CREATES OPTIONS & OPPORTUNITIES FOR BANKS AND INSURERS

% Non-Life Insurers Planning to Widen Fin’l. Services Operations
17.2%
58.1%
8.6%4.5%
8.6%13.6%
28.3%
16.7%13.1%
26.3%
0%
10%
20%
30%
40%
50%
60%
70%
InsuranceServices
Insurance Alliances withBank/AssetManagers
Ownership ofBanks/AssetManagers
FinancialServices
Conglomerate
Today
2005
Source: EIU/Pricewaterhouse Coopers; December 2000.
Is moreConglomeration
in store?

Applications for Thrift Charters, by Industry
Telecom1%
Retail5%Insurance
53%
Trade Group5%
Mfg.8%
Misc.10%
SecuritiesBroker/Dealers
18%
January 1, 1997 – May 1, 2001 (220 Applications)
Source: Office of Thrift Supervision

World’s Largest Financial Services Firms, 2000
*EstimateSource: Fortune
$129.9
$111.8
$92.8
$71.2 $71.0
$0
$20
$40
$60
$80
$100
$120
$140
General Electric Citigroup AXA ING Group Allianz
$ Millions

Top 10 Bank Holding Companies (2000, $ Billions)
Source: Board of Governors of the Federal Reserve; Insurance Information Institute.
$953.4
$712.7$625.5
$289.8 $272.4 $245.9 $216.5 $202.1 $165.2 $164.7
$0
$250
$500
$750
$1,000 $ Billions

Number of Bank Holding Cos. Formed Since GLB, (by FRB District)*
*As of Aug. 10, 2001.; GLB signed into law Nov. 1999.Source: Board of Governors of the Federal Reserve; Insurance Information Institute.
13
44
26
49
29
85
68
4437
89
42 42
$0
$20
$40
$60
$80
$100
Dallas district holding companies have smallest asset base of all 12 districts!!

Financial Assets by Sector
1990 vs. 2000 ($Billions)
608
2,644
1,351
556
6,406 6,492
3,139
1,217880
0
1,000
2,000
3,000
4,000
5,000
6,000
7,000
Mutual Funds* CommercialBanks
Life Insurers Securities Non-LifeInsurers
1990 2000
*Includes closed-end funds.Source: Federal Reserve, Insurance Information Institute

The Mating Dance

Wave of the Future?

Know Thy Enemy

Top 10 P/C Insurers: TX & US(2000)
Texas NWP US NWPState Farm $3,125.1 State Farm $33.3Allstate 1,997.8 Allstate 21.6Farmers 1,956.6 Zurich/Farmers 16.8AIG 817.5 AIG 12.2USAA 776.9 Berk. Hathaway 10.4Travelers 695.4 Travelers/Citi 9.9Progressive 532.6 Nationwide 9.5Continental 441.5 Liberty 8.7Liberty 403.8 C N A 8.1Hartford 401.9 Hartford 6.9

Top 10 Life/Health Insurance Groups & Cos., (2000, US Market)
*EstimateSource: Insurance Services Office, Insurance Information Institute.
$30.6
$24.0 $23.5 $23.0
$18.6 $18.2 $17.5 $17.0 $15.6 $14.4
$0
$5
$10
$15
$20
$25
$30
$35
Met
Life ING
AIG
Aegon
USA
Hartfo
rd L
ife
Nation
wide
CIGNA
Pruden
tial
Princip
al L
ife
New Y
ork L
ife
$ Billions

Top 10 Global Life Insurance Companies, (2000)
Source: Fortune, Insurance Information Institute.
$92.8
$71.2 $68.1$61.5
$53.3$46.4 $43.1
$38.1 $37.5$31.9
$0
$10
$20
$30
$40
$50
$60
$70
$80
$90
$100 $ Billions

Top 10 Writers of Annuities, 2000
*EstimateSource: Insurance Services Office, Insurance Information Institute.
$9.5
$7.1 $6.7 $6.5$5.9 $5.4 $5.3 $5.3 $4.9 $4.9
$0
$2
$4
$6
$8
$10
Hartfo
rd L
ife
Amer
ican G
ener
al
Citigr
oup
Aegon
USA
GE Fin
ancia
l
Met
Life
Nation
wide
TIAA G
roup
ING
Gro
up
Amer
ican E
xpre
ss
$ Billions

Top 10 Securities Firms’ Revenue (2000)
Source: Fortune, Insurance Information Institute.
$45.4 $44.9
$33.0
$26.4
$10.3$7.1
$2.8 $2.3 $2.0 $1.7$0
$10
$20
$30
$40
$50 $ Billions

Top 10 Mutual Fund Cos. (Assets, 2000)
Source: Investment Company Institute, Insurance Information Institute.
$818.8
$574.3
$368.5
$242.6$191.7 $177.0 $176.6 $172.2 $171.7 $166.0
$0
$100
$200
$300
$400
$500
$600
$700
$800
$900 $ Billions

Why Bother Getting into Financial Services?

0%
5%
10%
15%
20%
25%
US P/C Insurers All US Industries LifeDiversified Finl. Comm. Banks
ROE: Financial Services Industry Segments, 1987–2000*
* 2000 figures are estimates.Source: Insurance Information Institute

-2%
0%
2%
4%
6%
8%
10%
12%
14%
P/C Life
Source: A.M. Best, Insurance Information Institute
Growth in Premiums Written: P/C vs. Life/Annuity
*2000 est.; 2001 forecast from III Groundhog Survey
Life Growth Outpaces P/C

0%
2%
4%
6%
8%
10%
12%
14%
16%
18%
ROE Non-Life Cost of Capital
ROE vs. Cost of Capital: US Non-Life 1991 – 2000
Source: The Geneva Association, Insurance Information Institute.
Ranks of the “Best of Breed” are Thin

1999 Return on Equity (Profitability)
1.0%
2.8%
3.1%
5.5%
6.5%
7.4%
15.4%
0% 5% 10% 15% 20%
Fortune 500
PP Auto
US All P/C Lines
Workers Comp
Homeowners
Comm Multi Peril
Comm Auto
Source: NAIC, Insurance Information Institute
1999

0%
2%
4%
6%
8%
10%
12%
14%
16%
18%
ROE Life Cost of Capital
ROE vs. Cost of Capital: US Life Insurance 1992 – 2000
Source: The Geneva Association, Insurance Information Institute.
Ranks of the “Best of Breed” are thin among stock life insurers too, though not quite so bad.

Competition—Still Intense: Number of Insurers: 1970-2000
1095 1059
15751702
2406 2430 2485 2480 2455
1802 17461958
2261 2195
17151563
0
500
1,000
1,500
2,000
2,500
3,000
1970 1975 1980 1985 1990 1995 1998 1999 2000
Property/Casualty
Life/Health
Sources: P/C: A.M. Best; L/H: NAIC.

Impact of Recession on P/C Premiums and Profitability (1970-1999)
8.1%
5.4%
-2.7%
0.2%
3.9% 3.8%2.7%
4.1%
8.8%
4.7%
7.0%
8.9%9.4%
11.3%
-4%
-2%
0%
2%
4%
6%
8%
10%
12%
Inflation (CPI) NWP Growth(unadj.)
Real NWPGrowth
ROE--P/CInsurers*
ROE--AllIndustries*
ROE--Banks* ROE--DiversifiedFinancial*
Recession Years (1970; 74-75; 80-82; 90-91)
Non-Recession Years (all other years, 1970-1999)
*GAAP return on equity, adjusted for inflation; Bank data 1952-99; Div. Fin. 1987-99Source: Insurance Information Institute

Source: New York Times Magazine, August 12, 2001

Source: New York Times Magazine, August 12, 2001

Source: New York Daily News, September 10, 2001

Financial Services Reform: The Reality so Far
• GLB: Signed by President Clinton Nov. 12, 1999• M&As: Little activity between banks and insurers.
Overall M&A activity ($ & #) down significantlyPartnerships popular (Travelers/Citi model not followed)Acquisition of agencies somewhat popular
• Impediments:Low ROEs (esp. on P/C side, but also Life)Regulatory uncertainties (fed vs. state regulation; privacy)Extraordinary economic/financial uncertainty
• Organic Growth:Many insurers have formed banks Has appeal for banks and insurers (e.g. State Farm)
• No federal chartering of insurers—yet

What’s Hot?

Value of Shares Traded, 1990- 2000 ($ Trillions)
Source:Securities Industry Association, Insurance Information Institute
1.3
1.5
1.8 2.3
2.5 3.1 4.
1 5.8 7.
3 9.0
11.1
0.5
0.7
0.9 1.4
1.5 2.
4 3.3 4.
5 5.8
11.0
20.4
0
5
10
15
20
25
90 91 92 93 94 95 96 97 98 99 00
NYSE NASDAQ

Number of Mutual Funds, 1985- 2000*
*Total also includes hybrid and money market funds.Source: Investment Company Institute, Insurance Information Institute
5791,100
2,140
4,395
382 4041,046
2,2101,527
3,081
5,728
8,171
0
3,000
6,000
9,000
1985 1990 1995 2000
Equity Bond Total

Principal Categories of Revenue Growth for Life Insurers
13.6%
18.5%
23.6%
24.1%
48.1%
72.0%
0% 20% 40% 60% 80%
Indiv. Annuities
All Lines
Ordinary Life
Indiv. A&H
Group A&H
Group Life
G ro u p L i f e
Source: AM Best
Percent Change from 1995 - 2000

Fixed Annuity Sales, Distribution Channel (2000)
Source: LIMRA.
1995
Stockbrocker10.0%
Banks21.0%Direct Resp.
1.0%Other3.0%
Ind. Agents38.0%
Career Agents27.0%
2000
Stockbrocker6.0%
Banks29.0%
Direct Resp.1.0%Other
4.0%
Ind. Agents47.0%
Career Agents13.0%

Variable Annuity Sales, Distribution Channel (2000)
Source: LIMRA.
1995
Stockbrocker30.0%
Banks7.0%
Direct Resp.14.0%
Other5.0%
Ind. Agents12.0%
Career Agents32.0%
2000
Stockbrocker41.0%
Banks10.0%
Direct Resp.8.0%Other
5.0%
Ind. Agents11.0%
Career Agents25.0%

Annuities: Too Many Eggs in One Basket?
“C N A To Cut Staff 11%; Charges To Be Taken”
--Wall Street Journal, December 6, 2001
Will cut 1,850 jobs (600 at Chicago HQ)
Discontinue variable life and annuity business
Take charge up to $174 million (2/3 for restructuring)
Reduce number of offices from 169 to 68

What are the Banks Doing?

Bank Distribution Channels for P/C Insurance
4.3%
15.4%
17.4%
21.7%
27.7%
0% 5% 10% 15% 20% 25% 30%
Agents in Banks
Direct Mail
Telemarketing
Bank/platform empl
Securities/Inv Grp
Source: American Bankers Insurance Association, Insurance Information Institute
2000

1998 Bank Insurance Premiums
Other1%
Annuities$19.6 billion
63%
Life$1.5 billion
5%
Personal$2.9 billion
9%
Commercial$4.0 billion
13%
Credit$2.9 billion
9%
Total = $31.1 Billion

1999 Bank Insurance Premiums
Other$0.3 billion
1%
Indiv. Life$0.7 billion
2%
Annuities$24.2 billion
66%
Indiv. Health/Dis$1.1 billion
3%
Personal$3.1 billion
8%
Commercial$4.4 billion
12%
Credit$2.9 billion
8%
Total = $36.7 Billion
Source: American Bankers Insurance Association, Insurance Information Institute.

2000 Bank Insurance Premiums
Annuities$31.0 billion
66%
Indiv. Health/Dis$2.1 billion
3%
Personal$3.7 billion
8%
Commercial$5.4 billion
12%
Credit$2.7 billion
8%
Total = $44.9 Billion

Annuity Sales through Banks, 2000
3.7 4.1 3.9 4.1
3.94.4
4.0 3.7
$7.8$7.9
$8.5
$7.6B
$0
$3
$6
$9
1Q 2Q 3Q 4Q
($ in billions)
Fixed Variable
Source: Kenneth Kehrer & Associates/American Banker

Bank Sales of Mutual Funds
$19.2
$33.0
$41.0
$46.3 $45.5
$40.0
$0
$10
$20
$30
$40
$50
1995 1996 1997 1998 1999 2000
$ Billions
Source: Kenneth Kehrer Associates, Insurance Information Institute.

WHY MOST BANKS FAIL AT SELLING INSURANCE

Bankers Hours?Image Problem

Why Most Banks Fail in Insurance
• Short-Term Thinking
Stick with it
• Failure to Think Strategically
Need to focus on customers’ insurance needs
• Putting a Banker in Charge
Specialized expertise important
Source: American Banker, January 19, 2001.

Why Most Banks Fail in Insurance (cont’d)
• Neglecting Cultural Issues
Europeans successful at cultural integration
• Ignoring Commercial Market
Especially middle market

What Can We Expect?
• More Partnerships
• Major Insurers Focus on Organic Growth
• Europeans:
Dominant, Aggressive, Experienced
• CEOs Focused and Distracted by Other Issues
Profits, disasters, economy
• Many Banks/Insurers struggling with “core issues”

Does the Internet Make a Difference?

Shifting Distribution Channels: Property/Casualty Insurers
Source: Datamonitor
20031998
Direct Response
10.0%Banks8.1%
Interne t7.3%
Other2.5%
Independent Agents23.3%
Captive Agents48.8%
Direct Response
9.8%Banks2.8%
Interne t0.9%
Other3.0%
Independent Agents27.0%
Captive Agents56.5%

Projected Online Sales of Auto, Home & Term Life Insurance
0
500
1000
1500
2000
2500
3000
3500
Auto Home Term Life
1998
1999
2000
2001
2002
2003
Source: Forrester Research
$ Millions
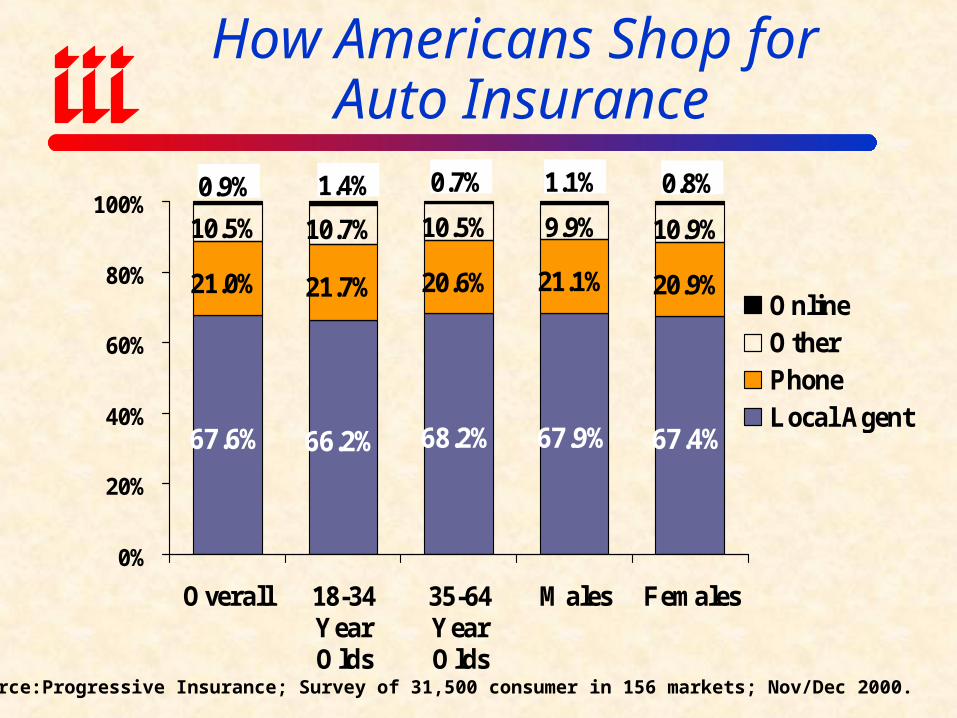
How Americans Shop for Auto Insurance
67.6% 66.2% 68.2% 67.9% 67.4%
21.0% 21.7% 20.6% 21.1% 20.9%
10.5% 10.7% 10.5% 9.9% 10.9%
0.8%1.1%0.7%1.4%0.9%
0%
20%
40%
60%
80%
100%
Overall 18-34YearOlds
35-64YearOlds
Males Females
OnlineOtherPhoneLocal Agent
Source:Progressive Insurance; Survey of 31,500 consumer in 156 markets; Nov/Dec 2000.

Interest in 1-Stop Shopping Concept
61%
74%
90%
0%
10%
20%
30%
40%
50%
60%
70%
80%
90%
100%
Single-Source Supermarket Either Option
Source: Bank Administration Institute,; Cambridge Group; as of February 2000.
High interest in use online financial services online

% On-Line Customers Conducting Selected Transactions
1%2%
4% 4%
8%
10%11%
12%13%
0%2%4%6%8%
10%12%14%
Source: Bank Administration Institute,; Cambridge Group; as of February 2000.
Use of financial services online lags expectations

6-Month Change in Number of E-Distribution Start-Ups
0
10
20
30
40
50Aug. 2000
Feb. 2001
Source: Conning

Distribution Channels Continue to Proliferate
Customer InsurerAgent Broker
Mail Telephone
Bank
Internet Dealerships Payroll Plans
Stock Exchanges
Online Auctions
????

Insurers: Tangled in the Web?

Leading Insurers Selling Life Ins. Through Banks
Source: Kenneth Kehrer Associates, Insurance Information Institute.
$50.
9
$27.
1
$20.
8
$8.7
$31.
1
$12.
3
$16.
1
$39.
5
$17.
1
$6.1
$56.
8
$47.
7
$36.
4
$35.
1
$28.
7
$24.
7
$20.
9
$20.
2
$17.
8
$10.
0
$0
$10
$20
$30
$40
$50
$60
1999 2000
$ Millions

Employment in Banking Sector, 1991- 2000
Source: Bureau of Labor Statistics, Insurance Information Institute.
1,5291,466 1,430
382276 253
135 156 194
0
200
400
600
800
1,000
1,200
1,400
1,600
1991 1995 2000
(Thousands)

Investing

Investing: Rewards but Many Pitfalls
• Agent often has inside track on major life events (banks don’t)
• Appropriate advice: Assessing the customer’s needs
90 year olds don’t need annuities (it’s happened)
• Bad advice can ruin a relationship and cost you the customer’s p/c and life business
too
• Decision on what to push can’t be entirely commission-driven
E.g., tech funds pushed aggressively until tech bubble burst
Better of with dollar cost averaging, but commission not as good
• Knowledge Gap: LT market performance, stocks v. bonds, interest rates, FX, GDP,
CPI, M&A
• Impact of economy on performance

-30%
-20%
-10%
0%
10%
20%
30%
40%
19
70
19
72
19
74
19
76
19
78
19
80
19
82
19
84
19
86
19
88
19
90
19
92
19
94
19
96
19
98
20
00
Large Company Stocks*As of December 5, 2001.Source: Ibbotson Associates, Insurance Information Institute
Total Returns for Large Company Stocks: 1970-2001
2001*
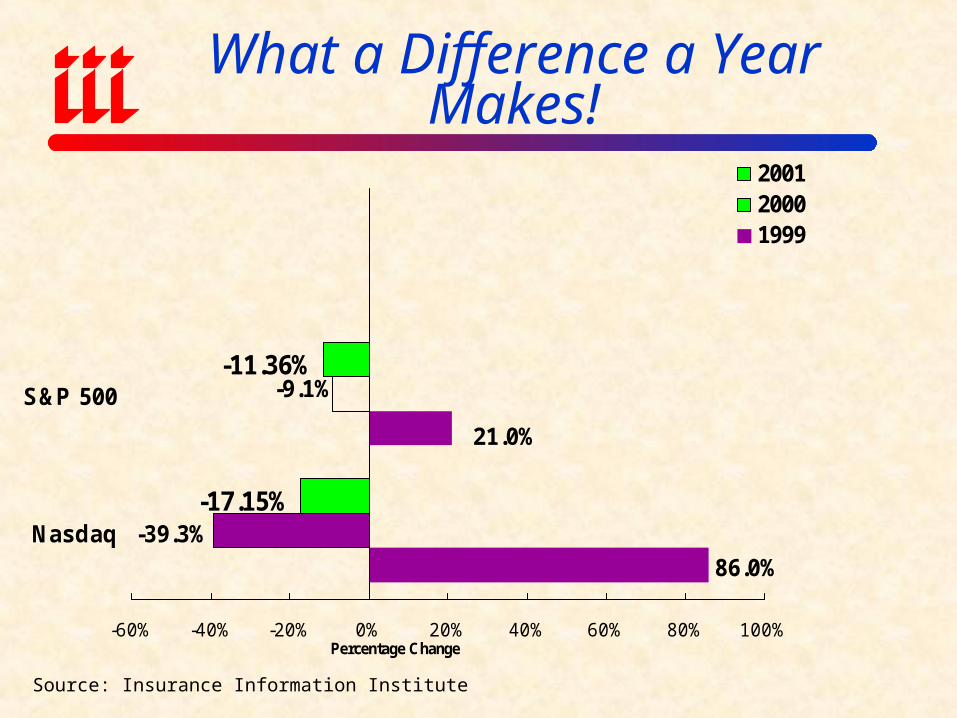
What a Difference a Year Makes!
86.0%
-17.15%
-11.36%
21.0%
-39.3%
-9.1%
-60% -40% -20% 0% 20% 40% 60% 80% 100%
Nasdaq
S&P 500
Percentage Change
200120001999
Source: Insurance Information Institute

Security Broker & Dealer Employment, 1991- 2000
Source: Bureau of Labor Statistics, Insurance Information Institute.
315 334359
393 400 417446
481505
548
0
100
200
300
400
500
600
1991 1992 1993 1994 1995 1996 1997 1998 1999 2000
(Thousands)

Texas: Income, 2000
$39,642$42,148
$27,722 $28,451
$0
$5,000
$10,000
$15,000
$20,000
$25,000
$30,000
$35,000
$40,000
$45,000
Median Household Per Capita
Texas US

Texas: Race Distribution 2000
Asian3%
Native Hawiaan
0%
Other12%
Two or More2%
American Indian
1%
African American
11%White71%
6.67 Million (32%) residents of Texas identify themselves as Latino or Hispanic (of any race)
75%
12%
1%
4%
0%6%2%
Texas PopulationU.S. Population
Source: U.S. Census Bureau

Retirement

Retirement Planning
$0
$5,000
$10,000
$15,000
$20,000
$25,000
$30,000
$35,000
$40,000
401(k) 457 Traditional &Roth IRA
SEP-IRA TraditionalKeough
Maximum contribution
To
Be
Det
erm
ined
To
Be
Det
erm
ined
‘01 ‘02 ‘06 ‘01 ‘02 ‘06 ‘01 ‘02 ‘06 ‘01 ‘02 ‘06 ‘01 ‘02 ‘06
Source: National Bureau of Economic Research

IRA Market Shares
Source: Investment Company Institute.
20001995
Banks/Thrifts20.0%
Life Insurers7.0%
Broker/ Dealers35.0%
Mutual Funds38.0%
Banks/Thrifts9.0%Life Insurers
9.0%
Broker/ Dealers35.0%
Mutual Funds45.0%

Retirement Benefit Asset Mix (2000)
Source: Investment Company Institute.
Private Defined
Benefits Plans
Other10.0%
Cash, e tc.7.0%
Mutual Funds6.0%
Broker/ Dealers35.0%
Equitie s49.0%
Private Defined
Contribution PlansOther20.0%
Cash, e tc.5.0%
Mutual Funds28.0%
Broker/ Dealers35.0%
Equitie s39.0%

Estate Planning

Texas: Age Distribution, 2000
Under 2032%
20 to 3423%
35 to 5428%
55 to 7413%
74 and older4%
Texas Population: 20,851,820
28%
20%31%
15%
6%
U.S. Population: 276 MillionNov 2001 projections
Source: U.S. Census Bureau
TX has a significantly younger population than the US as a whole.
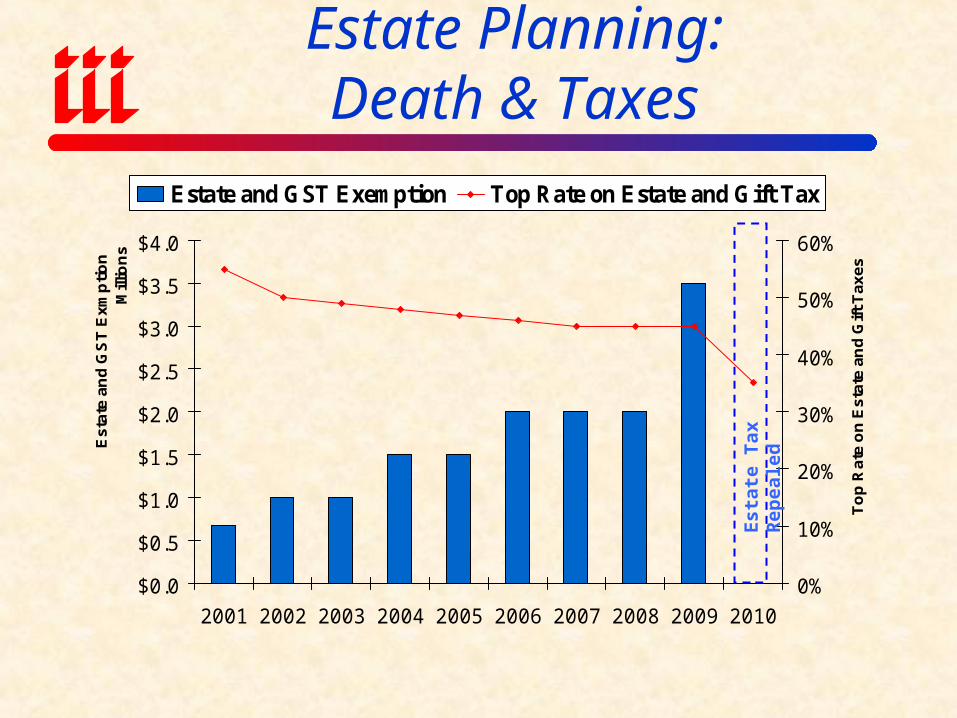
Estate Planning:Death & Taxes
$0.0
$0.5
$1.0
$1.5
$2.0
$2.5
$3.0
$3.5
$4.0
2001 2002 2003 2004 2005 2006 2007 2008 2009 2010
Es
tate
an
d G
ST
Ex
mp
tio
nM
illio
ns
0%
10%
20%
30%
40%
50%
60%
To
p R
ate
on
Es
tate
an
d G
ift
Ta
xe
s
Estate and GST Exemption Top Rate on Estate and Gift Tax
Est
ate
Tax
Rep
eale
d

It’s the Economy, Stupid!

Post World War II Recessionary Cycles
Previous Peak Trough Contraction in Months
February ‘45 October ‘45 8
November ’48 October ‘49 11
July ’53 May ’54 10
August ’57 April ‘58 8
April ’60 February ’61 10
December ’69 November ‘70 11
November ’73 March ’75 16
January ’80 July ’80 6
July ’81 November ’82 16
July ’90 March ’91 8
March ’01 - ? - ?Source: National Bureau of Economic Research

4.4%
3.5%
2.5%
5.7%
8.3%
4.8%5.6%
2.2%
1.0% 1.3%0.7%
-0.4%
-1.5%
-1%
0%
1%
2%
3%
4%
5%
6%
7%
8%
9%
10%
Real GDP Growth
Source: US Department of Commerce; Insurance Information Institute.*Estimate.
Economy is experiencing negative G-forces after several quarters of unsustainably high
real growth
In March 2001 we entered our first recession since 1990/91

-2
0
2
4
6
8
10
12
14
Per
cen
t
CPI - All Items (1982-84=100)
Change in Consumer Price Index
*EstimateSource: Bureau of Labor Statistics

Texas:Personal Bankruptcies
44,8
78
58,0
60
69,2
55
69,0
61
62,3
95
59,5
39
73,1
12
86,0
15
79,2
71
74,6
02
75,4
04
0
10,000
20,000
30,000
40,000
50,000
60,000
70,000
80,000
90,000
1995 1996 1997 1998 1999 2000 2001 2002 2003 2004 2005

Unemployment Rate (%)
5.6
6.8
7.56.9
6.15.6
5.44.9
4.54.2 4.0
5.4
3.0
3.5
4.0
4.5
5.0
5.5
6.0
6.5
7.0
7.5
8.0
90 91 92 93 94 95 96 97 98 99 00 Oct'01
Source: US Bureau of Labor Statistics; Insurance Information Institute.
Unemployment Is Up
Unemployment rate of 5.8% is
forecast for 2002.

Texas: Unemployment Rate
4.2
4.0
4.8
4.7
6.3
6.1
5.9
5.7
5.5
5.3 5.5
5.3
3
4
4
5
5
6
6
7
2000 2001 2002 2003 2004 2005
Texas USA
Estimates made before Enron debacle.

Texas: Change in Employment
3.1%
2.2%
2.1%
0.4% 0.5%
-0.3
%
2.7%
2.1% 2.
4%
1.9%
1.8%
1.2%
-0.5%
0.0%
0.5%
1.0%
1.5%
2.0%
2.5%
3.0%
3.5%
2000 2001 2002 2003 2004 2005
Texas USA

Consumer Confidence: Nov. ’01 vs. Nov. ‘00
Source: Conference Board
PACIFIC
-43.7%
GREAT PLAINS
-27.0%
SW. CENTRAL
-29.8%
ROCKY MOUNTAIN
–32.9%
SE. CENTRAL
-41.0%
S. ATLANTIC
-38.9%
MID ATLANTIC
-33.7%
NEW ENGLAND
-39.0%
US: -38.0%

70,4
18 83,1
03
82,1
80
99,8
31
101
,848
108
,613
107
,319
91,1
22
89,7
02
82,7
47
79,8
97
0
20000
40000
60000
80000
100000
120000
1995
1996
1997
1998
1999
2000
2001
2002
2003
2004
2005
Texas: Single-Family Housing Permits

42,0
57 53,3
59
57,2
95
99,4
83
82,2
90
72,8
53
118,
297
84,1
53
74,0
17
71,0
14
67,9
68
0
20,000
40,000
60,000
80,000
100,000
120,000
1995 1996 1997 1998 1999 2000 2001 2002 2003 2004 2005
Texas: Mortgage Originations

1,12
7,30
0
1,16
6,40
0
1,14
4,00
0
1,21
2,70
0
1,28
5,20
0
1,41
3,00
0
1,39
6,30
0
1,36
2,10
0
1,37
1,60
0
1,35
0,00
0
1,36
1,10
0
0
200,000
400,000
600,000
800,000
1,000,000
1,200,000
1,400,000
1,600,000
1995 1996 1997 1998 1999 2000 2001 2002 2003 2004 2005
Texas: New Vehicle Registrations

Insurance Information Institute On-Line
If you would like a copy of this presentation, please give me your business card with e-mail address or