Financial Scrutiny Unit Briefing Scotland’s economy ... · Financial Scrutiny Unit Briefing...
32
Financial Scrutiny Unit Briefing Scotland’s economy: recent developments 23 January 2014 14/07 Greig Liddell, Richard Marsh, Scherie Nicol and Simon Wakefield This briefing is produced to assist the Economy, Energy & Tourism Committee in their inquiry into Scotland’s Economic Future Post-2014. It provides an overview of Scotland’s recent economic performance as well as outlining the nature of the business base and international trade. It also considers the key issues in public finance and summarises the existing financial powers and those extended through the Scotland Act 2012. A supplementary briefing summarising some of the papers that have been published by the Scottish Government, the UK Government and the ESRC ‘Future of UK and Scotland’ programme to inform the debate on Scotland’s future is available here. © SteveLindridge/iStockphoto.com
Transcript of Financial Scrutiny Unit Briefing Scotland’s economy ... · Financial Scrutiny Unit Briefing...

The Scottish Parliament and Scottish Parliament Infor mation C entre l ogos .
Financial Scrutiny Unit Briefing
Scotland’s economy: recent developments
23 January 2014
14/07
Greig Liddell, Richard Marsh, Scherie Nicol and Simon Wakefield
This briefing is produced to assist the Economy, Energy & Tourism Committee in their inquiry into Scotland’s Economic Future Post-2014. It provides an overview of Scotland’s recent economic performance as well as outlining the nature of the business base and international trade. It also considers the key issues in public finance and summarises the existing financial powers and those extended through the Scotland Act 2012.
A supplementary briefing summarising some of the papers that have been published by the Scottish Government, the UK Government and the ESRC ‘Future of UK and Scotland’ programme to inform the debate on Scotland’s future is available here.
© SteveLindridge/iStockphoto.com

2
CONTENTS
EXECUTIVE SUMMARY .............................................................................................................................................. 3
AN OVERVIEW OF SCOTLAND’S ECONOMIC PERFORMANCE ........................................................................... 4
GDP PER PERSON ................................................................................................................................................. 4 KEY DRIVERS OF GDP – SECTORS ..................................................................................................................... 4 NATIONAL INCOME ................................................................................................................................................ 5 INADEQUACY OF GDP IN MEASURING WELFARE ............................................................................................. 5 POVERTY AND INEQUALITY ................................................................................................................................. 6
THE BUSINESS BASE ................................................................................................................................................ 7
COMPANIES BY SIZE ............................................................................................................................................. 7 COMPANY OWNERSHIP ........................................................................................................................................ 8 TRENDS IN MANUFACTURING ............................................................................................................................. 8 LEVEL OF BUSINESS INVESTMENT ..................................................................................................................... 9 GROWTH SECTORS ............................................................................................................................................. 10 KEY CHALLENGES FOR BUSINESS ................................................................................................................... 11
SCOTLAND AS A TRADING NATION ...................................................................................................................... 12
EXPORTS .............................................................................................................................................................. 12 TRADE BALANCE – SURPLUS OR DEFICIT? ..................................................................................................... 15
THE SCOTTISH LABOUR MARKET......................................................................................................................... 17
PARTICIPATION .................................................................................................................................................... 17 LABOUR FORCE PROFILE ................................................................................................................................... 18 PRODUCTIVITY ..................................................................................................................................................... 19
PUBLIC FINANCES ................................................................................................................................................... 21
PUBLIC SECTOR EXPENDITURE ........................................................................................................................ 21 PUBLIC SECTOR REVENUES .............................................................................................................................. 21 NET FISCAL BALANCE ......................................................................................................................................... 22 FUTURE PUBLIC FINANCE ISSUES .................................................................................................................... 23
North Sea revenues ........................................................................................................................................... 23 Demographic change ......................................................................................................................................... 24
DEVOLVED POWERS ............................................................................................................................................... 26
DEVOLVED FINANCIAL POWERS ....................................................................................................................... 26
ANNEX 1 – SUPPLEMENTARY TABLES ................................................................................................................ 28
SOURCES .................................................................................................................................................................. 29
RELATED BRIEFINGS .............................................................................................................................................. 32

3
EXECUTIVE SUMMARY
Scotland’s GDP per capita including a geographic share of North Sea activity was £28,117 in 2012, compared to £24,600 for the UK as a whole. Scotland has performed well relative to other similar countries since devolution, with GDP per person growing by an average of 1.4% each year. In particular there has been a strong movement towards service industries and a decline in other areas such as manufacturing and agriculture, forestry and fishing. Over two thirds of all businesses in Scotland have no employees. The number of businesses without employees has risen since devolution. Almost a fifth of private sector employment is in businesses owned in the rest of the UK, and a further 16.5% are under overseas ownership. Scotland’s manufacturing industry has higher levels of overseas ownership than other sectors. Exports to the rest of the UK as a share of GDP have remained relatively stable since devolution; however, exports to the rest of the world as a share of GDP have declined. This is likely to be linked to the decline in the electronics industry in Scotland. The three top sectors in relation to overseas exports in 2011 were food and drink, manufacture of refined petroleum and chemical products and computer, electronic and optical product manufacturing. Excluding oil and gas, the value of Scottish imports has been higher than the value of exports every year since devolution. The inclusion of North Sea exports would have a positive impact on Scotland’s balance of trade, swinging the balance towards a trade surplus. Scotland currently has the highest employment rate of the four countries in the UK. The employment rate has been driven by improvements in female employment, while the number of men in employment has fallen since 2008. The largest sector of employment is in public administration, education and health, accounting for 31% of employment. Scotland still lags the UK in earnings with median earnings lower in Scotland. There has been a significant reduction in both absolute and relative poverty since devolution but income inequality has remained fairly stable. A higher proportion of the working age population hold higher education qualifications than any other UK country. Since devolution, Scotland has had a net fiscal deficit every year except 2000-2001. Including a geographic share of North Sea revenues, Scotland’s net fiscal deficit tended to be slightly higher than the UK in the earlier years of devolution. In more recent years Scotland’s net fiscal deficit has been slightly lower than the UK. Future Scottish public finances will be significantly affected by the future value of North Sea revenues and demographic change. At present around 7% of Scottish tax revenues come from devolved taxes, although the Scotland Act 2012 devolved a number of additional financial powers (e.g., landfill tax and stamp duty land tax). In addition to these, Scotland has powers relating to the economy, e.g., in the areas of economic development, education and training, regeneration and aspects of transport. Powers in relation to fiscal, economic and monetary policy, benefits and social security, employment legislation and trade agreements are reserved to the UK Parliament.

4
AN OVERVIEW OF SCOTLAND’S ECONOMIC PERFORMANCE
GDP PER PERSON
Scotland’s economy has performed well relative to other developed countries since devolution. GDP per person has grown by an average of 1.4% in real terms1 each year from 1999. This is ahead of the rest of the UK, the rest of Europe and the OECD countries (shown in Table 1 below).
Table 1: Real growth in GDP per person
Economy Average growth annual rate
(1999-2012)
Scotland* 1.4% OECD 1.3% EU (27) 1.2% UK 1.2% Source: Scottish Government 2013b, ONS and OECD
Notes: Onshore economy (excluding North Sea activities)
The latest Scottish National Accounts Project (SNAP) data (Scottish Government 2013b) show GDP per person (in current prices2). Since devolution, GDP per person in Scotland grew by 62% to reach £23,932 in 2012, or by 71% to reach £28,117 if a geographic share of the North Sea is included. These figures compare to an increase of 54% for the UK as a whole with GDP per person rising to £24,600 in 2012.
Scotland’s growth in GDP per capita during the 14 years post-devolution (1999-2012) is less than half the growth in GDP per person during the 14 years before devolution (1985-1998) at 3.0% per annum. Most of the relative decline in Scotland’s growth can be accounted for by the onset of the financial crisis from 2007.
The Scottish Government compared Scotland’s growth in GDP per person with a selection of comparable countries in Scotland’s Future (Scottish Government, 2013p). The analysis found that GDP per person grew more slowly in Scotland during 1977-2007 compared to an average of the comparable countries (not accounting for size). However, Scotland still grew more quickly than most of the comparable countries cited for 1997-2007 (Table A.2 appended). If the most recent time period is considered (1982-2012) Scotland’s GDP per person grew more quickly than the average and by more than most of the comparable countries.
KEY DRIVERS OF GDP – SECTORS
Scotland’s economy has expanded significantly (in total by 23% in real terms) since devolution and has also undergone significant structural change. Onshore mining and quarrying activities (mostly supporting oil and gas extraction) grew by 63%, however these activities form a small part of Scotland’s economy accounting for just 3% of GDP in 20093.
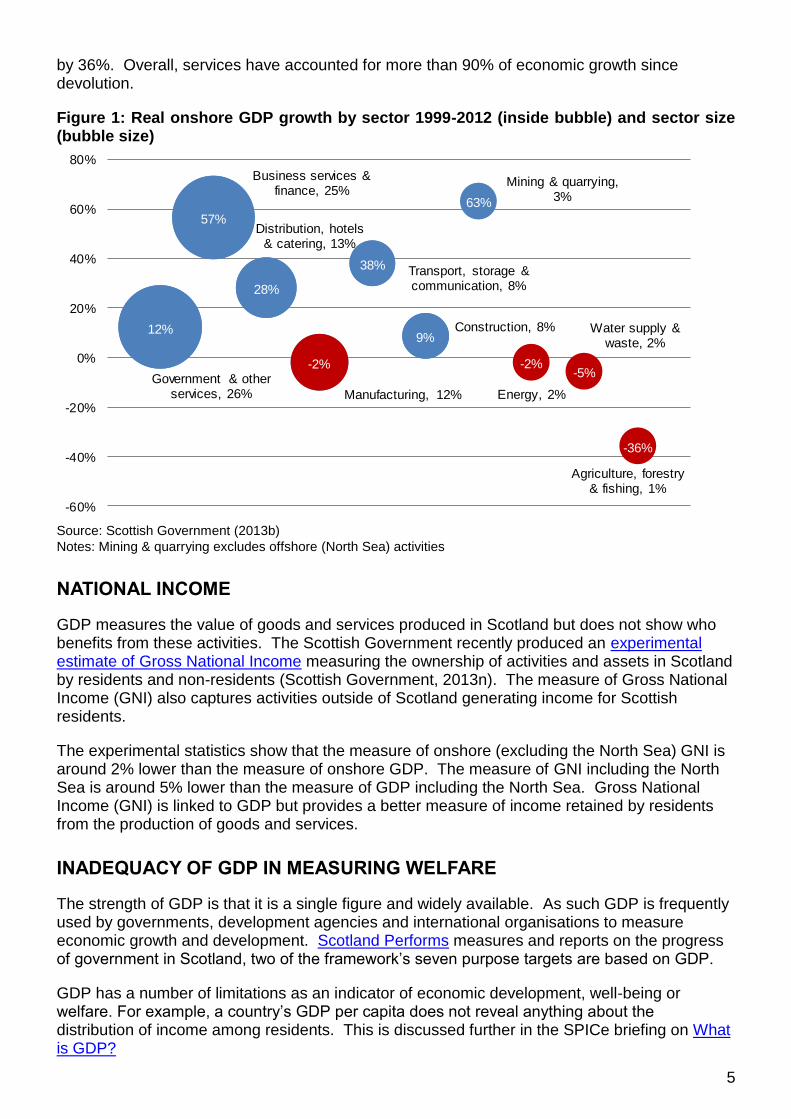
Figure 1 shows a strong movement towards services; business services and finance expanded by 57% and accounted for one quarter of Scotland’s economy (25%) in 2009. Manufacturing has declined by 2% in real terms since devolution and agriculture, forestry and fishing has fallen
1 After accounting for inflation.
2 No account is made for inflation.
3 Scottish Government Quarterly GDP estimates use a 2009 baseline which is shown in the above figure to reflect
the relative size of the different sectors in Scotland’s economy.
5
by 36%. Overall, services have accounted for more than 90% of economic growth since devolution.
Figure 1: Real onshore GDP growth by sector 1999-2012 (inside bubble) and sector size (bubble size)
Source: Scottish Government (2013b)
Notes: Mining & quarrying excludes offshore (North Sea) activities
NATIONAL INCOME
GDP measures the value of goods and services produced in Scotland but does not show who benefits from these activities. The Scottish Government recently produced an experimental estimate of Gross National Income measuring the ownership of activities and assets in Scotland by residents and non-residents (Scottish Government, 2013n). The measure of Gross National Income (GNI) also captures activities outside of Scotland generating income for Scottish residents.
The experimental statistics show that the measure of onshore (excluding the North Sea) GNI is around 2% lower than the measure of onshore GDP. The measure of GNI including the North Sea is around 5% lower than the measure of GDP including the North Sea. Gross National Income (GNI) is linked to GDP but provides a better measure of income retained by residents from the production of goods and services.
INADEQUACY OF GDP IN MEASURING WELFARE
The strength of GDP is that it is a single figure and widely available. As such GDP is frequently used by governments, development agencies and international organisations to measure economic growth and development. Scotland Performs measures and reports on the progress of government in Scotland, two of the framework’s seven purpose targets are based on GDP.
GDP has a number of limitations as an indicator of economic development, well-being or welfare. For example, a country’s GDP per capita does not reveal anything about the distribution of income among residents. This is discussed further in the SPICe briefing on What is GDP?
12%
57%
28%
-2%
38%
9%
63%
-2%-5%
-36%
Government & other services, 26%
Business services & finance, 25%
Distribution, hotels & catering, 13%
Manufacturing, 12%
Transport, storage & communication, 8%
Construction, 8%
Mining & quarrying, 3%
Energy, 2%
Water supply & waste, 2%
Agriculture, forestry & fishing, 1%
-60%
-40%
-20%
0%
20%
40%
60%
80%

6
Measures of GDP do not wholly account for externalities. For example, GDP does not fully capture the value of natural resources consumed or pollution produced in the production of goods and services. GDP as a single measure of economic development is therefore likely to overstate the progress of an economy. The welfare of a nation cannot be shown from measuring GDP alone, this is discussed further in the SPICe briefing on alternatives to GDP.
Indicators of well-being recently developed by the ONS show Scotland had proportionately more people than any other country in the UK rating their anxiety as very low (0 to 1 out of 10) in 2012/13. Scotland performs tracks 7 purpose targets, supported by 16 National Outcomes and 50 National Indicators. This is discussed further in the SPICe briefing on The National Performance Framework and Scotland Performs.
POVERTY AND INEQUALITY
The Scottish Government’s report on Poverty and income inequality in Scotland: 2011-12 shows at the start of devolution (1999-2000) there were around 1,050 thousand people (21% of the population) in relative poverty Before Housing Costs (BHC) and 1,330 thousand people (27% of the population) in absolute poverty BHC (Scottish Government, 2013o).
The latest data available shows a significant reduction in both absolute and relative poverty4. By 2011-2012 there were 710 thousand people (14% of the population) in relative poverty (BHC) and 780 thousand people (15% of the population) in absolute poverty (BHC). The report highlights that changes in income equality have been limited “In terms of income inequality, the percentage of income received by the lowest 3 income deciles in 2011/12 was 14 per cent, unchanged from 2010/11. This percentage has remained at between 13 and 14 per cent since 1998/99.” The Gini index5 measures the extent to which the distribution of income among individuals or households is different from a perfectly equal distribution. An index of zero represents perfect equality and 100 represents perfect inequality. The latest Scottish Government data shows Scotland’s Gini index has remained relatively stable since devolution at 33 in 1999-2000 and 32 in 2011-2012. This compares with a Gini index for the UK at 35 in 1999-2000 and 34 in 2011-2012.
4 Poverty and income inequality in Scotland: 2011-12 defines relative poverty as individuals living in households
whose equivalised income is below 60% of UK median income in the same year. This is a measure of whether
those in the lowest income households are keeping pace with the growth of incomes in the population as a whole.
Absolute poverty is defined as individuals living in households whose equivalised income is below 60% of the
(inflation adjusted) median income in 2010/11. This is a measure of whether those in the lowest income households
are seeing their incomes rise in real terms. 5 The OECD definition of the GINI index states the index measures the extent to which the distribution of income
among individuals or households within an economy deviates from a perfectly equal distribution. A Gini index of
zero represents perfect equality and 100, perfect inequality.

7
THE BUSINESS BASE
In 2013 Scotland was home to approximately 160,000 registered enterprises, i.e. businesses registered for VAT and/or PAYE. There are a further 183,000 unregistered enterprises giving a total of 343,000 enterprises in Scotland.
COMPANIES BY SIZE
Figure 2: Number of ‘enterprises’ Over two thirds of all enterprises6 (over 240,000), are businesses with no employees, whilst a quarter (nearly 95,000) employ between 1 and 49 people (Scottish Government 2013k). Although a small proportion of all enterprises are large employers, (those with 250 or more employees), these enterprises account for nearly half the private sector workforce (Scottish Government 2013k). Scotland is not unusual amongst the regions/countries of the UK in demonstrating a broadly similar spread of companies by size at this level of aggregation (NOMIS 2014).
Figure 3: Change in numbers of enterprises by size-band between 20007 and 2013
Including unregistered enterprises, the total number of enterprises in Scotland has increased since 2000 from 240,000 to 343,000. The largest increase has come in the number of enterprises with zero employees (particularly unregistered enterprises).
(Scottish Government 2013k)
6 Including those that are unregistered
7 The year that this dataset begins

8
COMPANY OWNERSHIP
Some 18.7% of Scottish private sector employment was in enterprises with ultimate ownership in the rest of the UK whilst 16.5% of employment was in enterprises with ultimate ownership outside the UK. The remaining 65% of employment was in Scottish-owned enterprises.
As shown in Figure 4, Scotland’s manufacturing industry has higher levels of overseas ownership than other sectors (with 31% of employment ‘abroad-owned’ as measured, compared 6% for construction employment). Conversely construction has one of the highest rates of Scottish ownership.
Figure 4: Share of employment by ownership, by industry sector, 2013
(Reproduced from Scottish Government 2013k)
As at March 2013, registered private sector enterprises with ultimate ownership outside Scotland (either in the rest of the UK or overseas) accounted for
3.1% of all enterprises,
35.2% of employment and
58.1% of turnover.
TRENDS IN MANUFACTURING
Whilst turnover in the manufacturing sector has risen since 1979, correcting this to constant prices reveals fluctuations around the £40 billion mark, notwithstanding for example the increases experienced by the electronics sector in the 1990s, and subsequent decline.

9
Figure 5: Scottish Manufacturing 1979-2011: Total Turnover (current and constant 2011 prices)
Source: Scottish Government 2013l
LEVEL OF BUSINESS INVESTMENT
Gross capital formation measures the value of acquisitions of new or existing assets. It is the standard definition in the national accounts to measure the value added that is invested rather than consumed. ‘SNAP’ data from the Scottish Government provides estimates of gross capital formation for the whole Scottish economy (including public sector investment). Whilst there has been an increase from £13.9 billion in 1999 to £22.4 billion in 2012, GDP has also risen over this period.
As is indicated below investment as a proportion of GDP rose slightly until 2007 before declining during the recession. The latest Scottish figure of 17.6% is above the 2012 figure for the UK (of 14.8%), but below the figure for the EU (28) of 18.1%, the USA (19.0%), Japan (20.6%) and Canada (24.7%) (Eurostat 2014 and Scottish Government 2013m).
Figure 6: Gross capital formation as proportion of GDP
Source: Scottish Government 2013b and Eurostat 2014

10
GROWTH SECTORS
The Scottish Government has identified six growth sectors; food and drink, financial and business services, life sciences, energy (including renewables), sustainable tourism and creative industries (including digital). The Scottish Government (2012) sets out the rationale for identifying growth sectors as follows:
“The Government Economic Strategy sets out a framework which establishes an economic environment that provides an opportunity for all companies - large or small, Scottish or international, new or old, or social enterprises - to be successful.
However, certain sectors offer particular opportunities for growth - in all or part of that sector - due to existing comparative advantages or through the potential to capitalise on Scotland's unique natural assets. These are sectors where Scotland typically has distinctive capabilities and businesses with the potential to be internationally successful.”
The government collates data on these growth sectors from 2008 to 2013 – key highlights are set out in Table 2 below.
Table 2: An overview of Scottish growth sectors
Source: Scottish Government 2014
The growth sectors cover nearly 70,000 enterprises, and employment of 659,000. The growth sectors vary in size with financial and business services the largest and life sciences the smallest.
As shown in Figure 7, the growth sectors have experienced different rates of growth over the period since 2008, with creative industries experiencing the greatest growth in numbers of enterprises, whilst food and drink actually saw a slight decline.
Enterprises Turnover (£m) Employment
Change in
number of
enterprises
% change in
number of
enterprises
2013 2011 2012 2008 to 2013 2008 to 2013
Scottish Economy Total 160,050 2,425,900 5,415 4%
-
Food and Drink 17,370 13,136 117,900 315- -2%
Financial and Business Services 22,680 215,600 2,445 12%
Life Sciences 480 1,950 16,000 40 9%
Energy (including Renewables) 3,085 66,208 63,400 1,925 166%
Sustainable Tourism (Tourism related
Industries) 13,480 6,221 181,500 185 1%
Creative Industries (including Digital) 12,890 4,999 65,200 2,615 25%
All growth sectors 69,985 659,600 6,900 11%

11
Figure 7: Change in numbers of enterprises in growth sectors 2008-2013
KEY CHALLENGES FOR BUSINESS
Views of Scottish businesses on the key challenges they face are assessed through a variety of means. For example, the KPMG business instinct survey 2013 was based on responses from 90 Scottish companies during May 2013. Some of the findings included that:
There is cautious optimism in relation to prospects for increased turnover, profitability and to a lesser extent workforce levels
Business faces some challenges under the headings of achieving sustainable growth in the business and a lack of economic growth generally. Businesses were also concerned about margin erosion and cost control/reduction. To a lesser extent business identified the challenges of “talent management” (recruiting and retaining the right people) and access to/raising finance (where businesses felt they were being made to “work harder” with the “risk averse” banks)
“Government led initiatives to stimulate growth” and improvements in “hard infrastructure” were identified as key factors affecting the Scottish business environment.
Finally the sectors of the future (likely to have the most positive impact on Scotland over the next 10 years) included: Energy and utilities; Leisure and tourism; Food and drink; Financial services; Pharmaceuticals and life sciences and Communications, media and technology. Only 14% of businesses identified manufacturing as a sector of the future.
More recently the Scottish Chambers of Commerce released their business results survey for the fourth quarter of 2013 (published January 2014). The survey reported “the most positive signs of growth and business activity that we have seen for many years”. This included:
Manufacturing optimism at its highest level since 2006 and construction orders rising at their fastest rate for seven years (driven by the private/commercial sector rather than the public sector)
Retailers reporting the highest rise in sales since 2006, and confidence amongst hotels at its highest point in a decade.
However cash flow remains weak, and employment trends are mixed across different sectors.

12
SCOTLAND AS A TRADING NATION
The importance of trade to the Scottish Government is highlighted in its 2011 Economic Strategy: ‘Greater exposure to international trade promotes productivity and competition within Scottish markets….businesses learn new ideas, adopt new technologies and seek out new opportunities and in doing so, build their confidence, ambition and leadership aspirations.’ (Scottish Government, 2011). In the same document, the Government repeated its ambition to increase the value of Scottish exports by 50% by 2017, with international export performance appearing as one of the Scotland Performs national indicators. From its early medieval trading links with Ireland, Scandinavia and the Baltic countries, through to its central role in the British Empire’s various transatlantic trades, Scotland has enjoyed a rich and varied trading history which continues to this day. This section looks at Scotland’s export and import performance in recent years, summarising Global Connections Survey export data and finishing with a look at North Sea oil and gas exports. Scottish import data is not as extensively compiled as export figures; however it is possible to estimate a hypothetical Scottish balance of trade based on analysis carried out by the Scottish Government over recent months.
EXPORTS
The Scottish Government produces two surveys used to measure Scotland’s export performance - the Global Connections Survey (GCS) and the Index of Manufactured Exports (IME). These allow Scottish policymakers access to relatively comprehensive sources of regional export data compared to other parts of the UK.
Global Connections Survey (GCS)
The GCS covers all sectors of the economy, the exception being North Sea oil and gas activity, and has been published each year since 2004 (data for 2002 is the earliest available). In 2011 total exports from Scotland, including both international and those to the rest of the UK (RUK), amounted to £69.4bn. The vast majority - worth £45.5bn, or 66% of total exports - were goods and services exported to other parts of the UK. Of the remaining £23.9bn – Scotland’s ‘international’ exports – the USA was Scotland’s top export destination, followed by the Netherlands, France and Germany. The EU taken as a whole accounted for approximately £11bn of Scotland’s exports in 2011 (46% of total ‘international’ trade or 16% of all exports).
Figure 8: Value of goods and services sold outside Scotland (not inflation adjusted)
Source: Scottish Government (2013a), Global Connections Survey 2011
0
40
80
'02 '03 '04 '05 '06 '07 '08 '09 '10 '11
£(b
n)
RoW
EU
UK
13
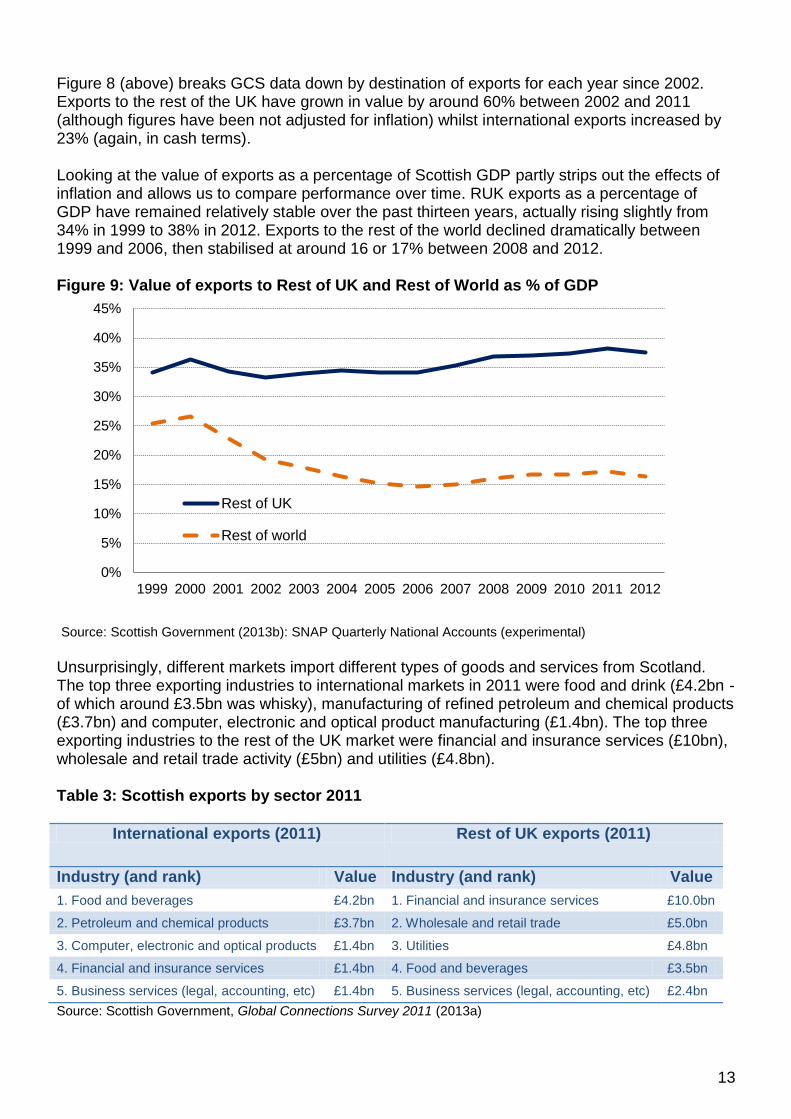
Figure 8 (above) breaks GCS data down by destination of exports for each year since 2002. Exports to the rest of the UK have grown in value by around 60% between 2002 and 2011 (although figures have been not adjusted for inflation) whilst international exports increased by 23% (again, in cash terms). Looking at the value of exports as a percentage of Scottish GDP partly strips out the effects of inflation and allows us to compare performance over time. RUK exports as a percentage of GDP have remained relatively stable over the past thirteen years, actually rising slightly from 34% in 1999 to 38% in 2012. Exports to the rest of the world declined dramatically between 1999 and 2006, then stabilised at around 16 or 17% between 2008 and 2012. Figure 9: Value of exports to Rest of UK and Rest of World as % of GDP
Source: Scottish Government (2013b): SNAP Quarterly National Accounts (experimental)
Unsurprisingly, different markets import different types of goods and services from Scotland. The top three exporting industries to international markets in 2011 were food and drink (£4.2bn - of which around £3.5bn was whisky), manufacturing of refined petroleum and chemical products (£3.7bn) and computer, electronic and optical product manufacturing (£1.4bn). The top three exporting industries to the rest of the UK market were financial and insurance services (£10bn), wholesale and retail trade activity (£5bn) and utilities (£4.8bn). Table 3: Scottish exports by sector 2011
International exports (2011) Rest of UK exports (2011)
Industry (and rank) Value Industry (and rank) Value
1. Food and beverages £4.2bn 1. Financial and insurance services £10.0bn
2. Petroleum and chemical products £3.7bn 2. Wholesale and retail trade £5.0bn
3. Computer, electronic and optical products £1.4bn 3. Utilities £4.8bn
4. Financial and insurance services £1.4bn 4. Food and beverages £3.5bn
5. Business services (legal, accounting, etc) £1.4bn 5. Business services (legal, accounting, etc) £2.4bn
Source: Scottish Government, Global Connections Survey 2011 (2013a)
0%
5%
10%
15%
20%
25%
30%
35%
40%
45%
1999 2000 2001 2002 2003 2004 2005 2006 2007 2008 2009 2010 2011 2012
Rest of UK
Rest of world
14
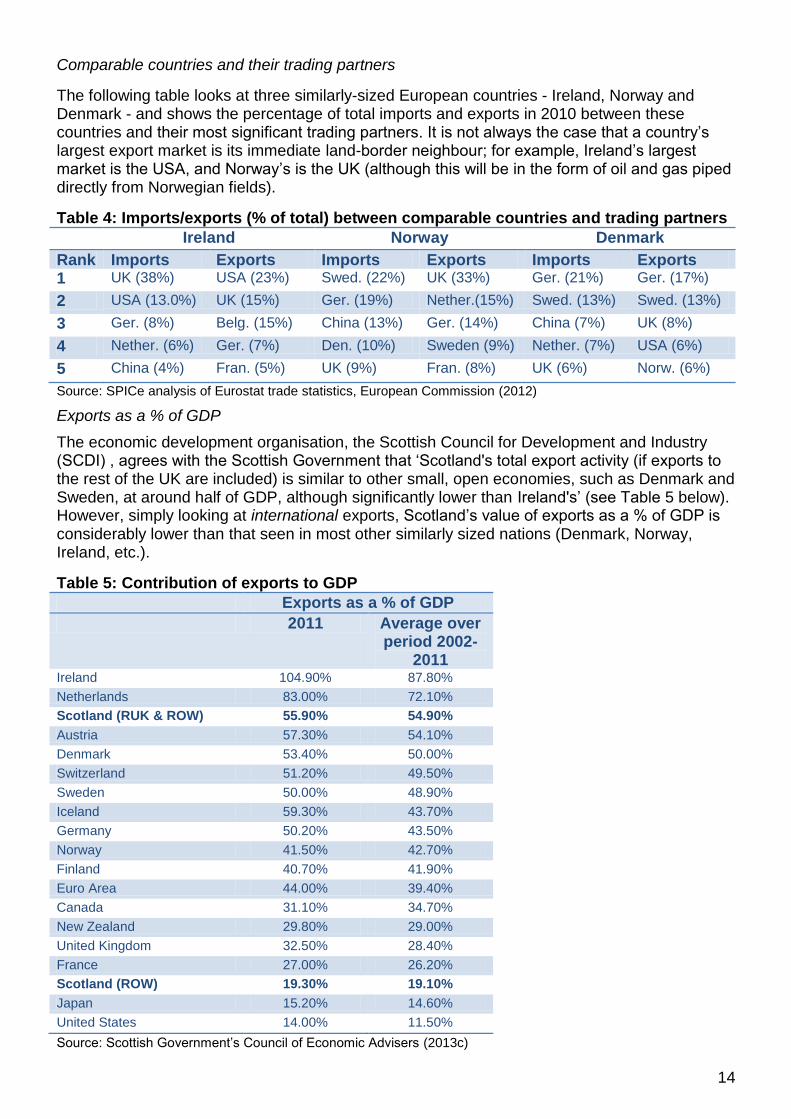
Comparable countries and their trading partners
The following table looks at three similarly-sized European countries - Ireland, Norway and Denmark - and shows the percentage of total imports and exports in 2010 between these countries and their most significant trading partners. It is not always the case that a country’s largest export market is its immediate land-border neighbour; for example, Ireland’s largest market is the USA, and Norway’s is the UK (although this will be in the form of oil and gas piped directly from Norwegian fields).
Table 4: Imports/exports (% of total) between comparable countries and trading partners
Ireland Norway Denmark
Rank Imports Exports Imports Exports Imports Exports 1 UK (38%) USA (23%) Swed. (22%) UK (33%) Ger. (21%) Ger. (17%)
2 USA (13.0%) UK (15%) Ger. (19%) Nether.(15%) Swed. (13%) Swed. (13%)
3 Ger. (8%) Belg. (15%) China (13%) Ger. (14%) China (7%) UK (8%)
4 Nether. (6%) Ger. (7%) Den. (10%) Sweden (9%) Nether. (7%) USA (6%)
5 China (4%) Fran. (5%) UK (9%) Fran. (8%) UK (6%) Norw. (6%)
Source: SPICe analysis of Eurostat trade statistics, European Commission (2012)
Exports as a % of GDP
The economic development organisation, the Scottish Council for Development and Industry (SCDI) , agrees with the Scottish Government that ‘Scotland's total export activity (if exports to the rest of the UK are included) is similar to other small, open economies, such as Denmark and Sweden, at around half of GDP, although significantly lower than Ireland's’ (see Table 5 below). However, simply looking at international exports, Scotland’s value of exports as a % of GDP is considerably lower than that seen in most other similarly sized nations (Denmark, Norway, Ireland, etc.).
Table 5: Contribution of exports to GDP
Exports as a % of GDP
2011 Average over period 2002-
2011 Ireland 104.90% 87.80%
Netherlands 83.00% 72.10%
Scotland (RUK & ROW) 55.90% 54.90%
Austria 57.30% 54.10%
Denmark 53.40% 50.00%
Switzerland 51.20% 49.50%
Sweden 50.00% 48.90%
Iceland 59.30% 43.70%
Germany 50.20% 43.50%
Norway 41.50% 42.70%
Finland 40.70% 41.90%
Euro Area 44.00% 39.40%
Canada 31.10% 34.70%
New Zealand 29.80% 29.00%
United Kingdom 32.50% 28.40%
France 27.00% 26.20%
Scotland (ROW) 19.30% 19.10%
Japan 15.20% 14.60%
United States 14.00% 11.50%
Source: Scottish Government’s Council of Economic Advisers (2013c)

15
Manufactured goods exports
Index of Manufactured Exports (IME)
Figure 10 (below) shows that the total value of Scottish manufactured exports declined by 30% between 1999 and 2012 in real terms. Writing in 2011 about IME trends over the previous decade, Professor David Bell concluded that the performance of Scottish manufactured exports has been ‘particularly troubling’ (Reform Scotland, 2011). Looking behind the headline trend data the largest reductions have been in the ‘textiles and clothing’ and ‘engineering and allied’ sectors, where exports have more than halved in value since 2000. Some sectors have managed to defy the general trend with the ‘food and drink’, ‘metals and metal products’ and ‘refined petroleum and chemicals’ sectors all growing significantly over the decade (by 51%, 23% and 117% respectively). Figure 10: Chained Volume Index of Scottish Manufactured Exports (inflation-adjusted)
Source: Scottish Government (2013d)
TRADE BALANCE – SURPLUS OR DEFICIT?
Imports into Scotland are difficult to estimate, due to a lack of Scottish data, although for some areas, such as tourism, spend data is available. Import estimates for 2010 to 2012 in Table 6 are based on previous years’ data, with final estimates derived as part of the process to balance supply and demand in the economy (ie. what is left in the national accounts after other areas of expenditure and demand are accounted for). The following table, published in November 2013, illustrates that exports from Scotland to the RUK were £47.7bn, equal to 38% of Scottish onshore GDP in 2011. In the same year it is estimated that Scotland received imports from the rest of the UK amounting to £59.3 bn, equal to 47% of Scottish onshore GDP. The 2009 Scottish Government Input-output tables show the largest imports into Scotland (by value) were in the ‘financial services’ sector (7.2% of total imports, almost all from rest of UK), followed by ‘oil and gas extraction’ (partly explained in the following section), ‘computers, electronics and opticals’ (5.2%), ‘motor vehicles’ (4.2%) and computer services (3.8%) (Scottish Government, 2013e). The following table demonstrates that the total value of imports has been considerably higher than the value of exports every year since 1998. There was, for example, a net trade deficit of £11.4 bn in 2012 (excluding North Sea oil and gas exports).
0
20
40
60
80
100
120
140
160
1999 2000 2001 2002 2003 2004 2005 2006 2007 2008 2009 2010 2011 2012
(2011=100)

16
Table 6: Scotland’s net trade balance (excluding North Sea oil and Gas exports) £ million
Exports Imports Exports to the Rest of the UK
Exports to the Rest of the World
Imports from the Rest of the UK
Imports from the Rest of the World
Net Trade (including account balancing adjustments)
1998 25,145 18,263 -35,143 -14,594 -6,329
1999 25,570 19,020 -36,627 -15,370 -7,407
2000 28,221 20,583 -39,891 -17,787 -8,874
2001 28,005 18,647 -40,046 -16,283 -9,677
2002 28,357 16,475 -41,223 -14,108 -10,499
2003 30,514 16,033 -43,541 -14,313 -11,307
2004 32,815 15,661 -44,953 -15,464 -11,941
2005 34,476 15,271 -47,483 -16,553 -14,289
2006 36,559 15,731 -48,897 -17,510 -14,117
2007 40,257 17,160 -54,898 -17,851 -15,332
2008 44,031 19,077 -55,707 -20,172 -12,771
2009 42,739 19,178 -54,765 -18,991 -11,839
2010 45,384 20,258 -57,799 -19,805 -11,962
2011 47,773 21,542 -59,268 -20,625 -10,578
2012 47,733 20,935 -59,413 -20,667 -11,412
Source: Scottish Government (2013b) North Sea oil and Scotland’s trade balance Total sales from Scotland’s geographic share of the UK Continental Shelf (UKCS) were estimated to be worth £26.8bn in 2012 (Scottish Government, 2013b). Scottish Government statisticians and economists recently attempted to illustrate ‘the flows of crude oil, natural gas liquids (NGLs), natural gas, and refined petroleum products through the Scottish economy, including their import and export’ (Scottish Government, 2013f)). Referring to this work in his most recent ‘State of the Economy’ update, the Scottish Government’s Chief Economic Adviser provided an estimate of Scotland’s total exports in 2012 including a contribution from the North Sea sector. The following table adds North Sea exports to Scottish onshore exports, increasing the total value of exports by almost £19bn to a total of £87.4bn. Table 7: Scotland’s exports including the North Sea (2012, £ million)
Scotland’s exports Rest of UK exports
International exports
Total exports
Onshore Scotland 47,700 20,900 68,700 Less Exports of mining support to North Sea (already as an export from onshore)
5,700
Plus Exports of oil and gas 10,700 13,800 24,400 Scotland including the North Sea 52,700 34,700 87,400 Source: Scottish Government, State of the Economy (2013g)
Directly contrasting this estimate with the import figures in Table 6 in order to calculate a hypothetical net trade balance, is not recommended. Such an exercise could involve a degree of double-counting as UK regional accounts currently classify the UKCS as an extra-regio territory. Therefore crude flowing to Grangemouth from the North Sea is already included in Table 6 within the imports column. Furthermore, imports into the UKCS (for example oil platforms, pipes, etc) from the rest of the UK or rest of the world, would in the case of independence, be seen as imports into Scotland. Despite these caveats it is clear that the

17
inclusion of North Sea exports would have a positive impact on Scottish balance of trade figures, swinging the balance more towards a trade surplus.
THE SCOTTISH LABOUR MARKET
The following section summarises the data available on labour market participation as well as providing a profile of the Scottish workforce. Scotland’s productivity performance is also explained in relation to other parts of the UK and OECD countries.
PARTICIPATION
Employment
Scotland currently has the highest employment rate of the four countries in the UK: a rate of 72.7%, one of Scotland’s highest since 2008. Much of the recent increase has been driven by improvements in female employment which has risen by twenty-seven thousand, or 2%, since September-November 2008. The number of men in employment has reduced by over twenty thousand (-2.0%) over the same period. Part-time employment in Scotland now accounts for 27% of all employment, the vast majority of which is carried out by women. Table 8: headline employment and unemployment rates (Sep-Nov 2013)
Employment (% of 16-64 population)
Unemployment (% of economically active)
All Men Women All Men Women
Scotland 72.7 76.0 69.5 6.4 6.4 6.5
England 72.3 77.6 67.0 7.2 7.6 6.8
Wales 71.1 74.8 67.4 7.2 7.8 6.5
NI 67.4 71.6 62.3 7.3 9.1 5.3
UK average 72.1 77.2 67.1 7.1 7.5 6.7
Source: ONS (2014a), Labour Force Survey: regional figures
According to the Scottish Government, Scotland’s employment rate in 2012, using the European Union age definition (15-64), was 69.4% (Scottish Government, 2013h). This compared with an average EU employment rate of 68.4%.
Unemployment
Table 8 (above) shows that unemployment in Scotland is currently lower than in any other country of the UK. At 6.4%, the overall unemployment rate is down considerably from its peak in 2010/11. The following table shows that there are wide disparities in unemployment rates between different age groups in Scotland. It is clear that the number and rate of unemployment amongst young people (aged 16-24) is far higher than in any other age group. This trend is broadly consistent with the UK’s generally, and much less dramatic than those seen in some European countries such as Spain and Greece, where youth unemployment rates are above 50% of the economically active population within those age groups. Scotland’s youth unemployment rate is currently lower than the EU average of 23%.

18
Table 9: Unemployment in Scotland by age group – July 2012 to June 2013
Age group Level Rate (%)
16-24 81,900 20.5 25-34 42,300 7.2 35-49 49,400 5.4 50+ 35,400 4.6 Source: Annual Population Survey (ONS 2013b)
LABOUR FORCE PROFILE
Employment by sector The largest industrial sector of employment in Scotland is ‘public admin, education and health’, providing 30% of all employment in 2012/13. Not all these people were employed in the public sector. Other ONS/Scottish Government statistics show approximately 550,000 public sector employees in Q3 2013, just under 23% of all employment in Scotland. The services sector taken as a whole provides roughly three quarters of all employment in Scotland whereas the number of people employed in manufacturing currently stands at 8.3% of total employment. This is a dramatic reduction from thirty years ago when manufacturing accounted for 24% of Scotland’s workforce (469,000 people in Q3 1982) (Scottish Office, 1994). The percentage of Scotland’s workforce engaged in manufacturing is now below the UK average (9.7% of all employment).
Table 10: Employment in Scotland by broad industrial Jul 2012 to Jun 2013
Industry Jul 2012-Jun 2013
Number employed
% of total employment
Agriculture and fishing 44,000 1.8 Energy and water 88,000 3.6 Manufacturing 203,700 8.3 Construction 168,700 6.8 Distribution, hotels and restaurants 475,600 19.3 Transport and communications 191,400 7.8 Banking, finance and insurance 379,600 15.4 Public admin. education and health 757,200 30.7 Other services 138,000 5.6 Total employment 2,446,200 100 Source: Annual Population Survey (ONS 2014b)
Earnings The median gross annual salary in Scotland was £ 21,586 in 2013, and £ 21,905 for the UK as a whole. There are considerable disparities in pay across gender, sector and region in Scotland. For example, median gross annual pay for women was £17,258 in 2013, compared to £26,427 for men. Some of this difference can be explained by the fact that women are more likely to work part-time than men; however looking at median full-time hourly earnings minus overtime, there are still clear differences: £13.27 per hour for men and £12.26 for women. There are also wide differences in pay by local authority: median gross annual pay in Edinburgh and Aberdeen was around £8,000 higher than that in Eileen Siar and Dumfries and Galloway in 2013 (ONS, 2014c). The top earning industry (by broad sector) is in ‘mining and quarrying’ (which includes Oil and Gas), while the lowest earning industry is ‘accommodation and food services’ activity. Again high levels of part-time employment helps explain some of the low pay levels in this sector (roughly half of employees work part-time).

19
Qualifications There is a higher proportion of Scotland’s 16-64 population with degrees and HNC/HND level qualifications than any other UK country. The Scottish workforce includes more than 800,000 university graduates (24% of all employees) an increase of 55% since 2004. Professors Peter McGregor and Kim Swales of Strathclyde University in ‘Scotland’s Future: the economics of constitutional change’ quoted recent research suggesting that ‘maintaining the high levels of university enrolment in Scotland will increase the annual GDP by 6% in the long-run’ (from a base year of 2006)8(McGregor and Swales, 2013).
Table 11: Percentage of 16-64 population with following qualifications (2012)
Scotland England Northern Ireland
Wales UK average
Degree or equivalent or above 24.4 26.1 19.8 21.5 25.6
HE below degree level 14.4 8.4 8.0 9.3 8.9
With trade apprenticeships 5.3 3.4 5.6 3.8 3.7
No qualifications 10.8 9.6 18.6 11.6 10.0
Source: ONS (2014b) Annual Population Survey
At the other end of the qualifications spectrum, Scotland has a slightly higher than (UK) average proportion of 16-64 population without any qualifications, 10.8% compared to a UK average of 10.0%. Since 2004 the number of working age people with no qualifications has decreased, from 490,000 to 360,000 – a reduction of 27%.
PRODUCTIVITY
Productivity can be measured by dividing annual GDP by the total number of hours worked over a year. ‘GDP per hour worked’ in Scotland, as presented by the Office for National Statistics, was 97.4% of the UK average in 2012, significantly higher than the rate in either Wales (85.2%) or Northern Ireland (82.8%). England’s GDP per hour worked was 101.5% of the UK average. Of the nine regions in England, only London (131.2% of the UK average) and the South East (107.7%) had higher productivity rates than Scotland. It is also worth bearing in mind that the Scottish figure does not include North Sea oil and gas activities within its GDP calculation (ONS 2013). According to the Scottish Government, ‘over the long-term, improvements in productivity performance will increase the competitiveness of an economy and make the largest contribution to increases in overall economic growth rates’. One of the Scottish Government’s ‘Scotland Performs’ targets is ‘to rank in the top quartile for productivity against our key trading partners in the OECD by 2017’. At the moment, Scotland is still in the third quartile - 17th out of 32 countries - indeed Scotland’s relative position has remained broadly unchanged since 2008 (with the exception of 2010):
8 Original paper: http://strathprints.strath.ac.uk/45885/

20
Figure 11: Productivity comparison between Scotland and OECD countries
Source: Scotland Performs (Scottish Government, 2013i) Some key drivers of productivity have been highlighted by Professors Peter McGregor and Kim Swales of Strathclyde University:
Technical change: mainly through corporate investment in new technologies and adoption of new processes;
Investment in human capital: for example formal educational qualifications as well as effective on-the-job training;
Public investment in ‘appropriate infrastructure’: transport, communications and energy transmission and distribution networks. (McGregor and Swales, 2013)
During a recent presentation at the David Hume Institute in Edinburgh, Professor Nick Crafts of Warwick University emphasised the importance of the first of these drivers, believing that the uptake of new technologies (‘diffusion’) ‘matters more for productivity performance than original invention and deserves more attention from policymakers’. He cited the example of the wholesale and retail sector which does little in the way of original research and development but is a top user and adopter of new technologies and supply chain processes. Professor Crafts demonstrated that this sector (often overlooked by policymakers) contributed more than any other sector to productivity growth in the UK over the past decade (Crafts, 2013)
020406080
100120140160
No
rway
Luxe
mb
ou
rg
Ire
land
Un
ite
d S
tate
s
Ne
the
rla
nd
s
Be
lgiu
m
Fra
nce
Ge
rma
ny
Sw
itze
rlan
d
De
nm
ark
Sw
eden
Au
str
ia
Au
str
alia
Fin
land
Sp
ain
Un
ite
d K
ingd
om
Sco
tla
nd
Ca
na
da
Ita
ly
Ja
pa
n
Ice
land
Slo
ve
nia
New
Zeala
nd
Slo
va
k R
ep
ub
lic
Gre
ece
Po
rtu
ga
l
Cze
ch R
epu
blic
Ko
rea
Turk
ey
Hu
ng
ary
Po
land
Me
xic
o
Top Quartile Second Quartile Third Quartile Bottom Quartile
2011 GDP per hour worked (USA=100)

21
PUBLIC FINANCES
PUBLIC SECTOR EXPENDITURE
Public sector expenditure in Scotland was approximately £12,150 per person, compared to around £10,950 across the whole of the UK in 2011-12.
Around 60% of public sector expenditure in Scotland is devolved spending. The areas of health and education account for the majority of devolved spending, while the majority of reserved spending goes towards social protection (welfare payments and unemployment benefits), as illustrated in Figure 12 below.
Figure 12 – Devolved and reserved public expenditure in Scotland, 2011-12
Source: Scottish Government 2013r
The scale of devolved public sector expenditure in Scotland is determined by the level of the block grant provided annually by the UK Government, any Barnett consequentials received over the course of the year and revenues raised through devolved taxation.
PUBLIC SECTOR REVENUES
The average revenue raised per person, assuming a geographic share of North Sea revenues, was approximately £10,750 compared to around £9,050 across the UK as a whole in 2011-12.
Almost 70% of revenue, assuming a geographic share of North Sea revenues, comes from four taxes in Scotland; income tax, VAT, national insurance contributions and North Sea revenue, as shown in Figure 13 below:

22
Figure 13 – Scottish public sector revenues by source of taxation in 2011-12
Source: Scottish Government 2013q
At present the only devolved taxes are council tax and non-domestic rates, accounting for 6.9% of revenues, assuming a geographic share of North Sea revenues.
NET FISCAL BALANCE
A country’s net fiscal balance is the difference between total public sector expenditure and revenues in that country. A negative fiscal balance may be planned (e.g., to stimulate the economy) or unplanned (e.g., as a result of revenues being lower than expected). Under the current constitutional settlement, a negative fiscal balance for the UK as a whole is funded by the UK Government through borrowing.
Estimates of Scotland’s net fiscal balance as a percentage of GDP since devolution are shown in Figure 14 below, with comparator information for the UK provided. This information is also presented in Table A.1 in the Annex. Since devolution, Scotland has had a net fiscal deficit every year except in 2000-2001. The net fiscal position deteriorated after the financial crisis, with both Scotland and the UK showing a fiscal deficit greater that 10% of GDP in 2009-10.
£0 £2 £4 £6 £8 £10 £12
Income taxNorth sea revenue - geographical share
VATNational insurance contributionsCorporation tax (excl North Sea)
Gross operating surplusFuel duties
Council taxNon-domestic rates
Tobacco dutiesOther taxes, royalties and adjustments
Alcohol dutiesStamp duties
Vehicle excise dutyOther taxes on income and wealth
Insurance premium taxCapital gains tax
Interest and dividendsAir passenger duty
Inheritance taxBetting and gaming and duties
Landfill taxClimate change levy
Aggregates levyRent and other current transfers
£ Billions

23
Figure 14 - Estimated net fiscal balance as a % of GDP, Scotland and the UK
Source: Scottish Government 2013r
Note that the most recent figures are for 2011-12, but figures for 2012-13 are due to be published in March 2014.
The figure above illustrates the extent to which North Sea revenues have contributed towards Scotland’s net fiscal balance over the period since devolution. When North Sea revenues are excluded, or a population share in included, Scotland’s net fiscal balance is consistently below the UK’s. Including a geographic share of North Sea revenues, Scotland’s net fiscal deficit tended to be slightly higher than the UK in the earlier years of devolution. In more recent years Scotland’s net fiscal deficit has been slightly lower than the UK.
FUTURE PUBLIC FINANCE ISSUES
Scottish public finances will be significantly affected by a number of key issues including the future value of North Sea revenues and demographic change.
North Sea revenues
The volatility and finite nature of oil and gas production raises public finance challenges. UK tax receipts from oil and gas activities on the UKCS peaked in 1984-85 at £27.9bn (in today’s money) and fell dramatically during the late 1980s, remaining relatively low throughout the 1990s. Since 2000-01 revenues have generally remained well above the £5bn mark, rising to over £10bn during four of the last ten years. In total, over the past four decades, revenue from the UK Continental Shelf (UKCS) has contributed over £300bn to the UK Treasury (in today’s money). This includes Petroleum Revenue Tax (PRT), Ring Fenced Corporation Tax (RFCT) and the Supplementary Charge (SC) revenue, as well as the Gas Levy (abolished in 1996) and Royalties (abolished 2001).
24
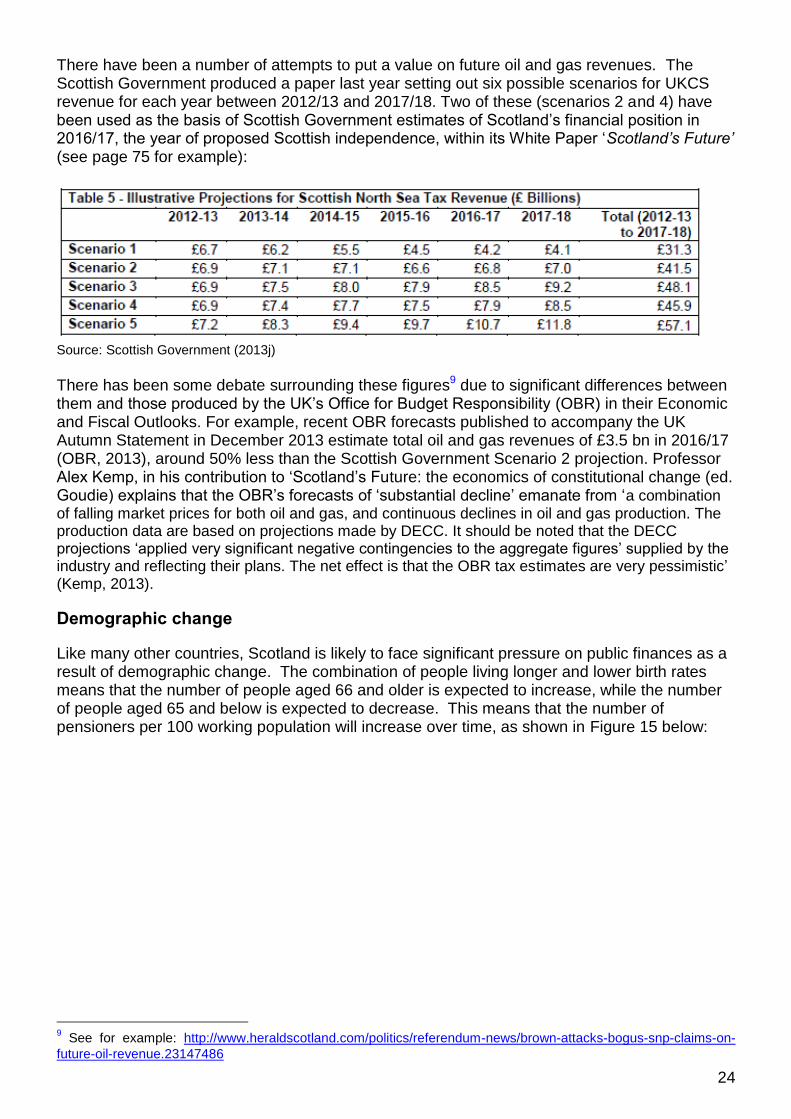
There have been a number of attempts to put a value on future oil and gas revenues. The Scottish Government produced a paper last year setting out six possible scenarios for UKCS revenue for each year between 2012/13 and 2017/18. Two of these (scenarios 2 and 4) have been used as the basis of Scottish Government estimates of Scotland’s financial position in 2016/17, the year of proposed Scottish independence, within its White Paper ‘Scotland’s Future’ (see page 75 for example):
Source: Scottish Government (2013j)
There has been some debate surrounding these figures9 due to significant differences between them and those produced by the UK’s Office for Budget Responsibility (OBR) in their Economic and Fiscal Outlooks. For example, recent OBR forecasts published to accompany the UK Autumn Statement in December 2013 estimate total oil and gas revenues of £3.5 bn in 2016/17 (OBR, 2013), around 50% less than the Scottish Government Scenario 2 projection. Professor Alex Kemp, in his contribution to ‘Scotland’s Future: the economics of constitutional change (ed. Goudie) explains that the OBR’s forecasts of ‘substantial decline’ emanate from ‘a combination of falling market prices for both oil and gas, and continuous declines in oil and gas production. The production data are based on projections made by DECC. It should be noted that the DECC projections ‘applied very significant negative contingencies to the aggregate figures’ supplied by the industry and reflecting their plans. The net effect is that the OBR tax estimates are very pessimistic’ (Kemp, 2013).
Demographic change
Like many other countries, Scotland is likely to face significant pressure on public finances as a result of demographic change. The combination of people living longer and lower birth rates means that the number of people aged 66 and older is expected to increase, while the number of people aged 65 and below is expected to decrease. This means that the number of pensioners per 100 working population will increase over time, as shown in Figure 15 below:
9 See for example: http://www.heraldscotland.com/politics/referendum-news/brown-attacks-bogus-snp-claims-on-
future-oil-revenue.23147486

25
Figure 15 – Projected pensioners per 100 working age population (2012-based principal projection)
Source: General Register Office for Scotland 2013
As highlighted by the Institute for Fiscal Studies (IFS):
“Changing demographics have implications for how economic output will grow, how tax revenues will evolve in future, and how demand for public spending will change… As a result, demographic changes are a key driver of the future path of public revenues and spending, and thus borrowing and debt. “(IFS 2013)
However, another factor to take into account in this area is the lower life expectancy at birth in Scotland, relative to some other developed countries. Table 12 shows the life expectancy at birth in Scotland and the UK for someone born in 2012. Table 12 – Life expectancy at birth (2012-based)
Male Female
Scotland 76.8 80.8 UK 79.0 82.7 Source: Office for National Statistics (2013)

26
DEVOLVED POWERS
The nature of the devolved settlement means that there are some areas where the Scottish Parliament has powers to make laws (devolved matters) and other areas where powers are reserved to the UK Parliament (reserved matters). The following table outlines some of the key areas relevant to the economy which are devolved and reserved: Table 13: Devolved and reserved matters
Devolved matters Reserved matters
Education and training Economic development Regeneration Aspects of transport Some financial powers
Fiscal, economic and monetary policy Benefits and social security Employment legislation Trade agreements Consumer rights
The table highlights that the Scottish Parliament has some financial powers. These are outlined in more detail below.
DEVOLVED FINANCIAL POWERS
The financial powers that have come into effect since devolution and are due to come into effect as a result of the Scotland Act 2012 are outlined in Table 14.
Table 14 - Timeline of financial powers coming into effect through the Scotland Act 1998 and the Scotland Act 2012
Timeline Change to financial powers
From 1999 The Scottish Variable Rate is introduced. This gives the Scottish Parliament the power to vary the basic rate of income tax by plus or minus three pence in the pound.
Limited borrowing powers of up to £500 million to cover temporary shortfalls of cash or for providing a working balance.
May 2012 The Scottish Parliament has the power to introduce new ‘devolved taxes’ April 2013 New capital borrowing powers for specific projects subject to HM Treasury
consent. April 2015 Scottish Landfill tax and Land and Buildings Transaction Tax will be introduced
in Scotland, replacing the UK taxes of Landfill Tax and Stamp Duty Land Tax. Extended borrowing powers to fund capital expenditure, up to £200 million in any one year with a cumulative limit of £500 million. This is accompanied by the introduction of a cash reserve to help manage deviations between forecast and actual tax receipts. Full capital borrowing powers of up to 10% of the Scottish capital budget each year, subject to a limit of £2.2 billion, come into force.
April 2016 The Scottish rate of income tax will be introduced. This means that the rate of income tax applying in Scotland will be reduced by 10 pence in the pound at all rates, with the new rate to be determined by the Scottish Parliament annually.
Although just 6.9% of Scottish tax revenues came from devolved taxes in 2011-12, the additional financial powers that will be brought about by the Scotland Act 2012 will increase this

27
percentage. When these powers come into effect, it is estimated that 16% of Scottish tax revenues will come from devolved taxation, as shown in Figure 16:
Figure 16 – Percentage of tax revenues that are devolved and reserved
Source: Scottish Government 2013s
Reserved 85%
Currently Devolved
7%
Scotland Act 2012 8%

28
ANNEX 1 – SUPPLEMENTARY TABLES
Table A.1: Estimated net fiscal balance as a % of GDP, Scotland and the UK
Year Scotland UK
Excluding North Sea revenue
Including per capita share of
North Sea revenue
Including geographic share
of North Sea revenue
1999-00 -4.3% -4.0% -1.3% 1.6%
2000-01 -1.8% -1.3% 2.5% 4.1%
2001-02 -6.4% -5.7% -0.8% -0.1%
2002-03 -9.9% -9.2% -3.9% -2.4%
2003-04 -10.4% -9.9% -5.5% -2.9%
2004-05 -10.3% -9.7% -4.8% -3.4%
2005-06 -10.3% -9.3% -1.9% -3.0%
2006-07 -10.1% -9.3% -2.6% -2.4%
2007-08 -9.7% -9.0% -2.9% -2.6%
2008-09 -13.4% -12.1% -2.6% -6.9%
2009-10 -18.1% -17.2% -10.7% -11.2%
2010-11 -16.5% -15.6% -8.1% -9.5%
2011-12 -14.6% -13.5% -5.0% -7.9%
Source: Scottish Government 2013q
Table A.2: Real growth in GDP per capita (1977 to 2007)
Country Growth
Ireland 4.4% Luxembourg 3.5% Finland 2.6% Portugal 2.5% Scotland* 2.5% Iceland 2.4% Austria 2.2% Norway (mainland) 2.1% Sweden 1.9% Denmark 1.9% Average of comparable countries 2.6% Source: Scottish Government
Notes: *Excluding the North Sea

29
SOURCES
Amior, M., Crawford, R. and Tetlow, G. (2013). Institute for Fiscal Studies – Fiscal Sustainability in an Independent Scotland. Available at - http://www.ifs.org.uk/publications/6952
Centre for Public Policy for Regions (CPPR) (2013) ‘Reflections on a post-independence fiscal landscape’. Available at: http://policyscotland.gla.ac.uk/wp-content/uploads/2013/10/CPPR-NSO-Briefing-Final-I.pdf
Crafts, N. ‘What kind of supply-side policy for the UK? What implications for Scotland?’. Presentation at the David Hume Institute, November 2013. Slides and notes available: Professor Nick Crafts slides: http://www.davidhumeinstitute.com/images/stories/Seminars/Autumn2013/Crafts_presentation.pdf and http://www.davidhumeinstitute.com/images/stories/Seminars/Autumn2013/Commentary_14_November_2013.pdf
European Commission (2011) External and intra-EU trade: a statisticial yearbook (Data 1958-2010). Available at: http://epp.eurostat.ec.europa.eu/cache/ITY_OFFPUB/KS-GI-11-001/EN/KS-GI-11-001-EN.PDF (accessed 21st Jan 2014)
Eurostat (2014): National Accounts and GDP. Available at http://epp.eurostat.ec.europa.eu/statistics_explained/index.php/National_accounts_%E2%80%93_GDP
HMRC (2013) PRT and Government revenues from UK oil and gas production. Available at: http://www.hmrc.gov.uk/statistics/prt.htm
General Register Office for Scotland (2013). Projected Population of Scotland (2012-based). Available at - http://www.gro-scotland.gov.uk/statistics/theme/population/projections/scotland/2012-based/list-of-figures.html
Kemp, A. ‘North Sea oil and gas’. In Goudie, A. (ed) Scotland’s Future: the economics of constitutional change. Dundee University Press, 2013.
KPMG (2013): Scotland Business Instinct Survey 2013. Available at http://www.kpmg.com/uk/en/issuesandinsights/articlespublications/pages/business-instinct-survey.aspx
McGregor, P. and Swales, K. ‘The impact of greater autonomy on the growth of the Scottish economy’. In Goudie, A. (ed) Scotland’s Future: the economics of constitutional change. Dundee University Press, 2013.
NOMIS/Office for National Statistics (2014). NOMIS: Official labour market statistics web pages (accessed 21 January 2014). Available at https://www.nomisweb.co.uk/
Office for Budget Responsibility (2013). Economic and Fiscal Outlook December 2013. Available at: http://budgetresponsibility.org.uk/pubs/Economic-and-fiscal-outlook-December-2013.pdf
Office for National Statistics (2013) Labour Productivity, Q4 2012. Available at: http://www.ons.gov.uk/ons/rel/productivity/labour-productivity/q4-2012/stbq412.html
Office for National Statistics (2013). Historic and Projected Data from the Period and Cohort Life Tables, 2012-based. Available at - http://www.ons.gov.uk/ons/publications/re-reference-tables.html?edition=tcm%3A77-325302
Office for National Statistics (2014a) Labour Force Survey: regional labour market statistics. Available at: http://www.ons.gov.uk/ons/rel/subnational-labour/regional-labour-market-statistics/january-2014/stb-regional-labour-market-january-2014.html
http://www.davidhumeinstitute.com/images/stories/Seminars/Autumn2013/Commentary_14_November_2013.pdf
http://www.davidhumeinstitute.com/images/stories/Seminars/Autumn2013/Commentary_14_November_2013.pdf
http://www.kpmg.com/uk/en/issuesandinsights/articlespublications/pages/business-instinct-survey.aspx

30
Office for National Statistics (2014b) Annual Population Survey 2013. Accessed through NOMIS: https://www.nomisweb.co.uk/Default.asp
Office for National Statistics (2014c) Annual Survey of Hours and Earnings, Provisional 201s. Available at: http://www.ons.gov.uk/ons/rel/ashe/annual-survey-of-hours-and-earnings/2013-provisional-results/stb-ashe-statistical-bulletin-2013.html
Oil and Gas UK (2013). ‘2013 Activity Survey’. Available at: http://www.oilandgasuk.co.uk/news/news.cfm/newsid/824
Reform Scotland (2011) Scotland’s Economic Future (ed. Mackay). Edinburgh, 2011. Available:
http://reformscotland.com/index.php/publications/details/1212
Scotland Office (1994). Scottish Economic Bulletin, Number 49, summer 1994. HMSO 1994. Available in SPICe collection.
Scottish Chambers of Commerce (2014): Scottish Chambers Business Survey Q4 2013. Available at http://www.scottishchambers.org.uk/press-policy/press-releases/2014/01/744
Scottish Council for Development and Industry (2013) Future Scotland: Macroeconomic & Fiscal Sustainability. Available at: http://www.scdi.org.uk/pi/2013/SCDIFutureScotlandApr13_Macroeconomic_Fiscal_web.pdf (accessed 21st Jan 2014)
Scottish Government (2011) The Government Economic Strategy 2011. Available at: http://www.scotland.gov.uk/Publications/2011/09/13091128/8 (accessed 21st Jan 2014)
Scottish Government (2012): Growth Sectors web pages. Available at http://www.scotland.gov.uk/Topics/Economy/Key-Sectors
Scottish Government (2013a) Global Connections Survey 2011. Available at: http://www.scotland.gov.uk/Topics/Statistics/Browse/Economy/Exports/GCSIntroduction/GCS2011pdf (accessed 21st Jan 2014)
Scottish Government (2013b) Scottish National Accounts Project: Quarterly National Accounts
Available at: http://www.scotland.gov.uk/Topics/Statistics/Browse/Economy/QNA2013Q2 (accessed 21st Jan 2014)
Scottish Government (2013c) Scottish Government’s Council of Economic Advisers ‘First annual chair’s report’. Available at: http://www.scotland.gov.uk/Resource/0041/00417465.pdf
Scottish Government (2013d) Index of Manufactured Exports Q3 2013. Available at:
http://www.scotland.gov.uk/Topics/Statistics/Browse/Economy/IME2013Q2/IME2013Q2XLS
Scottish Government (2013e) Scottish Government’s Input-Output tables 2009. Available at: http://www.scotland.gov.uk/Topics/Statistics/Browse/Economy/Input-Output/Downloads
Scottish Government (2013f) SNAP: Oil and Gas Flows. Available at: http://www.scotland.gov.uk/Topics/Statistics/Browse/Economy/SNAP/expstats/oilandgas/Oilgasflows (accessed 21st Jan 2014)
Scottish Government (2013g) Scottish Government State of the Economy December 2013. Available at: http://www.scotland.gov.uk/Topics/Economy/state-economy/latestSofE (accessed 21st Jan 2014)
Scottish Government (2013h) High Level Summary of Statistics. Available at: http://www.scotland.gov.uk/Topics/Statistics/Browse/Labour-Market/TrendEconomicActivity
Scottish Government (2013i) Scotland Performs: Productivity. Available at:
http://www.scotland.gov.uk/About/Performance/scotPerforms/purpose/productivity

31
Scottish Government (2013j) Oil and Gas bulletin. Available at: http://www.scotland.gov.uk/Topics/Statistics/Browse/Business/Energy/OilGas
Scottish Government (2013k) Businesses in Scotland: web pages. Available at http://www.scotland.gov.uk/Topics/Statistics/Browse/Business/Corporate
Scottish Government (2013l) Historic Manufacturing Charts. Available at http://www.scotland.gov.uk/Topics/Statistics/Browse/Business/SABS/Graphs/Manu-charts
Scottish Government (2013m): Building Security and Creating Opportunity: Economic Policy choices in an Independent Scotland. Available at http://www.scotland.gov.uk/Publications/2013/11/2439
Scottish Government (2013n): Scottish National Accounts Project (SNAP) Income Account and Gross National Income. Available at http://www.scotland.gov.uk/Topics/Statistics/Browse/Economy/SNAP/expstats/aggregates/GNI
Scottish Government (2013o): Poverty and Income Inequality Scotland: 2011-12. Available at http://www.scotland.gov.uk/Publications/2013/06/2493
Scottish Government (2013p) Scotland's Future. Available at: http://www.scotland.gov.uk/Publications/2013/11/9348
Scottish Government (2013q). Government Expenditure and Revenue Scotland 2011-12. Available at - http://www.scotland.gov.uk/Resource/0041/00415871.pdf
Scottish Government (2013r). Historic Fiscal Balance Calculations. Available at - http://www.scotland.gov.uk/Topics/Statistics/Browse/Economy/GERS/RelatedAreas/LRfiscalbalances2013
Scottish Government (2013s). Scotland’s Economy: the case for independence. Available at - http://www.scotland.gov.uk/Resource/0042/00422987.pdf
Scottish Government (2014): Growth Sectors statistics database. Available at http://www.scotland.gov.uk/Topics/Statistics/Browse/Business/Publications/GrowthSectors/Database
Scottish Parliament (2013). Tax revenue estimates: a comparison of GERS and HMRC. SPICe Briefing: http://www.scottish.parliament.uk/parliamentarybusiness/68543.aspx
Reform Scotland (2011) Scotland’s Economic Future (ed. Mackay). Edinburgh, 2011. Available: http://reformscotland.com/index.php/publications/details/1212
Wood Review (2013) Interim report. Available at http://www.woodreview.co.uk/documents/UKCS_Maximising_Recovery_Review_Interim_Report_11.11.13_LOCKED.PDF

32
RELATED BRIEFINGS
SB 13-48 What is GDP? (27 August 2013)
SB 12-12 The National Performance Framework and Scotland Performs (7 February 2012)
SB 11-67 Corporation Tax (14 September 2011)
SB 11-63 Alternatives to GDP (7 September 2011)
SB 11-37 Borrowing Powers (8 June 2011)
Scottish Parliament Information Centre (SPICe) Briefings are compiled for the benefit of the Members of the Parliament and their personal staff. Authors are available to discuss the contents of these papers with MSPs and their staff who should contact Scherie Nicol on extension 85380 or email [email protected]. Members of the public or external organisations may comment on this briefing by emailing us at [email protected]. However, researchers are unable to enter into personal discussion in relation to SPICe Briefing Papers. If you have any general questions about the work of the Parliament you can email the Parliament’s Public Information Service at [email protected].
Every effort is made to ensure that the information contained in SPICe briefings is correct at the time of publication. Readers should be aware however that briefings are not necessarily updated or otherwise amended to reflect subsequent changes.
www.scottish.parliament.uk