Financial Results - Kubota · 846.0 796.1 +49.9 +6.3 +16.0 +1.9 840.0 ... * In second half of 2016,...
28
Shigeru Kimura Financial Results for the six months ended June 30, 2017 August 9, 2017 Director and Senior Managing Executive Officer, General Manager of Planning & Control Headquarters
-
Upload
phunghuong -
Category
Documents
-
view
218 -
download
2
Transcript of Financial Results - Kubota · 846.0 796.1 +49.9 +6.3 +16.0 +1.9 840.0 ... * In second half of 2016,...

Shigeru Kimura
Financial Results for the six months ended June 30, 2017
August 9, 2017
Director and Senior Managing Executive Officer,
General Manager of Planning & Control Headquarters

(Financial results for the six months ended June 30, 2017) 2
Original forecast
(Feb. 2017)
Amount % Amount % Amount
846.0 796.1 +49.9 +6.3 +16.0 +1.9 840.0
Domestic 280.6 282.2 -1.6 -0.6 +6.6 +2.4 285.0
Overseas 565.4 513.9 +51.4 +10.0 +9.4 +1.7 555.0
11.9% 13.3% 11.7%
100.6 105.6 -5.0 -4.7 +6.6 +7.0 98.0
8.3% 7.8% 8.0%
70.4 62.3 +8.1 +13.0 +5.4 +8.4 67.0
Amount %
2,660.6 2,670.6 -10.0 -0.4
1,233.7 1,198.8 +34.9 +2.9
As of
June 30, 2017
As of
Dec. 31, 2016
Variance from revised
forecast (May 2017)Changes
(Billion yen)Changes
Six months ended
June 30, 2017
Six months ended
June 30, 2016
Total assets
Shareholders'
equity
Revenues
(Billion yen)
Operating
income
Net income
attributable to
Kubota Corp.
Financial Summary

(Financial results for the six months ended June 30, 2017) 3
Amount %
692.4 631.4 +61.1 +9.7
Domestic 147.1 143.4 +3.7 +2.6
Overseas 545.3 488.0 +57.3 +11.7
138.7 149.9 -11.2 -7.5
Domestic 118.8 124.1 -5.3 -4.3
Overseas 19.9 25.7 -5.9 -22.8
14.9 14.9 -0.0 -0.2
Domestic 14.7 14.7 -0.0 -0.0
Overseas 0.2 0.2 -0.0 -11.6
846.0 796.1 +49.9 +6.3
280.6 282.2 -1.6 -0.6
565.4 513.9 +51.4 +10.0
Six months ended
June 30, 2017
Six months ended
June 30, 2016
Total revenues
Domestic revenues
(Billion yen)
Overseas revenues
Farm & Industrial Machinery
(Machinery)
Water & Environment
(Water)
Other
Changes
Revenues by Reporting Segment
For reference: Changes excluding the effects of fluctuation in exchange (-6 billion yen) and an acquisition of Great Plains Manufacturing, Inc.(hereinafter, “GPM”) (+18 billion yen). >Overseas revenues in Machinery increased by 9%. Total overseas revenues increased by 8%.

(Financial results for the six months ended June 30, 2017) 4
Increased sales of agricultural-related products compensated for decreased sales of construction machinery, mainly due to the negative effect of prioritized investment in large-sized machinery.
Machinery: +61.1 billion yen (Domestic: +3.7, Overseas: +57.3)
Water: -11.2 billion yen (Domestic: -5.3, Overseas: -5.9)
■Changes in revenues by product (Billion yen)
+0.2
-0.9 -0.4 -0.7
+5.5
+11.5 +13.4
+3.6+0.2
+28.6
-10.0
+0.0
+10.0
+20.0
+30.0
+40.0
Farmequipment
Const.machinery
Engines E-equippedmachinery
Others
Domestic Overseas
Revenues from pipe-related products decreased due to lower sales of ductile iron pipes and the construction business. Wastewater treatment equipment and plant also decreased. On the other hand, sales of spiral-welded steel pipes (piles) for civil engineering works increased.
Domestic
Overseas
Domestic
Overseas
Total sales of tractors increased mainly due to recovery in Thailand caused by cancelation of the restrictions on water intake. Sales in North America were almost the same level because increased sales of compact tractors covered decreased sales of mid-scale tractors. Total sales of combine harvesters and rice transplanters increased due to expanded sales of rice transplanters in China. Total sales of construction machinery rose in each region such as North America, Europe, and China.
Export sales of ductile iron pipes to the Middle East significantly decreased. Sales of reformer and cracking tubes for petrochemical plants decreased as well.
Revenues by Reporting Segment (Year-on-Year)
・
・ ・ ・

(Financial results for the six months ended June 30, 2017)
2.Material
5
Machinery Water
Amount % Amount % Amount %
Operating income 100.6 11.9 105.6 13.3 -5.0 -4.7
(Billion yen)
Six months ended
June 30, 2017
Six months ended
June 30, 2016Changes
US$ (112→112) Euro (125→122) Other currencies
Factors affecting operating income (YoY change -5.0 billion yen)
-6.0 billion yen -3.0 billion yen -1.0 billion yen
-10.0 billion yen 1.Fluctuation in exchange rates
-1.0 billion yen -1.0 billion yen
-2.0 billion yen
4.Personnel expenses (Excluding GPM)
Cost of good sold SG&A expenses
+1.2 billion yen -1.9 billion yen -0.7 billion yen
3.Sales incentive ratio growth -1.1 billion yen
5.Specific items -0.9 billion yen
7.Other -6.3 billion yen
Change in depreciation method
Amortization of valuation difference between the amount paid and fair market value of net assets of GPM
Operating Income
+0.5 billion yen
-1.4 billion yen
6.Impact of increased sales
U.S. : -5.6 Billion yen China: +4.8 Billion yen etc.
+16.0 billion yen
(Financial results for the six months ended June 30, 2017)
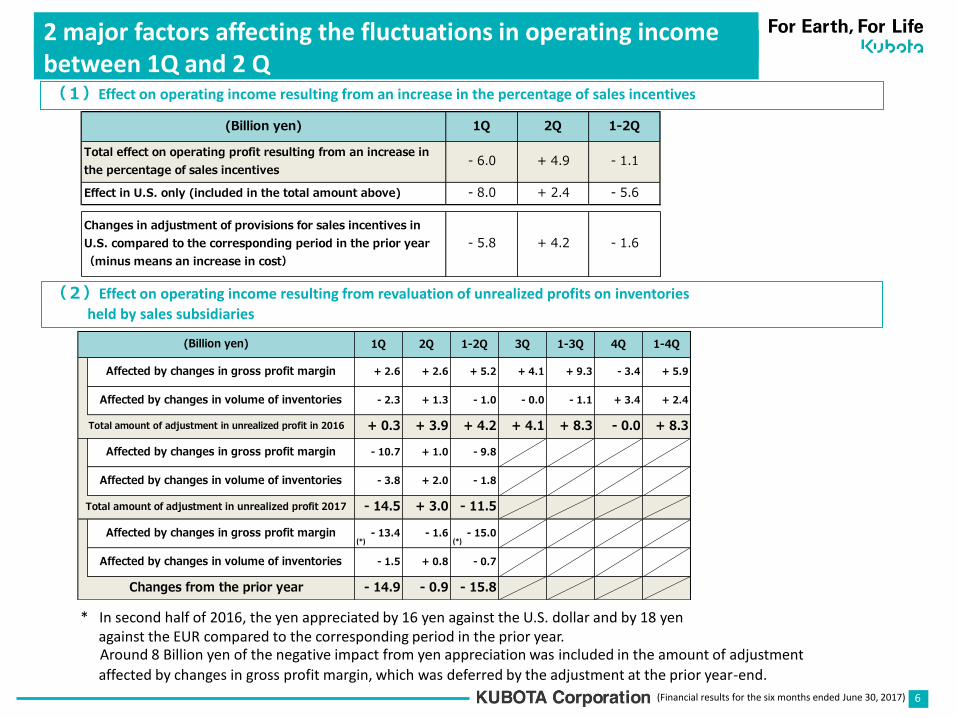
(1)Effect on operating income resulting from an increase in the percentage of sales incentives
6
2 major factors affecting the fluctuations in operating income between 1Q and 2 Q
(Billion yen) 1Q 2Q 1-2Q
Total effect on operating profit resulting from an increase in
the percentage of sales incentives- 6.0 + 4.9 - 1.1
Effect in U.S. only (included in the total amount above) - 8.0 + 2.4 - 5.6
Changes in adjustment of provisions for sales incentives in
U.S. compared to the corresponding period in the prior year
(minus means an increase in cost)
- 5.8 + 4.2 - 1.6
(2)Effect on operating income resulting from revaluation of unrealized profits on inventories
held by sales subsidiaries
* In second half of 2016, the yen appreciated by 16 yen against the U.S. dollar and by 18 yen against the EUR compared to the corresponding period in the prior year. Around 8 Billion yen of the negative impact from yen appreciation was included in the amount of adjustment
affected by changes in gross profit margin, which was deferred by the adjustment at the prior year-end.
1Q 2Q 1-2Q 3Q 1-3Q 4Q 1-4Q
Affected by changes in gross profit margin + 2.6 + 2.6 + 5.2 + 4.1 + 9.3 - 3.4 + 5.9
Affected by changes in volume of inventories - 2.3 + 1.3 - 1.0 - 0.0 - 1.1 + 3.4 + 2.4
+ 0.3 + 3.9 + 4.2 + 4.1 + 8.3 - 0.0 + 8.3
Affected by changes in gross profit margin - 10.7 + 1.0 - 9.8
Affected by changes in volume of inventories - 3.8 + 2.0 - 1.8
- 14.5 + 3.0 - 11.5
Affected by changes in gross profit margin - 13.4 - 1.6 - 15.0
Affected by changes in volume of inventories - 1.5 + 0.8 - 0.7
- 14.9 - 0.9 - 15.8
(Billion yen)
Total amount of adjustment in unrealized profit in 2016
Changes from the prior year
Total amount of adjustment in unrealized profit 2017
(*) (*)

(Financial results for the six months ended June 30, 2017) 7
(% shows OP margin)
Operating
income
Specific
items
Adjusted
operating
income
Operating
income
Specific
items
Adjusted
operating
income
① ② ③=①-② ④ ⑤ ⑥=④-⑤ ①-④ ③-⑥
13.9% 14.1% 16.1% 16.1%
96.6 -0.9 97.5 101.4 - 101.4 -4.9 -4.0 +61.1
11.7% 11.6% 9.1% 9.1%
16.2 0.2 16.1 13.7 - 13.7 +2.6 +2.4 -11.2
10.6% 10.6% 12.5% 12.5%
1.6 - 1.6 1.9 - 1.9 -0.3 -0.3 -0.0
-13.8 -0.2 -13.6 -11.4 - -11.4 -2.4 -2.2
11.9% 12.0% 13.3% 13.3%
100.6 -0.9 101.5 105.6 - 105.6 -5.0 -4.1 +49.9Total
Adjustment
Other
Water
Machinery
Six months ended June 30, 2017
(Billion yen)
Six months ended June 30, 2016
Changes
in
revenues
Changes
(Adjusted)Changes
■Operating income excluding specific items
Operating Income by Reporting Segment

(Financial results for the six months ended June 30, 2017)
Changes
Amount
7.0 -8.5 +15.5
Interests and dividends 3.4 2.9 +0.4
Gain on sales of securities-net 5.4 0.9 +4.5
Foreign exchange gain (loss)-net 3.3 -9.6 +12.9
Other -5.1 -2.8 -2.3
Valuation loss on derivatives -4.9 -2.7 -2.2
Other-net -0.2 -0.0 -0.1
(Billion yen)
Other income (expenses)
Six months ended
June 30, 2017
Six months ended
June 30, 2016
8
(Details)
+10.7
Other Income (Expenses)

(Financial results for the six months ended June 30, 2017) 9
Amount % Amount % Amount %
107.6 12.7 97.1 12.2 +10.5 10.8
33.4 30.7 -2.7
0.8 0.8 +0.1
75.1 8.9 67.1 8.4 +7.9 11.8
4.6 4.8 +0.2
70.4 8.3 62.3 7.8 +8.1 13.0
Interim 15 yen 14 yen +1 yen
Year-end 16 yen -
Total 30 yen -
Dividend per
common share (Undecided)
(Undecided)
Equity in net income
of affiliated companies
Six months ended
June 30, 2017
Six months ended
June 30, 2016
Taxable income *
Income taxes
(Effective tax rate) (31.0%) (31.6%)
Changes
ChangesYear ending
Dec. 31, 2017
Year ended
Dec. 31, 2016
(Billion yen)
Net income attributable to
Kubota Corp.
Less: Net income attributable
to non-controlling interests
Net income
Taxable Income/ Net Income
* Income before income taxes and equity in net income of affiliated companies
We established the program of purchasing own shares not exceeding 10 billion yen (Term of validity: From May 11, 2017 to December 20, 2017).
Payout ratio: 30% as a target Shareholder return ratio: over 30%

(Financial results for the six months ended June 30, 2017) 10
As of
June 30, 2017
As of
Dec. 31, 2016Changes
Changes ex
the effects of
fluctuation in
exchange
Current assets 1,501.0 1,563.1 -62.0Cash and cash equivalents 190.8 169.4 +21.3Trade notes and accounts receivable 597.7 632.8 -35.1 -29.0Short-term finance receivables-net 246.0 244.2 +1.8Inventories 367.4 356.2 +11.2 +13.0Other current assets 99.1 160.5 -61.3
699.6 677.5 +22.1Long-term finance receivables-net 532.7 508.3 +24.4Other 167.0 169.2 -2.2
Property, plant, and equipment 312.2 314.2 -2.1Other assets 147.8 115.8 +32.0
2,660.6 2,670.6 -10.0
778.6 752.5 +26.2 +42.0
<Reference>Foreign exchange rate at balance sheet date (yen)
112 116 -4
128 123 +5Euro
(Billion yen)
Investments and long-term finance receivables
Total assets
Total finance receivables-net
U.S. dollar
Balance Sheets (Assets)

(Financial results for the six months ended June 30, 2017)
As of
June 30, 2017
As of
Dec. 31, 2016Changes
Changes ex
the effects of
fluctuation in
exchange
Current liabilities 812.4 836.6 -24.3
Short-term borrowings 193.2 193.9 -0.7
Trade notes and accounts payable 246.5 255.9 -9.4 Current portion of long-term debt 132.3 145.2 -12.9 Other current liabilities 240.4 241.7 -1.2
Long-term liabilities 538.1 562.0 -23.9
Long-term debt 471.2 478.9 -7.7
Accrued retirement and pension costs 12.4 12.1 +0.3 Other long-term liabilities 54.6 71.1 -16.4
Total liabilities 1,350.5 1,398.7 -48.2
Total interest-bearing debt 796.7 818.0 -21.3 -9.0
Net debt equity ratio 0.49 0.54 -0.05
Net debt equity ratio (ex financial services) -0.10 -0.06 -0.04
(Billion yen)
11
Balance Sheets (Liabilities)

(Financial results for the six months ended June 30, 2017)
As of
June 30, 2017
As of
Dec. 31, 2016Changes
Kubota Corp. shareholders' equity 1,233.7 1,198.8 +34.9Common stock 84.1 84.1 +0.0Capital surplus 85.0 84.6 +0.4Legal reserve 19.5 19.5 - Retained earnings 1,012.0 961.4 +50.6
39.4 49.3 -9.9Foreign currency translation adjustments 14.7 26.0 -11.3
Unrealized gains on securities 50.4 49.6 +0.8
Pension liabilities adjustments -25.7 -26.2 +0.5
Treasury stock, at cost -6.4 -0.2 -6.2Non-controlling interests 76.5 73.2 +3.3
1,310.1 1,271.9 +38.2
46.4% 44.9% +1.5point
(Billion yen)
Total equity
Shareholders' equity to total assets
Accumulated other comprehensive income
12
Balance Sheets (Equity)

(Financial results for the six months ended June 30, 2017)
Six months ended
June 30, 2017
Six months ended
June 30, 2016
Net cash provided by operating activities 104.8 92.7 +12.1
Net cash used in investing activities -48.6 -66.1 +17.6
Purchases of fixed assets -29.7 -24.0 -5.7
Other -18.9 -42.2 +23.3
Net cash (used in) provided by financing activities -33.9 18.3 -52.2
-1.0 -14.3 +13.3
Net increase in cash and cash equivalents 21.3 30.7 -9.3
Free cash flow 75.1 68.8 +6.3
Effect of exchange rate changes
on cash and cash equivalents
(Billion yen) Changes
13
Cash Flow Statements

(Financial results for the six months ended June 30, 2017)
Financial Services <Reference (unaudited)>
14
Balance Sheets
Financial
servicies
Equipment
operations
Financial
servicies
Equipment
operations
957.1 1,773.7 938.5 1,809.7 Cash and cash equivalents 12.0 178.8 12.5 156.9 Trade notes and accounts receivable 33.8 565.3 29.8 603.7 Finance receivables 778.6 - 752.5 - Inventories - 367.4 - 356.2 Property, plant, and equipment 0.4 311.7 0.4 313.8 Other assets 132.2 350.5 143.3 379.0
824.3 580.8 812.4 648.4 Interest-bearing debt 747.6 68.1 744.7 93.2 Other liabilities 76.7 512.7 67.7 555.2
132.8 1,192.9 126.1 1,161.3
Total liabilities
Total equity
(Billion yen)As of June 30, 2017 As of Dec. 31, 2016
Total assets
Consolidated statements of income(Financial Services )
Amount % Amount % Amount %
Revenues 28.3 25.2 +3.2 +12.6
Operating income 12.0 42.5 10.5 41.6 +1.6 +15.0
Net income attributable to Kubota Corp. 7.2 25.4 6.3 24.9 +0.9 +14.9
(Billion yen)
Six months ended
June 30, 2017
Six months ended
June 30, 2016Changes

Recent Developments
In Machinery

(Financial results for the six months ended June 30, 2017)
0
200
400
600
800
1,000
1,200
1,400 (Thousand units)
Tractors / RS
U.S.
■YoY growth rate of retail sales units in the tractor market by horsepower
Sales of compact tractors significantly increased due to sales promotion activities in addition to expanded markets. Mid-scale tractors increased as well due to improved market share in spite of the severe market conditions.
■New privately owned housing units started
(Seasonally adjusted annual rate)
Source: U.S. Census Bureau
Sales of mini-excavators and CTL increased due to high demand in the construction industry. Sales of SSL increased as we finished allocating inventory of them in the prior year, while there was a negative effect of a slowdown in the agricultural market.
Sales increased along with steady demand for the construction and industrial machinery.
Source: AEM (Association of Equipment Manufacturers)
Demand for compact tractors and construction machinery increased along with favorable economy and a strong housing market. Market contraction for agriculture slowed. Severe competition has continued.
Const. machinery/ RS
Engines / WS
16
Recent Developments in Machinery (North America)
■YoY growth rate of retail sales units in the mini-excavator market (0-8t)
Source: AEM (Association of Equipment Manufacturers)
* RS: Retail sales, WS: Wholesale
Jan.-Mar. Apr.-June July-Sept. Oct.-Dec. Jan.-June Jan.-Dec.
0-40hp +26.1% +7.1% +9.6% +14.0% +12.7% +12.1%40-120hp -0.7% -4.3% -10.6% -2.5% -2.9% -4.9%0-120hp +14.9% +3.5% +2.3% +7.4% +7.3% +6.0%0-40hp +13.7% +11.2% - - +12.0% -
40-120hp -4.0% -1.4% - - -2.5% -0-120hp +7.3% +7.7% - - +7.5% -
Jan.-Mar. Apr.-June July-Sept. Oct.-Dec. Jan.-June Jan.-Dec.
+27.6% +13.0% +8.9% +6.2% +18.4% +12.7%
+12.2% +12.4% - - +12.3% -
2016
2017
2017
2016

(Financial results for the six months ended June 30, 2017) 17
Recent Developments in Machinery (Europe)
Europe Demand for const. machinery and engines were firm due to recovery in
the economy and expanded demand for the construction of housing and infrastructure. The market of machinery for agriculture was still weak, but gradually showed signs of recovery due to the bottoming out of agricultural prices.
Tractors / RS Sales of tractors decreased because of delays in authentications for some products regarding new EU tractor regulations and poor harvest in France. Sales in Turkey stayed at the same level as last year due to the negative effects of political uncertainty and the increased import tax rate.
Sales in France increased due to the front-loaded demand before the end of investment promotion act. Sales in Germany was firm as well due to increased demand in the construction industry. In the U.K., investments in const. machinery by rental agencies stayed aggressive while the outlook for the economy remains unclear.
Sales increased along with favorable business confidence, mainly in the construction market.
Const. machinery / RS
Engines / WS
Sales increased due to a bottoming out of demand for implements and the positive effects of new products introduced. Orders increased significantly.
Implements / WS
Kubota established a Holding company in Europe as a Regional Headquarters for the industrial machinery business in the Netherlands in July 2017. (Plan to start operations in Oct. 2017) ⇒Aim to optimize our business management in Europe by shifting our business management from a country basis to a pan-European business basis.

(Financial results for the six months ended June 30, 2017)
Source: USDA, Thai Rice Exporters Association
■Export price of Thai rice (US$/t)
18
Recent Developments in Machinery (Asia)
Thailand Demand for tractors for rice cropping-market recovered due to
cancelation of restrictions on water intake, while there was a negative effect from the slump in rice prices. Conservative buying arose in neighboring countries due to the negative effect of the slump in agricultural prices. Rice prices have shown signs of recovery recently.
Tractors, Combines / WS
Sales of tractors for rice cropping-market increased due to cancelation of the restrictions on water intake, while there were negative effects of slump in rice prices and floods in some areas. Regarding tractors for the dry-field crop- market, sales for sugar cane-market increased, while sales for cassava-market were weak. Sales of combines decreased due to a slump in rice prices.
Sales increased due to expanded demand in the constructions in urban areas.
Sales in Cambodia and Laos decreased due to a slump in agricultural prices. In Myanmar, where we established a sales company, sales of tractors increased because mechanization was accelerated resulting from labor shortages.
Const. machinery / RS
Exports to neighboring
countries / WS
0
200
400
600
800
1,000
1,200
1,400
(US$) Fragrant rice White rice 100% B grade
2013年 2014年 2015年
2014 2015 20162013 2017

(Financial results for the six months ended June 30, 2017)
■Budgeted government subsidies for purchase of agricultural equipment
2007 2008 2009 2010 2011 2012 2013 2014 2015 2016 2017 *
1st stage - - - - 11.0 13.0 20.0 17.0 21.0 22.8 18.6
Full year 2.0 4.0 13.0 15.5 17.5 21.5 21.8 23.8 23.8 23.7 18.6Subsidies
(Billion RMB)
19
Recent Developments in Machinery (Asia)
China Budgeted government subsidies decreased by approximately 20%. Customers’ needs moved to highly functional products because of greater competition among contractors, and contractors’ needs for machinery with greater efficiency. Demand for const. machinery recovered due to expanded investment in urban infrastructure.
Tractors / RS Sales grew due to increased market share, while market for 70-99 hp tractors shrank resulting from the transition in demand to tractors with higher hp.
Sales significantly increased due to expanded investment in urban infrastructure and the adverse reaction of decreased sales in the prior year due to delayed authentication for emission regulations in the prior year.
Const. machinery / RS
Sales of combines with low hp declined due to decreased government subsidies and transitions in demand to highly functional products along with severer competition among contractors. An increase in sales of wheel drive combine harvesters was limited mainly due to increased inventories of used products sold before strengthening emission regulations.
Rice transplanters / RS
Combines / RS
Sales significantly increased due to postponed purchases resulting from delayed authentication for emission regulations in the prior year, crop conversion from corn to rice, and expanded demand for repurchase.
* The amount in 2017 is forecast.
Sales increased due to rapidly recovered demand of construction machinery. Engines / WS

(Financial results for the six months ended June 30, 2017)
Source: Ministry of Agriculture, Forestry and Fisheries
20
Recent Developments in Machinery (Japan)
Japan Sales of farm machinery and const. machinery showed signs of gradual recovery, although stagnation of sales continued after strengthening emission regulations in 2015.
Demand for tractors exceeded that in the prior year.
Farm machinery / RS
Sales of tractors increased due to the recovery from the stagnation of sales following tighter emission regulations. Sales of combines decreased due to the adverse reaction to increased sales resulting from the “Agri-Seed lease program”, agricultural equipment lease support program established by financial institution, and expanded sales of products manufactured before strengthening emission regulations. Sales of agriculture-related products, such as implements, increased.
Sales decreased due to prioritized investment in large-sized const. machinery by rental companies along with emission regulations for engines of 75 hp and over. Recovery in demand is expected on increased infrastructure investment related to the Tokyo Olympic Games.
Const. machinery / RS
Sales declined because of OEM clients’ adjustments in the production and weak sales of power generators to developing countries.
Engines / WS
5,000
6,000
7,000
8,000
9,000
10,000
11,000
12,000
13,000
14,000
15,000 (yen)
2013 2014 2015 2016 2017
■Producers’ price of Japanese rice
(yen/ 60kg)

Forecast
(Financial results for the six months ended June 30, 2017) 22
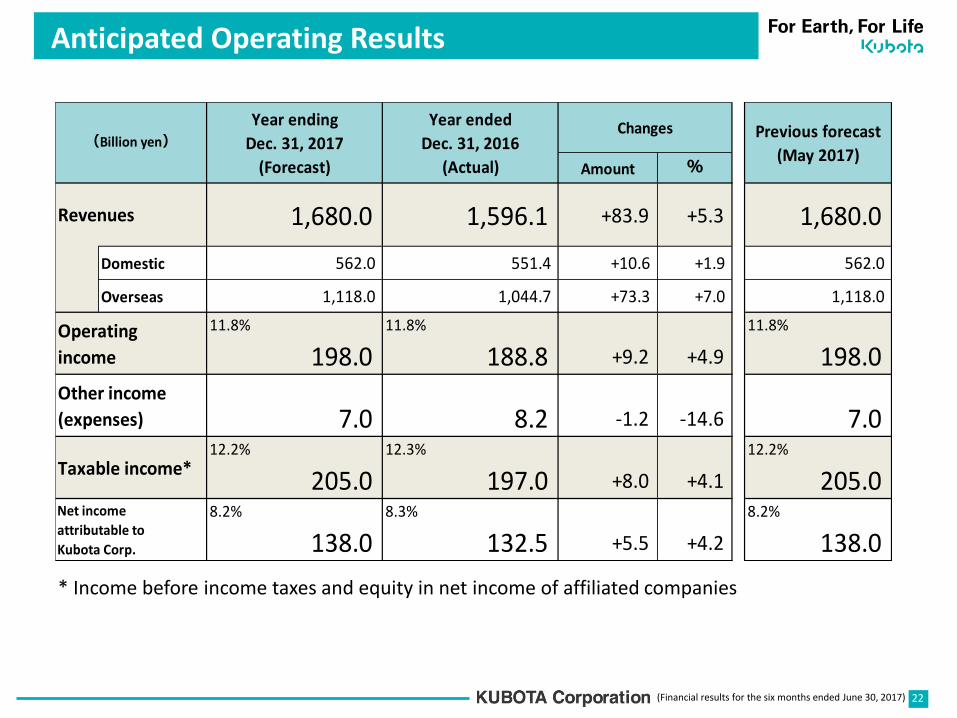
Anticipated Operating Results
Amount %
1,680.0 1,596.1 +83.9 +5.3 1,680.0
Domestic 562.0 551.4 +10.6 +1.9 562.0
Overseas 1,118.0 1,044.7 +73.3 +7.0 1,118.0
11.8% 11.8% 11.8%
198.0 188.8 +9.2 +4.9 198.0
7.0 8.2 -1.2 -14.6 7.012.2% 12.3% 12.2%
205.0 197.0 +8.0 +4.1 205.08.2% 8.3% 8.2%
138.0 132.5 +5.5 +4.2 138.0
Previous forecast
(May 2017)
Net income
attributable to
Kubota Corp.
Changes
Other income
(expenses)
Taxable income*
Revenues
(Billion yen)
Operating
income
Year ending
Dec. 31, 2017
(Forecast)
Year ended
Dec. 31, 2016
(Actual)
* Income before income taxes and equity in net income of affiliated companies

(Financial results for the six months ended June 30, 2017) 23
Anticipated Revenues by Reporting Segment
Amount % Amount %
1,357.0 1,272.2 +84.8 +6.7 1,357.0 - -
Domestic 288.0 281.5 +6.5 +2.3 288.0 - -
Overseas 1,069.0 990.7 +78.3 +7.9 1,069.0 - -
293.0 294.5 -1.5 -0.5 293.0 - -
Domestic 244.0 240.8 +3.2 +1.3 244.0 - -
Overseas 49.0 53.7 -4.7 -8.8 49.0 - -
30.0 29.4 +0.6 +2.0 30.0 - -
Domestic 30.0 29.1 +0.9 +3.1 30.0 - -
Overseas - 0.3 -0.3 -100.0 - - -
1,680.0 1,596.1 +83.9 +5.3 1,680.0 - -
562.0 551.4 +10.6 +1.9 562.0 - -
1,118.0 1,044.7 +73.3 +7.0 1,118.0 - -
Changes
Overseas revenues
Machinery
Water
Other
Total revenues
Domestic revenues
(Billion yen)
Year ending
Dec. 31, 2017
(Forecast)
Previous forecast
(May 2017)
ChangesYear ended
Dec. 31, 2016
(Actual)
For reference: Changes excluding the effects of fluctuation in exchange (-8 billion yen) and an acquisition of GPM (+21 billion yen). >Overseas revenues in Machinery are forecast to increase by 7%. Total overseas revenues are forecast to increase by 6%.

(Financial results for the six months ended June 30, 2017)
2.Material
24
Machinery Water
Amount % Amount % Amount %
Operating income 198.0 11.8 188.8 11.8 +9.2 +4.9
(Billion yen)
Year ending
Dec. 31, 2017
(Forecast)
Year ended
Dec. 31, 2016
(Actual)
Changes
US$ (109→110) Euro (120→119) Other currencies
Factors affecting operating income (YoY change +9.2 billion yen)
-1.0 billion yen -3.0 billion yen -3.0 billion yen
-7.0 billion yen 1.Fluctuation in exchange rates
-2.0 billion yen -4.0 billion yen -6.0 billion yen
4.Personnel expenses (Excluding GPM)
Cost of good sold SG&A expenses
+1.5 billion yen -4.0 billion yen -2.5 billion yen
3.Sales incentive ratio growth -1.5 billion yen
5.Specific items
+0.1 billion yen
7.Other +0.1 billion yen
Change in depreciation method
Amortization of valuation difference between the amount paid and fair market value of net assets of GPM
Anticipated Operating Income
+1.0 billion yen
-0.9 billion yen
6.Impact of increased sales +26.0 billion yen
U.S. : -3.0 Billion yen China: +2.5 Billion yen etc.

(Financial results for the six months ended June 30, 2017) 25
(% shows OP margin)
Operating
income
Specific
items
Adjusted
operating
income
Operating
income
Specific
items
Adjusted
operating
income
① ② ③=①-② ④ ⑤ ⑥=④-⑤ ①-④ ③-⑥
14.6% 14.7% 14.5% 14.6%
198.0 -1.2 199.2 185.0 -1.3 186.3 +13.0 +12.9 +84.8
7.5% 7.4% 7.5% 7.5%
22.0 0.3 21.7 22.2 - 22.2 -0.2 -0.5 -1.5
10.0% 10.0% 12.3% 12.3%
3.0 - 3.0 3.6 - 3.6 -0.6 -0.6 +0.6
-25.0 -0.3 -24.7 -22.0 - -22.0 -3.0 -2.7
11.8% 11.9% 11.8% 11.9%
198.0 -1.2 199.2 188.8 -1.3 190.1 +9.2 +9.1 +83.9
Year ending Dec. 31, 2017 (Forecast)
(Billion yen)
Year ended Dec. 31, 2016 (Actual)
Changes
in
revenues
Changes
(Adjusted)Changes
Total
Adjustment
Other
Water
Machinery
■Anticipated operating income excluding specific items
Anticipated Operating Income by Reporting Segment
(Financial results for the six months ended June 30, 2017)
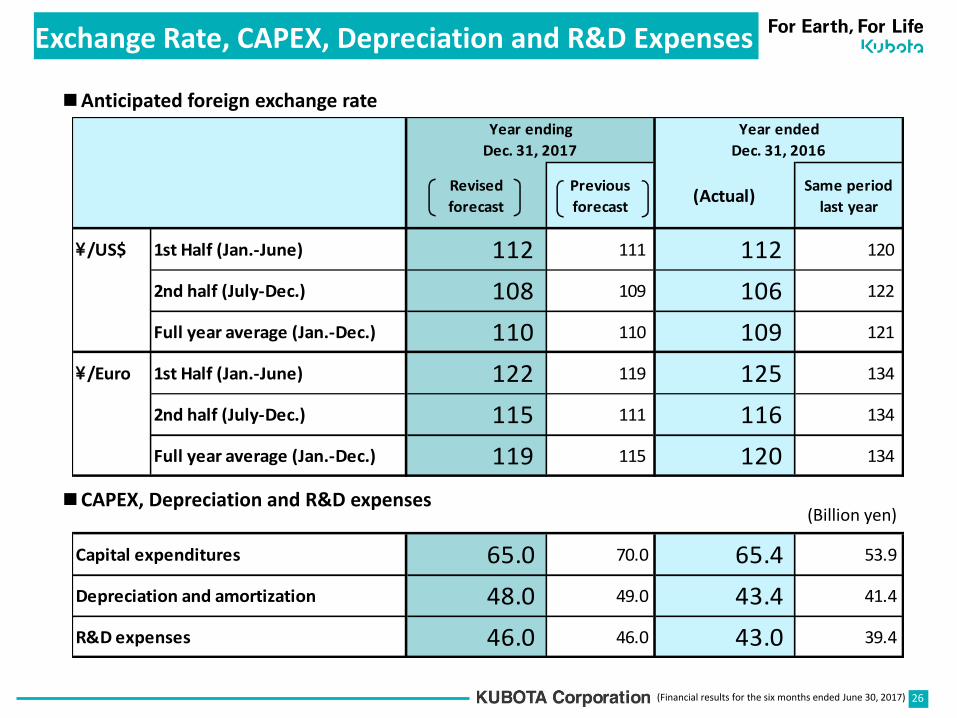
Revised
forecast
Previous
forecast(Actual)
Same period
last year
\/US$ 1st Half (Jan.-June) 112 111 112 120
2nd half (July-Dec.) 108 109 106 122
Full year average (Jan.-Dec.) 110 110 109 121
\/Euro 1st Half (Jan.-June) 122 119 125 134
2nd half (July-Dec.) 115 111 116 134
Full year average (Jan.-Dec.) 119 115 120 134
65.0 70.0 65.4 53.9
48.0 49.0 43.4 41.4
46.0 46.0 43.0 39.4R&D expenses
Capital expenditures
Depreciation and amortization
Year ended
Dec. 31, 2016
Year ending
Dec. 31, 2017
■Anticipated foreign exchange rate
■CAPEX, Depreciation and R&D expenses
26
Exchange Rate, CAPEX, Depreciation and R&D Expenses
(Billion yen)

(Financial results for the six months ended June 30, 2017)
Cautionary Statements with Respect to Forward-Looking Statements
This document may contain forward-looking statements that are based on management’s expectations, estimates, projections and assumptions. These statements are not guarantees of future performance and involve certain risks and uncertainties, which are difficult to predict. Therefore, actual future results may differ materially from what is forecast in forward-looking statements due to a variety of factors, including, without limitation: general economic conditions in the Company's markets, particularly government agricultural policies, levels of capital expenditures both in public and private sectors, foreign currency exchange rates, the occurrence of natural disasters, continued competitive pricing pressures in the marketplace, as well as the Company's ability to continue to gain acceptance of its products.
27
Safe Harbor

Giving to the future of Earth