Financial Results for the the Fiscal Year Ended March 2016
33
Financial Results for the Fiscal Year Ended March 2016 May 12, 2016 President Takashi Tanaka KDDI Corporation (From April 2015 to March 2016)
-
Upload
kddi -
Category
Investor Relations
-
view
1.823 -
download
2
Transcript of Financial Results for the the Fiscal Year Ended March 2016

Financial Results for the Fiscal Year Ended March 2016
May 12, 2016
President Takashi Tanaka KDDI Corporation
(From April 2015 to March 2016)

KDDI would like to extend its sincere condolences to the people affected by the recent earthquakes in Kumamoto
and Oita prefectures, and to their families.
The KDDI Group is fully committed to recovering the areas affected by the disaster.

2
Review through to FY2016.3
Medium-Term Target – Looking toward FY2019.3 –
Forecasts for FY2017.3
■ Appendix
Today’s Presentation
The figures included in the following brief, including the business performance target and the target for the number of subscribers are all projected data based on the information currently available to the KDDI Group, and are subject to variable factors such as economic conditions, a competitive environment and the future prospects for newly introduced services. Accordingly, please be advised that the actual results of business performance or of the number of subscribers may differ substantially from the projections described here.

Review through to FY2016.3

4 Targets for FY2014.3 to FY2016.3 Consolidated
“Achieve Continuous Growth and Enhance Shareholder Return”
Profit Growth
Consider as possible option for management
Shareholder Return
Double-digit annual growth rate
Large increases with income growth
Over 30%
Operating Income
Dividend
EPS
Payout Ratio
Business growth by promoting the 3M strategy
au Smart Value (Bundled Services)
au Smart Pass (Subscription Service of Apps, etc.)
Repurchase of Own Shares

5
3/'13 3/'14 3/'15 3/'16
au Smart Value Subs (Bundled Services)
Results through to FY2016.3 (Operation)
Personal / Value Services
Note) Households: total for KDDI group companies and fixed-line allied companies
Mobile Fixed-line
(As of March 31, 2016)
11.55M
5.72M
(au subs)
(Households) Note
au Smart Pass Members (Subscription Service of Apps, etc.)
3/'13 3/'14 3/'15 3/'16
au Smart Pass 14.47M
Secured Solid Customer Base by Promoting the 3M Strategy
(As of March 31, 2016)

6
FY14.3 J-GAAP
FY15.3 J-GAAP/[IFRS]
FY16.3 IFRS
Operating Income: Achieved Double Digit Growth for Three Consecutive Fiscal Years
FY13.3 J-GAAP
Consolidated
Operating RevenueNote1
Operating Income
Profit for the PeriodNote2
EPSNote3
Note1) “Operating revenues” based on Japan GAAP Note2) “Net income” based on Japan GAAP, “Profit for the period attributable to owners of the parent” based on IFRS Note3) Earnings Per Share. Figures are adjusted to reflect stock split *YOY comparisons through to FY15.3 are based on Japan GAAP. YOY comparisons between FY15.3 and FY16.3 are based on IFRS
¥4,333.6B
YOY +18.3%
¥4,573.1B [¥4,270.1B]
YOY +5.5%
¥4,466.1B
YOY +4.6%
¥663.2B
YOY +29.4%
¥741.3B [¥665.7B]
YOY +11.8%
¥833.4B
YOY +25.2%
¥322.0B
YOY +33.4%
¥427.9B [¥395.8B]
YOY +32.9%
¥494.5B
YOY +24.9%
¥132.87
YOY +26.2%
¥170.84 [¥158.01]
YOY +28.6%
¥197.56
YOY +25.0%
¥3,662.3B
¥512.7B
¥241.5B
¥105.30
Results through to FY2016.3 (Profit Growth)

7
Payout Ratio
DPSNote
ROE
Share Price (fiscal year-end)
Consolidated
*Figures are adjusted to reflect stock split Note) Dividend per Share
32.6% 33.2% 35.4%(E)
¥43.33
YOY +44.4%
¥56.67
YOY +30.8%
¥70.00(E)
YOY +23.5%
13.0% 14.9% 15.5%
¥1,992.0 ¥2,720.5 ¥3,006.0
28.5%
¥30.00
ー
11.2%
¥1,290.0
FY14.3 J-GAAP
FY15.3 J-GAAP
FY16.3 IFRS
FY13.3 J-GAAP
Dividend Payout Ratio Set over 30%, DPSNote Showed Double-Digit Growth Each Year
Results through to FY2016.3 (Shareholder Return)
8 Shareholder Return in the Final Year of the Medium-Term Target
• “5 yen” to be increased over the initial forecast for the year-end dividend
• Payout ratio is 35.4%
Dividend for FY16.3
In Appreciation for Three Years of Support from Shareholders
Consolidated
Repurchase of Own Shares
• Resolution of repurchase of own shares up to
aggregate price of ¥100 billion Aggregate number of shares to be repurchased:
Up to 38 million shares Period for share repurchase:
May 13, 2016 – September 23, 2016

Medium-Term Target – Looking toward FY2019.3 –

10 New Direction for the Next Three Years
Transform into a business providing customer experience value
Achieve continuous profit growth and enhance shareholder return
Sustainably grow the domestic telecommunications business
Maximize the “au Economic Zone” Aggressively develop global business
Business Management
Direction
Business Strategy
Financial Targets

11
Up To Now From Now On
Developing into an established growing company in the
telecommunications business
Pursue customer experience value at all
customer contact points
Customer Perspective
Innovation
An Era of Telecommunication Service Differentiation To an Era of Existing as the Preferred Choice of Customers
Business Management Direction
Transform into a Business Providing Customer Experience Value
Business growth by promoting the 3M strategy
• Provide individual customers with rich experiences
• Support corporate customers’ businesses to grow
• Contribute to overseas economic development and growth
au Smart Value (Bundled Services)
au Smart Pass (Subscription Service of Apps, etc.)
12
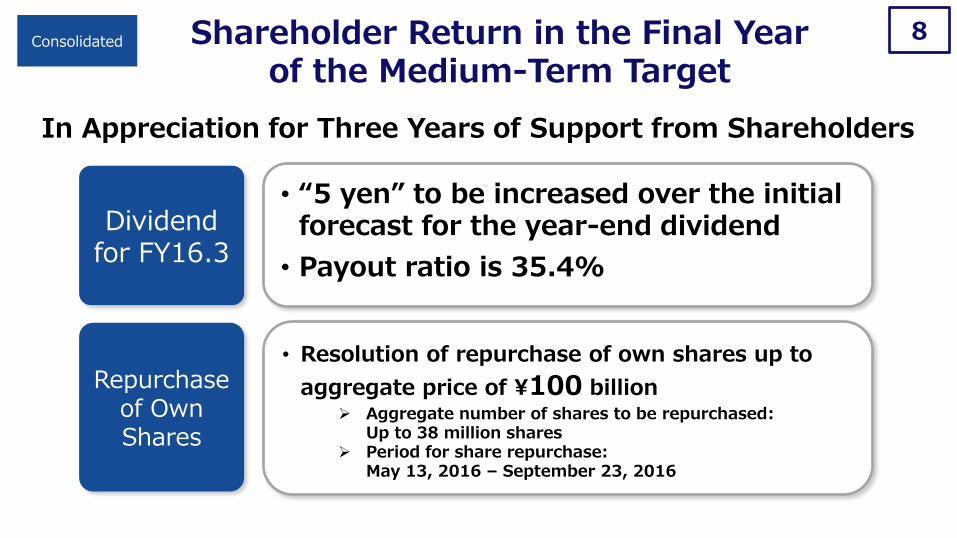
Becoming a Business that Provides Customer Experience Value
(1) Sustainably grow the domestic telecommunications business
(2) Maximize the “au Economic Zone”
(3) Aggressively develop global business
Domain expansion
Qu
alita
tive e
xp
an
sio
n
Business Strategy
Sustainably Grow the Domestic Business and Establish New Growth Pillars

au ID
13
Aim for Sustainable Growth through Further Promotion of the 3M Strategy
Penetration of smart devices
Strengthen IoT initiatives
Create new experience value
24
au Smart Value (Bundled Services)
(1) Sustainably Grow the Domestic Telecommunications Business
Domestic Telecom
Multi-Network
Multi-Use
Multi-Device
4G LTE WiMAX 2+
Wi-Fi FTTH CATV
au ID

14
Promote Multi-Device and Multi-Use to Maximize “ID×ARPA”
au ARPA
Tablet
Router
more
Smartphone
Demand for Data Volume Usage
Multi-Use
Multi-Device
Increase penetration of IoT services
Multi-Network
Domestic Telecom
ID = au customers (Accounts)
(1) Sustainably Grow the Domestic Telecommunications Business

(2) Maximize the “au Economic Zone” 15
Fixed-line Food
au Feature phone
au Smart phone
Electricity Commodity Life
Insurance Home
Mortgage Non-life
Insurance
Evolve services tailored to each life stage au ID
Strengthen platform for providing customer experience value
Shift to Omni-Channel
au Smart Pass 14.47M membersNote
Note) As of March 31, 2016
au Economic Zone
Aim to Transform from a Telecommunication Company into a Life Design Company
Approx. 2,500 au Shops Nationwide
“au Life Design”

16
Reinforce Settlement Platform and Data Management Platform by Leveraging Solid Customer Base
24
Offline Examples)
Online + Offline Settlement at Various Shops
Commerce Financial Services
Select Content & Apps
au Smart Pass
Online
au Customer Base (=au ID)
Big Data / DMP(Data Management Platform)
Customer Data Purchase Data Product Data
au Carrier Billing Billing Platform
Promotions and Recommendations
Ecosystem of Reward
Points
au Economic Zone
Ecosystem of Reward
Points
Video Pass
(2) Maximize the “au Economic Zone”

17
Accelerate the Growth of the Global Consumer Business by Promoting Further Initiatives
Myanmar Telecommunications Business
7/'14 3/'16
Since conclusion of JV agreement, MPT mobile subscribers increase by approx.
Three-fold
Global Business
Expand branch network Improve network quality Expand area coverage
Launch next-generation communication service (LTE)
(3) Aggressively Develop Global Business
Aim to be the leading local carrier striving as the best choice of customers
Approx.
19M
Approx.
6M

18
New data center opens this summer
to strengthen operations in Europe
Expansion in London
23,000㎡
Docklands North Two
Evolve to a Premium Data Center Operator with Prolific Connectivity 48 Locations in 24 Cities across 13 of the World’s Countries/Regions
Total floor space: 447,000㎡ (As of March 31, 2016)
London
Paris
Frankfurt
Istanbul
Moscow
Beijing
Shanghai
Seoul
Japan
9 cities Hanoi
Hong Kong
Los Angeles
New York
Singapore
Cape Town
Johannesburg
(3) Aggressively Develop Global Business Global Business

19
•Lift dividend payout ratio from “above 30%” to “above 35%”
•Repurchase own shares after growth investment
•Limit the amount of those treasury stock to approximately 5% of
our total issued shares, and will cancel any treasury stock held in
excess of this limit
Medium-Term Target – Looking toward FY2019.3 –
Profit Growth
Shareholder Return
“Achieve Continuous Growth and Enhance Shareholder Return”
Consolidated
Note) CAGR (Compound Average Growth Rate)
•Target operating income; CAGRNote of 7%
•Gross merchandise value of au Economic Zone; over ¥2 trillion
•M&As for growth; Approx. 500 billion yen over three years

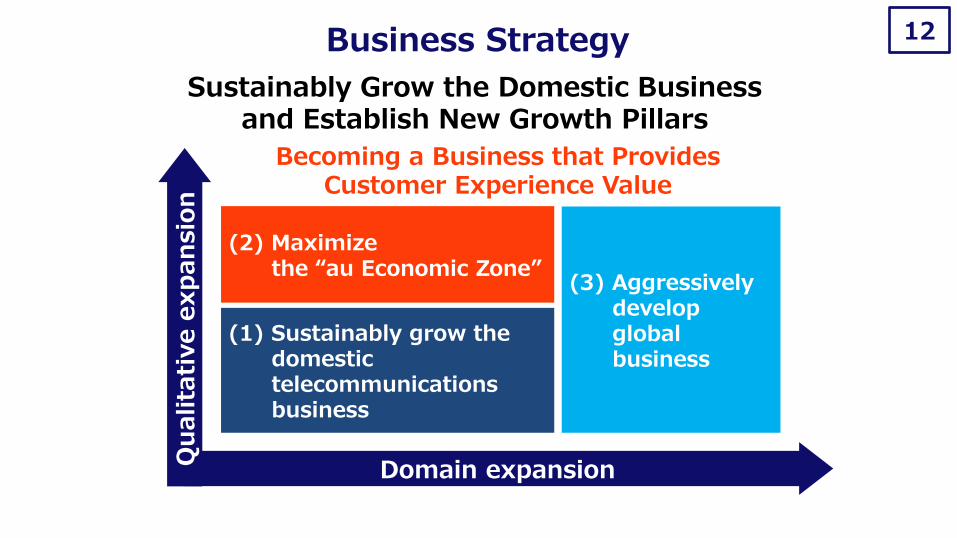
Forecasts for FY2017.3
21
Aim to Increase Both Sales and Profits in the First Year of the Medium-Term Target
Forecasts for FY2017.3
FY16.3 FY17.3 (E)
885.0
833.4
YOY
+6.2%
FY16.3 FY17.3 (E)
4,700.0
4,466.1
YOY
+5.2%
FY16.3 FY17.3 (E)
540.0
YOY
+9.2%
494.5
Consolidated
Operating Revenue Profit for the period attributable
to owners of the parent Operating Income
(Billions of yen) (Billions of yen) (Billions of yen)
*Based on IFRS

22
Aim for 15th Consecutive Year of Dividend Increase and 6th Consecutive Year of Double-Digit Dividend Increase
Dividend per Share
(Yen)
(E)
(E)
FY02.3 FY03.3 FY04.3 FY05.3 FY06.3 FY07.3 FY08.3 FY09.3 FY10.3 FY11.3 FY12.3 FY13.3 FY14.3 FY15.3 FY16.3 FY17.3
1.49 1.49 2.00 4.00 5.83 7.50 8.33 9.17 9.17 10.83 12.50 14.17 20.00
26.67 30.00
40.00
1.67
1.67
5.00
1.49 2.00 4.00
5.83 7.50 8.33 9.17 9.17
10.83 12.50 14.17
15.83
23.33
30.00
30.00
40.00
5.00
70.0
56.7
43.3
30.0 26.7
23.3
80.0
(Initial Forecast)
Year-end Dividend
Commemorative Dividend
Interim Dividend
*Figures are adjusted to reflect stock split

23
Expanding the Content of the Previous Shareholder
Benefit SchemeNote
*For shareholders holding 1 share unit (100 shares) or more listed on the shareholders’ register as of March 31, 2016 Note) Previous shareholder benefit scheme: au handset discount coupon
Shareholder Benefits
A present comprising a selection of carefully picked popular items from the rich variety of products available on “au WALLET Market”
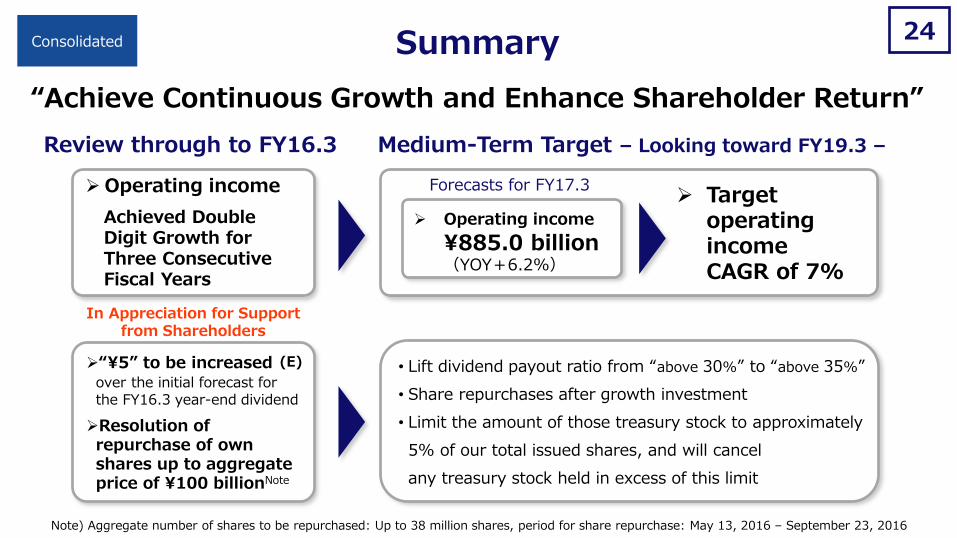
Summary 24
Operating income
Operating income ¥885.0 billion (YOY+6.2%)
Review through to FY16.3 Medium-Term Target – Looking toward FY19.3 –
Forecasts for FY17.3
Note) Aggregate number of shares to be repurchased: Up to 38 million shares, period for share repurchase: May 13, 2016 – September 23, 2016
In Appreciation for Support from Shareholders
“¥5” to be increased over the initial forecast for the FY16.3 year-end dividend
Resolution of repurchase of own shares up to aggregate price of ¥100 billionNote
Target operating income CAGR of 7%
Consolidated
“Achieve Continuous Growth and Enhance Shareholder Return”
Achieved Double Digit Growth for Three Consecutive Fiscal Years
• Lift dividend payout ratio from “above 30%” to “above 35%”
• Share repurchases after growth investment
• Limit the amount of those treasury stock to approximately
5% of our total issued shares, and will cancel
any treasury stock held in excess of this limit
(E)

Appendix

26
Operating revenue 4,270.1 4,466.1 +4.6% 4,700.0
Operating income 665.7 833.4 +25.2% 885.0
Operating margin 15.6% 18.7% -- 18.8%
Profit for the period attributable
to owners of the parent 395.8 494.5 +24.9% 540.0
EBITDA 1,284.6 1,411.0 +9.8% 1,480.0
EBITDA margin 30.1% 31.6% -- 31.5%
Free cash flows 333.0 216.6 -34.9% 350.0
FY15.3 FY16.3 YOY FY17.3(E)
Consolidated Financial Results and Forecasts
(Billions of yen)
*Based on IFRS

27
Operating Income
Consolidated Personal Value Business Global Other, Elimination
and Corporate
IFRS 665.7 546.7 52.7 75.9 (15.3) 5.7
J-GAAP 741.3 577.4 58.0 80.4 16.8 8.7
Difference (75.6) (30.7) (5.3) (4.5) (32.1) (3.0)
Major differences
• Reclassification (73.2) • Non-amortization of
goodwill: +28.1 • Differences in depreciation
method: (26.6)
• Reclassification (25.0) • Non-amortization of
goodwill: +20.2 • Differences in depreciation
method: (27.4)
Reclassification (7.2)
Reclassification (33.4)
Differences in the scope of consolidation: (4.2)
Operating Revenue
Consolidated Personal Value Business Global Other, Elimination
and Corporate
IFRS 4,270.1 3,330.6 237.7 659.2 279.0 (236.4)
J-GAAP 4,573.1 3,513.3 242.3 669.2 320.6 (172.3)
Difference (303.0) (182.7) (4.6) (10.0) (41.6) (64.1)
Major differences
• Impact of excluding selling commissions: (184.1)
• Impact of excluding reward point expenses: (26.9)
• Differences in the scope of consolidation: (24.1)
• Impact of excluding selling commissions: (178.8)
• Impact of excluding reward point expenses: (24.8)
• Differences in the scope of consolidation: +39.2
Unification of reporting period for overseas subsidiaries:
(41.6)
Differences in the scope of consolidation:
(63.3)
(Ref.) IFRS/J-GAAP Differences in FY2015.3
(Billions of yen)
• Reclassification (8.7) • Non-amortization of
goodwill: +2.5
• Impact of excluding selling commissions:
(5.3) • Impact of excluding
reward point expenses: (2.2)

28
Segment
Operating revenue 3,330.6 3,503.3 +5.2% 3,550.0
Operating income 546.7 656.6 +20.1% 690.0
Operating margin 16.4% 18.7% -- 19.4%
EBITDA 1,080.1 1,162.7 +7.6% 1,200.0
EBITDA margin 32.4% 33.2% -- 33.8%
Operating revenue 237.7 271.8 +14.3% 440.0
Operating income 52.7 73.8 +40.1% 90.0
Operating margin 22.2% 27.2% -- 20.5%
EBITDA 70.7 85.5 +21.0% 110.0
EBITDA margin 29.7% 31.5% -- 25.0%
FY15.3 FY16.3 YOY FY17.3(E)
*Based on IFRS
Financial Results and Forecasts by Segment (1)
(Billions of yen)
Personal Services
Value Services

29
Segment
Operating revenue 659.2 632.0 -4.1% 635.0
Operating income 75.9 61.4 -19.0% 63.0
Operating margin 11.5% 9.7% -- 9.9%
EBITDA 129.0 109.5 -15.2% 110.0
EBITDA margin 19.6% 17.3% -- 17.3%
Operating revenue 279.0 294.4 +5.5% 310.0
Operating income (15.3) 32.1 -- 34.0
Operating margin -- 10.9% -- 11.0%
EBITDA (1.0) 44.4 -- 48.0
EBITDA margin -- 15.1% -- 15.5%
FY15.3 FY16.3 YOY FY17.3(E)
Financial Results and Forecasts by Segment (2)
(Billions of yen)
Business Services
Global Services
*Based on IFRS

KPI 30
Segment 3/’15 3/’16 Change 3/’17(E)
Consolidated au subscriptions (Millions) 43.48 45.91 +2.43 48.71
Personal Services au subscriptions (Millions) 36.48 38.24 +1.75 39.24
Devices per person (Units) 1.37 1.41 +0.04 1.44
au smartphone penetration (%) 54.3% 58.2% +3.9pt --
au Smart Value (Mobile) (Millions) 9.33 11.55 +2.22 --
au Smart Value (Fixed-line) (Millions) 4.59 5.72 +1.13 --
Value Services au Smart Pass (Millions) 12.89 14.47 +1.58 --
Segment FY15.3 FY16.3 YOY FY17.3(E)
Personal / Value Total ARPA (Yen) 5,950 6,130 +3.0% 6,230
Personal Services au ARPA (Yen) 5,530 5,690 +2.9% 5,730
Value Services Value-added ARPA (Yen) 420 440 +4.8% 500
Personal / Value au Economic Zone gross merchandise value
(Billions of yen) -- 730.0 -- 1,200.0

31
188.6 193.4 210.0
479.1 338.0
350.0
FY15.3 FY16.3 FY17.3
FY17.3 (E)
¥560.0B
Capital Expenditure
Consolidated
*Based on IFRS
CAPEX (cash flow basis)
Mobile (including UQ)
Fixed-line and others
(Billions of yen)
(E)
531.4
Including impact of change in construction period Approx. ¥30.0 B
560.0
667.7


![Consolidated Financial Results for the Fiscal Year Ended ...Note: Comprehensive income Fiscal year ended March 31, 2019: ¥1,761 million [24.3%] Fiscal year ended March 31, 2018: ¥1,417](https://static.fdocuments.net/doc/165x107/5fe4d06806b4775830253106/consolidated-financial-results-for-the-fiscal-year-ended-note-comprehensive.jpg)

